Page 1 of 34 1 January - 31 March 2015 (Company announcement No. 08-2015) Interim Report 1 January - 31 March 2015 (Company announcement No. 08-2015) Interim Report FLSmidth: 1 January – 31 March 2015 Interim Report ROCE Up from 7% 11% EBITA margin Up from 6.5% 7.7% Free cash flow Up from DKK -624m DKKm 715 Up from DKK 115m Net profit DKKm 272

Welcome message from author
This document is posted to help you gain knowledge. Please leave a comment to let me know what you think about it! Share it to your friends and learn new things together.
Transcript
Page 1 of 34
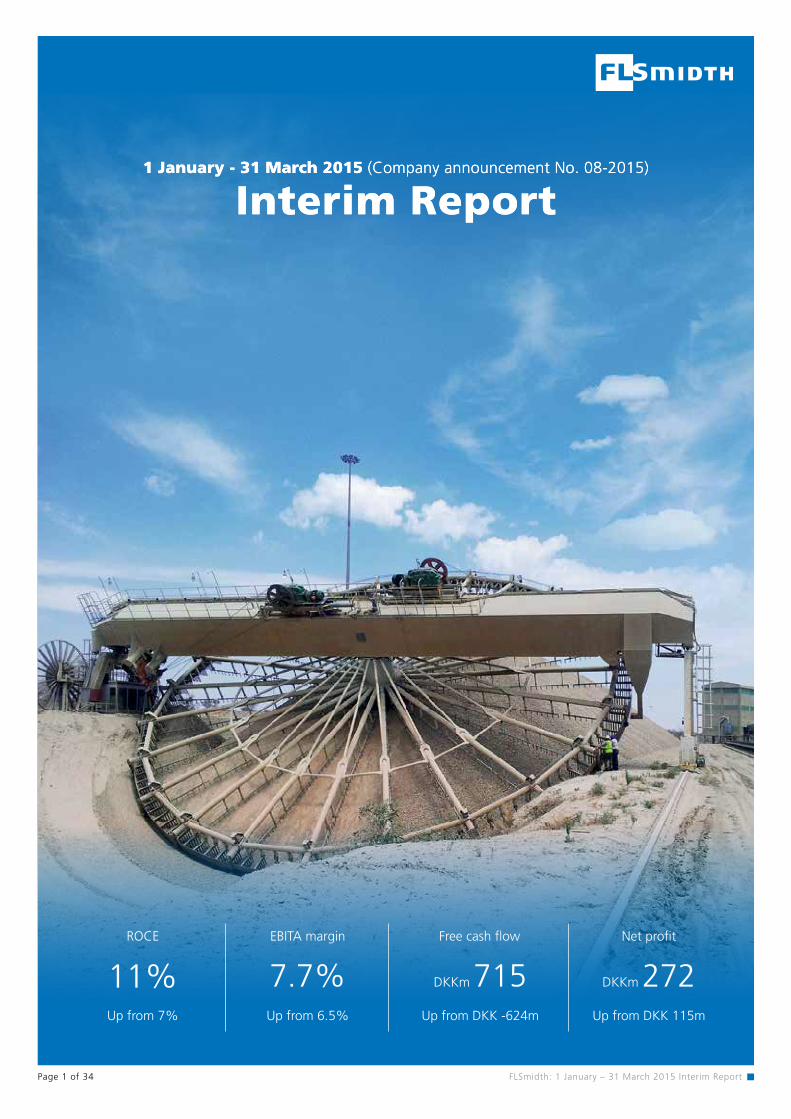
1 January - 31 March 2015 (Company announcement No. 08-2015)
Interim Report1 January - 31 March 2015 (Company announcement No. 08-2015)
Interim Report
FLSmidth: 1 January – 31 March 2015 Interim Report
ROCE
Up from 7%
11%EBITA margin
Up from 6.5%
7.7%Free cash flow
Up from DKK -624m
DKKm 715Up from DKK 115m
Net profit
DKKm 272

FLSmidth: 1 January – 31 March 2015 Interim Report Page 2 of 34
FLSmidthat a glance
Main conclusionsCustomer Services and Product Companies provide a stable and profitable base in a tough market environment. Margins expanded as a consequence of efficiency measures. EBITA margin of 9.5% adjusted for non-recurring costs. Positive free cash flow of DKK 715m owing to sale of Cembrit. Sequential increase in order intake. Market outlook and guidance for 2015 remain unchanged.
Realised 2014 Realised Q1 2015 Guidance 2015
Revenue DKK 21.1bn DKK 4.8bn DKK 19-21bn
EBITA margin 7.7% 7.7% 9-10%
ROCE 11% 11% 12-14%
Effective tax rate 30.2% 31% 31-33%
CFFI *) DKK -0.4bn DKK -0.1bn DKK -0.4bn
*) excluding acquisitions and divestments of enterprises and activities
Revenue DKK 1,878m DKK 1,375m DKK 946m DKK 836m
EBITA margin adj. 13.6% 14.4% -3.9% 4.7%
EBITA margin 9.7% 14.4% -5.5% 4.7%
Order intake DKK 1,789m DKK 1,580m DKK 1,074m DKK 431m
FLSmidth
CementCustomer Services
Product Companies
Minerals
Financial result Q1 2015
Guidance for 2015 (unchanged)
Revenue DKK 4,825mEBITA margin adj. 9.5%EBITA margin 7.7%Order intake DKK 4,677m
Guidance for 2015 (unchanged)

Page 3 of 34 FLSmidth: 1 January – 31 March 2015 Interim Report
FLSmidthQ1 2015 in numbers
Return on Capital employed
11% Up from 7%
EBITA margin
7.7%Up from 6.5%
Order backlog (DKKm)
18,952 Down from 22,152
Revenue (DKKm)
4,825Down from 4,949
CFFO (DKKm)
-45Up from -552
Net interest-bearing debt (DKKm)
4,258Down from 5,353
EBITA (DKKm)
370Up from 322
Order intake (DKKm)
4,677Down from 4,841
Net working capital (DKKm)
2,868Up from 2,726

FLSmidth: 1 January – 31 March 2015 Interim Report Page 4 of 34
DKKm Q1 2015 Q1 2014 Year 2014
INCOME STATEMENTRevenue 4,825 4,949 21,129 Gross profit 1,188 1,176 5,056 Earnings before non-recurring items, depreciation, amortisation and write-downs (EBITDA) 443 388 1,931 Earnings before amortisations and write-down on intangible assets (EBITA) 370 322 1,627 Earnings before interest and tax (EBIT) 266 236 1,220 Earnings from financial items, net (14) (62) (118)Earnings before tax (EBT) 252 174 1,102 Profit/loss for the period, continuing activities 174 118 769 Profit/loss for the period, discontinued activities 98 (3) 44 Profit/loss for the period 272 115 813
CASH FLOWCash flow from operating activities (45) (552) 1,298 Acquisition and disposal of enterprises and activities 830 - (184)Acquisition of tangible assets (39) (44) (366)Other investments, net (31) (28) (48)Cash flow from investing activities 760 (72) (598)Cash flow from operating and investing activities of continuing activities 882 (569) 742 Cash flow from operating and investing activities of discontinued activities (167) (55) (42)
NET WORKING CAPITAL 2,868 2,726 2,164 NET INTEREST-BEARING DEBT 4,258 5,353 4,557
ORDER INTAKE, CONTINUING ACTIVITIES (GROSS) 4,677 4,841 17,761 ORDER BACKLOG, CONTINUING ACTIVITIES 18,952 22,152 19,017
BALANCE SHEETNon-current assets 12,160 12,103 11,535 Current assets 14,782 14,841 13,421 Assets held for sale - - 1,396 Total assets 26,942 26,944 26,352 Equity 8,157 7,033 7,761 Long-term liabilities 6,652 7,458 5,868 Short-term liabilities 12,133 12,453 12,240 Liabilities directly associated with assets classified as held for sale - - 483 Total equity and liabilities 26,942 26,944 26,352
DIVIDEND TO THE SHAREHOLDERS PAID 439 - 461
FINANCIAL MARGINContinuing activitiesGross margin 24.6% 23.8% 23.9%EBITDA margin 9.2% 7.8% 9.1%EBITA margin 7.7% 6.5% 7.7%EBIT margin 5.5% 4.8% 5.8%EBT margin 5.2% 3.5% 5.2%
Return on equity 14% 7% 11%Equity ratio 30% 26% 29%ROCE (Return on capital employed) 11% 7% 11%Net working capital ratio (end of period) 13.7% 11.0% 10.3%Net working capital ratio (average) 13.3% 10.3% 10.2%Capital employed (end of period) 16,385 14,999 14,944Capital employed (average) 15,692 15,086 15,059NIBD/EBITDA 2.1 3.9 2.4
Number of employees end of period, Group 13.710 15.045 14.765 Number of employees in Denmark 1.177 1.458 1.289
Share and dividend figures, the GroupCFPS (cash flow per share), (diluted) (0.9) (11.2) 26.3 EPS (earnings per share), (diluted) 5.6 2.1 16.4 FLSmidth & Co. share price 313.0 273.4 272.3 Number of shares (1,000) end of period 51,250 53,200 51,250 Marked capitalisation 16,041 14,545 13,955
The financial ratios have been computed in accordance with the guidelines of the Danish Society of Financial Analysts from 2010.
Group financial highlights

FLSmidth: 1 January – 31 March 2015 Interim Report Page 5 of 34
Management’s Review
Group
By uneven, IMF means that growth rates are picking up in advanced economies and slowing in emerging markets and developing economies. The latter makes up roughly two-thirds of FLSmidth’s business today but advanced economies may play a more essential role in FLSmidth’s future business. The change in regional growth dynamics should be most pronounced for the cement industry which is impacted by local or regional demand, whereas the minerals business first and foremost depend on global demand.
One of the major world economic forces impacting region-al growth dynamics, and thus the cement market, is the decline in oil price. Most experts agree that the lower oil price is good for the overall economy which in turn is good for the GDP-driven cement industry. However, the flow of funds from oil-exporting countries to oil-importing coun-tries is creating a shift in the short-term demand for new cement capacity, causing a more muted short-term recovery in cement. However, it does not change the expectations for a higher cement order intake in 2015 compared to last year with generally brighter prospects ahead for global cement demand.
Customer Services and Product Compa-nies provide a stable and profitable base in a tough market environment. Margins expanded as a consequence of efficiency measures. EBITA margin of 9.5% adjusted for non-recurring costs. Positive free cash flow of DKK 715m owing to sale of Cembrit. Sequential increase in order intake. Market outlook and guidance for 2015 remain unchanged.
Market trendsThe outlook for FLSmidth’s end markets remains overall unchanged versus the end of 2014.
In its most recent World Economic Outlook, IMF projects global growth for 2015 to be on par with 2014 and refers to this as “a moderate and uneven growth”.
DKKm Q1 2015 Q1 2014 Change (%)
Order intake 4,677 4,841 -3%
Order backlog 18,952 22,152 -14%
Revenue 4,825 4,949 -3%
Gross profit 1,188 1,176 1%
Gross profit margin 24.6% 23.8%
EBITDA 443 388 14%
EBITDA margin 9.2% 7.8%
EBITA 370 322 15%
EBITA margin 7.7% 6.5%
EBIT 266 236 13%
EBIT margin 5.5% 4.8%
Number of employees 13,710 15,045 -9%
Group (continuing activities)

FLSmidth: 1 January – 31 March 2015 Interim Report Page 6 of 34
Management’sReview
The price of the shares was agreed to DKK 1.1bn (Enterprise value on a debt free basis) and the transaction was closed on 30 January 2015. The sale of Cembrit had a DKK 108m pos-itive impact on FLSmidth’s profit from discontinued activities in Q1 2015. The settlement in Q1 amounted to DKK 912m, reflected in a positive cash flow from investments of DKK 830m and a neutralised cash position of DKK 82m. The final balance sheet adjustments will be determined and settled within 12 months after the closing date.
Financial developments in Q1 2015Growth efficiencyFLSmidth saw both a revenue and order intake decline of 3% in Q1 2015, despite currency tailwind. The decline in revenue was related to the Minerals division as a consequence of a low order backlog at the beginning of the year, whereas the decline in order intake was first and foremost related to the Cement division, where no large orders became effective in the first quarter this year. In general, the Customer Services Division and the Product Company Division are showing good, stable developments.
Order intake and order backlogThe order intake decreased 3% to DKK 4,677m (Q1 2014: DKK 4,841m). Currency translation effects had a positive impact of 10%. Organic growth was -13%, which is primarily explained by the lack of large orders in Cement and no additional order intake from operation and maintenance contracts in Customer Services.
The level of unannounced orders was up 3% Q1 2015 compared to the year before, however also positively impacted by currency translation effects.
This is underpinned by expectations for mid-single digit growth in the world’s cement demand excluding China and the fact that the industry as a whole is well-capitalized and ready to invest when capacity becomes scarce.
Another dominant world economic force at present is the appreciation of the US dollar which has had an impact, especially on FLSmidth’s minerals business. Also, the mining industry still faces uncertainty and lower commodity prices. The mid- to long-term fundamentals remain strong for copper with most industry experts anticipating a supply deficit to re-emerge a few years from now. The gold price has fluctuated recently with no clear trend of direction, whereas the prices of coal and iron ore remain under downward pressure. With FLSmidth’s relatively low exposure to iron ore, the direct impact is confined, and the indirect exposure may be more important as many miners are largely dependent on cash flow from iron ore operations to cover dividends and future investments. That said, the price decline is partly self-imposed by some major miners who continue to expand low cost capacity in a market of oversupply and contracting Chinese steel demand. Logically, at some point this will have to trigger capacity adjustments and not surprisingly we have witnessed shutdown of some junior miner’s higher cost iron ore production.
Potash and phosphate prices were stable during the quarter, and the first large fertiliser order in several quarters was announced.
The overall outlook for FLSmidth’s minerals business is un-changed with mining capex expected to trough in 2015 and slow growth expected in 2016. Customer focus is on produc-tivity enhancing investments, and recovery should be evident first in the product business, whereas the projects business typically picks up later in the cycle.
For both minerals and cement, the service business and the more standardised product business, which today constitute the clear majority of Group earnings, remain resilient, and reflects a continued drive to enhance productivity and main-tain the current production capacity.
Sale of CembritOn 12 January 2015, it was announced that FLSmidth has signed an agreement with a company in the Solix Group AB to sell all shares in Cembrit Holding A/S. Cembrit is one of the leading distributors and manufacturers of fibre-cement prod-ucts in Europe and has been part of the FLSmidth Group since 1927. The sale of Cembrit concludes FLSmidth’s divestment of building materials companies, a process that started 10 years ago by the divestment of Aalborg Portland and Unicon.
Order intake (vs. Q1 2014)
Cu
sto
mer
Se
rvic
es
Pro
du
ct
Co
mp
anie
s
Min
eral
s
Cem
ent
FLSm
idth
G
rou
p
Organic growth -21% -5% 14% -45% -13%
Currency 10% 9% 11% 6% 10%
Total growth -11% 4% 25% -39% -3%
Order intake developments in Q1 2015

FLSmidth: 1 January – 31 March 2015 Interim Report Page 7 of 34
Management’sReview
The order intake in Cement declined as much as 39% in Q1 as a result of the lack of large order announcements in the quarter. However, one quarter is not significant in a project based business, and based on the current order tender activity, order intake in 2015 in the cement division is expected to be higher than in 2014. Short term, the low oil price has had a negative impact on the economic growth and infrastructure investments in oil exporting countries, whereas a low oil price is benefiting oil importing countries, however with a slightly longer time horizon.
The order intake in Customer Services declined 11% in Q1 2015, which is primarily related to lower order intake from O&M contracts, which, by nature, is the most volatile part of the order intake in Customer Services. Order intake related to service and spare parts in both cement and minerals was keeping up well in Q1.
The order intake in Minerals increased 25%, of which 11% was attributable to currency developments. Sequentially, the order intake increased 72%, although from a very low level in Q4 2014. One large order was announced in the quarter.
The order backlog for the Group was almost unchanged in Q1 2015 at DKK 18,952m (end of 2014: DKK 19,017m) as adjustments to the order backlog were compensated by currency translation effects. 56% of the order backlog is expected to be converted to revenue in the remainder of 2015, 32% in 2016, and 12% in 2017 and beyond.
As announced on 6 May 2015, the order backlog was reduced by DKK 671m related to the ceased collaboration on operation and maintenance contracts with Dangote cement on two cement plants in Nigeria.
With respect to the legacy order backlog in the Materials Handling business unit, eight projects are still regarded as risky (end of 2014: 9 projects). These projects accounted for DKK 205m of the order backlog at the end of Q1 2015 (end of 2014: DKK 208m).
RevenueRevenue decreased by 3% to DKK 4,825m in Q1 2015 (Q1 2014: DKK 4,949m), as a consequence of a lower order backlog at the beginning of the year in the Minerals Division in particular.
Revenue (vs. Q1 2014)
Cu
sto
mer
Se
rvic
es
Pro
du
ct
Co
mp
anie
s
Min
eral
s
Cem
ent
FLSm
idth
G
rou
p
Organic growth -3% -8% -40% 9% -12%
Currency 12% 9% 8% 6% 9%
Total growth 9% 1% -32% 15% -3%
Revenue developments in Q1 2015
Profit efficiencyDespite a small decline in top line in Q1 2015, the EBITA margin increased 1.2 percentage points to 7.7% due to a positive impact from the efficiency programmes and business right-sizing, more than off-setting the negative impacts from non-recurring costs recognised in the quarter.
The total costs of non-recurring nature encountered in Q1 2015 amounted to DKK -88m (Q1 2014: DKK -45m), of which DKK -73m was related to the discontinued operation and maintenance contract as previously mentioned. The remaining DKK -15m of the one-off costs are related to the additional efficiency and business right-sizing initiatives announced on 12 February 2015. As announced, the additional efficiency and right-sizing measures are expected to improve EBITA by DKK 200m in 2015, less one-off costs of DKK 100m. The programme is expected to result in headcount reductions of around 300 people. At the end of Q1 2015, 219 people had been given notice.
The gross profit was more or less unchanged at DKK 1,188m (Q1 2014: DKK 1,176m), corresponding to a gross margin of 24.6% (Q1 2014: 23.8%). The increasing gross margin is attributable to the efficiency programme.
Q1 2015 saw total research and development expenses of DKK 68m (Q1 2014: DKK 85m), representing 1.4% of revenue (Q1 2014: 1.7%), of which DKK 21m was capitalised (Q1 2014: DKK 28m) and the balance reported as production costs. In addition, project financed developments are taking place in cooperation with customers. In accordance with international accounting standards, research costs are expensed, whereas development costs are to be capitalised if substantiated by an underlying business case.

FLSmidth: 1 January – 31 March 2015 Interim Report Page 8 of 34
Management’sReview
Quarterly revenue and EBITA margin
0
1,000
2,000
3,000
4,000
5,000
6,000
7,000
8,000
0%
2%
4%
6%
8%
10%
12%
14%
DKKm EBITA-%
Revenue EBITA margin
Q1 Q2 Q3 Q4 Q1 Q2 Q3 Q4 Q1 2013 2013 2013 2013 2014 2014 2014 2014 2015
Quarterly order intake
0
1,000
2,000
3,000
4,000
5,000
6,000
DKKm
Announced O&M orders
Announced capital orders
Unannounced orders
Q1 Q2 Q3 Q4 Q1 Q2 Q3 Q4 Q1 2013 2013 2013 2013 2014 2014 2014 2014 2015
Net working capital
0
500
1,000
1,500
2,000
2,500
3,000
DKKm
Net working capital
Q1 Q2 Q3 Q4 Q1 Q2 Q3 Q4 Q1 2013 2013 2013 2013 2014 2014 2014 2014 2015
Sales, distribution and administrative costs and other operating income including some costs of one-off nature amounted to DKK 745m in Q1 2015, which represents a cost percentage of 15.4% of revenue (Q1 2014: 15.9%) and a 5% decrease on Q1 2014 (Q1 2014: DKK 788m).
Earnings before interest, tax, depreciation, amortisation and impairment (EBITDA) increased 14% to DKK 443m (Q1 2014: DKK 388m) corresponding to an EBITDA margin of 9.2% (Q1 2014: 7.8%).
Depreciation and impairment of tangible assets amounted to DKK -73m (Q1 2014: DKK -66m).
Earnings before amortisation and impairment of intangible assets (EBITA) increased 15% to DKK 370m (Q1 2014: DKK 322m), corresponding to an EBITA margin of 7.7% (Q1 2014: 6.5%). Adjusted for non-recurring costs, the EBITA-margin was 9.5% in Q1 (Q1 2014: 7.4%).
Amortisation and impairment of intangible assets amounted to DKK -104m (Q1 2014: DKK -86m). The effect of purchase price allocations amounted to DKK -71m (Q1 2014: DKK -76m) and other amortisations to DKK -33m (Q1 2014: DKK -10m). The increase is related to increased use of the new ERP business system.
Earnings before interest and tax (EBIT) amounted to DKK 266m (Q1 2014: DKK 236m), corresponding to an EBIT margin of 5.5% (Q1 2014: 4.8%).
Net financial items amounted to DKK -14m (Q1 2014: DKK -62m), of which foreign exchange and fair value adjustments amounted to DKK -7m (Q1 2014: DKK -51m). Net interest costs amounted to DKK -7m (Q1 2014: DKK -11m).
Earnings before tax (EBT) was DKK 252m (Q1 2014: DKK 174m).
The tax for the year amounted to DKK -78m (Q1 2014: DKK -56m), corresponding to an effective tax rate of 31%.
Profit from discontinued activities amounted to DKK 98m, mainly related to the sale of Cembrit (Q1 2014: DKK -3m).
Profit/loss for the period increased to DKK 272m (Q1 2014: DKK 115m).

FLSmidth: 1 January – 31 March 2015 Interim Report Page 9 of 34
-600
-500
-400
-300
-200
-100
0
100
200
300
DKKm
CFFO
Q1 Q2 Q3 Q4 Q1 Q2 Q3 Q4 Q1 2013 2013 2013 2013 2014 2014 2014 2014 2015
Management’sReview
Cement 9%
Customer Services 37%
Product Companies 32%
Minerals 22%
Order intake – by segment (Q1 2015)
Other 29%
Cement 30%
Copper 16%
Fertilizer 0%
Gold 6%Coal 6%Iron ore 8%Fertiliser 5%
Order intake – by industry (Q1 2015)
Capital efficiencyThe balance sheet was significantly impacted by currency translation effects as well as the sale of Cembrit in Q1 2015. The net interest bearing debt decreased to DKK 4,258m and the financial gearing declined to 2.1. At the same time, the equity ratio increased to 30%, which means that the capital structure is getting closer to the targeted range.
Capital employed and ROCEAverage Capital employed increased to DKK 15.7bn in Q1 2015 (end of 2014: DKK 15.1bn) due to currency translation effects, while 12 months trailing EBITA increased to DKK 1,675m (2014: DKK 1,627m). Consequently, ROCE was unchanged at 11% (2014: 11%).
Capital employed consists primarily of intangible assets amounting to DKK 10.6bn which is mostly historical goodwill as well as patents and rights, and customer relations. Tangible assets account for DKK 2.9bn and net working capital for DKK 2.9bn, which leaves limited room for significant reductions in Capital employed.
Consequently, reaching the target of more than 20% Return on Capital employed requires an increase in EBITA to around DKK 3bn through a combination of top-line growth and margin expansion.
Cash flow developments and working capitalCash flow from operating activities amounted to DKK -45m in Q1 2015 (Q1 2014: DKK -552m). The improvement on last year is explained by higher operational earnings, a positive impact from provisions and less negative impact from change in working capital and taxes paid.
Net working capital amounted to DKK 2,868m at the end of Q1 2015 (end of 2014: DKK 2,164m), representing 13.7% of 12 months trailing revenue at the end of Q1 2015 (Q1 2014: 11.0% of revenue). The ratio is negatively impacted by an uneven currency impact. Thus, net working capital has full currency impact, while 12 months trailing revenue only partly reflects current foreign exchange rates. Adjusted for currency effects, net working capital increased by DKK 328m in Q1 2015. Historically, net working capital has proven to be seasonally weak in Q1, which was also the case this year. The currency adjusted increase is almost entirely explained by an increase in net work in progress. It is worth mentioning that both accounts receivable and accounts payable decreased by around DKK 0.5bn in
Cash flow from operating activities
Cement 17%
Customer Services 37%
Product Companies 27%
Minerals 19%
Revenue – by segment (Q1 2015)

FLSmidth: 1 January – 31 March 2015 Interim Report Page 10 of 34
Management’sReview
Q1 and that inventories were stable, when adjusted for currency effects. The ambition is that net working capital should not exceed 10% of sales at any point in the cycle, and in times when project business is the predominant business area, net working capital should even be low single digit or close to zero. Each of the divisions have been given specific net working capital targets, reflecting the business model of each division.
Investing in the businessCash flow from investing activities amounted to DKK 760m (Q1 2014: DKK -72m), including divestment of Cembrit, contributing with a DKK 830m positive impact in Q1 2015.
Cash flow from investments (excluding acquisitions and divestments) amounted to DKK -70m in Q1 (Q1 2014: DKK -72m) which was below the level of depreciation, and amortisation (excluding the effect of purchase price allocations), amounting to DKK 106m in Q1 2015.
Balance sheet, capital structure and dividendThe balance sheet total amounted to DKK 26,942m at the end of Q1 2015 (end of 2014: DKK 26,352m). The increase is primarily explained by currency translation effects.
Equity at the end of Q1 2015 increased to DKK 8,157m (end of 2014: DKK 7,761m), and the equity ratio increased to 30% at the end of Q1 2015 (end of 2014: 29%), despite pay-out of dividend to shareholders in Q1 2015 of DKK 439m.
Net interest-bearing debt by the end of Q1 2015 amounted to DKK 4,258 (end of 2014: DKK 4,557m) and the Group’s financial gearing (calculated as NIBD divided by 12 months trailing EBITDA) amounted to 2.1 at the end of Q1 2015 (end of 2014: 2.4). The gearing is continuously getting closer to the targeted capital structure of maximum two times EBITDA.
Net interest-bearing debt decreased by DKK 0.3bn in Q1 2015, which is reflecting free cash flow of DKK 0.7bn in Q1 2015, and dividend paid out of DKK 0.4bn.
The Group’s capital resources currently consist of committed credit facilities of DKK 7.9bn (excluding mortgage) with a weighted average time to maturity of 3.9 years.
Treasury sharesFLSmidth’s treasury share capital amounted to 2,401,823 shares at the end of Q1 2015 (end of 2014: 2,412,491 shares) representing 4.7% of the total share capital (end
of 2014: 4.7%). The holding of treasury shares is adjusted continuously to match FLSmidth’s incentive plans.
Incentive planAt the end of Q1 2015, there were a total of 2.442.986 unexercised share options under FLSmidth’s incentive plan and the fair value of them was DKK 147m. The fair value is calculated by means of a Black & Scholes model based on a current share price of DKK 313, a volatility of 27.35% and annual dividend of DKK 9 per share. The effect of the plan on the income statement for Q1 2015 was DKK 11m (Q1 2014: DKK 11m).
EmployeesThe number of employees amounted to 13,710 by the end of Q1 2015, representing a decrease of 7% in Q1 (end 2014: 14,765). The decline is primarily explained by the divestment of Cembrit.
Guidance for 2015 (unchanged)In 2015, FLSmidth & Co. A/S expects a consolidated revenue of DKK 19-21bn (Q1 2015: DKK 4.8bn) and an EBITA margin of 9-10% (Q1 2015: 7.7%).
The return on capital employed is expected to be 12-14% in 2015 (Q1 2015: 11%).
The effective tax rate is expected to be 31-33% (Q1 2015: 31%) and cash-flow from investments is expected to be around DKK -0.4bn excluding acquisitions and divestments. (Q1 2015: DKK -70m).
With respect to the expected divisional performance, it is clear that 2015 will be a challenging year for the two project divisions, Minerals and Cement, considering the relatively low order backlog at the beginning of the year and the current cyclical downturn. Cement, however, is expected to see a pickup in order intake in 2015.
The Product Companies division and the Customer Services division are expected to be on a growth trajectory with a potential to expand margins.
Events occurring after the balance sheet dateAs announced on 6 May 2015, FLSmidth has reached an agreement to exit O&M contracts with Dangote Cement PLC in Nigeria due to changed market conditions.

FLSmidth: 1 January – 31 March 2015 Interim Report Page 11 of 34
Forward-looking statements FLSmidth & Co. A/S’ financial reports, whether in the form of annual reports or interim reports, filed with the Danish Business Authority and/or announced via the company’s website and/or NASDAQ OMX Copenhagen, as well as any presentations based on such financial reports, and any other written information released, or oral statements made, to the public based on this interim report in the future on behalf of FLSmidth & Co. A/S, may contain forward-looking statements.
Words such as ‘believe’, ‘expect’, ‘may’, ‘will’, ‘plan’, ‘strategy’, ‘prospect’, ‘foresee’, ‘estimate’, ‘project’, ‘anticipate’, ‘can’, ‘intend’, ‘target’ and other words and terms of similar meaning in connection with any discussion of future operating or financial performance identify forward-looking statements. Examples of such forward-looking statements include, but are not limited to:
• statements of plans, objectives or goals for future operations, including those related to FLSmidth & Co. A/S markets, products, product research and product development
• statements containing projections of or targets for revenues, profit (or loss), capital expenditures, dividends, capital structure or other net financial items
• statements regarding future economic performance, future actions and outcome of contingencies such as legal proceedings and statements regarding the underlying assumptions or relating to such statements
• statements regarding potential merger & acquisition activities
These forward-looking statements are based on current plans, estimates and projections. By their very nature, forward-looking statements involve inherent risks and uncertainties, both general and specific, which may be outside FLSmidth & Co. A/S´ influence, and which could materially affect such forward-looking statements. FLSmidth & Co. A/S cautions that a number of important factors, including those described in this report, could cause actual results to differ materially from those contemplated in any forward-looking statements.
Factors that may affect future results include, but are not limited to, global as well as local political and economic conditions, including interest rate and exchange rate fluctuations, delays or faults in project execution, fluctuations in raw material prices, delays in research and/ or development of new products or service concepts, interruptions of supplies and production, unexpected breach or termination of contracts, market-driven price reductions for FLSmidth & Co. A/S’ products and/or services, introduction of competing products, reliance on information technology.
FLSmidth & Co. A/S’ ability to successfully market current and new products, exposure to product liability and legal proceedings and investigations, changes in legislation or regulation and interpretation thereof, intellectual property protection, perceived or actual failure to adhere to ethical marketing practices, investments in and divestitures of domestic and foreign enterprises, unexpected growth in costs and expenses, failure to recruit and retain the right employees and failure to maintain a culture of compliance. Unless required by law FLSmidth & Co. A/S is under no duty and undertakes no obligation to update or revise any forward-looking statement after the distribution of this annual report.
Management’sReview
FLSmidth: 1 January – 31 March 2015 Interim Report Page 12 of 34
FACTS
Customer Services
Long term financial targets:
5-10% annual revenue growth (over the cycle)
EBITA margin > 15%
NWC 15-20%
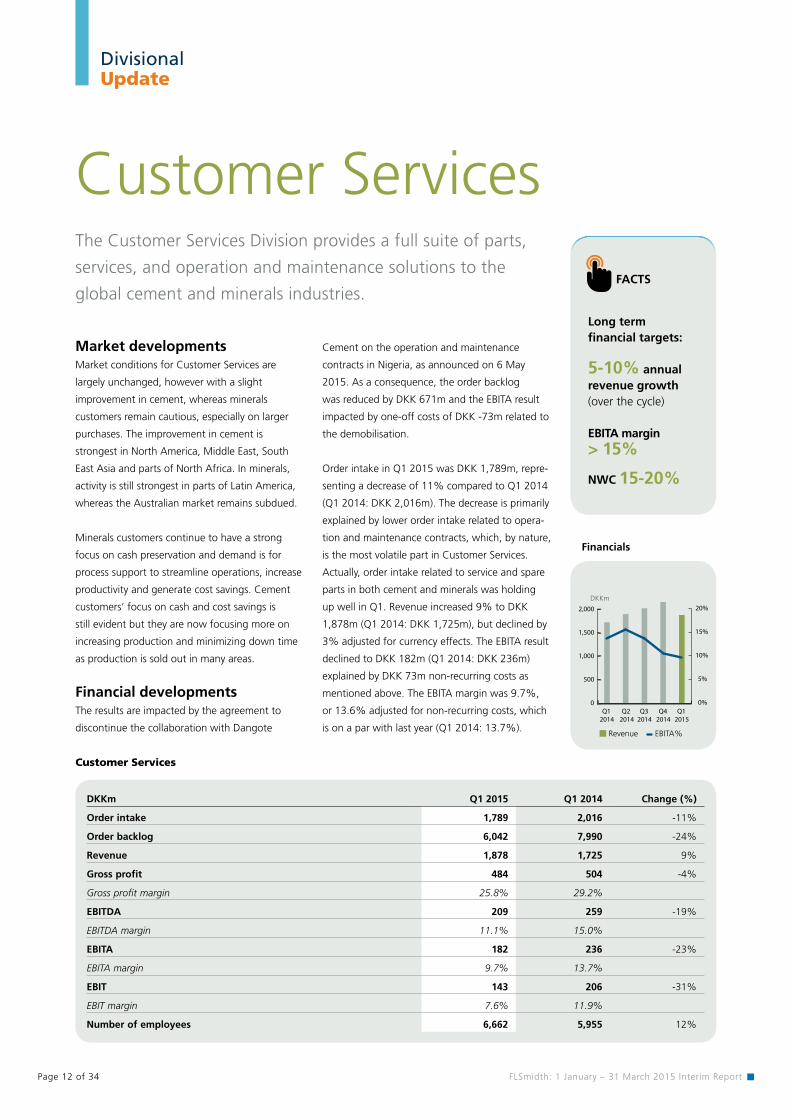
Financials
0
500
1,000
1,500
2,000
0%
5%
10%
15%
20%DKKm
Revenue EBITA%
Q1 Q2 Q3 Q4 Q1 2014 2014 2014 2014 2015
DKKm Q1 2015 Q1 2014 Change (%)
Order intake 1,789 2,016 -11%
Order backlog 6,042 7,990 -24%
Revenue 1,878 1,725 9%
Gross profit 484 504 -4%
Gross profit margin 25.8% 29.2%
EBITDA 209 259 -19%
EBITDA margin 11.1% 15.0%
EBITA 182 236 -23%
EBITA margin 9.7% 13.7%
EBIT 143 206 -31%
EBIT margin 7.6% 11.9%
Number of employees 6,662 5,955 12%
Customer Services
The Customer Services Division provides a full suite of parts,
services, and operation and maintenance solutions to the
global cement and minerals industries.
Cement on the operation and maintenance
contracts in Nigeria, as announced on 6 May
2015. As a consequence, the order backlog
was reduced by DKK 671m and the EBITA result
impacted by one-off costs of DKK -73m related to
the demobilisation.
Order intake in Q1 2015 was DKK 1,789m, repre-
senting a decrease of 11% compared to Q1 2014
(Q1 2014: DKK 2,016m). The decrease is primarily
explained by lower order intake related to opera-
tion and maintenance contracts, which, by nature,
is the most volatile part in Customer Services.
Actually, order intake related to service and spare
parts in both cement and minerals was holding
up well in Q1. Revenue increased 9% to DKK
1,878m (Q1 2014: DKK 1,725m), but declined by
3% adjusted for currency effects. The EBITA result
declined to DKK 182m (Q1 2014: DKK 236m)
explained by DKK 73m non-recurring costs as
mentioned above. The EBITA margin was 9.7%,
or 13.6% adjusted for non-recurring costs, which
is on a par with last year (Q1 2014: 13.7%).
Market developmentsMarket conditions for Customer Services are
largely unchanged, however with a slight
improvement in cement, whereas minerals
customers remain cautious, especially on larger
purchases. The improvement in cement is
strongest in North America, Middle East, South
East Asia and parts of North Africa. In minerals,
activity is still strongest in parts of Latin America,
whereas the Australian market remains subdued.
Minerals customers continue to have a strong
focus on cash preservation and demand is for
process support to streamline operations, increase
productivity and generate cost savings. Cement
customers’ focus on cash and cost savings is
still evident but they are now focusing more on
increasing production and minimizing down time
as production is sold out in many areas.
Financial developmentsThe results are impacted by the agreement to
discontinue the collaboration with Dangote
Divisional Update

FLSmidth: 1 January – 31 March 2015 Interim Report Page 13 of 34
Product Companies
FACTS
Long term financial targets:
5-10% annual revenue growth (over the cycle)
EBITA margin
12-15%
NWC ~15%
DKKm Q1 2015 Q1 2014 Change (%)
Order intake 1,580 1,516 4%
Order backlog 3,074 3,174 -3%
Revenue 1,375 1,356 1%
Gross profit 419 387 8%
Gross profit margin 30.5% 28.5%
EBITDA 220 150 47%
EBITDA margin 16.0% 11.0%
EBITA 198 128 55%
EBITA margin 14.4% 9.5%
EBIT 180 109 65%
EBIT margin 13.1% 8.0%
Number of employees 3,370 3,600 -6%
Product Companies
Adjusted for currency effects, however, the order
intake decreased 5%. Revenue increased 1%
to DKK 1,375m (Q1 2014: DKK 1,356m), but
decreased 8% adjusted for currency effects.
The EBITA result amounted to DKK 198m in Q1,
representing a 55% increase over last year (Q1
2014: DKK128m). As a result, the EBITA margin
in Q1 increased to 14.4% which is significantly
higher than the corresponding quarter last year
(Q1 2014: 9.5%), and the previous quarter
(Q4 2014: 9.2%). The margin improvement
is explained by lower indirect production and
administration costs, which is attributable to the
efficiency programme.
Market developments in Q1 2015Although the product companies are
predominantly exposed to replacement demand
as well as parts and services, they are not
completely immune to changes in demand for
new equipment and capex investments by the
cement and minerals industries. As such, both
order intake and revenue will fluctuate from
quarter to quarter, although with significantly less
amplitude than the project business.
Financial developmentsOrder intake in Q1 2015 increased to DKK
1,580m, which is the highest level since Q3 2012,
representing an increase of 4% compared to Q1
2014 (Q1 2014: DKK 1,516m).
The Products Companies Division hosts a diverse portfolio of
relatively standardised market leading product brands, applied
in cement, minerals and adjacent industries.
Financials
0
300
600
900
1,200
1,500
0%
5%
10%
15%
20%DKKm
Revenue EBITA%
Q1 Q2 Q3 Q4 Q1 2014 2014 2014 2014 2015
Divisional Update

FLSmidth: 1 January – 31 March 2015 Interim Report Page 14 of 34
Minerals
FACTS
Long term financial targets:
5-6% annual revenue growth (over the cycle)
EBITA margin 3-8% (over a cycle)
Negative NWC
DKKm Q1 2015 Q1 2014 Change (%)
Order intake 1,074 858 25%
Order backlog 6,123 6,765 -9%
Revenue 946 1,387 -32%
Gross profit 143 170 -16%
Gross profit margin 15.0% 12.3%
EBITDA (37) (36) n/a
EBITDA margin -4.0% -2.6%
EBITA (52) (51) n/a
EBITA margin -5.5% -3.7%
EBIT (91) (83) n/a
EBIT margin -9.6% -6.0%
Number of employees 2,344 2,994 -22%
Minerals
future investments. Potash and phosphate prices
were stable during the quarter which included the
announcement of the first large fertilizer order in
several quarters.
Financial developmentsOrder intake in Q1 2015 increased 25% to DKK
1,074m (Q1 2014: DKK 858m), attributable
to the announced order of DKK 230m from
Morocco in Q1. Adjusted for currency effects,
the order intake increased 14%. On the other
hand, revenue decreased 32%, as expected, to
DKK 946m (Q1 2014: DKK 1,387m) due to the
lower order backlog at the beginning of the year.
EBITA amounted to DKK -52m which is almost
unchanged from last year (Q1 2014: DKK -51m),
corresponding to an EBITA margin of -5.5% (Q1
2014: -3.7%). The negative margin is explained
by the ongoing restructuring and efficiency
measures, reflected in a cost structure that is still
not right-sized and optimised, which is expected
to be the case by the end of 2015.
Market developments in Q1 2015The overall outlook for FLSmidth’s minerals
business is unchanged with mining capex
expected to trough in 2015 and slow growth
expected in 2016. Customer focus is on
productivity enhancing investments, and recovery
should be evident first in the product business,
whereas the projects business typically picks up
later in the cycle.
The mining industry still faces uncertainty and
declining commodity prices. However, the mid-
to long-term fundamentals remain strong for
copper with most industry experts anticipating
a supply deficit to re-emerge a few years from
now. The gold price has fluctuated recently with
no clear trend of direction, whereas the prices
of coal and iron ore remain under downward
pressure. With FLSmidth’s relatively low exposure
to iron ore, the direct impact is confined, and the
indirect exposure is maybe more important as
many miners are largely dependent on cash flow
from iron ore operations to cover dividends and
The Minerals Division is a leading provider of mineral
processing and material handling technology and solutions to
the global minerals industries.
Financials
0
400
800
1,200
1,600
2,000
-6%
-4%
-2%
0%DKKm
Revenue EBITA%
Q1 Q2 Q3 Q4 Q1 2014 2014 2014 2014 2015
Divisional Update
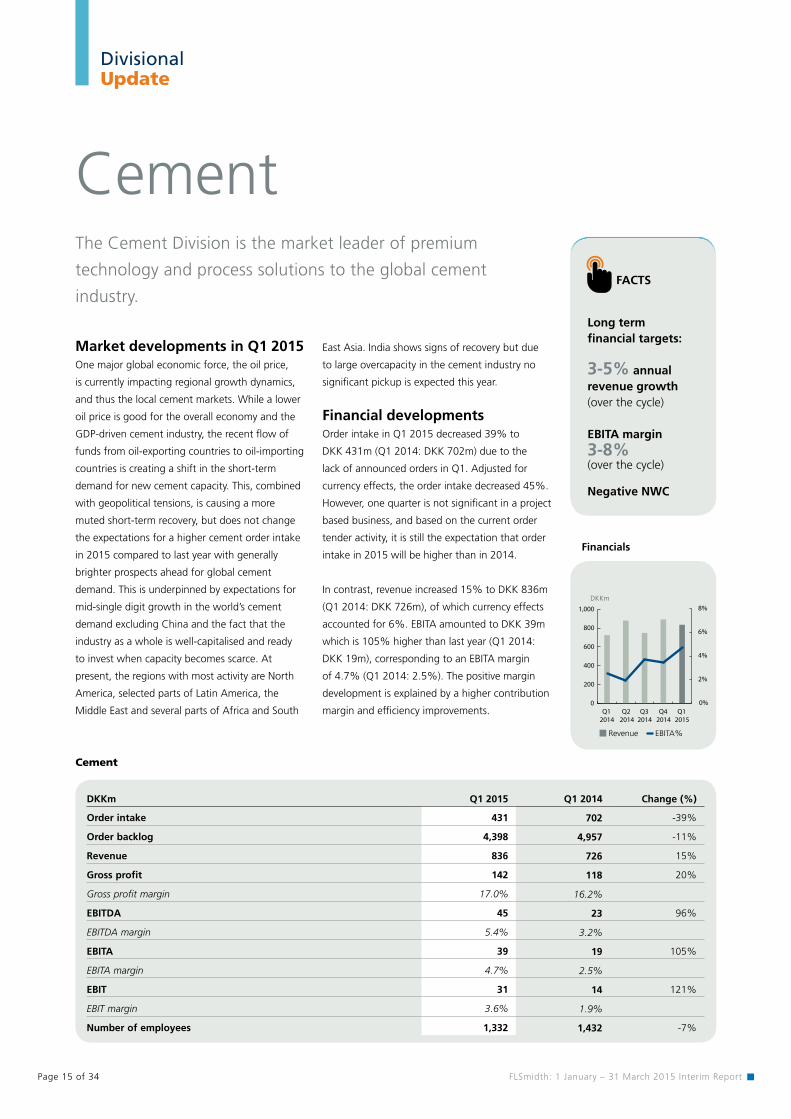
DKKm Q1 2015 Q1 2014 Change (%)
Order intake 431 702 -39%
Order backlog 4,398 4,957 -11%
Revenue 836 726 15%
Gross profit 142 118 20%
Gross profit margin 17.0% 16.2%
EBITDA 45 23 96%
EBITDA margin 5.4% 3.2%
EBITA 39 19 105%
EBITA margin 4.7% 2.5%
EBIT 31 14 121%
EBIT margin 3.6% 1.9%
Number of employees 1,332 1,432 -7%
Cement
FLSmidth: 1 January – 31 March 2015 Interim Report Page 15 of 34
Cement
FACTS
Long term financial targets:
3-5% annual revenue growth (over the cycle)
EBITA margin 3-8% (over the cycle)
Negative NWC
East Asia. India shows signs of recovery but due
to large overcapacity in the cement industry no
significant pickup is expected this year.
Financial developmentsOrder intake in Q1 2015 decreased 39% to
DKK 431m (Q1 2014: DKK 702m) due to the
lack of announced orders in Q1. Adjusted for
currency effects, the order intake decreased 45%.
However, one quarter is not significant in a project
based business, and based on the current order
tender activity, it is still the expectation that order
intake in 2015 will be higher than in 2014.
In contrast, revenue increased 15% to DKK 836m
(Q1 2014: DKK 726m), of which currency effects
accounted for 6%. EBITA amounted to DKK 39m
which is 105% higher than last year (Q1 2014:
DKK 19m), corresponding to an EBITA margin
of 4.7% (Q1 2014: 2.5%). The positive margin
development is explained by a higher contribution
margin and efficiency improvements.
Market developments in Q1 2015One major global economic force, the oil price,
is currently impacting regional growth dynamics,
and thus the local cement markets. While a lower
oil price is good for the overall economy and the
GDP-driven cement industry, the recent flow of
funds from oil-exporting countries to oil-importing
countries is creating a shift in the short-term
demand for new cement capacity. This, combined
with geopolitical tensions, is causing a more
muted short-term recovery, but does not change
the expectations for a higher cement order intake
in 2015 compared to last year with generally
brighter prospects ahead for global cement
demand. This is underpinned by expectations for
mid-single digit growth in the world’s cement
demand excluding China and the fact that the
industry as a whole is well-capitalised and ready
to invest when capacity becomes scarce. At
present, the regions with most activity are North
America, selected parts of Latin America, the
Middle East and several parts of Africa and South
The Cement Division is the market leader of premium
technology and process solutions to the global cement
industry.
Financials
0
200
400
600
800
1,000
0%
2%
4%
6%
8%DKKm
Revenue EBITA%
Q1 Q2 Q3 Q4 Q1 2014 2014 2014 2014 2015
Divisional Update
FLSmidth: 1 January – 31 March 2015 Interim Report Page 16 of 34
Statement by Management on the annual report
The Board of Directors and the Executive Board have today considered and approved the interim report for the period 1 January - 31 March 2015.
The consolidated financial statements are presented in accordance with International Financial Reporting Standards as adopted by the EU. The parent financial statements are presented in accordance with the Danish Financial Statements Act. Further, the interim report is prepared in accordance with Danish disclosure requirements for listed companies.
In our opinion, the consolidated financial statements and the parent financial statements give a true and fair view of
the Group’s and the Parent’s financial position at 31 March 2015 as well as of the results of their operations and cash flows for the period 1 January - 31 March 2015.
In our opinion, the management commentary contains a fair review of the development of the Group’s and the Parent’s business and financial matters, the results for the year and of the Parent’s financial position and the financial position as a whole of the entities included in the consolidated financial statements, together with a description of the principal risks and uncertainties that the Group and the Parent face.
Thomas SchulzGroup Chief Executive Officer
Vagn Ove SørensenChairman
Sten Jakobsson
Mette Dobel
Virve Elisabeth MeesakGroup Executive Vice President
Per Mejnert KristensenGroup Executive Vice President
Lars VestergaardGroup Executive Vice President and CFO
Torkil BentzenVice chairman
Tom Knutzen
Søren Quistgaard Larsen
Brian M. DayGroup Executive Vice President
Eric Thomas PoupierGroup Executive Vice President
Bjarne Moltke HansenGroup Executive Vice President
Martin Ivert
Caroline Grégoire Sainte Marie
Jens Peter Koch
Manfred SchafferGroup Executive Vice President
Copenhagen, 8 May 2015
Group Executive Management
Board of Directors
FLSmidth: 1 January – 31 March 2015 Interim Report Page 17 of 34
Consolidated financial statements
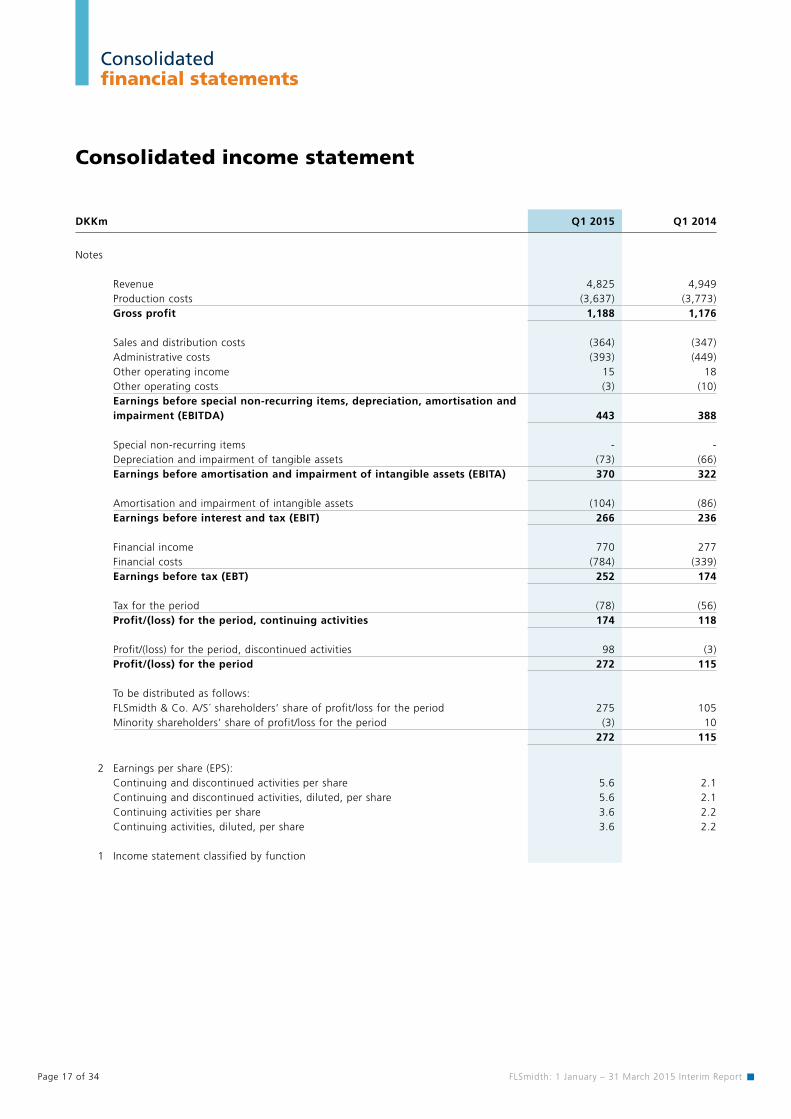
Consolidated income statement
DKKm Q1 2015 Q1 2014
Notes
Revenue 4,825 4,949 Production costs (3,637) (3,773)Gross profit 1,188 1,176
Sales and distribution costs (364) (347)Administrative costs (393) (449)Other operating income 15 18 Other operating costs (3) (10)Earnings before special non-recurring items, depreciation, amortisation andimpairment (EBITDA) 443 388
Special non-recurring items - - Depreciation and impairment of tangible assets (73) (66)Earnings before amortisation and impairment of intangible assets (EBITA) 370 322
Amortisation and impairment of intangible assets (104) (86)Earnings before interest and tax (EBIT) 266 236
Financial income 770 277 Financial costs (784) (339)Earnings before tax (EBT) 252 174
Tax for the period (78) (56)Profit/(loss) for the period, continuing activities 174 118
Profit/(loss) for the period, discontinued activities 98 (3)Profit/(loss) for the period 272 115
To be distributed as follows:FLSmidth & Co. A/S´ shareholders’ share of profit/loss for the period 275 105Minority shareholders’ share of profit/loss for the period (3) 10
272 115
2 Earnings per share (EPS):Continuing and discontinued activities per share 5.6 2.1Continuing and discontinued activities, diluted, per share 5.6 2.1Continuing activities per share 3.6 2.2Continuing activities, diluted, per share 3.6 2.2
1 Income statement classified by function
FLSmidth: 1 January – 31 March 2015 Interim Report Page 18 of 34
Consolidated financial statements
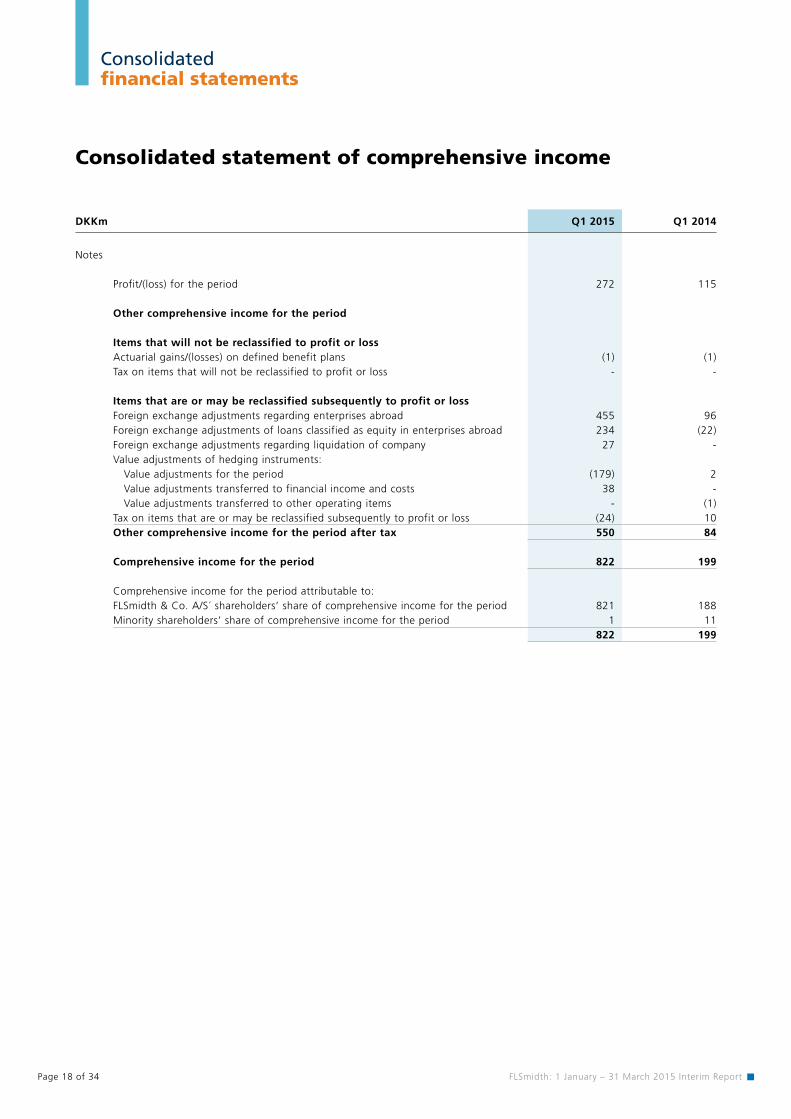
Consolidated statement of comprehensive income
DKKm Q1 2015 Q1 2014
Notes
Profit/(loss) for the period 272 115
Other comprehensive income for the period
Items that will not be reclassified to profit or lossActuarial gains/(losses) on defined benefit plans (1) (1)Tax on items that will not be reclassified to profit or loss - -
Items that are or may be reclassified subsequently to profit or lossForeign exchange adjustments regarding enterprises abroad 455 96Foreign exchange adjustments of loans classified as equity in enterprises abroad 234 (22)Foreign exchange adjustments regarding liquidation of company 27 -Value adjustments of hedging instruments: Value adjustments for the period (179) 2 Value adjustments transferred to financial income and costs 38 - Value adjustments transferred to other operating items - (1)Tax on items that are or may be reclassified subsequently to profit or loss (24) 10Other comprehensive income for the period after tax 550 84
Comprehensive income for the period 822 199
Comprehensive income for the period attributable to:FLSmidth & Co. A/S´ shareholders’ share of comprehensive income for the period 821 188Minority shareholders’ share of comprehensive income for the period 1 11
822 199
FLSmidth: 1 January – 31 March 2015 Interim Report Page 19 of 34
Consolidated financial statements
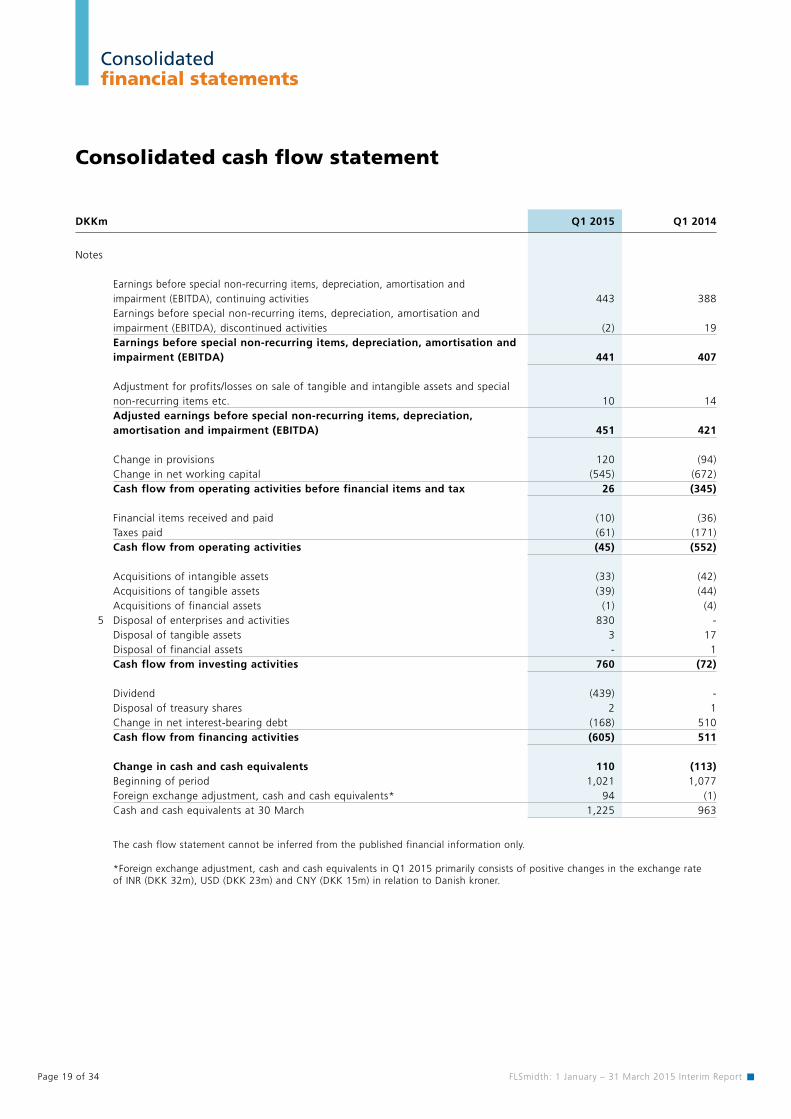
Consolidated cash flow statement
DKKm Q1 2015 Q1 2014
Notes
Earnings before special non-recurring items, depreciation, amortisation and impairment (EBITDA), continuing activities 443 388Earnings before special non-recurring items, depreciation, amortisation and impairment (EBITDA), discontinued activities (2) 19Earnings before special non-recurring items, depreciation, amortisation and impairment (EBITDA) 441 407
Adjustment for profits/losses on sale of tangible and intangible assets and special non-recurring items etc. 10 14Adjusted earnings before special non-recurring items, depreciation, amortisation and impairment (EBITDA) 451 421
Change in provisions 120 (94)Change in net working capital (545) (672)Cash flow from operating activities before financial items and tax 26 (345)
Financial items received and paid (10) (36)Taxes paid (61) (171)Cash flow from operating activities (45) (552)
Acquisitions of intangible assets (33) (42)Acquisitions of tangible assets (39) (44)Acquisitions of financial assets (1) (4)
5 Disposal of enterprises and activities 830 - Disposal of tangible assets 3 17 Disposal of financial assets - 1 Cash flow from investing activities 760 (72)
Dividend (439) - Disposal of treasury shares 2 1 Change in net interest-bearing debt (168) 510 Cash flow from financing activities (605) 511
Change in cash and cash equivalents 110 (113)Beginning of period 1,021 1,077 Foreign exchange adjustment, cash and cash equivalents* 94 (1)Cash and cash equivalents at 30 March 1,225 963
The cash flow statement cannot be inferred from the published financial information only.
*Foreign exchange adjustment, cash and cash equivalents in Q1 2015 primarily consists of positive changes in the exchange rate of INR (DKK 32m), USD (DKK 23m) and CNY (DKK 15m) in relation to Danish kroner.

FLSmidth: 1 January – 31 March 2015 Interim Report Page 20 of 34
Consolidated financial statements
Consolidated balance sheet
Assets
DKKm End of Q1 2015 End of 2014
Notes
Goodwill 4,540 4,275 Patents and rights 1,474 1,490 Customer relations 1,279 1,207 Other intangible assets 91 109 Completed development projects 325 336 Intangible assets under development 359 336 Intangible assets 8,068 7,753
Land and buildings 1,878 1,707Plant and machinery 763 693Operating equipment, fixtures and fittings 215 191Tangible assets in course of construction 77 111Tangible assets 2,933 2,702
Investments in associates 8 8Other securities and investments 92 90Pension assets 3 3Deferred tax assets 1,056 979Financial assets 1,159 1,080
Total non-current assets 12,160 11,535
Inventories 2,936 2,628
Trade receivables 4,971 5,0268 Work-in-progress for third parties 3,570 3,289
Prepayments to subcontractors 447 279Other receivables 1,596 1,216Prepaid expenses and accrued income 37 20Receivables 10,621 9,830
Cash and cash equivalents 1,225 963
Assets classified as held for sale - 1,396
Total current assets 14,782 14,817
TOTAL ASSETS 26,942 26,352

FLSmidth: 1 January – 31 March 2015 Interim Report Page 21 of 34
Consolidated financial statements
Equity and liabilities
DKKm End of Q1 2015 End of 2014
Notes
Share capital 1,025 1,025Foreign exchange adjustments 380 (332)Value adjustments of hedging transactions (204) (63)Retained earnings 6,914 6,629Proposed dividend - 461FLSmidth & Co. A/S’ shareholders’ share of equity 8,115 7,720Minority shareholders’ share of equity 42 41Total equity 8,157 7,761 Deferred tax liabilities 581 552Pension liabilities 280 263
6 Other provisions 631 551Mortgage debt 352 352Bank loans 4,338 3,777Finance lease - 3Prepayments from customers 293 229Other liabilities 177 141Long-term liabilities 6,652 5,868
Pension liabilities 6 66 Other provisions 1,168 1,047
Bank loans 996 1,401Finance lease 3 3Prepayments from customers 1,742 1,602
8 Work-in-progress for third parties 3,122 3,223Trade payables 2,469 2,736Current tax liabilities 437 261Other liabilities 2,149 1,928Deferred revenue 41 33Short-term liabilities 12,133 12,240
Liabilities directly associated with assets classified as held for sale - 483
Total liabilities 18,785 18,591
TOTAL EQUITY AND LIABILITIES 26,942 26,352
Consolidated balance sheet
FLSmidth: 1 January – 31 March 2015 Interim Report Page 22 of 34
Consolidated financial statements
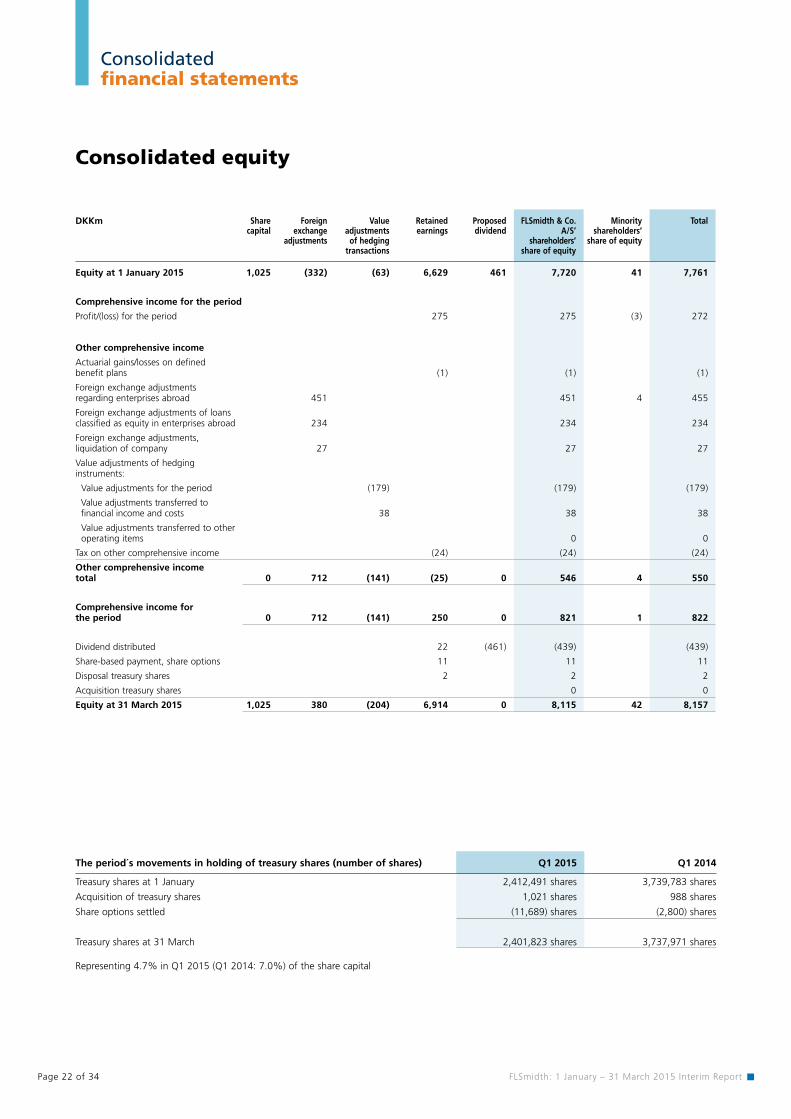
Consolidated equity
DKKm Share capital
Foreignexchange
adjustments
Valueadjustments
of hedgingtransactions
Retainedearnings
Proposeddividend
FLSmidth & Co. A/S’
shareholders’share of equity
Minorityshareholders’
share of equity
Total
Equity at 1 January 2015 1,025 (332) (63) 6,629 461 7,720 41 7,761
Comprehensive income for the period
Profit/(loss) for the period 275 275 (3) 272
Other comprehensive income
Actuarial gains/losses on defined benefit plans (1) (1) (1)
Foreign exchange adjustments regarding enterprises abroad 451 451 4 455
Foreign exchange adjustments of loans classified as equity in enterprises abroad 234 234 234
Foreign exchange adjustments, liquidation of company 27 27 27
Value adjustments of hedging instruments:
Value adjustments for the period (179) (179) (179)
Value adjustments transferred to financial income and costs 38 38 38
Value adjustments transferred to other operating items 0 0
Tax on other comprehensive income (24) (24) (24)
Other comprehensive income total 0 712 (141) (25) 0 546 4 550
Comprehensive income for the period 0 712 (141) 250 0 821 1 822
Dividend distributed 22 (461) (439) (439)
Share-based payment, share options 11 11 11
Disposal treasury shares 2 2 2
Acquisition treasury shares 0 0
Equity at 31 March 2015 1,025 380 (204) 6,914 0 8,115 42 8,157
The period´s movements in holding of treasury shares (number of shares) Q1 2015 Q1 2014
Treasury shares at 1 January 2,412,491 shares 3,739,783 shares
Acquisition of treasury shares 1,021 shares 988 shares
Share options settled (11,689) shares (2,800) shares
Treasury shares at 31 March 2,401,823 shares 3,737,971 shares
Representing 4.7% in Q1 2015 (Q1 2014: 7.0%) of the share capital

FLSmidth: 1 January – 31 March 2015 Interim Report Page 23 of 34
Consolidated financial statements
Consolidated equity
DKKm Share capital
Foreignexchange
adjustments
Valueadjustments
of hedgingtransactions
Retainedearnings
Proposeddividend
FLSmidth & Co. A/S’
shareholders’share of equity
Minorityshareholders’
share of equity
Total
Equity at 1 January 2014 1,064 (733) (23) 6,474 106 6,888 34 6,922
Comprehensive income for the period
Profit/(loss) for the period 105 105 10 115
Other comprehensive income
Actuarial gains/losses on defined benefit plans (1) (1) (1)
Foreign exchange adjustments regarding enterprises abroad 95 95 1 96
Foreign exchange adjustments of loans classified as equity in enterprises abroad (22) (22) (22)
Value adjustments of hedging instruments:
Value adjustments for the period 2 2 2
Value adjustments transferred to financial income and costs 0 0
Value adjustments transferred to other operating items (1) (1) (1)
Tax on other comprehensive income 10 10 10
Other comprehensive income total 0 73 1 9 0 83 1 84
Comprehensive income for the period 0 73 1 114 0 188 11 199
Share-based payment, share options 11 11 11
Disposal of treasury shares 0 0
Dividend transferred to other liabilities 7 (106) (99) (99)
Acquisition of treasury shares 0 0
Equity at 31 March 2014 1,064 (660) (22) 6,606 0 6,988 45 7,033
FLSmidth: 1 January – 31 March 2015 Interim Report Page 24 of 34
Notes to the interim report
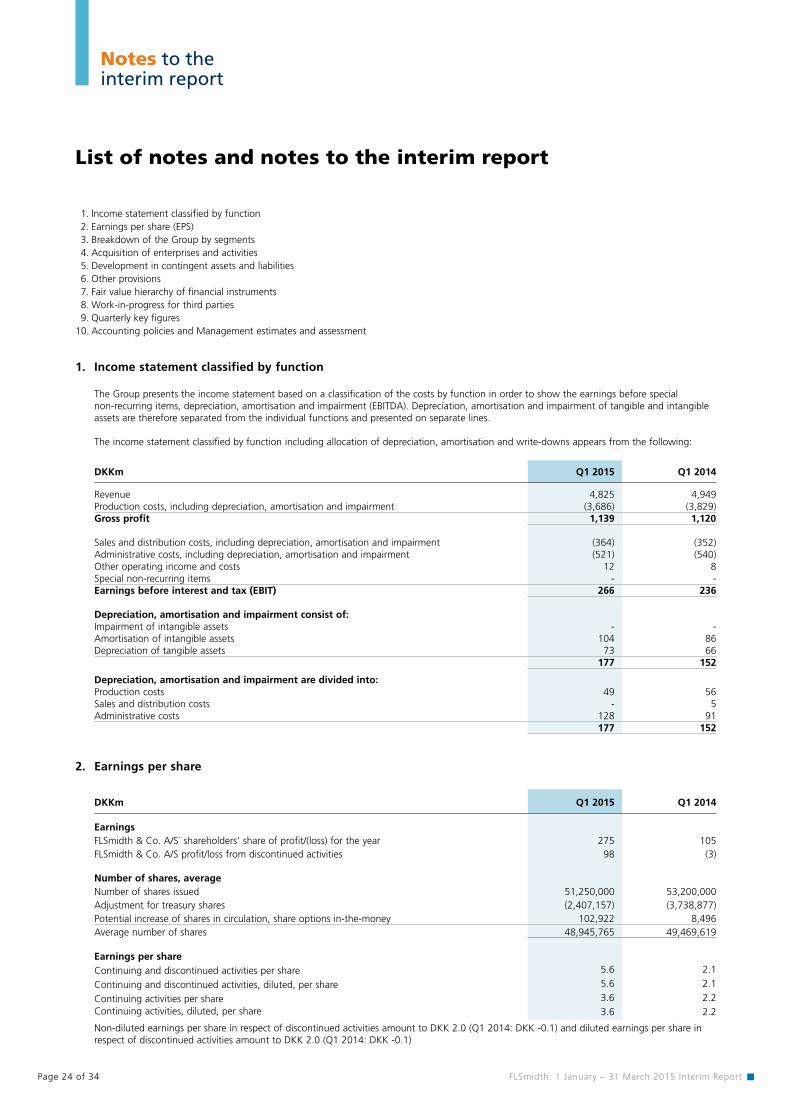
1. Income statement classified by function
The Group presents the income statement based on a classification of the costs by function in order to show the earnings before special non-recurring items, depreciation, amortisation and impairment (EBITDA). Depreciation, amortisation and impairment of tangible and intangible assets are therefore separated from the individual functions and presented on separate lines.
The income statement classified by function including allocation of depreciation, amortisation and write-downs appears from the following:
DKKm Q1 2015 Q1 2014
Revenue 4,825 4,949Production costs, including depreciation, amortisation and impairment (3,686) (3,829)Gross profit 1,139 1,120
Sales and distribution costs, including depreciation, amortisation and impairment (364) (352)Administrative costs, including depreciation, amortisation and impairment (521) (540)Other operating income and costs 12 8Special non-recurring items - -Earnings before interest and tax (EBIT) 266 236
Depreciation, amortisation and impairment consist of:Impairment of intangible assets - -Amortisation of intangible assets 104 86Depreciation of tangible assets 73 66
177 152
Depreciation, amortisation and impairment are divided into:Production costs 49 56Sales and distribution costs - 5Administrative costs 128 91
177 152
2. Earnings per share
DKKm Q1 2015 Q1 2014
EarningsFLSmidth & Co. A/S´ shareholders’ share of profit/(loss) for the year 275 105FLSmidth & Co. A/S profit/loss from discontinued activities 98 (3)
Number of shares, averageNumber of shares issued 51,250,000 53,200,000 Adjustment for treasury shares (2,407,157) (3,738,877)Potential increase of shares in circulation, share options in-the-money 102,922 8,496Average number of shares 48,945,765 49,469,619
Earnings per shareContinuing and discontinued activities per share 5.6 2.1
Continuing and discontinued activities, diluted, per share 5.6 2.1
Continuing activities per share 3.6 2.2 Continuing activities, diluted, per share 3.6 2.2
Non-diluted earnings per share in respect of discontinued activities amount to DKK 2.0 (Q1 2014: DKK -0.1) and diluted earnings per share in respect of discontinued activities amount to DKK 2.0 (Q1 2014: DKK -0.1)
List of notes and notes to the interim report
1. Income statement classified by function 2. Earnings per share (EPS) 3. Breakdown of the Group by segments 4. Acquisition of enterprises and activities 5. Development in contingent assets and liabilities 6. Other provisions 7. Fair value hierarchy of financial instruments 8. Work-in-progress for third parties 9. Quarterly key figures10. Accounting policies and Management estimates and assessment

FLSmidth: 1 January – 31 March 2015 Interim Report Page 25 of 34
3. Breakdown of the Group by segments for 2015
Q1 2015
DKKm CustomerServices
Product Companies
Minerals Cement Other companies
etc.1)
Continuingactivities
Discon-tinued
activities
FLSmidth Group
INCOME STATEMENTExternal revenue 1,867 1,182 940 836 - 4,825 99 4,924 Internal revenue 11 193 6 - (210) - - - Revenue 1,878 1,375 946 836 (210) 4,825 99 4,924 Production costs (1,394) (956) (803) (694) 210 (3,637) (78) (3,715)Gross profit 484 419 143 142 - 1,188 21 1,209 Sales, distr. and admin. costs and other operating items (275) (199) (180) (97) 6 (745) (23) (768)Earnings before special non- recurring items, depreciation, amortisation and impairment (EBITDA) 209 220 (37) 45 6 443 (2) 441 Special non-recurring items - - - - - - 107 107 Depreciation and impairment of tangible assets (27) (22) (15) (6) (3) (73) (4) (77)Earnings before amortisation and impairment of intangible assets (EBITA) 182 198 (52) 39 3 370 101 471 Amortisation and impairment of intangible assets (39) (18) (39) (8) - (104) - (104)Earnings before interest and tax (EBIT) 143 180 (91) 31 3 266 101 367
ORDER INTAKE (GROSS) 1,789 1,580 1,074 431 (197) 4,677 - 4,677 ORDER BACKLOG 6,042 3,074 6,123 4,398 (685) 18,952 - 18,952
FINANCIAL RATIOSGross margin 25.8% 30.5% 15.0% 17.0% N/A 24.6% N/A 24.6%EBITDA margin 11.1% 16.0% -4.0% 5.4% N/A 9.2% N/A 9.0%EBITA margin 9.7% 14.4% -5.5% 4.7% N/A 7.7% N/A 9.6%EBIT margin 7.6% 13.1% -9.6% 3.6% N/A 5.5% N/A 7.5%Number of employees at 31 March 6,662 3,370 2,344 1,332 0 13,708 2 13,710
DKKm Q1 2015
Reconciliation of the profit/(loss) for the period before tax, continuing activities Segment earnings before tax of reportable segments 266 Financial income 770Financial costs (784) Earnings before tax (EBT), continuing activities 252
1) Other companies etc. consist of companies with no activity, real estate companies, eliminations and the parent company.
Notes to the interim report

FLSmidth: 1 January – 31 March 2015 Interim Report Page 26 of 34
3. Breakdown of the Group by segments for 2014
Q1 2014
DKKm CustomerServices
Product Companies
Minerals Cement Other companies
etc.1)
Continuingactivities
Discon-tinued
activities
FLSmidth Group
INCOME STATEMENTExternal revenue 1,694 1,154 1,375 726 - 4,949 350 5,299 Internal revenue 31 202 12 - (245) - - - Revenue 1,725 1,356 1,387 726 (245) 4,949 350 5,299 Production costs (1,221) (969) (1,217) (608) 242 (3,773) (251) (4,024)Gross profit 504 387 170 118 (3) 1,176 99 1,275 Sales, distr. and admin. costs and other operating items (245) (237) (206) (95) (5) (788) (80) (868)Earnings before special non- recurring items, depreciation, amortisation and impairment (EBITDA) 259 150 (36) 23 (8) 388 19 407 Special non-recurring items - - - - - - - - Depreciation and impairment of tangible assets (23) (22) (15) (4) (2) (66) (14) (80)Earnings before amortisation and impairment of intangible assets (EBITA) 236 128 (51) 19 (10) 322 5 327 Amortisation and impairment of intangible assets (30) (19) (32) (5) - (86) (2) (88)Earnings before interest and tax (EBIT) 206 109 (83) 14 (10) 236 3 239
ORDER INTAKE (GROSS) 2,016 1,516 858 702 (251) 4,841 - 4,841 ORDER BACKLOG 7,990 3,174 6,765 4,957 (734) 22,152 - 22,152
FINANCIAL RATIOSGross margin 29.2% 28.5% 12.3% 16.2% N/A 23.8% N/A 24.1%EBITDA margin 15.0% 11.0% -2.6% 3.2% N/A 7.8% N/A 7.7%EBITA margin 13.7% 9.5% -3.7% 2.5% N/A 6.5% N/A 6.2%EBIT margin 11.9% 8.0% -6.0% 1.9% N/A 4.8% N/A 4.5%Number of employees at 31 March 5,955 3,600 2,994 1,432 5 13,986 1,059 15,045
DKKm Q1 2014
Reconciliation of the profit/(loss) for the period before tax, continuing activitiesSegment earnings before tax of reportable segments 236 Financial income 277 Financial costs (339)Earnings before tax (EBT), continuing activities 174
1) Other companies etc. consist of companies with no activity, real estate companies, eliminations and the parent company.
Notes to the interim report

FLSmidth: 1 January – 31 March 2015 Interim Report Page 27 of 34
Notes to the interim report
5. Disposal of enterprises and activities
Accounting policy On disposal of enterprises and activities the difference between the selling price and the carrying amount of the net assets at the date of dispos-al including remaining goodwill less expected costs of disposals is recognised in the income statement among special non-recurring items. If the final consideration is dependent on future events (contingent consideration), it is stated at fair value at the time of sale, and classified as financial assets and adjusted directly in the income statement.
Enterprises and activities sold are included in the consolidated financial statements until the date of disposal.
DKKm Q1 2015 Q1 2014 End of 2014
Intangible assets 57 - -Tangible assets 610 - 13Inventories 283 - 5Work-in-progress for third parties - - 12Other assets 352 - 28Cash and cash equivalents 82 - 4Liabilities (1,035) - (34)Carrying amount of net assets disposed 349 - 28Net interest bearing debt 455 - -Enterprise value 804 - 28
Selling price 1,037 - 20Enterprise value (804) - (28)Transaction costs (125) - -Profit/loss on disposal of enterprises and activities 108 - (8)
Cash received 912 - 20Deferred payment 125 - -Total selling price 1,037 - 20Deferred payment (125) - -Cash and cash equivalents disposed of, see above (82) - (4)Net cash effect 830 - 16
As announced on 12 January 2015, FLSmidth has signed an agreement with a company in the Solix Group AB to sell all shares in Cembrit Holding A/S.
The price of the shares has end of January been adjusted to DKK 1,037m, as a consequence of purchase price adjustments. The sale of Cembrit was closed on 30 January 2015.
The final balance sheet adjustment will be determined and settled within 12 months of the closing date.
6. Other provisions
DKKm Q1 2015 Q1 2014 End of 2014
Provisions at 1 January 1,598 2,109 2,109Transfer to assets held for sale - - (196)Exchange rate and other adjustments 88 9 67Disposal of Group enterprises - - (9)Provision for the year 283 133 783Used during the period (137) (158) (686)Reversals (32) (56) (438)Discounting of provisions - - 1Reclassification to/from other liabilities (1) - (33)Provisions at 31 March 1,799 2,037 1,598 The maturity of provisions is specified as follows:Short-term liabilities 1,168 1,322 1,047Long-term liabilities 631 715 551
1,799 2,037 1,598
4. Acquisition of enterprises and activities
There have been no acquisitions of enterprises and activities in Q1 2015 or Q1 2014.

FLSmidth: 1 January – 31 March 2015 Interim Report Page 28 of 34
7. Fair value hierarchy of financial instruments
The table below shows the classification of financial instruments that are measured at fair value, specified in accordance with the fair value hierarchy:- Quoted prices in an active market for the same type of instrument (level 1)- Quoted prices in an active market for similar assets or liabilities or other valuation methods, where all significant inputs are based on observable
market data (level 2)- Valuation methods where any significant inputs are not based on observable market data (level 3)
DKKm Q1 2015
Quoted prices
Level 1
Observable input
Level 2
Non-observableinput
Level 3
Total
Financial assetsFinancial assets available for sale:Other securities and investments 67 25 92
Financial assets measured at fair value through the income statement:Bonds and listed shares 1 1Derivative financial instruments used to hedge the fair value of recognised assets and liabilities and future cash flow 172 172Total financial assets 68 197 0 265Financial liabilitiesFinancial liabilities measured at fair value through the income statement:Derivative financial instruments used to hedge the fair value of recognised assets and liabilities and future cash flow 434 434Contingent consideration in a business combination 0 0Total financial liabilities 0 434 0 434
Notes to the interim report
DKKm Q1 2014
Quoted prices
Level 1
Observable input
Level 2
Non-observableinput
Level 3
Total
Financial assetsFinancial assets available for sale:Other securities and investments 35 24 59
Financial assets measured at fair value through the income statement:Bonds and listed shares 10 10Derivative financial instruments used to hedge the fair value of recognised assets and liabilities and future cash flow 101 101Total financial assets 45 125 0 170Financial liabilitiesFinancial liabilities measured at fair value through the income statement:Derivative financial instruments used to hedge the fair value of recognised assets and liabilities and future cash flow 230 230Contingent consideration in a business combination 100 100Total financial liabilities 0 230 100 330
There have been no significant transfers between level 1 and level 2 in 2015.
FLSmidth: 1 January – 31 March 2015 Interim Report Page 29 of 34
Notes to the interim report
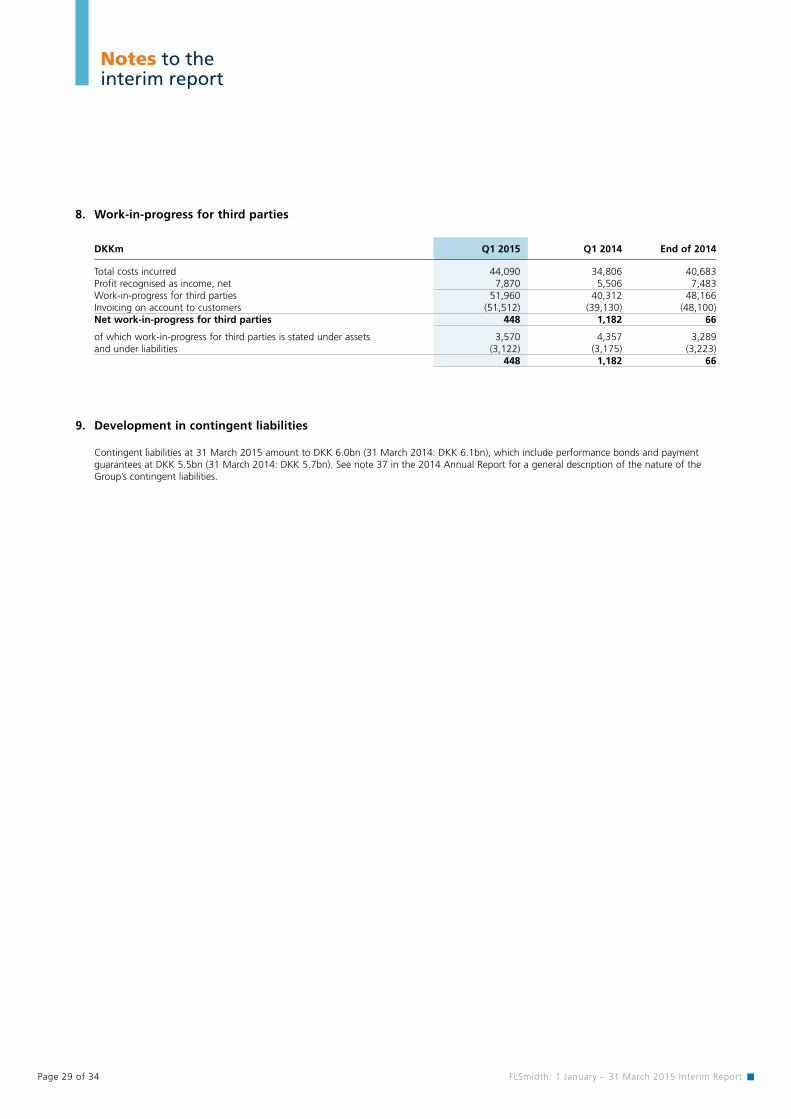
8. Work-in-progress for third parties
DKKm Q1 2015 Q1 2014 End of 2014
Total costs incurred 44,090 34,806 40,683Profit recognised as income, net 7,870 5,506 7,483Work-in-progress for third parties 51,960 40,312 48,166Invoicing on account to customers (51,512) (39,130) (48,100)Net work-in-progress for third parties 448 1,182 66
of which work-in-progress for third parties is stated under assets 3,570 4,357 3,289and under liabilities (3,122) (3,175) (3,223)
448 1,182 66
9. Development in contingent liabilities
Contingent liabilities at 31 March 2015 amount to DKK 6.0bn (31 March 2014: DKK 6.1bn), which include performance bonds and payment guarantees at DKK 5.5bn (31 March 2014: DKK 5.7bn). See note 37 in the 2014 Annual Report for a general description of the nature of the Group’s contingent liabilities.
FLSmidth: 1 January – 31 March 2015 Interim Report Page 30 of 34
Notes to the interim report
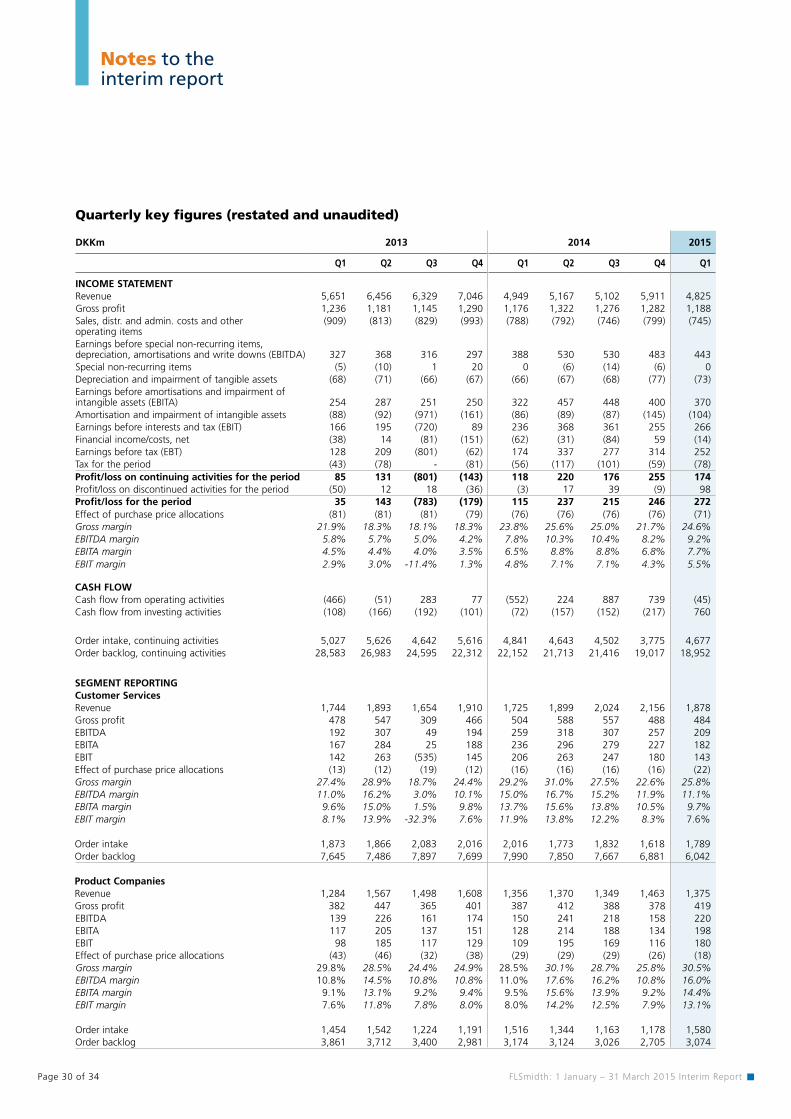
Quarterly key figures (restated and unaudited)
DKKm 2013 2014 2015
Q1 Q2 Q3 Q4 Q1 Q2 Q3 Q4 Q1
INCOME STATEMENTRevenue 5,651 6,456 6,329 7,046 4,949 5,167 5,102 5,911 4,825Gross profit 1,236 1,181 1,145 1,290 1,176 1,322 1,276 1,282 1,188Sales, distr. and admin. costs and other operating items
(909) (813) (829) (993) (788) (792) (746) (799) (745)
Earnings before special non-recurring items, depreciation, amortisations and write downs (EBITDA) 327 368 316 297 388 530 530 483 443Special non-recurring items (5) (10) 1 20 0 (6) (14) (6) 0Depreciation and impairment of tangible assets (68) (71) (66) (67) (66) (67) (68) (77) (73)Earnings before amortisations and impairment of intangible assets (EBITA) 254 287 251 250 322 457 448 400 370Amortisation and impairment of intangible assets (88) (92) (971) (161) (86) (89) (87) (145) (104)Earnings before interests and tax (EBIT) 166 195 (720) 89 236 368 361 255 266Financial income/costs, net (38) 14 (81) (151) (62) (31) (84) 59 (14)Earnings before tax (EBT) 128 209 (801) (62) 174 337 277 314 252Tax for the period (43) (78) - (81) (56) (117) (101) (59) (78)Profit/loss on continuing activities for the period 85 131 (801) (143) 118 220 176 255 174Profit/loss on discontinued activities for the period (50) 12 18 (36) (3) 17 39 (9) 98 Profit/loss for the period 35 143 (783) (179) 115 237 215 246 272Effect of purchase price allocations (81) (81) (81) (79) (76) (76) (76) (76) (71)Gross margin 21.9% 18.3% 18.1% 18.3% 23.8% 25.6% 25.0% 21.7% 24.6%EBITDA margin 5.8% 5.7% 5.0% 4.2% 7.8% 10.3% 10.4% 8.2% 9.2%EBITA margin 4.5% 4.4% 4.0% 3.5% 6.5% 8.8% 8.8% 6.8% 7.7%EBIT margin 2.9% 3.0% -11.4% 1.3% 4.8% 7.1% 7.1% 4.3% 5.5%
CASH FLOWCash flow from operating activities (466) (51) 283 77 (552) 224 887 739 (45)Cash flow from investing activities (108) (166) (192) (101) (72) (157) (152) (217) 760
Order intake, continuing activities 5,027 5,626 4,642 5,616 4,841 4,643 4,502 3,775 4,677Order backlog, continuing activities 28,583 26,983 24,595 22,312 22,152 21,713 21,416 19,017 18,952
SEGMENT REPORTINGCustomer ServicesRevenue 1,744 1,893 1,654 1,910 1,725 1,899 2,024 2,156 1,878 Gross profit 478 547 309 466 504 588 557 488 484 EBITDA 192 307 49 194 259 318 307 257 209 EBITA 167 284 25 188 236 296 279 227 182 EBIT 142 263 (535) 145 206 263 247 180 143Effect of purchase price allocations (13) (12) (19) (12) (16) (16) (16) (16) (22)Gross margin 27.4% 28.9% 18.7% 24.4% 29.2% 31.0% 27.5% 22.6% 25.8%EBITDA margin 11.0% 16.2% 3.0% 10.1% 15.0% 16.7% 15.2% 11.9% 11.1%EBITA margin 9.6% 15.0% 1.5% 9.8% 13.7% 15.6% 13.8% 10.5% 9.7%EBIT margin 8.1% 13.9% -32.3% 7.6% 11.9% 13.8% 12.2% 8.3% 7.6%
Order intake 1,873 1,866 2,083 2,016 2,016 1,773 1,832 1,618 1,789Order backlog 7,645 7,486 7,897 7,699 7,990 7,850 7,667 6,881 6,042
Product CompaniesRevenue 1,284 1,567 1,498 1,608 1,356 1,370 1,349 1,463 1,375 Gross profit 382 447 365 401 387 412 388 378 419 EBITDA 139 226 161 174 150 241 218 158 220 EBITA 117 205 137 151 128 214 188 134 198 EBIT 98 185 117 129 109 195 169 116 180 Effect of purchase price allocations (43) (46) (32) (38) (29) (29) (29) (26) (18)Gross margin 29.8% 28.5% 24.4% 24.9% 28.5% 30.1% 28.7% 25.8% 30.5%EBITDA margin 10.8% 14.5% 10.8% 10.8% 11.0% 17.6% 16.2% 10.8% 16.0%EBITA margin 9.1% 13.1% 9.2% 9.4% 9.5% 15.6% 13.9% 9.2% 14.4%EBIT margin 7.6% 11.8% 7.8% 8.0% 8.0% 14.2% 12.5% 7.9% 13.1%
Order intake 1,454 1,542 1,224 1,191 1,516 1,344 1,163 1,178 1,580Order backlog 3,861 3,712 3,400 2,981 3,174 3,124 3,026 2,705 3,074

FLSmidth: 1 January – 31 March 2015 Interim Report Page 31 of 34
Notes to the interim report
Quarterly key figures (restated and unaudited)
DKKm 2013 2014 2015
Q1 Q2 Q3 Q4 Q1 Q2 Q3 Q4 Q1
Minerals
Revenue 2,096 2,210 2,286 2,594 1,387 1,242 1,217 1,683 946 Gross profit 265 32 379 425 170 206 220 241 143 EBITDA (14) (226) 93 42 (36) (54) (22) 24 (37)EBITA (30) (254) 79 27 (51) (71) (39) 2 (52)EBIT (73) (301) (306) (56) (83) (103) (72) (65) (91)Effect of purchase price allocations (43) (46) (32) (38) (29) (29) (29) (26) (29)Gross margin 12.6% 1.4% 16.6% 16.4% 12.3% 16.6% 18.1% 14.3% 15.0%EBITDA margin -0.6% -10.2% 4.1% 1.6% -2.6% -4.3% -1.8% 1.4% -4.0%EBITA margin -1.4% -11.5% 3.5% 1.0% -3.7% -5.7% -3.2% 0.1% -5.5%EBIT margin -3.5% -13.6% -13.4% -2.2% -6.0% -8.3% -5.9% -3.9% -9.6%
Order intake 1,790 1,463 1,195 1,783 858 1,077 1,024 626 1,074Order backlog 11,324 10,078 8,698 7,349 6,765 6,707 6,650 5,570 6,123
CementRevenue 820 1,098 1,207 1,272 726 880 750 894 836 Gross profit 121 155 97 18 118 114 111 176 142 EBITDA 11 49 12 (86) 23 22 33 37 45 EBITA 6 44 6 (91) 19 17 28 31 39 EBIT 6 39 1 (103) 14 12 24 19 31 Effect of purchase price allocations - (2) (2) (2) (2) (2) (2) (5) (2)Gross margin 14.8% 14.1% 8.0% 1.4% 16.2% 13.0% 14.8% 19.7% 17.0%EBITDA margin 1.4% 4.4% 1.0% -6.7% 3.2% 2.4% 4.4% 4.1% 5.4%EBITA margin 0.7% 4.0% 0.5% -7.1% 2.5% 1.9% 3.8% 3.5% 4.7%EBIT margin 0.7% 3.5% 0.1% -8.1% 1.9% 1.4% 3.2% 2.1% 3.6%
Order intake 135 1,087 410 954 702 677 704 547 431Order backlog 6,413 6,437 5,275 4,990 4,957 4,771 4,820 4,546 4,398
Calculation of margins are based on non-rounded figures.

FLSmidth: 1 January – 31 March 2015 Interim Report Page 32 of 34
Notes to the interim report
Accounting policies and Management estimates and assessmentsThe interim report of the Group for the first quarter of 2015 is presented in accordance with IAS 34, Presentation of financial statements, as approved by the EU and additional Danish disclosure requirements regarding interim reporting by listed companies as fixed by NASDAQ OMX Copenhagen (”OMX”).
Apart from the below mentioned changes, the accounting policies are unchanged from those adopted in the 2014 Annual Report. Reference is made to note 49, Accounting policy, in page 128 and to specific notes in the 2014 Annual Report for further details.
Effective 1 January 2015, the Group has implemented the changes to standard IAS 19. The changes does not have any material impact on the financial reporting.
As a consequence of Cembrit being sold 30 January 2015, Cembrit is reported as discontinued activity. Profit and loss comparative figures for 2014 have been adjusted accordingly.
As announced on 13 August 2014, FLSmidth has implemented a new structure 1 January 2015. The Material Handling and Mineral Processing divisions are merged into a Minerals division. Cement and Customer Services are maintained as separate divisions. A new Product Companies division is created. As a consequence of the new structure, the comparative figures for 2014 have been restated accordingly.
Management estimates and assessmentsWhen preparing the interim report in accordance with the Group’s accounting policies, it is necessary that Management makes estimates and lays down assumptions that affect the recognised assets and liabilities, including the disclosures made regarding contingent assets and liabilities.
Management bases its estimates on historical experience and other assumptions considered relevant at the time in question. These estimates and assumptions form the basis of the recognised carrying amounts of assets and liabilities and the derived effects on the income statement.
The actual results may deviate over time. Reference is made to note 48, page 128 and to specific notes in the 2014 Annual Report for further information about the items primarily affected by Management estimates and assessments in connection with the presentation of the consolidated financial statements.

FLSmidth: 1 January – 31 March 2015 Interim Report Page 33 of 34

Page 34 of 34 FLSmidth: 1 January – 31 March 2015 Interim Report
FLSmidth & Co. A/SVigerslev Allé 77
DK-2500 Valby
Denmark
Tel.: +45 36 18 18 00
Fax: +45 36 44 11 46
www.flsmidth.com
CVR No. 58180912