Comparing Machine Learning Performances 100108 9 th Protein Folding Winter School Group Project 6 조 조조조 , 조조조 , 조조조

Welcome message from author
This document is posted to help you gain knowledge. Please leave a comment to let me know what you think about it! Share it to your friends and learn new things together.
Transcript
Comparing Machine Learning Performances
100108
9th Protein Folding Winter School
Group Project
6 조 윤형식 , 신웅희 , 최정현
Page 2
Unlike former winter schools, many machine learning techniques are introduced this year.– Eg. Protein secondary structure prediction using neural net.
However, it is hard to study machine learning except for reading books and journals.
In this project, we practice several algorithms and compare the results.
Introduction

Page 3
Machine Learning Techniques
4 techniques are used.– Decision Tree (DT).
– Random Forest (RF).
– Logistic Regression (LR).
– Neural Network (NN).

Page 4
Decision Tree
Builds a set of classification rules.All datum are split into smaller and smaller samples by
choosing a variables and the corresponding threshold value to divide the sample.
If the value of the data is satisfy the condition then it is assigned to one branch and if not then it is assigned to the other branch.

Page 5
Random Forest
Extension of decision tree.– Build many trees by using randomly selected variables, not all
input attributes.
Predictions are made by averaging multiple trees. In this work, 10 trees are made using 4 randomly selected
attributes.
Page 6
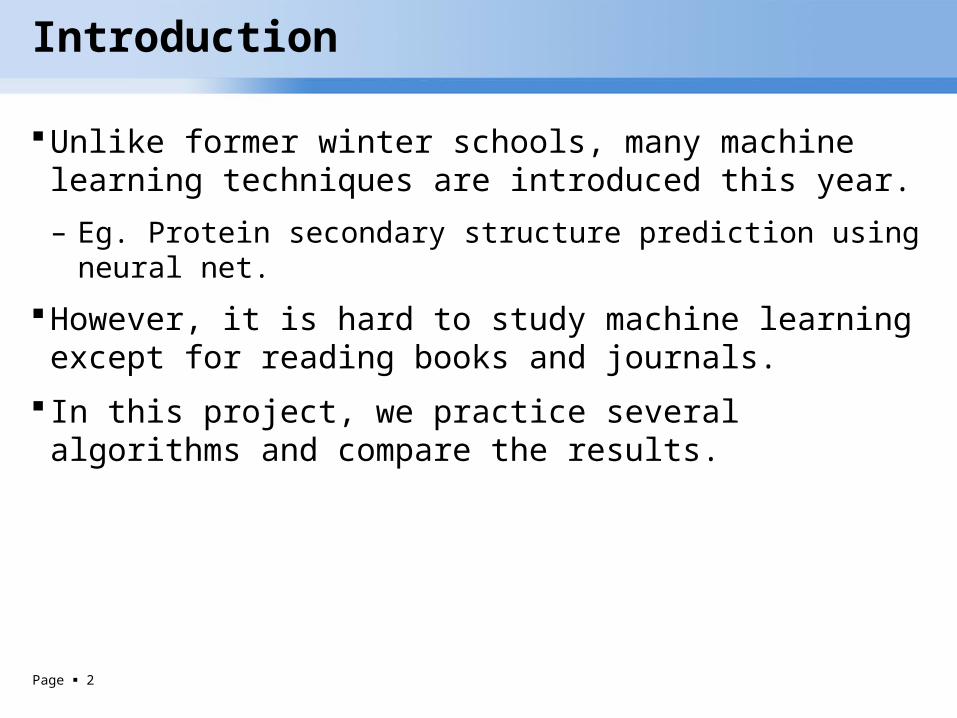
Logistic Regression
– xi: Input attribute.
– αi: Weights for each attribute.
For binary classification, optimize {αi} to predict positive if f(z) > 0.5.

Page 7
Neural Network
Resemble the network of brain. Information flows unidirectional; Input layer → Output layer.Hidden node receives data from previous layer and calculate
f(z), the activation function, like logistic regression. If f(z) is higher than some threshold, the node gives
information to next nodes.Finally output layer receives the information, it calculate g(z),
and determine the outputs.
Page 8
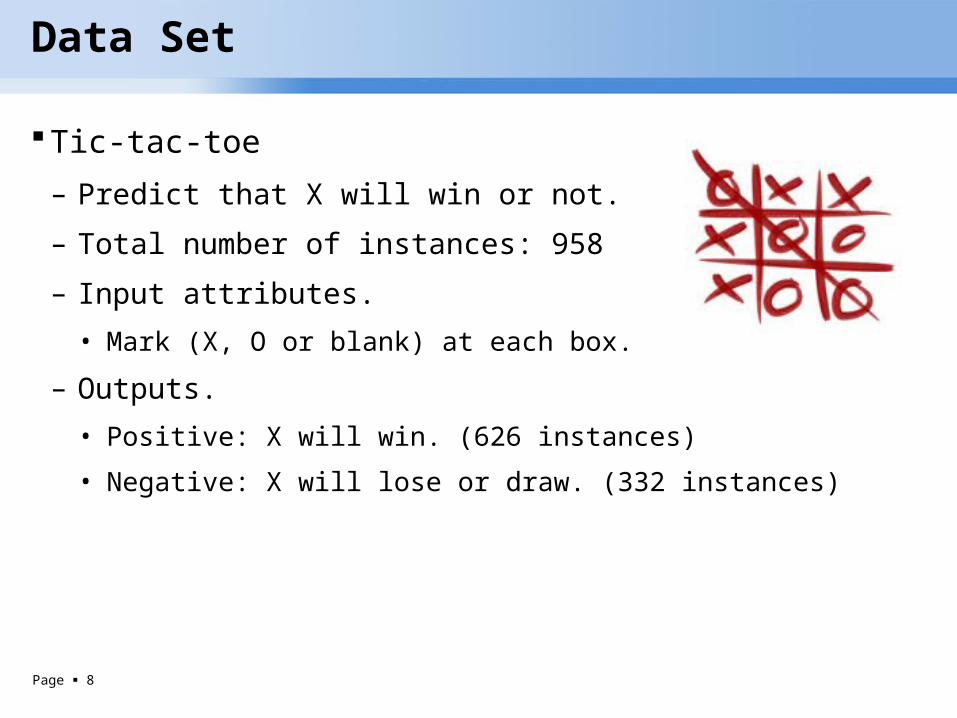
Data Set
Tic-tac-toe– Predict that X will win or not.
– Total number of instances: 958
– Input attributes.• Mark (X, O or blank) at each box.
– Outputs.• Positive: X will win. (626 instances)
• Negative: X will lose or draw. (332 instances)

Page 9
Data Set
Yeast.– Predict where the protein to be located in the cell.
– Total number of instances: 1298
– Input attributes• 8 properties.
– Output• Location of protein.
• CYT: cytosolic (463 instances)
• NUC: nucleus (429 instances)
• MEM: membrane (163 instances)
• MIT: mitochondria (244 instances)

Page 10
Method
Data set preparation.– Two sets are downloaded from archive.ics.uci.edu/ml/index.html.
Machine learning.– All works are done by Weka 3.4.15 which is downloadable at
http://www.cs.waikato.ac.nz/ml/weka/
– Using default option, 10-fold cross-validation are done.

Page 11
Result
Tic-tac-toe.Method Correctly predicted Incorrectly predicted
DT 85.1% 14.9%
RF 91.3% 8.7%
LR 98.3% 1.7%
NN 96.7% 3.3%
DT W D/LW 562 64
D/L 79 253
RF W D/LW 611 15
D/L 68 264
NN W D/LW 609 17
D/L 15 317
LR W D/LW 626 0
D/L 16 316
←Predicted
↑ Real case
Page 12
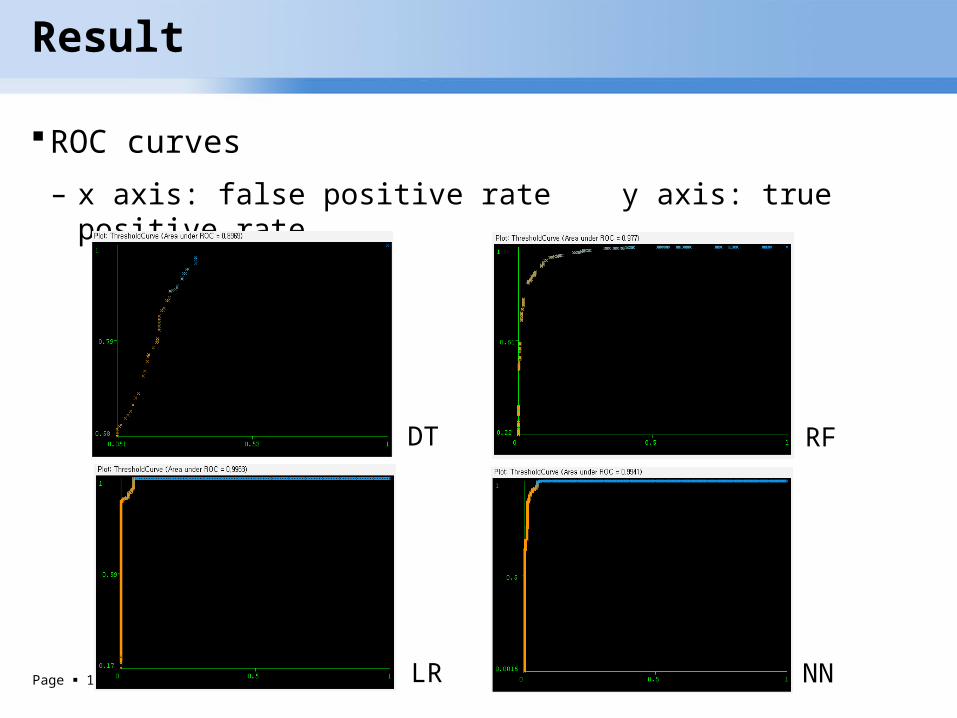
Result
ROC curves– x axis: false positive rate y axis: true positive rate
DT RF
NNLR

Page 13
Result
Yeast set.
Method Correctly predicted Incorrectly predictedDT 56.9% 43.1%
RF 63.4% 36.6%
LR 62.5% 37.5%
NN 61.0% 39.0%
Page 14
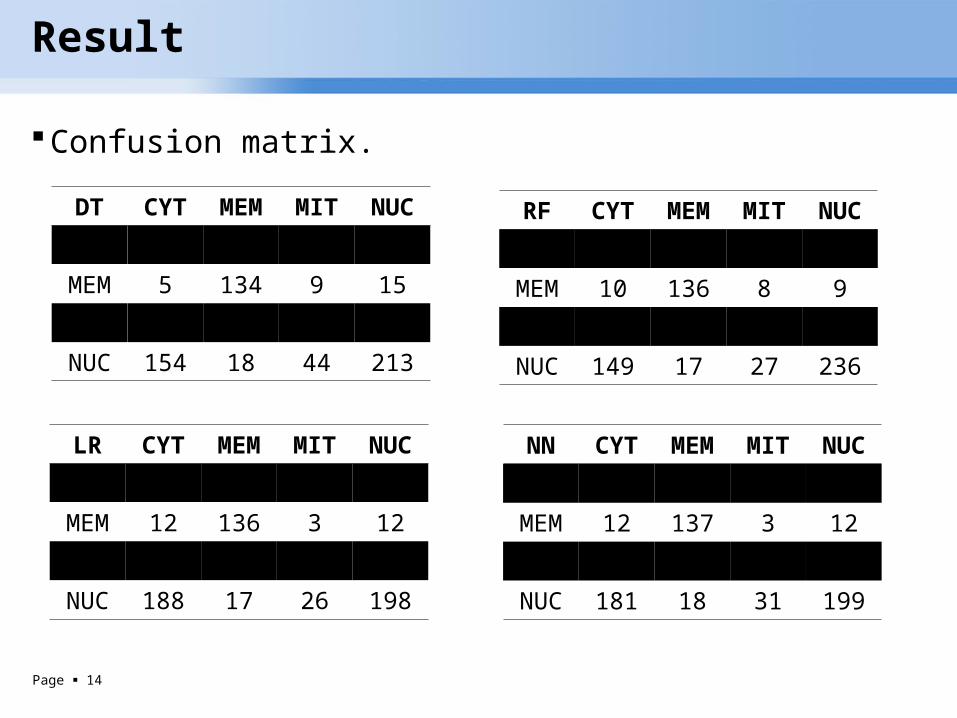
Result
Confusion matrix.
DT CYT MEM MIT NUCCYT 257 7 61 138
MEM 5 134 9 15
MIT 63 14 135 32
NUC 154 18 44 213
RF CYT MEM MIT NUCCYT 312 10 37 104
MEM 10 136 8 9
MIT 72 12 140 10
NUC 149 17 27 236
NN CYT MEM MIT NUCCYT 314 4 36 109
MEM 12 137 3 12
MIT 70 11 142 21
NUC 181 18 31 199
LR CYT MEM MIT NUCCYT 324 2 46 91
MEM 12 136 3 12
MIT 71 8 154 11
NUC 188 17 26 198
Page 15
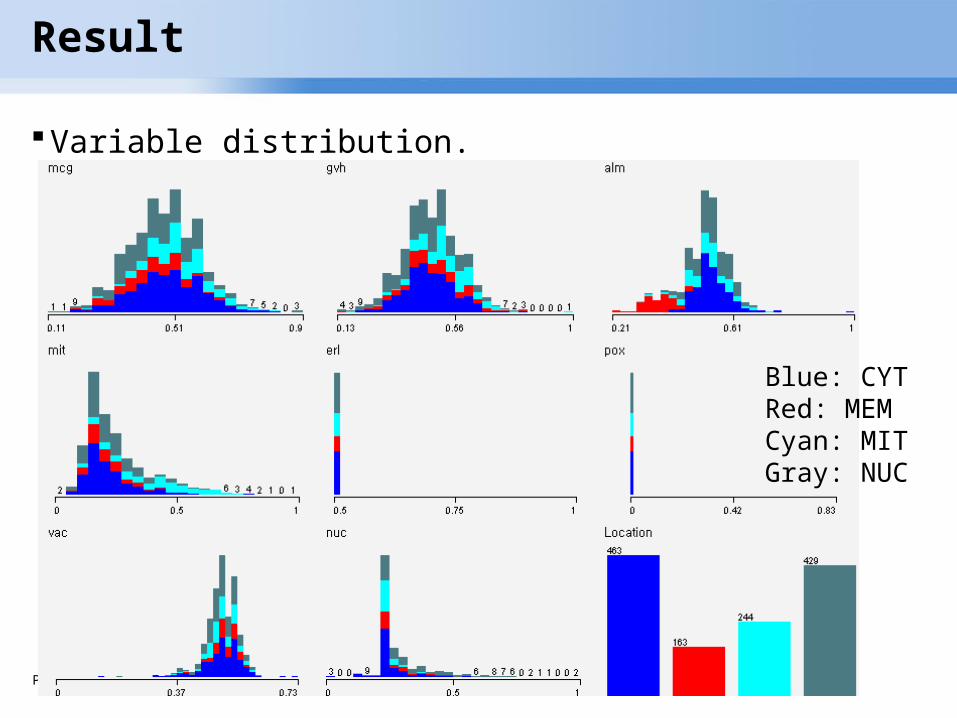
Result
Variable distribution.
Blue: CYTRed: MEMCyan: MITGray: NUC

Page 16
Conclusion
Tic-tac-toe set.– Easier to classify.
– LR > NN > RF > DT.
– Overall correctly predicted rate is 92.9%, at least that of DT is 85.1%.
Yeast set.– Harder than tic-tac-toe set.
– RF > LR > NN > DT.
– Classification between CYT and NUC is poor because of their distribution pattern.
Related Documents