1 ABSTRACT In this project, titled “COMPARATIVE ANALYSIS AND STUDY OF GMR GROUPS CREDIT RATING”. This aims to analyse the credit worthiness of the GMR Infrastructure ltd among the key competitors of the company using the credit rating methodology This study based on financial statements such as Ratio Analysis, Comparative balance sheet with the competitors in the same industry and business process analysis like swot analysis. By using these combined tools it enables to determine in an effective manner. The study is made to evaluate the financial position, the operational results as well as financial progress of a business concern. This study explains ways in which ratio analysis can be of assistance in long-range planning, budgeting and asset management to strengthen financial performance and help avoid financial difficulties. This study makes us to study the credit rating methodology and also about the credit rating agencies in India and finally gives the credit worthiness of the company The study not only throws on the financial position of a firm but also serves as a Stepping stone to remedial measures for GMR Infrastructure ltd. This project helps to identify and give suggestion to improve some of the concerned area of businesses in “GMR Infrastructure ltd”

64137897 Comparative Analysis Credit Rating
Dec 01, 2015
a report on comparative analysis of credit rating
Welcome message from author
This document is posted to help you gain knowledge. Please leave a comment to let me know what you think about it! Share it to your friends and learn new things together.
Transcript

1
ABSTRACT
In this project, titled “COMPARATIVE ANALYSIS AND STUDY OF GMR
GROUPS CREDIT RATING”. This aims to analyse the credit worthiness of the GMR
Infrastructure ltd among the key competitors of the company using the credit rating methodology
This study based on financial statements such as Ratio Analysis, Comparative balance
sheet with the competitors in the same industry and business process analysis like swot analysis.
By using these combined tools it enables to determine in an effective manner.
The study is made to evaluate the financial position, the operational results as well as
financial progress of a business concern.
This study explains ways in which ratio analysis can be of assistance in long-range
planning, budgeting and asset management to strengthen financial performance and help avoid
financial difficulties.
This study makes us to study the credit rating methodology and also about the credit
rating agencies in India and finally gives the credit worthiness of the company
The study not only throws on the financial position of a firm but also serves as a
Stepping stone to remedial measures for GMR Infrastructure ltd.
This project helps to identify and give suggestion to improve some of the concerned area
of businesses in “GMR Infrastructure ltd”

2
LIST OF TABLES
TABLE NO NAME OF TABLE PAGE NO 5.1 CRISIL fixed deposit rating symbols 5.2 CRISIL rating symbols for short term instruments 5.3 ICRA rating symbols for long-term debentures,
bonds and preference shares 5.4 ICRA fixed deposit rating symbols 5.5 CARE rating symbols for long-term instruments 5.6 CARE short-term investment symbols 5.7 CARE analysis rating 5.8 Rating methodology for infrastructure industries 5.9 ICRA credit rating methodology 6.1 Comparative balance sheet 6.2 Comparative profit and loss account 6.3 Comparative cash flow statements 6.4 Ratio analysis 6.5 Key parameters of rating 6.6 Rank based on the parameters 6.7 Final ranking 6.8 Sectors involved in infrastructure companies 6.9 Power sector projects involved 6.10 Roads sector projects involved 6.11 Ratings assigned by the agencies 6.12 Care ratings 6.13 Ratings explanation 6.14 Swot analysis for GMR 6.15 Swot analysis for LANCO 6.16 Swot analysis for GVK 6.17 Swot analysis for JPASSOCIAT 6.18 Comparison b/w GMR and JPASSOCIAT 6.19 Comparison b/w GMR and LANCO 6.20 Comparison b/w GMR and GVK

3
LIST OF CHARTS
CHART NO NAME OF CHART PAGE NO
2.1 Organizational chart of GMR
3.1 Process of ratio analysis 3.2 CARE’s rating process 3.3 ICRA’s rating process 3.4 CRISIL’s rating process 6.1 EBITDA margin ratio 6.2 Return on equity 6.3 Price to earnings ratio 6.4 Debt to equity ratio 6.5 Return on capital employed 6.6 Price to book value 6.7 EV/EBITDA 6.8 Cash profit margin 6.9 Operating cash flow ratio 6.10 Current ratio 6.11 Cash ratio 6.12 Asset efficiency ratio 6.13 Operating cash margin 6.14 Operating profit margin 6.15 Basic earning power ratio

4
CHAPTER-1
INTRODUCTION TO THE STUDY
1.1 INTRODUCTION:
The removal of strict regulatory framework in recent years has led to a spurt in the
number of companies borrowing directly from the capital markets. There have been several
instances in the recent past where the “fly-by-night” operators have cheated unwary investors. In
such a situation, it has become increasingly difficult for an ordinary investor to distinguish
between 'safe and good investment opportunities' and 'unsafe and bad investments'. Investors find
that a borrower's size or names are no longer a sufficient guarantee of timely payment of interest
and principal.
Investors perceive the need of an independent and credible agency, which judges
impartially and in a professional manner, the credit quality of different companies and assist
investors in making their investment decisions. Credit Rating Agencies, by providing a simple
system of gradation of corporate debt instruments, assist lenders to form an opinion on -the
relative capacities of the borrowers to meet their obligations. These Credit Rating Agencies, thus,
assist and form an integral part of a broader programme of financial disintermediation and
broadening the debt market.
Credit rating is used' extensively for evaluating debt instruments. These include long-
term instruments, like bonds and debentures as well as short-term obligations, like Commercial
Paper. In addition, pured deposits, certificates of deposits, inter-corporate deposits, structured
obligations including non-convertible portion of partly Convertible Debentures(PCDs) and
preferences shares are also rated.
1.2 DEFINITION OF CREDIT RATING:
5
A published ranking, based cut_down_on detailed financial analysis by a credit
beareu, of one's financial history, specifically as it relates to one's ability to meet debt obligation.
The highest rating is usually AAA, and the lowest is D. Lender use this information to decide
whether to approve a loan.
1.3 DETERMINANTS:
The default-risk assessment and quality rating assigned to an issue are primarily
determined by three factors :
i) The issuer's ability to pay,
ii) The strength of the security owner's claim on the issue, and
iii) The economic significance of the industry and market place of the issuer.
1.4 RATING METHODOLOGIES: Rating is a search for long-term fundamentals and the probabilities for changes in
the fundamentals. Each agency's rating process usually includes fundamental analysis of public
and private issuer-specific data, 'industry analysis, and presentations by the issuer's senior
executives, statistical classification models, and judgement. Typically, the rating agency is privy
to the issuer's short and long-range plans and budgets. The analytical framework followed for
rating methodology is divided into two interdependent segments.
The first segment deals with operational characteristics and the second one with
the financial characteristics. Besides, quantitative and objective factors; qualitative aspects, like
assessment of management capabilities play a very important role in arriving at the rating for an
instrument. The relative importance of qualitative and quantitative components of the analysis
varies with the type of issuer.
Rating is not based on a predetermined formula, which specifies the relevant
variables as well as weights attached to each one of them. Further, the emphasis on different
aspects varies from agency to agency. Broadly, the rating agency assures itself that there is a
6
good congruence between assets and liabilities of a company and downgrades the rating if the
quality of assets depreciates. The rating agency employs qualified professionals to ensure
consistency and reliability. Reputation of the Credit Rating Agency creates confidence in the
investor. Rating Agency earns its reputation by assessing the client's operational performance,
managerial competence, management and organizational set-up and financial structure. It should
be an independent company with its own identity. It should have no government interference.
Rating of an instrument does not give any fiduciary status to the credit rating agency. It is
desirable that the rating be done by more than one agency for the same kind of instrument. This
will attract investor's confidence in the rating symbol given.
A rating is a quality label that conveniently summarizes the default risk of an
issuer. The credibility of the issuer's, proposed payment schedule is complemented by the
credibility of the rating agency. Rating agencies perform this certification role by exploiting the
economies of scale in processing information and monitoring the issuer. There is an ongoing
debate about whether the rating agencies perform an information role in addition to a
certification role. Whether agencies have access to superior (private) information, or if agencies
are superior processors of information; security ratings provide information to investors, rather
than merely summarizing existing information. Empirical research confirms the information role
of rating agencies by demonstrating that news of actual and proposed rating changes affects the
price of issuer's securities.
Most studies document numerically larger price effects for downgrades than for
upgrades, consistent with the perceived predilection of
management for delaying bad news.
Despite variations across individual rating agencies, the following features appear to
be common in the rating methodology employed by different agencies:
• Two broad types of analyses are done:

7
(a) industry and business analysis and
(b) financial analysis
The key factors considered in industry and business analysis:
(a) Growth rate and relationship with the economy
(b) Industry risk characteristics
(c) Structure of industry and nature of competition
(d) Competitive position of the issuer
(e) Managerial capability of the issuer
The key factors considered in financial analysis:
(a)Earning power
(b)Business and financial risk
(c)Asset protection
(d)Cash flow adequacy
(e)Financial flexibility
(f)Quality of accounting
Subjective judgments seem to play an important role in the assessment of the issue/issuer on
various factors. While each factor is normally scored separately, no mechanical formula is used
for combining the scores on different factors to arrive at the ratings conclusion. In the ultimate
analysis of variables which are viewed as interdependent industry risk characteristics are likely to
set the upper limit on rating
1.4.1 Business analyses:

8
It is the academic desciplines of identifying business needs and determining
solutions to business problems. Solutions often include a systems development component, but
may also consist of process improvement, organizational change or strategic planning and policy
development. The person who carries out this task is called a business analysts or BA.
Those BAs who work solely on developing software systems may be called IT
Business Analysts, Technical Business Analysts, Online Business Analysts or Systems Analysts.
Business analysis as a discipline has a heavy overlap with requirement analysis
sometimes also called requirements engineering, but focuses on identifying the changes to an
organization that are required for it to achieve strategic goals. These changes include changes to
strategies, structures, policies, processes, and information systems.
1.4.1.1 Goal of business analysis
Ultimately, business analysis wants to achieve the following outcomes:
• Reduce waste
• Create solutions
• Complete projects on time
• Improve efficiency
• Document the right requirements
1.4.1.2 Business analysis includes:
Enterprise analysis or company analysis:
It focuses on understanding the needs of the business as a whole, its strategic
direction, and identifying initiatives that will allow a business to meet those strategic goals.
Requirements planning and management :
It involves planning the requirements development process, determining which
requirements are the highest priority for implementation, and managing change.

9
Requirements elicitation:
It describes techniques for collecting requirements from stakeholders in a project.
Requirements analysis
It describes how to develop and specify requirements in enough detail to allow them to be
successfully implemented by a project team.
Requirements communication
It describes techniques for ensuring that stakeholders have a shared understanding of the
requirements and how they will be implemented.
Solution assessment and validation
It describes how the business analyst can verify the correctness of a proposed solution,
how to support the implementation of a solution, and how to assess possible shortcomings
in the implementation.
There are a number of techniques that a Business Analyst will use when facilitating
business change. These range from workshop facilitation techniques used to elicit requirements,
to techniques for analyzing and organizing requirements.
The best technique to analyse the business is SWOT analysis.This is used to help
focus activities into areas of strength and where the greatest opportunities lie. This is used to
identify the dangers that take the form of weaknesses and both internal and external threats.
*The four attributes of SWOT are strength, weakness, opportunities and threats:.
Strength is defined as any internal asset, technology, motivation, finance, business links,
etc that can help to exploit opportunities and to fight off threats.
Weakness is an internal condition which hampers the competitive position or exploitation
of opportunities.
Opportunity is any external circumstance or characteristic which favour
the demand of the system or where the system is enjoying a competitive advantage.

10
Threat is a challenge of an unfavorable trend or of any external Circumstance which will
unfavorably influence the position of the system.
1.4.2 Financial statements Analysis:
The financial statements provide some extremely useful information to the
extent that the balance sheet mirrors the financial position on a particular date in terms of the
structure of assets, liabilities and owners’ equity, and so on and the profit and loss account shows
the results of operations during a certain period of time in terms of the revenues obtained and the
cost incurred during the year.
Thus, the financial statements provide a summarized view of the financial
position and operations of a firm. Therefore, much to be learnt about a firm from a careful
examination of its financial statements as invaluable documents performance reports. The
analysis of financial statements is thus, an important aid to financial analysis.The focus of
financial analysis is on key figures in the financial statements and the significant relationship that
exists between them. The analysis of financial statements is a process of evaluating the
relationship between component parts of financial statements to obtain a better understanding of
the firm’s position and performance.
The first task of the financial analyst is to select the information relevant to the
decision under consideration from the total information contained in the financial statements.
The second step is to arrange the information in a way to highlight significant relationships. The
final step is interpretation and drawing of inferences and conclusion. In brief, the financial
analysis is the process of selection, relation and evaluation.
The term financial analysis is also known as analysis and interpretation of financial
statements. It refers to the establishing meaningful relationship between various items of the two
financial statements i.e. Income statement and position statement. It determines financial strength
and weaknesses of the firm. Analysis of financial statements is an attempt to assess the efficiency
and performance of an enterprise. Thus, the analysis and interpretation of financial statements is
very essential to measure the efficiency, profitability, financial soundness and future prospects of
the business units.

11
1.4.2.1 Financial analysis serves the following purposes:
Measuring the profitability
The main objective of a business is to earn a satisfactory return on the funds invested in it.
Financial analysis helps in ascertaining whether adequate profits are being earned on the capital
invested in the business or not. It also helps in knowing the capacity to pay the interest and
dividend.
Indicating the trend of Achievements
Financial statements of the previous years can be compared and the trend regarding various
expenses, purchases, sales, gross profits and net profit etc. can be ascertained. Value of assets
and liabilities can be compared and the future prospects of the business can be envisaged.
Assessing the growth potential of the business
The trend and other analysis of the business provides sufficient information indicating the growth
potential of the business.
1.4.2.3 PARTIES INTERESTED
Analysis of financial statements has become very significant due to widespread
interest of various parties in the financial results of a business unit. The various parties interested
in the analysis of financial statements are :
(i)Investors:
Shareholders or proprietors of the business are interested in the well being of the
business. They like to know the earning capacity of the business and its prospects of future
growth.
(ii) Management:
12
The management is interested in the financial position and performance of the
enterprise as a whole and of its various divisions. It helps them in preparing budgets and
assessing the performance of various departmental heads.
(iii) Trade unions:
They are interested in financial statements for negotiating the wages or salaries or
bonus agreement with the management.
(iv) Lenders:
Lenders to the business like debenture holders, suppliers of loans and lease are
interested to know short term as well as long term solvency position of the entity.
(v) Suppliers and trade creditors:
The suppliers and other creditors are interested to know about the solvency of the
business i.e. the ability of the company to meet the debts as and when they fall due.
(vi) Tax authorities:
Tax authorities are interested in financial statements for determining the tax liability.
(vii) Researchers:
They are interested in financial statements in undertaking research work in business
affairs and practices.
(viii) Employees :
They are interested to know the growth of profit. As a result of which they can
demand better remuneration and congenial working environment.
(ix) Government and their agencies:
Government and their agencies need financial information to regulate the activities of
the enterprises/industries and determine taxation policy. They suggest measures to formulate
policies and and regulations.
(x) Stock exchange:
The stock exchange members take interest in financial statements for the purpose
of analysis because they provide useful financial information about companies.Thus; we find that
different parties have interest in financial statements for different reasons.

13
1.5 Credit rating process:
Receipt of rating request from an issuer
Assigning a rating team
Collecting information
Meeting key officials and the management team
Preview meeting
• Rating committee meeting
• Rating communication
• Rating review
• Surveillance
CHAPTER-2
PROFILE OF THE COMPANY
2.1 HISTORY:
GMR Group is one of the fastest growing Infrastructure organisation in the
country. The GMR Group was found in the year 1976.It is head quartered in Bangalore, India.
GMR also takes part in Indian Premier League's (A Twenty20 Cricket league in India) Delhi
franchise, Delhi Daredevils. Grandhi Mallikarjun Rao is the Chairman and Managing director of
GMR group. With an estimated personal worth of $6.2 billion dollars, G M Rao stands at 198th
rank in Forbes' 2008 World Billionaire list.
2.2 BACKBONE:
GMR Varalakshmi foundation is the corporate social responsibility arm of the
GMR Group.The foundation is not for profit company.The vision is to emerge as a premier
national body in the area of corporate social responsibility.The mission is to improves the lives of
the poor and needy in a self-generating way.The core activities of the foundation include
education,health& hygiene and empowerment.
2.3 GMR GROUP MEMBERS:

14
• G.M.Rao-Group chairman&founder
• Srinivas Bommidala-chairman-Highways&Urban infrastructure
• G.B.S.Raju-chairman-Corporate&International business
• Kiran kumar grandhi-chairman-Airports
• K Balasubramanian-chairman-Corporate social responsibility
• P M Kumar-executive director-Group corporate development.
• B.V.N Rao-chairman-Energy business
2.4 VISION & MISSION:
VISION :
GMR will pay a pioneering role in developing innovative projects and provide world
class services in infrastructure.
MISSION :
To build entrepreneurial organisations that make a difference to society through
creation of value.
2.5 VALUES & BELIEFS:
Humility: They value intellectual modesty and detest false pride and arrogance.
Entrepreneurship: They will seek opportunities and they are everywhere.
Teamwork and relationship: Going beyond the individual, encouraging boundary less
behavior.
Deliver the promise: They will value a deep sense of responsibility and self discipline,to
meet and surpass commitments made.
Learning: Nurturing active curiosity-to question, share and improve.
Social responsibility: Anticipating and meeting relevant and emerging needs of society.

15
Respect for individual: They will treat others with dignity, sensitivity and honour.
2.6 BUSINESS SECTORS :
GMR Groups business interests is in Airports, Highways, Energy and Urban Infrastructure. .
GMR Infrastructure Limited has in the following sectors:
1. Airports
2. Energy
3. Highways
4. Urban infrastructure
5. EPC
1.Airports:
Under operation:
• GMR hyderabad international airport(63%)
• Delhi international airport(54%)
• Instanbul sabiha gokcen international airport(40%)
• Male international airport(100%)
2.Energy:
Under operation:
• GMR Energy ltd(100%)
• GMR Power corporation(51%)
• Vemagiri power generation(100%)
Under development:
• Badrinath Hydro Power(100%)

16
• GMR kamalanga energy(80%)
• GMR Bajoli Power Project(100%)
• GMR Chattisgarh Power Project(100%)
• Upper Karnali Power Project(73%)
• EMCO Energy limited(100%)
• GMR Rajahmundry energy(100%)
• Talong hydro power(100%)
• Himtal hydro power co.(80%)
• Island power singapore(100%)
• GMR Solar Energy (100%)
• Deedwana Transmission Line (100%)
• Alwar Transmission Line (100%)
3.Highways:
Under operation:
• GMR Tambaram-Tindivanam(61%)
• GMR Tuni-Ankapalli(61%)
• GMR Ambala-Chandigarh(100%)
• GMR Adloor-Gundla Ponchanpalli(100%)
• GMR Ulunderpet(100%)
• GMR Jadcherla(100%)
Under construction:
• GMR Hyderabad Vijayawada(74%)
• Chennai outer ringroad(90%)
• Hungund-Hospet(51%)
17
4.Urban Infrastructure:
At Hyderabad Airport
• 1000 acres for commercial development
• 250 acres Aviation SEZ
• 250 acres Logistic SEZ
At Delhi Airport
• 250 acres for commercial development
In Tamilnadu
• 3300 acres SEZ
5.EPC:
GMR Group is estimating to save 8-12 percent cost by having an in-house engineering,
procurement and construction unit through extensive procurement for various verticals.GMR
Infrastructure ltd is setting up an in-house division EPC division in order to reduce future project
costs and ensures that deadlines are met.
2.7 MERGERS AND ACQUISITION OF GMR :
• The largest deal in November 2010 was China Huaneng Corp's acquisition of US-based
InterGenInc from GMR Infrastructure for $1.232 million
• GIL acquires Barasentosa lestare PT,a coal mining company in feb 26 2009
• GMR Group acquired 50 percent stake in Intergen for $1.354 million in October 2008
• GMR infrastructure ltd acquires a minority stake in DIAL from GMR holdings pvt ltd in
2008.

18
• GMR Infrastructure ltd, a unit of GMR holdings pvt ltd of india acquired Coralrose ltd ,a
construction company andsunwood properties korea BV,an Amsterdam-based real estate
agency in 2008.
• GIL acquires island power co pte ltd , a jurong island-based electric utility company from
InterGen N.V. of 800 MW.
• GMR Energy ltd has acquired 63% stake in south africa’s homeland, mining and energy
SA ltd , a unit of canada’s homeland energy group ltd in 2008.
2.8 EVENTS HAPPENED RECENTLY IN GMR:
• The important event recently happened is that , Mr.BVN.Rao(business chairman,energy
sector) launched the GMR business excellence reference manual called “blue book”
coinciding with BE assessor workshop on 7th feb 2011.
• GMR group has been awarded with “The best infrastructure project” from all over India
by property world magazine.property world belongs to the united business media group.
• GVPGL has won the prestigious national energy conversation award at delhi on 14th dec
2010.
• GHIAL and luthansa cargo AG(LCAG) on 3rd dec 2010 signed a MOU to jointly develop
RGIA,hyderabad in to a key cargo hub in south asia for the transport of temperature
sensitive pharmaceuticals.
2.9 COMPETITORS OF GMR:
Reliance Infra
Adani Power
Jaypee jaiprakash asso
Unitech

19
Lanco infrastructure
GVK Infra
IVRCL Infra
IRB Infra
II&FS Trans
2.10 KEY COMPETITORS OF GMR:
2.10.1 GVK POWER AND INFRASTRUCTURE LTD:
HISTORY:
GVK power and infrastructure ltd is a diversified business entity with a focus on
infrastructure and urban infrastructure.G.V.Krishna reddy,the chairman and managing director of
GVKPIL,is a first generation entreprenuer who establishes the business.
The area of business interests including power,roads,urban infrastructure,bio-science,hotels
and manufacturing.
The company was incorporated in the year 1994 as jagurupadu operating and maintenance
company,a private company ,under the companies act 1956.later the company name has changed
to jagurupadu operating and maintenance private ltd company in the year 2005 and then the
company has changed to private ltd to public ltd and then the company name is changed as
GVK power and infrastructure ltd. GVK foundation is involved in the corporate social
responsibility to help out the needy .
GROUP MEMBERS:
• G.V.Krishna Reddy
• G.V.Sanjay reddy
• A.Issac George
• K.Narsim Shenoy
• Abid Hussain
G.V.K SECTORS:

20
POWER:
• OPERATIONAL:
o Jagurupadu combained cycle power plant phase-1(217mw)
o Jagurupadu combained cycle power plant phase-2(220mw)
o Gautami combained cycle power plant(464mw)
• UNDER DEVELOPMENT:
o Alaknanda(330mw)-uttarkand
o Goindwal sahib(540mw)-punjab
• UNDER IMPLEMENTATION:
o Jagurupadu phase-3(800mw)-A.P
o Gautami-2(800mw)-A.P
o Goriganga(370mw)-Uttarkhand
o Rattle(690mw)-J&K
o Tokisud-Jharkhand
AIRPORTS:
• Mumbai international airport(74%)
• Bangalore international airport(29%)
ROADS:
• Jaipur-kishangarh BOT project(6lane from the 500km)
• Deoli-kota road BOT project(4 lane from the 83km)
URBAN INFRASTRUCTURE:

21
• 3000 acres SEZ in perambalur(tamilnadu)
2.10.2 LANCO INFRATECH:
HISTORY:
Lanco is the one of the fastest growing integrated infrastructure enterprises of India.The area
of business interests are in power,roads, EPC,infrastructure,property development.
The founder chairman of lanco infratech is L.Rajagopal, a techno-crat turned industrialist. He
started the lanco foundation, a charitable trust in the year 2000 to reach out to the needy.And
also he is the member of parliament,India.
GROUP MEMBERS:
• L.Madhusudhan rao-executive chairman
• G.Bhaskara rao-executive vice-chairman
• L.Sridhar-vice-chairman
• G.Venkatesh babu-managing director
LANCO SECTORS:
CONSTRUCTION:
• Power plants based on Gas, Coal, Bio-mass and Hydro.
• Irrigation and water supply projects, including dams, tunnels, lift irrigation, sewerage
schemes and marine works.
• Civil construction including commercial and residential buildings, mass housing projects
and townships, industrial structures, information technology parks, Corporate offices,
Hospitals and more.
• Transportation engineering projects including roads, highways, bridges and flyovers.
POWER:
• OPERATIONAL PROJECTS:
22
o Lanco kondapalli 1&2(734mw)
o Aban power(120mw)
o Lanco power 1&2(600mw)
o Udipi power 1(600mw)
o Lanco,chitradurga(3mw)
o Lanco,thirunelveli(10mw)
o Vamshi hydro energies(10mw)
o Vamshi industrial power(5mw)
• UNDER IMPLEMENTATION:
o Lanco kondapalli 3(732mw)
o Lanco power(3&4)(1320mw)
o Lanco anpara(1200mw)
o Udipi power 2(600mw)
o Lanco babandh(1320mw)
o Lanco budhil hydro power(70mw)
o lanco teesta hydro power(500mw)
o lanco mandakini hydro power(76mw)
ROADS:
• Bangalore-madbugal on NH-4(81km)
• Neelamangala-devihalli on NH-48(82km)
EPC:
The EPC group at lanco ensures project delivery cycles, greater capital expenditure
control, sourcing the best service and technology providers and most importantly allows its

23
clients to focus on their core business.the core competence of lanco is its experienced team for
managing contracts during all phases of project,while meeting the highest international
standards.
Lanco provides engineering,procurement,construction,project management and
commissioning services on turnkey basis to the power sector leveraging on the experience and
expertise of its group companies,its construction capability and competent manpower.
INFRASTRUCTURE:
LANCO infrastructure ltd has executed many challenging projects across india
including highways.lanco is currently executing the Varanasi non metro airport project
2.10.3 JAIPRAKASH ASSOCIATION:
HISTORY:
Jaiprakash associates was previously known as jaiprakash industries ltd but after merging
with jaypee cements in the year of 2004, the company gots its present name. Jaiprakash
associates ltd is under the jaypee group,which is an industrial infrastructural group in india .The
group was established in 1974 and has a turnover more than Rs.30,000million.
Jaiprakash associates has subsidary companies which are jaiprakash hotels,jaiprakash hydro
power and jaiprakash ventures
GROUP MEMBERS:
• Manoj gaur-executive chairman
• Sunil kumar sharma-executive vice chairman
• Sarat kumar jain-vice chairman
• Sunny gaur-managing director
• Pankaj gaur-joint managing director

24
JP SECTORS:
Civil Engineering:
Jaiprakash Associates Ltd., the flagship company of the Group, is a pioneer in
construction of river valley and hydropower projects on turnkey basis in India. Jaypee Group has
executed 13 Hydropower projects spread over 6 states of India and neighbouring Bhutan to
generate 10,290 MW of power.
Hydropower :
• OPERATIONAL:
o Baspa 2(300mw)
o Vishnuprayag(400mw)
• UNDER IMPLEMENTATION:
o Karcham wangtoo(1000mw)
• UNDER DEVELOPMENT:
o Lower siang(2700mw)
o Hirong(500mw)
o Kynshi stage-2(450mw)
o Umngot stage-1(270mw)
Thermal Power:
25
These all projects are in under implementation
• Bina power(1250mw)
• Jaypee nigrie(1320mw)
• Kannur(240mw)
• Karchana(1980mw)
• Bara(3300mw)
Transmission System:
Jaiprakash Hydro-Power Limited has plans to venture into the development of
transmission systems with the Power Grid Corporation of India Ltd (PGCIL).
Cement:
Jaypee Group is the 4th largest cement producer in the country. It produces ordinary
Portland cement and Pozzolana Portland cement under the brand names “Buland” and
“Buniyad”. The group has plants at Rewa and Bela. Jaypee group is poised to achieve cement
production capacity of 20 MTPA by the year 2009.
Hospitality:
Jaypee group owns and operates four five star deluxe hotels through a subsidiary company,
Jaypee hotels limited. These hotels are: Hotel Siddharth and hotel vasant continental in New
Delhi, Hotel Jaypee palace Agra, and Jaypee residency Manor, Mussoorie.
Real estate development:

26
Jaypee group is developing real estate in Greater Noida. Its property, Jaypee Greens,is spread
over an area of 450 acres. It comprises golf resorts , villas, townhouses.
Expressways & Highways:
Jaypee Group is constructing the prestigious 160 km long Expressway with Six lane
access that would connect the historical city of Agra with Greater Noida.
Information Technology:
Jaypee Group Company JIL Information Technology Limited (JILIT) specializes in:
Hardware & Networking, Multimedia Services & Software, and Enterprise Resource Planning.
2.11 GMR Group Organizational Chart
CHAIRMAN
Executive director
President

27
Chart:2.1
2.12 AWARDS & RECOGNISATIONS:
Mr.G.M.Rao received “first generation entreprenuer of the year” at CNBC TV18-2009 and
he also got a “doctorate” from Andhra University.
“silver plate award” for supporting cause of elders-on october 1,2009, new delhi.
AssociateVice president
General manager(H.R)
General manager(finance)
General manager(marketing)
General manager(production)
Associate manager
Associate manager
Regional officer Associate manager
Senior co-crdinator Senior Co-ordinator
Junior co-ordinator
junior Co-ordinator
Assistant Assistant
Executive vice president
Executive manager
Executive manager
Executive manager

28
RGIA also won the “essar steel infrastructure excellence award 2009” organised by CNBC
TV18-2009.
Mr.kiran kumar grandhi , chairman got “young entrepreneur award 2009” in the area of
travel and tourism.
G.M.R Vemagiri power generation ltd has won the “Innovative environmental project”
award at the CII environmental best practices award 2011 organized by CII-Godrej green
business centre on 28 & 29 January 2011
RGIA and IGIA have been rankes 1st and 4th best airports in their respective categories in the
latest ASQ rankings of Airports Council International.
CHAPTER-3
REVIEW OF THE LITERATURE:
3.1 Techniques and tools of financial analysis

29
Financial statements give complete information about assets, liabilities,equity, reserves,
expenses and profit and loss of an enterprise. They are not readily understandable to interested
parties like creditors, shareholders, investors etc. Thus, various techniques are employed for
analysing and interpreting the financial statements. Techniques of analysis of financial
statements are mainly classified into three categories :
(i) Cross-sectional analysis
It is also known as inter firm comparison. This analysis helps in analysing financial
characteristics of an enterprise with financial characteristics of another similar enterprise in that
accounting period.For example, if company A has earned 15% profit on capital invested. This
does not say whether it is adequate or not. If we analyse further and find that a similar company
has earned 16% during the same period, then only we can make a conclusion that company B is
better.Thus, it turns into a meaningful analysis.
(ii) Time series analysis
It is also called as intra-firm comparison. According to this method,the relationship
between different items of financial statement is established, comparisons are made and results
obtained. The basis of comparison may be :
– Comparison of the financial statements of different years of the same business unit.
– Comparison of financial statement of a particular year of different business units.
(iii) Cross-sectional cum time series analysis
This analysis is intended to compare the financial characteristics of two or more
enterprises for a defined accounting period. It is possible to extend such a comparison over the
year. This approach is most effective in analysing of financial statements.
3.2 Comparative position in relation to other firms
The purpose of financial statements analysis is to help the management to make a comparative
study of the profitability of various firms engaged in similar businesses. Such comparison also
helps the management to study the position of their firm in respect of sales,expenses, profitability
and utilising capital, etc.
• Assess overall financial strength
The purpose of financial analysis is to assess the financial strength of the business. Analysis also
helps in taking decisions, whether funds required for investing for business growth are provided

30
from internal sources of the business or not if yes, how much? And also to assess how much
funds have been received from external sources.
• Assess solvency of the firm
The different tools of an analysis tell us whether the firm has sufficient funds to meet its short
term and long term liabilities or not.
Ratio analysis is used to analyse the present and future earning power of the issuing
corporation and to get insight into the strengths and weaknesses of the firm. Bond rating agencies
have suggested guidelines about what value each ratio should have within a particular quality
rating. Different ratios are favoured by rating agencies. For any given set of ratios, different
values are appropriate for each industry. Moreover, the values of every firm's ratios vary in a
cyclical fashion through the ups and downs of the business cycle.
To assess the strength of security owner's claim, the protective provisions in the
indenture (legal instrument specifying bond owners' rights), designed to ensure the safety of
bondholder's investment, are considered in detail.
The factors considered in regard to the economic significance and size of issuer
includes: nature of industry 'in which issuer is, operating (specifically issues like position in the
economy, life cycle of the industry, labour situation, supply factors, volatility, major
vulnerabilities, etc.), and the competition faced by the issuer (market share, technological
leadership, production efficiency, financial structure, etc.)
3.3Ratio Analysis:
Ratio analysis is a widely-used tool of financial analysis. It can be used to
compare the risk and return relationships of firms of different sizes. It is defined as the
systematic use of ratio to interpret the financial statements so that the financial strengths and
weakness of a firm as well as its historical performance and current financial condition can be
determined. The term ratio refers to the numerical or quantitative relationship between two items
and variables. These ratios are expressed as
1. percentages,
2. fraction and
3. proportion of numbers.

31
These alternative methods of expressing items which are related to each other are, for
purposes of financial analysis, referred to as ratio analysis. It should be noted that computing the
ratios does not add any information not already inherent in the above figures of profits and
sales.What the ratio do is that they reveal the relationship in a more meaningful way so as to
enable equity investors, management and lenders make better investment and credit decisions.
3.3.1 PROCESS OF RATIO ANALYSIS
Chart:3.1
3.4 THE KEY RATIOS USED IN THE STUDY:
The main ratios which are very useful for the study that measures the business and
financial analysis.
1. EBITDA Margin:
Selection of relevant data from the financial statements depending upon the objective of the analysis.
Calculation of appropriate ratios from the above data
Comparison of the calculated ratio with the ratios of the same firm in the past, or ratios developed from projected financial statements or the ratios of other firms in the same year of the same company type or the ratios of the industry to which the firm belongs
Interpretation of ratios
32
A measurement of a company's operating profitability. It is equal to earnings before
interest, tax, depreciation and amortization (EBITDA) divided by total revenue. Because
EBITDA excludes depreciation and amortization, EBITDA margin can provide an investor with
a cleaner view of a company's core profitability.EBITDA margin measures the extent to which
cash operating expenses use up revenue.
EBITDA
EBITDA margin = _________________
Total revenue
2.Price to earnings ratio:
A valuation ratio of a company's current share price compared to its per-share earnings.
Calculated as:
Market value per share
Price to earnings ratio = ___________________________
Earnings per share
In general, a high P/E suggests that investors are expecting higher
earnings growth in the future compared to companies with a lower P/E. However, the P/E ratio
doesn't tell us the whole story by itself. It's usually more useful to compare the P/E ratios of
one company to other companies in the same industry, to the market in general or against the
company's own historical P/E. It would not be useful for investors using the P/E ratio as a basis
for their investment to compare the P/E of a technology company (high P/E) to a utility company
(low P/E) as each industry has much different growth prospects.
3.Return on equity:
The amount of net income returned as a percentage of shareholder’s equity.return
on equity measures a corporation’s profitability by revealing how much profit a company
generate with the money shareholder’s have invested.

33
Calculated as:
Net income
Return on equity=______________________
Share holder’s equity
Net income is for the full fiscal year(before dividends paid to common stock holders but
after dividends to preferred stock)share holder’s equity does not include preferred shares. Also
known as “return on net worth”(RONW).
4.Debt to equity ratio:
A measure of a company's financial leverage calculated by dividing its total
liabilities by stockholders' equity. It indicates what proportion of equity and debt the company is
using to finance its assets.
Debt to equity ratio= total liabilities .
Shareholder’s equity
Sometimes only interest-bearing, long-term debt is used instead of total liabilities in the
calculation. Also known as the Personal Debt/Equity Ratio, this ratio can be applied to personal
financial statements as well as corporate ones.
If a lot of debt is used to finance increased operations (high debt to equity), the company
could potentially generate more earnings than it would have without this outside financing. If this
were to increase earnings by a greater amount than the debt cost (interest), then the shareholders
benefit as more earnings are being spread among the same amount of shareholders. However, the
cost of this debt financing may outweigh the return that the company generates on the debt
through investment and business activities and become too much for the company to handle. This
can lead to bankruptcy, which would leave shareholders with nothing.
A high debt to equity ratio generally means that a company has been aggressive in
financing its growth with debt. This can result in volatile earnings
5. Return on capital employed:
34
This is considered to be the best measure of profitability in order to assess the over all
performance of the business. As the primary objective business is to earn profit higher the Return
On Capital Employed, the more efficient the firm is in using its funds. The ratio can be funds for
a number of years as to find a trend as to whether the profitability of the company is in
improving or otherwise.
Earnings before interest and tax
Return on capital employed = ____________________________
Net current assets
6.Price to book value:
A ratio used to compare a stock's market value to its book value. It is calculated by dividing the
current closing price of the stock by the latest quarter's book value per share.
Calculated as:
Price to book value= stock price .
Book value
Where,
book value = shareholders equity .
no.of equity shares
A lower P/B ratio could mean that the stock is undervalued. However, it could also mean that
something is fundamentally wrong with the company. As with most ratios, be aware that this
varies by industry. This ratio also gives some idea of whether you're paying too much for what
would be left if the company went bankrupt immediately.
Also known as price to equity ratio.
7.EV/EBITDA:
EV / EBITDA, is a measure of the cost of a stock which is more frequently valid for comparisons
across companies than the price to earnings ratio. Like the P/E ratio, the EV / EBITDA ratio is a

35
measure of how expensive a stock is. It measures the price in the form of Enterprise value an
investor pays for the benefit of the company's cash flow in the form of EBITDA.
Enterprise value
EV/EBITDA = _______________________________________________
Earnings before interest and tax depreciation amortization
Where, EV=Market capital+debt+preference shares+minority interest-cash
Market capital=price value*equity shares
EV/EBITDA values can vary depending on EBITDA is calculated. EBITDA can vary
due to differences in counting of depreciation and amortization which can be counted at different
rates over time. Unlike P/E ratios, however, EV / EBITDA ratios can be used to compare a wide
variety of companies.P/E ratios can be an invalid way of comparing different companies for
several reasons which are accounted for in EV / EBITDA. It is a better measurement of
companies takeover value.
8.Operating cashflow:
A measure of how well current liabilities are covered by the cash flow generated from a
Company’s operations.
Formula: OCF Ratio= cash flow from operations .
Current liabilities
The operating cash flow ratio can gauge a company's liquidity in the short term. Using cash flow
as opposed to income is sometimes a better indication of liquidity simply because, as we
know, cash is how bills are normally paid off.
Companies operations
9.Current ratio:

36
The current ratio is the ratio of total current assets to total current liabilities. It is
calculated by dividing current assets by current liabilities:
Current assets
Current Ratio = ________________
Current liabilities
The current assets of a firm, as already stated, represent those assets which can be, in the
ordinary course of business, converted into cash within a short period of time, normally not
exceeding one year and include cash and bank balances, marketable securities, inventory of raw
materials, semi-finished (work-in-progress) and finished goods, debtors net of provision for bad
and doubtful debts, bills receivable and prepaid expenses. The current liabilities defined as
liabilities which are short-term maturing obligations to be met, as originally contemplated, within
a year, consist of trade creditors, bills payable, bank credit, provision for taxation, dividends
payable and outstanding expenses.
10. Cash ratio:
The ratio of a company's total cash and cash equivalents to its current
liabilities. The cash ratio is most commonly used as a measure of company liquidity. It can
therefore determine if, and how quickly, the company can repay its short-term debt. A strong
cash ratio is useful to creditors when deciding how much debt, if any, they would be willing to
extend to the asking party.
Formula: cash ratio = total cash and cash equivalents .
Current liabilities
The cash ratio is generally a more conservative look at a company's ability to cover its
liabilities than many other liquidity ratios. This is due to the fact that inventory and accounts
receivable are left out of the equation. Since these two accounts are a large part of many
companies, this ratio should not be used in determining company value, but simply as one factor
in determining liquidity.
11.Asset efficiency ratio:
The asset efficiency ratio provides an indication of how well the assets of a company

37
are utilized to generate a cash flow return. As an alternative measure, total property,
plant and equipment could be used in place of total assets for the denominator to reflect a
company’s ability to minimize waste in generating cash flows from operations based on its
investment in operational assets. These measures, tracked over a period of time, can provide
useful insights especially when the results are compared to other companies in the same industry.
Formula:
asset efficiency ratio = cash flow from operations .
Total assets
12.operating cash margin:
The operating cash margin ratio is somewhat similar to a traditional profit margin ratio
except for the use of CFO in place of either net income or operating income as the
numerator. Thus, the operating cash margin ratio provides a more robust indicator of
performance based on cash generating ability as opposed to a profit margin ratio with its focus on
accrual based accounting income. Essentially, the operating cash margin ratio highlights the
timing of cash flows with respect to the timing of sales.
Formula:
Operating cash margin = cash flow from operations .
sales
Therefore, this ratio can prove useful as part of a process to evaluate cash management
performance, as well as, credit granting policies and receivable collections. However, since cash
flow margins are likely to exhibit substantial variations among companies in different industries,
it is more effective to focus a comparative analysis on companies within the same industry.
13.Operating profit margin:
A ratio used to measure a company's pricing strategy and operating efficiency.
Calculated as:

38
Operating profit margin = earning before interest and tax .
Net sales
Operating profit margin is a measurement of what proportion of a company's revenue is
left over after paying for variable costs of production such as wages, raw materials, etc. A
healthy operating margin is required for a company to be able to pay for its fixed costs, such as
interest on debt. Also known as "net profit margin".
Operating profit margin gives analysts an idea of how much a company makes (before
interest and taxes) on each dollar of sales. When looking at operating margin to determine the
quality of a company, it is best to look at the change in operating margin over time and to
compare the company's yearly or quarterly figures to those of its competitors. If a company's
margin is increasing, it is earning more per dollar of sales. The higher the margin, is the better.
14.Basic earning power:
The basic earning power ratio compares earnings apart from the influence of taxes or
financial leverage,to the assets of the company.this allows more direct comparision of similar
firms that use different financing strategies or have different tax situations.
Formula:
Basic earning power = earnings before tax and interests .

39
Total assets
The ratio indicates basic probability of assets and is useful in comparing firms with different
degree of leverage.
15.EBITDA to Interest coverage ratio:
The ratio that is used to assess a company’s financial durability by examining whether it is
at least profitably enough to pay off its interest expenses.
Formula:
EBITDA to interest coverage ratio= EBITDA .
Interest payments
A ratio greater than 1 indicates that the company has morethan enough interest coverage to
pay off its interest expenses.
3.5 Tips to improve financial health.
Author: Bill Hudley
Spend less money, or save more money or do both. If the annual income does nothing more
than remain constant, your financial condition will improve.
The above statement may sound come across as flippant, but it’s a fact of life,
regardless.Needless to say we all have different personalities and different responses to needs
and desires in life.
A very important yardstick, in my view, is the growth rate of personal assets. If you sit
down to all of the savings accounts, investment accounts and properly values and the total value
is greater than the same time of the previous year, it stands to improve that the financial health
intact and possibly improved.
3.5.1 Steps to Improve Financial Performance
Author: Terry Peltes
Given the challenges facing physicians, successful practices must take proactive steps to combat
negative trends and improve their overall financial performance.

40
To improve practice operations, processes can be streamlined to reduce costs; productivity
improvements can be implemented by the employees to increase revenue; a reporting structure
can be created that allows for better decision making by employees; and a rewards system can be
implemented to recognize hard-working employees.
To determine how you can improve your practice's performance, consider the
following management procedures.
1) Internal Cost Reduction Strategies
Cost reduction strategies focus on reducing the internal costs generated by
services provided to the marketplace.
2) External Cost Reduction Strategies
These strategies include the cost of services purchased from outside consultants or
vendors.
3) Asset and Credit Management Strategies
These strategies ensure that you are getting the most value from the resources invested in your
practice.
4) Personnel Resources
When managed properly, personnel costs and productivity can have a substantial
impact on profitability.
5) Management Reporting
The use of timely, relevant, properly formatted reports to manage your practice cannot
be overstated. This is a crucial link between setting financial and operational goals and
managing the practice to achieve them.
6) Revenue Enhancement
Industries can improve their financial performance by improving their ability to negotiate
favorable managed care contracts and reducing practice expenses as a percentage of revenue.
3.5.2 Excellence in Financial Management
Author: Matt H. Evans
Ratio analysis can be used to determine the time required to pay accounts payable
41
invoices.If the average number of days is close to the average credit terms, this may indicate
aggressive working capital management; i.e. using spontaneous sources of financing. However,
if the number of days is well beyond the average credit terms, this could indicate difficulty in
making payments to creditors.
3.5.3 Analyze Investments Quickly With Ratios
Author: Jonas Elmerraji
The information you need to calculate ratios is easy to come by: Every single number or
figure you need can be found in a company's financial statements. Once you have the raw data,
you can plug in right into your financial analysis and put those numbers to work for you.
Everyone wants an edge in investing but one of the best tools out there frequently is
misunderstood and avoided by new investors. When you understand what ratios tell you, as well
as where to find all the information you need to compute them, there's no reason why you
shouldn't be able to make the numbers work in your favour.
3.6 BUSINESS ANALYSIS:
Business analysis is the list of academic disciplines of identifying business needs and
determining solutions to business problems. Solutions often include a systems development
component, but may also consist of process improvement, organizational change or strategic
planning and policy development.
SWOT ANALYSIS:
A technique that enables a group or individual to move from everyday problems and
traditional strategies for a fresh perspective.swot is said to be strength and weakness as internal
environment ,opportunities and threats as external environment.
Strength:
Any existing or potential resources or capability within the organization that provides a competitive advantage in the market.
Weakness:

42
Any existing or potential force which could serve as a barrier to maintaining or achieving a competitive advantage in the market
Opportunities:
Any existing or potential force in external environment that ,if properly leveraged ,could provide a competitive advantage
Threats:
Any existing or potential force in the external environment that could erode a competitive advantage.
Aim of swot analysis:
• Take advantage of strengths and opportunities
• Minimize weaknesses and eliminate threats
3.6.1 Measures to improve the business process:
A Business process improvement (BPI) typically involves six steps:
1. Selection of process teams and leader:
Process teams, comprising 2-4 employees from various departments that are involved in the
particular process, are set up. Each team selects a process team leader, typically the person who
is responsible for running the respective process.
2. Process analysis training:
The selected process team members are trained in process analysis and documentation
techniques.
3. Process analysis interview:
The members of the process teams conduct several interviews with people working along the
processes. During the interview, they gather information about process structure, as well as
process performance data
43
4. Process documentation:
The interview results are used to draw a first process map. Previously existing process
descriptions are reviewed and integrated, wherever possible. Possible process improvements,
discussed during the interview, are integrated in to the process maps.
5. Review cycle:
The draft documentation is then reviewed by the employees working in the process.
additional review cycle may be necessary in order to achieve a common view(mental image) of
the process with all concerned employees. This stage is an interaction process.
6.Problem analysis:
A thorough analysis of process problems can then be conducted, based on the
process map, and information gathered about the process. At this time of the project, process goal
information from the strategy audit is available as well, and is used to derive measures for
process improvement.
3.7 CREDIT RATING AGENCIES IN INDIA:
The popular credit rating agencies in India are:
1.Credit Rating and Information Services of India Limited(CRISIL).
2. Investment Information and Credit Rating Agency of India Limited (ICRA) .
3. Credit Analysis and Research Limited (CARE).
4.Duff&phelps credit rating india private ltd(DCR)
5.FITCH rating agency

44
1.CRISIL :
CRISIL was set-up by ICICI and UTI in 1988, and rates debt instruments. Nearly half of
its ratings on the instruments are being used. CRISIL's market share is around 75%. It has
launched innovative products for credit risks assessment viz., counter party ratings and bank loan
ratings. CRISIL rates debentures, fixed deposits, commercial papers, preference shares and
structured obligations. Of the total value of instruments rated, debentures' accounted for 3 1.196,
formed deposits for 42.3% and commercial paper 6.6%. CRISIL publishes CRISIL rating in
SCAN that is a quarterly publication in Hindi and Gujarati, besides English.
CRISIL evaluation is carried out by professionally qualified persons and includes data
collection, analysis and meeting with key personnel in the company to discuss strategies, plans
and other issues that may effect ,evaluation of the company. The rating process ensures
confidentiality. Once the company decides to use rating, CRISIL is obligated to monitor the
rating over the life of the debt instrument.
2. ICRA :
ICRA was promoted by IFCI in 1991. During the year 1996-97, ICRA rated 261 debt
instruments of manufacturing companies, finance companies and financial institutions equivalent
to Rs. 12,850 crore as compared to 293 instruments covering debt volume of Rs. 75,742 crore in
1995-96. This showed a decline of 83.0% over the year in the volume of rated debt instruments.
Of the total amount rated cumulatively until March-end 1997, the share in terms of number of
instruments was 28.5% for debentures(including long term instruments), 49.4% for Fixed
Deposit programme (including medium- term instruments), and 22.1% for Commercial Paper
Programme (including shortterm instruments). The corresponding figures of amount involved for
these three broad rated categories was 23.8% for debentures, 52.2% for fixed deposits, and
24.0% for Commercial Paper.
The factors that ICRA takes into consideration for rating depend on the nature of
borrowing entity. The inherent protective factors, marketing strategies, competitive edge,
competence and effectiveness of management, human resource development policies and
practices, hedging of risks, trends in cash flows and potential liquidity, financial flexibility, asset

45
quality and past record of servicing of debt as well as government policies affecting the industry
are examined. Besides determining the credit risk associated with a debt instrument, ICRA has
also formed a group under Earnings Prospects and Risk Analysis (EPRA). Its goal is to provide
authentic information on the relative quality of the equity. This requires examination of almost
all parameters pertaining to the fundamentals of the company including relevant sectoral
perspectives. This qualitative analysis is reinforced and completed by way of the unbiased
opinion and informed perspective of one analyst and wealth of judgement of committee
members. ICRA opinions help the issuing company to broaden the market for their equity. As
the name recognition is replaced by objective opinion, the lesser know compapies are also able to
access the equity market.
3.CARE :
CARE is a credit rating and information services company promoted by IDBI jointly with
investment institutions, banks and finance companies. The company commenced its operations in
October 1993. 'In January 1994, CARE commenced publication of CAREVIEW, a quarterly
journal of CARE ratings. In additioh to the rationale of all accepted ratings, CAREVIEW often
carries special features of interest to issuers of debt instruments,investors and other market
players.
4.DCR:
DCR India or Duff & Phelps Credit Rating India Private Ltd is one of the top credit
rating agencies in India. Over the years, DCR India has been providing excellent services to its
clients. Duff & Phelps Credit Rating India Private Ltd (DCR India) has played an important role
in rating India's forex debt obligations.

46
Duff & Phelps Credit Rating India Private Ltd (DCR India) rated the forex debt
obligations of India as ' BBB-' or a Triple B Minus. This rating is of great importance for the
economy of India and the credibility of the national government.
This rating reflects the fact that the Indian national government is trying its best to improve the
state of Indian economy. As per the rating of DCR India, the national government of India is
trying to bring about a better economic environment through the introduction of several
economic policies and plans for the last 17 years.
Over the years India has had powerful accounts of payments. Since the decade of 1990s
the records of debt service have also been impressive. The external debt indicators of India are
also showing better patterns. All these support the rating provided by Duff & Phelps Credit
Rating India Private Ltd (DCR India)
5.FITCH:
Fitch ratings was founded as fitch publishing company on December 24,1913 by John
Knowles fitch.Located in the heart of the financial district in new York city,the fitch puvlishing
company began as a publisher of financial statistics whose consumers included the new York
stock exchange.it became a recognized leader in providing critical financial statistics to the
investment community through such publications as the “fitch bond book” and the “fitch stock
and bond manual.”In 1924,the fitch publishing company introduced the now familiar
“AAA”to”D” ratings scale to meet the growing demand for independent analysis of financial
securities.
Fitch ratings was one of the three ratings first agencies first recognized as a nationally recognized
statistical rating organization(NRSRO) by the securities and exchanges commission in 1975.
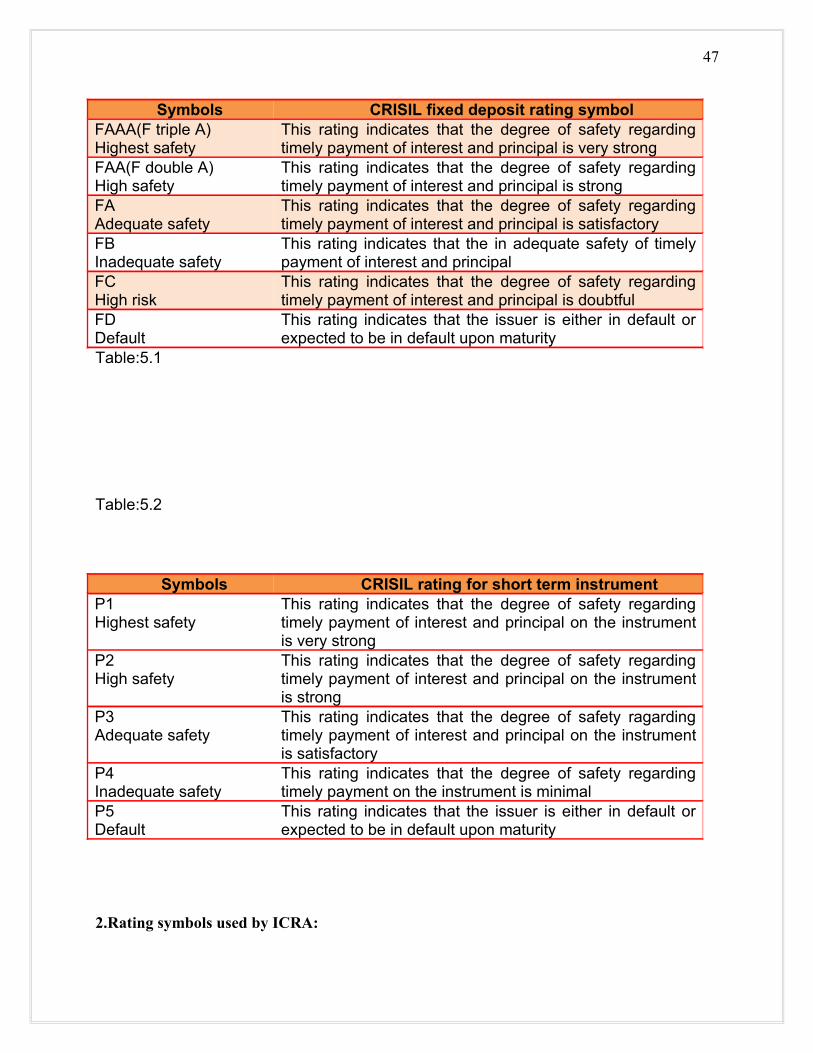
3.7.1 Rating symbols and their explaination:1.Rating symbols used by CRISIL:
47
Table:5.1
Table:5.2
2.Rating symbols used by ICRA:
Symbols CRISIL fixed deposit rating symbolFAAA(F triple A)Highest safety
This rating indicates that the degree of safety regarding timely payment of interest and principal is very strong
FAA(F double A)High safety
This rating indicates that the degree of safety regarding timely payment of interest and principal is strong
FA Adequate safety
This rating indicates that the degree of safety regarding timely payment of interest and principal is satisfactory
FBInadequate safety
This rating indicates that the in adequate safety of timely payment of interest and principal
FCHigh risk
This rating indicates that the degree of safety regarding timely payment of interest and principal is doubtful
FDDefault
This rating indicates that the issuer is either in default or expected to be in default upon maturity
Symbols CRISIL rating for short term instrumentP1Highest safety
This rating indicates that the degree of safety regarding timely payment of interest and principal on the instrument is very strong
P2High safety
This rating indicates that the degree of safety regarding timely payment of interest and principal on the instrument is strong
P3Adequate safety
This rating indicates that the degree of safety ragarding timely payment of interest and principal on the instrument is satisfactory
P4Inadequate safety
This rating indicates that the degree of safety regarding timely payment on the instrument is minimal
P5Default
This rating indicates that the issuer is either in default or expected to be in default upon maturity

48
Table:5.3
Symbols Long term debt-debentures,bonds and preference shares
LAAAHighest safety
Indicates fundamentally strong position.Risk factors are negligible. There may be circumstances adversely affecting the degree of safety but such circumstances, as may be visualised, are not likely to affect the timely payment of principal and interest as per terms
LAAHigh safety
Risk factors are modest and may vary slightly. The protective factors are strong and prospects of timely payment of interest and principal as per terms, under adverse a circumstances, as may be visual-ised, differ from LAAA only marginally.
LAAdequate safety
Risk factors are more variable and greater in periods of economic stress. The protective factors are average and any adverse change in circumstances, as may be visualised, may alter the fundamental strength and affect the timely payment of principal and interest as per terms
LBBBModerate safety
Considerable variability in risk factors.The protective factors are below average. Adverse changes in business/economic circumstances are likely to affect the timely payment of principal and interest as per terms.
LBRisk prone
Risk factors indicate that obligations may not be honoured when due. The protective factors are narrow. Adverse changes in business/ ecanomic conditions could result in inability unwillingness to service debt on time as per terms.
LCSubstantial risk
There are inherent elements of risk and timely servicing of debt/obligations could be possible only in case of continued existence of favourable circumstances.
LDDefault
Extremely speculative. Either already in default of payment of interest and/or principal as per terms or expected to default. Recovery is only likely on liquidation or reorganisation.

49
Table:5.4
3.Rating symbols used by CARE:
Symbols Medium term debt including fixed deposit programmes
MAAAHighest safety
The prospect of timely servicing of the interest and principal as per terms is the best
MAAHigh safety
The prospect of timely servicing of the interest and principal as per terms is high but not high as in MAAA rating
MAAdequate safety
The prospect of timely servicing of the interest and principal is moderate.however,debt servicing may be affected by adverse changes in the business/economic conditions
MBInadequate safety
The timely payment of interest and peincipal are more likely to be affected by future uncertainties
MCRisk prone
Susceptibility to default high.adverse changes in business/economic conditions could result in inability/unwillingness to service debts on time and as per terms
MDDefault
either in default or expected to default
A1Highest safety
The prospect of timely payment of debt/obligation is the best
A2High safety
The relative safety is marginally lower than in A1 rating
A3Adequate safety
The prospect of timely payment of interest and instalment is adequate but any adverse change in business/economic conditions may affect the fundamental strength
A4Risk prone
The degree of safety is low.likely to default in case of adverse changes in business/economic conditions
A5Default
Either in default or expected to default

50
Symbols Long term and medium term instrumentsAAAHighest safety
Debt instrument carrying the rating are considered to be of the best quality,carrying negligible investment risk.debt service payments are protected by stable cash flows with good margin.while the underlying assumptions may change,such changes as can be visualised are most unlikely to impair the strong position of such instruments
AAHigh safety
Instruments carrying this rating are judged to be of high quality by all standards.They also classified as high investment grade.They are rated lower than AAA.
AAdequate safety
Instruments with this rating are considered upper medium instrument and have many favourable investment attributes.safety for principal and interest are considered adequate.assumptions that do not materialise may have a greater impact as compared to the instruments rated higher.
BBB Such instruments are considered to be of investment grade.they indicate sufficient safety for payment of interest&principal,at the time of rating.however,adverse changes in assumptions are more likely to weaken the debt servicing capability compared to the higher rated instruments.
BB Such instruments are considered to be speculative,with inadequate protection for interest and principal payments
B Instruments with some ratings are generally classified susceptible to default.while interest and principal payments are being met,adverse changes in business conditions are likely to lead to default.
C Such instruments carry high investment risk with likelihood of default in the payment of interest and principal
D Such instruments are of the lowest category.They are either in default or are likely to be in default soon
Table: 5.5
Symbols Short term investmentsPR-1 Instruments would have superior capacity for repayments
of short term promissiory obligations.issuers of such instruments will normally be characterised by leading market positions in established industries, high rates of

51
return on funds employed etc.,PR-2 Instruments would have strong capacity for repayment of
short term promissory obligations.issuer would have most of the characteristics as for those with PR-1 instruments but to a lesser degree.
PR-3 Instruments have an adequate capacity for repayment of short term promissiory obligations.the effect of industry characteristics and market composition may be more pronounced.variability in earnings and profitability may result in changes in the level of debt protection
PR-4 Instruments have minimal degree of safety regarding timely payment of short term promisiory obligations and safety is likely to be adversally affected by short term adversity or less favourable conditions
PR-5 The instrument is in default or is likely to be in default on maturity
Table: 5.6
Symbols Credit analysis ratingCARE-1 Excellent debt management capability.such companies
will normally be characterised as leaders in the respective industries
CARE-2 Very good debt management capability.such companies would normally be regarded as close to those rated CARE-1,but with a lower capability to withstand changes in assumptions
CARE-3 Good capability for debt management.such companies are considered medium grade.assumptions that do not materialise may impair debt management capability in future
CARE-4 Barely satisfactory capability for debt management.the capacity to meet obligations is likely to be adversely affected by short term adversity or less favourable conditions
CARE-5 Poor capability of debt management.such companies are in default or are likely to default in meeting their debt obligations
Table: 5.7
3.7.2 RATING PROCESS
Client Agencies
Required for
Submits information and detailed schedules
Interacts with team, responds to queries&provides additional data necessary for the analysis
Assigns rating Team interacts with client, undertakes site visits & analyses data submitted by clients.
Press release, published in website, care view.
Rating kept under periodic surveillance
Appeal for review of rating (once)

52
Yes
NO
Chart: 3.2
3.7.3 RATING AGENCIES METHODOLOGIES: The construction is one of the important sectors in India today. The industry can
be gauged from the fact that supports a large number of upstream and downstream industries.
The team does analysis of the information
Rating commitee awards rating.rating letter and rationale issued to client
Accept rating

53
Moreover, the industry has strong linkages with the overall economy and enjoys a large
economic multiplier effect.
The Indian construction industry can classified into three broad subgroups as follows:
Category List of construction activitiesResidential and
Commercial/industrial
Residential and commercial buildings and complexes
such as houses,offices,hospitals,restaurants,shops and
shopping complexes etc.Infrastructure Roads,ports,bridges,flyovers,dams,power
plants,telecom facilities,oil&gas plants,refineriesUrban-infrastructure Municipal roads,water supply,sewerage and
drainage,sanitation,solid waste management systems
etc.Table:5.8
1.CRISIL’S CREDIT RATING METHODOLOGY:
CRISIL extensive experience in the credit evaluation of construction
companies has led to the evaluation of specific rating methodology for companies in this
industry.A discussion of the specific parameters used in the methodology follows.
BUSINESS RISK ANALYSIS:
Market position:
Area of expertise and business potential therein:
Construction company which has expertise in or are active in sectors of the
construction industries where higher activity levels are anticipated,benefit from significantly
better business prospects than their counterparts whose area of expertise has a relatively lower
growth expectation. It is crisils view, as indeed as that of most observers of the indian
economy,that the countries physical infrastructure needs of significant improvement.This
includes areas of construction activity like roads, ports,energy and housing,with each sector
carrying a demand potential that would call for an expenditure of several billion rupees each. The

54
timing and extent of activity in each sector would, however, depend on the interplay of numerous
factors.
Using this knowledge and understanding of economic environment, CRISIL
continally attempts to identify segments of the construction industry that are likely to witness
more actively than others. This view is coupled with the area of expertise of individual
construction companies to arrive at the demand potential for those companies.
Diversity and dispersion of project portfolio:
CRISIL views construction companies that have a diversified project portfolio
both across sectors and geographies of implementation ,more favourably than companies that
tend to have a more concentrated portfolio.In similar situation,other things remaining equal,a
construction company with a large number of small projects would be viewed more favourably
from a credit perspective than a company whose portfolio includes a small number of large
projects.such diversity and dispersion enables the company to better withstand unforeseen
adverse developments in any project that is being implemented.
Operating efficiency:
Track record and implementation expertise:
Construction companies that have a strong track record of project implementation to
the required quality standards and without cost,or time overrun enjoy,in crisils opinion,a strong
position with respect to winning future business in their future expertise.The track record
importance arises from the fact that most the construction projects are awarded on the tender
basis,where experience in the sector is a prerequisite for bidding.Moreover,this prior experience
also enhances the companies expected skills. Some large players, however, have been able to
establish project manager expertise spanning much wider range of technical skills.
Cost structure and operating philosophy:
Construction companies,cost structure is also an important element to determine the
operating efficiencies.A high fixed cost structure will make it unviable for the company for the
quoting aggressively for projects and impact success ratio. Similarly, if such companies quote

55
aggressively,then they may not be able to cover their cost.therefore several companies operate
extensively through sub-contractors to increase the variable element of their cost
structures.Thus,having an optimum cost structure is critical for the longterm viability of a
construction company.while,analysing the operating efficiency of a company,CRISIL will access
the company’s opearting philosophy,its cost structure,past track records in tenders,reasons for
losing tenders etc.
Knowledge of and comfort with the local environment:
Construction companies that are more kowledgeable about the environment in
which they operate are significantly better eqquiped to handle uncertainties and surprises that are
a potential part of all construction projects.with increasing globalisation,most business activities
have tended to span national and regional boundaries.However this process has been particularly
slow in the construction industry, which has retained its predominantly local character in most
markets.In CRISIL view,this is likely to continue over the short to medium term,given the
continuing importance of the awareness of naunces and detail about the local environment as an
ingredient of successful project implementation of the construction industry
FINANCIAL RISK ANALYSIS:
CRISIL’S analysis of financial risk for construction company is broadly in line with the
creiteria adopted for other manufacturing companies.The following elements are centrally
included in our analysis for construction companies.
Accounting quality:
Construction company that follow a consistent,transparent and conservative policy on
financial accounting tend to be viewed more favourably in crisil’s credit analysis than those that
do not.since construction companies can adopt varying accounting policies for income and profit
recognition,analysis of accounting is very critical first step in the financial risk analysis of such
companies.construction companies have followed diverse policies with respect to income
recognition.the analysis focuses on project-wise activity on a year to year basis in order to
determine the companies effective business level.

56
Cash flow and liquidity analysis:
Construction companies revenue and cash flow profile could be covered given to the
nature of business they undertake.Additionally, there could be a sharp distinction between the
cash flows and the accrued income.Therefore,conventional techniques of ratio analyis are often
not sufficient to ascertain the credit worthiness of a construction company.CRISIL analysis of
construction companies tends to be more focused on a cash based analysis of revenues, expenses
and financial indicators. Construction companies that have a strong liquidity position and a more
predictable project cashflows are viewed more favourably from a credit perspective.predictability
of cash flows is often supported by project,geographic and customer diversification and hence
companies with diversified revenue streams may be viewed more favourably compared to
companies with concentrated revenue streams.
CONCLUSION:
CRISIL’S analysis of Construction Company is unique from that of a typical manufacturing
company. This unique approach leverages on crisils in depth understanding of this sectors and on
specific naunces.In crisils opinion, the key success factors for the construction sectors include:
• Expertise in high growth segments
• Diversified and dispersed project portfolio
• Strong track record of project implementation
• Optimum cost structure
• Strong cashflow generation capabilities
2. ICRA’S CREDIT RATING METHODOLOGY:
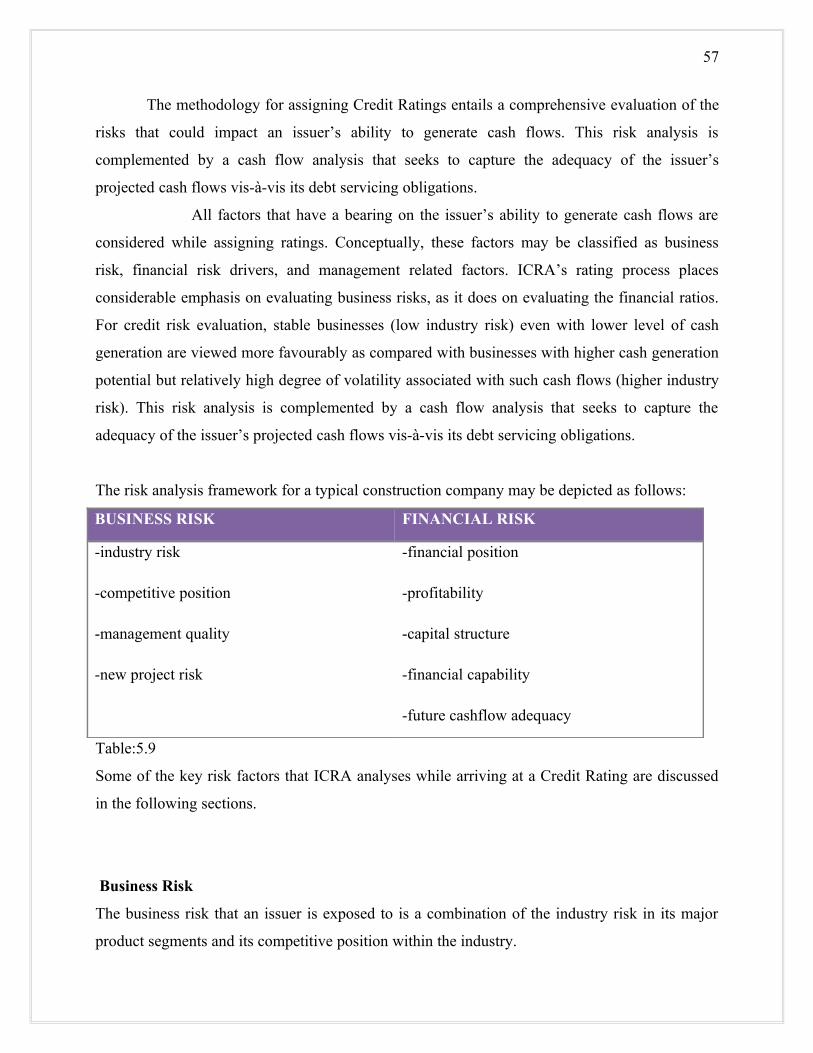
57
The methodology for assigning Credit Ratings entails a comprehensive evaluation of the
risks that could impact an issuer’s ability to generate cash flows. This risk analysis is
complemented by a cash flow analysis that seeks to capture the adequacy of the issuer’s
projected cash flows vis-à-vis its debt servicing obligations.
All factors that have a bearing on the issuer’s ability to generate cash flows are
considered while assigning ratings. Conceptually, these factors may be classified as business
risk, financial risk drivers, and management related factors. ICRA’s rating process places
considerable emphasis on evaluating business risks, as it does on evaluating the financial ratios.
For credit risk evaluation, stable businesses (low industry risk) even with lower level of cash
generation are viewed more favourably as compared with businesses with higher cash generation
potential but relatively high degree of volatility associated with such cash flows (higher industry
risk). This risk analysis is complemented by a cash flow analysis that seeks to capture the
adequacy of the issuer’s projected cash flows vis-à-vis its debt servicing obligations.
The risk analysis framework for a typical construction company may be depicted as follows:
BUSINESS RISK FINANCIAL RISK
-industry risk
-competitive position
-management quality
-new project risk
-financial position
-profitability
-capital structure
-financial capability
-future cashflow adequacy
Table:5.9
Some of the key risk factors that ICRA analyses while arriving at a Credit Rating are discussed
in the following sections.
Business Risk
The business risk that an issuer is exposed to is a combination of the industry risk in its major
product segments and its competitive position within the industry.

58
- Industry Risk
The objective here is to understand the attractiveness of the industry in which the issuer operates.
The aspects examined include:
• Intensity of competition
• Vulnerability to imports
• Regulatory risks
• Outlook for user industries
• Working capital intensity
• Overall prospects and outlook for the industry
The rating analysis begins with an evaluation of the business that the company is in.
The dynamics of the business influence a company’s operating risk to a large extent. The
analysis thus focuses on the overall industry prospects as well as the key success factors in the
industry.
- Issuer’s Competitive Position
An assessment of the issuer’s competitive position within an industry is made on the basis of its
operating efficiency as well as its market position. Some of the factors assessed are:
• Scale of operations
• Vintage of technology used
• Capital cost position
• Location advantage in terms of proximity to construction
• Operating efficiencies (yields, rejection rates, energy consumption, etc.)
• Market position as reflected in trends in market share, ability to command premium
pricing, extent of distribution network, and relationship with key customers
Usually, a peer comparison is carried out to evaluate each of the above factors.

59
Financial Risk
The objective here is to determine the issuer’s current financial position and its financial risk
profile. Some of the aspects analysed in detail in this context are:
Operating profitability: The analysis here focuses on determining the trend in the issuer’s
operating profitability and how the same appears by peer comparison.
Gearing: The objective here is to ascertain the level of debt in relation to the issuer’s own funds
and is viewed in conjunction with the business risks that the issuer is exposed to.
Debt service coverage ratios: Here, the trends in the issuer’s key debt service coverage ratios
like Interest Coverage and Net Cash Accruals/Total Debt are examined.
Working capital intensity: The analysis here evaluates the trends in the issuer’s key working
capital indicators like Receivables, Inventory and Creditors, again with respect to industry peers.
Accounting quality: Here, the Accounting Policies, Notes to Accounts, and Auditor’s
Comments are reviewed. Any deviation from the Generally Accepted Accounting Practices is
noted and the financial statements of the issuer are adjusted to reflect the impact of such
deviations.
Contingent liabilities/Off-balance sheet exposures: In this case, the likelihood of devolvement
of contingent liabilties/off-balance sheet exposures and the financial implications of the same are
evaluated.
Financial flexibility: The issuer’s financial flexibility—as reflected by it unutilised bank / credit
limits, liquid investments, and the nature of its relationship with banks, financial institutions and
other intermediaries—is assessed.
CONCLUSION:
ICRA’s credit ratings are a symbolic representation of its opinion on the relative
credit risk associated with the instrument being rated. This opinion is arrived at following a
detailed evaluation of the issuer’s business and financial risks, its competitive strengths, its likely
cash flows over the life of the instrument being rated, and the adequacy of such cash flows vis-à-
vis its debt servicing obligations.
3.CARE’S CREDIT RATING METHODOLOGY:
60
The term infrastructure projects is used to describe projects to provide water
supply, sanitation, solid waste management,power,bridges and roads, urban transport, bus
terminals, public housing, shopping complexes,ports and other public facilities.Infrastructure
services in India have been traditionally provided by public agencies operating at different levels
of government viz., local, state and central. These include municipalities, utility boards,
development authorities and government departments. For instance in India, water supply and
sanitation, is provided by different institutions in different areas. While generally, municipal
corporations are responsible for capital works and maintenance; a few cities have metropolitan
utility boards that undertake this function. In smaller cities, project implementation is done by
state level utility boards or the state’s Public Health Engineering Department whereas the
maintenance function is done by the local bodies. The term ‘municipal bodies’ is used to describe
local administrations or statutory undertakings providing civil or infrastructural services.
CARE undertakes rating exercise based on
• Information provided by the company
• In-house database and data from other sources that CARE considers reliable. CARE does
not undertake unsolicited ratings
• The primary focus of the rating exercise is to assess future cash generation capability and
their adequacy to meet debt obligations in adverse conditions.
• The analysis attempts to determine the long-term fundamentals and probabilities of
change in these fundamentals which could affect the credit worthiness of the borrower
• The analytical framework of CARE’s rating methodology is divided into two
interdependent segments. The first deals with the operational characteristics and the
second with the financial characteristics.
• Besides quantitative factors,qualitative aspects like assessment of management
capabilities play a very important role in arriving at the rating for an instrument.
• The relative importance of qualitative and quantitative components of the analysis varies
with the type of issuer
• Rating determination is a matter of experience and holistic judgement,based on the
relevant quantitative and qualitative factors affecting the credit quality of the issuer.
Financial analysis:

61
The term financial analysis is also known as analysis and interpretation of financial
statements. It refers to the establishing meaningful relationship between various items of the two
financial statements i.e. Income statement and position statement. It determines financial strength
and weaknesses of the firm.
Analysis of financial statements is an attempt to assess the efficiency and performance of
an enterprise. Thus, the analysis and interpretation of financial statements is very essential to
measure the efficiency, profitability financial soundness and future prospects of the business
units.
3.5.4 In addition Rating Agencies also does sectoral analysis as stated below:
Rating agencies has developed a rating methodology for debt issues of long term and
short term. The rating procedure is designed to facilitate appropriate credit risk assessment,
keeping in view the characteristics of the Indian infrastructure sector. Agencies rating looks at a
time horizon over the life of the debt instrument being rated and covers the following areas:
Demand analysis, Competition:
The viability of the road project is critically dependent on the extent and nature of benefits to the
users of the facility and their willingness to pay for the same. Agencies focus in rating toll road
debt issues is on traffic demand and potential variation of demand due to economic changes and
competition. The linkage of demand to toll pricing and the users willingness to pay is also
examined critically.
Demand Analysis
• Demand analysis involves analysis of the toll road region in terms of economic strength
and diversity. For this, regional wealth indicators like: level of industrialisation,
availability of facilitating infrastructure etc. Are examined. A sound and growing local
economy assures a high level of commercial and business travel, the mainstay for
revenue generation. Demand analysis is crucial as wrong estimation of demand or
deterioration in the economic base would result in flat or declining traffic flow, adversely
affecting debt servicing. Agencies traffic demand analysis is based on studies carried out
by reputed traffic consultants, with adequate experience.
62
• In order to comprehend risk, they considers it is essential to study the nature and
composition of traffic as well as volatility of traffic due to business cycles, natural factors
(floods, landslides, etc.), social unrest and escalation in fuel prices.
• While commercial traffic tends to serve as a stabilising force, they would favorably
consider a balance between commercial and private vehicle traffic. Commercial traffic is
less sensitive to toll increases than private traffic, since additional cost (tax deductible),
can be passed on to customers. As a general rule, a diverse traffic mix cushions the
impact of a decline in any one segment.
• Focus on demand and potential variation of demand due to economic changes, as the
most essential ingredient for commercially viable operation.
In such a case, the capital programmes of the appropriate state, regional and
local authorities are examined to factor in any possible competing facility. Covenants in the
Concession Agreement (CA) which explicitly prohibit the government from setting up
competing facilities upto a stipulated period will reduce the risk of the project.
Operating risks
Agencies believes that port operations carry unique operating risks which it analyses in detail:
• Susceptibility to the vagaries of weather and other natural hazards
• Proportion of firm commitments for cargo movement
• Ability of the operator to maintain optimum operating conditions
• Changes in global shipping practices
• Contract terms with the shipping lines
• Customer profile and degree of diversification
• Competition from any other alternative mode
• Technology
Operating risk covers the ability of the project to achieve the performance as envisaged. The
evaluation is done by
Considering the following factors.
(a) Technology

63
(b) Fuel supply arrangements:
- dedicated fuel linkages to the power plant;
- Proximity of the plant to fuel sources;
- Reliability of the transportation system to carry fuel from the source to the plant;
- Flexibility of the plant use alternative fuels; and
- In case of hydro electric power plants, the variability of rainfall in the catchment area and its
impact utilisation.
(c) Fuel cost risk arises when the PP is unable to pass on the rising cost of fuel to the purchaser.
Toassess such risk, sensitivity analysis is carried out to study the effect of rising cost on the
margins on the company.
Project implementation risk:
The risk associated with the completion of a Greenfield power project on time is quite high, due
to the long gestation period and large investments involved. They analyses the following factors
to estimate the risks associated with the completion of the project.
• The extent of tie-up for finance.
• Capability of the PP to raise additional resources in case of cost overruns.
• Contractor capability, based on technical and financial strengths as well as past
experience.
• Political risks.
• Environmental issues.
• Cushion provided in the financing plan and construction schedule for possible delays.
Financial Analysis
An in-depth analysis of the projected operations is undertaken to assess the ability of the port
operations to service its debt obligations. This would also entail a critical examination of the
underlying assumptions in context of the above factors. They would also examine the following
as part of its financial evaluation:
• Adequacy and stability of cash flow
• Coverage available for debt servicing

64
• Financial flexibility
• Comparison with other sectors
• Factors which could have a critical impact on the servicing ability
They will analyse each of the above factors and their linkages to arrive at the overall
assessment of credit quality. The reduction in credit risk due to any credit enhancement provided
is carefully evaluated before assigning the final rating.
While the methodology encompasses comprehensive technical, financial, commercial,
economic and management analysis, the credit rating is awarded by the rating committee on the
basis of an overall assessment of all aspects.
CHAPTER-4
OBJECTIVE OF THE STUDY
4.1 PRIMARY OBJECTIVE:
To know the credit worthiness of GMR infrastructure among the competitors by using
the credit rating methodology
4.2 SECONDARY OBJECTIVE:
To know the financial performance of the company.
To know the financial position of the concern.
To analyse the liquidity solvency position of the firm.
To study the working capital management of the firm.
To understand the profitability position and cash flow adequacy of the firm.
To know the competitive position and managerial capability of the issuer.
To understand the credit ratings given by the rating agency.

65
CHAPTER-5
RESEARCH METHODOLOGY
5.1 SCOPE OF THE STUDY:
The present study is intended to cover the 3 key competitors of gmr and comparing the
financial statements of the year 2010 and also an analysis and study of credit ratings of each
competitor along with the GMR Infrastructure ltd.
5.2 SOURCES OF DATA:
The project evaluates the credit ratings given by the rating agencies in India and finding
the rankings of the companies by using the credit rating methodologies like business analysis and
the financial analysis.
The data is the first hand information that has to be collected during the period of the
research. This data has been gathered through oral conversations with the employees in the
finance department.
Secondary data studies whole company records and company’s balance sheet in which
the project work has been done. In addition, a number of reference books, journals and reports
are also used to formulate the theoriotical model for the study and some information also drawn
from the websites.
5.3 TOOLS FOR THE STUDY:
Cross sectional and time-series analysis:
Weighted average ranking scale
Credit rating methodologies:
* financial analysis
-comparative financial statements

66
-ratio analysis
* business analysis
-swot analysis
CHAPTER-6
DATA ANALYSIS AND INTERPRETATION
6.1. Financial analysis using ratio analysis:
Ratio analysis is a powerful tool of financial analysis. A ratio is defined as “The
Indicated Quotient of Two Mathematical Expressions” and as “The Relationship between Two or
More Things”. In financial analysis, a ratio is used as a benchmark for evaluating the financial
position and performance of firm. The absolute accounting figures reported in the financial
statement do not provide a meaningful understanding of the performance and financial position
of a firm. The relationship between two accounting figures, expressed mathematically is known
as a financial ratio. Ratios help to summaries large quantities of financial data and to make
qualitative about the firm’s financial performance. The point to note is that a ratio reflecting a
quantitative relationship helps to form a qualitative judgment. Such is the nature of all financial
ratios.
6.1.1 Significance of Using Ratios:
The significance of a ratio can only truly be appreciated when:
1. It is compared with other ratios in the same set of financial statements.
2. It is compared with the same ratio in previous financial statements (trend analysis).
3. It is compared with a standard of performance (industry average). Such a standard
may be either the ratio which represents the typical performance of the trade or
industry, or the ratio which represents the target set by management as desirable for
the business.
6.1.2 Comparative balance sheet:
Comparative balance sheets as on two or more different dates can be used for
comparing assets, liabilities, capital and finding out any increase or decrease in those items. In

67
the words of Foulke “comparative balance sheet analysis is the study of the trend of the same
items, group of items and computed items in two or more balance sheets of the same business
enterprise on different dates”. Such analysis often yields valuable information as regards
progress of business concern
Comparative Balance sheet Rs in CrsPARTICULARS GMR JPASSO LANCO GVKsources of fundsshare holders fundsshare capital 366.74 424.93 238.547 157.97reserves and surplus 6300.32 8075.79 3106.226 2998deferred income 178.65preference shares issued by a subsidiary 200minority interest 1790.15 710.819 250.05loan fundssecured loans 16229.4 11358.01 7561.908 4430.48unsecured loans 4607.95 6550.7 799.469 15deferred payment liability 333.92deferred tax liability 956.08 100.303 89.01
Total29828.48
27365.51
12517.272
8119.16
application of fundsfixed assets:
gross block 14889.64
12847.14 6164.39 4841.12
less:revaluation reserveless:accumulated depreciation/amortization 2341.58 2228.46 1086.66 892.8
net block12548.06
10618.68 5077.73 3948.32
capital work-in-progress10382.87 3891.68
1328.088 1589.17
expenditure during construction 595.641 406.2922930.93
14510.36
7001.459
5943.78
Investments4641.05
5576.26
2022.892 1938.2
deferred tax asset(net) 80.47 32.83 0.52foreign currency monetary item translation difference account 0.53
81 32.83 0 0.52current assets,loans and advances
Inventories 115.92 1553.631626.708 35.47
projects under development 1356.05sundry debtors 864.93 2285.03 2226.99 67.56

68
7cash and bank balances 1682.62 3879.18 962.771 50.81other current assets 161.65 30.38 7.429 193.32
loans and advances 1315.63 3994.722180.029 93.81
4140.75
13098.99
7003.934 440.97
less:current liabilities and provisionsLiabilities 1582.14 5201.43 3411.51 180.55Provisions 383.11 651.46 99.503 23.76
1965.25
5852.89
3511.013 204.31
w.c:current assets-current liabilities(net current assets) 2175.5 7246.1
3492.921 236.66
Total29828.48
27365.55
12517.272
8119.16
Table:6.1
6.1.3 Comparative profit and loss account:
The profit and loss account is having an alternative term as revenue account. It shows
the inflows of money from the sale of goods or services and the cost and expenses chargeable
against it, over an accounting period and also we can say that profit and loss account is a report
of the company’s profit on the sale of their goods or the provision of their service over a trading
period, normally one year.
COMPARITIVE PROFIT AND LOSS ACCOUNT rs in crsPARTICULARS GMR JPASSO LANCO GVKIncome
sales and operating income 5123.42 3540.36 8107.5561786.6359
Revenue 6566.19 asbestes sheets of sales 82.36less:revenue share paid/payable to concessionaire grantors 556.91 75.536
4566.51 8032.02other income 163.39 1582.87 183.944 29.1825
net income 4729.9 11671.78 8215.9641815.8184
Expenditure increrase/decrease in stocks and work in progress 83.1exice duty on stocks 22.34 1054.231

69
2generation and operating expenses 2576.59 5703.62 6149.377selling and distribution expenses 683.86Personnal 665.29 23.9935administration and other expenses 625.61 619.35 431.148 240.112interest and finance charges(net) 722.33 1055.79 355.411 217.1depreciation/amortization 612.24 456.06 347.88 137.1201
4536.77 2382.37 7283.8161672.5668
prior period adjustments -0.7profit before taxation,minority interest and share of profits/losses of associates 193.13 2381.67 932.153 143.2616provision for taxationcurrent tax 70.76 439.69 311.027 24.1585less:MAT credit entitlement -4.41 60.372 -9.2deferred tax credit -98.56 233.62 82.822 0.2592income tax for earlier years 4.8052fringe benefit tax 0.417 -0.0142profit after taxation and before minority interest/share of profits/(losses) of associates 225.34 1708.36 567.87 123.2529share of profits/losses of associates -21.58 -17.797 51.6838minority interest-profits/losses -45.36 -91.524 -19.0621net profit after minority interest/share of profits/losses of associates 158.4 1708.36 458.549 155.8746surplus brought forward 778.36 1879.68 779.553 279.7382debenture redemption reserve no longer required 100profit available for appropriation 936.76 3638.04 1238.204appropriations:transfer from debenture redemption reserve -16.25 117.32transfer to debenture redemption reserve 24.41 483.44 -2.423transfer to general reserve 240 19transfer of profits on minority on dilutionof interest in subsidiaries 12.68preference dividend declared by a subsidiary 1.39dividend distribution tax 0.41 19.06available surplus carried to balance sheet 914.12 2645.03 1221.525 435.6128earnings per share 0.43 0.4 2.04 1.02
no of equity shares3667354392
2124634633
2407804920
1532189062
price value 62.35 150.45 54.15 44.85Table:6.2
6.1.4 Cash flow statements:

70
Financial statements that reflects the inflow of revenue and outflow of expenses resulting
from operating, investing and financing activities during a specific time period. Cash flow
statements express a business results or plans in terms of cash in and out of the business, without
adjusting for accrued revenues and expenses. It doesn’t shows whether the business will be
profitable, but it shows cash position of the business.
Cash flow statementsRs.in crs.
PARTICULARS GMR JPASSOLANCO GVK
a.cash flow from/(used in) operating activitiesprofit before taxation and minority interest/share profits/(losses) of associates 193.13 2006.79 932.15 143.26adjustments for:depreciation/amortization 612.24 492.36 347.88 137.12provision for diminution in value of investments 0.07 75.3 -1.98liabilities/provisions no longer required,written back -72.77 -1.885profit from sale of investments(net) -37.33 -8.49 -14.61 -0.78loss from sale of fixed assets 3.85 0.98 0.83 0.02interest on borrowings 1286.38profit on sale of beneficiary trusts -1316.35excess provisions/credit balance return back -0.62provision for doubtful advances and debts(net) 0.79 2.11employee compensation expenses 211.94 57.08effect of changes in exchange rates on transaltion of subsidiaries/joint ventures -21.97 75.53loss/gain of foreign exchanges -72.4 0.059bad debts writtenoff 11.45 2.66dividend income -1.58 -7.58 -7.09 -13.03other income -1.99
interest income-256.66 -158.4 -62.16 -6.76
mark to market losses on derivative instruments 25.93interest and finance charges 824.35 467.21 208.47operating profit before working capital changes 1283.5 2581.73
1724.64 468.408
adjustments for:

71
(increase)/decrease in inventories 15.96 -343.75-304.41 2.708
increase in projects under development -2652.68
increase in sundry debtors-210.86 -688.85 -121.03
trade and other receivables 6.56
-1292.01
increase in loans and advances -90.74 -1175.16 -35.78increase in current liabilities and provisions 304.35 1613.91 341.98 61.48cash generated used in operations 18.71 -658.23 470.2 375.78
direct taxes paid -51.1 -356.9-314.51 -21.99
net cash from operating activities1251.11 1015.13 155.61 353.78
b.cash flow from/(used in) investing activities
purchase of fixed assets
-6875.29 -1810.03
-1538.31 -813.34
sale/ transfer of fixed asset-10508.02 3.041
proceeds from sale fixed assets 2.79 8.21 0.008
purchase of investment-long term-456.11 -2958.86
-605.53 -1247.1
sale of shares held in trusts 1680.79 38.3miscellanous expenditure -29.95
refund of share application money-102.84 0.12
proceeds from sale of investments-long term 0.37 37.02 4.26
(purchase)/sale of investments-current(net)
-2718.49 1491.85
-628.58 0.78
intercorporate deposites given 121 30.621consideration paid on acquisition of subsidiaries
-185.95 37.843 -112.63
interest received 171.85 132.04 68.96 9.039dividend received 1.58 7.58 7.09 15.308other income 1.19direct taxes paid 223.71
net cash used in investing activities
-10059.25 9221.55
-2840.9
-2112.93
c.cash flow from/(used in)financing activitiesproceeds on issue of preference shares 300 311 727.3 705payment of debenture/share issue expenses -70.81 -14.24issue of common stock in consolidated entities 83.91 83.48
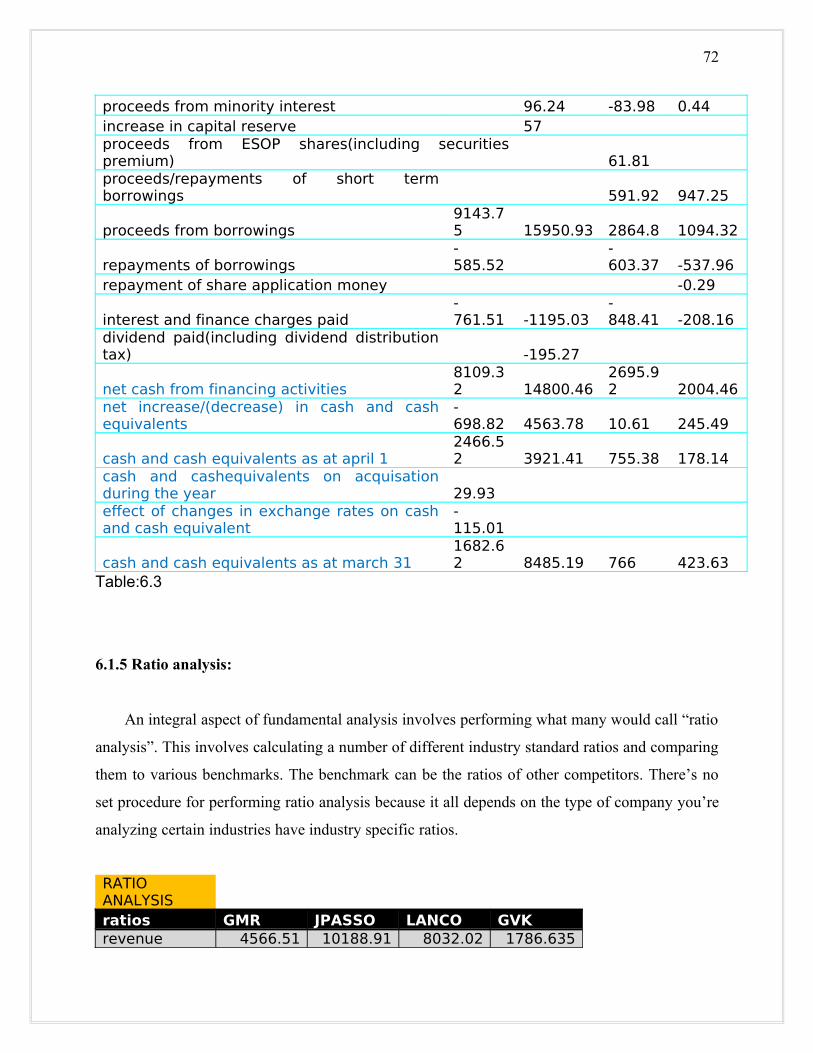
72
proceeds from minority interest 96.24 -83.98 0.44increase in capital reserve 57proceeds from ESOP shares(including securities premium) 61.81proceeds/repayments of short term borrowings 591.92 947.25
proceeds from borrowings9143.75 15950.93 2864.8 1094.32
repayments of borrowings-585.52
-603.37 -537.96
repayment of share application money -0.29
interest and finance charges paid-761.51 -1195.03
-848.41 -208.16
dividend paid(including dividend distribution tax) -195.27
net cash from financing activities8109.32 14800.46
2695.92 2004.46
net increase/(decrease) in cash and cash equivalents
-698.82 4563.78 10.61 245.49
cash and cash equivalents as at april 12466.52 3921.41 755.38 178.14
cash and cashequivalents on acquisation during the year 29.93 effect of changes in exchange rates on cash and cash equivalent
-115.01
cash and cash equivalents as at march 311682.62 8485.19 766 423.63
Table:6.3
6.1.5 Ratio analysis:
An integral aspect of fundamental analysis involves performing what many would call “ratio
analysis”. This involves calculating a number of different industry standard ratios and comparing
them to various benchmarks. The benchmark can be the ratios of other competitors. There’s no
set procedure for performing ratio analysis because it all depends on the type of company you’re
analyzing certain industries have industry specific ratios.
RATIO ANALYSISratios GMR JPASSO LANCO GVKrevenue 4566.51 10188.91 8032.02 1786.635

73
9ebitda 1364.31 2411.35 1451.50 468.30
ebitda margin 0.30
0.24
0.18
0.26
pat 225.34 1708.36 567.87 123.2529
roe 0.55
1.37
2.03
0.51
eps 0.61
8.04
2.36
0.80
debt 20,837.35
17,908.71
8,361.38
4,445.48
p/e 101.47
18.71
22.96
55.75
equity 8,657.21
8,500.72
4,055.59
3,584.67
D/E 2.41
2.11
2.06
1.24
roce 0.35
0.27
0.32
1.40
ebit 752.07
1,955.29
1,103.62
331.18
Price/Book value
2.64
3.76
3.21
1.92
book value 23.61
40.01
16.84
23.40
ev 44,010.83
45,994.66
21,147.69
11,516.59
mc 22,865.95
31,965.13
13,038.26
6,871.87
ev/ebitda 32.26
19.07
14.57
24.59
current ratio 2.11
2.24
1.99
2.16
asset efficiency
0.30
0.08
0.02
0.80
ocf ratio 0.64
0.17
0.04
1.73
ocm 0.24
0.29
0.02
0.20
cash ratio 0.86
1.45
0.22
2.07
basic earning power
0.18
0.15
0.16
0.75
opm 0.15
0.55
0.14
0.19
EBITDA/Intetrest
1.89
2.28
4.08
2.16
Table:6.4

74
1. EBITDA Margin:
A measurement of a company's operating profitability. It is equal to earnings
before interest, tax, depreciation and amortization (EBITDA) divided by total revenue. Because
EBITDA excludes depreciation and amortization, EBITDA margin can provide an investor with
a cleaner view of a company's core profitability.EBITDA margin measures the extent to which
cash operating expenses use up revenue
EBITDA MARGIN= EBITDA .
Total revenue
Chart:6.1
Notes:EBITDA Margin is to measure the extent to which cash operating expenses use up
revenues.
Inference:
Comparing the above graph the GMR is having the ratio of 0.30 as well as JPASSO-0.24,
LANCO-0.18 and GVK-0.26. Here GMR is highest in its EBITDA margin ratio comparing with

75
the other companies. so GMR is using revenue for their expenses.this is very useful for investors
to know the companies profitability position.
2.Return on equity:
The amount of net income returned as a percentage of shareholder’s equity.return on
equity measures a corporations profitability by revealing how much profit a company generates
with the money shareholder’s have invested.
ROE is calculated as:
Net income
Return on equity=______________________
Share holder’s equity
Chart:6.2
Notes: It shows how well the company uses investment funds to generate earnings growth.
Inference:

76
Comparing the above graph GMR is having the return on equity ratio as 0.55 as well as for
JPASSO-1.37, LANCO-2.03 and GVK-0.51.Here LANCO’s ratio is higher than the other
companies. so Lanco uses the investment funds to generate earnings growth
3.Price to earnings ratio:
A valuation ratio of a company's current share price compared to its per-share earnings.
Calculated as:
Price to earnings ratio= Market value per share .
Earnings per share
Chart:6.3
Notes:In general,a high P/E suggests that investors are expecting higher earnings growth in
future compared to the companies with lower P/E.
Inference:
By comparing the above graph GMR is having the price to earning ratio as 101.47 as well as for
JPASSO is having the ratio as 18.71 and for LANCO and GVK is 22.96 and 55.75 respectively.

77
Here GMR is highest comparing with the other companies.so for GMR investors are expecting
higher earnings growth in future period.
4.Debt to equity ratio:
A measure of a company’s financial leverage calculated by dividing its total liabilities by
stock holder’s equity.It indicates what proportion of equity and debt the company is using to
finance its assets.
Debt to equity ratio = Total liabilities .
Shareholder’s equity
A high debt/equity ratio generally means that a company has been aggressive in financing its
growth with debt.This can result in volatile earnings and additional growth.
Chart:6.4
Notes:Debt- equity ratio is that the low ratio of the company is exposing itself to large amount of
equity this is betterthan a high ratio of 2 or more.
Inference:
By comparing the above graph GMR is having the debt to equity ratio as 2.41 ,JPASSO is having
2.11 and for LANCO and GVK are having 2.06 and 1.24 respectively.Here GVK is having the

78
less debt so it is exposing itself to large amount of equity where as GMR is having high ratio so
one way to improve their situation would be to issue more debt and use the cash to buy back
some of its outstanding shares.
5.Return on capital employed:
This is considered to be the best measure of profitability in order to assess the over all
performance of the business. As the primary objective business is to earn profit higher the Return
On Capital Employed, the more efficient the firm is in using its funds.
Return on capital employed= earnings before interest and tax .
Net current assets
Chart:6.5
Notes:A ratio indicates the efficiency and profitability of companies capital investments.roce
always should be higher than the rate at which the company borrows.
Inference:
By comparing the above graph GMR is having the ROCE as 0.35,JPASSO is having 0.27 as well
as LANCO and GVK are having 0.32 and 1.40 respectively.Here GVK is having the high ratio
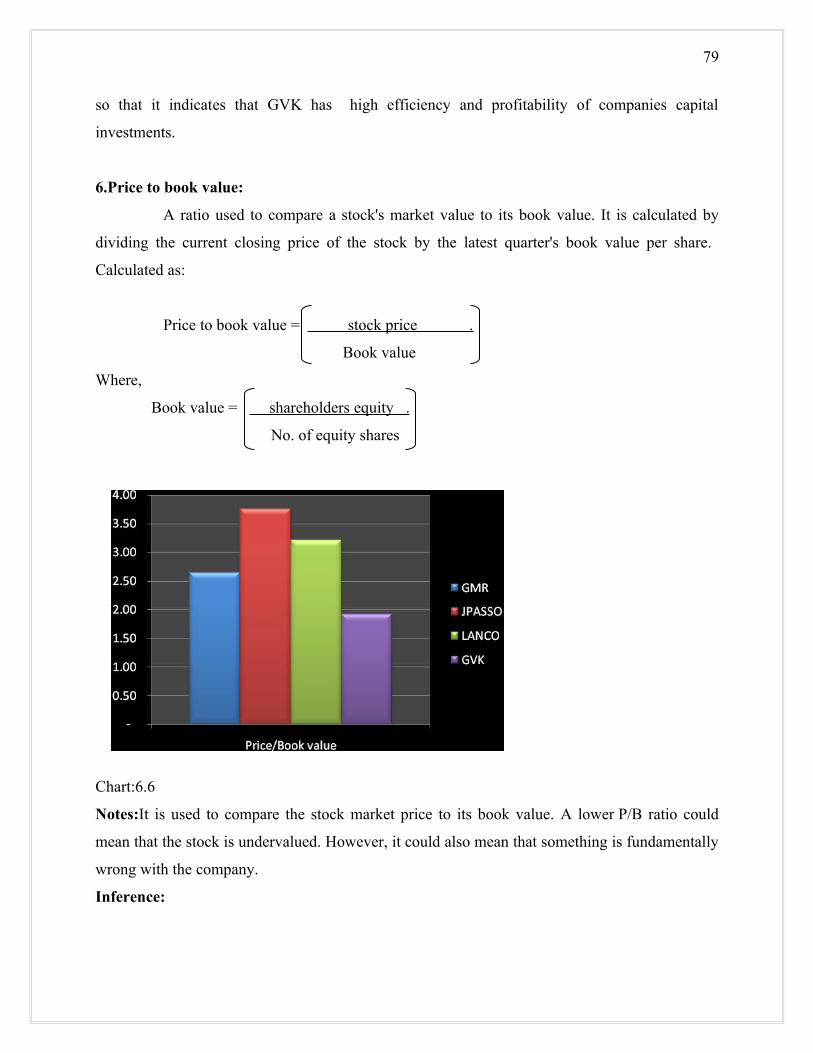
79
so that it indicates that GVK has high efficiency and profitability of companies capital
investments.
6.Price to book value:
A ratio used to compare a stock's market value to its book value. It is calculated by
dividing the current closing price of the stock by the latest quarter's book value per share.
Calculated as:
Price to book value = stock price .
Book value
Where,
Book value = shareholders equity .
No. of equity shares
Chart:6.6
Notes:It is used to compare the stock market price to its book value. A lower P/B ratio could
mean that the stock is undervalued. However, it could also mean that something is fundamentally
wrong with the company.
Inference:

80
By comparing the above graph GMR is having the price to book value as 2.64 ,JPASSO is
having 3.76,LANCO is 3.21 ratio and GVK is having 1.92.Here JPASSO is having the high ratio
than others and remaining all three companies having the lower ratio so that the stock is
undervalued and also mean that something is fundamentally wrong with the company.
7.EV/EBITDA:
EV/EBITDA is a measure of the cost of a stock which is more frequently valid for
Comparisions across companies than the price to earnings ratio.like the P/E ratio, the
EV/EBITDA ratio is a measure of how expensive a stock is.it measures the price in the form of
enterprise value an investor pays for the benefit of the company’s cash flow in the form of
EBITDA
Calculated as:
EV/EBITDA= Enterprise value .
Earnings before interest and tax depreciation amortization
Chart:6.7
Notes:It is a measure of how expensive a stock is.it measures the price an investor pays for the
benefit of the companies cashflow.
Inference:
From the above graph the GMR is having the EV/EBITDA as 32.26,JPASSO as 19.07 ,LANCO
is having 14.57 and GVK as 24.59.by comparing all the four companies GMR is having high

81
ratio with 32.36 so GMR stock is expensive than other companies and investors will pay the
price for the benefit of the companies cashflows
8.Operating cash flow:
A measure of how well current liabilities are covered by the cash flow generated from the
company’s operations.
Formula: OCF Ratio = cash flow from operations .
Current liabilities
The operating cash flow ratio can gauge a company's liquidity in the short term. Using cash flow
as opposed to income is sometimes a better indication of liquidity simply because, as we
know, cash is how bills are normally paid off.
Chart:6.8
Notes:It is to measure how well the current liabilities are covered by the cashflow generated
from the company’s operations.
Inference:

82
From the above graph GMR is having the operating cashflow ratio as 0.64,JPASSO as
0.17,LANCO as 0.04 and GVK is having the ratio as 1.73.by comparing all the four companies
GVK is having the highest ratio.so that the current liabilities are covered by the cashflow
generated from the company’s operations.
9.Current ratio:
The current ratio is the ratio of total current assets to total current liabilities. It is
calculated by dividing current assets by current liabilities:
Current assets
Current Ratio = ________________
Current liabilities
Chart:6.9
Notes:This ratio measures the ability to pay its current liabilities.the ideal current ratio is 2:1
i.e,current asset must be twice current liabilities.if the current ratio is less ,the short term
financial position is not supposed to be very sound.
Inference:
From the above graph GMR is having the current ratio as 2.11,JPASSO as 2.24,LANCO is
having the ratio as 1.99 and the GVK as 2.16.by comparing all the four ratios JPASSO is having
the high raio so that the company is having ability to pay its current liabilities and LANCO is
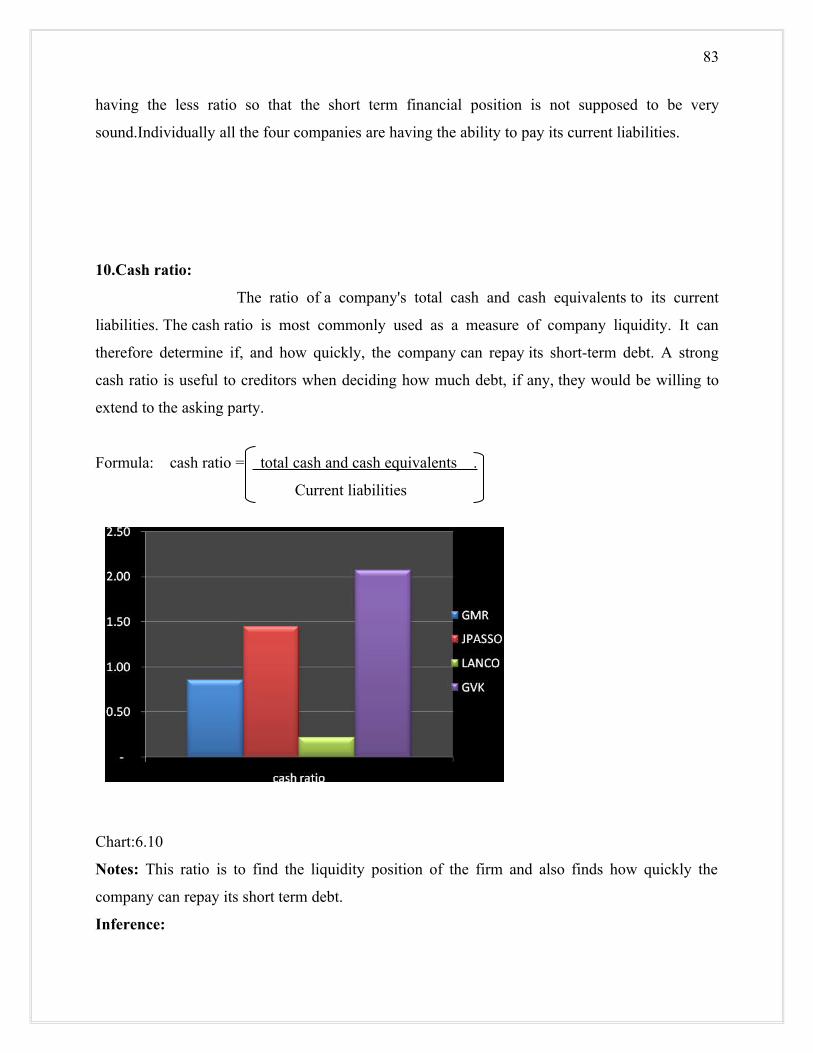
83
having the less ratio so that the short term financial position is not supposed to be very
sound.Individually all the four companies are having the ability to pay its current liabilities.
10.Cash ratio:
The ratio of a company's total cash and cash equivalents to its current
liabilities. The cash ratio is most commonly used as a measure of company liquidity. It can
therefore determine if, and how quickly, the company can repay its short-term debt. A strong
cash ratio is useful to creditors when deciding how much debt, if any, they would be willing to
extend to the asking party.
Formula: cash ratio = total cash and cash equivalents .
Current liabilities
Chart:6.10
Notes: This ratio is to find the liquidity position of the firm and also finds how quickly the
company can repay its short term debt.
Inference:

84
From the above graph GMR is having the cas ratio as 0.86 ,JPASSO as 1.45,LANCO as 0.22 and
GVK as 2.07.by comparing all the four companies we have GVK with high ratio so the liquidity
position of the firm is high and also the company can repay its short term debt very quickly.
11.Asset efficiency ratio:
The asset efficiency ratio provides an indication of how well the assets of a company
are utilized to generate a cash flow return.
Formula: asset efficiency ratio = cash flow from operations.
Total assets
Chart:6.11
Notes: The cfo and finance area must continually look at the companies efficiency.it is to know
how well the company is using the assets and liabilities internally.
Inference:
From the above graph GMR is having the asset efficiency ratio as 0.30,JPASSO as 0.08,LANCO
as 0.02 and GVK is having the ratio as 0.80.by comparing the ratios the GVK is having high
ratio so that the company is using assets and liabilities internally.

85
12.Operating cash margin:
The operating cash margin ratio highlights the timing of cash flows with respect to the
timing of sales.
Formula:
Operating cash margin = cash flow from operations .
Sales
Chart:6.12
Notes:This ratio is to evaluate the cash management performance as well as credit granting
policies and receivable collection.
Inference:
From the above graph GMR is having the operating cash margin ratio as 0.24,JPASSO as
0.29,LANCO as 0.02 and GVK is having ratio as 0.20.By comparing all the four ratios JPASSO
is having the high ratio so that the cash management performance is going well.

86
13.Operating profit margin:
Company is used to measure a company’s pricing strategy and operating efficiency
Calculated as:
Operating profit margin = earnings before interest and tax .
Net sales
Operating profit margin is a measurement of what proportion of a company's revenue is
left over after paying for variable costs of production such as wages, raw materials, etc.
Chart:6.13
Notes:It indicates how effective a company is at controlling the costs and expenses associated
with their normal business operations.

87
Inference:
From the above graph GMR is having the operating profit margin as 0.15,JPASSO as 0.55
,LANCO as 0.14 and the GVK is having the ratio as 0.19.by comparing all the four ratios
JPASSO is having higher ratio with 0.55 so the company is very effective at controlling the costs
and expenses associated with their normal business operations
14.Basic earning power:
The basic earning power ratio compares earnings apart from the influence of taxes or
financial leverage,to the assets of the company.
Formula:
Basic earning power = earnings before tax and interests .
Total assets
The ratio indicates basic probability of assets and is useful in comparing firms with different
degree of leverage.
Chart:6.14

88
Notes:A business ability to generate profit from conducting its operations.earning power is to
analyze stocks to assess whether the underlying company is worthy of investment.
Inference:From the above graph GMR is having the basic earning ratio as 0.18,JPASSO as
0.15,LANCO as 0.16 and GVK is having the ratio as 0.75.by comparing the all companies GVK
is having the high ratio with 0.75 so the company is having ability to generate profit from
conducting operations so this is worthy of investment
15.EBITDA to interest coverage ratio:
The ratio that is used to assess a company’s financial durability by examining whether
it is at least profitably enough to pay off its interest expenses.
Formula:
EBITDA to interest coverage ratio= EBITDA .
Interest payments
A ratio greater than 1 indicates that the company has morethan enough interest coverage to
pay off its interest expenses.
Table:6.15
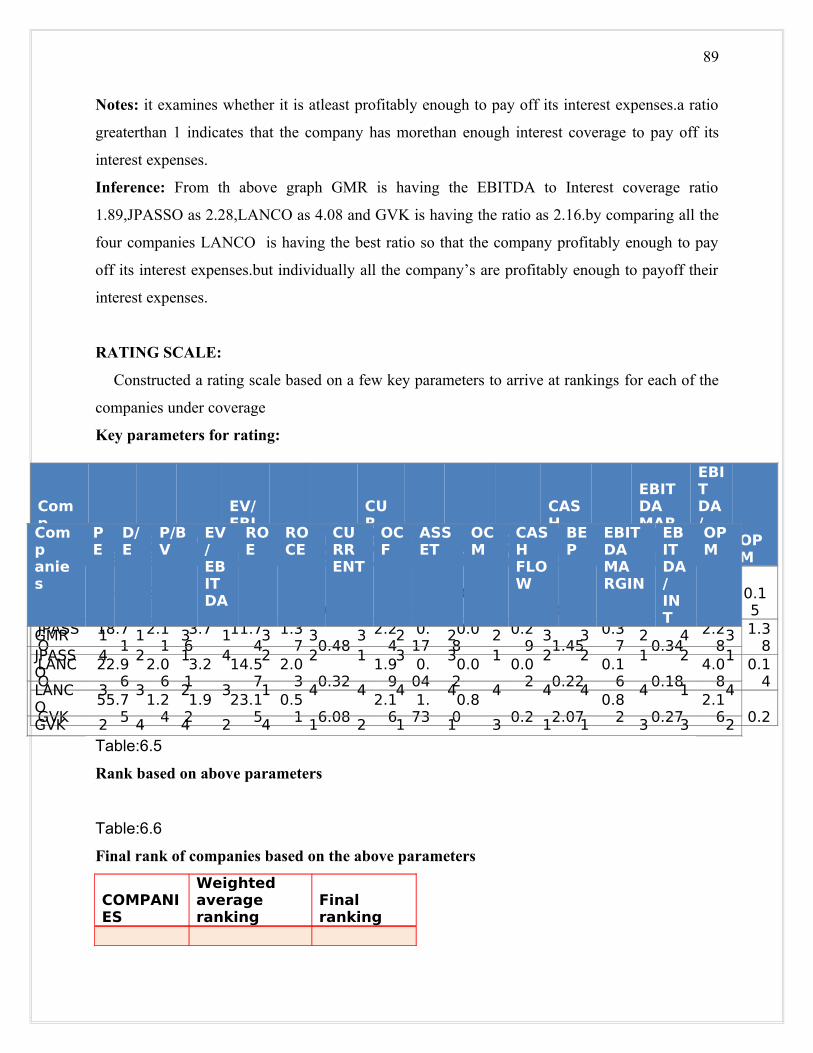
89
Notes: it examines whether it is atleast profitably enough to pay off its interest expenses.a ratio
greaterthan 1 indicates that the company has morethan enough interest coverage to pay off its
interest expenses.
Inference: From th above graph GMR is having the EBITDA to Interest coverage ratio
1.89,JPASSO as 2.28,LANCO as 4.08 and GVK is having the ratio as 2.16.by comparing all the
four companies LANCO is having the best ratio so that the company profitably enough to pay
off its interest expenses.but individually all the company’s are profitably enough to payoff their
interest expenses.
RATING SCALE:
Constructed a rating scale based on a few key parameters to arrive at rankings for each of the
companies under coverage
Key parameters for rating:
Table:6.5
Rank based on above parameters
Table:6.6
Final rank of companies based on the above parameters
COMPANIES
Weighted average ranking
Final ranking
Comp anies PE
D/E
P/BV
EV/ EBIT DA
ROE
ROCE
CUR RENT
OCF
ASSET
OCM
CASH FLOW
BEP
EBITDA MARGIN
EBITDA/INT
OPM
GMR101.
52.4
1 2.64
32.26
0.55 0.35
2.11
0.64
0.30
0.24 0.86
0.18 0.3
1.89
0.15
JPASSO
18.71
2.11
3.76
11.74
1.37 0.48
2.24
0.17
0.08
0.29 1.45
0.37 0.34
2.28
1.38
LANCO
22.96
2.06
3.21
14.57
2.03 0.32
1.99
0.04
0.02
0.02 0.22
0.16 0.18
4.08
0.14
GVK55.7
51.2
4 1.92
23.15
0.51 6.08
2.16
1.73
0.80 0.2 2.07
0.82 0.27
2.16 0.2
Comp anies
PE
D/E
P/BV
EV/ EBITDA
ROE
ROCE
CURR ENT
OCF
ASSET
OCM
CASH FLOW
BEP
EBITDA MARGIN
EBIT DA/ INT
OPM
GMR 1 1 3 1 3 3 3 2 2 2 3 3 2 4 3JPASSO
4 2 1 4 2 2 1 3 3 1 2 2 1 2 1
LANCO
3 3 2 3 1 4 4 4 4 4 4 4 4 1 4
GVK 2 4 4 2 4 1 2 1 1 3 1 1 3 3 2
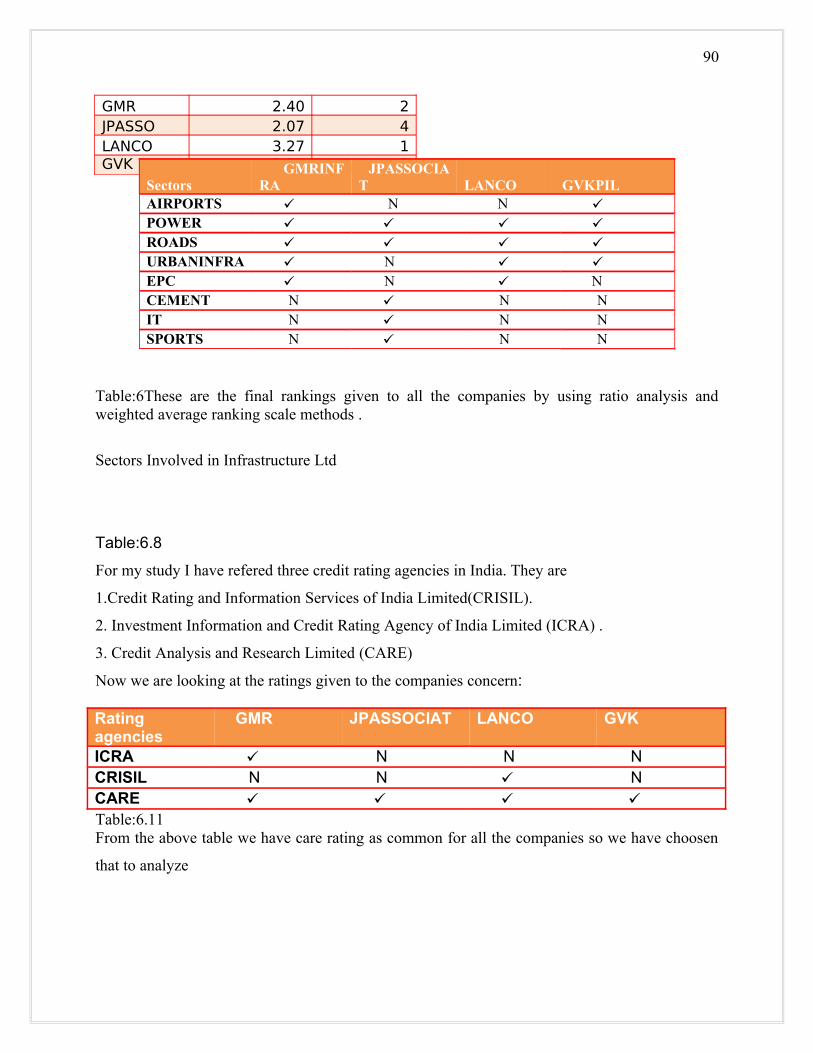
90
GMR 2.40 2JPASSO 2.07 4LANCO 3.27 1GVK 2.27 3
Table:6These are the final rankings given to all the companies by using ratio analysis and weighted average ranking scale methods .
Sectors Involved in Infrastructure Ltd
Table:6.8
For my study I have refered three credit rating agencies in India. They are
1.Credit Rating and Information Services of India Limited(CRISIL).
2. Investment Information and Credit Rating Agency of India Limited (ICRA) .
3. Credit Analysis and Research Limited (CARE)
Now we are looking at the ratings given to the companies concern:
Rating agencies
GMR JPASSOCIAT LANCO GVK
ICRA N N N CRISIL N N NCARE Table:6.11From the above table we have care rating as common for all the companies so we have choosen
that to analyze
Sectors GMRINFRA
JPASSOCIAT
LANCO
GVKPIL
AIRPORTS N N POWER ROADS URBANINFRA N EPC N NCEMENT N N NIT N N NSPORTS N N N

91
Table:6.12
CARE RATINGSCOMPANIES
RATINGS
AMOUNT(rs.crores) INSTRUMENTS
GMRINFRA A(SO) 132
secured non-convertible debenture
JPASSOCIAT A+ 500 long term bank facilities
LANCO A- 100long term non-convertible debenture
GVKPIL PR2+ 125 short term bank facilities
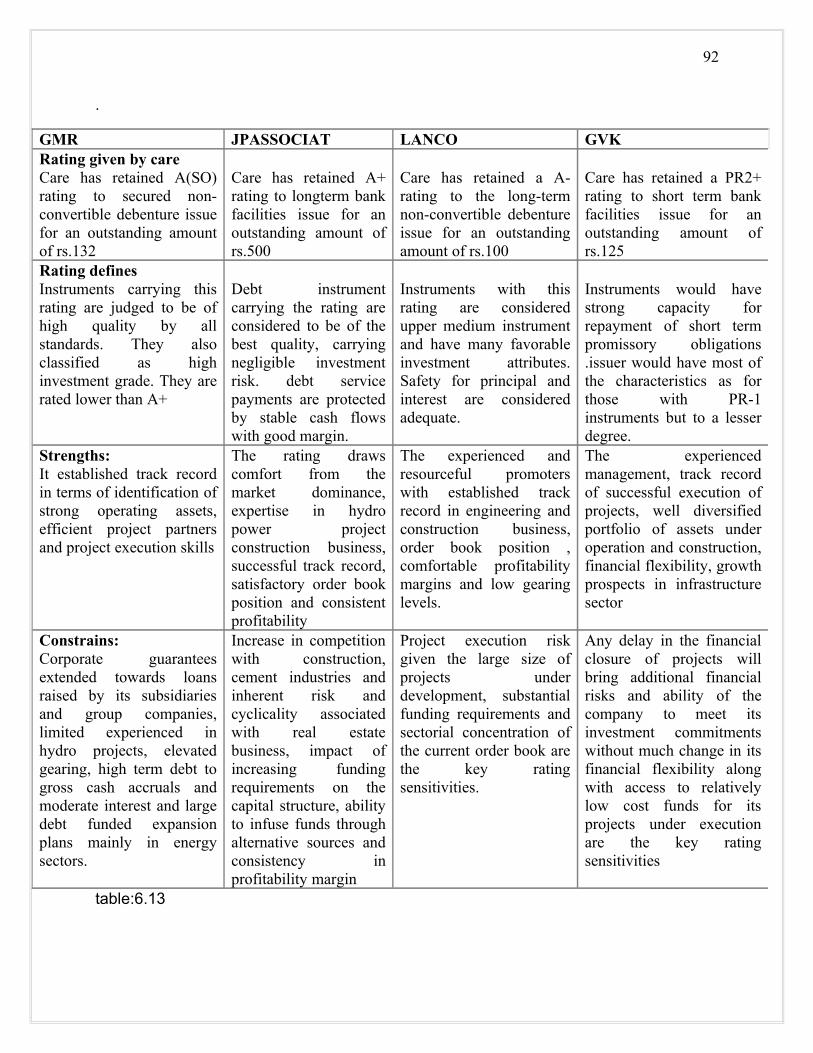
92
.
table:6.13
GMR JPASSOCIAT LANCO GVKRating given by careCare has retained A(SO) rating to secured non-convertible debenture issue for an outstanding amount of rs.132
Care has retained A+ rating to longterm bank facilities issue for an outstanding amount of rs.500
Care has retained a A- rating to the long-term non-convertible debenture issue for an outstanding amount of rs.100
Care has retained a PR2+ rating to short term bank facilities issue for an outstanding amount of rs.125
Rating definesInstruments carrying this rating are judged to be of high quality by all standards. They also classified as high investment grade. They are rated lower than A+
Debt instrument carrying the rating are considered to be of the best quality, carrying negligible investment risk. debt service payments are protected by stable cash flows with good margin.
Instruments with this rating are considered upper medium instrument and have many favorable investment attributes. Safety for principal and interest are considered adequate.
Instruments would have strong capacity for repayment of short term promissory obligations .issuer would have most of the characteristics as for those with PR-1 instruments but to a lesser degree.
Strengths:It established track record in terms of identification of strong operating assets, efficient project partners and project execution skills
The rating draws comfort from the market dominance, expertise in hydro power project construction business, successful track record, satisfactory order book position and consistent profitability
The experienced and resourceful promoters with established track record in engineering and construction business, order book position , comfortable profitability margins and low gearing levels.
The experienced management, track record of successful execution of projects, well diversified portfolio of assets under operation and construction, financial flexibility, growth prospects in infrastructure sector
Constrains:Corporate guarantees extended towards loans raised by its subsidiaries and group companies, limited experienced in hydro projects, elevated gearing, high term debt to gross cash accruals and moderate interest and large debt funded expansion plans mainly in energy sectors.
Increase in competition with construction, cement industries and inherent risk and cyclicality associated with real estate business, impact of increasing funding requirements on the capital structure, ability to infuse funds through alternative sources and consistency in profitability margin
Project execution risk given the large size of projects under development, substantial funding requirements and sectorial concentration of the current order book are the key rating sensitivities.
Any delay in the financial closure of projects will bring additional financial risks and ability of the company to meet its investment commitments without much change in its financial flexibility along with access to relatively low cost funds for its projects under execution are the key rating sensitivities
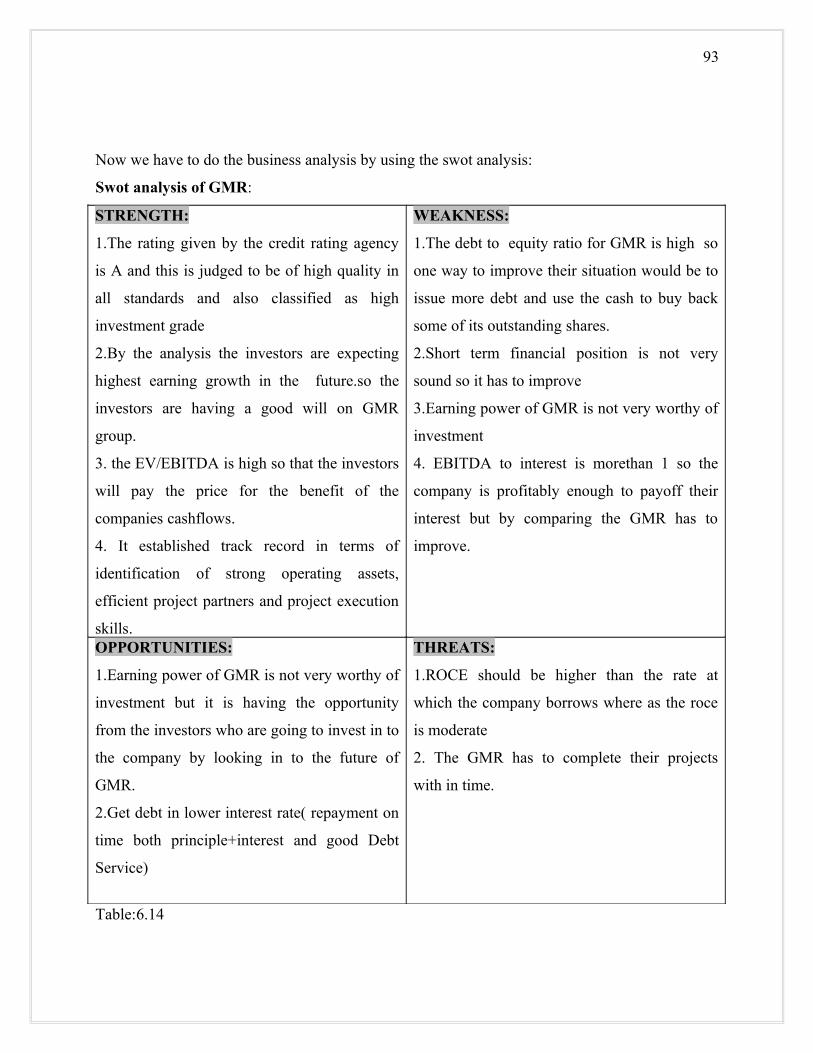
93
Now we have to do the business analysis by using the swot analysis:
Swot analysis of GMR:
STRENGTH:
1.The rating given by the credit rating agency
is A and this is judged to be of high quality in
all standards and also classified as high
investment grade
2.By the analysis the investors are expecting
highest earning growth in the future.so the
investors are having a good will on GMR
group.
3. the EV/EBITDA is high so that the investors
will pay the price for the benefit of the
companies cashflows.
4. It established track record in terms of
identification of strong operating assets,
efficient project partners and project execution
skills.
WEAKNESS:
1.The debt to equity ratio for GMR is high so
one way to improve their situation would be to
issue more debt and use the cash to buy back
some of its outstanding shares.
2.Short term financial position is not very
sound so it has to improve
3.Earning power of GMR is not very worthy of
investment
4. EBITDA to interest is morethan 1 so the
company is profitably enough to payoff their
interest but by comparing the GMR has to
improve.
OPPORTUNITIES:
1.Earning power of GMR is not very worthy of
investment but it is having the opportunity
from the investors who are going to invest in to
the company by looking in to the future of
GMR.
2.Get debt in lower interest rate( repayment on
time both principle+interest and good Debt
Service)
THREATS:
1.ROCE should be higher than the rate at
which the company borrows where as the roce
is moderate
2. The GMR has to complete their projects
with in time.
Table:6.14

94
Swot analysis for lanco:
Strengths:
1. The rating draws comfort from the market
dominance, expertise in hydro power project
construction business, successful track record,
satisfactory order book position and consistent
profitability
2.The company uses its investment funds to
generate the earnings growth
3.LANCO is having the high EBITDA to
interest ratio so that the company is profitably
enough to payoff their interest expenses
Weakness:
1.Lanco uses only less revenue for their
expenses.
2.The financial ,profitability position are not
very sound.
3.The company is not at all worthy for an
investment
4.The cash management performance is very
low.
5.The company doesn’t know to control the
costs and expenses associated with their
operations.Opportunities:
1.Price/book value is to compare the stock
market value to the book value it is moderate
for lanco
2.There is a chance to investors to expect
earnings growth in the future. And stock value
should be moderate.
Threats:
1.The debt/equity is at high so that it would
expose the company to risk such as interest rate
increases and creditor nervousness.
2.Corporate efficiency is not yet present in the
company Project execution risk given the large
size of projects under development, substantial
funding requirements and sectorial
concentration of the current order book are the
key rating sensitivities
Table:6.15
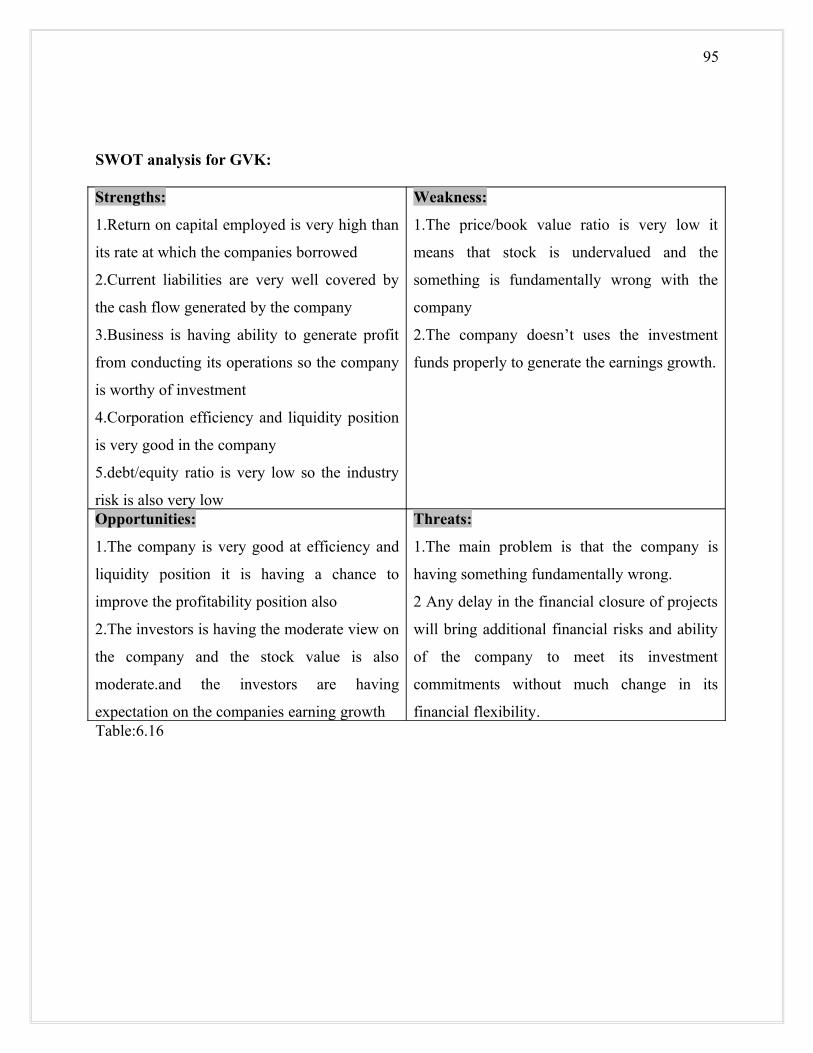
95
SWOT analysis for GVK:
Strengths:
1.Return on capital employed is very high than
its rate at which the companies borrowed
2.Current liabilities are very well covered by
the cash flow generated by the company
3.Business is having ability to generate profit
from conducting its operations so the company
is worthy of investment
4.Corporation efficiency and liquidity position
is very good in the company
5.debt/equity ratio is very low so the industry
risk is also very low
Weakness:
1.The price/book value ratio is very low it
means that stock is undervalued and the
something is fundamentally wrong with the
company
2.The company doesn’t uses the investment
funds properly to generate the earnings growth.
Opportunities:
1.The company is very good at efficiency and
liquidity position it is having a chance to
improve the profitability position also
2.The investors is having the moderate view on
the company and the stock value is also
moderate.and the investors are having
expectation on the companies earning growth
Threats:
1.The main problem is that the company is
having something fundamentally wrong.
2 Any delay in the financial closure of projects
will bring additional financial risks and ability
of the company to meet its investment
commitments without much change in its
financial flexibility. Table:6.16
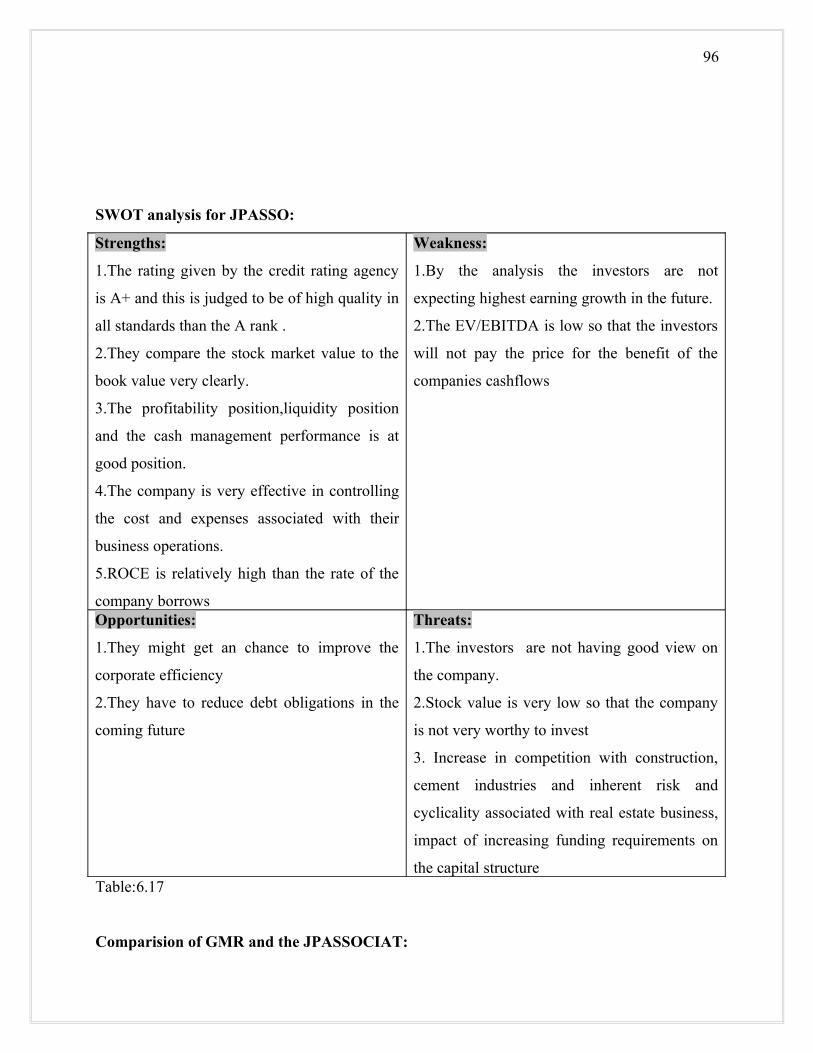
96
SWOT analysis for JPASSO:
Strengths:
1.The rating given by the credit rating agency
is A+ and this is judged to be of high quality in
all standards than the A rank .
2.They compare the stock market value to the
book value very clearly.
3.The profitability position,liquidity position
and the cash management performance is at
good position.
4.The company is very effective in controlling
the cost and expenses associated with their
business operations.
5.ROCE is relatively high than the rate of the
company borrows
Weakness:
1.By the analysis the investors are not
expecting highest earning growth in the future.
2.The EV/EBITDA is low so that the investors
will not pay the price for the benefit of the
companies cashflows
Opportunities:
1.They might get an chance to improve the
corporate efficiency
2.They have to reduce debt obligations in the
coming future
Threats:
1.The investors are not having good view on
the company.
2.Stock value is very low so that the company
is not very worthy to invest
3. Increase in competition with construction,
cement industries and inherent risk and
cyclicality associated with real estate business,
impact of increasing funding requirements on
the capital structureTable:6.17
Comparision of GMR and the JPASSOCIAT:

97
GMR JAYPEE1.The credit rating retained by the care agency
is A(SO) rating to secured non-convertible
debenture issue for an outstanding amount of
rs.132
1. Care has retained A+ rating to longterm
bank facilities issue for an outstanding amount
of rs.500
2. Instruments carrying this rating are judged
to be of high quality by all standards. They
also classified as high investment grade. They
are rated lower than A+
2. Debt instrument carrying the rating are
considered to be of the best quality, carrying
negligible investment risk. debt service
payments are protected by stable cash flows
with good margin.3.comparatively EBITDA to interest ratio is
low
3.EBITDA to interest ratio is high these are
enough to payoff their interest4.for GMR the investors are expecting more
earnings growth in the future
4.relatively for JPASSO the investors are not
expecting more earnings growth in the future5.stock value is going to very expensive 5.stock value is going to be very cheap6.the profitability position,liquidity position
and cash management performance are in
moderate position
6.The profitability position,liquidity position
and cash management performance are in very
good position7.it is not very much effective to controlthe
costs and expenses associated with the normal
operations
7.it is very effective to control the costs and the
expenses associated with the normal
operations.8.earning power is very low so that it is not
worthy of investment
8.earning power is relatively high so it is
moderatly worthy of investment9.the debt/equity ratio is high 9.the debt/equity ratio is relatively low so the
company is having a less amount of riskTable:6.18
Comparision of GMR and LANCO:
GMR LANCO1. The credit rating retained by the care agency
is A(SO) rating to secured non-convertible
1. Care has retained a A- rating to the long-
term non-convertible debenture issue for an
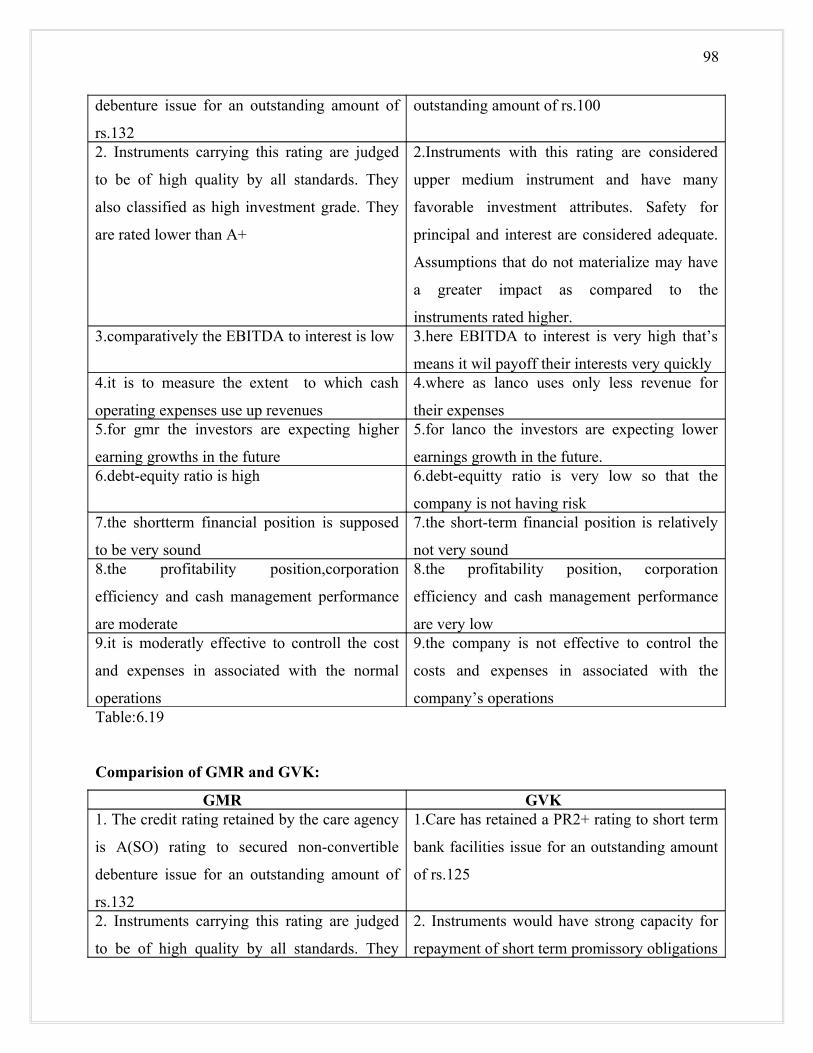
98
debenture issue for an outstanding amount of
rs.132
outstanding amount of rs.100
2. Instruments carrying this rating are judged
to be of high quality by all standards. They
also classified as high investment grade. They
are rated lower than A+
2.Instruments with this rating are considered
upper medium instrument and have many
favorable investment attributes. Safety for
principal and interest are considered adequate.
Assumptions that do not materialize may have
a greater impact as compared to the
instruments rated higher.3.comparatively the EBITDA to interest is low 3.here EBITDA to interest is very high that’s
means it wil payoff their interests very quickly4.it is to measure the extent to which cash
operating expenses use up revenues
4.where as lanco uses only less revenue for
their expenses5.for gmr the investors are expecting higher
earning growths in the future
5.for lanco the investors are expecting lower
earnings growth in the future.6.debt-equity ratio is high 6.debt-equitty ratio is very low so that the
company is not having risk7.the shortterm financial position is supposed
to be very sound
7.the short-term financial position is relatively
not very sound8.the profitability position,corporation
efficiency and cash management performance
are moderate
8.the profitability position, corporation
efficiency and cash management performance
are very low9.it is moderatly effective to controll the cost
and expenses in associated with the normal
operations
9.the company is not effective to control the
costs and expenses in associated with the
company’s operationsTable:6.19
Comparision of GMR and GVK:
GMR GVK1. The credit rating retained by the care agency
is A(SO) rating to secured non-convertible
debenture issue for an outstanding amount of
rs.132
1.Care has retained a PR2+ rating to short term
bank facilities issue for an outstanding amount
of rs.125
2. Instruments carrying this rating are judged
to be of high quality by all standards. They
2. Instruments would have strong capacity for
repayment of short term promissory obligations

99
also classified as high investment grade. They
are rated lower than A+
.issuer would have most of the characteristics
as for those with PR-1 instruments but to a
lesser degree.3. it is to measure the extent to which cash
operating expenses use up revenues
3.where as gvk uses the revenue for their
expenses were relatively low4.the company uses the investment funds
moderatly to generate earnings growth
4.the company uses the investment funds
relatively low to generate earning growth5. for gmr the investors are expecting higher
earning growths in the future
5.for gvk the investors are expecting moderate
earning growth in the future6.debt-equity ratio is relatively low so that the
risk involved
6.debt-equity ratio is very high so it is having
less amount of equity and there is risk
involved7.price-book value ratio is high so that the
company fundamentals are going right
7.where as the ratio is very low so that the
stock is undervalued and something is
fundamentally wrong in the company8.profitability position and cash mangement
performance are high
8.profitabilitty position and cash management
performance are relatively low9.gmr stock is very expensive 9.gvk stock is moderatly expensiveTable:6.20
CHAPTER-7
FINDINGS OF THE STUDY
1. The GMR credit worthiness is 2 when compared along with all the three competitors by doing
the analysis and by comparing with ratings given by the agencies.
2. The GMR is uses moderate revenue for their expenses.
3. The GMR is not using more investment funds to generate earnings growth.
4. Price-earnings ratio is very high in GMR.so it means that investors are expecting higher
earnings growth in the future.

100
5. Debt-equity ratio is high so, GMR is exposing itself to large amount of equity so that, the
company is not having risk.
6. Stock is very expensive it means that the price an investors pays to the benefit of the
company’s cash flow.
7. The profitability position of the GMR is moderate among the competitors.
8. The GMR is not very worthy of investment because there is no ability to generate profits from
conducting its operations.
9. The corporation’s efficiency is good at GMR because they are using its assets and liabilities
internally.
10. The liquidity position of the company is moderate and short term financial position is not
very sound. it indicates of working capital.
11. The cash management performance, credit granting policies, receivable collections are in the
2nd position by comparing with the competitors.
12. The asset efficiency and basic earnings are moderate.
13. The competitive position of GMR is good compared with the competitors concern
14. The managerial capability of issuer is very good at GMR.
CHAPTER-8
SUGGESTIONS, RECOMMENDATIONS AND CONCLUSION
8.1 Suggestions and recommendations:
1. The liquidity position of the company can be utilized in a better or other effective
manner.
2. The company can be utilized the investment funds to increase their earnings growth.
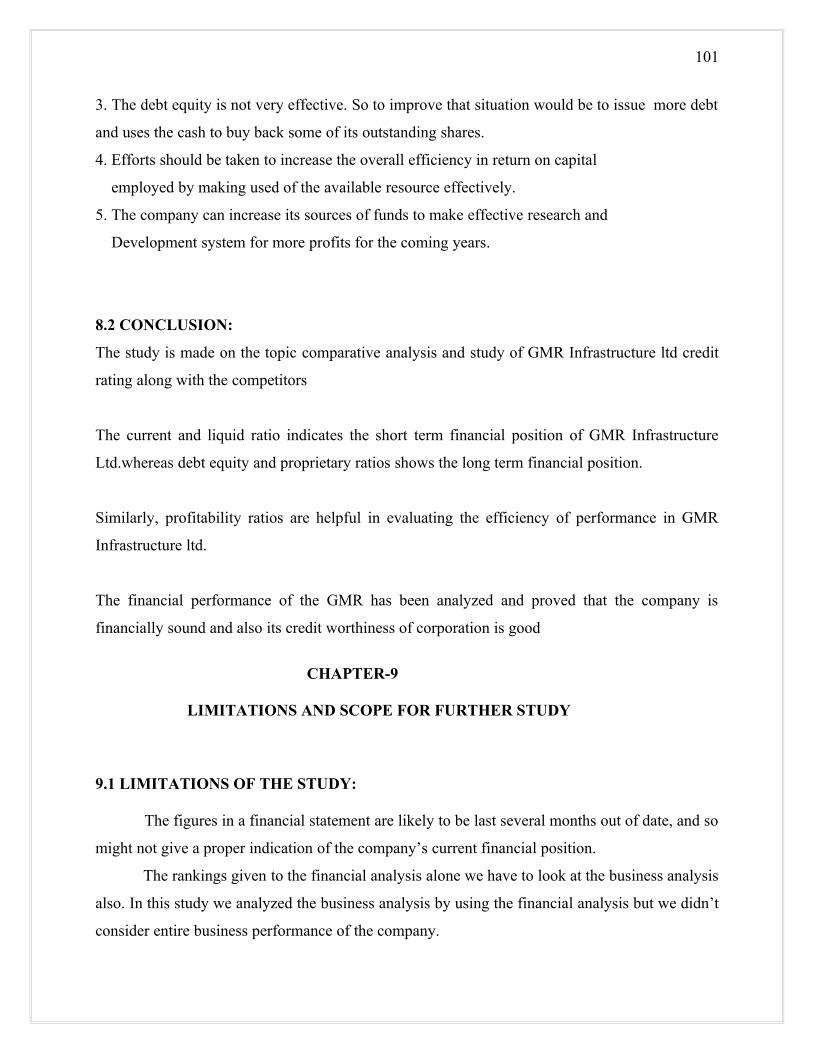
101
3. The debt equity is not very effective. So to improve that situation would be to issue more debt
and uses the cash to buy back some of its outstanding shares.
4. Efforts should be taken to increase the overall efficiency in return on capital
employed by making used of the available resource effectively.
5. The company can increase its sources of funds to make effective research and
Development system for more profits for the coming years.
8.2 CONCLUSION:
The study is made on the topic comparative analysis and study of GMR Infrastructure ltd credit
rating along with the competitors
The current and liquid ratio indicates the short term financial position of GMR Infrastructure
Ltd.whereas debt equity and proprietary ratios shows the long term financial position.
Similarly, profitability ratios are helpful in evaluating the efficiency of performance in GMR
Infrastructure ltd.
The financial performance of the GMR has been analyzed and proved that the company is
financially sound and also its credit worthiness of corporation is good
CHAPTER-9
LIMITATIONS AND SCOPE FOR FURTHER STUDY
9.1 LIMITATIONS OF THE STUDY:
The figures in a financial statement are likely to be last several months out of date, and so
might not give a proper indication of the company’s current financial position.
The rankings given to the financial analysis alone we have to look at the business analysis
also. In this study we analyzed the business analysis by using the financial analysis but we didn’t
consider entire business performance of the company.

102
This study need to be interpreted carefully.while doing ratios the formulas may differ
from others
9.2 SCOPE FOR FURTHER STUDY:
Financial performance covers the liquidity , leverage and profitability position of
“GMR Infrastructure ltd”.
It helps to the investors for decision making by the credit rating given to the company
by the credit rating agencies.
This study further includes the interior business projects and the analysis of each project
of that company
BIBLIOGRAPHY
BOOKS:
M Y Khan and P K Jain Financial Management Fourth Edition-2006, Tata McGrew Hill
publishing company limited, New Delhi.
A.Murthy Management Accounting First Edition, S.Viswanathan (printers & publishers)
private limited.

103
WEBSITES:
WWW.NSEINDIA.COM
WWW.MONEYCONTROL.COM
WWW.INVESTOPEDIA.COM
WWW.GMRGROUP.CO.IN
WWW.JAYPEEGROUP.COM
WWW.LANCOGROUP.COM
WWW.GVKGROUP.COM
Related Documents