RIBuild_D6.5_v1.0 Dissemination Level: CO H2020-EE-03-2014 Robust Internal Thermal Insulation of Historic Buildings Project no.: 637268 Project full title: Robust Internal Thermal Insulation of Historic Buildings Project Acronym: RIBuild Deliverable no.: D6.5 Title of the deliverable: Description of the simulations Contractual Date of Delivery to the EC 31.01.2020 Actual Date of Delivery to the EC 03.07.2020 Organisation name of lead contractor for this deliverable DTU Editors Christian Kongsgaard, Søren Peter Bjarløv, Thomas Perkov, Eva Møller (Editor) Contributors DTU Participants(s) WP6 Internal reviewers Ernst Jan de Place Hansen (AAU) Work package contributing to the deliverable Report Nature 1.0 Version 52 Total number of pages 01.01.2015 Start date of project 30.06.2020 Abstract: This deliverable describes how simulations were generated for the basis of the RIBuild Insulation Calculation Tool (ICT). The simulations were performed in DELPHIN and sampled according to the Sobol method. Input parameters may be either uniform distributed within an interval or discrete. The input parameters include material parameters, boundary conditions, climates, etc. The simulations are performed with different insulation systems, the outcome of the simulations are temperature, relative humidity and moisture content in different places of the construction (solid walls). Based on this, predictions are made on mould and algae growth, internal surface temperature, U-value and heat loss. Keyword list: DELPHIN simulations, Sobol method, sampling, input parameters, predictions

Welcome message from author
This document is posted to help you gain knowledge. Please leave a comment to let me know what you think about it! Share it to your friends and learn new things together.
Transcript
RIBuild_D6.5_v1.0
Dissemination Level: CO
H2020-EE-03-2014
Robust Internal Thermal Insulation of Historic Buildings
Project no.: 637268
Project full title: Robust Internal Thermal Insulation of Historic Buildings
Project Acronym: RIBuild
Deliverable no.: D6.5
Title of the deliverable: Description of the simulations
Contractual Date of Delivery to the EC
31.01.2020
Actual Date of Delivery to the EC 03.07.2020
Organisation name of lead contractor for this deliverable
DTU
Editors Christian Kongsgaard, Søren Peter Bjarløv, Thomas Perkov, Eva Møller (Editor)
Contributors DTU
Participants(s) WP6
Internal reviewers Ernst Jan de Place Hansen (AAU)
Work package contributing to the deliverable
Report
Nature 1.0
Version 52
Total number of pages 01.01.2015
Start date of project 30.06.2020
Abstract:
This deliverable describes how simulations were generated for the basis of the RIBuild Insulation Calculation Tool (ICT). The simulations were performed in DELPHIN and sampled according to the Sobol method. Input parameters may be either uniform distributed within an interval or discrete. The input parameters include material parameters, boundary conditions, climates, etc. The simulations are performed with different insulation systems, the outcome of the simulations are temperature, relative humidity and moisture content in different places of the construction (solid walls). Based on this, predictions are made on mould and algae growth, internal surface temperature, U-value and heat loss.
Keyword list:
DELPHIN simulations, Sobol method, sampling, input parameters, predictions
637268 - RIBuild - H2020-EE-03-2014 Dissemination level: PU
Page 2 of 52
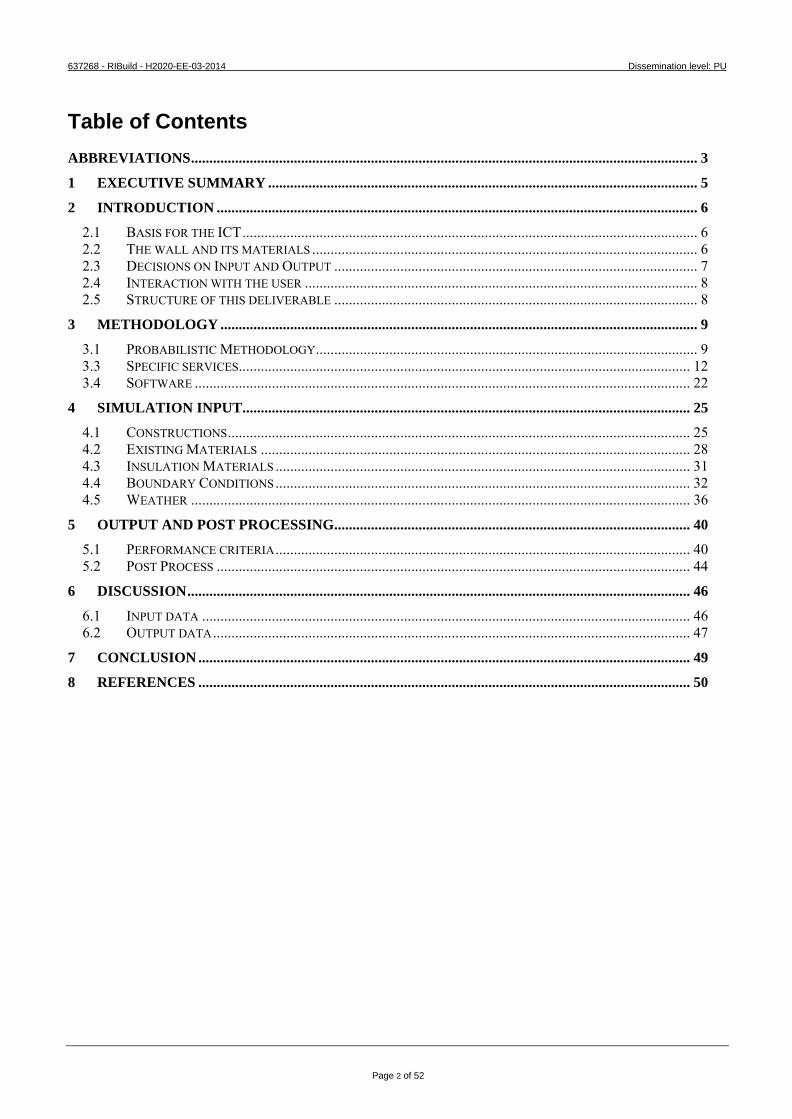
Table of Contents
ABBREVIATIONS .......................................................................................................................................... 3
1 EXECUTIVE SUMMARY ..................................................................................................................... 5
2 INTRODUCTION ................................................................................................................................... 6
2.1 BASIS FOR THE ICT ............................................................................................................................ 6 2.2 THE WALL AND ITS MATERIALS ......................................................................................................... 6 2.3 DECISIONS ON INPUT AND OUTPUT ................................................................................................... 7 2.4 INTERACTION WITH THE USER ........................................................................................................... 8 2.5 STRUCTURE OF THIS DELIVERABLE ................................................................................................... 8
3 METHODOLOGY .................................................................................................................................. 9
3.1 PROBABILISTIC METHODOLOGY ........................................................................................................ 9 3.3 SPECIFIC SERVICES ........................................................................................................................... 12 3.4 SOFTWARE ....................................................................................................................................... 22
4 SIMULATION INPUT .......................................................................................................................... 25
4.1 CONSTRUCTIONS .............................................................................................................................. 25 4.2 EXISTING MATERIALS ..................................................................................................................... 28 4.3 INSULATION MATERIALS ................................................................................................................. 31 4.4 BOUNDARY CONDITIONS ................................................................................................................. 32 4.5 WEATHER ........................................................................................................................................ 36
5 OUTPUT AND POST PROCESSING................................................................................................. 40
5.1 PERFORMANCE CRITERIA ................................................................................................................. 40 5.2 POST PROCESS ................................................................................................................................. 44
6 DISCUSSION ......................................................................................................................................... 46
6.1 INPUT DATA ..................................................................................................................................... 46 6.2 OUTPUT DATA .................................................................................................................................. 47
7 CONCLUSION ...................................................................................................................................... 49
8 REFERENCES ...................................................................................................................................... 50
637268 - RIBuild - H2020-EE-03-2014 Dissemination level: PU
Page 3 of 52
Abbreviations
AEC Architecture, Engineering and Construction ASOS Automated Surface Observing System D RIBuild Deliverable DMI Danish Meteorological Institute DRY Design reference year DTU RIBuild partner: Technical University of Denmark ECAD European Climate Assessment & Dataset Project ECMWF European Centre for Medium-Range Weather Forecasts EPW Energy Plus Weather HPC High Performance Computing ICT Insulation Calculator tool IOT Internet Of Things KU Leuven RIBuild partner LCA Life Cycle Assessment LCC Life Cycle Cost NOAA National Oceanic and Atmospheric Administration ODM Object Document Mapper RTU RIBuild partner: Riga Technical University SSH Secure Shell TRY Test Reference Year TUD RIBuild partner: Technical University Dresden WP Work Package
637268 - RIBuild - H2020-EE-03-2014 Dissemination level: PU
Page 4 of 52
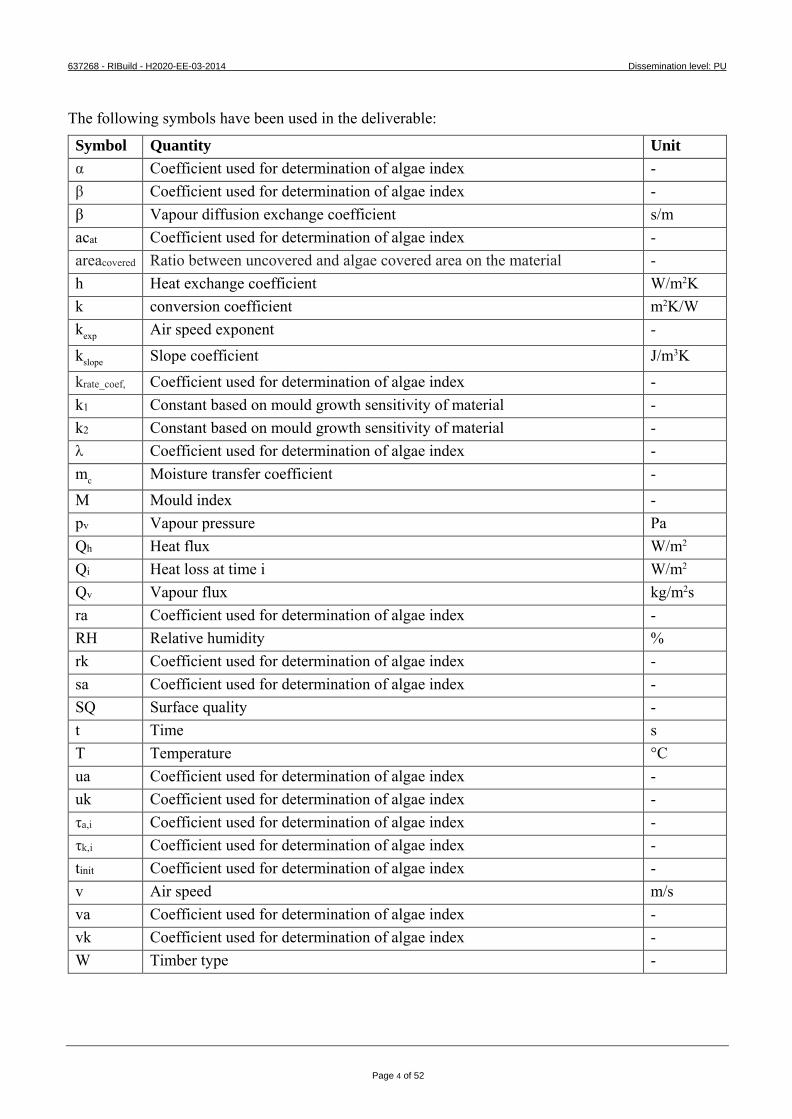
The following symbols have been used in the deliverable:
Symbol Quantity Unit
α Coefficient used for determination of algae index - β Coefficient used for determination of algae index - β Vapour diffusion exchange coefficient s/m acat Coefficient used for determination of algae index - areacovered Ratio between uncovered and algae covered area on the material - h Heat exchange coefficient W/m2K k conversion coefficient m2K/W kexp Air speed exponent - kslope Slope coefficient J/m3K krate_coef, Coefficient used for determination of algae index - k1 Constant based on mould growth sensitivity of material - k2 Constant based on mould growth sensitivity of material - λ Coefficient used for determination of algae index - mc Moisture transfer coefficient - M Mould index - pv Vapour pressure Pa Qh Heat flux W/m2 Qi Heat loss at time i W/m2 Qv Vapour flux kg/m2s ra Coefficient used for determination of algae index - RH Relative humidity % rk Coefficient used for determination of algae index - sa Coefficient used for determination of algae index - SQ Surface quality - t Time s T Temperature °C ua Coefficient used for determination of algae index - uk Coefficient used for determination of algae index - τa,i Coefficient used for determination of algae index - τk,i Coefficient used for determination of algae index - tinit Coefficient used for determination of algae index - v Air speed m/s va Coefficient used for determination of algae index - vk Coefficient used for determination of algae index - W Timber type -
637268 - RIBuild - H2020-EE-03-2014 Dissemination level: PU
Page 5 of 52
1 Executive Summary
One of the outcomes of RIBuild is Deliverable D6.1; a web tool including a feasibility study of possible input and output date. To make this tool and the feasibility study, many simulations have been necessary. In this deliverable D6.5 it is described how these simulations were performed and what input and output was chosen to develop the tool described in D6.1. The basis for the decisions made in this deliverable is the work done in other RIBuild work packages (WP):
• WP 1 has been used to decide on which constructions should be included. The result was that masonry with brick or natural stone was chosen, while timber framed walls were left out. These walls may or may not have interior and/or exterior rendering.
• WP 2 was used to decide on which materials and simulation program should be involved. It was decided to use the simulation program DELPHIN and use the bricks and natural stones that were available in the DELPHIN database supplemented with a few materials that were tested as a part of RIBuild and implemented in the DELPHIN database. For the insulation materials, a similar choice was made; it had to be whole systems, with all parameters described in the DELPHIN database. Only exception was to include a traditional internal insulation method of mineral wool behind gypsum board.
• Furthermore, the WP 2 results on different failure modes were used to decide on which output data would be relevant. Here temperature, relative humidity and moisture content were chosen in specific points of the construction. Finally, the results from D 2.3 were used to decide whether hydrophobisation should be included in the simulations. It was decided to leave this out, as the knowledge about hydrophobisation and how it is to be simulated, is still too uncertain.
• WP4 results on probabilistic methods was used. It was decided to use a quasi Monte Carlo method (Sobol) to sample the needed simulations. Based on this the actual simulations were generated. As the there are many variables in the input data, some of them are discrete while others are variated uniformly within an interval, consequently the numbers of possible simulations is very high, although limited by the use of the Sobol method. It is not part of this deliverable to describe how many simulations that are needed to get a reliable answer when the user enters the web tool, described in D 6.1.
The work done in WP 3 and WP 5 has only been used to a smaller degree, although the findings of these WP’s have contributed to a general understanding that have made it easier to decide which input parameters should be varied and to what extent. The probabilistic approach resulted in 16 uncertainty layers, from where the input data was picked. Not all simulations reached convergence; therefore, the sampling also handled when to move on to the next simulation in the queue.
637268 - RIBuild - H2020-EE-03-2014 Dissemination level: PU
Page 6 of 52
2 Introduction
This report describes the creation and functionality of the simulations behind the Insulation Calculation Tool (ICT) and the choices made, the ICT itself is described in (RIBuild Deliverable D6.1, 2020). The prerequisites, described at the RIBuild homepage www.ribuild.eu, must be respected before applying internal insulation. E.g., rising damp and dilapidated facades with cracks or mortar damages should be taken care of and repaired before application of internal insulation takes place. At a RIBuild workshop held at Aalborg University, Copenhagen, January 2016, DTU presented the idea of producing a Web Tool. The Web Tool should give answer to the question: How much internal insulation can I safely add to my wall? DTU repeated the proposal at the RIBuild meeting at TUD, Dresden, Germany, May 2016 and all partners agreed to this additional work. Later, an amendment describing a feasibility study of such a tool and if feasible integrating it to the project, was approved by EU.
2.1 Basis for the ICT
Before deciding which simulations were necessary to perform to create a basis for the ICT, it had to be discussed what the ICT should be capable of. Since the RIBuild meeting in Dresden May 2016, the background and the ICT itself have been developed. All sorts of challenges and questions came up, and were discussed at the biannual RIBuild meetings and decisions was continuously made. It was decided that the ICT should be designed to target the owner, mainly a non-professional building owner who is interested in internal insulation, who has no or very little prior knowledge but interested in learning more. It was decided that it should be a database with an enormous amount of pre-calculated simulations, as real-time simulations was not realistic in spite of improvements made in WP4. These simulations should be carried out in the DELPHIN simulation tool developed by TUD and with a few input from the user the web tool should be able to find useable pre-calculations in the database. How precise should the ICT be? The ambition to cover Europe from Italy in south, to Sweden in north was a challenge because of the variations in building types, material parameters, climate data, insulation systems, etc. It was realised that the ICT would be less precise than e.g. a simulation in DELPHIN with all input data known. However, as it is unrealistic to know all input data, a single simulation will never be exact either. Since the original application to EU was based on improving the existing probabilistic approach, it was decided to choose probabilistic calculations for ICT as well, reducing the needed number of calculations considerably, and not a deterministic approach. It was decided that the ICT should aim at giving a preliminary recommendation to the user whether it is possible to add internal insulation to a wall or not and what the risk of damage would be. Furthermore, the results should also indicate uncertainties, recognising that simulations are not perfect descriptions of the reality due to uncertainties in input and calculation method.
2.2 The wall and its materials
Should the ICT take details like partition walls and window openings of the façade into consideration as explored in WP3 and WP4, or should it just give an answer based on one square meter of regular wall? It was decided to base it on one square meter wall, as involving more than 1D would complicate the
637268 - RIBuild - H2020-EE-03-2014 Dissemination level: PU
Page 7 of 52
simulations and would be too early to include due to the other challenges that were expected when developing a tool based on a probabilistic approach.
Based on results from WP1 and WP2, the relevant materials and material data were decided. For the existing wall, this meant which type of brick, limestone, sandstone, mortar, renderings and surface treatments, etc. that should be included. Timber-framed walls were left out as this building type only represents a small part of the historic buildings, and represent challenges that are very different from the much more common solid walls made of brick masonry or natural stone. In addition, a selection of insulation systems had to be made based on the findings in WP1 and WP2, including material data of insulation materials and glue mortars.
It was discussed whether surface treatment like hydrophobisation and paint should be taken into consideration, as it seem to have a high influence on moisture in the wall; are we able to simulate it? In Task 2.4, the question of hydrophobisation was investigated, showing that a thoroughly tested method to simulate hydrophobisation was not available yet (RIBuild deliverable D2.3, 2020); therefore, hydrophobisation was left out in this first version of ICT.
RIBuild is about historic buildings, i.e. buildings at least 70 years old, meaning that they often have been refurbished, with new render or joints in the surface, were most likely the mortar contains a percentage of cement. This will change the moisture transport in the masonry. The chosen mortars in ICT should all contain lime.
The internal insulation must be considered as an insulation system as the glue mortar, the render, eventual reinforcement and the internal surface treatment, must be taken into consideration when the hygrothermal condition is simulated. As it was decided to use the DELPHIN simulation tool, a DELPHIN file is required, requesting all necessary material data in the insulation system to be experimentally found for each material. Therefore, it was decided that if an insulation material system should be part of the ICT, the whole insulation system must be available in the DELPHIN database. When comparing with WP3 case studies, the relevance of the systems was confirmed, as the insulation systems used in the ICT were often used in these examples.
2.3 Decisions on Input and Output
Which damage criteria should be chosen? In (RIBuild deliverable D2.2, 2019) four failure modes were considered: Mould growth, wood rot, algae growth and surface pealing caused by frost. Although neither mould growth nor algae growth deteriorates the materials, these were for several reasons considered the two most important damage criteria. The ICT should therefore assess the risk of mould and algae growth. Another reason was the fact that no reliable model for failure could be identified for frost and wood rot (RIBuild deliverable D2.2, 2019), thus leaving these out of the ICT.
Which output data would the user need? Energy saving potential including U-value was considered important. As moisture-induced failures are the reason for scepticism towards internal insulation, it was important to address this as well. Therefore, it was decided to use models for mould growth in the intersection between the original wall and internal insulation, and a new model for algae growth on the outer surface, and hereby calculate the risk of mould growth and algae growth based on the outcome of the hygrothermal simulations. Instead of answering the question of how much insulation material could safely be added to the wall, it was decided to give the user information on calculation results and leave it up to the user to decide how high a risk of different failures would be acceptable. The probabilistic
637268 - RIBuild - H2020-EE-03-2014 Dissemination level: PU
Page 8 of 52
approach also made it possible to illustrate the uncertainties, something that could influence the user’s level of acceptance.
Weather data that covers all the RIBuild countries were available from the European research project “Climate for Culture” (www.climateforculture.eu). The CfC data were created to consider expected climate change and this made sense in a RIBuild context, as the application of internal insulation is supposed to work for many years ahead. It was decided to use the dataset for the near future period, 2021-2050.
Concerning how to simulate the indoor climate, two standards, ISO 13788 (2012) and EN 15026 (2007) were considered and analysed. It was decided to use EN 15026.
It was discussed how to include sustainability in the ICT as a separate tool with an advanced approach to probabilistic LCA and LCC assessment was developed in WP5. Another idea, to integrate a simple post calculation in ICT, was also pursued. This postprocessor should add LCA and LCC including U-value to the picked hygrothermal simulation. In the end, it was found too difficult to include the LCC and the simpler LCA, which then was eliminated from the ICT.
2.4 Interaction with the user
How to access the ICT as a user? It was decided to let the user access the ICT through the RIBuild homepage that includes information about the RIBuild project in general, how to decide if a building is suitable for internal insulation, and details from the research performed. From here, the user could move on to the ICT. What kind of information is needed from the user? The user is asked to give input about location and orientation of the wall, as well as wall thickness, material, and surface treatment (render). When that is done the database come up with different insulation systems with Thickness of the insulation material possible, risk of mould, risk of algae, U-value, and temperature at the inner surface. The results can be prioritised after the user’s wishes.
2.5 Structure of this deliverable
Before the ICT could work, the basis of it all i.e. many simulations had to be pre-calculated. The development of the simulations is the subject of this deliverable. It contains three section describing the probabilistic methodology, the system architecture, and the specific services and software involved (Section 3), the simulation input (Section 0), and the output (performance criteria) and post-processing (Section 5). In Section 0, the choice of input and output data are discussed, and how this affected the outcome and quality of the performed simulations. Concluding remarks are given in Section 7.
637268 - RIBuild - H2020-EE-03-2014 Dissemination level: PU
Page 9 of 52
3 Methodology
3.1 Probabilistic Methodology
3.1.1 Introduction
The aim of the ICT is to cover as many situations as possible within the seven member countries of RIBuild. To cover such a wide range of scenarios within a limited amount of time and resources, it was chosen among the RIBuild partners that a probabilistic methodology should be applied, which also aligns with the work that have been done in Work Package 4.
Besides, from reducing the number of simulations needed to cover the wide range scenarios, a probabilistic approach to hygrothermal building simulations also have some additional benefits, as (RIBuild Deliverable D4.1, 2017) describes:
“Most studies on interior insulation make use of deterministic simulations, hence neglecting the inherent variability and uncertainty of geometries and configurations, of material and component properties, of internal loads and boundary conditions. A deterministic approach may hence lead to inconclusive analyses and non-optimal designs, and a probabilistic methodology is therefore to be
preferred.”
(Deliverable D4.1)
A more detailed description of the probabilistic methodology can be found in Deliverable D4.1. In the following paragraphs only a brief description will be given.
3.1.2 Monte Carlo Method
The probabilistic methodology used in the ICT is developed at the Building Physics Department of KU Leuven (Van Gelder et al., 2014). At the centre of this methodology stands a Monto Carlo Scheme.
The Monte Carlo Method generally refers to a repeated computation of a deterministic function, given different input values to determine the probability distribution of the output values (Deliverable 4.1). In case of the ICT, the deterministic function is the simulation of a DELPHIN Project. After each set of DELPHIN simulations a new set of input parameters are given and a new set of DELPHIN projects can be created and simulated, where after the Monto Carlo loop repeats itself.
The Monte Carlo loop runs until a desired convergence level is reached. In our case, the convergence level is determined by the Error Estimation, which are described in section 3.1.4.
The applied Monte Carlo Method consists of two layers:
The Design Layer The Design Layer contains parameters, which stays fixed through all of the iterations. A design within the Design Layer refers to a single or a group of parameters. E.g. a specific insulation width and insulation material.
637268 - RIBuild - H2020-EE-03-2014 Dissemination level: PU
Page 10 of 52
The Uncertainty Layer The Uncertainty Layer contains parameters, which are uncertain or unknown and they are not consistent between iterations. E.g., boundary conditions such as heat transfer coefficients.
3.1.3 Sobol Sampling
The basic concept of repeating computation of a deterministic function with randomized input values is not always desirable when dealing with a resource heavy function, such as DELPHIN. Therefore, the number of repetitions should be reduced. A sampling scheme for the input values can be used to achieve that. Deliverable D4.1 describes three main criteria of such a sampling scheme:
“In that respect, three criteria are crucial. Firstly, the sampling scheme should be as efficient as possible, which can be described as using a minimal number of runs to obtain a desired accuracy
level. Based on the work of (Niederreiter, 1978), a sampling scheme with a greater uniformity of its sampling points will have a faster rate of convergence and is hence considered to be more efficient. Secondly, monitoring sampling convergence should be possible, in other words, estimation of the
accuracy of the result should be feasible. Such error estimation allows terminating the Monte Carlo analysis when a desired accuracy has been reached. And thirdly, sequential additions of
single samples should be possible, because it guarantees a maximal reduction of the computational expense of the Monte Carlo analysis. By doing so, a desired accuracy of the outcomes can be
reached with a truly minimal number of repetitions”.
(Deliverable D4.1)
Deliverable D4.1 compares several sampling schemes as well as making a comparison between using a Monte Carlo and a Quasi Monte Carlo approach. It is concluded, that the Sobol Sequence and the Quasi Monte Carlo method is the best for use cases such as hygrothermal modelling.
3.1.4 Error Estimation
To estimate the errors and ultimately the convergence criteria, a way of computing those errors is needed. The Standard Error is used as an error estimator. When dealing with Quasi Monte Carlo Methods, the classic approach of calculating the Standard Error cannot be used. Deliverable 4.1 explains what can be done instead:
“Contrary to the standard Monte Carlo method, the conventional error estimation method based on central limit theory is not valid for the quasi-Monte Carlo method. Instead, one can randomize
the initial low-discrepancy sequence by implementing related randomization techniques, and repeat the procedure r times, so that 1) each of the randomized sequence preserves the low-
discrepancy property, and 2) each of the randomized sequence is independent. Resultantly, the standard error of these independent approximations can be derived:
”
(Deliverable D4.1)
637268 - RIBuild - H2020-EE-03-2014 Dissemination level: PU
Page 11 of 52
3.2 System Architecture
3.2.1 System Concept
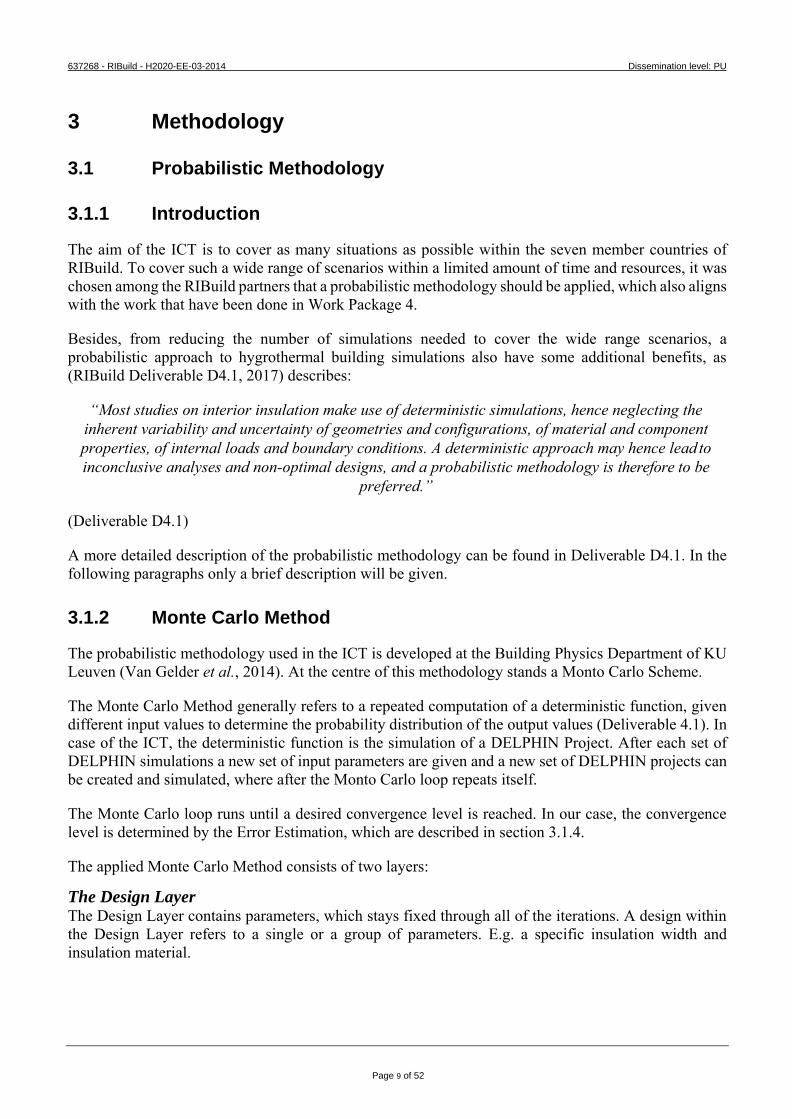
The system is built as series of micro services, which each work independently but are connected to the same database and through that share the workload. The system setup are mainly derived from the dataflow diagram (Figure 1), which was originally conceived in the early stages of the ICT.
3.2.2 Dataflow
The dataflow of the system can be seen in Figure 1. The figure describes the pathways and processes involved in presenting the end user with a solution. It starts from the very early stages of the RIBuild partners discussing and determining, which input data should be included in the tool (objects annotated with 1.x).
Early on, the six input categories have been chosen as areas, which needed special attention for input to the ICT. After the determination of which input data to include in the tool, this data is stored before proceeding to the next set of processes (objects annotated with 2.x).
Figure 1 - Data flow diagram of the ICT
637268 - RIBuild - H2020-EE-03-2014 Dissemination level: PU
Page 12 of 52
This second process category is what WP6 calls the “Backend”. It is the part of the system, which handles the input data, organizes and samples it to DELPHIN projects, simulates the projects and stores the results in a database. This part has been a focus point for WP6 throughout the RIBuild project.
The last process category is the user interface (annotated with 3.x); it couples the user inputs with the simulated data to lookup a given solution, which is also enriched with environmental impact data, before it is presented to the user. This part of the process is described in Deliverable 6.1.
3.2.3 Services in general
There are three main services in play, the Sampling Service, the Simulation Service and the Database. They corresponds to objects 2.1, 2.2, 2.3 and the storages (pipe shaped objects) from Figure 1.
Services are handled as Docker Services and Containers [https://www.docker.com/]. Docker is a technology that makes software orchestration of micro services easy. Each service has a series of workers, which is operating independently from each other, but can be controlled globally. For more see section 3.4.4 about the Docker software.
While Docker is used to control the individual service workers, the High Performance Computing (HPC) cluster at DTU [https://www.hpc.dtu.dk/] is used as hardware for the actual computation. A similar HPC cluster at Riga technical University (RTU) has also been used; this was done late in the process to achieve more simulations within the given timeframe.
The services and their worker processes are described more in depth section 3.3.
3.3 Specific services
3.3.1 Simulation Worker
The Simulation Worker is the service, which simulates the DELPHIN projects and calculates the damage models. It is only aware of the database and will run as long as there are projects to be simulated. There are multiple instances of the Simulation Worker making it possible to run simulations in parallel only limited by the number of cores available.
The life cycle of a Simulation Worker is as follows (see also Figure 2): 1 The Simulation Worker instance is spawned. 2 Find next unsimulated DELPHIN project in the database. 3 Download the project files including DELPHIN materials and weather. 4 Estimate simulation time. 5 Submit the simulation to the DTU HPC queue. 6 Wait for the simulation to finish. 7 Upload results to the database. 8 The Simulation Worker instance is shut down.
637268 - RIBuild - H2020-EE-03-2014 Dissemination level: PU
Page 13 of 52
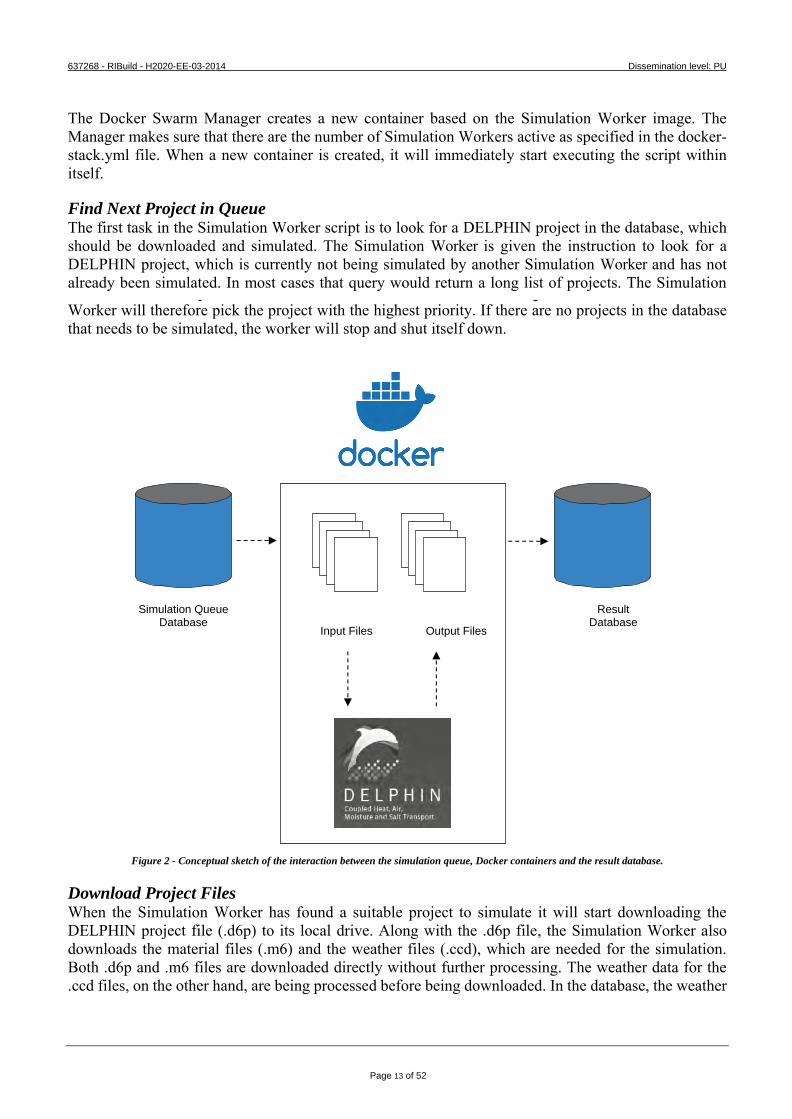
The Docker Swarm Manager creates a new container based on the Simulation Worker image. The Manager makes sure that there are the number of Simulation Workers active as specified in the docker-stack.yml file. When a new container is created, it will immediately start executing the script within itself.
Find Next Project in Queue The first task in the Simulation Worker script is to look for a DELPHIN project in the database, which should be downloaded and simulated. The Simulation Worker is given the instruction to look for a DELPHIN project, which is currently not being simulated by another Simulation Worker and has not already been simulated. In most cases that query would return a long list of projects. The Simulation
Worker will therefore pick the project with the highest priority. If there are no projects in the database that needs to be simulated, the worker will stop and shut itself down.
Figure 2 - Conceptual sketch of the interaction between the simulation queue, Docker containers and the result database.
Download Project Files When the Simulation Worker has found a suitable project to simulate it will start downloading the DELPHIN project file (.d6p) to its local drive. Along with the .d6p file, the Simulation Worker also downloads the material files (.m6) and the weather files (.ccd), which are needed for the simulation. Both .d6p and .m6 files are downloaded directly without further processing. The weather data for the .ccd files, on the other hand, are being processed before being downloaded. In the database, the weather
Input Files Output Files Simulation Queue
Database Result
Database
637268 - RIBuild - H2020-EE-03-2014 Dissemination level: PU
Page 14 of 52
files are stored per year and therefore when a simulation runs over several years (five in the case of the final simulation run), the weather data needs to be concatenated in order to a 5-year long weather file. Furthermore, wind driven rain, direct solar radiation and the indoor climate data are not stored in the database, but is calculated before the download and then made into .ccd files.
Estimation of Simulation Time When submitting a job to the DTU HPC queue it is required to specify how many resources the jobs needs. Whether it is number of CPU cores, amount of RAM or computation time it is all needed up front. The number of CPU cores and RAM does not change between DELPHIN simulations, but the simulation time does.
The Simulation Worker has three ways of predicting the simulation time of a DELPHIN project. 1 If there is no previously simulated projects in the database, the Simulation Worker will per default
estimate that the DELPHIN project will take 120 minutes to simulate. 2 If there is previously simulated projects in the database, the Simulation Worker will use the
average time it took for them to finish the simulation as the estimation of how long it will take the DELPHIN project at hand to finish.
3 If the DELPHIN project already has been given a simulation time estimate by the Sampling Worker, see section 3.3.2, the Simulation Worker will use that as the estimate.
Submit Job to DTU HPC The DELPHIN simulation will then be submitted as a job to the DTU HPC queue. That means that it is not actually the Simulation Worker, which does the simulation, but it is outsourced to DTU HPC for performance gains.
Wait until Simulation is finished When job has been submitted to the DTU HPC queue the Simulation Worker will wait until the simulation is done. It is not idle while waiting, but does several checks to figure out the “health” of the simulation and whether it was completed before the estimate time.
• When a DELPHIN project is finished, simulating it will always produce a summary.txt file in its log folder. The Simulation Worker will look for that file as the sign of completion of the simulation.
• If a simulation exceeds the estimated time and the summary.txt file is not produced, the Simulation Worker will grant it more time in order to finish. The simulation will be given 150% of the previous time estimate, however the new time estimate can never be more than 1440 minutes or 24 hours.
• If the total simulation time exceeds 24 hours, the Simulation Worker stops the simulation and flags it in the database as having exceeded the time limit.
• The Simulation Worker will look in the simulation’s screenlog.txt file to check whether it encounters any errors. If the simulation encounters a critical error, it will stop. A critical error does not always mean that the simulation cannot continue, therefore will the Simulation Worker try to submit the DELPHIN simulation to the DTU HPC queue again. However, if the simulation encounters the same critical error three times in a row the Simulation Worker will stop retrying and flag the simulation as having encountered critical errors in the database.
637268 - RIBuild - H2020-EE-03-2014 Dissemination level: PU
Page 15 of 52
Upload Results to Database When the Simulation Worker has determined that the simulation is finished and whether or not it was successful, it will start uploading the produced output to the database. The Simulation Worker both uploads the raw output files to the database, but it also processes it and computes the damage models. See section 5.1 for more information on the calculated damage models.
Simulation Worker Shutdown When the simulation output and the damage models have been successfully uploaded to the database, the Simulation Worker will flag the DELPHIN project as simulated in the database along with the time it took. After that, it will terminate to make room for a new Simulation Worker.
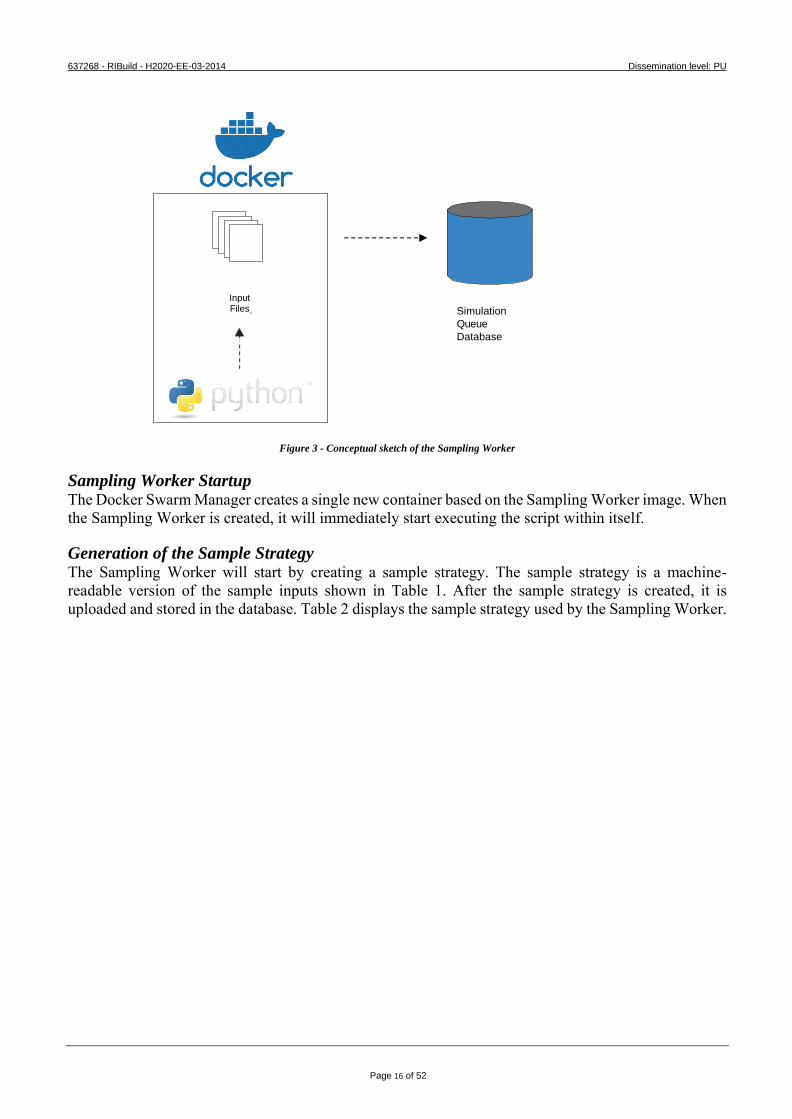
3.3.2 Sampling Worker
The Sampling Worker is the service, which takes care of the probabilistic methodology and the creation of DELPHIN projects for the Simulation Worker to consume. The Sampling Worker is not aware of the Simulation Worker; it is only connected to the database. The Sampling Worker is created at the beginning of a simulation run and the same Sampling Worker will be active throughout the whole period of the simulation run.
The life cycle of the Sampling Worker is as follows (see Figure 3): 1 The Sampling Worker instance is spawned 2 The sample strategy is generated 3 While the simulation run has not converged, the Sampling Worker will do
1 Generate new samples 2 Create DELPHIN projects based on those samples 3 Predict simulation time of the DELPHIN projects 4 Wait until all the generated DELPHIN projects have been simulated 5 Calculate the sample standard error 6 Check for convergence
637268 - RIBuild - H2020-EE-03-2014 Dissemination level: PU
Page 16 of 52
Figure 3 - Conceptual sketch of the Sampling Worker
Sampling Worker Startup The Docker Swarm Manager creates a single new container based on the Sampling Worker image. When the Sampling Worker is created, it will immediately start executing the script within itself.
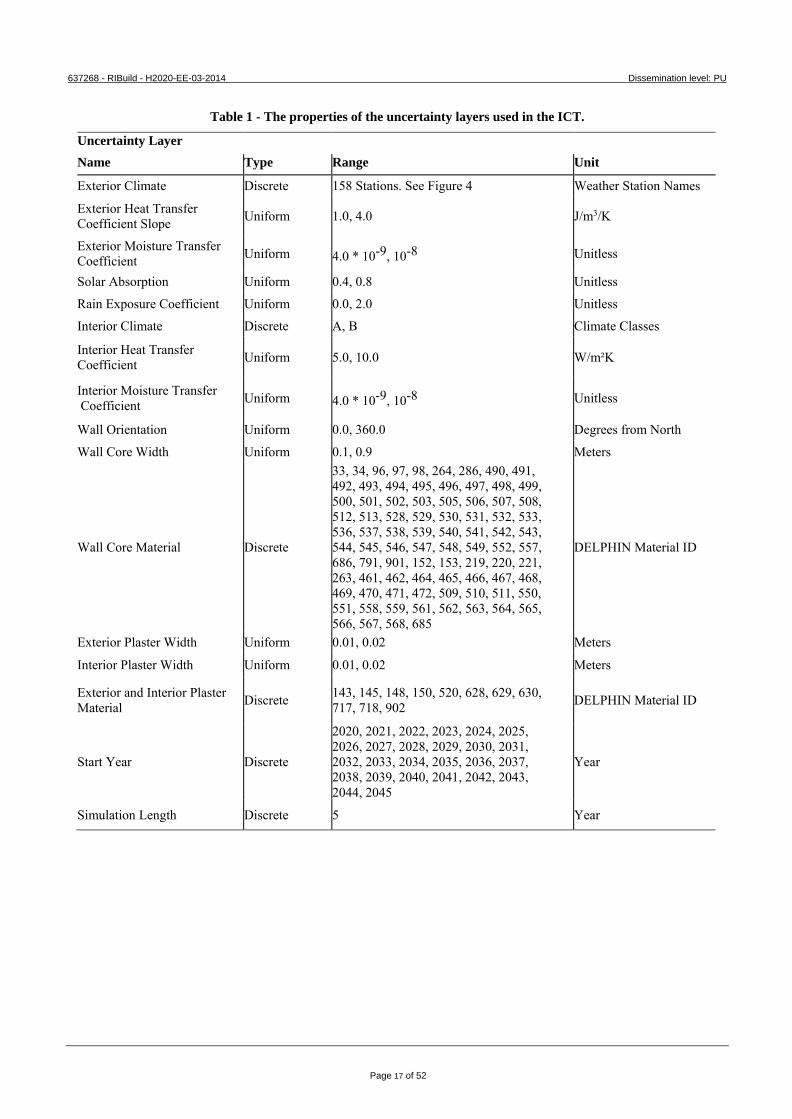
Generation of the Sample Strategy The Sampling Worker will start by creating a sample strategy. The sample strategy is a machine- readable version of the sample inputs shown in Table 1. After the sample strategy is created, it is uploaded and stored in the database. Table 2 displays the sample strategy used by the Sampling Worker.
Input Files Simulation
Queue
Database
637268 - RIBuild - H2020-EE-03-2014 Dissemination level: PU
Page 17 of 52
Table 1 - The properties of the uncertainty layers used in the ICT.
Uncertainty Layer Name Type Range Unit
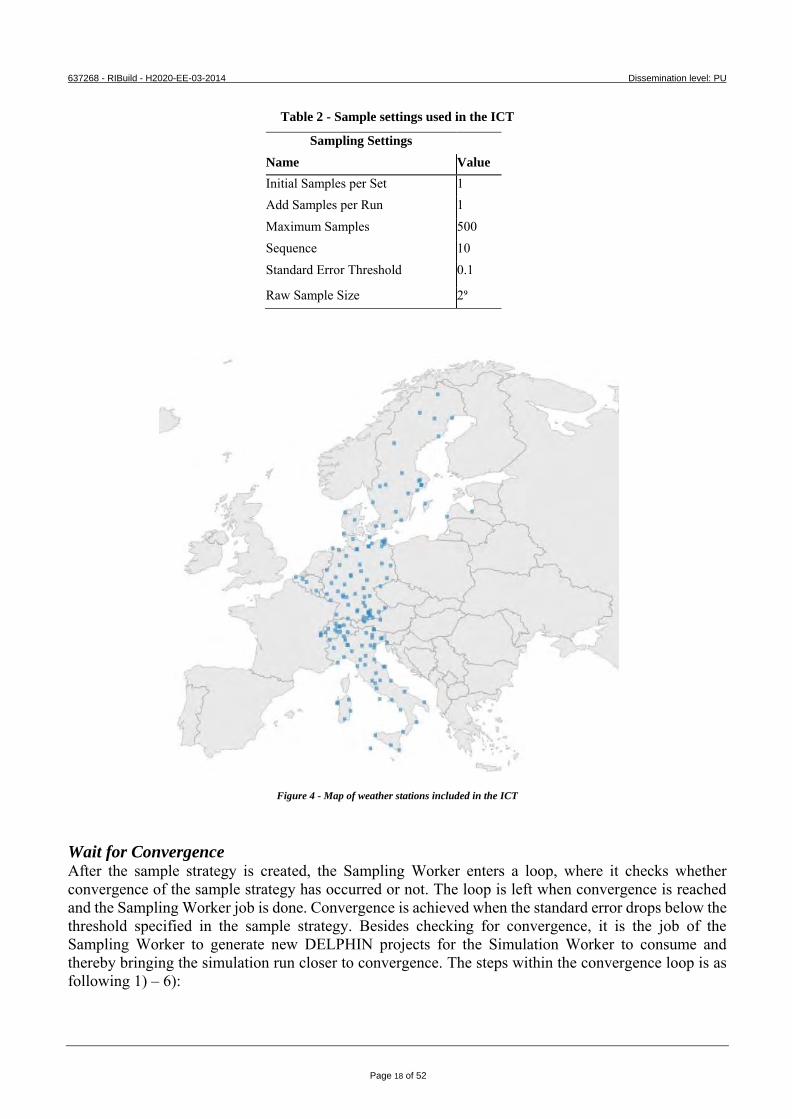
Exterior Climate Discrete 158 Stations. See Figure 4 Weather Station Names
Exterior Heat Transfer Coefficient Slope Uniform 1.0, 4.0 J/m3/K
Exterior Moisture Transfer Coefficient Uniform 4.0 * 10-9, 10-8 Unitless
Solar Absorption Uniform 0.4, 0.8 Unitless
Rain Exposure Coefficient Uniform 0.0, 2.0 Unitless
Interior Climate Discrete A, B Climate Classes
Interior Heat Transfer Coefficient Uniform 5.0, 10.0 W/m²K
Interior Moisture Transfer Coefficient Uniform 4.0 * 10-9, 10-8 Unitless
Wall Orientation Uniform 0.0, 360.0 Degrees from North
Wall Core Width Uniform 0.1, 0.9 Meters
Wall Core Material Discrete
33, 34, 96, 97, 98, 264, 286, 490, 491, 492, 493, 494, 495, 496, 497, 498, 499, 500, 501, 502, 503, 505, 506, 507, 508, 512, 513, 528, 529, 530, 531, 532, 533, 536, 537, 538, 539, 540, 541, 542, 543, 544, 545, 546, 547, 548, 549, 552, 557, 686, 791, 901, 152, 153, 219, 220, 221, 263, 461, 462, 464, 465, 466, 467, 468, 469, 470, 471, 472, 509, 510, 511, 550, 551, 558, 559, 561, 562, 563, 564, 565, 566, 567, 568, 685
DELPHIN Material ID
Exterior Plaster Width Uniform 0.01, 0.02 Meters
Interior Plaster Width Uniform 0.01, 0.02 Meters
Exterior and Interior Plaster Material Discrete 143, 145, 148, 150, 520, 628, 629, 630,
717, 718, 902 DELPHIN Material ID
Start Year Discrete
2020, 2021, 2022, 2023, 2024, 2025, 2026, 2027, 2028, 2029, 2030, 2031, 2032, 2033, 2034, 2035, 2036, 2037, 2038, 2039, 2040, 2041, 2042, 2043, 2044, 2045
Year
Simulation Length Discrete 5 Year
637268 - RIBuild - H2020-EE-03-2014 Dissemination level: PU
Page 18 of 52
Table 2 - Sample settings used in the ICT
Sampling Settings Name Value
Initial Samples per Set 1 Add Samples per Run 1 Maximum Samples 500 Sequence 10 Standard Error Threshold 0.1
Raw Sample Size 2⁹
Figure 4 - Map of weather stations included in the ICT
Wait for Convergence After the sample strategy is created, the Sampling Worker enters a loop, where it checks whether convergence of the sample strategy has occurred or not. The loop is left when convergence is reached and the Sampling Worker job is done. Convergence is achieved when the standard error drops below the threshold specified in the sample strategy. Besides checking for convergence, it is the job of the Sampling Worker to generate new DELPHIN projects for the Simulation Worker to consume and thereby bringing the simulation run closer to convergence. The steps within the convergence loop is as following 1) – 6):
637268 - RIBuild - H2020-EE-03-2014 Dissemination level: PU
Page 19 of 52
1) Generation of New Samples
Firstly, the Sampling Worker will check for existing raw samples. If it is the first time in the convergence loop there will not be any raw samples created and therefore the Sampling Worker will create those according to the Sobol model as described in D4.2. The raw samples are essential a matrix containing values between 0 and 1 and has the shape: m x n. Where m is the number of parameters in the uncertainty layer and n is the closest value to the maximum number of sample iterations, which is also a power of 2. In the case of the WP6 simulation run m is 17 and n is 512. The raw sample matrix is generated for each sequence. When all the raw sample matrices have been generated, they are uploaded to the database, so they can be retrieved for the next convergence loop iteration.
After the creating of the raw sample matrices or retrievement of them from the database, their values have to be converted to correspond to the distribution of each given parameter in the uncertainty layer. This is done for each design option.
The final samples are also upload to be stored in the database.
2) Creation of New DELPHIN Projects
The DELPHIN projects for the given convergence loop iteration is then created based on the samples. After they have been created, they are uploaded to the database, so the Simulation Worker can download and simulate them.
3) Simulation Time Estimation
After the creation of the DELPHIN projects, the simulation-time-estimation-model is updated. If there is no previous model, it will be created instead. A description of the model can be read in section 3.3.1.
To predict the simulation time of each DELPHIN project three methods have been chosen: 1 If there is no previously simulated projects, the Sampling Worker will guess that all simulations
takes 120 minutes. 2 If there is previously simulated projects, but not enough to create a machine-learning model, the
Sampling Worker will estimate that the DELPHIN projects will take the average of the simulation time of the previous projects.
3 If there is enough previously simulated projects to create a machine-learning model that model will be used to estimate the simulation time.
The purpose of predicting the simulation time of each DELPHIN project is to give the DTU HPC Scheduler a simulation time, which it requires. Besides that, the simulation times can be used to decide in which order the DELPHIN projects should be simulated. For the WP6 simulation run, it has been chosen that the DELPHIN project, which takes the longest, should be simulated first.
4) Wait for DELPHIN Projects to be simulated
At this point, in the convergence loop, all the DELPHIN projects are created and ready to be simulated. The Sampling Worker will therefore sleep and only check every two minutes, if all the DELPHIN projects are done.
5) Calculate Sample Standard Error
When the DELPHIN projects have been simulated, the Sampling Worker will start computing the Sample Standard Error for the current iteration. The method whereby it does that is well described in D4.1. To sum up what happens:
637268 - RIBuild - H2020-EE-03-2014 Dissemination level: PU
Page 20 of 52
1 The mean and standard deviation for mould growth and heat loss are calculated for each design option in each sequence.
2 The mean of the design options across sequences are calculated. 3 The relative standard error is calculated for each design option across all sequences.
When the standard errors are calculated, they are upload and stored in the database.
6) Check for Convergence
The final step in the convergence loop is to check for convergence. The Sampling Worker checks if the standard error is below the given threshold (see Table 2) for all the design options. If convergence is reached then the simulation run will be terminated otherwise the convergence loop will repeat itself until convergence.
3.3.3 Logging Worker
When the services start, a logging container is also created to capture the logs of the other services and make them available for the maintainer. The Logging Worker is couple to Loggly, a service which stores and makes the logs visible to the maintainer.
3.3.4 Database
The Database service is essentially just holding the Mongo database (see Section 3.4.5) so all the data produced by the Simulation Worker and Sampling Worker can be stored in a central place.
3.3.5 Web User Interface
Depending on the need of the user, a web site with user interaction will load results from the database and display sorted results to user. The web site is not described in this deliverable. See Deliverable D6.1.
3.3.6 Simulation Time Analysis
During the testing period, it became clear that one of the challenges of completing the simulations within WP6 would be that some of the DELPHIN simulations turn out to be extremely slow or would encounter numerical problems, which caused the simulation to stop.
Test Run To get an overview of such behaviour, a small study was carried out with the objective of analysing the simulation times and creating a model for predicting the time it would take new simulations to finish.
This study was based on the first proper test run, which consisted of 910 simulated DELPHIN projects. The sampling strategy used was for many of the parameters identical to those of the full simulation run. There were however, a few changes in order to decrease the number of simulations needed for convergence. Only one weather station: “KobenhavnTaastrup” was used, the starting year was either 2020 or 2045 and only two insulation systems and one case without insulation were considered.
637268 - RIBuild - H2020-EE-03-2014 Dissemination level: PU
Page 21 of 52
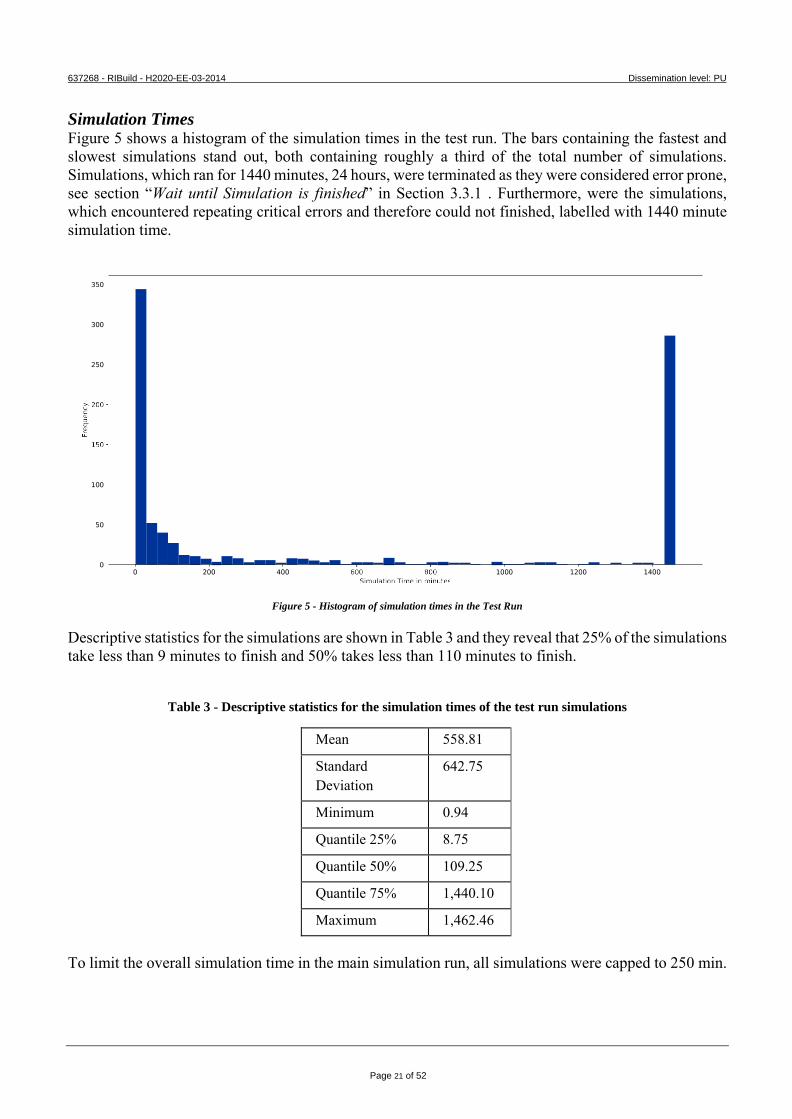
Simulation Times Figure 5 shows a histogram of the simulation times in the test run. The bars containing the fastest and slowest simulations stand out, both containing roughly a third of the total number of simulations. Simulations, which ran for 1440 minutes, 24 hours, were terminated as they were considered error prone, see section “Wait until Simulation is finished” in Section 3.3.1 . Furthermore, were the simulations, which encountered repeating critical errors and therefore could not finished, labelled with 1440 minute simulation time.
Figure 5 - Histogram of simulation times in the Test Run
Descriptive statistics for the simulations are shown in Table 3 and they reveal that 25% of the simulations take less than 9 minutes to finish and 50% takes less than 110 minutes to finish.
Table 3 - Descriptive statistics for the simulation times of the test run simulations
Mean 558.81
Standard Deviation
642.75
Minimum 0.94
Quantile 25% 8.75
Quantile 50% 109.25
Quantile 75% 1,440.10
Maximum 1,462.46
To limit the overall simulation time in the main simulation run, all simulations were capped to 250 min.
637268 - RIBuild - H2020-EE-03-2014 Dissemination level: PU
Page 22 of 52
3.4 Software
3.4.1 DELPHIN 6
“DELPHIN is a simulation program for the coupled heat, moisture, and matter transport in porous building materials.”
(http://bauklimatik-dresden.de/delphin/index.php?aLa=en)
DELPHIN is developed by the RIBuild partner TU Dresden and has been an essential tool in developing the WP6 ICT.
A more in depth description of DELPHIN can be found in (RIBuild Deliverable D4.1, 2017).
3.4.2 Python
Python is the main programming language of the WP6 ICT. Both the backend (2.x in Figure 1) and frontend (3.x in Figure 1) are written in Python. Python is a dynamic and flexible language, which has a rich eco-system of libraries to be used for creating a system like the one for WP6 ICT (https://python.org/).
NumPy, SciPy and Pandas NumPy, SciPy and Pandas are three mathematical/scientific packages for Python, which gives access to advanced and fast mathematical operations such as array and matrix operations (https:// scipy.org/).
Scikit-Learn Scikit-learn builds upon NumPy, SciPy and Pandas and enables the user to do machine learning (https://scikit-learn.org/stable/index.html).
Matplotlib Matplotlib is a widely used plotting package for Python. It works very well together with NumPy, SciPy, Pandas and Scikit-Learn (https://matplotlib.org/).
Django Django is a high-level web framework for Python, which makes it easy to build secure and feature rich web applications (https://www.djangoproject.com/).
Xmltodict and lxml DELPHIN 6 project files are formatted as xml and xmltodict (https://pypi.org/project/xmltodict/) and lxml (https://lxml.de/) makes it easy to manipulate those files by bridging Python’s data model with xml files.
SSHTunnel and Paramiko SSHTunnel (https://sshtunnel.readthedocs.io/en/latest/) and Paramiko (http://www.paramiko.org/) are two Python packages, which enables communication and execution of commands through SSH connections. They have been essential tools for coupling the different micro services.
637268 - RIBuild - H2020-EE-03-2014 Dissemination level: PU
Page 23 of 52
MongoEngine MongoEngine (http://mongoengine.org/) is Object Relational Mapping (ORM) between Python and MongoDB. MongoEngine makes it possible to have a seamless dataflow between MongoDB and Python’s data model.
PyTest PyTest (https://docs.pytest.org/en/latest/) is a testing library for Python. To deliver reliable software a good testing suite is needed. PyTest is a feature-rich testing tool and was used to test the different parts of the WP6 ICT.
3.4.3 Version Control
Git Git (https://git-scm.com/) is a widely used version control software, which makes collaboration between developers, on the same codebase easy.
Github Github (https://github.com) is one of the most widely used cloud solutions for hosting Git repositories.
Travis-CI Continuous Integration is another essential part of modern software development and Travis-CI (https://travis-ci.org/) is a tool for running tests in the cloud.
Docker Hub Docker Hub (https://hub.docker.com/) is a cloud solution for hosting Docker images making it easy to deploy those images in containers for your different micro services.
3.4.4 Docker
The WP6 ICT is broken down into several services, which runs in Docker Containers. The Containers makes it easy to deploy and update code in production.
“A container is a standard unit of software that packages up code and all its dependencies so the application runs quickly and reliably from one computing environment to another. A Docker container image is a lightweight, standalone, executable package of software that includes everything needed to run an application: code, runtime, system tools, system libraries and
settings.”
(https://www.docker.com/resources/what-container)
Docker Images Docker Images is what the containers are built on. They contain all the information and software needed to run an application.
Python 3.7.1-slim Both the Simulation Worker and Sampling Worker is based on the Python: 3.7.1-slim image. The image is based on a light-weight version Debian to keep the image as small as possible.

637268 - RIBuild - H2020-EE-03-2014 Dissemination level: PU
Page 24 of 52
Loggly The iamatypeofwalrus/logspout-loggly image (https://github.com/iamatypeofwalrus/logspout-loggly) is used as the Logging Worker image.
3.4.5 MongoDB
MongoDB (https://www.mongodb.com) is a NoSQL Document Database. A document database does not require a strict schema, which makes it easier to work with and develop on.
637268 - RIBuild - H2020-EE-03-2014 Dissemination level: PU
Page 25 of 52
4 Simulation Input
4.1 Constructions
4.1.1 Configuration of 2D wall segments
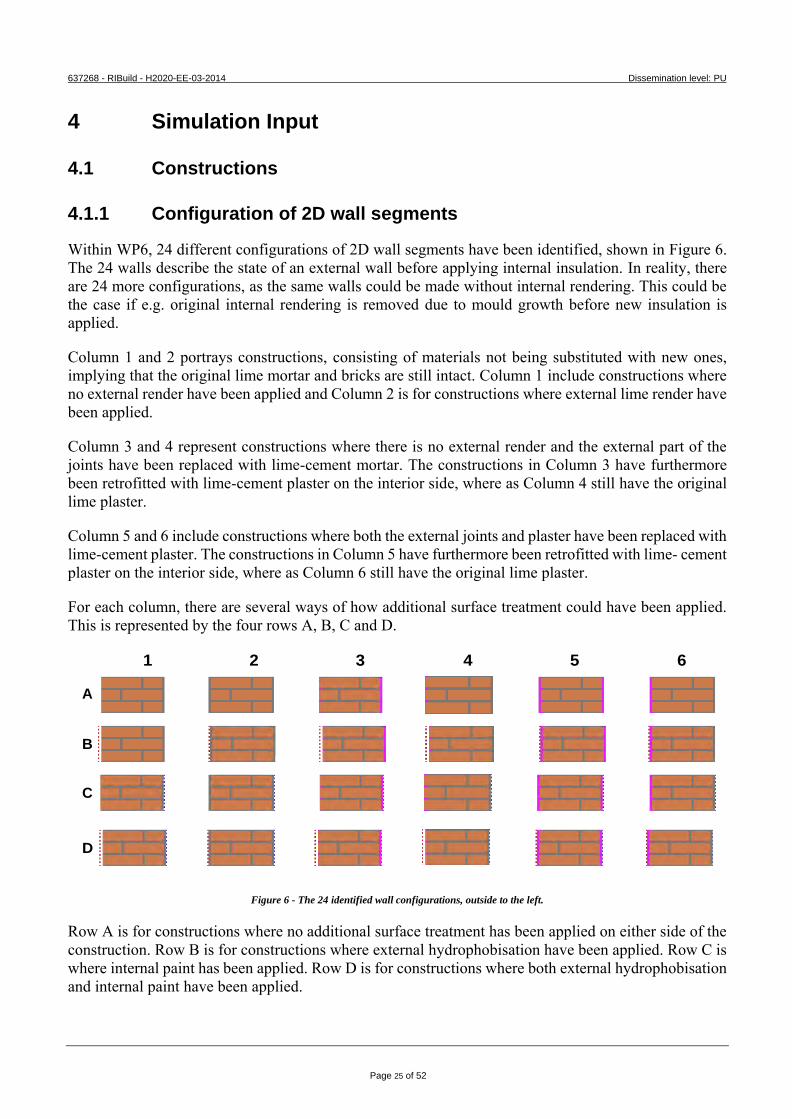
Within WP6, 24 different configurations of 2D wall segments have been identified, shown in Figure 6. The 24 walls describe the state of an external wall before applying internal insulation. In reality, there are 24 more configurations, as the same walls could be made without internal rendering. This could be the case if e.g. original internal rendering is removed due to mould growth before new insulation is applied.
Column 1 and 2 portrays constructions, consisting of materials not being substituted with new ones, implying that the original lime mortar and bricks are still intact. Column 1 include constructions where no external render have been applied and Column 2 is for constructions where external lime render have been applied.
Column 3 and 4 represent constructions where there is no external render and the external part of the joints have been replaced with lime-cement mortar. The constructions in Column 3 have furthermore been retrofitted with lime-cement plaster on the interior side, where as Column 4 still have the original lime plaster.
Column 5 and 6 include constructions where both the external joints and plaster have been replaced with lime-cement plaster. The constructions in Column 5 have furthermore been retrofitted with lime- cement plaster on the interior side, where as Column 6 still have the original lime plaster.
For each column, there are several ways of how additional surface treatment could have been applied. This is represented by the four rows A, B, C and D.
1 2 3 4 5 6
A
B
C
D
Figure 6 - The 24 identified wall configurations, outside to the left.
Row A is for constructions where no additional surface treatment has been applied on either side of the construction. Row B is for constructions where external hydrophobisation have been applied. Row C is where internal paint has been applied. Row D is for constructions where both external hydrophobisation and internal paint have been applied.
637268 - RIBuild - H2020-EE-03-2014 Dissemination level: PU
Page 26 of 52
As WP6 only deals with 1D constructions, it is possible to reduce the number of construction types significantly. There is inherently only four types: one without render on any side, one with render on both sides and two with one layer of rendering, either on the inside or on the outside.
Whether the construction has lime or lime-cement plaster (internally as well as externally) can been treated as a variable in the probabilistic setup.
Having retrofitted external joints as shown in Column 3 and 4 in Figure 6, cannot be distinguished in a 1D simulation, because joints are not considered in the 1D model. In 1D it would either be interpreted as a wall without external plaster (Column 1), if you imagine the section through one of the bricks, or a wall with retrofitted external plaster (Column 5 or 6), if you imagine the section through one of the joints.
Within WP6, it has been decided not to simulate constructions, which have been treated with external hydrophobisation as there is currently a lack of knowledge of how to model the effect of hydrophobization on the material properties in DELPHIN simulations (RIBuild Deliverable D2.3, 2020).
As a prerequisite for using the WP6 simulation tool it is required that the internal surface of the wall has been cleaned, which also implies that all prior surface treatments should be removed including interior paint.
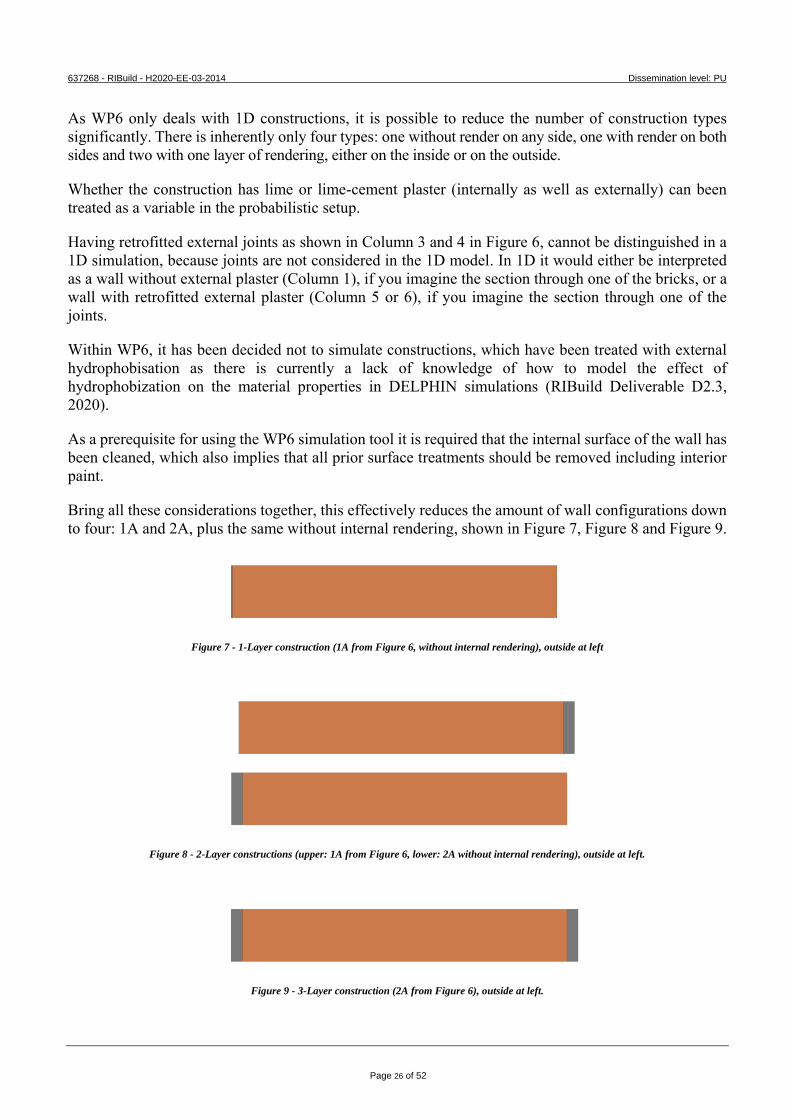
Bring all these considerations together, this effectively reduces the amount of wall configurations down to four: 1A and 2A, plus the same without internal rendering, shown in Figure 7, Figure 8 and Figure 9.
Figure 7 - 1-Layer construction (1A from Figure 6, without internal rendering), outside at left
Figure 8 - 2-Layer constructions (upper: 1A from Figure 6, lower: 2A without internal rendering), outside at left.
Figure 9 - 3-Layer construction (2A from Figure 6), outside at left.
637268 - RIBuild - H2020-EE-03-2014 Dissemination level: PU
Page 27 of 52
4.1.2 Material Layers
The 1D wall constructions are modelled in DELPHIN 6.0 (http://www.bauklimatik-dresden.de/delphin/index.php). The uninsulated versions consists of two or three layers (see Figure 8 and 9), depending on whether or not the construction has external render. The insulated constructions have either two or three additional layers (Figure 11), which holds the insulation layers.
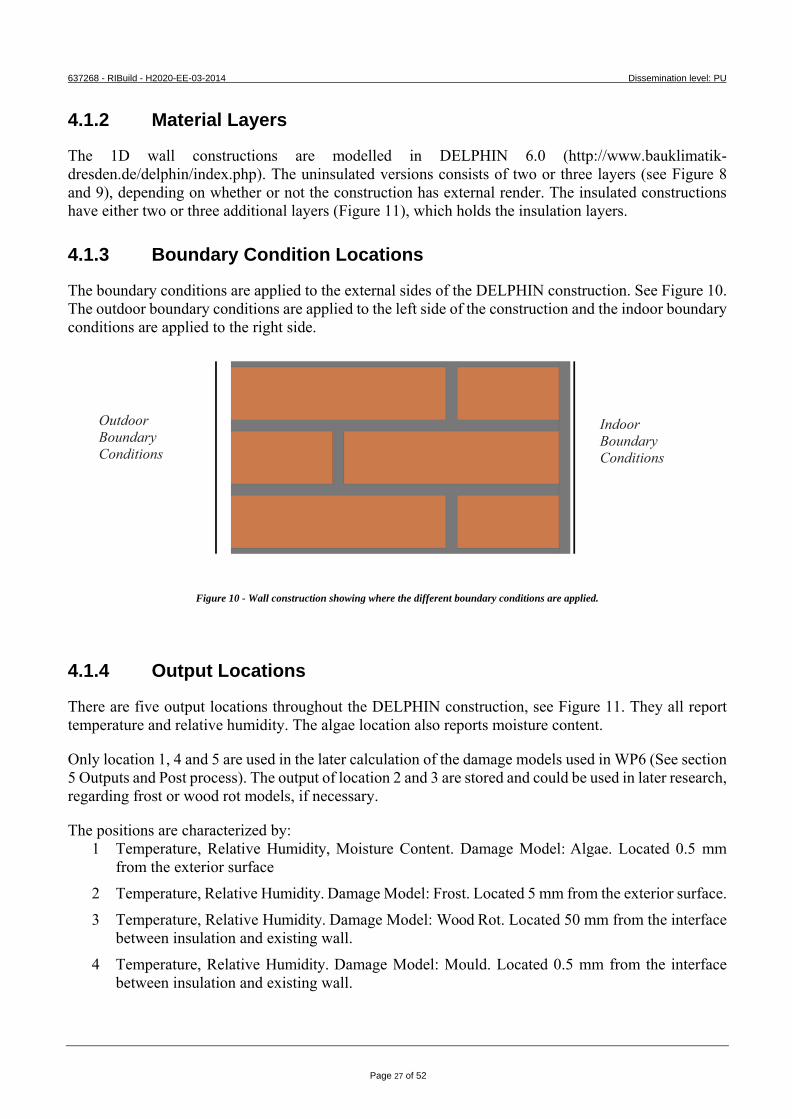
4.1.3 Boundary Condition Locations
The boundary conditions are applied to the external sides of the DELPHIN construction. See Figure 10. The outdoor boundary conditions are applied to the left side of the construction and the indoor boundary conditions are applied to the right side.
Figure 10 - Wall construction showing where the different boundary conditions are applied.
4.1.4 Output Locations
There are five output locations throughout the DELPHIN construction, see Figure 11. They all report temperature and relative humidity. The algae location also reports moisture content.
Only location 1, 4 and 5 are used in the later calculation of the damage models used in WP6 (See section 5 Outputs and Post process). The output of location 2 and 3 are stored and could be used in later research, regarding frost or wood rot models, if necessary.
The positions are characterized by: 1 Temperature, Relative Humidity, Moisture Content. Damage Model: Algae. Located 0.5 mm
from the exterior surface 2 Temperature, Relative Humidity. Damage Model: Frost. Located 5 mm from the exterior surface. 3 Temperature, Relative Humidity. Damage Model: Wood Rot. Located 50 mm from the interface
between insulation and existing wall. 4 Temperature, Relative Humidity. Damage Model: Mould. Located 0.5 mm from the interface
between insulation and existing wall.
Outdoor Boundary Conditions
Indoor Boundary Conditions
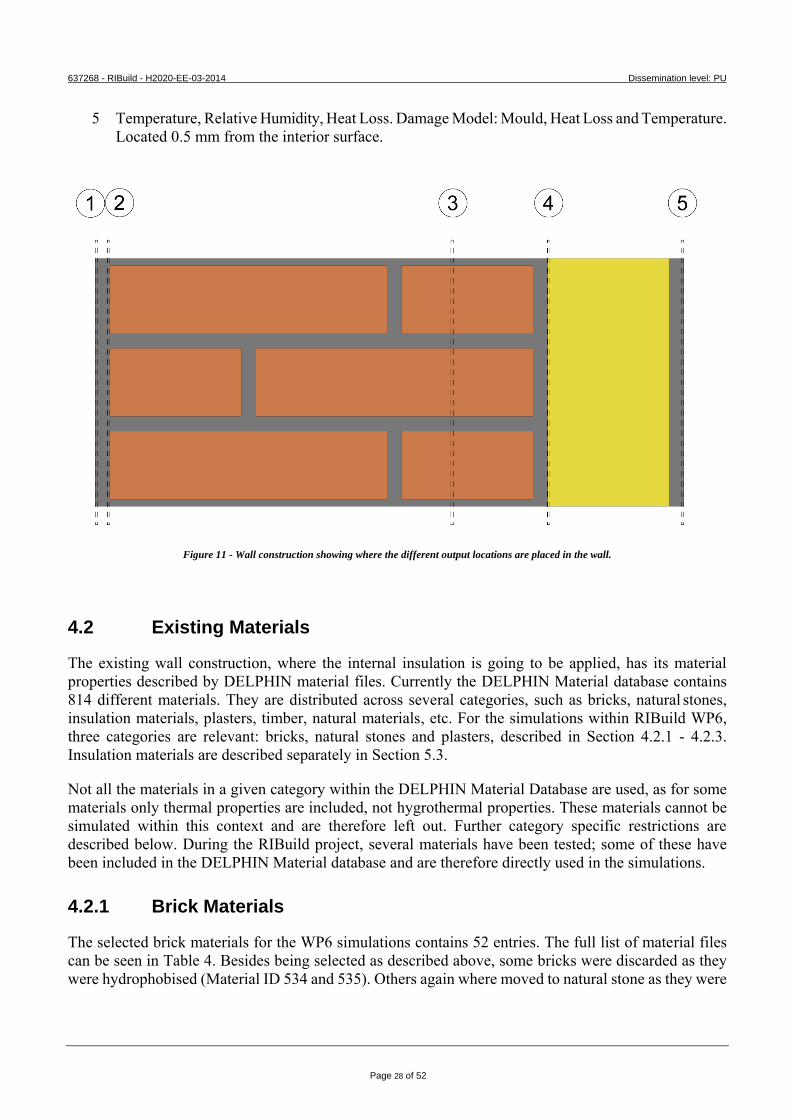
637268 - RIBuild - H2020-EE-03-2014 Dissemination level: PU
Page 28 of 52
5 Temperature, Relative Humidity, Heat Loss. Damage Model: Mould, Heat Loss and Temperature. Located 0.5 mm from the interior surface.
Figure 11 - Wall construction showing where the different output locations are placed in the wall.
4.2 Existing Materials
The existing wall construction, where the internal insulation is going to be applied, has its material properties described by DELPHIN material files. Currently the DELPHIN Material database contains 814 different materials. They are distributed across several categories, such as bricks, natural stones, insulation materials, plasters, timber, natural materials, etc. For the simulations within RIBuild WP6, three categories are relevant: bricks, natural stones and plasters, described in Section 4.2.1 - 4.2.3. Insulation materials are described separately in Section 5.3.
Not all the materials in a given category within the DELPHIN Material Database are used, as for some materials only thermal properties are included, not hygrothermal properties. These materials cannot be simulated within this context and are therefore left out. Further category specific restrictions are described below. During the RIBuild project, several materials have been tested; some of these have been included in the DELPHIN Material database and are therefore directly used in the simulations.
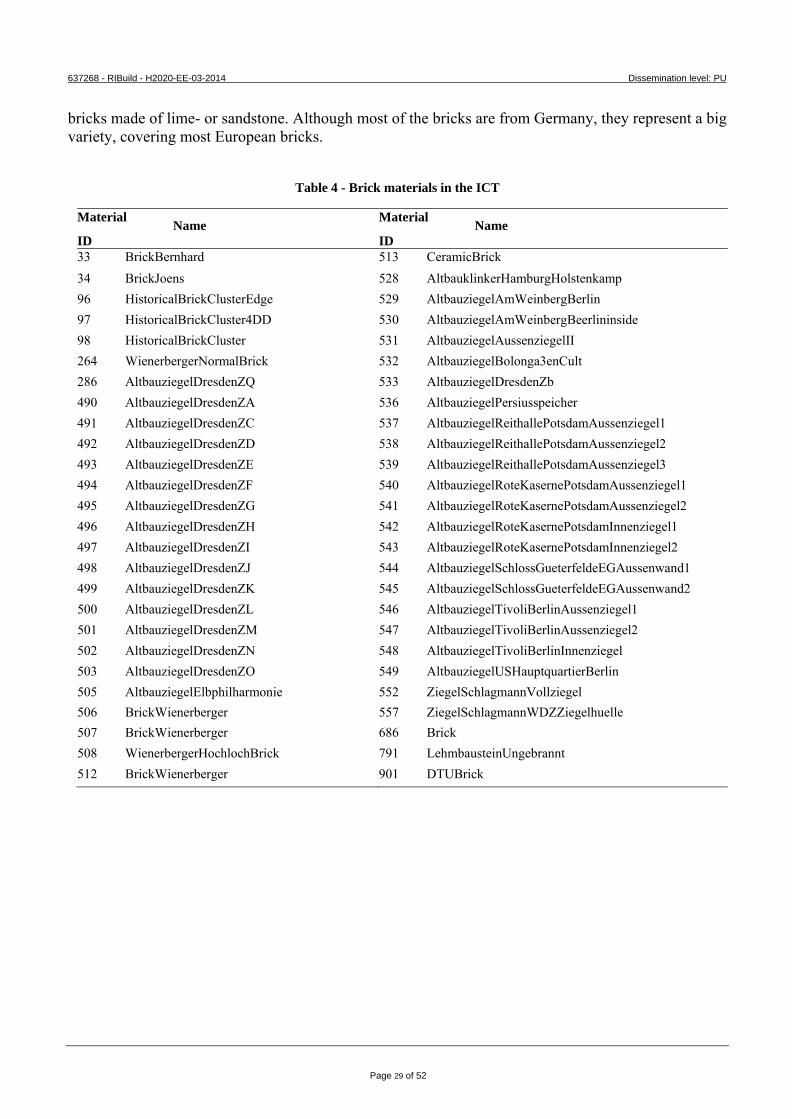
4.2.1 Brick Materials
The selected brick materials for the WP6 simulations contains 52 entries. The full list of material files can be seen in Table 4. Besides being selected as described above, some bricks were discarded as they were hydrophobised (Material ID 534 and 535). Others again where moved to natural stone as they were
637268 - RIBuild - H2020-EE-03-2014 Dissemination level: PU
Page 29 of 52
bricks made of lime- or sandstone. Although most of the bricks are from Germany, they represent a big variety, covering most European bricks.
Table 4 - Brick materials in the ICT
Material Name
ID
Material Name
ID
33 BrickBernhard 513 CeramicBrick 34 BrickJoens 528 AltbauklinkerHamburgHolstenkamp 96 HistoricalBrickClusterEdge 529 AltbauziegelAmWeinbergBerlin 97 HistoricalBrickCluster4DD 530 AltbauziegelAmWeinbergBeerlininside 98 HistoricalBrickCluster 531 AltbauziegelAussenziegelII 264 WienerbergerNormalBrick 532 AltbauziegelBolonga3enCult 286 AltbauziegelDresdenZQ 533 AltbauziegelDresdenZb 490 AltbauziegelDresdenZA 536 AltbauziegelPersiusspeicher 491 AltbauziegelDresdenZC 537 AltbauziegelReithallePotsdamAussenziegel1 492 AltbauziegelDresdenZD 538 AltbauziegelReithallePotsdamAussenziegel2 493 AltbauziegelDresdenZE 539 AltbauziegelReithallePotsdamAussenziegel3 494 AltbauziegelDresdenZF 540 AltbauziegelRoteKasernePotsdamAussenziegel1 495 AltbauziegelDresdenZG 541 AltbauziegelRoteKasernePotsdamAussenziegel2 496 AltbauziegelDresdenZH 542 AltbauziegelRoteKasernePotsdamInnenziegel1 497 AltbauziegelDresdenZI 543 AltbauziegelRoteKasernePotsdamInnenziegel2 498 AltbauziegelDresdenZJ 544 AltbauziegelSchlossGueterfeldeEGAussenwand1 499 AltbauziegelDresdenZK 545 AltbauziegelSchlossGueterfeldeEGAussenwand2 500 AltbauziegelDresdenZL 546 AltbauziegelTivoliBerlinAussenziegel1 501 AltbauziegelDresdenZM 547 AltbauziegelTivoliBerlinAussenziegel2 502 AltbauziegelDresdenZN 548 AltbauziegelTivoliBerlinInnenziegel 503 AltbauziegelDresdenZO 549 AltbauziegelUSHauptquartierBerlin 505 AltbauziegelElbphilharmonie 552 ZiegelSchlagmannVollziegel 506 BrickWienerberger 557 ZiegelSchlagmannWDZZiegelhuelle 507 BrickWienerberger 686 Brick 508 WienerbergerHochlochBrick 791 LehmbausteinUngebrannt 512 BrickWienerberger 901 DTUBrick
637268 - RIBuild - H2020-EE-03-2014 Dissemination level: PU
Page 30 of 52
4.2.2 Natural Stone Materials
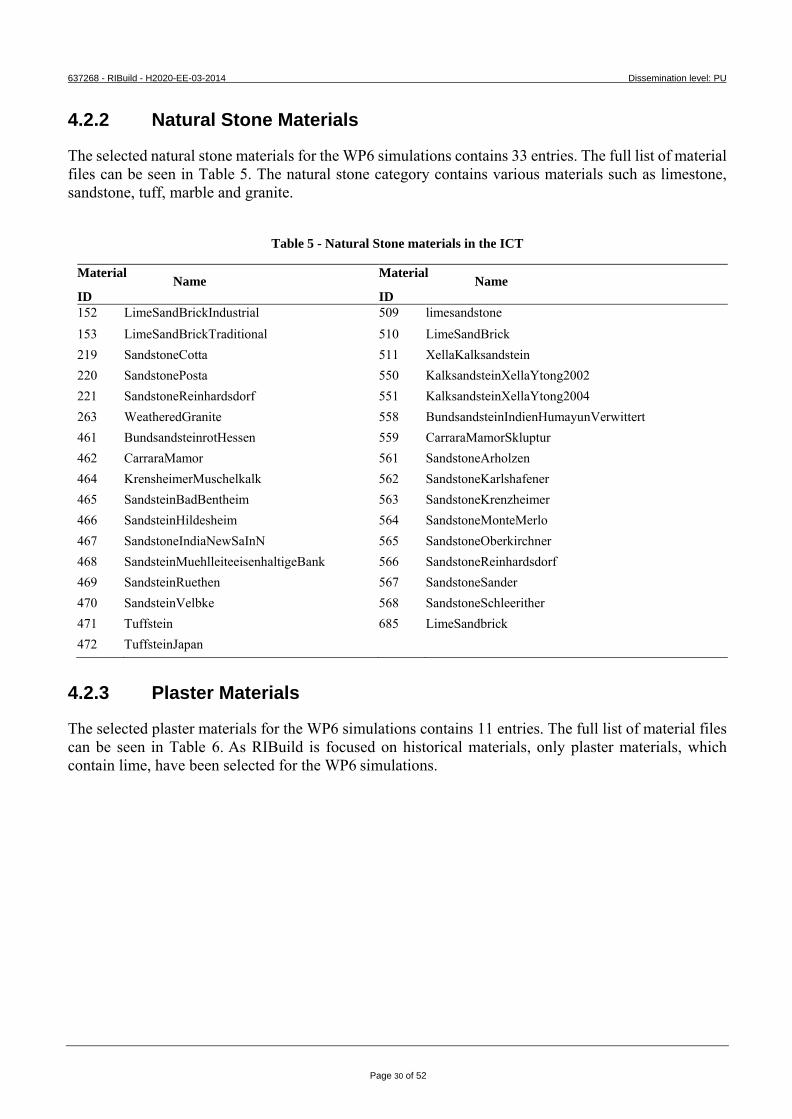
The selected natural stone materials for the WP6 simulations contains 33 entries. The full list of material files can be seen in Table 5. The natural stone category contains various materials such as limestone, sandstone, tuff, marble and granite.
Table 5 - Natural Stone materials in the ICT
Material Name
ID
Material Name
ID
152 LimeSandBrickIndustrial 509 limesandstone 153 LimeSandBrickTraditional 510 LimeSandBrick 219 SandstoneCotta 511 XellaKalksandstein 220 SandstonePosta 550 KalksandsteinXellaYtong2002 221 SandstoneReinhardsdorf 551 KalksandsteinXellaYtong2004 263 WeatheredGranite 558 BundsandsteinIndienHumayunVerwittert 461 BundsandsteinrotHessen 559 CarraraMamorSkluptur 462 CarraraMamor 561 SandstoneArholzen 464 KrensheimerMuschelkalk 562 SandstoneKarlshafener 465 SandsteinBadBentheim 563 SandstoneKrenzheimer 466 SandsteinHildesheim 564 SandstoneMonteMerlo 467 SandstoneIndiaNewSaInN 565 SandstoneOberkirchner 468 SandsteinMuehlleiteeisenhaltigeBank 566 SandstoneReinhardsdorf 469 SandsteinRuethen 567 SandstoneSander 470 SandsteinVelbke 568 SandstoneSchleerither 471 Tuffstein 685 LimeSandbrick 472 TuffsteinJapan
4.2.3 Plaster Materials
The selected plaster materials for the WP6 simulations contains 11 entries. The full list of material files can be seen in Table 6. As RIBuild is focused on historical materials, only plaster materials, which contain lime, have been selected for the WP6 simulations.
637268 - RIBuild - H2020-EE-03-2014 Dissemination level: PU
Page 31 of 52
Table 6 - Plaster materials in the ICT
Material ID Name
143 Lime Cement Mortar
145 Lime Cement Plaster
148 Lime Plaster Historical
150 Lime Plaster
520 Lime Plaster Bolonga
628 Lime Plaster Fine
629 Lime Plaster
630 Lime Cement Plaster Light
717 Lime Cement Mortar (High Cement Ratio)
718 Lime Cement Mortar (Low Cement Ratio)
902 DTUMortar
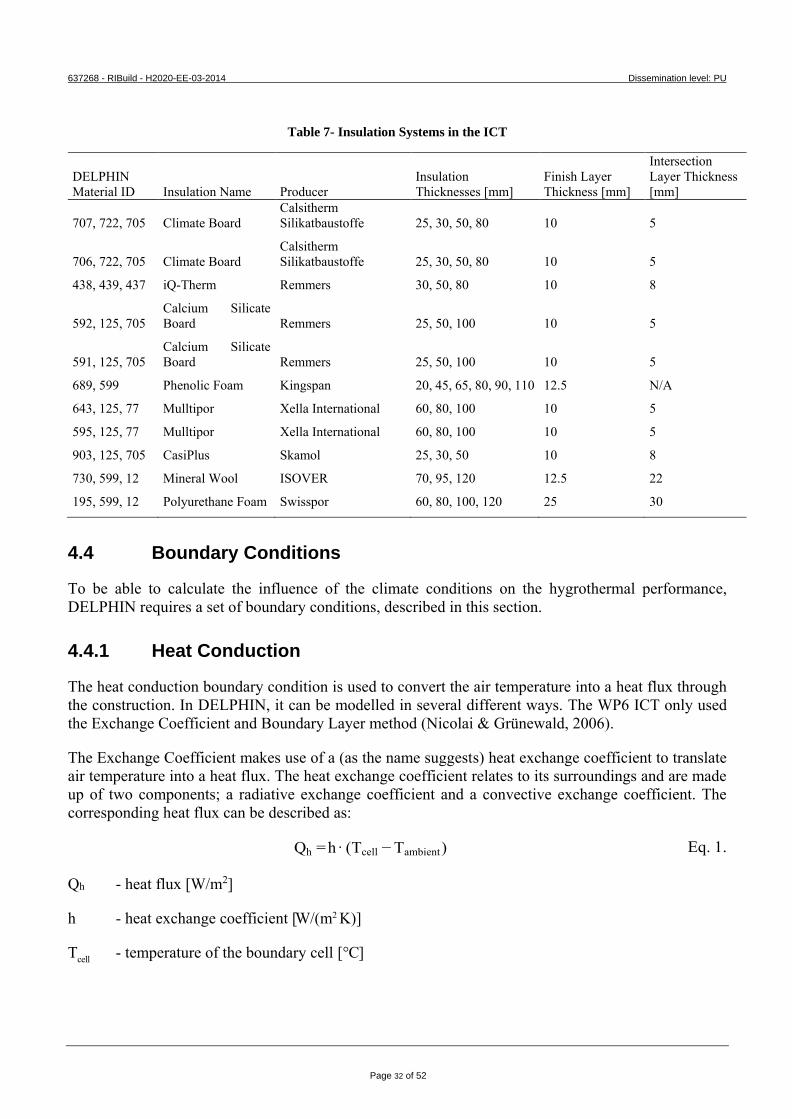
4.3 Insulation Materials
Insulation in the ICT is always applied as a system, i.e. the insulation comes together with at least one layer on each side of the actual insulation material. The insulation systems are modelled as close as possible to the producers’ specifications in an attempt to make them as realistic as possible. The insulation systems are chosen to have as broad a spectrum of insulation material types as possible, while remaining inside of the constrains of the DELPHIN Material Database and having materials that represent a whole system resembling what actual producers specify. Consequently, insulation materials that are not part of a well-defined system are omitted, except for a system with mineral wool, as this is regarded as a very common way of applying internal insulation and was therefore included with a standard gypsum board as finishing layer. Further, the chosen systems represents the WP3 case studies, being examples of systems being used in Europe (RIBuild deliverable D3.2, 2019).
All insulation systems consists of three layers: 1 Intersection Layer.
The intersection layer is located between the existing wall and the insulation material. The intersection layer material is typically some kind of glue mortar. The detail layer has a fixed thickness. The Phenolic Foam from Kingspan does not have intersection layer as the insulation material is applied directly on the existing construction.
2 Insulation Layer. The insulation layer is the layer of the actual insulation material. The insulation layer typically exists in different thicknesses, illustrated in Table 7.
3 Finish Layer. The finish layer is the innermost layer of the construction. It is the layer between the insulation material and indoor environment. The finish material is typically a plaster material or a gypsum board. The finish material has a fixed thickness.
637268 - RIBuild - H2020-EE-03-2014 Dissemination level: PU
Page 32 of 52
Table 7- Insulation Systems in the ICT
DELPHIN Material ID Insulation Name Producer
Insulation Thicknesses [mm]
Finish Layer Thickness [mm]
Intersection Layer Thickness [mm]
707, 722, 705 Climate Board Calsitherm Silikatbaustoffe 25, 30, 50, 80 10 5
706, 722, 705 Climate Board Calsitherm Silikatbaustoffe 25, 30, 50, 80 10 5
438, 439, 437 iQ-Therm Remmers 30, 50, 80 10 8
592, 125, 705 Calcium Silicate Board Remmers 25, 50, 100 10 5
591, 125, 705 Calcium Silicate Board Remmers 25, 50, 100 10 5
689, 599 Phenolic Foam Kingspan 20, 45, 65, 80, 90, 110 12.5 N/A
643, 125, 77 Mulltipor Xella International 60, 80, 100 10 5
595, 125, 77 Mulltipor Xella International 60, 80, 100 10 5
903, 125, 705 CasiPlus Skamol 25, 30, 50 10 8
730, 599, 12 Mineral Wool ISOVER 70, 95, 120 12.5 22
195, 599, 12 Polyurethane Foam Swisspor 60, 80, 100, 120 25 30
4.4 Boundary Conditions
To be able to calculate the influence of the climate conditions on the hygrothermal performance, DELPHIN requires a set of boundary conditions, described in this section.
4.4.1 Heat Conduction
The heat conduction boundary condition is used to convert the air temperature into a heat flux through the construction. In DELPHIN, it can be modelled in several different ways. The WP6 ICT only used the Exchange Coefficient and Boundary Layer method (Nicolai & Grünewald, 2006).
The Exchange Coefficient makes use of a (as the name suggests) heat exchange coefficient to translate air temperature into a heat flux. The heat exchange coefficient relates to its surroundings and are made up of two components; a radiative exchange coefficient and a convective exchange coefficient. The corresponding heat flux can be described as:
Qh = h · (Tcell − Tambient ) Eq. 1.
Qh - heat flux [W/m2]
h - heat exchange coefficient [W/(m2 K)]
Tcell - temperature of the boundary cell [°C]
637268 - RIBuild - H2020-EE-03-2014 Dissemination level: PU
Page 33 of 52
Tambient - ambient air temperature [°C]
The Boundary Layer Method is similar to the Exchange Coefficient method but it lets the convective exchange coefficient be a function of the air speed given:
Qh = h(v) · (Tcell − Tambient ) Eq. 2.
Qh - heat flux [W/m2]
h(v)= h0 + kslope · vkexp Eq. 3.
h0 - exchange coefficient at 0 m/s [W/(m2 K)]
kslope - slope coefficient [J/(m3 K)]
kexp - air speed exponent [ - ]
v - air speed [m/s]
Tcell - temperature of the boundary cell [°C]
Tambient - ambient air temperature [°C]
In DELPHIN, the heat conduction boundary condition should be applied on both the exterior and interior side of the construction.
Exterior The exterior heat conduction is modelled as a boundary layer with variable air velocity to be able to mimic the variance in wind speed around the building and its influence on the convection of the heat conduction (Sharples, 1984), (Mirsadeghi, Cóstola, Blocken, & Hensen, 2013), (Defraeye, Blocken, & Carmeliet, 2011).
The following variables are set for the exterior heat conduction: • Exchange Coefficient for Still Air, h0: 4.0 W/m2K
• Slope Coefficient for Moving Air, kslope: 1.0 to 4.0 J/m3K sampled as a uniform continued distribution
• Exponent for Moving Air, kexp: : 1.0 -
Climate Data: • Exterior Temperature [°C] • Wind Speed [m/s]
Interior In the indoor environment, the air movement is more stable compared to the outdoor; therefore it is chosen to model the heat conduction as an Exchange Coefficient (Obyn & Van Moeseke, 2015), (Peeters, Beausoleil-Morrison, & Novoselac, 2011).
637268 - RIBuild - H2020-EE-03-2014 Dissemination level: PU
Page 34 of 52
The following variables are set for the interior heat conduction: • Exchange Coefficient for Still Air: 5.0 to 10.0 W/m2K sampled as a uniform continued
distribution
Climate Data: • Interior Temperature [°C]
4.4.2 Vapour Diffusion
The Vapour Diffusion Boundary Condition is used to translate a relative humidity in the air into a vapour flux in the construction. In DELPHIN, it can be modelled in several different ways. The WP6 ICT only used the Exchange Coefficient and Boundary Layer method (Nicolai & Grunewald, 2006).
The vapour diffusion boundary condition are as the heat conduction applied to both the exterior and interior side of the construction. The Moisture Transfer Coefficient is computed as dependent on the heat conduction:
mc = k*h Eq. 4
mc - moisture transfer coefficient
h - heat transfer coefficient
k - conversion coefficient
The conversion coefficient is a probabilistic variable and is sampled as a uniform continued distribution from 4 * 10-9 to 10-8.
As DELPHIN does not allow boundary coefficients to be a list of numbers, the exterior vapour diffusion is modelled as a Boundary Layer to be able to be dependent on the exterior heat conduction. The interior vapour diffusion is modelled as an Exchange Coefficient (Worch, 2004), (EN 15026, 2007).
The Boundary Layer Method can be formulated as:
Qv = β(v) · (pvcell − pvambient ) Eq. 5.
Qv is the vapour flux [kg/(m2s)]
β(v)= β0 + kslope · vkexp Eq. 6.
β0 - exchange coefficient at 0 m/s [s/m]
kslope - slope coefficient [s2/m2]
kexp - air speed exponent [ - ]
v - air speed [m/s]
pvcell - vapour pressure in the boundary cell [Pa]
637268 - RIBuild - H2020-EE-03-2014 Dissemination level: PU
Page 35 of 52
v
pvambient - vapour pressure in the ambient air given [Pa]
Exterior The following variables are set for the exterior vapour diffusion:
• Exchange Coefficient for Still Air, β0,: 8*10-9 to 4 * 10-8 s/m reversed engineered from Eq. 4 • Slope Coefficient for Moving Air, kslope: 4*10-9 to 4*10-8 s2/m2 reversed engineered from Eq. 4
• Exponent for Moving Air: 1.0 [-] • Sd-value: is taken from the insulation systems. See section 4.3 • Climate Data: • Exterior Temperature [°C] • Exterior Relative Humidity [%] • Wind Speed [m/s]
Interior For the interior side of the construction the Exchange Coefficient Method is used as the Vapour Diffusion boundary Condition (Nicolai & Grunewald, 2006). It can be formulated as:
Qv = β(v) · (pvcell − pvambient ) Eq. 7.
Qv - vapour flux [kg/m2s]
β - exchange coefficient [s/m]
pvcell - vapour pressure in the boundary cell [Pa]
pvambient - vapour pressure in the ambient air [Pa]
The following variables are set for the interior vapour diffusion: • Exchange Coefficient for Still Air, β,: Computed with Eq. 4 • k is sampled as an uniform continued distribution from 4*10-9 to 10-8 [ - ] • Sd-value: 0.0 to 0.6 m sampled as a uniform continued distribution.
4.4.3 Long Wave Radiation
The Long Wave Radiation Boundary Condition describes the heat radiation emission from the wall. The Long Wave Radiation is only applied to the external side of the construction. The Long Wave Radiation is modelled with the Long Wave Radiation Components Boundary Condition method.
The following variables are set for the long wave emission: • Emission Coefficient: 0.9 [-]
Climate Data: • Atmospheric Counter Radiation [W/m2]
637268 - RIBuild - H2020-EE-03-2014 Dissemination level: PU
Page 36 of 52
4.4.4 Short Wave Radiation
The Short Wave Radiation Boundary Condition describes the sun radiation on the wall. For the Short Wave Radiation Boundary Condition pre-calculated radiation data is used, based on
(Svendsen, 1998). The model computes the solar radiation hitting a wall based on the horizontal global radiation, the wall orientation and inclination. When utilizing the pre-calculated data it is possible to apply the short wave radiation boundary condition as an Imposed Flux (Yao & Yan, 2011).
The following variables are set for the short wave radiation: • Short Wave Absorption Coefficient: 0.4 to 0.8 sampled as a uniform continues distribution.
Climate Data: • Short wave radiation [W/m2]
4.4.5 Wind Driven Rain
Wind Driven Rain (WDR) is the amount of rain hitting a vertical wall. For the Wind Driven Rain Boundary Condition, pre-calculated data is used; computed as described in (Blocken & Carmeliet, 2002). When utilizing the pre-calculated data it is possible to apply the wind driven rain as an imposed flux. The following variables are set for the wind driven rain:
• Rain Exposure Coefficient: 0.0 to 2.0 sampled as a uniform continues distribution. • Minimum Rain Temperature: -2°C Climate Data: • Exterior Temperature [°C] • Exterior Relative Humidity [%]
• Rain Flux Normal to Wall Construction [mm/h]
4.5 Weather
4.5.1 Preliminary investigations
The research work began with an introductory literature study and online search for other weather related projects. This study showed that specific weather are used in some weather data - including dry, epw, etc. The survey also showed that some referenced weather data from airports or the US organization NOAA.
The Danish Meteorological Institute (DMI) were asked if they knew about a weather dataset or were able to deliver such for a EU project. They were not, but referred to the ‘European Centre for Medium-Range Weather Forecasts’ (ECMWF). Unfortunately, this proved to be dead end - see section 4.5.3 for description of ’ECMWF’.
637268 - RIBuild - H2020-EE-03-2014 Dissemination level: PU
Page 37 of 52
4.5.2 The nature of weather data and storage
Weather data is a very complex thing to measure, handle and process. Weather data is a constant stream of data, second for second, but in most cases only logged on a minute or hourly basis.
The weather data needed for hygrothermal simulations consist of different weather parameters with a sampling/time resolution of at least 1/h for all parameters. A DELPHIN simulation needs the following weather data parameters: Temperature (°C), Relative humidity (%), Vertical rain (mm/h), Wind direction (°), Wind speed (m/s), Long wave radiation (w/m2), Diffuse radiation (w/m2) and Direct radiation (W/m2). Other parameters, such as wind driven rain is derived from these parameters.
Predicting weather is the main purpose of most weather stations. Most stations save the data for weather research and climate change purposes - not for research purposes in the Architecture, Engineering and Construction (AEC) industries. While many professional weather stations are able to log data on a minute basis, not all data is saved due to the accumulative big storage size. Some save all the data, but in a highly compressed file format and stored in some kind of ‘deep storage’. These deep storage servers are hard to access for outsiders and some are only accessible with expensive memberships. This is especially true for European weather data.
4.5.3 Weather data sources
Data from more than seven different weather data sources was collected and researched during the period.
Design reference year (DRY), Test Reference Year (TRY) and Energy Plus Weather (EPW) files were the first three file formats investigated. The Design Reference Year and Energy Plus Weather files both consist of only one year of hourly weather data. The one year represents 10 year of data, each month is selected based on weather parameters and a building performance. For DRY and EPW files, typical temperature and solar radiation are the two main criteria. The majority of the time spent on the DRY and EPW research went into trying to find the 10 year data the EPW and DRY files were built upon. DRY and EPW files do not include rain data but maybe the 10-year weather data did. The EPW weather files are mostly fragmented, based on data from National Oceanic and Atmospheric Administration (NOAA) and did not include rain in Europe. TRY and DRY weather were also fragmented but a large amount of work for Europe was made by the Danish professor Hans Lund from DTU. Unfortunately, the data used for his research could not be found.
The main source of weather data for most DTU research projects is currently The Danish
Meteorological Institute (DMI). However, DMI only has Danish weather. DMI is a member of ECMWF and some departments have access to European data. DMI is not allowed to share this data. The data is therefore not available for people outside DMI.
The Automated Surface Observing System (ASOS) is the weather observation system used by airports and airplanes. The system consists primarily of data from airport weather stations; the data is accessible from different websites such as Iowa State University website. A problem with ASOS is the variation of weather data parameters between the stations. While one station may have all weather data, another may only a few parameters with many gaps in the data. Most ASOS weather stations only save rain data for every three hours, which is the main reason ASOS cannot be used. The only way to get an
637268 - RIBuild - H2020-EE-03-2014 Dissemination level: PU
Page 38 of 52
overview of the available data were to download data from a large number of stations. The data was downloaded through a special developed Python web scraper and visualized through matplotlib.
The European Climate Assessment & Dataset Project (ECAD) was also investigated. It became quickly evident that the weather data from ECAD did not fulfil the requirement from the RIBuild project. A daily sampled weather data set were available from the website. The underlying data comes from ECMWF. A mail correspondence with a responsible within the ECAD did not yield any results.
National Oceanic and Atmospheric Administration (NOAA) collects weather data from all over the world. NOAA has an open source policy to their data, since the US citizen already have paid for it once through the taxes. Much data from local weather station websites etc. could also be found through NOAA. The NOAA weather data set has the same problem as the ASOS weather data. The difference between the stations and the gaps in the data. This was identified by downloading weather data through a web scraper with python. However, the web scraping method was much harder to install and involved running an old java based script. After getting an overview of the available data is was concluded that handling and processing the raw data from NOAA should be the last resort. Especially the rain data seemed to be fragmented with lots of gaps and different sample rates.
The European Centre for Medium-Range Weather Forecasts (ECMWF) is comparable to NOAA. While the NOAA has an open source policy to all their data, the ECMWF has a more closed source commercial policy. After many mail correspondence with DMI, different European contacts, agencies etc. it finally succeed to access and open a gridded weather data file from ECMWF. After some additional research and sampling in the weather files, it was concluded that the file formats from the ECMWF were too cumbersome to handle and the ECMWF would have some the same problems as NOAA.
Beside the larger data sources mentioned above, some local and alternative data sources were investigated. One of these sources was climate data from the Institute for Building Climatology at Dresden University of Technology. The data collected in Germany cities is of high quality and is collected to support DELPHIN simulations. A few similar dataset from the Technical University of Denmark were investigated too. The main problem with these types of data sources is the high possibility of inconsistencies in measurements. Resulting in different hygrothermal simulation results.
Another investigated data source was the open source Internet Of Things (IOT) weather stations. A problem with IOT stations is the inconsistencies and the big variations since each weather station has been set up by amateurs. However, the number and density of stations is high enabling the possibility for statistical analysis. The statistical analysis needed to upgrade and validating the data would be a project on its own. The main problem with IOT weather stations is that data is only stored for a few months.
4.5.4 Technical implementation
To collect and investigate the weather data was time consuming and technical implementation was needed. As already mentioned, both web scraping and plotting with Python was necessary to retrieve and understand the data. Not mentioned is the investigation into NoSQL database schemas to store the large amount of data. The databases and schemas with object document mappers (ODMs) is also used in the final simulation system. Mesoscale Meteorological Models to improve the weather data and Machine Learning algorithms to repair gaps in weather data was also investigated briefly.
637268 - RIBuild - H2020-EE-03-2014 Dissemination level: PU
Page 39 of 52
4.5.5 Climate for culture
Finally, suitable weather files were found in another European project. The chosen weather data used in RIBuild is created from the European research project ‘Climate for Culture’ (https://www.climateforculture.eu/). A copy of the created weather data was procured. The Climate for Culture weather data is a synthetic weather data created to take climate change into account. Based on the Regional Climate Model REMOs weather data from 1961 to 1990, the Climate for Culture created two new weather data sets; for the near future period (2021–2050) and the far future period (2071–2100). The RIBuild project uses the near future period 2021-2050. Both data sets are based on the A1B scenario described in the Special Report on Emissions Scenarios (SRES), which is reported by the Intergovernmental Panel on Climate Change (IPCC) in (Nakicenovic, et al., 2000).
The distribution of weather stations from Climate for Culture used in RIBuild is shown in Figure 4.
637268 - RIBuild - H2020-EE-03-2014 Dissemination level: PU
Page 40 of 52
5 Output and Post processing
5.1 Performance criteria
To evaluate the performance of a construction from a simulated project it is often not enough just to look at the computed output; further performance criteria are needed. Different damage models and energy related characteristics are the performance criteria used in WP6.
5.1.1 Mould
Mould is one of the first indicators of excess moisture in a construction. It is therefore important as a performance criteria. Mould is a fungus that mainly grows on the surface of construction materials, but does not deteriorate the material. However, it effects the interior air quality as it might release spores into the air.
The VTT Mould Index model is perhaps the most widely used model for computing mould growth from hygrothermal simulating results. It computes a Mould Index, from 0 to 6, based upon hourly temperature and relative humidity values. It further depends on material parameters to work.
The VTT Mould Index model (Ojanen et al., 2010) is formulated as:
dM/dt = 1/ (7 * exp(-0.68 * ln(T) – 13.9 * ln(RH) + 0.14 * W – 0.33 * SQ + 66.02)) * k1 * k2 Eq. 8
dM/dt - change in mould index at the time t
T - temperature [°C]
RH - relative humidity [%]
W - timber type. 0 for pine and 1 for spruce.
SQ - surface quality. 0 for sawed surface and 1 for kiln-dried surface.
k1 - can be found in Table 8.
k2 - is found in Eq. 10.
-0.032, when t – ti <= 6 hours;
dM/dt = 0, when 6 hours <= t – ti <= 24 hours; Eq. 9
-0.016, when t – ti > 24 hours
Eq. 9 describes the behaviour when there is unfavourable conditions for mould growth.
k2 = max(1 – exp(2.3*(M + Mmax)), 0) Eq. 10
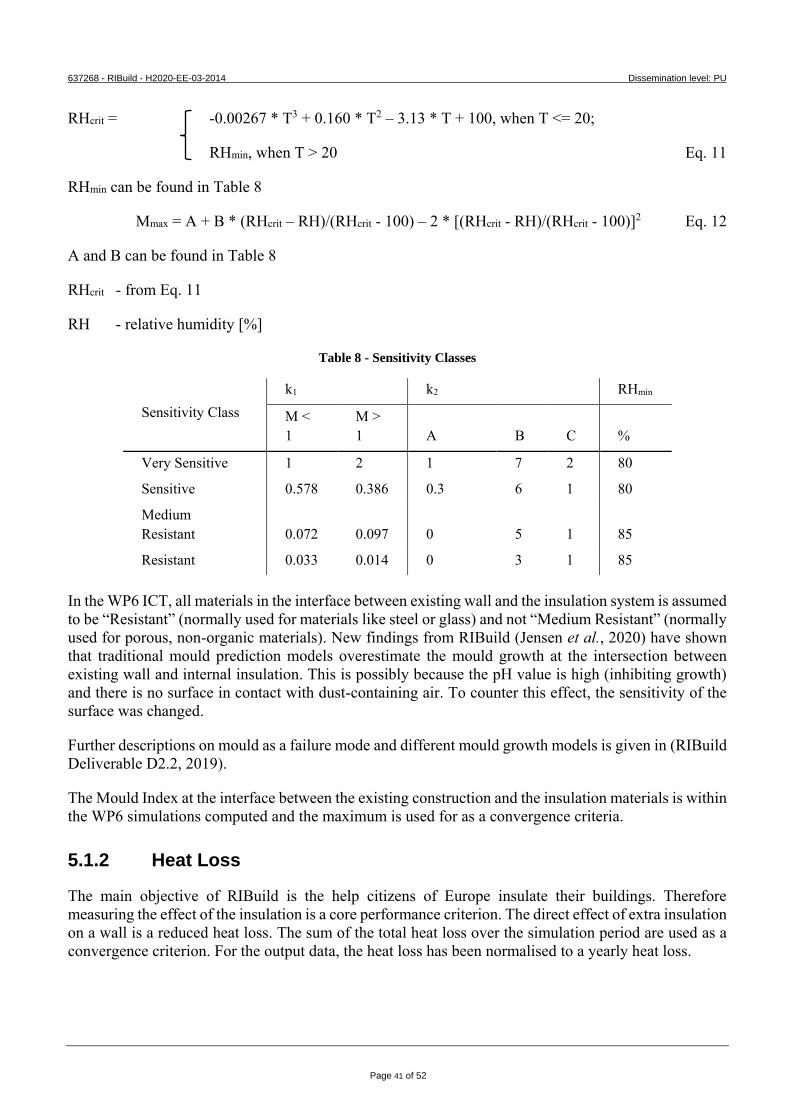
637268 - RIBuild - H2020-EE-03-2014 Dissemination level: PU
Page 41 of 52
RHcrit = -0.00267 * T3 + 0.160 * T2 – 3.13 * T + 100, when T <= 20;
RHmin, when T > 20 Eq. 11
RHmin can be found in Table 8
Mmax = A + B * (RHcrit – RH)/(RHcrit - 100) – 2 * [(RHcrit - RH)/(RHcrit - 100)]2 Eq. 12
A and B can be found in Table 8
RHcrit - from Eq. 11
RH - relative humidity [%]
Table 8 - Sensitivity Classes
Sensitivity Class k1 k2 RHmin
M < 1
M > 1 A B C %
Very Sensitive 1 2 1 7 2 80
Sensitive 0.578 0.386 0.3 6 1 80
Medium Resistant 0.072 0.097 0 5 1 85
Resistant 0.033 0.014 0 3 1 85
In the WP6 ICT, all materials in the interface between existing wall and the insulation system is assumed to be “Resistant” (normally used for materials like steel or glass) and not “Medium Resistant” (normally used for porous, non-organic materials). New findings from RIBuild (Jensen et al., 2020) have shown that traditional mould prediction models overestimate the mould growth at the intersection between existing wall and internal insulation. This is possibly because the pH value is high (inhibiting growth) and there is no surface in contact with dust-containing air. To counter this effect, the sensitivity of the surface was changed.
Further descriptions on mould as a failure mode and different mould growth models is given in (RIBuild Deliverable D2.2, 2019).
The Mould Index at the interface between the existing construction and the insulation materials is within the WP6 simulations computed and the maximum is used for as a convergence criteria.
5.1.2 Heat Loss
The main objective of RIBuild is the help citizens of Europe insulate their buildings. Therefore measuring the effect of the insulation is a core performance criterion. The direct effect of extra insulation on a wall is a reduced heat loss. The sum of the total heat loss over the simulation period are used as a convergence criterion. For the output data, the heat loss has been normalised to a yearly heat loss.
637268 - RIBuild - H2020-EE-03-2014 Dissemination level: PU
Page 42 of 52
5.1.3 U-value
The U-value is an import parameter to present, to compare the different insulation solutions. Heat loss, exterior and interior temperature are used to calculate the value. U-value is not used as convergence criteria, but displayed because this is an important parameter in the building legislation.
Umean = mean[Qi / ((Text,i – Tint,i) * area)] Eq. 13
Qi is the heat loss at time i
Text,i is the exterior temperature at time i
Tint,i is the interior temperature at time i
Area is the wall area.
5.1.4 Surface Temperature
Apart from reducing the heat loss, the improvement of the thermal comfort is often a motivator for insulating a historic building, even if the standard of modern buildings might not be reached. Applying internal insulation increases the interior surface temperature, and the increase can be used to evaluate whether or not the thermal comfort has changed significantly in the retrofitted building. Surface temperature is not used as convergence criteria.
5.1.5 Algae
Algae growth on a building occurs at very high moisture levels and are not directly tied to a deterioration of the wall, but is seen as visual damage. An algae damage model was developed as a part of WP2 (RIBuild Deliverable D2.2, 2019). Algae is not used as a convergence criteria but only shown as extra information. The algae model can be described with following formulas:
2, when material is sandstone α = 100, when material is limestone Eq. 14 1, when material is not limestone or sandstone 1.724, when material is sandstone β = 6.897, when material is limestone Eq. 15 1, when material is not limestone or sandstone 0.2, when material is sandstone γ = 1.6, when material is limestone Eq. 16 1, when material is not limestone or sandstone
637268 - RIBuild - H2020-EE-03-2014 Dissemination level: PU
Page 43 of 52
ra = 3.8447e-4 * porosity - 4.0800e-6 * roughness - 2.1164e-4 Eq. 17 sa = -2.7874e-2 * porosity + 2.95905e-4 * roughness + 1.1856e-2 Eq. 18 ua = 5.5270e-1 * porosity -5.8670e-3 * roughness - 1.4727e-1 Eq. 19 va = -2.1146 * porosity + 2.2450e-2 * roughness + 4.7041e-1 Eq. 20 rk = 8.327e-5 * porosity – 6.7e-7 * roughness - 1.8459e-4 Eq. 21 sk = -6.0378e-3 * porosity - 4.88e-5 * roughness + 9.877e-3 Eq. 22 uk = 1.1971e-1 * porosity + 9.69e-4 * roughness - 1.0759e-1 Eq. 23 vk = -4.5803e-1 * porosity – 3.71e-3 * roughness + 3.1809e-1 Eq. 24 krate_coef = 1 – exp(-β * [{4.49e-3 * (porosity * areatotal_pore) - 5.79e-3)}/ 2.09]2), krate_coef > 0 Eq. 25 acat = 1 – exp[-α* (2.48 * porosity + 0.126 * roughness)4], 0 ≤ acat ≤ 1 Eq. 26 tinit = 30, when roughness = 5.02
24 * γ * [5 / (roughness - 5.02)2], when roughness ≠ 5.02 Eq. 27 τa,i = ra * Ti3 + sa * Ti2 + ua * Ti + va, 0 ≤ τa,i ≤ 1 Eq. 28 τk,i = rk * Ti3 + sk * Ti2 + uk * Ti + vk, 0 ≤ τk,i ≤ 1 Eq. 29 δt = {-[1 / (τk,i * krate_coef)] * log(1 - (areacovered, i-1 / [τa,i * acat]))}0.25 - (ti - 1 - tinit) Eq. 30 areacovered,i = τa,i * acat * {1 – exp[-τk,i * krate_coef * (ti + δt – tinit)4]}, when RHi ≥ 98% and 5 < Ti < 40 areacovered,i-1 Eq. 31
roughness and porosity is the roughness and porosity of the material, whereupon the algae growth is calculated.
α, β, λ, ra, rk, sa, sk, ua, uk, va, vk, krate_coef, acat, tinit, τa,i, τk,i and δt are unitless coefficients.
areacovered is the ratio between uncovered and algae covered area on the material. areacovered is unitless and between 0 and 1.
5.1.6 Frost, Wood Rot and Salt
Frost and wood rot can cause significant damages to buildings. It is however, very difficult to compute reliable results with the current models as described in (RIBuild Deliverable D2.2, 2019) and is therefore not included in the ICT. More insight in the two damage criteria can be found in the work of WP2.
Salt can cause severe damaged in exterior walls and create very moist areas and is often difficult to get rid of (RIBuild Deliverable D2.2, 2019). It is therefore generally not recommended to apply internal insulation to walls containing salt. Salt efflorescence is therefore omitted as a failure mode.
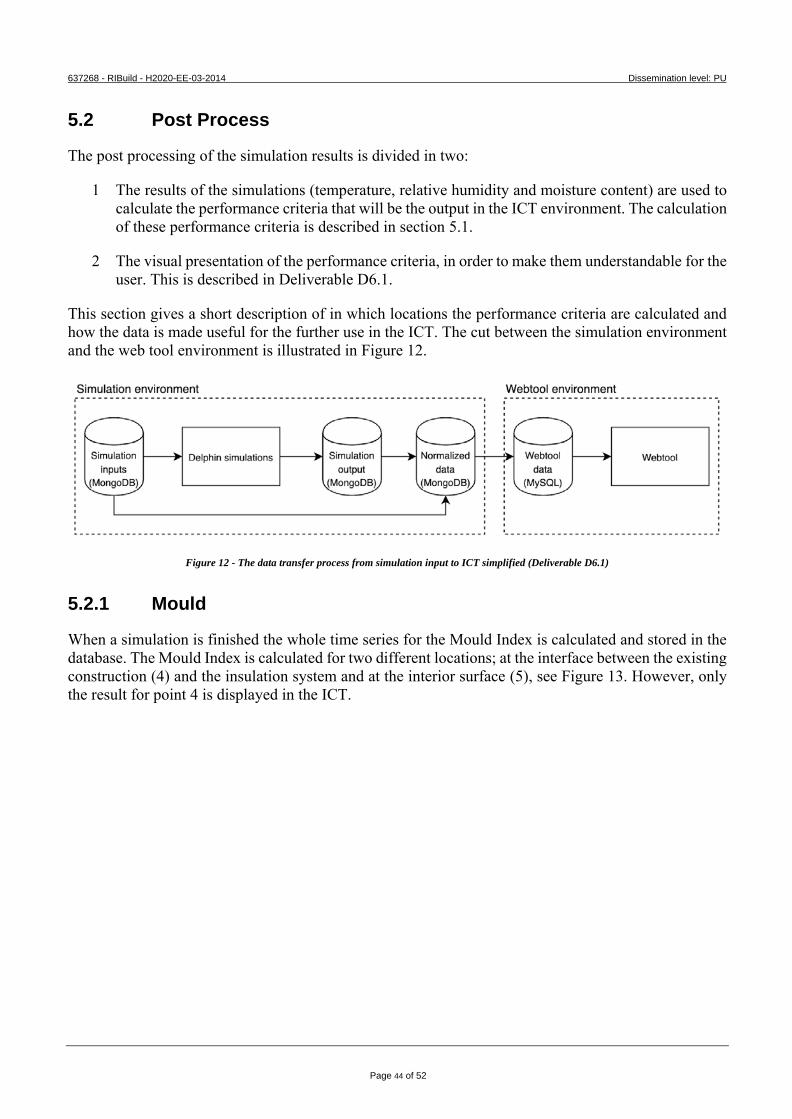
637268 - RIBuild - H2020-EE-03-2014 Dissemination level: PU
Page 44 of 52
5.2 Post Process
The post processing of the simulation results is divided in two:
1 The results of the simulations (temperature, relative humidity and moisture content) are used to calculate the performance criteria that will be the output in the ICT environment. The calculation of these performance criteria is described in section 5.1.
2 The visual presentation of the performance criteria, in order to make them understandable for the user. This is described in Deliverable D6.1.
This section gives a short description of in which locations the performance criteria are calculated and how the data is made useful for the further use in the ICT. The cut between the simulation environment and the web tool environment is illustrated in Figure 12.
Figure 12 - The data transfer process from simulation input to ICT simplified (Deliverable D6.1)
5.2.1 Mould
When a simulation is finished the whole time series for the Mould Index is calculated and stored in the database. The Mould Index is calculated for two different locations; at the interface between the existing construction (4) and the insulation system and at the interior surface (5), see Figure 13. However, only the result for point 4 is displayed in the ICT.
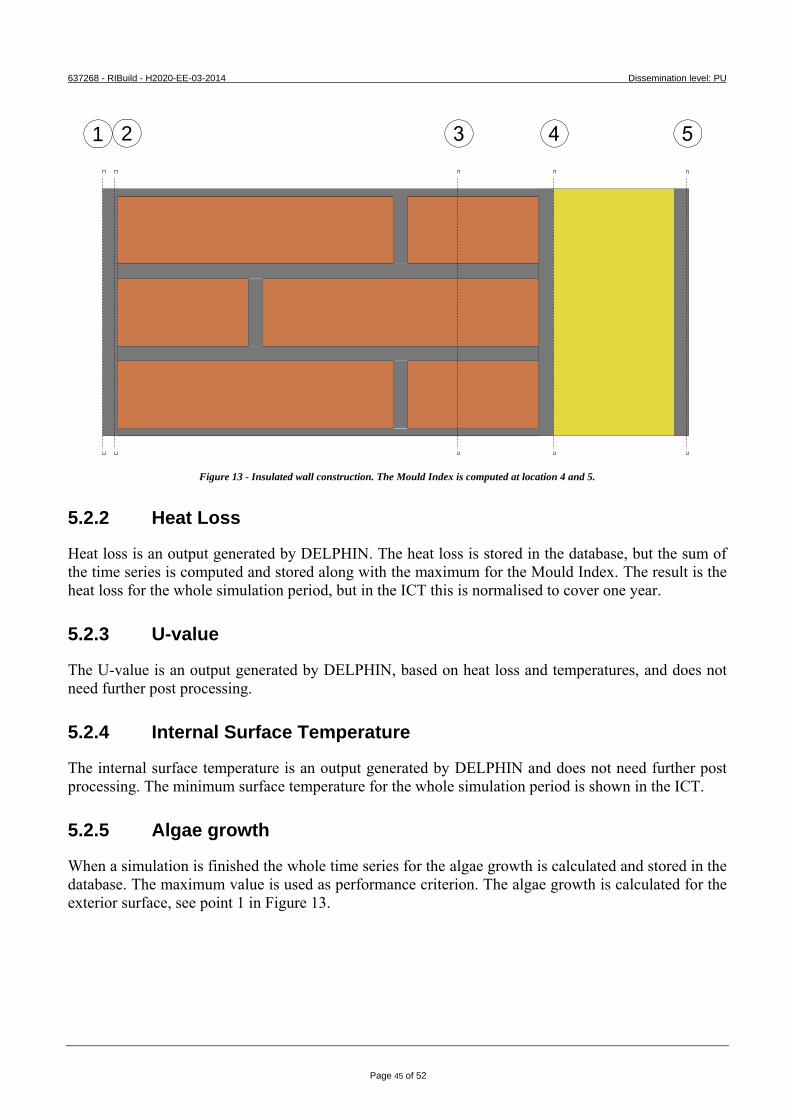
637268 - RIBuild - H2020-EE-03-2014 Dissemination level: PU
Page 45 of 52
Figure 13 - Insulated wall construction. The Mould Index is computed at location 4 and 5.
5.2.2 Heat Loss
Heat loss is an output generated by DELPHIN. The heat loss is stored in the database, but the sum of the time series is computed and stored along with the maximum for the Mould Index. The result is the heat loss for the whole simulation period, but in the ICT this is normalised to cover one year.
5.2.3 U-value
The U-value is an output generated by DELPHIN, based on heat loss and temperatures, and does not need further post processing.
5.2.4 Internal Surface Temperature
The internal surface temperature is an output generated by DELPHIN and does not need further post processing. The minimum surface temperature for the whole simulation period is shown in the ICT.
5.2.5 Algae growth
When a simulation is finished the whole time series for the algae growth is calculated and stored in the database. The maximum value is used as performance criterion. The algae growth is calculated for the exterior surface, see point 1 in Figure 13.
1 2
637268 - RIBuild - H2020-EE-03-2014 Dissemination level: PU
Page 46 of 52
6 Discussion
Although the total number of possible combinations that could be simulated in the basis for the choices made on input data is high, many choices have been made to limit the total number. The choice of using Sobol sampling for a probabilistic approach reduced the total number considerably opposed to making deterministic sampling. However, many of the choices could be discussed.
In general, the choices were made as a combination of what would be relevant for the user and what was possible, especially in terms of limiting the number of simulations.
6.1 Input data
6.1.1 Uncertainty layer: uniform or discrete
Table 1 lists the uncertainty layers and describes whether these are uniform within an interval or discrete. As a result, there may be simulation made with an orientation of 172° and 173°. From a hygrothermal point of view, this may not create many differences and could be seen as a waste of simulations instead of just simulation in e.g. eight directions. However, because of the quasi Monte Carlo sampling, changing the uniform layers to discrete values may not cause significant changes in the overall number of needed simulations to make the ICT outcome useful. It would probably be more efficient to reduce the numbers in the discrete uncertainty layers.
Nevertheless, some of the uniform parameters could probably have been changed to few discrete parameters, reducing the number of needed simulations to get a reliable ICT.
6.1.2 Exterior climate
To cover Europe from North to South, all available weather stations in the seven countries with RIBuild partners were used. This may be too many, as some of them may be located closely to each other. However, more weather stations could have been involved to cover all of EU. It was decided to use only the weather stations in the participating countries to limit the number of simulations. Limiting the weather stations within the countries was deselected, as it would require a study of the single weather files for several parameters e.g. wind and rain and simultaneity factors, not just a question of how close the locations were to each other. Sorting weather stations by comparing which were similar was out of the scope of this project.
6.1.3 Interior climate
Two interior climates were chosen. If the aim was to be on the safe side, indoor climate B would have been sufficient. However, the idea was also to show uncertainties, and many buildings, e.g. offices, are likely to have indoor climate A. Therefore, it was decided to use both indoor climates.
6.1.4 Wall core material and Exterior and interior plaster material
Having 85 different wall core materials and 11 different kinds of interior and exterior plaster materials may seem to be excessive, especially when (RIBuild Deliverable D2.1, 2018) showed that other
637268 - RIBuild - H2020-EE-03-2014 Dissemination level: PU
Page 47 of 52
parameters are more important than the material parameters. Nevertheless, Deliverable D2.1 also showed that the material parameter being the most important depends on the construction and point of interest. For example: If there is no exterior plaster and the wall is thin, water uptake in the wall core material may be very important when assessing mould growth behind interior insulation. In a thick wall with exterior plaster, the water uptake may be of minor interest, while the heat conductivity may be much more important. Consequently, it was decided to use all available materials.
In the ICT the core material can be chosen as natural stone, however not a specific type of natural stone. This may result in big uncertainties, as there is a big difference in using e.g. tuff or granite. However, it was decided, that a non-professional building owner would have difficulties in determining which kind of natural stone was used. Hence, a high uncertainty might be defendable. In the future, it would be possible to have an extra filter in the ÌCT to differentiate between different kinds of natural stones.
6.1.5 Insulation material
If the ICT becomes a success to such a degree that companies are willing to pay to be a part of the tool, it would be important to have different insulation materials as input parameters even if the materials differ very little. Consequently, several insulation systems were used as input parameters, although their material parameters varied very little. Later, the idea of including company names was abandoned to make sure not to give preference to specific products, but the chosen materials were kept.
To reduce the risk of mould growth, insulation systems containing organic material were deselected. At the same time, it was seen as a prerequisite that the insulation material had to be a part of an insulation system, as the possible combinations and therefore, simulations would be very high if materials could be combined randomly. This explains why many ways of insulating internally are not represented, while some of those that are, seem to be very similar.
6.1.6 Simulation time
The simulation time was set to five years, originally it was set to be seven years, but tests showed that there was very little difference in the outcome whether the simulation ran five or seven years, therefore, the shorter period was chosen to save computing time.
6.2 Output data
6.2.1 Mould and rot
Models for mould growth are generally based on experiments on free surfaces i.e. where air and dust have access. Behind the insulation systems used in the ICT, there is no free surface, and because the glue mortar contains cement, the pH value behind the insulation is high in many cases. New investigations within the RIBuild project (Jensen et al., 2020) have shown that the known mould models may not apply to the area behind internal insulation, because apparently mould growth may not happen although temperature and relative humidity would predict mould growth. Consequently, the resistance of the materials was set higher than usual. However, this might be a too simple way to counter the effects that are not encompassed in mould prediction models so far.
637268 - RIBuild - H2020-EE-03-2014 Dissemination level: PU
Page 48 of 52
The problem is similar to the findings concerning rot models. Rot was eliminated as a failure mode in the ICT, as the models were not reliable; they seem to overestimate the risk. If and when new wood rot or mould growth models are developed, the temperature, relative humidity, and moisture content results from the simulations will still be available and a new mould index and a wood rot index can be calculated in an updated version of the ICT.
6.2.2 Algae
The model for algae growth is a relatively new model, not being tested in practice for a longer period. It is included in this study, but the results may not be very precise. Furthermore, the length of the simulations may influence the risk of algae growth, as the algae growth is not declining.
6.2.3 Environmental impact
A probabilistic LCA tool has been developed in WP5. The tool is made for LCA/LCC experts, not for the same user group as the ICT. Therefore, it was originally considered to incorporate a simpler approach to estimate the environmental impact in addition to the heat loss (Walther et al., 2019), however it was not implemented, mainly as it could be confusing to have two methods to determine LCA at the RIBuild website.
637268 - RIBuild - H2020-EE-03-2014 Dissemination level: PU
Page 49 of 52
7 Conclusion
Deliverable D6.5 describes how it is possible to create a series of simulations that can be used as the basis for an Insulation Calculation Tool (ICT). The tool is planned for the non-professional building owner who wants to learn about internal insulation, but can also be used by professionals to get a fast estimation. The ICT is accessible from a website (www.riibuild.eu) where it is described what to look for when deciding if the building is suitable for internal insulation. If this is the case, the building owner can move on to the ICT to find information on what the implications of different kind of internal insulation could be. The ICT uses a high number of simulations to predict the effect of internal insulation, it predicts risk of mould growth behind interior insulation, risk of algae growth at the exterior side of the wall, minimum surface temperature and heat loss.
A probabilistic approach using the Sobol method was used to sample the simulations. With this approach, it is possible to indicate the uncertainties in the predictions.
The deliverable describes the technical details about how the DELPHIN simulations are created and sampled with temperature, relative humidity and moisture content as the basic outcome. Furthermore, the deliverable describes the formulas being used for the additional outcome; predictions on mould and algae growth, internal surface temperature, heat loss and U-value. The additional outcome is more usable for the non-professional user, but cannot be calculated without having the basic outcome.
The method results in many simulations, however the amount might have been reduced, e.g. if some of the variables were changed from being uniform distributed to being discrete variables.
Predictions on mould growth and algae growth may be questionable, as recent studies indicate that e.g. the mould prediction model may overestimate the risk of mould growth behind interior insulation, as it does not account for high pH values that may inhibit mould growth. High pH values are common in the insulation system included in the ICT, as most of them include a cement containing glue mortar. Consequently, the sensitivity class of the materials was changed from what is normally used for these types of materials (non-organic, porous materials), a choice that has not been sufficiently verified. Likewise, the Algae growth model has not been tested in practice. However, the basic outcome of the simulations will still be reliable and available after RIBuild ends. If new models are created, an update of the ICT can include the new model without repeating the simulations.
637268 - RIBuild - H2020-EE-03-2014 Dissemination level: PU
Page 50 of 52
8 References
Bauklimatik: http://bauklimatik-dresden.de/delphin/index.php?aLa=en June 2020 Blocken, B. & Carmeliet, J. (2002) Spatial and temporal distribution of driving rain on a low-rise building. Wind and Structures, 5, 441-46. http://koreascience.or.kr/journal/view.jsp?kj=KJKHCF&py=2002&vnc=v5n5&sp=441 Climate for Culture: https://www.climateforculture.eu/ June 2020 Defraeye, T., Blocken, B., & Carmeliet, J. (2011) Convective heat transfer coefficients for exterior building surfaces: Existing correlations and CFD modelling. Energy Conversion and Management, 52, 512-522 http://dx.doi.org/10.1016/j.enconman.2010.07.026 Django: https://www.djangoproject.com/ June 2020 Docker: https://www.docker.com/ June 2020 Docker Hub: https://hub.docker.com/ June 2020 EN 15026. (2007). Hygrothermal performance of building components and building elements. Assessment of moisture transfer by numerical simulation. June 2020 Git: https://git-scm.com/ June 2020 GitHub: https://github.com/ June 2020 HPC: https://www.hpc.dtu.dk/ June 2020 ISO 13788. (2012). Hygrothermal performance of building components and building elements — Internal surface temperature to avoid critical surface humidity and interstitial condensation — Calculation methods. Jensen, N.F., Bjarløv, S.P., Odgaard, T.R., Andersen, B., Rode, C., & Møller, E.B. (2020) Hygrothermal assessment of diffusion open insulation systems for interior retrofitting of solid masonry walls, Accepted for Building and Environment Loggly: https://github.com/iamatypeofwalrus/logspout-loggly June 2020 lxml: https://lxml.de/ June 2020 Matplotlib: https://matplotlib.org/ June 2020 Mirsadeghi, M., Cóstola, D., Blocken, B., & Hensen, J. L.M. (2013) Review of external convective heat transfer coefficient models in building energy simulation programs: Implementation and uncertainty. Applied Thermal Engineering, vol. 56, 134-151. http://dx.doi.org/10.1016/j.applthermaleng.2013.03.003
637268 - RIBuild - H2020-EE-03-2014 Dissemination level: PU
Page 51 of 52
mongoDB: https://www.mongodb.com/ June 2020 MongoEngine: http://mongoengine.org/ June 2020 Nakicenovic, N., Alcamo, J., Davis, J., de Vries, B., Fenhann, J., Gaffin, S., Gregory, K., Griibler, A., Jung, T., Kram, T., La Rovere, E., Michaelis, L., Mori, S., Morita, T., Pepper, W., Pitcher, H., Price, L., Riahi, K., Roehrl, A., Rogner, H., Sankovski, A., Schlesinger, M., Shukla, P., Smith, S., Swart, R., van Rooijen, S., Victor, N., Dadi, Z. (2000). Special report on emissions scenarios, A Special Report of Working Group III of the Intergovernmental Panel on Climate Change. IPCC, I.P.o.C.C (Eds.) Niederreiter H. (1978). Quasi-Monte Carlo methods and pseudo-random numbers. Bull. Amer. Math. Soc. 84, 957-1041 Nicolai, A. & Grunewald, J. (2006). User Manual and Program Reference – DELPHIN 5. Retrieved from http://bauklimatik-dresden.de/delphin/index.php?aLa=en June 2020 Obyn, S., Van Moeseke, G. (2015). Variability and impact of internal surfaces convective heat transfer coefficients in the thermal evaluation of office buildings. Applied Thermal Engineering, 87, 258-272 http://dx.doi.org/10.1016/j.applthermaleng.2015.05.030 Ojanen, T. Viitanen, H, Peuhkuri, R. Lähdesmäki. K, Vinha J., & Salminen, K. (2010). Mold growth modeling of building structures using sensitivity classes of materials. Proceedings of Thermal Performance of the Exterior Envelopes of Whole Buildings XI International Conference. Paramiko: http://www.paramiko.org/ June 2020 Peeters, L., Beausoleil-Morrison, I. & Novoselac, A. (2011). Internal convective heat transfer modeling: Critical review and discussion of experimentally derived correlations. Energy and Buildings, 43, 2227-223 http://dx.doi.org/10.1016/j.enbuild.2011.05.002 pytest: https://docs.pytest.org/en/latest/ June 2020 Python: https://www.python.org/ June 2020 RIBuild Deliverable D2.1 (2018) Report on the material properties. Retrieved from www.ribuild.eu. RIBuild Deliverable D2.2. (2019). Threshold values for failure, linked to types of building structures and failure modes. Retrieved from www.ribuild.eu. RIBuild Deliverable D2.3. (2020). Impact of water repellent agents on hygric properties of porous building materials. Retrieved from www.ribuild.eu. RIBuild Deliverable D3.2 (2019) Monitoring Data Basis of European Case Studies for Sound Performance Evaluation of Internal Insulation Systems Under Different Realistic Boundary Conditions. Retrieved from www.ribuild.eu. RIBuild Deliverable D4.1. (2017). Basic probabilistic analysis of hygrothermal performance of interior insulation. Retrieved from www.ribuild.eu.
637268 - RIBuild - H2020-EE-03-2014 Dissemination level: PU
Page 52 of 52
RIBuild Deliverable D6.1. (2020). Basic probabilistic analysis of hygrothermal performance of interior insulation. Retrieved from www.ribuild.eu. Scikit-learn: https://scikit-learn.org/stable/index.html June 2020 SciPy: https://www.scipy.org/ June 2020 Sharples, S. (1984) Full-scale measurements of convective energy losses from exterior building surfaces. Building and Environment, 19, 31-39. DOI: 10.1016/0360-1323(84)90011-8 sshtunnel: https://sshtunnel.readthedocs.io/en/latest/ June 2020 Svendsen, S. (1998) Solstråling, Undervisningsnotat U-032 (teaching note), Institut for Bygninger og Energi, DTU 1998 DTH, Lyngby Denmark Travis CI: https://travis-ci.org/ June 2020 Van Gelder, L., Janssen, H., & Roels, S. (2014) Probabilistic design and analysis of building performances: Methodology and application example Energy and Buildings, 79, 202-211. http://dx.doi.org/10.1016/j.enbuild.2014.04.042 Van Gelder, L., Das, P., Janssen, H., & Roels, S. (2014) Comparative study of metamodelling techniques in building energy simulation: Guidelines for practitioners, Simulation Modelling Practice and Theory, 49, 245-257. http://dx.doi.org/10.1016/j.simpat.2014.10.004 Walther, S., Birkved, M., Perkov, T.H., & Bjarløv S.P. (2019) Web tool for quantitative sustainability evaluation of hygrothermally optimized insulation solutions. 1st Nordic Conference on Zero Emission and Plus Energy Buildings, IOP Conf. Series: Earth and Environmental Science, 352
doi:10.1088/1755-1315/352/1/012029 Worch, A. (2004). The Behaviour of Vapour Transfer on Building Material Surfaces: The Vapour Transfer Resistance. Journal Building Physics http://journals.sagepub.com/doi/10.1177/1097196304044398 Yao, J. &; Yan, C. (2011) Effects of Solar Absorption Coefficient of External Wall on Building Energy Consumption Proceedings of World Academy of Science, Engineering and Technology 52
Related Documents