Woodfibre LNG Application for an Environmental Assessment Certificate January 2015 Page 6.3-1 6.3 SUSTAINABLE ECONOMY ASSESSMENT This section presents the results of the assessment of potential project-related adverse effects and cumulative effects on sustainable economy as a result of the proposed Woodfibre Liquefied Natural Gas (LNG) Project (Project). The processes used to select sustainable economy as a valued component (VC), the assessment boundaries, and existing conditions relevant to sustainable economy are described. This section also presents assessment findings, including evaluation of Project-related interactions and likely adverse effects, proposed approaches to mitigation, identification of likely residual and cumulative adverse effects, and determination of the significance of residual adverse effects. Monitoring and follow-up programs to be conducted with respect to sustainable economy are also described. This section supports the assessments in the following sections (see Table 4-2 Component Linkages Matrix): Section 6.2 Labour Market Section 7.2 Infrastructure and Community Services Section 7.3 Marine Transport Section 7.4 Land and Resource Use The assessment in this section is supported by assessments in the following sections: Section 6.2 Labour Market Section 7.2 Infrastructure and Community Services Section 7.3 Marine Transport 6.3.1 Sustainable Economy Scoping and Rationale This section provides an overview of the sustainable economy VC and its regulatory setting, the rationale for its selection as a VC, the spatial and temporal boundaries used in the assessment, and the indicators used to determine potential effects to the sustainable economy VC. 6.3.1.1 Overview and Regulatory Setting The sustainable economy VC includes three sub-components: regional economic development, commercial marine use, and local government finances. 6.3.1.1.1 Regional Economic Development Regional economic development is defined here as the change that occurs in in a major driver of a region’s economic well-being. In the context of the Project, expenditures made by the Project would accrue to individuals, local businesses, contractors and communities, thereby contributing to potential expansion of existing companies (e.g., in size/area of service), or stimulating creation of new businesses.

Welcome message from author
This document is posted to help you gain knowledge. Please leave a comment to let me know what you think about it! Share it to your friends and learn new things together.
Transcript
Woodfibre LNG Application for an Environmental Assessment Certificate January 2015
Page 6.3-1
6.3 SUSTAINABLE ECONOMY ASSESSMENT
This section presents the results of the assessment of potential project-related adverse effects and
cumulative effects on sustainable economy as a result of the proposed Woodfibre Liquefied Natural Gas
(LNG) Project (Project). The processes used to select sustainable economy as a valued component (VC),
the assessment boundaries, and existing conditions relevant to sustainable economy are described. This
section also presents assessment findings, including evaluation of Project-related interactions and
likely adverse effects, proposed approaches to mitigation, identification of likely residual and
cumulative adverse effects, and determination of the significance of residual adverse effects. Monitoring
and follow-up programs to be conducted with respect to sustainable economy are also described.
This section supports the assessments in the following sections (see Table 4-2 Component
Linkages Matrix):
Section 6.2 Labour Market
Section 7.2 Infrastructure and Community Services
Section 7.3 Marine Transport
Section 7.4 Land and Resource Use
The assessment in this section is supported by assessments in the following sections:
Section 6.2 Labour Market
Section 7.2 Infrastructure and Community Services
Section 7.3 Marine Transport
6.3.1 Sustainable Economy Scoping and Rationale
This section provides an overview of the sustainable economy VC and its regulatory setting, the rationale
for its selection as a VC, the spatial and temporal boundaries used in the assessment, and the indicators
used to determine potential effects to the sustainable economy VC.
6.3.1.1 Overview and Regulatory Setting
The sustainable economy VC includes three sub-components: regional economic development,
commercial marine use, and local government finances.
6.3.1.1.1 Regional Economic Development
Regional economic development is defined here as the change that occurs in in a major driver of a
region’s economic well-being. In the context of the Project, expenditures made by the Project would
accrue to individuals, local businesses, contractors and communities, thereby contributing to potential
expansion of existing companies (e.g., in size/area of service), or stimulating creation of new businesses.
Woodfibre LNG Application for an Environmental Assessment Certificate January 2015
Page 6.3-2
This contribution to economic development is valued by local governments and communities since
it provides opportunities for income and wealth creation and contributes to a community’s
economic stability.
Provincially, the regulation and management of economic development occurs through domestic trade
policies, including the New West Partnership Trade Agreement and Agreement (2010) on interprovincial
trade, and through the Industry Training Authority Act, SBC 2003, c. 34.
The New West Partnership Trade Agreement was fully implemented in July 2013 and requires British
Columbia (BC), Alberta, and Saskatchewan to commit to full mutual recognition and reconciliation of rules
affecting investment, trade and labour mobility, in order to remove barriers to the free movement of
goods, services, investment, and people within and between the three provinces. The agreement states
that government standards and regulations cannot restrict or impair trade, investment or labour mobility
between the three provinces. No preferential treatment can take place with respect to a province’s
people, investments, or goods, except where justified by actual cost-of-service differences, or by
measures focused on Aboriginal peoples. This agreement builds on the Trade, Investment, Labour and
Mobility Agreement between BC and Alberta.
6.3.1.1.2 Commercial Marine Use
The federal Fisheries Act, R.S.C. 1985. c. F-14 (1985) is the key piece of legislation responsible for
regulating commercial and recreational fishing in tidal waters, as well as salmon fishing in freshwater.
Fisheries and Oceans Canada (DFO) has overall responsibility for administering the federal Fisheries Act.
Under the federal Fisheries Act, BC exercises delegated authority for the management of non-salmon
freshwater fisheries. Non-salmon freshwater fishing is the responsibility of the Aquaculture and
Commercial Fisheries Branch, under the provincial Fisheries Act, R.S.B.C. 1996, c. 149.
The Canada Shipping Act, S.C. 2001, c. 26 promotes the safety and economic performance of the
commercial marine industry, while promoting the safety of those using pleasure crafts. This statute
includes direction for the protection and support of crews, passenger and vessel safety, and the
protection of the environment.
6.3.1.1.3 Local Government Finances
Local government finances are defined here as the collective expenditures and revenues raised by
municipal and regional district governments. Local governments in BC generate revenue primarily
through property taxes and sale of services, with clear rules in place for the borrowing and repaying of
transfer funds. Local government expenditures generally fall under the broad categories of expenditures
Woodfibre LNG Application for an Environmental Assessment Certificate January 2015
Page 6.3-3
directed to government operations, goods and services, and income transfers. The regulation of local and
regional government finances occurs primarily through the following legislation:
The Community Charter, SBC 2003, c. 26 (the Charter) is the key statute governing local
government revenues and expenditures. Part 6 (Financial Management) of the Charter
establishes revenue sources and management guidelines for local governments (e.g., rules for
the borrowing of funds and recovering costs through taxation associated with local services). The
Charter also sets guidelines for management and sources of proposed expenditures.
The Local Government Grants Act, RSBC 1996, c. 275 establishes the provincial-municipal
statutory funding framework, providing the authority for the province to make conditional and
unconditional grants to local governments and related organisations.
The Local Government Act RSBC1996. c. 323 requires municipalities and regional districts to
prepare annual financial plans, which must be adopted as a by-law and address a minimum five-
year period. A public consultation process is required before a financial plan can be adopted.
6.3.1.2 Selection of Valued Component
Selection of sustainable economy as a VC followed a process as set out in Section 4.3 Issues Scoping
and Selection of Valued Components. The identified VC subcomponents (i.e., regional economic
development, commercial marine use, and local government finances) reflect environmental assessment
issues and guidelines, potential Aboriginal concerns, issues identified by the BC Environmental
Assessment Office (EAO), Canadian Environmental Assessment Agency (CEA Agency), First Nations,
stakeholders, and professional judgment about key sensitive resources, and social and cultural values.
Table 6.3-1 provides a summary of identified subcomponents, rationale for their inclusion, and the
indicators that will be considered as part of the effects assessment. A summary of the rationale for
selecting each sub-component is as follows:
Regional Economic Development - The Project will offer new contracting opportunities and
potentially assist in diversifying and expanding the local business base, which will be of interest to
local business providers. Project construction and operation activities may require substantial
expenditures on goods and services, and may result in local or regional supply shortages and
increased costs. Project operation phase activities may or may not be compatible with local
economic plans or strategies.
Commercial Marine Use - The Project may displace marine-based economic activities and affect
certain environmental conditions (noise and visual resources) and therefore may affect
commercial marine users, including tourism operations. Tourism development is a priority for the
District of Squamish, and potential affects to tourism have been raised by stakeholders as a
concern.
Local Government Finances - For municipal and regional governments, the Project may have
fiscal benefits or involve direct fiscal outlays due to direct servicing requirements of the Project
and/or incremental service requirements due to permanent in-migration associated with Project
labour requirements. These effects would be of interest to local stakeholders, as well as
municipal and regional governments.
Woodfibre LNG Application for an Environmental Assessment Certificate January 2015
Page 6.3-4
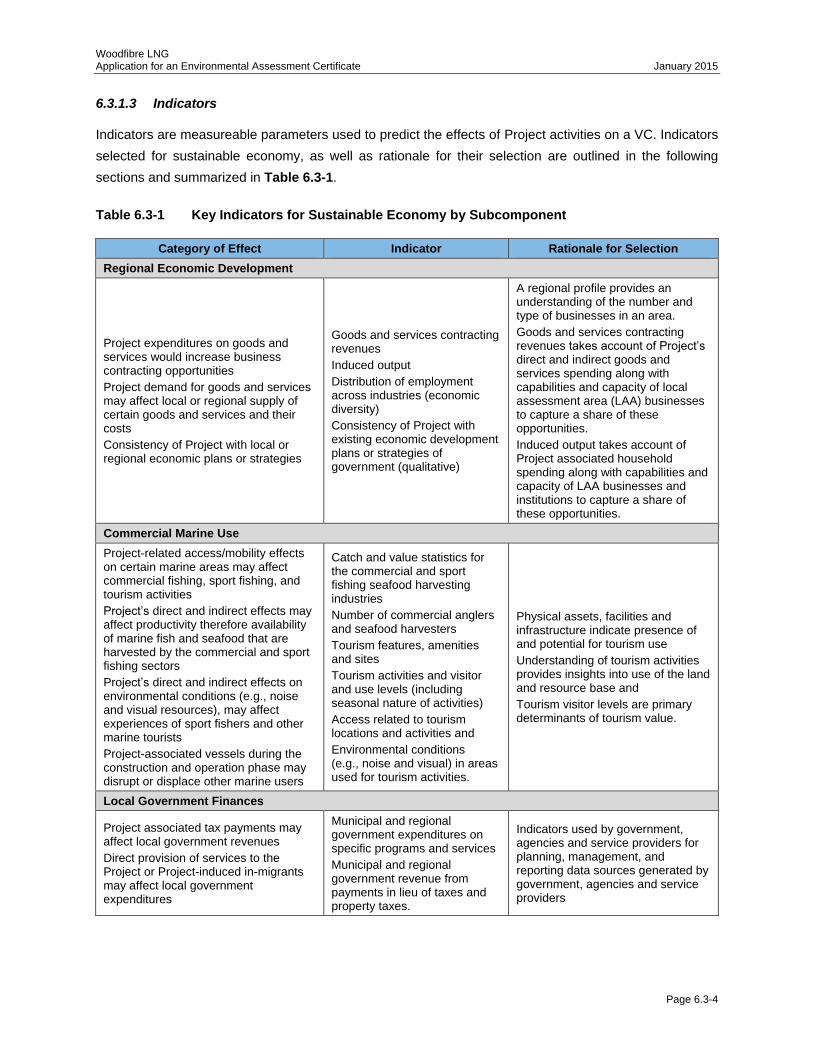
6.3.1.3 Indicators
Indicators are measureable parameters used to predict the effects of Project activities on a VC. Indicators
selected for sustainable economy, as well as rationale for their selection are outlined in the following
sections and summarized in Table 6.3-1.
Table 6.3-1 Key Indicators for Sustainable Economy by Subcomponent
Category of Effect Indicator Rationale for Selection
Regional Economic Development
Project expenditures on goods and services would increase business contracting opportunities
Project demand for goods and services may affect local or regional supply of certain goods and services and their costs
Consistency of Project with local or regional economic plans or strategies
Goods and services contracting revenues
Induced output
Distribution of employment across industries (economic diversity)
Consistency of Project with existing economic development plans or strategies of government (qualitative)
A regional profile provides an understanding of the number and type of businesses in an area.
Goods and services contracting revenues takes account of Project’s direct and indirect goods and services spending along with capabilities and capacity of local assessment area (LAA) businesses to capture a share of these opportunities.
Induced output takes account of Project associated household spending along with capabilities and capacity of LAA businesses and institutions to capture a share of these opportunities.
Commercial Marine Use
Project-related access/mobility effects on certain marine areas may affect commercial fishing, sport fishing, and tourism activities
Project’s direct and indirect effects may affect productivity therefore availability of marine fish and seafood that are harvested by the commercial and sport fishing sectors
Project’s direct and indirect effects on environmental conditions (e.g., noise and visual resources), may affect experiences of sport fishers and other marine tourists
Project-associated vessels during the construction and operation phase may disrupt or displace other marine users
Catch and value statistics for the commercial and sport fishing seafood harvesting industries
Number of commercial anglers and seafood harvesters
Tourism features, amenities and sites
Tourism activities and visitor and use levels (including seasonal nature of activities)
Access related to tourism locations and activities and
Environmental conditions (e.g., noise and visual) in areas used for tourism activities.
Physical assets, facilities and infrastructure indicate presence of and potential for tourism use
Understanding of tourism activities provides insights into use of the land and resource base and
Tourism visitor levels are primary determinants of tourism value.
Local Government Finances
Project associated tax payments may affect local government revenues
Direct provision of services to the Project or Project-induced in-migrants may affect local government expenditures
Municipal and regional government expenditures on specific programs and services
Municipal and regional government revenue from payments in lieu of taxes and property taxes.
Indicators used by government, agencies and service providers for planning, management, and reporting data sources generated by government, agencies and service providers
Woodfibre LNG Application for an Environmental Assessment Certificate January 2015
Page 6.3-5
6.3.1.4 Assessment Boundaries
This section describes the spatial and temporal boundaries for the assessment of the sustainable
economy, as well as administrative or technical boundaries that may apply.
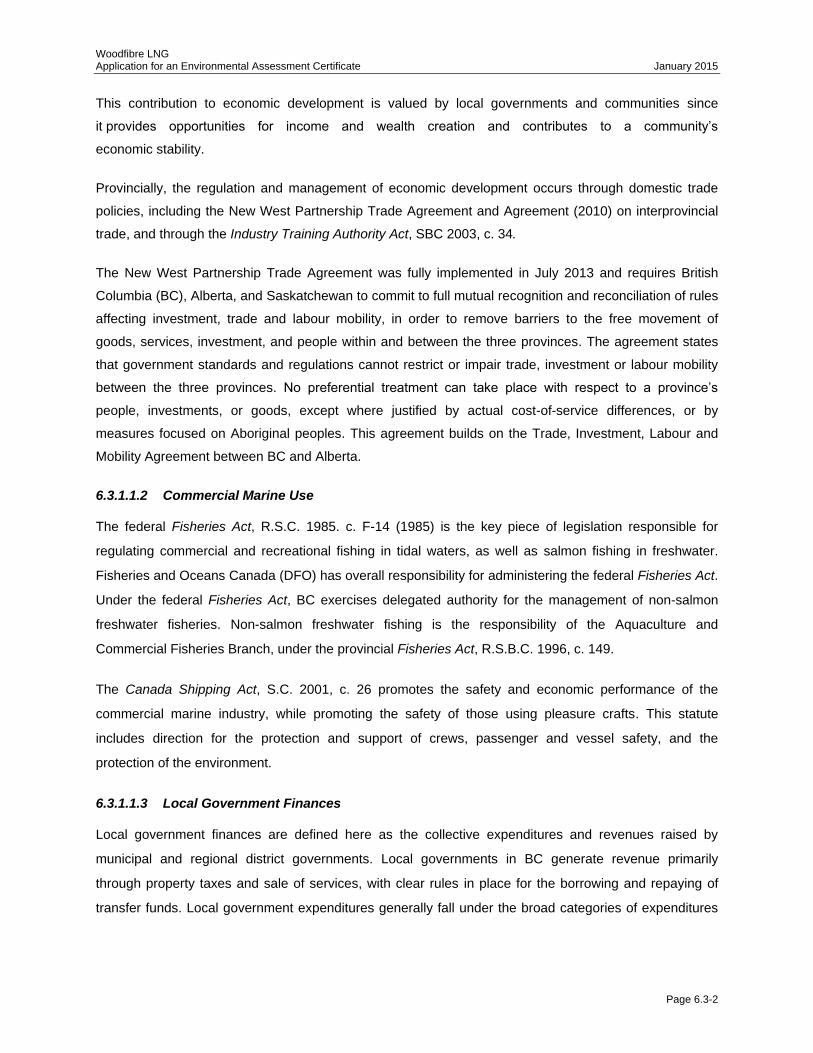
6.3.1.4.1 Spatial Boundaries
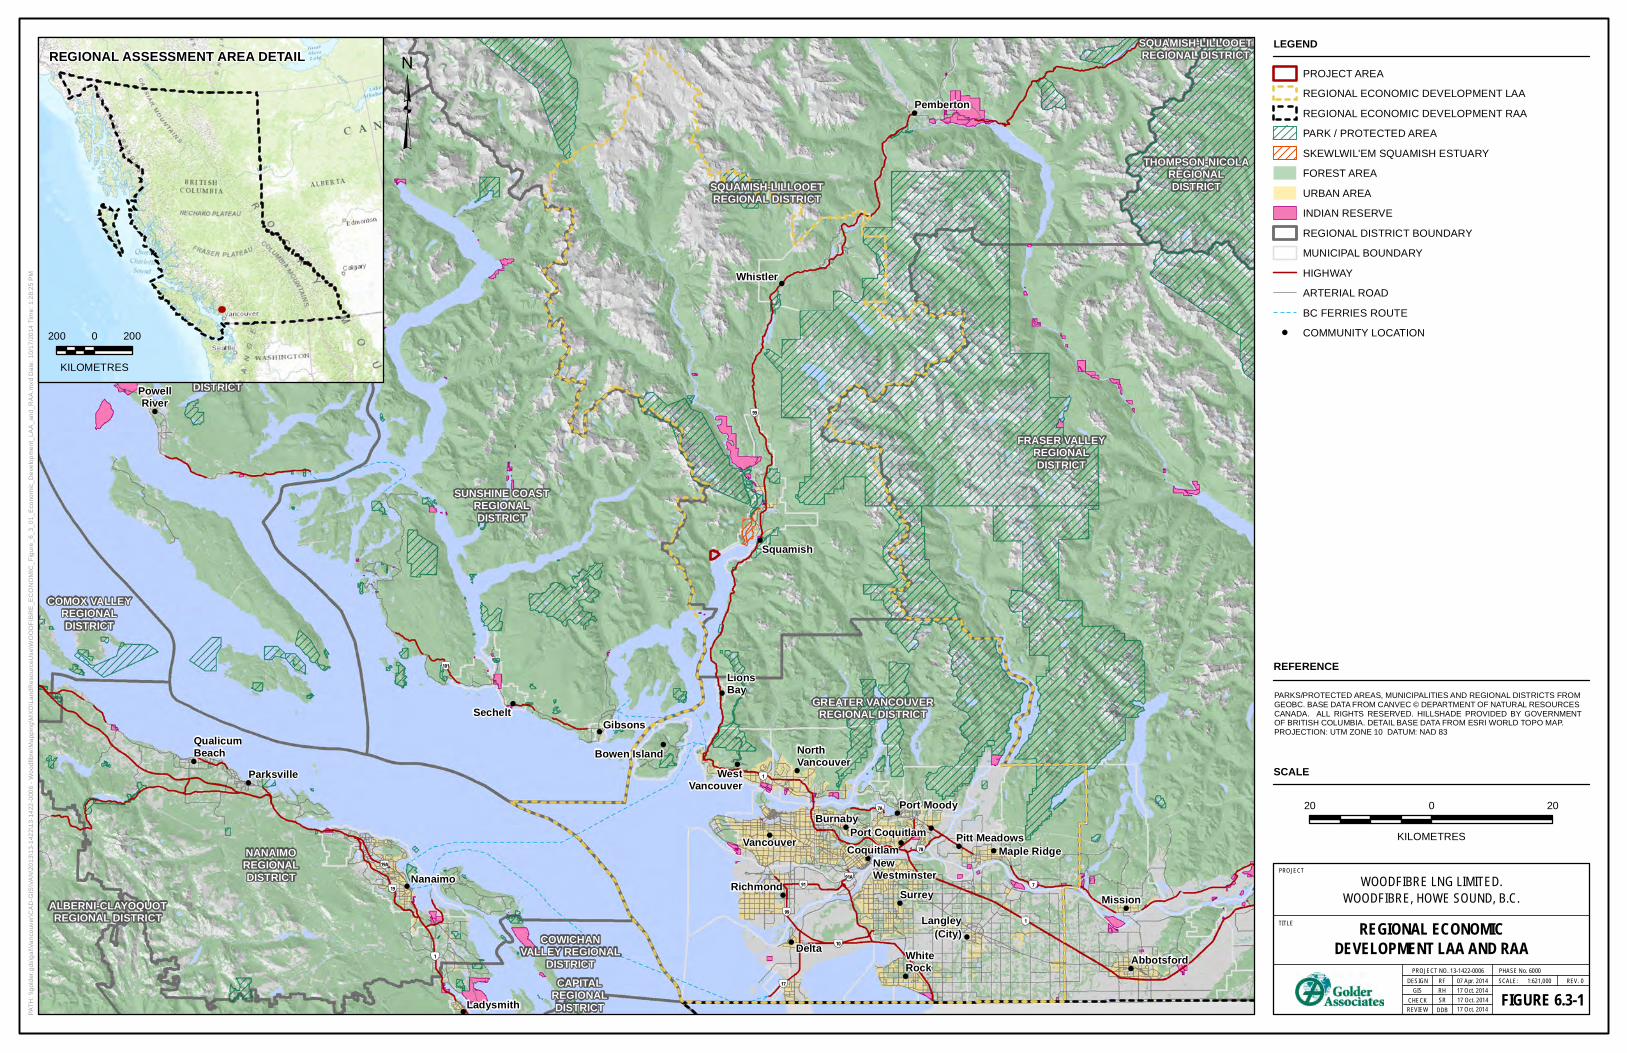
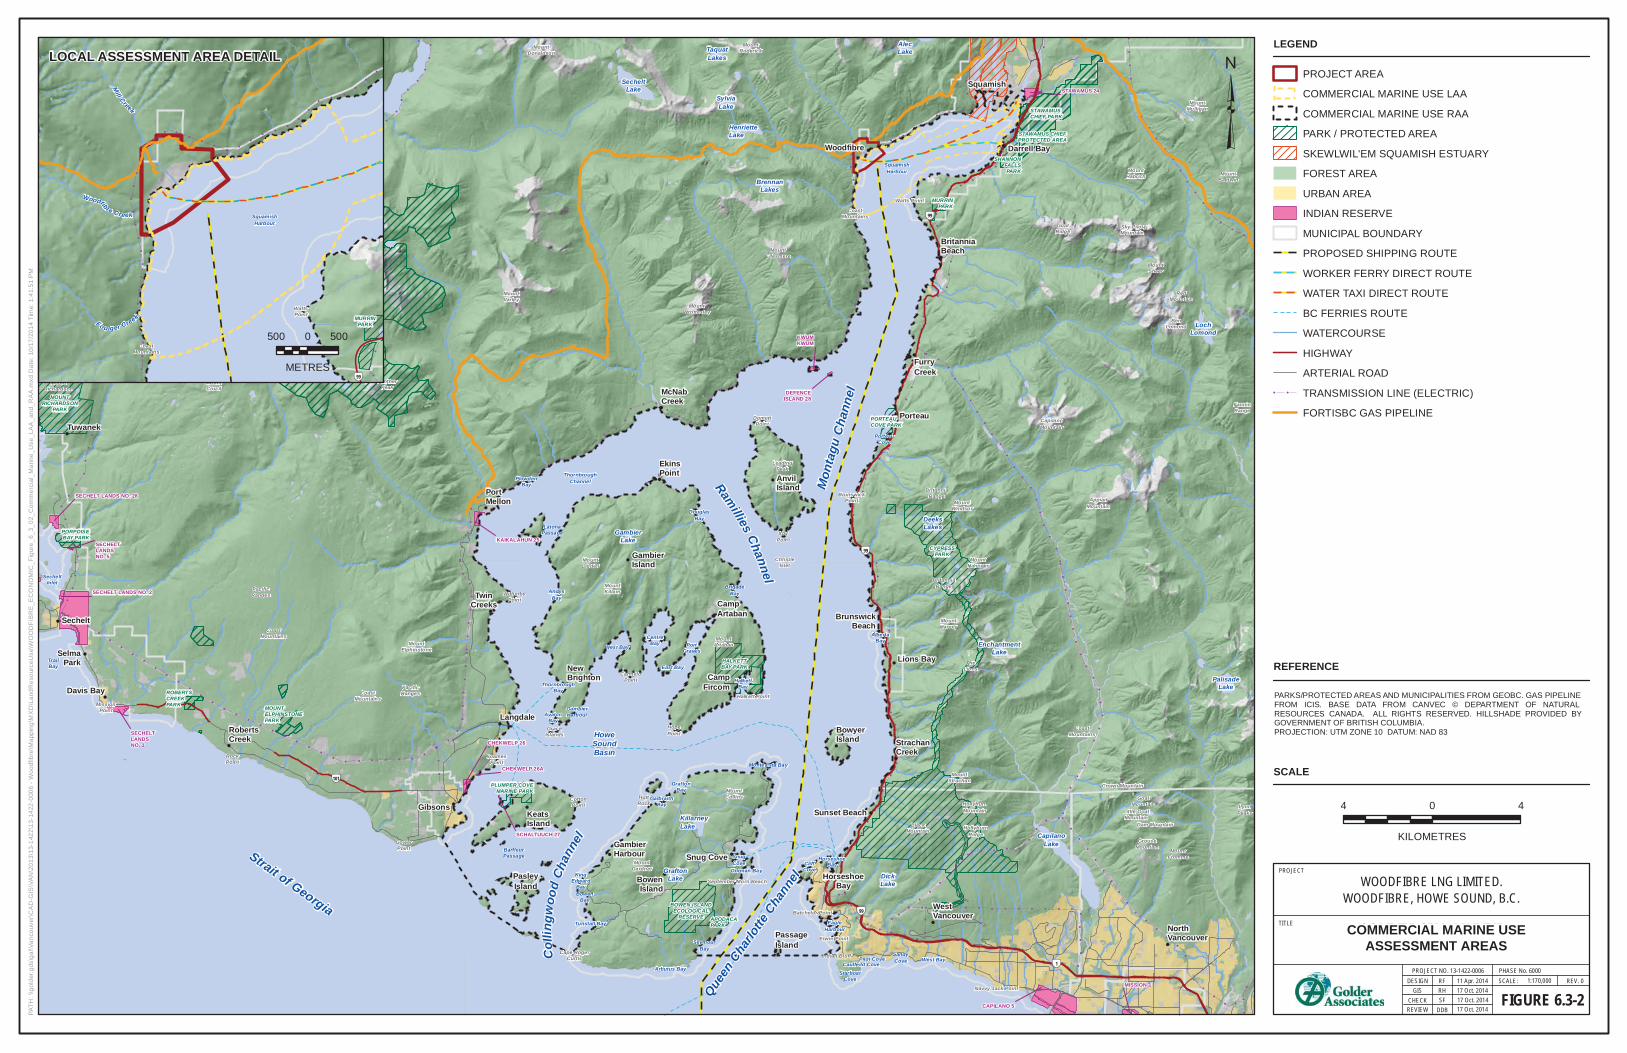
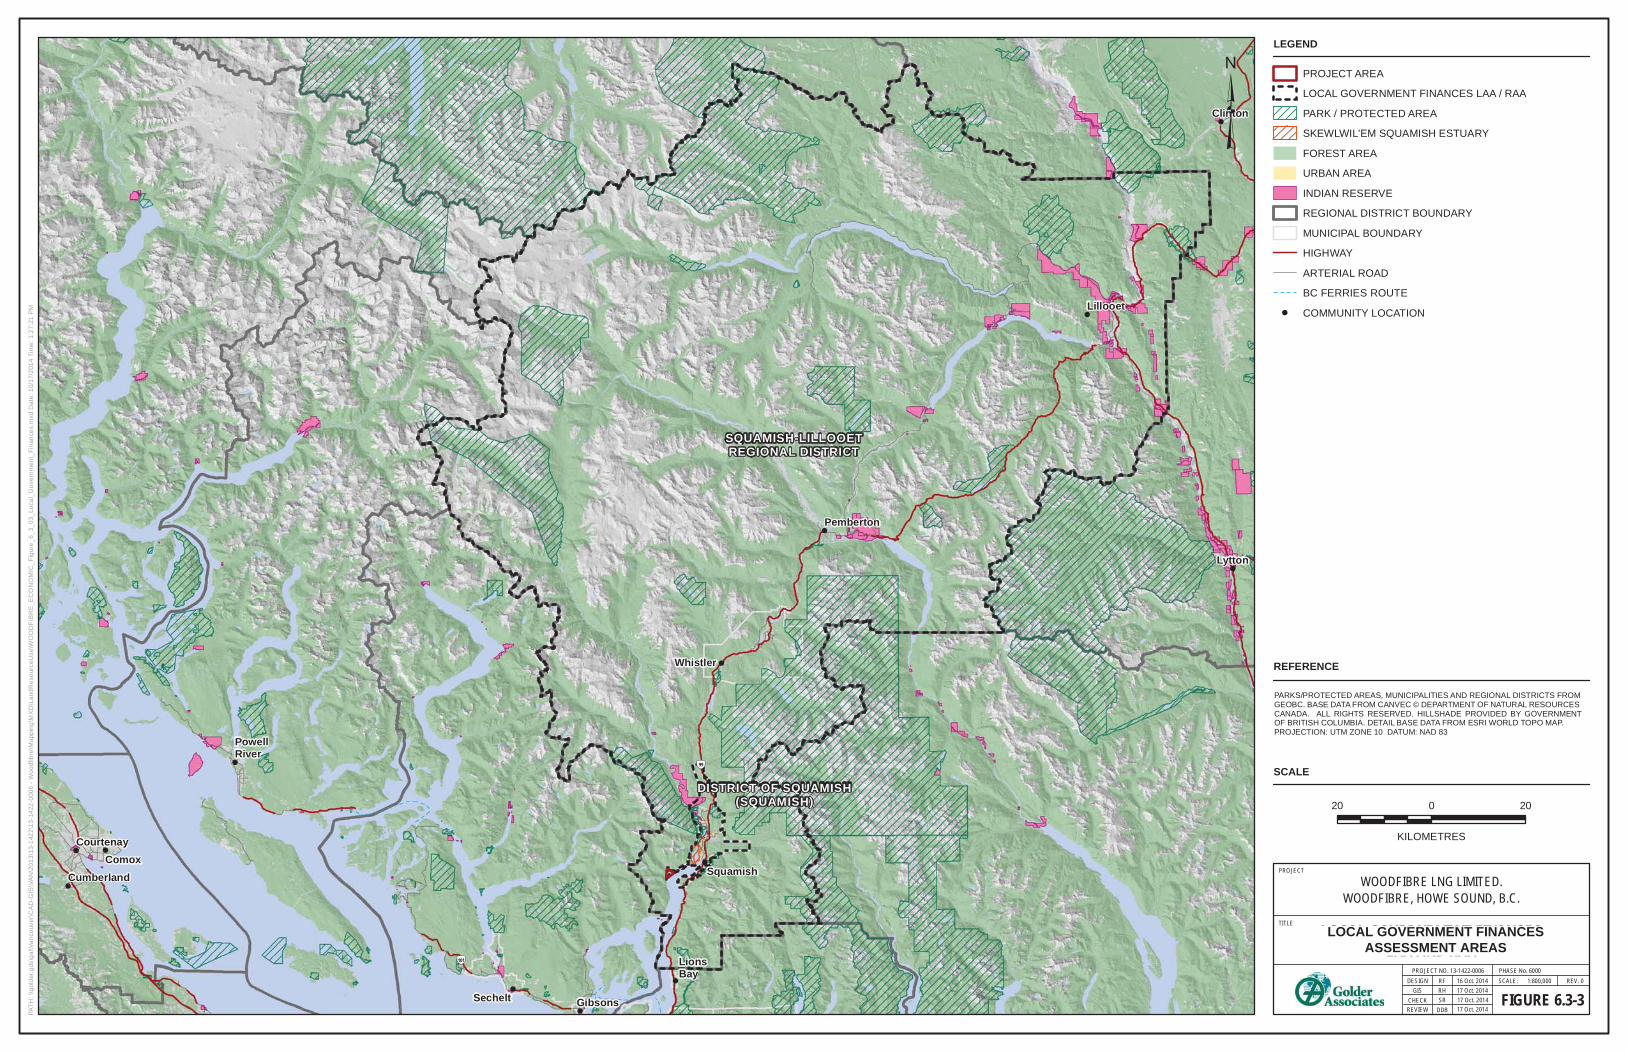
The spatial boundaries for the assessment of sustainable economy have been selected to capture the
physical extent of the Project, along with Project-related effects and key environmental systems. The local
assessment area (LAA) and regional assessment area (RAA) for sustainable economy and sub-
components are defined in Table 6.3-2 and shown in Figure 6.3-1, Figure 6.3-2, and Figure 6.3-3.
The LAA was established to encompass the area in which the Project is expected to interact with, and
potentially have direct or indirect effects on sustainable economy. In determining LAA boundaries,
consideration was given to the nature and characteristics of sustainable economy, pathways of effects
and the maximum extent of potential adverse effects on sustainable economy. The RAA was established
to provide a regional context for the assessment of Project-related effects and, although usually larger
than the LAA, encompasses the LAA. The RAA was also established to encompass the area in which the
residual effects of the Project are likely to overlap with the incremental residual effects of other existing or
reasonably foreseeable projects and activities and, as a result, is the area in which the cumulative effects
assessment has been conducted.
In determining the LAA boundaries, different considerations were necessary for the different sub-
components. For regional economic development, consideration was given to the nature and
characteristics of the local economy (e.g., type of industries, business capacity) and the Project’s
potential direct, indirect and induced effects during construction and operation. The same LAA was used
for commercial marine use as was used for the recreational marine use subcomponent of the Land and
Resource Use VC (see Section 7.4 Land and Resource Use) since key areas of activity for commercial
marine use are the same as those used by recreational and tourist users. For local government finances,
the LAA is the local government jurisdictions in which the Project area is located and that could potentially
provide direct utility services to the Project.
Woodfibre LNG Application for an Environmental Assessment Certificate January 2015
Page 6.3-6
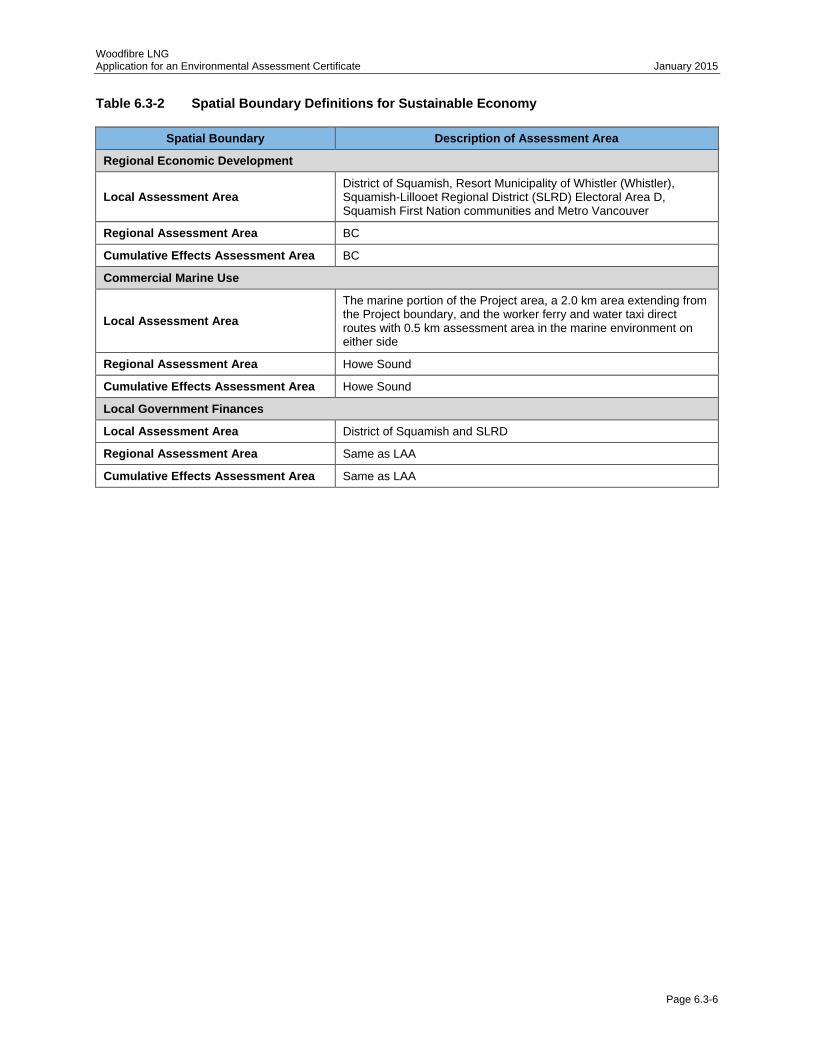
Table 6.3-2 Spatial Boundary Definitions for Sustainable Economy
Spatial Boundary Description of Assessment Area
Regional Economic Development
Local Assessment Area District of Squamish, Resort Municipality of Whistler (Whistler), Squamish-Lillooet Regional District (SLRD) Electoral Area D, Squamish First Nation communities and Metro Vancouver
Regional Assessment Area BC
Cumulative Effects Assessment Area BC
Commercial Marine Use
Local Assessment Area
The marine portion of the Project area, a 2.0 km area extending from the Project boundary, and the worker ferry and water taxi direct routes with 0.5 km assessment area in the marine environment on either side
Regional Assessment Area Howe Sound
Cumulative Effects Assessment Area Howe Sound
Local Government Finances
Local Assessment Area District of Squamish and SLRD
Regional Assessment Area Same as LAA
Cumulative Effects Assessment Area Same as LAA
!
!
!
!
!
!
!
!
!
!
!
!
!
!
!
!
!
!
!
!
!
!
!
!
!
!
!
!
!
ÃÄ
17
ÃÄ
10
ÃÄ
101
ÃÄ
19A
ÃÄ
19
ÃÄ
7B
ÃÄ
1
ÃÄ
1
ÃÄ
99
ÃÄ
7
ÃÄ
1
ÃÄ
99
ÃÄ
7A
ÃÄ
91
ÃÄ
91A
Abbotsford
Langley(City)
Surrey
WhiteRock
Delta
RichmondNewWestminster
NorthVancouver
Vancouver
Squamish
Whistler
Parksville
Nanaimo
PowellRiver
WestVancouver
Maple Ridge
Mission
Pitt MeadowsPort CoquitlamCoquitlam
Port Moody
Sechelt
Burnaby
LionsBay
Ladysmith
QualicumBeach
Gibsons
Pemberton
Bowen Island
ALBERNI-CLAYOQUOTREGIONAL DISTRICT
CAPITALREGIONALDISTRICT
THOMPSON-NICOLAREGIONALDISTRICT
FRASER VALLEYREGIONALDISTRICT
COWICHANVALLEY REGIONAL
DISTRICT
GREATER VANCOUVERREGIONAL DISTRICT
NANAIMOREGIONALDISTRICT
POWELL RIVERREGIONALDISTRICT
SUNSHINE COASTREGIONALDISTRICT
SQUAMISH-LILLOOETREGIONAL DISTRICT
SQUAMISH-LILLOOETREGIONAL DISTRICT
COMOX VALLEYREGIONALDISTRICT
STRATHCONAREGIONALDISTRICT
REGIONAL ECONOMICDEVELOPMENT LAA AND RAA
FIGURE 6.3-1REV. 0DESIGN
PROJECT NO. 13-1422-0006
PROJECT
TITLE
GIS
REVIEWCHECK
REFERENCE
³PA
TH: \\
golde
r.gds
\gal\V
anco
uver\
CAD-
GIS\
VAN\
2013
\13-14
22\13
-1422
-0006
- Woo
dfibre
\Map
ping\M
XD\La
ndRe
sourc
eUse
\WOO
DFIB
RE_E
CONO
MIC_
Figure
_6_3
_01_
Econ
omic_
Deve
lopme
nt_LA
A_an
d_RA
A.mx
d Date
: 10/1
7/201
4 Tim
e: 1:2
8:25 P
M
20 0 20
KILOMETRES
SCALE:RF 07 Apr. 2014PHASE No. 6000
1:621,000
SCALE
REGIONAL ASSESSMENT AREA DETAIL
200 0 200
KILOMETRES
PARKS/PROTECTED AREAS, MUNICIPALITIES AND REGIONAL DISTRICTS FROMGEOBC. BASE DATA FROM CANVEC © DEPARTMENT OF NATURAL RESOURCESCANADA. ALL RIGHTS RESERVED. HILLSHADE PROVIDED BY GOVERNMENTOF BRITISH COLUMBIA. DETAIL BASE DATA FROM ESRI WORLD TOPO MAP.PROJECTION: UTM ZONE 10 DATUM: NAD 83
17 Oct. 2014
WOODFIBRE LNG LIMITED.WOODFIBRE, HOWE SOUND, B.C.
DDB
RH 17 Oct. 2014SR 17 Oct. 2014
LEGEND
PROJECT AREAREGIONAL ECONOMIC DEVELOPMENT LAAREGIONAL ECONOMIC DEVELOPMENT RAAPARK / PROTECTED AREASKEWLWIL'EM SQUAMISH ESTUARYFOREST AREAURBAN AREAINDIAN RESERVEREGIONAL DISTRICT BOUNDARYMUNICIPAL BOUNDARYHIGHWAYARTERIAL ROADBC FERRIES ROUTE
! COMMUNITY LOCATION
!
!
!
!
!
!!
!!
!!
!
!
!
!
!
!
!
!
!
!
!
!
!
!
!
!
!!
!
!
!
!
!
!!
!
!
!
!!
!!
!
!!
!
!!
!
!
!
!
!!
!
!!
!
!
!
!
!!
!
!
!
!
!
!
!!
!
!
!!
!!
!
!
!
!
!
! !! ! !
!
!
!!
!
!
!!
!!
!
!!
!!
!!
!
!
! !
!
!
!
!
! !
!
!!
!
!
!
!!
!!
!
!
!
!
!
!
!
!
!
!
!
!
!
!
!
!
!
!
!
!
!
!
!
!
!
!
!
!
!
!
!
!
!
!
!
!
!
!
!
!
!!
!
!
!
!
!
!
!
!
!
!
!
!
!
!
!
!
!
!
!
!
!
!
!
!
!
! ! ! ! ! !
!
!!
!
!
!!
!!
!!
!
!
!
!!
!
!!
! ! ! ! ! ! ! ! ! ! ! !
!!
!!
!
!!
!
!!
!
!
!
!
!
!!
!
!!
!!
!!
!!
!!
!!
!!
!!
!!
!!
!!
!
!
!
!
!!
!!
!
!
!
!
!
!
!
! !
!
!!
!
!
!
!!
!!
!!
!
!
!
!
!
!
!
!
!
!!
! !
!
!
!!
!
!
!
!
!
!
!
!
!
!
!
!
!
!
!!
!
!
!
! !
!
!
!
!
!
!!
!
!
!
!
!
!
!
!
!!
!
!
!!
!!
!
!
!!
!
!!
!
!!
!!
!
!
!
!
!
! !!
!
!
!
!
!!
!
!
!
!
!
!
!
!
!!
!
Col
lingw
ood
Chan
nel
Mon
tagu
Cha
nnel
Queen
Cha
rlotte
Cha
nnel
Ramillies
Channel
HoweSoundBasin
Strait of Georgia
!
!
!
!
!
!
!
!
!
!
!
!
!
!
!
!
!
!
!
!
!
!
!
!
!
!
!
!
!
!
!
!!
!
!
!
ÃÄ
99
ÃÄ
99
ÃÄ
101
ÃÄ
1
ÃÄ
99
MountWrottesley
MountGardner
Crown Mountain
MountLiddell
Little GoatMountain
TheLions
LynnPeaks
PacificRanges
MountDonaldson
PacificRanges
PacificRanges
MountFromme
MountRichardson
MountMulligan
RedMountain
LeadingPeak
Sky PilotMountain
MountArtabanMount
Elphinstone
BlackMountain
MountCollins
MountHanover
MountWindsor
CoastMountains
CoastMountains
CoastMountains
CoastMountains
CoastMountains
MountStrachan
HollyburnMountain
MountEllesmere
MountSheer
BritanniaRange
BritanniaRange
TetrahedronPeak
MountBaldwin
FanninRange
PantherPeak
MountRoderick
MountHarvey
MountVarley
BenLomond
GoatMountain
MountHabrich
GrouseMountain
Dam Mountain
AppianMountain
CapilanoMountain
GoatRidge
Indian Bluff
MountCrucil
HollyburnRidge
BlackBearBluff
MountKillam
TETRAHEDRONPARK
MOUNTRICHARDSON
PARK
SECHELT INLETSMARINE PARK -
THORNHILL SITE
ROBERTSCREEKPARK
BOWEN ISLANDECOLOGICAL
RESERVE APODACAPARK
STAWAMUSCHIEF PARK
PLUMPER COVEMARINE PARK
PORTEAUCOVE PARK
MOUNTELPHINSTONEPARK
MURRINPARK
CYPRESSPARK
PORPOISEBAY PARK
STAWAMUS CHIEFPROTECTED AREA
HALKETTBAY PARK
SHANNONFALLSPARK
WitherbyPoint
September Morn Beach
CarmeloPoint
ChumPoint
SteelheadPoint
Batchelor Point
ThornhillPoint
DomettPoint
Cape RogerCurtis
ChristieIslet
Watts Point
GowerPoint
MidPoint
Navvy Jack Point
NewcombPoint
RockPoint
Halkett Point
CottonPoint
BrunswickPoint
HuttRock
HopePoint
GraceIslands
Erwin Point
SoamesPoint
IrbyPoint
MissionPoint
BarfleurPassage
ThornbroughChannel
LatonaPassage
SquamishHarbour
Tunstall Bay
DouglasBay
PortGraves
Pilot Cove
HalkettBay
East Bay
SandyCove
Dorman Bay
AvalonBay
BrigadeBay
ThornbroughBay
AndysBay
CliffCove
HorseshoeBay
GambierHarbour
CentreBay
SnugCove
West Bay
KingEdward
Bay
West Bay
GalbraithBay
Arbutus BayCaulfeild Cove
GraftonBay
PlowdenBay
EagleHarbour
AlbertaBay
StarboatCove
TrailBay
Montevista Bay
SeymourBay
PorteauCove
SalmonInlet
SecheltInlet
BowenBay
CapilanoLake
KillarneyLake
ChapmanLake
GambierLake
EnchantmentLake
LochLomond
RichardsonLake
GraftonLake
HenrietteLake
PalisadeLake
SylviaLake
DickLake
TaquatLakes
SecheltLake
EdwardsLake
DeeksLakes
BrennanLakes
AlecLake
DEFENCEISLAND 28
KAIKALAHUN 25
STAWAMUS 24
KWUMKWUM
SECHELTLANDSNO. 5
SECHELT LANDS NO. 28
SCHALTUUCH 27
MISSION 1
CAPILANO 5
CHEKWELP 26A
CHEKWELP 26
SECHELT LANDS NO. 2
SECHELTLANDSNO. 1
NorthVancouver
Squamish
WestVancouver
FurryCreek
Tuwanek
Gibsons
Lions Bay
GambierHarbour
AnvilIsland
BrunswickBeach
CampArtaban
PassageIsland
EkinsPoint
KeatsIsland
McNabCreek
Porteau
StrachanCreek
TwinCreeks
PasleyIsland
Snug Cove
NewBrighton
Woodfibre
Sechelt
Langdale
Davis Bay
RobertsCreek
SelmaPark
BritanniaBeach
Sunset Beach
PortMellon
Darrell Bay
BowenIsland
HorseshoeBay
GambierIsland
BowyerIsland
CampFircom
COMMERCIAL MARINEUSE LAA AND RAA
FIGURE 6.3-2REV. 0DESIGN
PROJECT NO. 13-1422-0006SCALE:
PROJECT
TITLE
GIS
REVIEW
RF 11 Apr. 2014
CHECK
PHASE No. 6000
1:170,000
PARKS/PROTECTED AREAS AND MUNICIPALITIES FROM GEOBC. GAS PIPELINEFROM ICIS. BASE DATA FROM CANVEC © DEPARTMENT OF NATURALRESOURCES CANADA. ALL RIGHTS RESERVED. HILLSHADE PROVIDED BYGOVERNMENT OF BRITISH COLUMBIA.PROJECTION: UTM ZONE 10 DATUM: NAD 83
LOCAL ASSESSMENT AREA DETAIL
PATH
: \\go
lder.g
ds\ga
l\Van
couv
er\CA
D-GI
S\VA
N\20
13\13
-1422
\13-14
22-00
06 - W
oodfi
bre\M
appin
g\MXD
\Land
Reso
urceU
se\W
OODF
IBRE
_ECO
NOMI
C_Fig
ure_6
_3_0
2_Co
mmerc
ial_M
arine
_Use
_LAA
_and
_RAA
.mxd
Date
: 10/1
7/201
4 Tim
e: 1:4
1:51 P
M
4 0 4
KILOMETRES
SCALE
!
!
!
!
!!
!!
!
!!
!!
!!
!!
!!
!!
!
!
!
! !
!
!
!
!!
!
!
!
!
!
!
!
!
!
!
!
!
CoastMountains
ÃÄ
99
WattsPoint
MURRINPARK
SquamishHarbour
Mill Creek
Woodfibre Creek
Foulger Creek
LOCAL ASSESSMENT AREA DETAIL
500 0 500
METRES
REFERENCE
³
17 Oct. 2014
WOODFIBRE LNG LIMITED.WOODFIBRE, HOWE SOUND, B.C.
DDB
RH 17 Oct. 2014SF 17 Oct. 2014
LEGEND
PROJECT AREACOMMERCIAL MARINE USE LAACOMMERCIAL MARINE USE RAAPARK / PROTECTED AREASKEWLWIL'EM SQUAMISH ESTUARYFOREST AREAURBAN AREAINDIAN RESERVEMUNICIPAL BOUNDARYPROPOSED SHIPPING ROUTEWORKER FERRY DIRECT ROUTEWATER TAXI DIRECT ROUTEBC FERRIES ROUTEWATERCOURSEHIGHWAYARTERIAL ROAD
! ! TRANSMISSION LINE (ELECTRIC)FORTISBC GAS PIPELINE
COMMERCIAL MARINE USE ASSESSMENT AREAS
!
!
!
!
!
!
!
!
!
!
!
!
!
ÃÄ
101
ÃÄ
99
Lillooet
Lytton
Squamish
Whistler
PowellRiver
Courtenay
Sechelt
LionsBay
ComoxCumberland
Gibsons
Pemberton
Clinton
SQUAMISH-LILLOOETREGIONAL DISTRICT
LOCAL GOVERNEMENT FINANCESLAA AND RAA
FIGURE 6.3-3REV. 0DESIGN
PROJECT NO. 13-1422-0006
PROJECT
TITLE
GIS
REVIEWCHECK
REFERENCE
³PA
TH: \\
golde
r.gds
\gal\V
anco
uver\
CAD-
GIS\
VAN\
2013
\13-14
22\13
-1422
-0006
- Woo
dfibre
\Map
ping\M
XD\La
ndRe
sourc
eUse
\WOO
DFIB
RE_E
CONO
MIC_
Figure
_6_3
_03_
Loca
l_Gov
ernme
nt_Fin
ance
s.mxd
Date
: 10/1
7/201
4 Tim
e: 1:2
7:21 P
M
20 0 20
KILOMETRES
SCALE:RF 16 Oct. 2014PHASE No. 6000
1:800,000
SCALE
PARKS/PROTECTED AREAS, MUNICIPALITIES AND REGIONAL DISTRICTS FROMGEOBC. BASE DATA FROM CANVEC © DEPARTMENT OF NATURAL RESOURCESCANADA. ALL RIGHTS RESERVED. HILLSHADE PROVIDED BY GOVERNMENTOF BRITISH COLUMBIA. DETAIL BASE DATA FROM ESRI WORLD TOPO MAP.PROJECTION: UTM ZONE 10 DATUM: NAD 83
17 Oct. 2014
WOODFIBRE LNG LIMITED.WOODFIBRE, HOWE SOUND, B.C.
DDB
RH 17 Oct. 2014SR 17 Oct. 2014
LEGEND
PROJECT AREALOCAL GOVERNMENT FINANCES LAA / RAAPARK / PROTECTED AREASKEWLWIL'EM SQUAMISH ESTUARYFOREST AREAURBAN AREAINDIAN RESERVEREGIONAL DISTRICT BOUNDARYMUNICIPAL BOUNDARYHIGHWAYARTERIAL ROADBC FERRIES ROUTE
! COMMUNITY LOCATION
DISTRICT OF SQUAMISH(SQUAMISH)
LOCAL GOVERNMENT FINANCES ASSESSMENT AREAS
Woodfibre LNG Application for an Environmental Assessment Certificate January 2015
Page 6.3-10
6.3.1.4.2 Temporal Boundaries
Temporal characteristics of the Project construction (including decommissioning of temporary
construction-related facilities), operation, and decommissioning phases are defined in Section 2.2
Description of the Proposed Project. The construction phase of the Project is expected to span a
period of 24 months. The operation life of the Project is anticipated to be at least 25 years. If, after that
timeframe, the Project can continue to operate in an effective and environmentally sound manner, plans
will be developed for continued operation. Decommissioning at the end of Project life will last
approximately 24 months. The temporal boundaries established for the assessment of Project-related
effects on sustainable economy encompass these Project phases.
The temporal characteristics of the sustainable economy VC are described in the existing conditions for
this VC and relate to annual and seasonal trends. Temporal characteristics are also considered in the
identification of the potential effects, and in the proposed mitigation measures.
6.3.1.4.3 Administrative Boundaries
The LAAs and RAAs for the sustainable economy VC have been defined in consideration of, and with
reference to, municipal, First Nation, regional district, and provincial boundaries. The Project footprint is
primarily located on private, fee simple owned land within the boundaries of the District of Squamish,
but there is a small overlap with Crown land in the Squamish-Lillooet Regional District (SLRD) Electoral
Area D. The LAAs and RAAs for the commercial marine use sub-component do not match defined
administrative boundaries.
6.3.1.4.4 Technical Boundaries
Prediction of effects on commercial marine use depends in part on the technical boundaries of the
assessment of Project-related effects on fish, as well as of noise and visual resources. The technical
boundaries for assessing effects on these activities also depend on the level of certainty regarding how
people use resources within the LAAs. While there is high confidence that marine user interests
interviewed for this assessment represent the most common uses in the LAAs (e.g., commercial fishers,
tourism operators, kiteboarders, and windsurfers), knowledge of the potential activities of other users is
less certain. Interviewed representatives of user groups identified locations where activities other than
their own have been known to occur within and near the LAAs but were not always able to describe the
extent of these other activities in detail. These uncertainties do not influence the ability to make decisions
regarding the overall significance of adverse effects on marine uses since the main pathway relates to
access and availability of marine use opportunities in the RAAs and LAAs, rather than to the level of
participation in these activities.
Woodfibre LNG Application for an Environmental Assessment Certificate January 2015
Page 6.3-11
6.3.2 Existing Conditions
This section describes the existing conditions of the sustainable economy VC, based on the results of
primary and secondary information collection (Section 6.3.1.4). The existing local and regional economic
conditions, as well as the surrounding environment and factors influencing the sustainable economy VC
are described. The baseline focuses on regional economic development (e.g., economic sector
composition, establishments and locations, business licenses, local economic development plans, and
economic development outlook); commercial marine use (e.g., commercial fishing catch and value,
marine-based tourism activities and locations, marine tourism operators, commercial marine transport);
and local government finances (e.g., local revenues and expenditures and local government
finances outlook).
Since the interactions of the effects associated with past and existing projects are not expected to change
over time, these projects are considered though the documentation of the existing conditions for this VC.
A summary of the projects the effects of which are included in the existing conditions is presented in
Table 4-6 Inclusion List of Past and Present Projects and Activities. Projects and activities that are
considered in the existing conditions for this VC include the Britannia Mine Remediation Project, the Furry
Creek Hydro Project, Howe Sound Pulp and Paper Corporation, Upper and Lower Mamquam Hydro
Projects, McNair Creek Hydro Project, Sea to Sky Gondola, Sea to Sky Highway (Improvement Project),
Squamish Terminals, Watts Point Quarry, Whistler Blackcomb Ski Resort, BC Ferries, recreational
boating, forestry, fishing activities, backcountry and outdoor recreation activities.
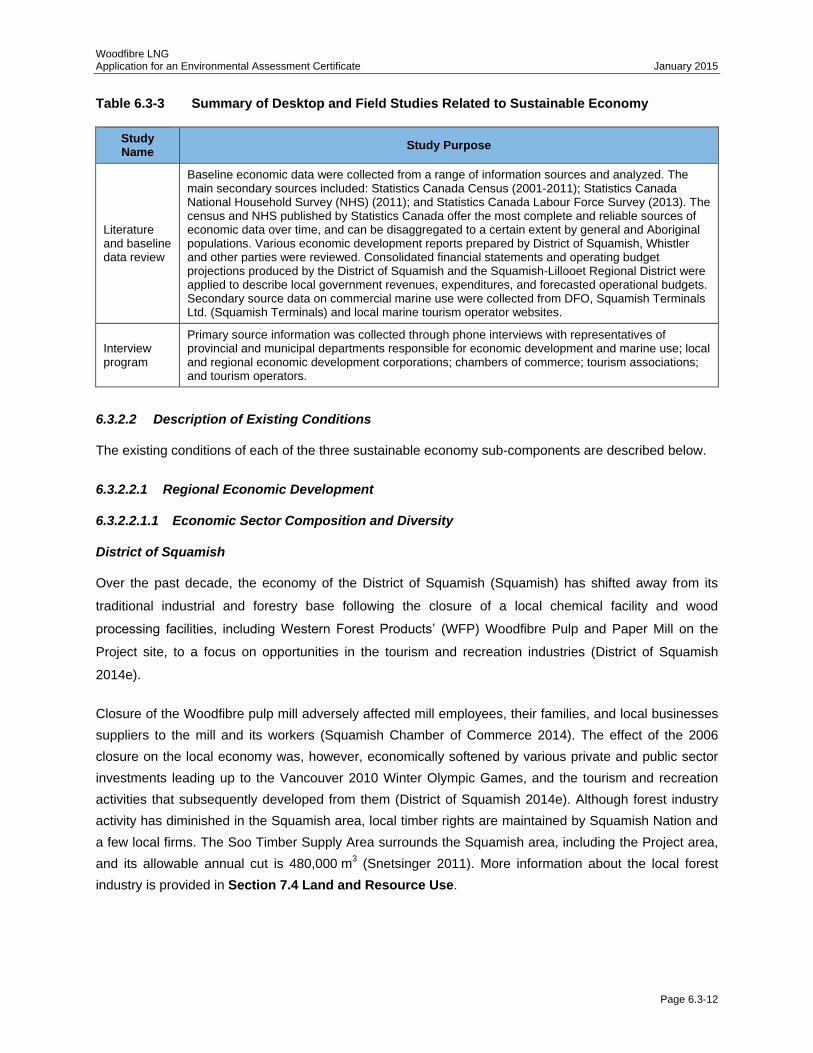
6.3.2.1 Background Information
In 2014, Woodfibre LNG Limited (WLNG, or the Proponent) initiated desktop studies and interviews on
sustainable economy to support Project planning and assessment, as well as future Project management.
No field studies were required. Building on available information, these studies were designed to address
known data gaps. Desktop reviews and interviews that were conducted with respect to sustainable
economy are summarized in Table 6.3-3.
Woodfibre LNG Application for an Environmental Assessment Certificate January 2015
Page 6.3-12
Table 6.3-3 Summary of Desktop and Field Studies Related to Sustainable Economy
Study Name
Study Purpose
Literature and baseline data review
Baseline economic data were collected from a range of information sources and analyzed. The main secondary sources included: Statistics Canada Census (2001-2011); Statistics Canada National Household Survey (NHS) (2011); and Statistics Canada Labour Force Survey (2013). The census and NHS published by Statistics Canada offer the most complete and reliable sources of economic data over time, and can be disaggregated to a certain extent by general and Aboriginal populations. Various economic development reports prepared by District of Squamish, Whistler and other parties were reviewed. Consolidated financial statements and operating budget projections produced by the District of Squamish and the Squamish-Lillooet Regional District were applied to describe local government revenues, expenditures, and forecasted operational budgets. Secondary source data on commercial marine use were collected from DFO, Squamish Terminals Ltd. (Squamish Terminals) and local marine tourism operator websites.
Interview program
Primary source information was collected through phone interviews with representatives of provincial and municipal departments responsible for economic development and marine use; local and regional economic development corporations; chambers of commerce; tourism associations; and tourism operators.
6.3.2.2 Description of Existing Conditions
The existing conditions of each of the three sustainable economy sub-components are described below.
6.3.2.2.1 Regional Economic Development
6.3.2.2.1.1 Economic Sector Composition and Diversity
District of Squamish
Over the past decade, the economy of the District of Squamish (Squamish) has shifted away from its
traditional industrial and forestry base following the closure of a local chemical facility and wood
processing facilities, including Western Forest Products’ (WFP) Woodfibre Pulp and Paper Mill on the
Project site, to a focus on opportunities in the tourism and recreation industries (District of Squamish
2014e).
Closure of the Woodfibre pulp mill adversely affected mill employees, their families, and local businesses
suppliers to the mill and its workers (Squamish Chamber of Commerce 2014). The effect of the 2006
closure on the local economy was, however, economically softened by various private and public sector
investments leading up to the Vancouver 2010 Winter Olympic Games, and the tourism and recreation
activities that subsequently developed from them (District of Squamish 2014e). Although forest industry
activity has diminished in the Squamish area, local timber rights are maintained by Squamish Nation and
a few local firms. The Soo Timber Supply Area surrounds the Squamish area, including the Project area,
and its allowable annual cut is 480,000 m3 (Snetsinger 2011). More information about the local forest
industry is provided in Section 7.4 Land and Resource Use.
Woodfibre LNG Application for an Environmental Assessment Certificate January 2015
Page 6.3-13
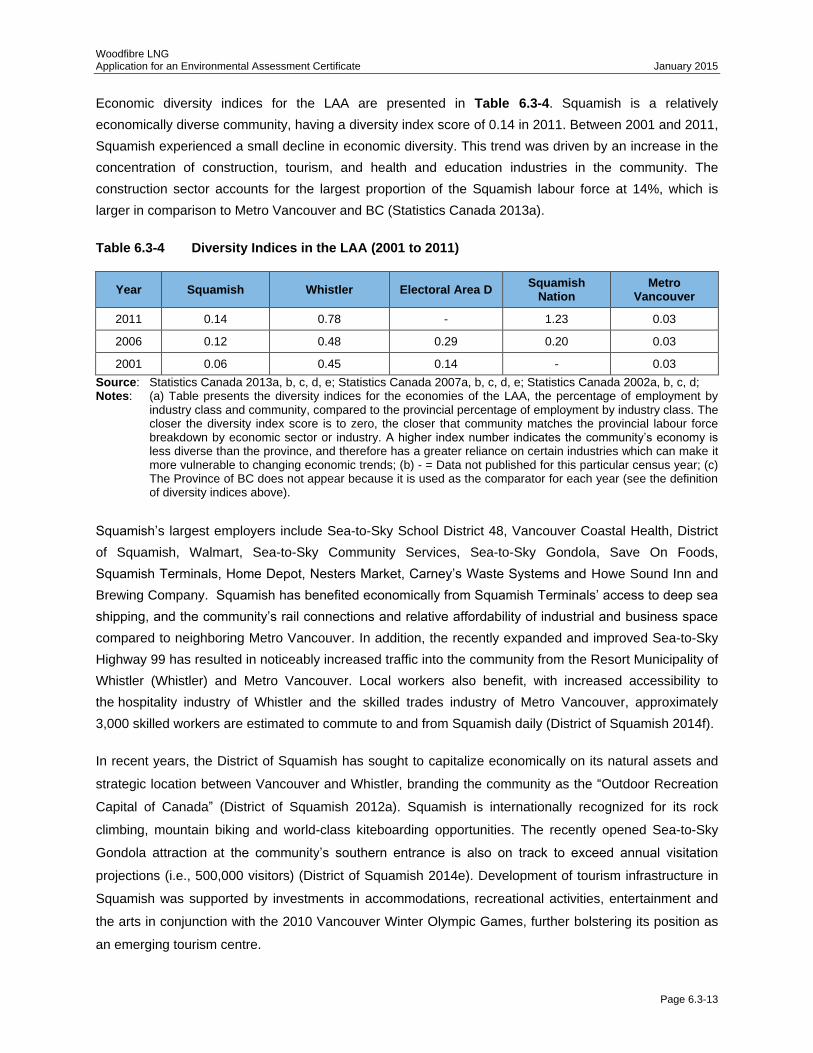
Economic diversity indices for the LAA are presented in Table 6.3-4. Squamish is a relatively
economically diverse community, having a diversity index score of 0.14 in 2011. Between 2001 and 2011,
Squamish experienced a small decline in economic diversity. This trend was driven by an increase in the
concentration of construction, tourism, and health and education industries in the community. The
construction sector accounts for the largest proportion of the Squamish labour force at 14%, which is
larger in comparison to Metro Vancouver and BC (Statistics Canada 2013a).
Table 6.3-4 Diversity Indices in the LAA (2001 to 2011)
Year Squamish Whistler Electoral Area D Squamish
Nation Metro
Vancouver
2011 0.14 0.78 - 1.23 0.03
2006 0.12 0.48 0.29 0.20 0.03
2001 0.06 0.45 0.14 - 0.03
Source: Statistics Canada 2013a, b, c, d, e; Statistics Canada 2007a, b, c, d, e; Statistics Canada 2002a, b, c, d; Notes: (a) Table presents the diversity indices for the economies of the LAA, the percentage of employment by
industry class and community, compared to the provincial percentage of employment by industry class. The closer the diversity index score is to zero, the closer that community matches the provincial labour force breakdown by economic sector or industry. A higher index number indicates the community’s economy is less diverse than the province, and therefore has a greater reliance on certain industries which can make it more vulnerable to changing economic trends; (b) - = Data not published for this particular census year; (c) The Province of BC does not appear because it is used as the comparator for each year (see the definition of diversity indices above).
Squamish’s largest employers include Sea-to-Sky School District 48, Vancouver Coastal Health, District
of Squamish, Walmart, Sea-to-Sky Community Services, Sea-to-Sky Gondola, Save On Foods,
Squamish Terminals, Home Depot, Nesters Market, Carney’s Waste Systems and Howe Sound Inn and
Brewing Company. Squamish has benefited economically from Squamish Terminals’ access to deep sea
shipping, and the community’s rail connections and relative affordability of industrial and business space
compared to neighboring Metro Vancouver. In addition, the recently expanded and improved Sea-to-Sky
Highway 99 has resulted in noticeably increased traffic into the community from the Resort Municipality of
Whistler (Whistler) and Metro Vancouver. Local workers also benefit, with increased accessibility to
the hospitality industry of Whistler and the skilled trades industry of Metro Vancouver, approximately
3,000 skilled workers are estimated to commute to and from Squamish daily (District of Squamish 2014f).
In recent years, the District of Squamish has sought to capitalize economically on its natural assets and
strategic location between Vancouver and Whistler, branding the community as the “Outdoor Recreation
Capital of Canada” (District of Squamish 2012a). Squamish is internationally recognized for its rock
climbing, mountain biking and world-class kiteboarding opportunities. The recently opened Sea-to-Sky
Gondola attraction at the community’s southern entrance is also on track to exceed annual visitation
projections (i.e., 500,000 visitors) (District of Squamish 2014e). Development of tourism infrastructure in
Squamish was supported by investments in accommodations, recreational activities, entertainment and
the arts in conjunction with the 2010 Vancouver Winter Olympic Games, further bolstering its position as
an emerging tourism centre.
Woodfibre LNG Application for an Environmental Assessment Certificate January 2015
Page 6.3-14
Squamish’s outdoor recreation lifestyle has also made the area an appealing destination for other
business sectors. Entrepreneurs have been attracted from a range of industries, many of whom have
established small and medium-sized businesses in the community, including many home-based
businesses (District of Squamish 2014e). Squamish has a relatively young population interested in the
educational opportunities, technology infrastructure, and outdoor recreation lifestyle the community offers,
leading to growth in the local knowledge-based business economy (e.g., recreational and sporting
technologies, environmental technologies, interactive media, animation, film and television).
Developing the film industry is a priority for the District of Squamish and, in 2013, it created a new Film
and Events Manager position to forge relationships with film and event industry providers and to manage
events and filming held on municipal property (District of Squamish 2013b). Squamish’s film industry
benefits from its proximity to Vancouver, but also offers an additional labour tax incentive of 6% compared
to Vancouver (District of Squamish 2014d). Between 2011 and 2013, the number of film productions in
Squamish rose from 14 to 26 (District of Squamish 2014d). Over the same period, the number of
production days peaked in 2012 at 227, driven in part by filming of the movie Twilight in Squamish
(District of Squamish 2014d, 2014g). Filming in Squamish in 2012 represented approximately $1.5 million
in spending (Aldous 2013). With the exception of 2012, the number of production days has grown from
90 in 2011 to 105 in 2013. As of the end of June 2014 approximately 18 productions had been filmed in
Squamish, representing 75 production days (District of Squamish 2014d).
Locations in Squamish used for filming include a gravel pit on Watts Point, which is used for
approximately 40 production days per year on average. Klahanie Campground at Darrell Bay is also used
for filming, as is the Sea-to-Sky Highway 99 (District of Squamish 2014f). Squamish-based Black Tusk
Helicopter Inc., offers a number of locations available for film and photography crews for use and rent on
a daily, weekly or monthly basis. In addition to Watts Point, locations include Coast Mountain
Range Tenure, Squamish River property, and their Squamish Airport hangar and office (Black Tusk
Helicopter Inc. n.d.).
Over the past decade, Squamish has experienced growth in its public and private education offerings,
with tourism and outdoor recreation education opportunities at Capilano University’s Squamish campus,
an influx of international students to the Howe Sound School District, and through the 2002 establishment
of the privately-funded Quest University Canada. Quest University Canada’s focus on progressive
pedagogy and innovation is also encouraging greater entrepreneurial activity within the community
(District of Squamish 2014e).
Local tourism features and activities are an important driver in Squamish’s economy. An example is the
Sea-to-Sky Gondola, which started operations in May 2014 and offers panoramic views of the entire LAA,
and as well Squamish, upper Howe Sound, Squamish Chief, and the surrounding mountains. The Sea-to-
Sky Gondola is open year round, seven days a week, and can carry a maximum of 600 people per hour.
Woodfibre LNG Application for an Environmental Assessment Certificate January 2015
Page 6.3-15
Since its opening, the Sea-to-Sky Gondola has averaged 1,500 to 3,000 visits per day. This new
attraction is projected to have between 200,000 and 300,000 visits per year, increasing to half a million
visits over the next five years (Sea-to-Sky Gondola 2014). Costing approximately $25 million to construct,
it has currently about 85 employees, 60% of which are full time. The gondola provides access to different
outdoor recreational opportunities, including hiking and running trails, paragliding launches, and
canyoning in the summer, and backcountry skiing and snowshoeing in the winter. Other facilities
include viewing platforms, suspension bridge, a gift and coffee shops, and a restaurant (Sea-to-Sky
Gondola 2014).
Another example of local tourism activity is Black Tusk Helicopter, established in 1993, which provides air
tours, charter and taxi services within the Sea-to-Sky corridor from its Squamish Municipal Airport
base (Cascade Environmental Resources Group 2008). The company offers back country day
trips, aerial sightseeing tours and glacier landings, heli-skiing, as well as air transport services for the
industry-oriented projects, such as timber harvesting, fire suppression and prevention, movies and
television commercials, and aerial construction (Black Tusk Helicopter Inc. n.d.). It has a heli-skiing tenure
on the west side of Howe Sound in the mountains above the Project area.
The Oceanfront Development Lands project is of particular importance to the District of Squamish. A
memorandum of understanding has been signed between a Squamish municipal entity and Matthews
Southwest and Bethel Lands Corporation to transform a 24 ha brownfield site into an urban space with
residential, commercial and open space development (District of Squamish 2014a, Ministry of Jobs,
Tourism and Skills Training 2013). The Squamish Oceanfront Development Corporation will maintain a
25% interest in the development, which will be built over a 20 year timeframe (District of Squamish
2014a). The District is also anticipating development of the Scott Crescent project, a combination of
approximately 450 units of condominiums and townhomes, and a light industrial component (District of
Squamish 2014e).
According to the December 2013 BC Major Projects Inventory, there are 11 major projects planned or
ongoing in Squamish, including the Project, the Sea-to-Sky Gondola, and the Squamish Oceanfront
Development (Appendix 6.3-1 Supplementary Labour Market Data, Table A-1). These projects are
predominantly residential or residential/commercial, but include utility, transportation and ski facility
projects. Based on available data, the combined budget for these projects is almost $4.3 billion, of which
$1.6 billion is for the Project (Ministry of Jobs, Tourism and Skills Training 2013).
Resort Municipality of Whistler
As a world-class four season mountain resort destination, Whistler’s economy relies almost completely on
the tourism and recreation industries. The community has deliberately focused on strengthening its tourist
economy over the past decade, as expressed in the statement that “economic diversification…
Woodfibre LNG Application for an Environmental Assessment Certificate January 2015
Page 6.3-16
undermines the value of these amenities and natural surrounds [and] could irreversibly destroy our
tourism economic base” (WCS & RMOW 2011a, Whistler Chamber of Commerce 2014). Whistler’s focus
on one industry is reflected in the decline in economic diversity between 2001 and 2011, as Whistler’s
diversity index score rose from 0.45 to 0.78 (Table 6.3-4).
BC’s image as a pristine, sustainable locale is central to Whistler’s tourism brand and value proposition
(Whistler Chamber of Commerce 2014). Tourism activity in BC was adversely affected following the 2008
economic recession and, while tourism has improved relative to 2008, the adverse effects continue to
persist. However, Whistler’s existing global brand and the legacy resulting from the Vancouver 2010
Winter Olympics have made the community more resilient to economic variance than other destination
locales.
Whistler generates approximately $1.27 billion in consumer spending annually, representing 22% of BC’s
export tourism economy and an estimated 25% of provincial tourism as a whole (RMOW 2013a, Whistler
Chamber of Commerce 2014). In 2012, Whistler had approximately 2.5 million unique visitors between its
winter and summer seasons. Although Whistler has more visitors during the summer months, these
guests are generally from the regional market, and stay for shorter periods than winter visitors who stay
for longer periods (Tourism Whistler 2014a).
Most revenues are derived from destination visitors (68.2%), followed by regional visitors (18.5%)
(RMOW n.d.). Between 2001 and 2012, the number of winter visitors increased by 18.8%, while the
number of summer visitors increased by 25.4% (WCS & RMOW 2011b). In its 2020 Comprehensive
Sustainability Plan (RMOW n.d.) the community identifies two priorities for its tourism economy:
1) enhancing the resort experience, and 2) ensuring economic viability through promotion of year-round
tourism and diversification of recreational opportunities to increase and stabilize consumer visits.
There are eight major projects planned for Whistler, in the residential/commercial, utility, arts and
educational services industries. These projects have a combined estimated cost of $671 million.
Construction has begun on two initiatives, the Audain Art Museum and the Rainbow Residential
Development (Ministry of Jobs, Tourism and Skills Training 2013).
Squamish-Lillooet Regional District Electoral Area D
Economic activity in SLRD Electoral Area D is focused around the communities of Britannia Beach and
Furry Creek. A copper mine and processing facility operated here from 1900 to 1974. The former mine
site was declared a National Historic Site in 1988, initiating the development of a small tourism-based
economy. Today the site hosts the award-winning Britannia Mine Museum, which received a major
investment for restoration as part of the 2010 Vancouver Olympic Games (Ministry of Jobs, Tourism and
Skills Training 2013). Construction of the mine remediation, mine museum, visitor centre and boardwalk
Woodfibre LNG Application for an Environmental Assessment Certificate January 2015
Page 6.3-17
were completed in September 2010, and there are plans for further project components. A commercial
component is included in the project plans, in the form of a historically themed mining town and waterfront
park (Ministry of Jobs, Tourism and Skills Training 2013).
The community of Furry Creek started out with a resource-based economy (e.g., logging, gravel
extraction). In 1993, development of the Furry Creek Golf and Country Club established the community
as a golfers’ recreational area between Whistler and Metro Vancouver (Furry Creek Golf and Country
Club 2014). Furry Creek has also been used occasionally as a location for the film industry. One major
project is underway in the community; the Furry Creek Residential project involves the development of
a 414 ha site, including 685 housing units and a marina (Ministry of Jobs, Tourism and Skills
Training 2013).
Squamish Nation
Squamish Nation maintains an active economic base centred on Squamish Nation-owned businesses
and leases derived from developments on Squamish Nation lands. Squamish Nation is well integrated
into the Lower Mainland regional economy due in part to the North Shore location of its main community
and proximity to other communities in Greater Vancouver. However, Squamish Nation’s economic
diversity decreased markedly between 2006 and 2011 (its diversity index score rose from 0.20 to 1.23)
demonstrating low levels of overall diversity in the economy (Table 6.3-4). This trend is linked to the
relative importance of nation-owned businesses and real estate development.
The Squamish Nation’s largest employer is the Squamish Nation Business Revenue and Services
department, which employs 75 workers (Squamish Nation 2013a). This department manages eight
businesses, including two marinas, one restaurant, three retailers, one RV park, and one forestry
company (Squamish Nation 2013a). Squamish Nation also opened the Squamish Lil’Wat Cultural Centre
jointly with Lil’Wat Nation in Whistler. This facility offers an exhibition space, theatre, gift shop and eco-
tourism desk (Tourism Whistler 2014a).
Squamish Nation maintains approximately 70 leases on Squamish lands, including those held by the
Greater Vancouver Storage Sewage Plant, International Plaza apartments, and Capilano Trailer Park
(Squamish Nation 2014). A key tenant operating on Squamish Nation lands is the Park Royal Shopping
Centre Holdings Ltd., as the south retail mall, 100 Park Royal, Village at Park Royal and several
restaurants and storage facilities are situated on Squamish Nation lands. The Park Royal Shopping
Centre was recently expanded and modernized to include an additional 11,150 m2 of leasable area and
parking, increasing rents collected by Squamish Nation annually (Squamish Nation 2013a).
Squamish Nation is involved with numerous real estate development plans, including proposed
developments at Capilano, Kitsilano, Chekwep, Stawamus and Senakw (Squamish Nation 2013a).
Woodfibre LNG Application for an Environmental Assessment Certificate January 2015
Page 6.3-18
Segments of the Whistler Alpine Lands were acquired by the Squamish Nation through the Olympic Joint
Legacy Agreement, and have been developed into townhouse units in partnership with the Bethel Lands
Corporation (Squamish Nation 2013b). According to the BC Major Projects Inventory, Squamish Nation
and Concord Pacific are seeking to undertake the Porteau Cove Residential Development, a
residential/commercial development outside of SLRD Electoral Area D (in Furry Creek). The project,
which is currently on hold, has an estimated cost of $200 million, and would cover 476 ha of land for
1,100 single and multifamily units and 295 ha of open space (Ministry of Jobs, Tourism and Skills Training
2013). The development of a $65 million, 39,950 m2 (430,000 square foot) destination shopping centre in
partnership with Progressive Properties is also proposed on 12 ha at Seymour Creek Village, with
consideration of accompanying residential developments (Coyne 2013).
Member-owned businesses also contribute to the Squamish Nation’s business sector. Its small
businesses feature artists (28), contracting, construction and excavation firms (seven), tourism-related
businesses (e.g., traditional cultural performers, outfitters) (seven), and gift shops and galleries (five)
(Squamish Nation 2012). The Xay Temixw (Sacred Land) Land Use Plan identifies the community’s
Forest Stewardship Zone as an area that could potentially be used for tourism purposes (Squamish
Nation 2013c).
Metro Vancouver
Metro Vancouver is BC’s principal economic and population hub, currently generating more than 50% of
the province’s economic activity (Metro Vancouver 2014). It is consistently ranked among the world’s
most livable cities, and received global exposure through the 2010 Vancouver Olympic Games. This
recognition has supported new economic activity in the region. Metro Vancouver is known for its
sustainable, innovative business culture, and its role as Canada’s Asia-Pacific gateway (Vancouver
Economic Commission 2014a). The region has a diverse economic base; key sectors include education,
film and television production, tourism, financial services, information and communication technology,
health services, mining, digital media, apparel, and transportation and logistics (Vancouver Economic
Commission 2014b). As the key provincial economic hub, Metro Vancouver has maintained a highly
diverse economy since 2001; its diversity index has remained constant at 0.03 since 2001 (Table 6.3-4).
In 2013, Metro Vancouver had 383 major projects either proposed or under construction. Based on
available data, the estimated combined budget of these projects is over $64.5 billion, with individual
project costs ranging in cost from $20 million to $4 billion. These projects are being developed in a range
of industries, including: arts, entertainment and recreation; commercial and residential development;
retail; accommodation and food service; educational services; information services; natural gas pipelines;
health care and social assistance; oil and gas extraction; port and harbour facilities; public administration;
seniors housing; social housing; transportation; utilities; warehousing; research and development; and
sewage and other systems.
Woodfibre LNG Application for an Environmental Assessment Certificate January 2015
Page 6.3-19
The five largest projects identified in Metro Vancouver are presented in Appendix 6.3-1 Supplementary
Labour Market Data, Table A-2. These projects are predominantly related to transportation and
residential development, and include the Roberts Bank Terminal 2 project, River District
residential/commercial development; Port Mann Bridge/Highway 1 Gateway Program, Skytrain
Expansion, and Vancouver International Airport Expansion (Ministry of Jobs, Tourism and Skills Training
2013).
6.3.2.2.1.2 Establishments and Locations
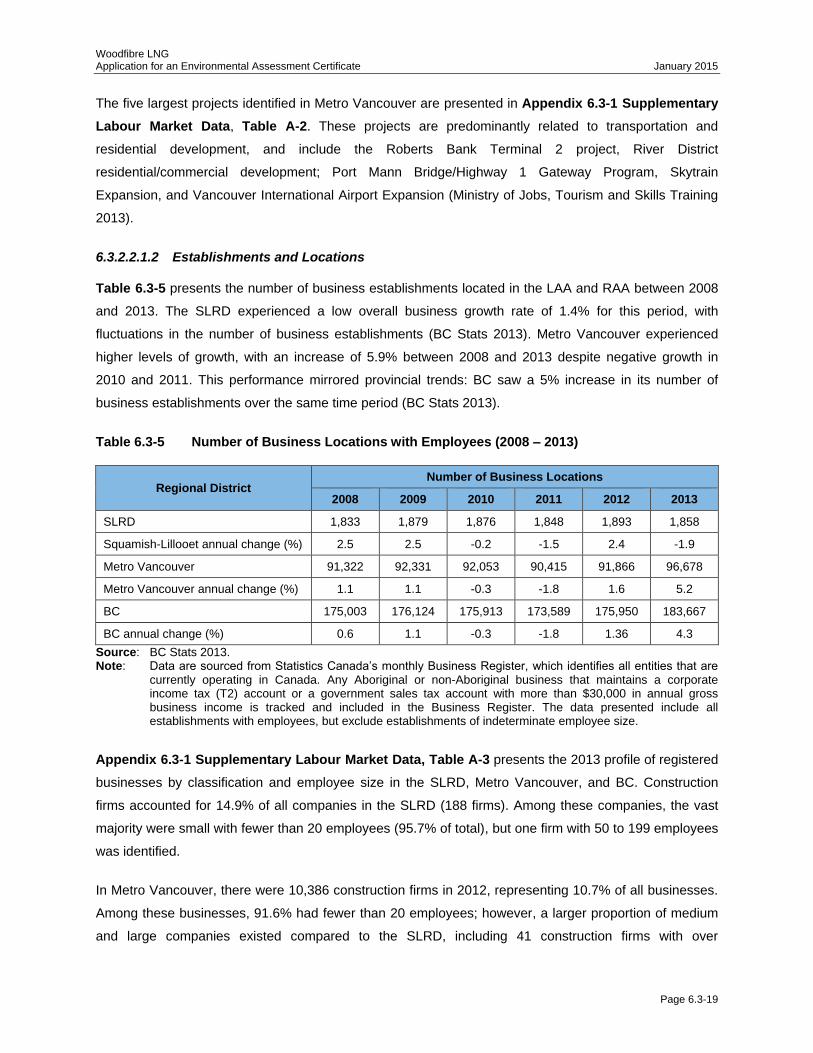
Table 6.3-5 presents the number of business establishments located in the LAA and RAA between 2008
and 2013. The SLRD experienced a low overall business growth rate of 1.4% for this period, with
fluctuations in the number of business establishments (BC Stats 2013). Metro Vancouver experienced
higher levels of growth, with an increase of 5.9% between 2008 and 2013 despite negative growth in
2010 and 2011. This performance mirrored provincial trends: BC saw a 5% increase in its number of
business establishments over the same time period (BC Stats 2013).
Table 6.3-5 Number of Business Locations with Employees (2008 – 2013)
Regional District Number of Business Locations
2008 2009 2010 2011 2012 2013
SLRD 1,833 1,879 1,876 1,848 1,893 1,858
Squamish-Lillooet annual change (%) 2.5 2.5 -0.2 -1.5 2.4 -1.9
Metro Vancouver 91,322 92,331 92,053 90,415 91,866 96,678
Metro Vancouver annual change (%) 1.1 1.1 -0.3 -1.8 1.6 5.2
BC 175,003 176,124 175,913 173,589 175,950 183,667
BC annual change (%) 0.6 1.1 -0.3 -1.8 1.36 4.3
Source: BC Stats 2013. Note: Data are sourced from Statistics Canada’s monthly Business Register, which identifies all entities that are
currently operating in Canada. Any Aboriginal or non-Aboriginal business that maintains a corporate income tax (T2) account or a government sales tax account with more than $30,000 in annual gross business income is tracked and included in the Business Register. The data presented include all establishments with employees, but exclude establishments of indeterminate employee size.
Appendix 6.3-1 Supplementary Labour Market Data, Table A-3 presents the 2013 profile of registered
businesses by classification and employee size in the SLRD, Metro Vancouver, and BC. Construction
firms accounted for 14.9% of all companies in the SLRD (188 firms). Among these companies, the vast
majority were small with fewer than 20 employees (95.7% of total), but one firm with 50 to 199 employees
was identified.
In Metro Vancouver, there were 10,386 construction firms in 2012, representing 10.7% of all businesses.
Among these businesses, 91.6% had fewer than 20 employees; however, a larger proportion of medium
and large companies existed compared to the SLRD, including 41 construction firms with over
Woodfibre LNG Application for an Environmental Assessment Certificate January 2015
Page 6.3-20
200 employees. By comparison, 12.1% of businesses in BC were involved in the construction industry. As
in the LAA, over 90% of these firms were small businesses with fewer than 20 employees. Province-wide,
47 construction firms were identified that employed over 200 employees.
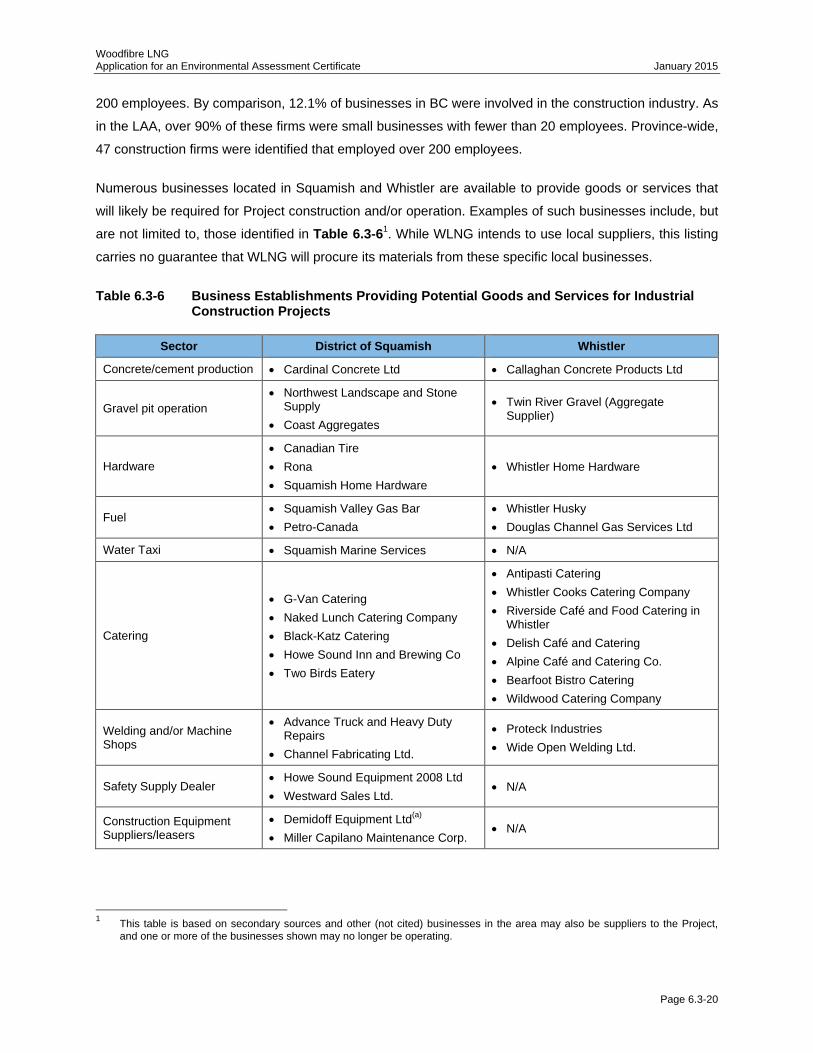
Numerous businesses located in Squamish and Whistler are available to provide goods or services that
will likely be required for Project construction and/or operation. Examples of such businesses include, but
are not limited to, those identified in Table 6.3-61. While WLNG intends to use local suppliers, this listing
carries no guarantee that WLNG will procure its materials from these specific local businesses.
Table 6.3-6 Business Establishments Providing Potential Goods and Services for Industrial Construction Projects
Sector District of Squamish Whistler
Concrete/cement production Cardinal Concrete Ltd Callaghan Concrete Products Ltd
Gravel pit operation
Northwest Landscape and Stone Supply
Coast Aggregates
Twin River Gravel (Aggregate Supplier)
Hardware
Canadian Tire
Rona
Squamish Home Hardware
Whistler Home Hardware
Fuel Squamish Valley Gas Bar
Petro-Canada
Whistler Husky
Douglas Channel Gas Services Ltd
Water Taxi Squamish Marine Services N/A
Catering
G-Van Catering
Naked Lunch Catering Company
Black-Katz Catering
Howe Sound Inn and Brewing Co
Two Birds Eatery
Antipasti Catering
Whistler Cooks Catering Company
Riverside Café and Food Catering in Whistler
Delish Café and Catering
Alpine Café and Catering Co.
Bearfoot Bistro Catering
Wildwood Catering Company
Welding and/or Machine Shops
Advance Truck and Heavy Duty Repairs
Channel Fabricating Ltd.
Proteck Industries
Wide Open Welding Ltd.
Safety Supply Dealer Howe Sound Equipment 2008 Ltd
Westward Sales Ltd. N/A
Construction Equipment Suppliers/leasers
Demidoff Equipment Ltd(a)
Miller Capilano Maintenance Corp. N/A
1 This table is based on secondary sources and other (not cited) businesses in the area may also be suppliers to the Project,
and one or more of the businesses shown may no longer be operating.
Woodfibre LNG Application for an Environmental Assessment Certificate January 2015
Page 6.3-21
Sector District of Squamish Whistler
Site excavation Demidoff Equipment Ltd
(a)
JIN Construction.
Coastal Mountain Excavations Ltd
Corona Excavations Ltd
Northland Excavating Ltd
Whistler Excavations Ltd
All-Terrain Excavating Ltd
Hans Demolition and Excavating Ltd(b)
Vegetation clearing Triack Resources N/A
Replanting (forestry and silviculture service firms)
Hedberg and Associates Consulting Ltd.
Leader Silviculture
Source: Wildwood Restaurant Group 2006, Gambier Island Water Taxi n.d., Tourism Whistler 2014b, 2014c, Alpine Café and Catering Co. n.d., Home Hardware Stores Ltd 2014, Canadian Tire 2014, Yellow Pages 2014a, Yellow Pages 2014b, Westward Sales Ltd. n.d., Yellow Pages 2014c, Squamish Chamber of Commerce 2012, Whistler Chamber of Commerce n.d., Coast Aggregates 2012, Hedberg and Associates 2008, All-Terrain Excavating Ltd 2011, Hans Demolition and Excavating Ltd 2013.
N/A = not applicable.
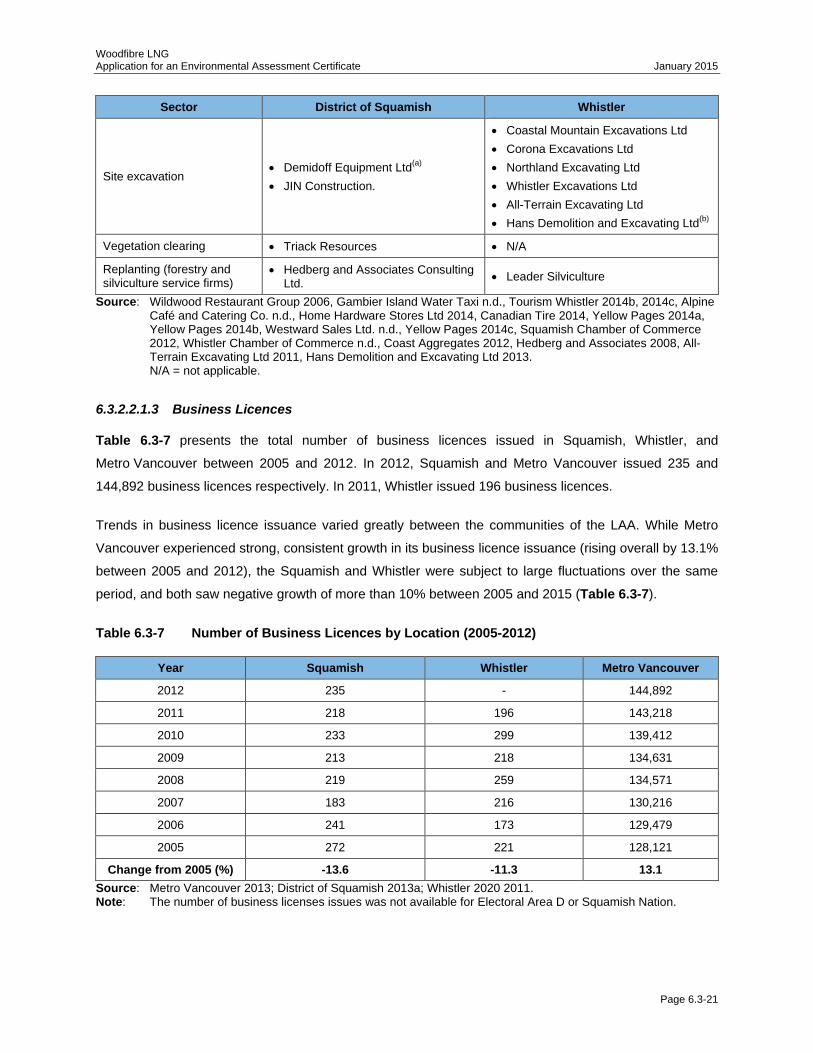
6.3.2.2.1.3 Business Licences
Table 6.3-7 presents the total number of business licences issued in Squamish, Whistler, and
Metro Vancouver between 2005 and 2012. In 2012, Squamish and Metro Vancouver issued 235 and
144,892 business licences respectively. In 2011, Whistler issued 196 business licences.
Trends in business licence issuance varied greatly between the communities of the LAA. While Metro
Vancouver experienced strong, consistent growth in its business licence issuance (rising overall by 13.1%
between 2005 and 2012), the Squamish and Whistler were subject to large fluctuations over the same
period, and both saw negative growth of more than 10% between 2005 and 2015 (Table 6.3-7).
Table 6.3-7 Number of Business Licences by Location (2005-2012)
Year Squamish Whistler Metro Vancouver
2012 235 - 144,892
2011 218 196 143,218
2010 233 299 139,412
2009 213 218 134,631
2008 219 259 134,571
2007 183 216 130,216
2006 241 173 129,479
2005 272 221 128,121
Change from 2005 (%)
-13.6 -11.3 13.1
Source: Metro Vancouver 2013; District of Squamish 2013a; Whistler 2020 2011. Note: The number of business licenses issues was not available for Electoral Area D or Squamish Nation.
Woodfibre LNG Application for an Environmental Assessment Certificate January 2015
Page 6.3-22
6.3.2.2.1.4 Economic Development Plans
The communities of the LAA have formalized their economic goals through community-based economic
development plans. Key economic development plans in the LAA include the following:
District of Squamish Economic Development Recommendations (Restraint Consulting 2010)
District of Squamish Outline for Economic Development Activities 2011-2015 (District of
Squamish n.d)
Squamish Nation’s Xay Temíxw Land Use Plan (Land and Resources Committee Squamish
Nation 2001) which includes a discussion of the community’s economic priorities
Whistler 2020 (RMOW 2013b, WCS & RMOW 2011c)
Squamish-Lillooet Regional District Regional Growth Strategy (SLRD 2010)
Metro Vancouver’s Regional Growth Strategy: Metro Vancouver 2040- Shaping our Future (Metro
Vancouver 2011)
District of Squamish
District of Squamish’s Outline for Economic Development Activities 2011-2015 (District of Squamish n.d)
includes key economic development recommendations focused on the enhancement of the District of
Squamish’s brand, image, and competitive advantage as the “Outdoor Recreation Capital of Canada”.
Also outlined are suggestions for strategic support for targeted sectors (e.g., tourism, port and marine
businesses, regional service centres, smaller-scale manufacturing, green industries, recreation
technology, construction, healthcare, recreation, industrial industries); the separation of the Squamish
Adventure Centre from the district’s economic development functions (achieved); assigned priorities
based on committed budgets; and the formalisation of strategic partnerships with Squamish Nation,
Whistler, and other governmental and non-governmental bodies as recommended to support stronger
local and regional economic development (Restraint Consulting 2010, District of Squamish 2014e).
Resort Municipality of Whistler
Whistler’s economic development strategies are captured in Whistler 2020, the community’s sustainability
plan (RMOW 2013b, WCS & RMOW 2011c). Priorities include enriching community life; enhancing the
resort experience; protecting the natural environment; ensuring economic viability; and partnering for
success (RMOW 2007). Whistler 2020’s Economic Strategy focuses on maintaining a diversified, year-
round tourism economy; achieving competitive returns on invested capital; taking advantage of economic
opportunities compatible with tourism; supporting success among locally-owned businesses; and offering
products and services with high net user value. The strategy highlights the need to protect Whistler’s core
accommodation base and partner with government and tourism organisations (WCS & RMOW 2011a).
Woodfibre LNG Application for an Environmental Assessment Certificate January 2015
Page 6.3-23
Squamish-Lillooet Regional District (including Electoral Area D)
Adopted in 2010, the SLRD Regional Growth Strategy provides a 20-year growth plan for the entire
SLRD, including Electoral Area D. The Strategy uses a smart growth framework to “shape the pattern and
quality of development along a more sustainable path” (SLRD 2010). Key economic development goals
include of the strategy include the following:
focussing development on compact, complete, sustainable communities
improving transportation linkages and options
supporting a range of quality, affordable housing
achieving a sustainable economy
protecting natural ecosystem functioning
encouraging the sustainable use of parks and natural areas
creating health and safe communities
enhancing relations with Aboriginal communities
improving collaboration among jurisdictions
Squamish Nation
Squamish Nation’s Xay Temíxw Land Use Plan identifies the wish to see greater economic development
and employment opportunities in-community. The plan identifies eco-tourism as both a potential
opportunity for jobs and economic growth, and a potential threat to environmental sustainability (Land and
Resources Committee Squamish Nation 2001). This plan also identifies the need to pursue training in
resource management and tourism positions, joint venture opportunities (particularly in forestry and
tourism), Nation-held forest tenure, and tourism licencing for activities on Squamish Nation’s traditional
territory (Land and Resources Committee Squamish Nation 2001).
Metro Vancouver
In 2011, Metro Vancouver adopted its Regional Growth Strategy: Metro Vancouver 2040 - Shaping our
Future (Metro Vancouver 2011). The growth strategy has five goals that focus on creating a compact
urban area, with growth in urban and transit centres; supporting sustainable economic growth through the
protection of industrial and agricultural land supply; and protecting the environment while responding to
climate change effects. The growth strategy also identifies the development of affordable housing and
sustainable transportation infrastructure as key goals, and recognizes marine transportation will have the
potential to play a larger role in the future of goods movement (Metro Vancouver 2011).
Woodfibre LNG Application for an Environmental Assessment Certificate January 2015
Page 6.3-24
British Columbia
With respect to economic development planning for the LNG sector, BC’s Ministry of Energy, Mines and
Natural Gas published A Strategy for BC’s Newest Industry (Ministry of Energy Mines and Natural Gas
2014) under the 2011 BC Jobs Plan. This strategy aims to guide the development of the LNG industry
province-wide and position BC as a global leader in LNG production and export by capitalising on BC’s
natural resource wealth and proximity to high demand Asian markets. Through the BC Jobs Plan and the
LNG Strategy, BC anticipates the construction and operation of three LNG facilities by 2020.
6.3.2.2.1.5 Economic Development Outlook
District of Squamish
Looking forward, the District of Squamish seeks to develop business sectors that fit among the
community’s existing industries and within its outdoor-focused lifestyle (District of Squamish 2014e).
Growth is anticipated through the consolidation of Squamish’s recreation and tourism brand and the
relocation of skilled professionals looking to start new local businesses (District of Squamish 2014e).
Consequently, continued growth in the tourism and outdoor recreation industries is expected to be a
driving force for the local economy (Tourism Squamish n.d.).
In key interviews, the District of Squamish also recognized the need for a mixed or diversified economy
resilient to economic change, given that this strategy helped the community to weather the 2008
economic recession (District of Squamish 2014e). Based on the above, knowledge-based industries are
also expected to be an important source of growth for Squamish, particularly in the existing geotechnical
and environmental technology and animation/film/television sectors, and through the emerging interactive
new media and recreational and sporting technologies (recreational technology) sectors, which are
aligned with the community’s focus on outdoor recreation and tourism (Business Squamish n.d.).
Given the high population growth projected for Squamish (an estimated 33,100 residents by 2031),
expansion in the local construction industry is also anticipated to meet the increased demand for housing
and infrastructure (District of Squamish Planning Department n.d.). These efforts include redevelopment
of the Squamish oceanfront that will support substantial growth in the local marine-based economy.
Development examples include plans for a pocket cruise ship terminal, a tourist boat dock, a boat works
yard for boat building and repair, a wind sports centre, and a marina.
As the site of two university campuses (the Squamish campus of Capilano University and Quest
University Canada), further growth in Squamish’s educational sector is expected, particularly as Quest
University Canada continues to expand its offerings (District of Squamish n.d.a, District of Squamish
2014e).
Woodfibre LNG Application for an Environmental Assessment Certificate January 2015
Page 6.3-25
Finally, as Metro Vancouver increases its capacity as a transportation hub for Asia-Pacific, Squamish is
also well-positioned to expand its role in the transportation sector, offering two marine berths, three
warehouses, specialized handling equipment and intermodal transportation infrastructure (including rail,
ocean and truck) (District of Squamish n.d.b.).
Resort Municipality of Whistler
In Whistler, there is a community-wide desire to further diversify the tourism product. Growth is expected
in the cultural tourism segment and in various recreational sectors, as Whistler seeks to gain greater
recognition for its mountain biking and lake sport opportunities (Whistler Chamber of Commerce 2014).
The recovery of the global economy has been slower than expected for Whistler, but the lower Canadian
dollar is expected to drive increased United States and international traffic to the community. The need for
the refurbishment and enhancement of Whistler Village is also expected to create new economic
development opportunities and drive local growth in the construction and trade sectors.
Metro Vancouver
According to the Conference Board of Canada, Vancouver’s gross domestic product is expected to rise
by 2.8% in 2014, below the 25 year average of 3%. This suppressed increase is attributed in part to
lagging employment in Vancouver’s film, media and tech sectors, but there is steady job growth in the
tourism sector (Parry 2014). Over the longer term, Metro Vancouver’s economy is forecasted to grow in
the following sectors:
tourism, given Metro Vancouver’s existing tourism and role as gateway to North America for
Asian visitors
film and television, given Metro Vancouver’s established cluster, variety of shooting locations and
arts and culture infrastructure
retail and personal services, corresponding with population growth and strengths in tourism,
specialty/destination retail and office retail
knowledge-based industries (e.g., digital media, communications, high tech, biotechnology,
research), given Metro Vancouver’s academic infrastructure and strategic location, attractive to
knowledge workers and firms
health, spurred by the aging domestic population of BC
green business, given Metro Vancouver’s reputation and expertise in advanced energy
technologies, green building and environmental sciences, and support through the City of
Vancouver’s Greenest City Action Plan
Industries associated with Port Metro Vancouver are also expected to increase in importance in Metro
Vancouver, with continued growth due to the expansion of Pacific Rim business. Over the next 10 years,
$22 billion in new public and private sector investment has been identified for the Greater Vancouver
Gateway (Canada’s main strategic link to Asia Pacific economies) to benefit from growing trans-Pacific
Woodfibre LNG Application for an Environmental Assessment Certificate January 2015
Page 6.3-26
traffic (Context Research Ltd 2012). At the multi-modal Vancouver International Airport, cargo handling is
also projected to double by 2020, and has resulted in an improvement plan for the airport and the
construction of a $200 million Canada Post e-commerce processing facility.
British Columbia
According to the Central 1 Credit Union, the provincial gross domestic product is projected to grow by a
modest 2.4% in 2014 due to low personal income growth, federal tightening of rules for mortgage
insurance and government spending restraint, exceeding 2013 growth (Central 1 Credit Union 2014).
Continued depreciation of the Canadian dollar combined with the improvement of the American economy
is expected to encourage a strong upturn in the trade sector of our natural resources.
Although the expansion in the economy will be modest in 2014 and is based primarily on export growth, a
sharp upward shift is expected after 2015. This forecasted growth is largely attributable to the
development of LNG projects by 2016, given BC’s plan to support the development of at least three LNG
operations and become a leader in the industry (Central 1 Credit Union 2014). BC’s LNG Strategy
identifies that, moving forward, the province must encourage capital planning and investment for BC to
enter the LNG export market as soon as possible (Government of BC 2013). Momentum in consumer
spending is projected to gather later, as industrial investment would drive employment and wage gains
throughout the BC economy.
6.3.2.2.2 Commercial Marine Use
Commercial Fishing
The RAA and LAA fall within DFO Fisheries Management Area (FMA) 28. While the LAA is located within
subarea 28-5, the RAA overlaps with subareas 28-1 through 28-5 (Figure 6.3-4). Subareas 28-6 through
28-14 are outside of the RAA, covering the Burrard Inlet and Indian Arm.
Finfish Harvest
In response to the high pink salmon (Oncorhynchus gorbuscha) run in 2013, a commercial pink salmon
fishery was opened in Howe Sound for the first time since 1962. The opening lasted three days and was
operated on a quota system, allowing only two commercial seine boats at any given time. Commercial
salmon fishing occurred throughout the waters from Watts Point to Squamish, but was generally
concentrated along the coastline from the Project area to Squamish (DFO 2014a, Pacific Prawn
Fishermen’s Association 2014, Western Forest Products Inc. 2014). In total, 282,400 pink salmon were
caught in FMA 28 during the opening (DFO 2014b).
It is not expected that the commercial pink salmon fishery will be opened in 2014, but on peak year
cycles, DFO may choose to open the fishery again (DFO 2014a). No other commercial finfish fishery
exists in Howe Sound.
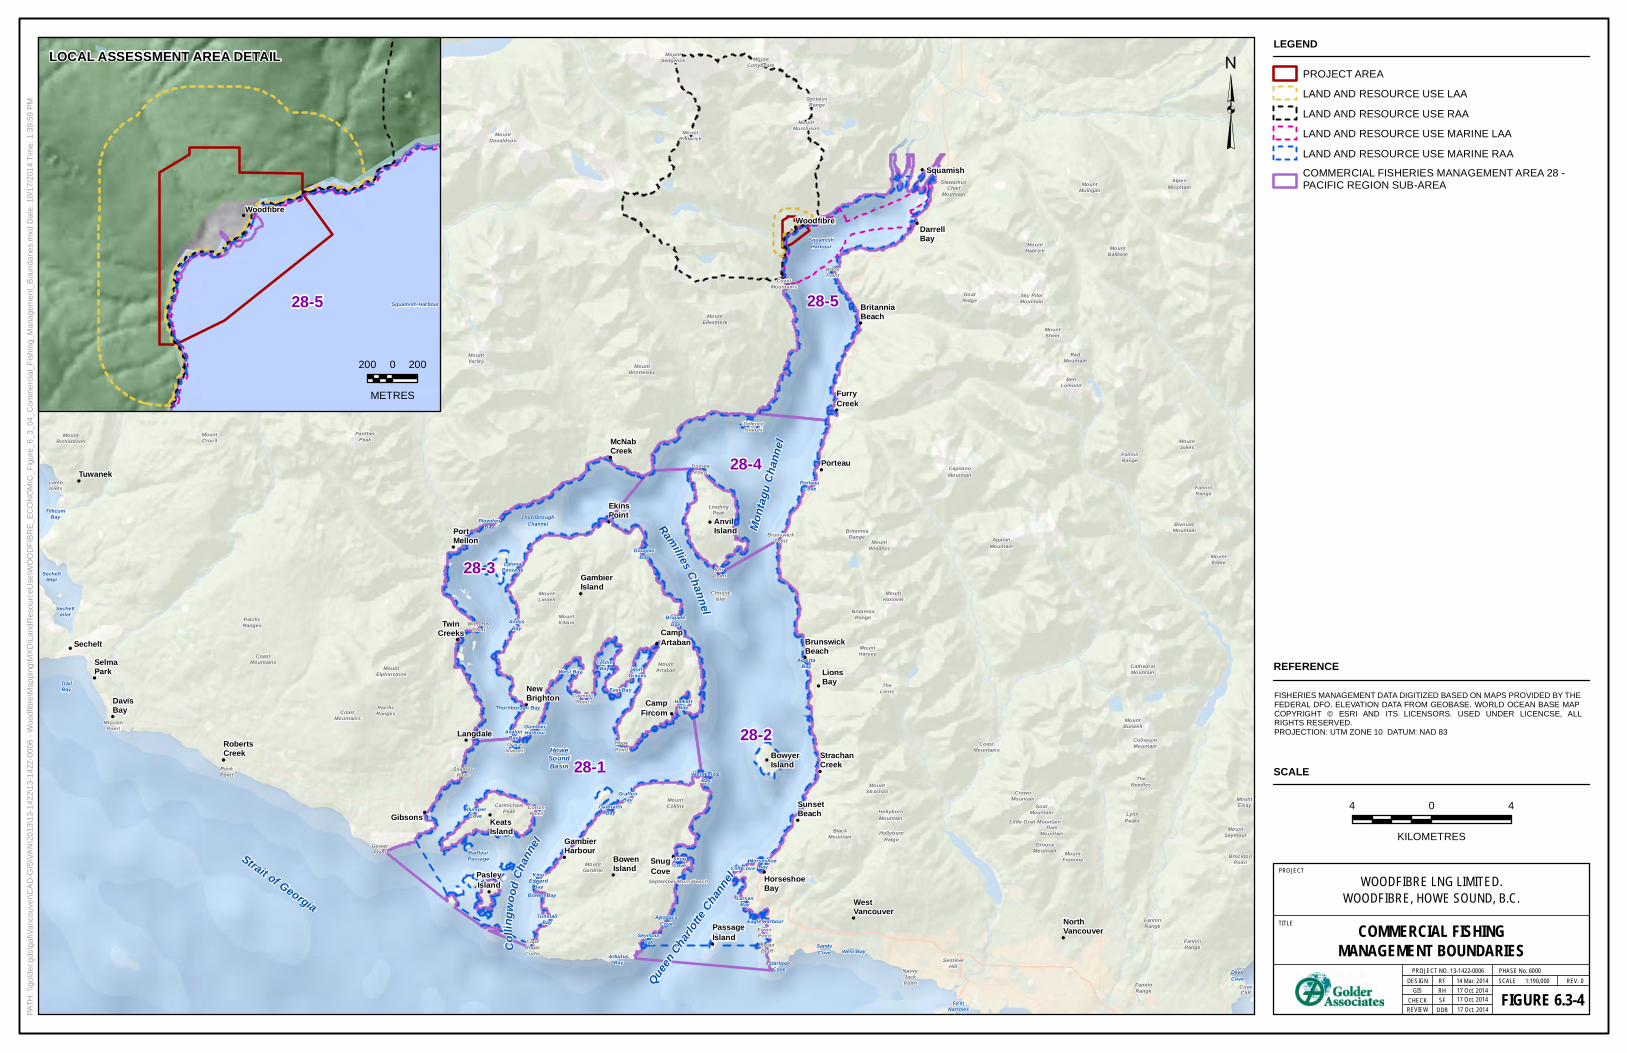
PATH
: \\go
lder.g
ds\ga
l\Van
couv
er\CA
D-GI
S\VAN
\2013
\13-14
22\13
-1422
-0006
- Woo
dfibre
\Map
ping\M
XD\La
ndRe
sourc
eUse
\WOO
DFIBR
E_EC
ONOM
IC_F
igure_
6_3_
04_C
omme
rcial_
Fishin
g_Ma
nage
ment_
Boun
darie
s.mxd
Date
: 10/1
7/201
4 Tim
e: 1:3
9:59 P
M
FIGURE 6.3-4REV. 0DESIGN
PROJECT NO. 13-1422-0006SCALE
PROJECT
TITLE
GIS
REVIEW
RF 14 Mar. 2014
CHECKRH 17 Oct. 2014
PHASE No. 6000
17 Oct. 2014
SF
WOODFIBRE LNG LIMITED.WOODFIBRE, HOWE SOUND, B.C.
LEGEND
SCALE
DDB 17 Oct. 2014
REFERENCE
FISHERIES MANAGEMENT DATA DIGITIZED BASED ON MAPS PROVIDED BY THEFEDERAL DFO. ELEVATION DATA FROM GEOBASE. WORLD OCEAN BASE MAPCOPYRIGHT © ESRI AND ITS LICENSORS. USED UNDER LICENCSE, ALLRIGHTS RESERVED.PROJECTION: UTM ZONE 10 DATUM: NAD 83
COMMERCIAL FISHINGMANAGEMENT BOUNDARIESCo
llingw
ood C
hann
el
Monta
gu C
hann
el
Queen
Charlo
tte Chan
nel
Ramillies Channel
HoweSoundBasin
Strait of Georgia
!
!
!
!
!
!
!
!
!
!
!
!
!
!
!
!
!
!
!
!
!
!
!
!
!
!
!
!
!
!
!
!!
!
!
!
MountWrottesley
MountGardner
CrownMountain
MountLiddell
MountElsay
Little Goat Mountain
TheLions
LynnPeaks
MountEldee
PacificRanges
MountDonaldson
PacificRanges
MountMurchison
PacificRanges
MountFromme
MountRichardson
MountMulligan
RedMountain
LeadingPeak
Sky PilotMountain
MountArtaban
AlpenMountain
MountElphinstone
BlackMountain
MountCollins
MountHanover
MountWindsor
ColiseumMountain
CoastMountains
CoastMountains
CoastMountains
CoastMountains
CoastMountains
BivouacMountain
MountStrachan
SentinelHill
HollyburnMountain
MountEllesmere
MountSheer
BritanniaRange
BritanniaRange
TetrahedronPeak
CarmichaelPeak
MountJukes
MountBaldwin
FanninRange
FanninRange
FanninRange
FanninRange
FanninRange
PantherPeak
MountRoderick
StawamusChief
Mountain
MountHarvey
MountSedgwick
MountVarley
TantalusRange
BenLomond
GoatMountain
MountHabrich
GrouseMountain
DamMountain
AppianMountain
MountSeymour
CapilanoMountain
GoatRidge
IndianBluff
MountCrucil
MountConybeare
HollyburnRidge
CathedralMountain
BlackBearBluff
TheNeedles
MountBurwell
MountKillam
CoveCliff
WitherbyPoint
September Morn Beach
CarmeloPoint
ChumPoint
SteelheadPoint
ThornhillPoint
BrocktonPoint
DomettPoint
CapeRogerCurtis
ChristieIslet
WattsPoint
GowerPoint
MidPoint
NavvyJackPoint
DefenceIslands
NewcombPoint
RockPoint
CottonPoint
BrunswickPoint
HopePoint
GraceIslands
ErwinPoint
LambIslets
SoamesPoint
IrbyPoint
MissionPoint
BarfleurPassage
FirstNarrows
ThornbroughChannel
LatonaPassage
SquamishHarbour
TunstallBay
DouglasBay
ApodacaCove
PortGraves
HalkettBay
East Bay
SandyCove
AvalonBay
BrigadeBay
Thornbrough Bay
AndysBay
Cliff CoveHorseshoe
Bay
GambierHarbour
CentreBay
SnugCove
West Bay
KingEdward
Bay
West Bay
GalbraithBay
ArbutusBay
GraftonBay
PlowdenBay
Eagle Harbour
PlumperCove
AlbertaBay
StarboatCove
NarrowsInlet
TrailBay
LarsenBay
MontevistaBay
SeymourBay
PorteauCove
SecheltInlet
SalmonInlet
SecheltInlet
Bowen Bay
DeepCove
TillicumBay
NorthVancouver
Squamish
WestVancouver
FurryCreek
Tuwanek
Gibsons
LionsBay
GambierHarbour
AnvilIsland
BrunswickBeach
CampArtaban
PassageIsland
EkinsPoint
KeatsIsland
McNabCreek
Porteau
StrachanCreek
TwinCreeks
PasleyIsland
SnugCove
NewBrighton
Woodfibre
Sechelt
Langdale
DavisBay
RobertsCreek
SelmaPark
BritanniaBeach
SunsetBeach
PortMellon
DarrellBay
BowenIsland
HorseshoeBay
GambierIsland
BowyerIsland
CampFircom
28-2
28-5
28-4
28-3
28-14 0 4
KILOMETRES
1:190,000
PROJECT AREALAND AND RESOURCE USE LAALAND AND RESOURCE USE RAALAND AND RESOURCE USE MARINE LAALAND AND RESOURCE USE MARINE RAACOMMERCIAL FISHERIES MANAGEMENT AREA 28 -PACIFIC REGION SUB-AREA
³!
28-5
Woodfibre
Squamish Harbour
LOCAL ASSESSMENT AREA DETAIL
200 0 200
METRES
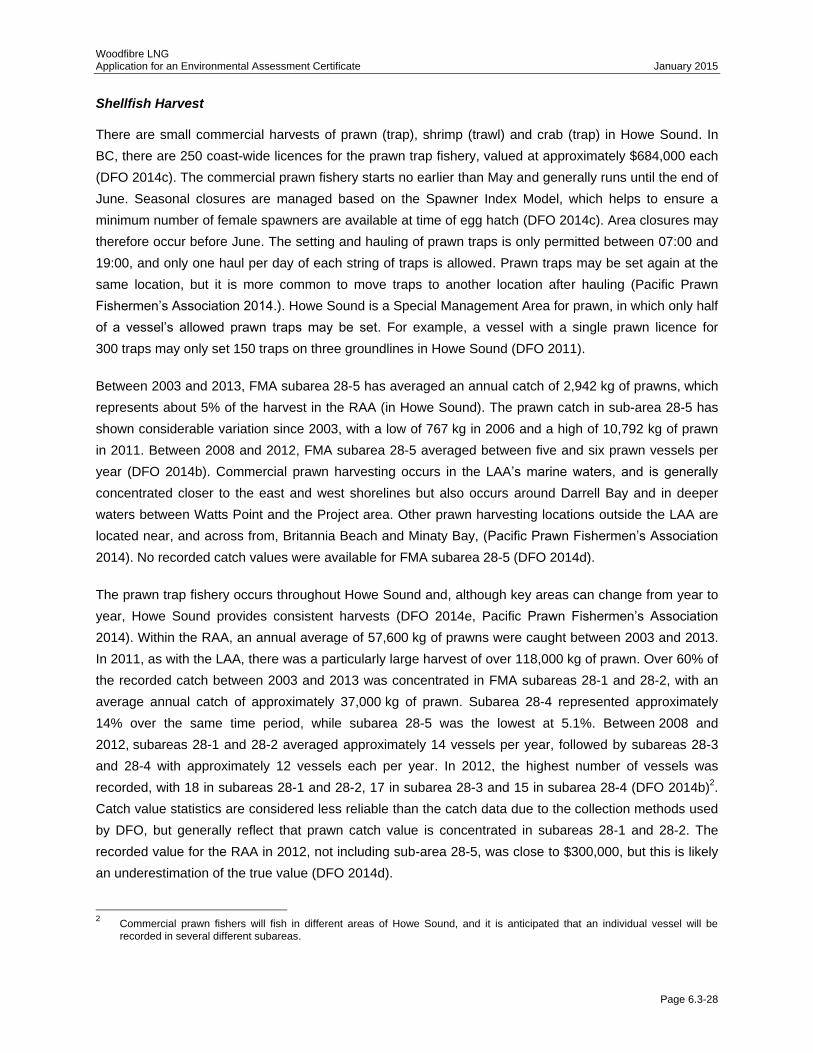
Woodfibre LNG Application for an Environmental Assessment Certificate January 2015
Page 6.3-28
Shellfish Harvest
There are small commercial harvests of prawn (trap), shrimp (trawl) and crab (trap) in Howe Sound. In
BC, there are 250 coast-wide licences for the prawn trap fishery, valued at approximately $684,000 each
(DFO 2014c). The commercial prawn fishery starts no earlier than May and generally runs until the end of
June. Seasonal closures are managed based on the Spawner Index Model, which helps to ensure a
minimum number of female spawners are available at time of egg hatch (DFO 2014c). Area closures may
therefore occur before June. The setting and hauling of prawn traps is only permitted between 07:00 and
19:00, and only one haul per day of each string of traps is allowed. Prawn traps may be set again at the
same location, but it is more common to move traps to another location after hauling (Pacific Prawn
Fishermen’s Association 2014.). Howe Sound is a Special Management Area for prawn, in which only half
of a vessel’s allowed prawn traps may be set. For example, a vessel with a single prawn licence for
300 traps may only set 150 traps on three groundlines in Howe Sound (DFO 2011).
Between 2003 and 2013, FMA subarea 28-5 has averaged an annual catch of 2,942 kg of prawns, which
represents about 5% of the harvest in the RAA (in Howe Sound). The prawn catch in sub-area 28-5 has
shown considerable variation since 2003, with a low of 767 kg in 2006 and a high of 10,792 kg of prawn
in 2011. Between 2008 and 2012, FMA subarea 28-5 averaged between five and six prawn vessels per
year (DFO 2014b). Commercial prawn harvesting occurs in the LAA’s marine waters, and is generally
concentrated closer to the east and west shorelines but also occurs around Darrell Bay and in deeper
waters between Watts Point and the Project area. Other prawn harvesting locations outside the LAA are
located near, and across from, Britannia Beach and Minaty Bay, (Pacific Prawn Fishermen’s Association
2014). No recorded catch values were available for FMA subarea 28-5 (DFO 2014d).
The prawn trap fishery occurs throughout Howe Sound and, although key areas can change from year to
year, Howe Sound provides consistent harvests (DFO 2014e, Pacific Prawn Fishermen’s Association
2014). Within the RAA, an annual average of 57,600 kg of prawns were caught between 2003 and 2013.
In 2011, as with the LAA, there was a particularly large harvest of over 118,000 kg of prawn. Over 60% of
the recorded catch between 2003 and 2013 was concentrated in FMA subareas 28-1 and 28-2, with an
average annual catch of approximately 37,000 kg of prawn. Subarea 28-4 represented approximately
14% over the same time period, while subarea 28-5 was the lowest at 5.1%. Between 2008 and
2012, subareas 28-1 and 28-2 averaged approximately 14 vessels per year, followed by subareas 28-3
and 28-4 with approximately 12 vessels each per year. In 2012, the highest number of vessels was
recorded, with 18 in subareas 28-1 and 28-2, 17 in subarea 28-3 and 15 in subarea 28-4 (DFO 2014b)2.
Catch value statistics are considered less reliable than the catch data due to the collection methods used
by DFO, but generally reflect that prawn catch value is concentrated in subareas 28-1 and 28-2. The
recorded value for the RAA in 2012, not including sub-area 28-5, was close to $300,000, but this is likely
an underestimation of the true value (DFO 2014d).
2 Commercial prawn fishers will fish in different areas of Howe Sound, and it is anticipated that an individual vessel will be
recorded in several different subareas.
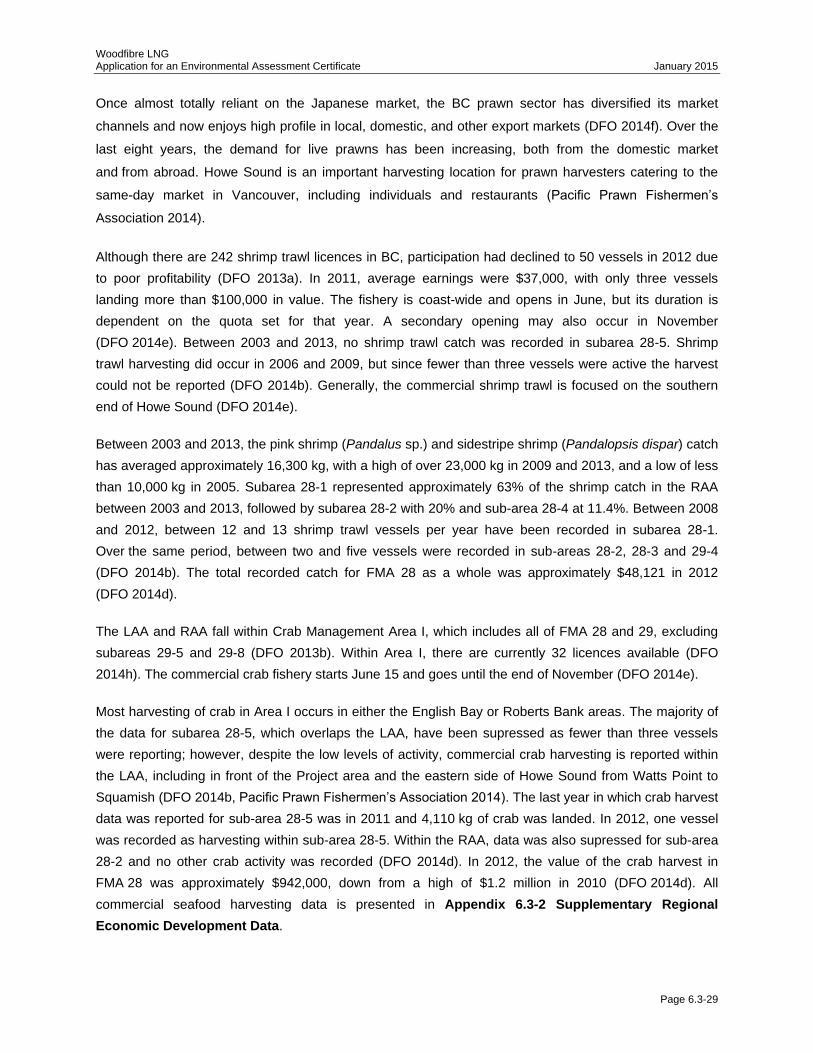
Woodfibre LNG Application for an Environmental Assessment Certificate January 2015
Page 6.3-29
Once almost totally reliant on the Japanese market, the BC prawn sector has diversified its market
channels and now enjoys high profile in local, domestic, and other export markets (DFO 2014f). Over the
last eight years, the demand for live prawns has been increasing, both from the domestic market
and from abroad. Howe Sound is an important harvesting location for prawn harvesters catering to the
same-day market in Vancouver, including individuals and restaurants (Pacific Prawn Fishermen’s
Association 2014).
Although there are 242 shrimp trawl licences in BC, participation had declined to 50 vessels in 2012 due
to poor profitability (DFO 2013a). In 2011, average earnings were $37,000, with only three vessels
landing more than $100,000 in value. The fishery is coast-wide and opens in June, but its duration is
dependent on the quota set for that year. A secondary opening may also occur in November
(DFO 2014e). Between 2003 and 2013, no shrimp trawl catch was recorded in subarea 28-5. Shrimp
trawl harvesting did occur in 2006 and 2009, but since fewer than three vessels were active the harvest
could not be reported (DFO 2014b). Generally, the commercial shrimp trawl is focused on the southern
end of Howe Sound (DFO 2014e).
Between 2003 and 2013, the pink shrimp (Pandalus sp.) and sidestripe shrimp (Pandalopsis dispar) catch
has averaged approximately 16,300 kg, with a high of over 23,000 kg in 2009 and 2013, and a low of less
than 10,000 kg in 2005. Subarea 28-1 represented approximately 63% of the shrimp catch in the RAA
between 2003 and 2013, followed by subarea 28-2 with 20% and sub-area 28-4 at 11.4%. Between 2008
and 2012, between 12 and 13 shrimp trawl vessels per year have been recorded in subarea 28-1.
Over the same period, between two and five vessels were recorded in sub-areas 28-2, 28-3 and 29-4
(DFO 2014b). The total recorded catch for FMA 28 as a whole was approximately $48,121 in 2012
(DFO 2014d).
The LAA and RAA fall within Crab Management Area I, which includes all of FMA 28 and 29, excluding
subareas 29-5 and 29-8 (DFO 2013b). Within Area I, there are currently 32 licences available (DFO
2014h). The commercial crab fishery starts June 15 and goes until the end of November (DFO 2014e).
Most harvesting of crab in Area I occurs in either the English Bay or Roberts Bank areas. The majority of
the data for subarea 28-5, which overlaps the LAA, have been supressed as fewer than three vessels
were reporting; however, despite the low levels of activity, commercial crab harvesting is reported within
the LAA, including in front of the Project area and the eastern side of Howe Sound from Watts Point to
Squamish (DFO 2014b, Pacific Prawn Fishermen’s Association 2014). The last year in which crab harvest
data was reported for sub-area 28-5 was in 2011 and 4,110 kg of crab was landed. In 2012, one vessel
was recorded as harvesting within sub-area 28-5. Within the RAA, data was also supressed for sub-area
28-2 and no other crab activity was recorded (DFO 2014d). In 2012, the value of the crab harvest in
FMA 28 was approximately $942,000, down from a high of $1.2 million in 2010 (DFO 2014d). All
commercial seafood harvesting data is presented in Appendix 6.3-2 Supplementary Regional
Economic Development Data.
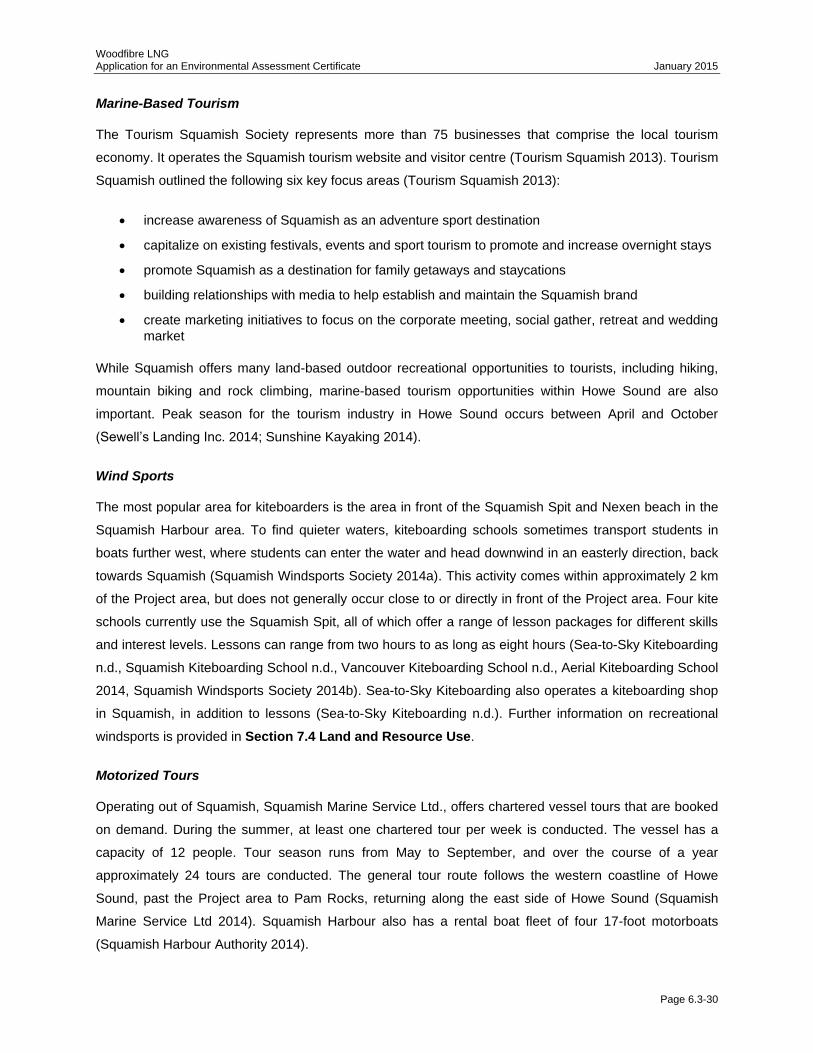
Woodfibre LNG Application for an Environmental Assessment Certificate January 2015
Page 6.3-30
Marine-Based Tourism
The Tourism Squamish Society represents more than 75 businesses that comprise the local tourism
economy. It operates the Squamish tourism website and visitor centre (Tourism Squamish 2013). Tourism
Squamish outlined the following six key focus areas (Tourism Squamish 2013):
increase awareness of Squamish as an adventure sport destination
capitalize on existing festivals, events and sport tourism to promote and increase overnight stays
promote Squamish as a destination for family getaways and staycations
building relationships with media to help establish and maintain the Squamish brand
create marketing initiatives to focus on the corporate meeting, social gather, retreat and wedding
market
While Squamish offers many land-based outdoor recreational opportunities to tourists, including hiking,
mountain biking and rock climbing, marine-based tourism opportunities within Howe Sound are also
important. Peak season for the tourism industry in Howe Sound occurs between April and October
(Sewell’s Landing Inc. 2014; Sunshine Kayaking 2014).
Wind Sports
The most popular area for kiteboarders is the area in front of the Squamish Spit and Nexen beach in the
Squamish Harbour area. To find quieter waters, kiteboarding schools sometimes transport students in
boats further west, where students can enter the water and head downwind in an easterly direction, back
towards Squamish (Squamish Windsports Society 2014a). This activity comes within approximately 2 km
of the Project area, but does not generally occur close to or directly in front of the Project area. Four kite
schools currently use the Squamish Spit, all of which offer a range of lesson packages for different skills
and interest levels. Lessons can range from two hours to as long as eight hours (Sea-to-Sky Kiteboarding
n.d., Squamish Kiteboarding School n.d., Vancouver Kiteboarding School n.d., Aerial Kiteboarding School
2014, Squamish Windsports Society 2014b). Sea-to-Sky Kiteboarding also operates a kiteboarding shop
in Squamish, in addition to lessons (Sea-to-Sky Kiteboarding n.d.). Further information on recreational
windsports is provided in Section 7.4 Land and Resource Use.
Motorized Tours
Operating out of Squamish, Squamish Marine Service Ltd., offers chartered vessel tours that are booked
on demand. During the summer, at least one chartered tour per week is conducted. The vessel has a
capacity of 12 people. Tour season runs from May to September, and over the course of a year
approximately 24 tours are conducted. The general tour route follows the western coastline of Howe
Sound, past the Project area to Pam Rocks, returning along the east side of Howe Sound (Squamish
Marine Service Ltd 2014). Squamish Harbour also has a rental boat fleet of four 17-foot motorboats
(Squamish Harbour Authority 2014).
Woodfibre LNG Application for an Environmental Assessment Certificate January 2015
Page 6.3-31
Sewell’s Landing Inc., (Sewell’s Marina) is a large marine-based tour operator in the RAA, with a fleet of
38 rental boats and three tour boats, berthed at its Horseshoe Bay marina. Tours are generally conducted
using two boats, each with a capacity of 12 people, although three boats will be used when there is
demand. During peak season, Sewell’s Marina runs three scheduled tours per day, each of which is
two hours long (Sewell’s Marina n.d.). The Sea Safari tours leave twice per day and travel up the eastern
side of Howe Sound, then return back down the eastern side of Gambier Island, through Collingwood
Channel and back to Horseshoe Bay. A new tour route for 2014, Sea Safari Deep Fjord runs once per
day and heads along the eastern side of Gambier Island up to the Defence Islands, and then crosses to
Britannia Beach, where it travels back to Horseshoe Bay along the eastern coastline of Howe Sound. In
addition to Sea Safari tours, Sewell’s Marina also organises marine-based scavenger hunts (Sea Quest)
within the eastern side of Howe Sound for large groups. No tours extend to the LAA, and most rentals are
estimated to stay on the eastern side of Howe Sound between Point Atkins and Anvil Islands
approximately 60% of the time (Sewell’s Landing Inc. 2014).
Paddling and Sailing Tours
Squamish has one kayaking school, Coast River Kayak, which provides sea kayaking tours and lessons,
in addition to white water kayaking courses. This company was established in 2011 and employs six part-
time employees. Peak season is from June to mid-September, with July and August being the busiest
months. Tours are also conducted during the shoulder season in spring and fall. Coast River Kayak’s
primary business is whitewater kayaking lessons, with approximately 100 people taking lessons per year.
Over the course of a year, Coast River Kayak provides sea kayaking tours to approximately 60 people,
averaging approximately five tours per month during peak season. While the majority of Coast River
Kayak’s clientele for whitewater are from Vancouver, international visitors make up the majority of the
demand for sea kayaking tours (Coast River Kayak 2014).
Coastal River Kayak’s two-hour tours generally focus on Squamish harbor and Squamish River. Its four-
hour tours often travel along the western side of Howe Sound. These tours generally come as far as the
Project area. Day tours are also conducted on occasion, approximately four to five per year, and typically
travel around Anvil Island (Coast River Kayak 2014). Coastal River Kayak does not currently rent kayaks
or stand-up paddle boards, but they are available for rent from Aerial Kiteboarding and Valhalla Pure in
Squamish (Aerial Kiteboarding School and Shop 2014a, Coast River Kayak 2014). Aerial Kiteboarding
also provides guided tours (Aerial Kiteboarding School and Shop 2014a, b, c).
Operating primarily in the southern portion of the RAA, Sunshine Kayaking was established in 1991 and
is based in Gibsons Landing Harbour. Services offered by Sunshine Kayaking include kayaking tours and
rentals, with a rental fleet of approximately 30 kayaks (plus 15 in inventory for sale) and one sail boat.
Over the course of the year, Sunshine Kayaking will have approximately 2,000 clients for kayak
rentals and 500 clients for its sailing and kayaking tours (between two and four clients per tour).
Woodfibre LNG Application for an Environmental Assessment Certificate January 2015
Page 6.3-32
Approximately 50 guided kayak tours are conducted per year. Sailing and kayaking tours vary from half
day tours, full day tours and multiday tours, and include full moon paddles and evening tours. Shorter
length kayak tours usually travel around Keats Island, while multiday will often travel around Gambier
Island (Sunshine Kayaking 2014).
Guided Fishing
No targeted guided fishing activities were identified within the LAA, although this activity occurs in several
other locations throughout Howe Sound. The nearest fishing location identified by fishing guides to the
Project area is the Defence Islands. Within Howe Sound, other key areas included Gambier Island and
Thornbrough Channel, the Grace Islands, southern end of Bowen Island, Hole in the Wall, Lions Bay,
Collingwood Channel, Point Atkinson, Hutt Island, Tunstall Bay, Keats Island, and Gower Point (Sewell’s
Landing Inc. 2014, Sunshine Kayaking 2014).
Within Howe Sound, recreational and guided fishing activity is generally highest in the summer, between
April and October (Sunshine Kayaking 2014). Sewell’s Marina’s fishing charters are owner-operated, with
Sewell’s providing administrative and advertising support. During peak season, charter operators based
at Sewell’s Marina run close to 200 fishing charters per month. Although the guided fishing fleet has
decreased by one boat over the last ten years, it was reported that the remaining boats are busy with a
steady stream of clients during the salmon fishing seasons. Key fishing areas change from year to year,
and in addition to Howe Sound, Sewell’s Marina-based charters may travel to the Capilano River, the
Fraser River and Gabriola Island. In 2013, approximately 85% of guided fishing associated with
Sewell’s Marina’s was estimated as taking place at least partly in Howe Sound waters (Sewell’s Landing
Inc. 2014).
Marine-Based Transportation
Squamish Terminals is a public terminal owned by Grieg Star Shipping AS (based in Norway), and is
open to all major break-bulk shipping lines (Squamish Terminals Ltd. 2014). Established in 1972 as a
forestry terminal servicing local pulp mills, Squamish Terminals is one of the largest wood-pulp handling
terminals in North America (Squamish Terminals Ltd. 2014). Although cargo currently handled by
Squamish Terminals remains predominately forest industry related (e.g., wood pulp, panel, lumber), it
also handles inbound steel products (e.g., pipe, rebar, coil, plate steel) and special cargo (e.g., yachts,
trailers, windmill parts, turbines) (Squamish Terminals Ltd 2012a, Squamish Terminals Ltd 2014).
Squamish Terminals has two berths that can handle common size Panamax vessels (generally 180 m to
220 m in length and 50,000 to 80,000 deadweight tonnes ) (Squamish Terminals Ltd. 2012b); however,
Handymax (open hatch) vessels(between 150 m to 200 m in length and 40,000 to 50,000 deadweight
tonnes) are most common. On an annual basis, there are approximately 100 vessel calls per year at
Squamish Terminals (Squamish Terminals Ltd. 2014). All vessels calling at Squamish Terminals traverse
the LAA.
Woodfibre LNG Application for an Environmental Assessment Certificate January 2015
Page 6.3-33
Squamish Terminals has a regular workforce of approximately 90 full-time equivalents, but also uses a
temporary pool of dock workers based in Vancouver who serve all marine terminals if required (Squamish
Terminals Ltd. 2014).
Squamish Marine Service Ltd., formerly Squamish Tug Ltd., was originally founded in 1972. In addition to
moorage and chartered tours, Squamish Marine Service Ltd., also offers water taxi services, small vessel
repair, and tugboats. The two tugboats are used for towing timber, construction rigs, barges and assisting
with ship docking. Squamish Marine Service Ltd. currently has 24 employees. However, the demand for
commercial marine transportation has declined with the closure of the Woodfibre pulp mill in 2006, and
Squamish Marine Service Ltd.’s capacity has decreased in response. Tug and water taxi traffic will
traverse the LAA (Squamish Marine Service Ltd 2014).
6.3.2.2.3 Local Government Finances
This section describes the existing conditions of local government finances, as well as the surrounding
environment, and factors influencing the local government finances subcomponent. Local governments
develop both capital and operating budgets as part of their ongoing financial planning. This baseline
focuses on operating revenues and expenditures, which are most closely linked to changes in service
demand. Information on services provided by local government can be found in Section 7.2
Infrastructure and Community Services, including healthcare, education, recreation, transportation,
potable water and wastewater infrastructure, solid waste infrastructure and services and emergency
services
6.3.2.2.3.1 Local Government Revenues and Expenditures
District of Squamish
Municipal government revenues for the District of Squamish are generated predominantly through
taxation, representing 38% to 55.1% of the LAA’s annual revenues since 2006 (Appendix 6.3-3
Supplementary Local Government Finances Data, Table C-1). In 2012, taxes and grants in lieu
generated 39.6% of revenue for the District of Squamish, while gains on land sales generated 14.1%
(District of Squamish 2008, 2009, 2011, 2012b, 2013c).
Appendix 6.3-3 Supplementary Local Government Finances Data, Table C-2 presents the total
expenditures by the District of Squamish between 2006 and 2012. For each year, departmental expenses
(e.g., general government, protective services, transportation, sanitation and waste removal, community
development services, parks, recreation and tourism) were the District’s key expenditure items,
representing 51% to 69% of all outlays (i.e., $17,181,351 to $21,842,541 in overall costs). Spending on
sewer and water facilities, amortisation expenses, and capital expenditures represented other key
expenditures over the same period (District of Squamish 2008, 2009, 2011, 2012b, 2013c).
Woodfibre LNG Application for an Environmental Assessment Certificate January 2015
Page 6.3-34
In recent years, the District “has embarked on an ambitious capital program that relied heavily on
borrowing, which needs to change” (District of Squamish 2014b). Consequently, the five-year capital
program for 2014 was established to fit within the District’s legal borrowing limits and to focus on other
funding opportunities. The capital budget for 2014 is 29% lower than that of 2013, but relies on less debt
and more on reserves saved from utility bill increases in previous years (District of Squamish 2014b).
There has been extensive debate over the District’s 2014 service level changes, given the initial
suggestion of a 0% tax revenue increase, which would have required a contraction of the budget by
$1.3 million (maintenance of a 2013 service level budget would have required a 6% tax change) (District
of Squamish 2014b). Council approved a budget increase of 5%, an approximate property tax increase of
4% for the average business and 6% per single family residence (District of Squamish 2014b; 2014f). Key
2014 budget drivers included contractual increases related to the Royal Canadian Mounted Police, transit
and others (2%); labour increases (2.5%), increases to capital funding (2.75%), and service contractions
across all departments (-3%) (District of Squamish 2014b). This budget allows for a reduced tax increase,
an annual special project envelop to decrease dependence on savings and stabilise future rates, a capital
plan that decreases annual borrowing for capital and an increased contribution to general fund capital
reserves. This plan also requires service reductions and user fee increases to reduce tax effects.
Although the capital program falls within financial and human resource limits, it is not viewed as sufficient
to realize long-term replacement requirements (District of Squamish 2014c). In 2014, budgeted operating
costs are anticipated to decrease for solid waste, recreation, parks and trails, and contributions to
capital programs.
According to the District of Squamish’s five-year financial plan (District of Squamish 2014c), revenues are
expected to increase from $38,579,848 in 2014 to $43,786,266 by 2018 (refer to Appendix 6.3-3
Supplementary Local Government Finances Data, Table C-3). Total revenues are projected to remain
below total expenses for all years. Property taxes will remain the largest income stream for the District,
representing close to 60% of total revenues. In terms of expenses, protective services and
general government services represent over 35% of the total costs combined in each year (District of
Squamish 2014c).
Squamish-Lillooet Regional District (including Electoral Area D)
Unlike local municipalities, regional districts do not levy and collect taxes directly from residents. Regional
districts create annual tax requisitions that specify the amount to be collected for each service provided,
such as water, wastewater, or transportation, in order to meet their annual revenue needs. Based on this
information, the province taxes property owners on a regional district’s behalf and remits the
revenue to the regional district (Berniaz 2009). Between 2009 and 2012, the SLRD generated
approximately one-third of its revenues through requisitions. An estimated one-third of revenues were
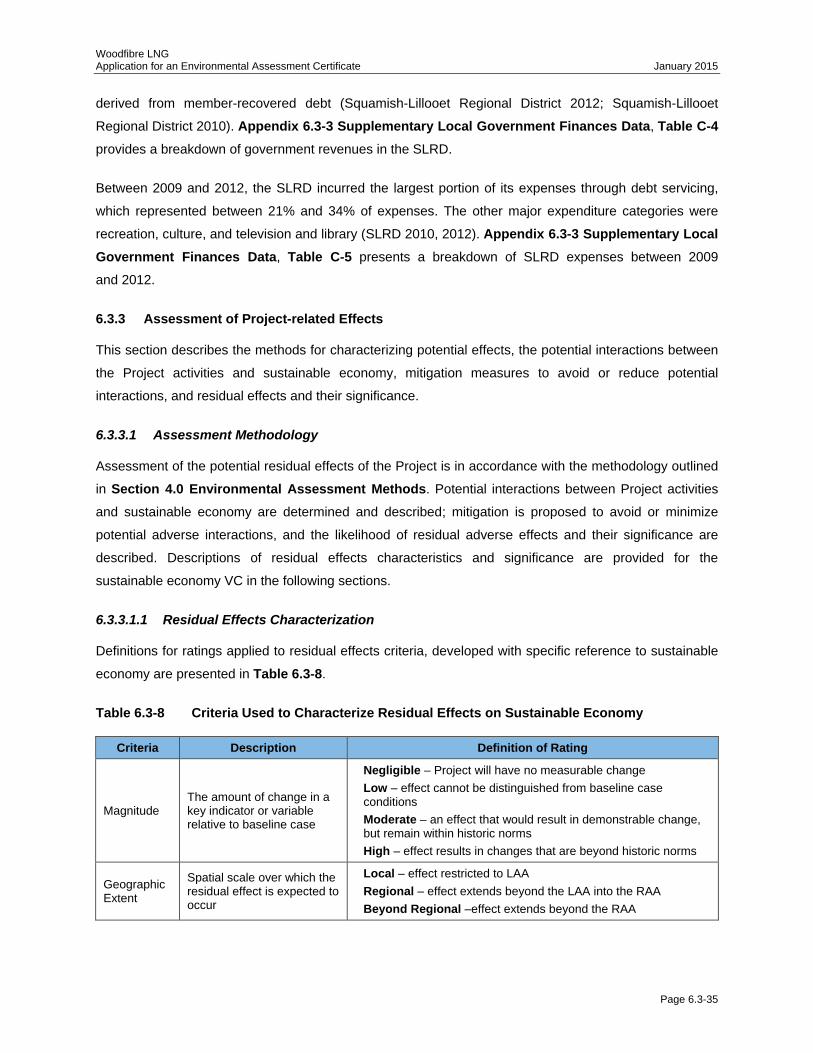
Woodfibre LNG Application for an Environmental Assessment Certificate January 2015
Page 6.3-35
derived from member-recovered debt (Squamish-Lillooet Regional District 2012; Squamish-Lillooet
Regional District 2010). Appendix 6.3-3 Supplementary Local Government Finances Data, Table C-4
provides a breakdown of government revenues in the SLRD.
Between 2009 and 2012, the SLRD incurred the largest portion of its expenses through debt servicing,
which represented between 21% and 34% of expenses. The other major expenditure categories were
recreation, culture, and television and library (SLRD 2010, 2012). Appendix 6.3-3 Supplementary Local
Government Finances Data, Table C-5 presents a breakdown of SLRD expenses between 2009
and 2012.
6.3.3 Assessment of Project-related Effects
This section describes the methods for characterizing potential effects, the potential interactions between
the Project activities and sustainable economy, mitigation measures to avoid or reduce potential
interactions, and residual effects and their significance.
6.3.3.1 Assessment Methodology
Assessment of the potential residual effects of the Project is in accordance with the methodology outlined
in Section 4.0 Environmental Assessment Methods. Potential interactions between Project activities
and sustainable economy are determined and described; mitigation is proposed to avoid or minimize
potential adverse interactions, and the likelihood of residual adverse effects and their significance are
described. Descriptions of residual effects characteristics and significance are provided for the
sustainable economy VC in the following sections.
6.3.3.1.1 Residual Effects Characterization
Definitions for ratings applied to residual effects criteria, developed with specific reference to sustainable
economy are presented in Table 6.3-8.
Table 6.3-8 Criteria Used to Characterize Residual Effects on Sustainable Economy
Criteria Description Definition of Rating
Magnitude The amount of change in a key indicator or variable relative to baseline case
Negligible – Project will have no measurable change
Low – effect cannot be distinguished from baseline case conditions
Moderate – an effect that would result in demonstrable change, but remain within historic norms
High – effect results in changes that are beyond historic norms
Geographic Extent
Spatial scale over which the residual effect is expected to occur
Local – effect restricted to LAA
Regional – effect extends beyond the LAA into the RAA
Beyond Regional –effect extends beyond the RAA
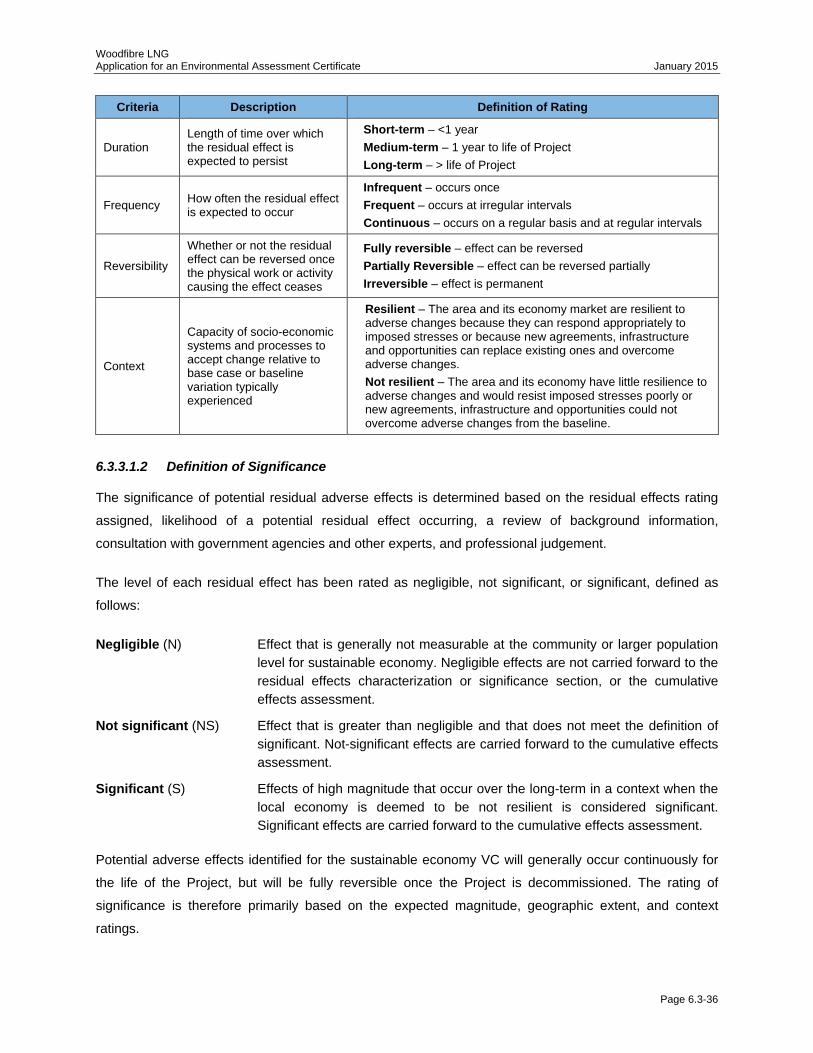
Woodfibre LNG Application for an Environmental Assessment Certificate January 2015
Page 6.3-36
Criteria Description Definition of Rating
Duration Length of time over which the residual effect is expected to persist
Short-term – <1 year
Medium-term – 1 year to life of Project
Long-term – > life of Project
Frequency How often the residual effect is expected to occur
Infrequent – occurs once
Frequent – occurs at irregular intervals
Continuous – occurs on a regular basis and at regular intervals
Reversibility
Whether or not the residual effect can be reversed once the physical work or activity causing the effect ceases
Fully reversible – effect can be reversed
Partially Reversible – effect can be reversed partially
Irreversible – effect is permanent
Context
Capacity of socio-economic systems and processes to accept change relative to base case or baseline variation typically experienced
Resilient – The area and its economy market are resilient to adverse changes because they can respond appropriately to imposed stresses or because new agreements, infrastructure and opportunities can replace existing ones and overcome adverse changes.
Not resilient – The area and its economy have little resilience to adverse changes and would resist imposed stresses poorly or new agreements, infrastructure and opportunities could not overcome adverse changes from the baseline.
6.3.3.1.2 Definition of Significance
The significance of potential residual adverse effects is determined based on the residual effects rating
assigned, likelihood of a potential residual effect occurring, a review of background information,
consultation with government agencies and other experts, and professional judgement.
The level of each residual effect has been rated as negligible, not significant, or significant, defined as
follows:
Negligible (N) Effect that is generally not measurable at the community or larger population
level for sustainable economy. Negligible effects are not carried forward to the
residual effects characterization or significance section, or the cumulative
effects assessment.
Not significant (NS) Effect that is greater than negligible and that does not meet the definition of
significant. Not-significant effects are carried forward to the cumulative effects
assessment.
Significant (S) Effects of high magnitude that occur over the long-term in a context when the
local economy is deemed to be not resilient is considered significant.
Significant effects are carried forward to the cumulative effects assessment.
Potential adverse effects identified for the sustainable economy VC will generally occur continuously for
the life of the Project, but will be fully reversible once the Project is decommissioned. The rating of
significance is therefore primarily based on the expected magnitude, geographic extent, and context
ratings.
Woodfibre LNG Application for an Environmental Assessment Certificate January 2015
Page 6.3-37
Likelihood refers to whether or not a residual effect is likely to occur (EAO 2013). The basis for likelihood
is assessed using appropriate qualitative terms with applicable descriptions for how a conclusion was
reached. The likelihood of potential residual effects occurring (after mitigation) is also characterized for
the sustainable economy VC using the following qualitative terms:
Unlikely – past experience and professional judgement indicate that a residual effect is unlikely to occur
Likely – past experience and professional judgement indicate that a residual effect is likely to occur
Characterization of likelihood is based on professional judgement considering the available qualitative
and quantitative data for each potential residual effect.
The level of confidence for each predicted effect is discussed to characterize the level of uncertainty
associated with both the significance and likelihood determinations. Level of confidence is typically based
on expert judgement and is characterized as follows:
Low – Judgement hampered by incomplete understanding of cause-effect relationships or lack of data
Moderate – Reasonable understanding of cause-effect relationships and adequate data
High – Good understanding of cause-effect relationships and ample data
Since there are many outside influences that can affect the magnitude and nature of the Project’s effect
on sustainable economy, such as population changes or macro-economic conditions, predictions of the
Project’s economic effects cannot be made with complete certainty.
6.3.3.2 Potential Interactions of the Project and Proposed Mitigation
Potential interactions between Project activities and the sustainable economy VC, and mitigation
measures proposed to avoid or minimize the interactions are presented in this section.
6.3.3.2.1 Potential Interactions
Potential interactions between Project activities and sustainable economy during the construction,
operation, and decommissioning phases of the Project are identified in Table 6.3-9. The following criteria
have been used to indicate the degree of the effect from the interaction between sustainable economy
and each activity:
No interaction predicted.
Minor interaction (i.e., an adverse effect may result from an interaction, but standard measures to
avoid or minimize the potential effect are available and well understood to be effective, and any
residual effects are negligible).
Carried forward indicates carried forward to the assessment of residual and cumulative effects,
meaning that the interaction may result in an adverse effect.
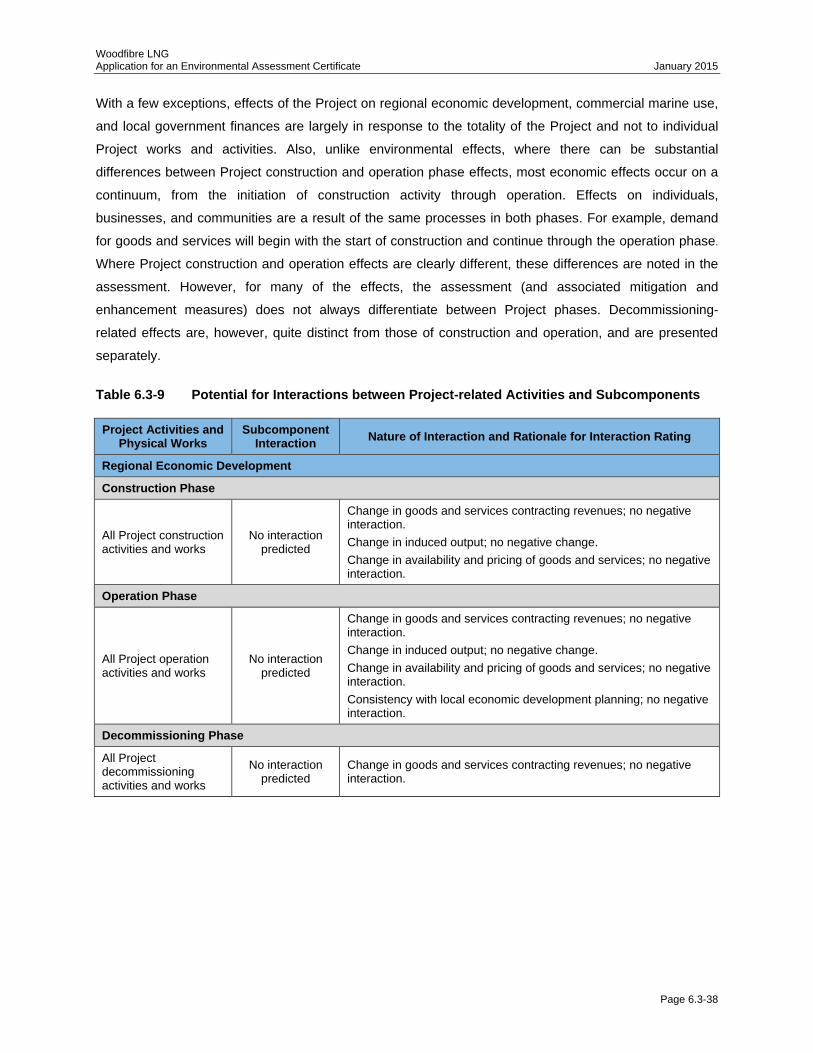
Woodfibre LNG Application for an Environmental Assessment Certificate January 2015
Page 6.3-38
With a few exceptions, effects of the Project on regional economic development, commercial marine use,
and local government finances are largely in response to the totality of the Project and not to individual
Project works and activities. Also, unlike environmental effects, where there can be substantial
differences between Project construction and operation phase effects, most economic effects occur on a
continuum, from the initiation of construction activity through operation. Effects on individuals,
businesses, and communities are a result of the same processes in both phases. For example, demand
for goods and services will begin with the start of construction and continue through the operation phase.
Where Project construction and operation effects are clearly different, these differences are noted in the
assessment. However, for many of the effects, the assessment (and associated mitigation and
enhancement measures) does not always differentiate between Project phases. Decommissioning-
related effects are, however, quite distinct from those of construction and operation, and are presented
separately.
Table 6.3-9 Potential for Interactions between Project-related Activities and Subcomponents
Project Activities and Physical Works
Subcomponent Interaction
Nature of Interaction and Rationale for Interaction Rating
Regional Economic Development
Construction Phase
All Project construction activities and works
No interaction predicted
Change in goods and services contracting revenues; no negative interaction.
Change in induced output; no negative change.
Change in availability and pricing of goods and services; no negative interaction.
Operation Phase
All Project operation activities and works
No interaction predicted
Change in goods and services contracting revenues; no negative interaction.
Change in induced output; no negative change.
Change in availability and pricing of goods and services; no negative interaction.
Consistency with local economic development planning; no negative interaction.
Decommissioning Phase
All Project decommissioning activities and works
No interaction predicted
Change in goods and services contracting revenues; no negative interaction.
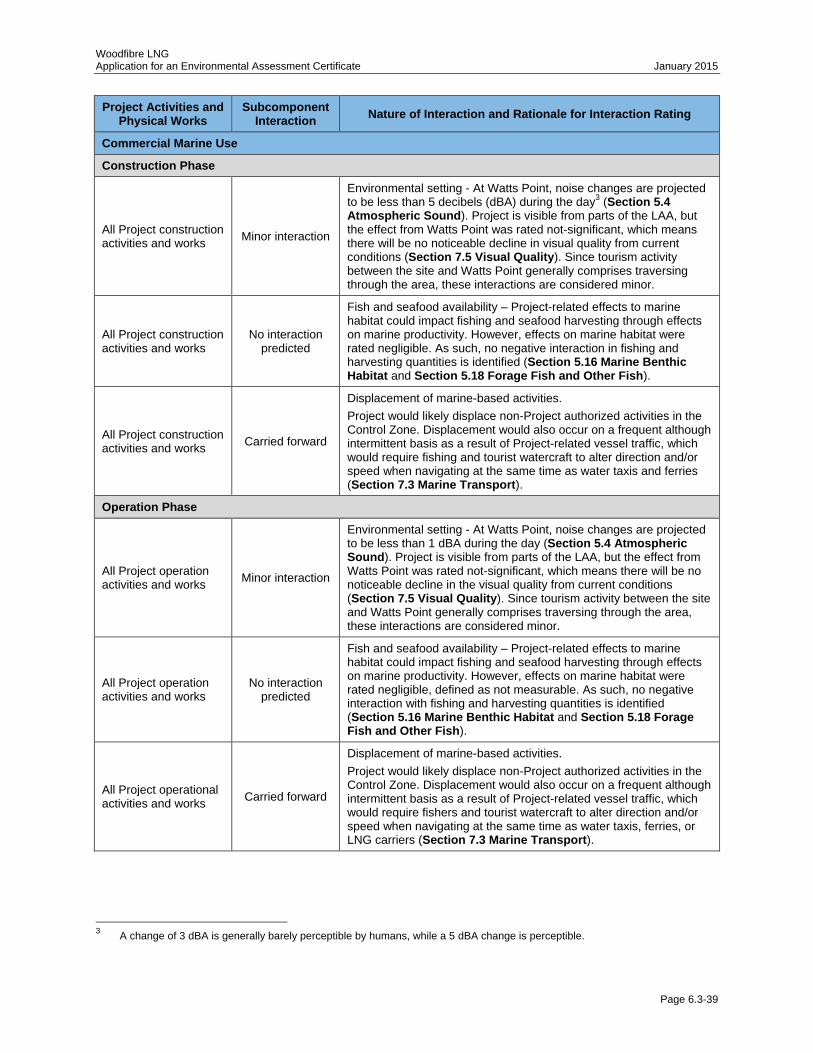
Woodfibre LNG Application for an Environmental Assessment Certificate January 2015
Page 6.3-39
Project Activities and Physical Works
Subcomponent Interaction
Nature of Interaction and Rationale for Interaction Rating
Commercial Marine Use
Construction Phase
All Project construction activities and works
Minor interaction
Environmental setting - At Watts Point, noise changes are projected to be less than 5 decibels (dBA) during the day
3 (Section 5.4
Atmospheric Sound). Project is visible from parts of the LAA, but the effect from Watts Point was rated not-significant, which means there will be no noticeable decline in visual quality from current conditions (Section 7.5 Visual Quality). Since tourism activity between the site and Watts Point generally comprises traversing through the area, these interactions are considered minor.
All Project construction activities and works
No interaction predicted
Fish and seafood availability – Project-related effects to marine habitat could impact fishing and seafood harvesting through effects on marine productivity. However, effects on marine habitat were rated negligible. As such, no negative interaction in fishing and harvesting quantities is identified (Section 5.16 Marine Benthic Habitat and Section 5.18 Forage Fish and Other Fish).
All Project construction activities and works
Carried forward
Displacement of marine-based activities.
Project would likely displace non-Project authorized activities in the Control Zone. Displacement would also occur on a frequent although intermittent basis as a result of Project-related vessel traffic, which would require fishing and tourist watercraft to alter direction and/or speed when navigating at the same time as water taxis and ferries (Section 7.3 Marine Transport).
Operation Phase
All Project operation activities and works
Minor interaction
Environmental setting - At Watts Point, noise changes are projected to be less than 1 dBA during the day (Section 5.4 Atmospheric Sound). Project is visible from parts of the LAA, but the effect from Watts Point was rated not-significant, which means there will be no noticeable decline in the visual quality from current conditions (Section 7.5 Visual Quality). Since tourism activity between the site and Watts Point generally comprises traversing through the area, these interactions are considered minor.
All Project operation activities and works
No interaction predicted
Fish and seafood availability – Project-related effects to marine habitat could impact fishing and seafood harvesting through effects on marine productivity. However, effects on marine habitat were rated negligible, defined as not measurable. As such, no negative interaction with fishing and harvesting quantities is identified (Section 5.16 Marine Benthic Habitat and Section 5.18 Forage Fish and Other Fish).
All Project operational activities and works
Carried forward
Displacement of marine-based activities.
Project would likely displace non-Project authorized activities in the Control Zone. Displacement would also occur on a frequent although intermittent basis as a result of Project-related vessel traffic, which would require fishers and tourist watercraft to alter direction and/or speed when navigating at the same time as water taxis, ferries, or LNG carriers (Section 7.3 Marine Transport).
3 A change of 3 dBA is generally barely perceptible by humans, while a 5 dBA change is perceptible.
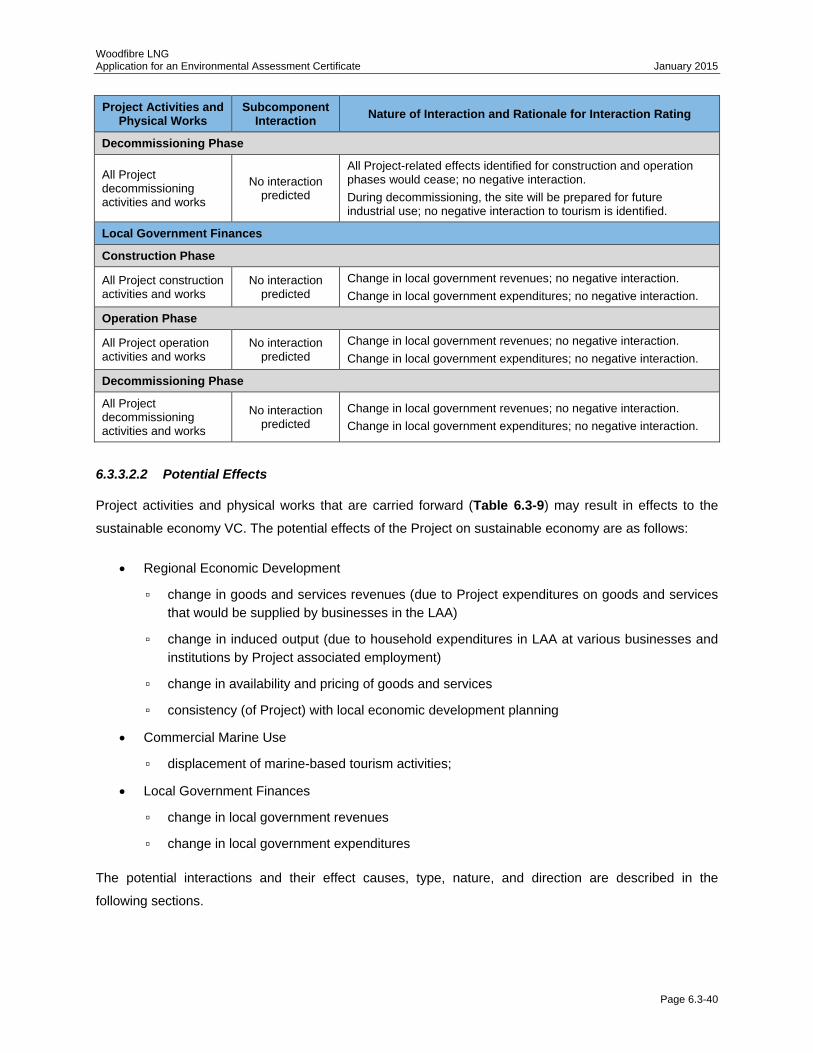
Woodfibre LNG Application for an Environmental Assessment Certificate January 2015
Page 6.3-40
Project Activities and Physical Works
Subcomponent Interaction
Nature of Interaction and Rationale for Interaction Rating
Decommissioning Phase
All Project decommissioning activities and works
No interaction predicted
All Project-related effects identified for construction and operation phases would cease; no negative interaction.
During decommissioning, the site will be prepared for future industrial use; no negative interaction to tourism is identified.
Local Government Finances
Construction Phase
All Project construction activities and works
No interaction predicted
Change in local government revenues; no negative interaction.
Change in local government expenditures; no negative interaction.
Operation Phase
All Project operation activities and works
No interaction predicted
Change in local government revenues; no negative interaction.
Change in local government expenditures; no negative interaction.
Decommissioning Phase
All Project decommissioning activities and works
No interaction predicted
Change in local government revenues; no negative interaction.
Change in local government expenditures; no negative interaction.
6.3.3.2.2 Potential Effects
Project activities and physical works that are carried forward (Table 6.3-9) may result in effects to the
sustainable economy VC. The potential effects of the Project on sustainable economy are as follows:
Regional Economic Development
▫ change in goods and services revenues (due to Project expenditures on goods and services
that would be supplied by businesses in the LAA)
▫ change in induced output (due to household expenditures in LAA at various businesses and
institutions by Project associated employment)
▫ change in availability and pricing of goods and services
▫ consistency (of Project) with local economic development planning
Commercial Marine Use
▫ displacement of marine-based tourism activities;
Local Government Finances
▫ change in local government revenues
▫ change in local government expenditures
The potential interactions and their effect causes, type, nature, and direction are described in the
following sections.
Woodfibre LNG Application for an Environmental Assessment Certificate January 2015
Page 6.3-41
6.3.3.2.2.1 Potential Interactions for Regional Economic Development
The potential effects of the Project on the regional economic development sub-component are related to
Project spending on goods and services, the local supply sector’s capacity to respond to the Project’s
contracting opportunities, and the consistency of the Project’s activities with local economic
development plans.
Construction and Operation – Change in Goods and Services Contracting Revenues
Economic development effects in the LAA communities will primarily be the result of the interaction of
Project-associated contracting opportunities and the capacity of LAA suppliers to provide needed goods
and services. This interaction is expected to result in incremental goods and services contracting
revenues for LAA suppliers.
The Proponent’s procurement practices and general economic conditions in the LAA, RAA (BC) and
Canada will positively affect the level of interest expressed by supplier enterprises and, consequently, the
extent to which the economies of the three main LAA population centres (Metro Vancouver, Squamish,
and Whistler) can maximize their shares of Project-related economic benefits. Local companies could
expand in size and/or increase their service/product offerings to become more competitive and new
businesses could be created because of Project demand. LAA enterprises could further benefit from the
expanded capacity, new skills and innovations developed as a result of the Project by increasing their
share of the expenditures made in the LAA communities (i.e., by displacing goods and services brought in
from outside the LAA) or by exporting.
The Project-related expenditures flowing to businesses located in the LAA communities will be influenced
by their capacity for meeting Project goods and services supply requirements. Capacity limitations within
local and regional supplier industries could include limited contractor experience, expertise, or credentials
for meeting project bid or performance standards.
Adverse effects could occur if local and regional businesses and contractors were unable to participate
fairly in the Project’s procurement and supply opportunities. WLNG is expected to use competitive bidding
practices and abide by various trade agreements (such as North American Free Trade Agreement and
World Trade Organisation agreements) to which Canada is a signatory. Adverse effects to local and
regional businesses and contractors are not anticipated from the perspective of LAA businesses being
allowed by WLNG to participate fairly in the Project’s procurement and supply opportunities and are
therefore not carried forward for further assessment.
The Project is situated within BC’s Lower Mainland region, which has the largest population, labour force
and business supply sector in the province. Several major construction projects have been successfully
undertaken within the LAA in recent years using local and regional goods and services suppliers,
Woodfibre LNG Application for an Environmental Assessment Certificate January 2015
Page 6.3-42
including the Sea-to-Sky Highway 99 upgrade, new Vancouver trade and convention centre, Port
Mann Bridge replacement, BC Place Stadium renovation, and various 2010 Winter Olympic Games
venue projects.
Due to their proximity to the Project site, Squamish area businesses will have a locational advantage in
terms of supplying to the Project certain types of basic goods and services, such as fuels and excavating
services. Metro Vancouver will be a major beneficiary in the LAA of the Project’s spending on goods and
services because of its well established role as the commercial, retail and service centre for BC
(See Section 6.3.1.1.1). The Metro Vancouver supply sector is deep, diverse, and experienced in terms
of producing and supplying a broad range of goods, such as fill, various cement products and wood
products, as well as services, such as various engineering services.
The goods and services revenues (output) for direct supplier industries in BC due to Project spending for
building the LNG facility is anticipated to be approximately $242 million over the 24-month construction
phase4.
There is anticipated to be an additional $136 million in goods and services revenues for BC businesses
due to expenditures on production inputs to make or provide the direct goods and services5 for the
Project. An example of a potential upstream supplier is a cement manufacturer that supplies the cement
to a concrete products manufacturer. Further upstream of the cement maker are enterprises that supply
inputs into the cement making process, such as limestone. There is anticipated to be an estimated total of
$378 million of incremental goods and services contracting revenues in BC via the Project’s construction
phase, or an annual average of $189 million.
The proportion of these revenues that would accrue to companies located in the LAA communities will be
based on their capacity, expertise, and willingness to participate in Project construction. An assumption is
made for this assessment that LAA businesses would capture approximately 55% of the Project’s
spending in BC on goods and services during the construction and operation phases.6 On this basis,
businesses in the LAA are expected to realise $208 million in direct and indirect goods and services
contracting revenues due to the Project over the 24-month construction phase, or an annual average of
$104 million.
4 This estimate of direct supplier industry goods and services revenues (output) in BC is tied to estimates of planned Project
direct expenditures on goods and services that are produced in BC. This estimate does not include Project expenditures on goods and services produced outside of BC. The estimate of BC direct supplier industry revenues (output) is based on goods and services expenditure estimates for the Project provided by WLNG, expected geographic sourcing of capital equipment as provided by WLNG and estimated level of imports by the engineering construction industry in BC. It is possible that LAA and BC businesses would capture a larger share of the Project’s direct expenditures on goods and services than the shares reported in this assessment. This estimate of direct supplier industry goods and services revenues is based on data and information that is current as of September 2014, and is subject to change as planning and permitting for the Project progresses.
5 The estimate of Project associated goods and services revenues (output) for indirect suppliers was calculated with WLNG
supplied estimates of the Project’s planned expenditures on direct goods and services and labour compensation and Statistics Canada industry output multipliers (Statistics Canada 2012).
6 This assumption uses labour force size as a proxy for economic capacity and capabilities. The LAA accounts for approximately
55% of the BC labour force.
Woodfibre LNG Application for an Environmental Assessment Certificate January 2015
Page 6.3-43
The operation phase business opportunities due to Project-associated goods and services supply and
consumer expenditures are similar in type to the construction phase opportunities. The key difference is
that the opportunities extend over a minimum 25-year operation period, which presents a lengthy interval
for suppliers to recoup any Project-focused investments.
In the third year of Project operation and thereafter, the annual average goods and services contracting
revenues for direct BC supplier industries, i.e., monies connected to Project spending on operation
matters, is anticipated to be approximately $416 million.7 Most of these monies would be spent on natural
gas feedstock as an input to LNG production. On an annual basis, there is expected to be another
$151 million in goods and services revenues for upstream supply industries in BC connected to the direct
spending of the Project on goods and services. Most of the upstream supplier industry revenues are
connected to natural gas production and processing in the province. There will be an estimated total of
$567 million in direct and indirect goods and services contracting revenues on an annual basis in the
province due to the Project.
The impact on the LAA of goods and services spending in the operation phase will be proportionately
smaller than in the construction phase because of the relative importance of spending on natural gas
feedstock within the annual operating budget of the Project. Most of the direct and indirect goods and
services revenues associated with the Project’s spending for natural gas feedstock are tied to northeast
BC natural gas production. As a consequence, direct and indirect goods and services revenues in the
LAA on an annual basis are expected to be approximately $68 million in connection with Project goods
and services spending.
Effects on business opportunities in the LAA resulting from Project-associated spending on goods and
services will be beneficial during the construction and operation phases. Consequently, this Project
activity is not carried forward for further assessment.
Construction and Operation – Induced Output
Induced output (or revenues) is another indicator of the scale and breadth of the business opportunity
offered by a Project either through its construction or operation. They are based on the economic output
earned by businesses and institutions that would service the household requirements of Project
associated direct and indirect employees.
There is anticipated to be a wide range of enterprises that would earn revenues via the spending of
Project-associated employment income, including retail outlets (especially the grocery store industry),
clothing stores, food establishments, and entertainment venues. Individual households will make their
own decisions as to the businesses that they will patronize. As a Project activity, WLNG procurement
practices will have no effect on household spending of Project-associated direct and indirect employment.
7 This estimate is based on the Project’s direct spending on all goods and services excepting electricity services.

Woodfibre LNG Application for an Environmental Assessment Certificate January 2015
Page 6.3-44
Project associated induced output in BC earned over the 24-month construction phase is expected to be
an estimated $282 million or an annual average of $141 million.8 The location of consumer spending of
wages and salaries connected to the Project will mainly vary according to the permanent residence of
direct and indirect employees. LAA businesses will garner a major share of this household spending
because a large majority of the construction phase workers from BC will reside there. WLNG anticipates
that approximately 60% of the construction phase direct labour demand will be filled from the LAA labour
force. In addition, the LAA communities are expected to experience induced spending effects during the
construction phase because non-resident workers constructing project facilities will spend a portion
of their compensation in the communities where they temporarily reside during their work on the
Project. In the LAA, induced output of $197 million is expected to be generated in various businesses
over the 24-month construction phase, and rooted in household spending of Project associated direct and
indirect employment and labour incomes. The industries that are likely to account for most of the induced
output are finance, insurance and real estate; retail trade; accommodation and food services;
manufacturing; and information and cultural industries.
In the third year of operation, and thereafter on an annual basis, there will be an estimated $64 million of
induced output generated in BC through the Project and $15 million of induced output stimulated within
the LAA.
The Project-related expenditures flowing to businesses located in the LAA communities will be influenced
by their capacity for meeting project goods and services supply requirements and meeting consumer
spending objectives of direct employees and supplier industry (indirect) employees.
Effects on business opportunities in the LAA resulting from the household spending of Project-associated
direct and indirect employment will be beneficial during the construction and operation phases. This
Project activity is not carried forward.
Decommissioning – Change in Goods and Services Contracting Revenues and Induced Output
It is not possible to accurately predict what baseline conditions in the LAA will be 25 years or more in the
future, particularly in terms of goods and services contracting opportunities and induced output (i.e., gross
business revenues generated by household expenditures). With decommissioning and closure, the
Project’s expenditures on goods and services will be limited to the requirements for shutting down
production and dismantling of the LNG facility at the Project site. Although this will entail a much reduced
level of Project-associated spending, it would not result in a reduction of goods and services contracting
opportunities in the LAA being reduced below existing conditions. Compared to existing conditions,
8 Project associated induced output was calculated with WLNG supplied estimates of the Project’s planned expenditures on
direct goods and services and labour compensation for its direct workforce and Statistics Canada industry output multipliers (Statistics Canada 2012).
Woodfibre LNG Application for an Environmental Assessment Certificate January 2015
Page 6.3-45
no adverse effects on goods and services contracting in the LAA are likely to result from the Project
during the decommissioning phase and closure. Also, with decommissioning and closure, all but a few
direct and indirect jobs will remain with the Project, along with their associated household expenditures;
however decommissioning and closure will not result in a reduction of induced output in the LAA below
existing conditions. Compared to existing conditions, no adverse effects on regional economic
development are likely to result from the Project during the decommissioning and closure phase.
Construction and Operation – Change in Availability and Pricing of Goods and Services
Although the Project site is located in Squamish, a smaller community which has a limited pool of goods
and services suppliers, the Project site is proximate to a deep and wide pool of goods and services
suppliers in Metro Vancouver. As the majority of LNG facility equipment is manufactured outside of
Canada, WLNG expects to source the majority of its capital equipment facility from outside of BC, and this
constitutes the largest portion of its construction phase spending. Price pressures that can be seen in
smaller communities of Western Canada that host major industrial construction projects are not
anticipated with this Project because of its proximate location within the large and diverse Metro
Vancouver and overall Lower Mainland economies.
During the operation phase, spending on natural gas feedstock takes up the largest portion of the
Project’s annual goods and services spending. The Project’s natural gas requirements are large within
the context of demand by current industrial facilities in BC, but it is one of the smallest proposed LNG
production facilities in the province and its demand is not expected to have price effects beyond historical
norms for BC natural gas consumers.
Project demand for goods and services will likely have a negligible effect on availability and pricing of
goods and services in the LAA. This activity is therefore not carried forward for further assessment.
Operation – Consistency with Local Economic Development Planning
The Woodfibre Property is designated by the District of Squamish for industry and employment, and was
occupied by the WFP Woodfibre Pulp and Paper Mill, a large-scale industrial facility, until 2006. Under
Squamish’s Official Community Plan, the Woodfibre Property falls within Development Permit Area No. 6
(Squamish Industrial Park and BC Rail Industrial), which was established to provide guidance for the
physical development of a major area to accommodate industrial growth (District of Squamish 2009).
The Project’s general industrial activity is consistent with the District of Squamish’s planning for the site so
no adverse effect is expected in terms of consistency with current local planning. However, District of
Squamish established the Woodfibre LNG Committee, an advisory committee to council in June 2014 to
“…provide input to both District Council and the Project proponents as the proposed project progresses
through its review processes…” (District of Squamish 2012b). The final findings of this advisory body and
Woodfibre LNG Application for an Environmental Assessment Certificate January 2015
Page 6.3-46
Council’s deliberations about them have not occurred: “District of Squamish Council has yet to take a
formal position on the Woodfibre LNG project” (District of Squamish 2014b). Given the consistency of
WLNG’s proposed industrial uses with current District of Squamish zoning and Official Community Plan
designations, the effect of Project activities in construction and operation phases is considered to be
beneficial at this juncture of Project development and not carried forward for further assessment.
6.3.3.2.2.2 Potential Interactions for Commercial Marine Use
The potential effect of the Project associated with the commercial marine use subcomponent is related to
the Project’s effects on use of certain marine areas by tourists.
Construction and Operation – Displacement of Marine-based Tourism Activities
The commercial marine use LAA is used for several activities, including commercial fishing, marine-based
tourism and marine transport. The change in displacement of certain commercial marine use activities
due to the Project would be caused by Project-related vessel traffic, including the ferry that will transport
project workers to the Project site, and by the marine Control Zone (Section 2.2 Description of the
Proposed Project) and, which is part of the Project area. The marine Control Zone is approximately
705 m2, extending between 450 m and 550 m from the shoreline, and will be in place during Project
construction and operation. No commercial fishing, marine-based tourism, or non-Project authorized
transport activity will be allowed within this Control Zone area for safety reasons, and as a condition of BC
Oil and Gas Commission permitting. During the construction phase, it is anticipated that the Project will
generate the following estimated additional vessel traffic within the LAA:
approximately six 500-passenger capacity ferry movements per day between the Project site and
Darrell Bay
approximately 20 water taxi movements per week between the Project site and the government
dock in Squamish
approximately two equipment barge movements per week between the Project site and North
Vancouver
approximately four fuel barge movements per month between the site and North Vancouver
intermittent support vessels in Squamish Harbour
approximately 24 deep-sea vessel movements through Howe Sound over the course of
construction
The start of construction will, however, result in the cessation of the following current vessel traffic:
approximately two crew boat movements per day by WFP for site access
approximately four barge movements per year by WFP for ongoing remediation activities
approximately three movements per week of log booms by tug to Watts Point and four crew boat
movements per day from Watts Point to the Project site
Woodfibre LNG Application for an Environmental Assessment Certificate January 2015
Page 6.3-47
During the minimum 25 years of Project operation, it is anticipated that vessel traffic to the Project by the
worker ferry (capacity of 100 passengers) and water taxi vessel traffic will be similar in volume but
different in composition than during the Project construction phase. The worker ferry service and water
taxis are anticipated to travel from Darrell Bay to the Project site and back during the early stages of
operation, but WLNG plans to investigate potential alternatives to the Darrell Bay ferry terminal within
Squamish Harbour for future operational use. The Project-associated barge movements will become
intermittent during the Project operation phase. In addition, during the operation phase there would be
between six and seven movements per month by LNG carriers, equivalent to a 0.7% increase in large
vessel traffic in Howe Sound. As noted in Section 7.3 Marine Transport, all channels along the LNG
carrier route will meet or exceed Technical Review Process of Marine Terminal Systems and
Transshipment Sites (TERMPOL) guidelines for two-way vessel operation, and no significant effect on
marine navigation is expected.
It is anticipated that the worker ferry and water taxis operating frequently from Darrell Bay and Squamish
will have a greater effect on recreational activities than the deep-sea vessels and LNG carriers that have
a very limited number of movements per month and will not travel north of the Project area into higher-
use areas of the LAA near the Squamish waterfront. As noted above, all channels along the LNG carrier
route will meet or exceed TERMPOL guidelines for two way vessel operation, and no significant effect on
marine navigation for recreational boaters is expected.
As documented in Section 6.3.2.2.2, marine tourism operators (e.g., charters, tours, rentals, kiteboarding
schools) are active within the LAA. As the Project-associated ferries and water taxis will operate
frequently through key use areas, it is anticipated that this will have a greater effect on marine tourism
activities than deep-sea vessels and LNG carriers, which have a very limited number of movements per
month and will not travel past the Project area into higher-use areas of the LAA.
The displacement of marine-based tourism (and recreation) activity by Project-associated vessels will be
intermittent on a daily and seasonal basis. The displacement will be very low for approximately eight
months of the year (October to May) because of the low volume of tourism-related marine activity in the
Squamish Harbour area during that period. Tourism and associated recreation use in the Squamish
Harbour area is relatively high from June through September, and especially high in July and August. The
intermittent aspect on a daily basis arises because the Project-associated vessel traffic will occur at
intervals rather than in a continuous flow. However, due to the nature of the bulk of the tourism and
recreation use being kiteboarding and windsurfing which uses wide swaths of the harbour area, the
Project-related displacement, although intermittent, is anticipated to be acute (in the absence of
mitigation).
Woodfibre LNG Application for an Environmental Assessment Certificate January 2015
Page 6.3-48
The displacement of marine-based tourism activity due to ferry and water taxi vessel traffic travelling to
the Project site from Darrell Bay and Squamish is considered adverse and is carried forward for
further assessment.
Other potential Project-related effects on commercial marine uses are considered to be minor, as
explained in the following paragraphs, and are not carried forward.
Although, the Project Control Zone will prevent tourism activities such as guided kayaking and charters
from traversing within approximately 550 m of the Project, the level of current activity that was identified
for the Control Zone location is very low. Given this level of activity, it will be neither unduly difficult nor
disruptive for current marine users to avoid the Control Zone.
While displacement effects are anticipated for marine tourism activities in the Control Zone and along the
proposed ferry route, they are anticipated to be minor for commercial fishing because of low levels of
commercial fishing activity in the LAA. Of the four commercial fisheries identified in the baseline, only
prawn trapping reported more than three vessels per year in FMA subarea 28-5 consistently between
2008 and 2012, with an average of five to six prawn vessels per year. The Control Zone was identified as
a commercial prawn fishing location in the LAA, as were deeper waters between Watts Point and the
Project area through which LNG carriers would travel. Commercial prawn fishing was also identified as
occurring throughout the RAA. Since commercial prawn fishers can relocate adjacent to the Control Zone
and LNG carrier traffic is infrequent enough to avoid disruption to trap setting and hauling activities, the
displacement effect of the Project on commercial fishing is not carried forward for further assessment.
Indirect effects on commercial fishing could include changes in harvest quantities through effects to
marine life productivity and habitat. This indirect effect on fishing has been assessed in Section 7.4
Land and Resource Use Assessment. As a result, no effects on harvesting quantities for commercial
fishers are identified. Project-related effects on commercial fishing are not anticipated after the Project
decommissioning phase, since all potential effects will cease.
Indirect effects on recreational activities include changes in quality of experience, such as changes to
noise and visual quality. During Project construction, the noise level at Watts Point is projected to
increase by less than 5 dBA during the day (a change of 5 dBA or more is considered perceptible to the
human ear). During Project operation, the expected noise levels at Watts Point will fall to less than 1 dBA,
which will not be perceptible. All effects on noise have been rated negligible. The Project will be visible
from parts of the LAA, but the effect from Watts Point was rated not-significant, which means there will be
no noticeable decline in visual quality from current conditions. However, since recreational activity closer
to the Project site is generally traversing between the site and Watts Point, these changes in quality of
experience are considered minor and therefore not carried forward for further assessment. Details
regarding these environmental settings and relevant mitigation measures are provided within Section 5.4
Atmospheric Sound and Section 7.5 Visual Quality.
Woodfibre LNG Application for an Environmental Assessment Certificate January 2015
Page 6.3-49
Decommissioning – Displacement of Marine-Based Tourism Activities
After the Project’s LNG facilities are dismantled, the Project Control Zone is expected to be eliminated
and Project-associated vessel traffic to the Project site will be significantly curtailed. These changes will
have beneficial effects on commercial marine uses, and this Project activity is not carried forward for a
residual effects assessment.
6.3.3.2.2.3 Potential Interactions for Local Government Finances
Potential interactions for local government finances include Project-associated tax payments that may
affect local government revenues, and direct provision of services to the Project and/or Project-induced
in-migration that may affect local government expenditures.
Construction and Operation – Change in Local Government Tax Revenues and Expenditures
The Project site is within the municipal boundaries of the District of Squamish, which is a member of the
SLRD. The assessed value of the Project’s real property at the Project site will increase as construction
gets underway and facilities are established on the Property. Squamish’s municipal tax rate for Class 4
(major industrial) real property will likely be applied against the Project’s assessed real property value to
determine the Project’s property tax obligations to the District of Squamish. In addition, rates for the
applicable regional district services will be applied to determine the Project’s property tax obligations to
the SLRD. There would also be fee payments, such as for building permits, made to the District
of Squamish.
WLNG estimates property tax and fee payments during the construction phase to be approximately
$1.5 million to $2 million per year. With the start of production in the Project operation phase, the
assessed value of the Project real property will rise and, accordingly, so will the Project’s property tax
payments and associated local government revenues. WLNG anticipates annual property tax and fee
payments to be approximately $3 million for the Project operation phase. The specific amount would be
subject to assessment and District of Squamish tax rate considerations. A $2 million property tax payment
to District of Squamish will represent an approximate 5% increase in this municipality’s annual revenues
(based on its 2014 estimated revenues).
In terms of direct services to the Project, potential local government supply of community infrastructure
and services due to the Project during construction and operation phases is presented in Section 7.2
Infrastructure and Community Services. During the construction and operation phases, the Project’s
potable water, wastewater, and solid waste needs are expected to be met through on-site Project
infrastructure and contracted services. WLNG is expected to lease the Darrell Bay Terminal from BC
Ministry of Transportation and Infrastructure for its worker ferry. WLNG is investigating the acquisition of
additional road and/or parking infrastructure provided by District of Squamish and/or BC Government. If
additional parking infrastructure is required, the cost will be assumed by WLNG and/or a parking provider.
Woodfibre LNG Application for an Environmental Assessment Certificate January 2015
Page 6.3-50
Temporary in-migration during the construction phase is anticipated to be limited as the majority of
construction labour would come from the LAA labour pool (see Section 6.2 Labour Market). As well,
the period over which construction associated temporary in-migration would occur will be limited to the
24-month construction period. No Project provided Squamish area temporary accommodation is planned;
construction workers are expected to reside in their own homes or use existing rental housing and
temporary accommodation.
There is anticipated to be temporary in-migration of approximately 40 persons and potentially their
families for the initial two years of the operation phase. It is anticipated that these persons will relocate to
and reside within in the Squamish area, for reasons of commuting convenience to and from the
Project area.
The increase in property tax payments and fees to District of Squamish and SLRD will have beneficial
effects on local government finances. Incremental outlays by local governments for either direct service to
the Project or in connection with Project associated in-migration of workers are foreseen as nominal.
No direct capital outlays are foreseen. The anticipated effect on local government finances is considered
to be beneficial on a net basis, and this Project activity is not carried forward for a residual
effects assessment.
Decommissioning – Change in Local Government Tax Revenues and Expenditures
After production is stopped at the Project’s LNG facilities and the facility is dismantled, the assessed
value of the Project’s real property and the associated property tax payments to District of
Squamish and Squamish-Lillooet Regional District will sharply fall. Although District of Squamish and
Squamish-Lillooet Regional District of will lose the property tax revenues associated with a producing
LNG facility, shutting production and dismantling of the LNG facility will not result in a reduction of local
government revenues below baseline conditions. Compared to existing baseline conditions, no adverse
effects are predicted on local government finances of the LAA during the decommissioning phase and
therefore this activity is not carried forward for further assessment.
6.3.3.2.3 Proposed Measures to Mitigate Project-related Effects
Mitigation measures are proposed to avoid, minimize, control, restore on-site conditions or offset potential
adverse effects to the economy. Mitigation measures are any practical means taken to manage potential
adverse effects. Measures include applicable standards, guidelines and BMPs. Mitigation measures can
be used alone or in combination to avoid, minimize, or control the potential adverse effects on
sustainable economy. The mitigation identified for sustainable economy is described below and
summarized in Table 6.3-10. For ease of reference, the described mitigation measure has a unique
identification number (unless the measure is being incorporated into the Project design or outlined in
another section of this EA, in which case it is described in the section that follows Table 6.3-10).
Woodfibre LNG Application for an Environmental Assessment Certificate January 2015
Page 6.3-51
As outlined in Section 13.0 Summary of Proposed Environmental and Operation Management Plans
and Follow-up Programs, WLNG will develop and implement a decommissioning plan that is
appropriate for fee simple industrial land. It will be developed in consultation with Aboriginal groups, local
governments and regulatory agencies.
The Squamish Harbour Vessel Traffic Plan identified in Section 7.4 Land and Resource Use, along with
adherence to the recommendations of the TERMPOL studies identified in Section 7.3 Marine Transport,
will help limit the adverse effect carried forward for commercial marine use, i.e., displacement of marine-
based tourism activities. WLNG’s use of the Darrell Bay terminal for the worker ferry helps to minimize
interaction with tourists and recreationists who are using the marine waters of Squamish Harbour and the
head of Howe Sound.
In addition to the measures under these other technical disciplines and as outlined above, the following
mitigation measure will be implemented.
M6.3-1 – Squamish Harbour Vessel Traffic Plan
WLNG will develop and implement strategies, best management practices, and guidelines to avoid or
minimize Project-related disruption of marine-based recreational activities in the Squamish Harbour area
during Project construction and operation. In developing this plan, WLNG will consult with key marine
user groups (e.g., Squamish Terminals, yacht clubs, kiteboard clubs, and kayaking operators) to identify
the routes of all Project-associated marine traffic (e.g., ferries and water taxis) and discuss strategies to
manage the interaction of Project vessel traffic with recreational and tourism areas during the high season
months. Woodfibre LNG Limited’s use of the Darrell Bay terminal for the worker ferry is part of this plan
since this measure will minimize interaction with recreationists and tourists who are using the marine
waters of Squamish Harbour and the head of Howe Sound. This plan will include a procedure for marine
stakeholders to consult with WLNG regarding special events such as yacht races, regattas, and marine-
based festivals to ensure that additional passage planning and scheduling can be reviewed.
Table 6.3-10 summarizes the potential effects, mitigation, and whether detectable residual effects will
remain following mitigation. The rationale for whether residual effects will be detectable following
mitigation is described in the section that follows.
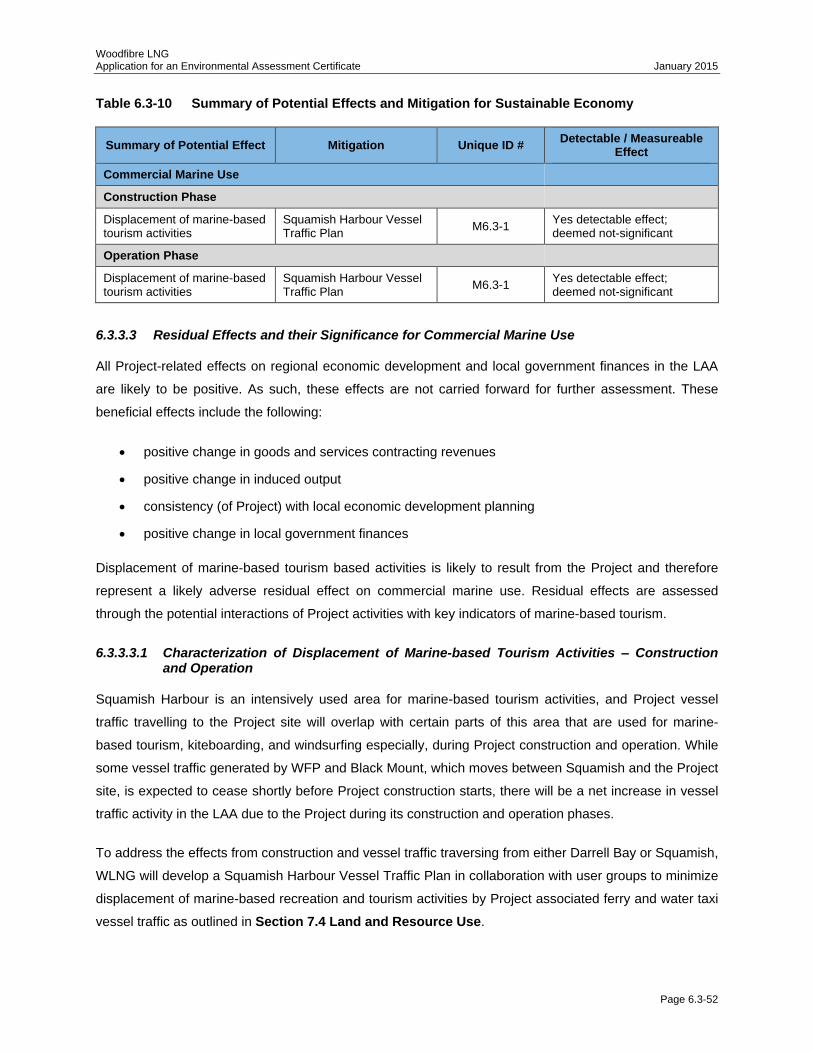
Woodfibre LNG Application for an Environmental Assessment Certificate January 2015
Page 6.3-52
Table 6.3-10 Summary of Potential Effects and Mitigation for Sustainable Economy
Summary of Potential Effect Mitigation Unique ID # Detectable / Measureable
Effect
Commercial Marine Use
Construction Phase
Displacement of marine-based tourism activities
Squamish Harbour Vessel Traffic Plan
M6.3-1 Yes detectable effect; deemed not-significant
Operation Phase
Displacement of marine-based tourism activities
Squamish Harbour Vessel Traffic Plan
M6.3-1 Yes detectable effect; deemed not-significant
6.3.3.3 Residual Effects and their Significance for Commercial Marine Use
All Project-related effects on regional economic development and local government finances in the LAA
are likely to be positive. As such, these effects are not carried forward for further assessment. These
beneficial effects include the following:
positive change in goods and services contracting revenues
positive change in induced output
consistency (of Project) with local economic development planning
positive change in local government finances
Displacement of marine-based tourism based activities is likely to result from the Project and therefore
represent a likely adverse residual effect on commercial marine use. Residual effects are assessed
through the potential interactions of Project activities with key indicators of marine-based tourism.
6.3.3.3.1 Characterization of Displacement of Marine-based Tourism Activities – Construction and Operation
Squamish Harbour is an intensively used area for marine-based tourism activities, and Project vessel
traffic travelling to the Project site will overlap with certain parts of this area that are used for marine-
based tourism, kiteboarding, and windsurfing especially, during Project construction and operation. While
some vessel traffic generated by WFP and Black Mount, which moves between Squamish and the Project
site, is expected to cease shortly before Project construction starts, there will be a net increase in vessel
traffic activity in the LAA due to the Project during its construction and operation phases.
To address the effects from construction and vessel traffic traversing from either Darrell Bay or Squamish,
WLNG will develop a Squamish Harbour Vessel Traffic Plan in collaboration with user groups to minimize
displacement of marine-based recreation and tourism activities by Project associated ferry and water taxi
vessel traffic as outlined in Section 7.4 Land and Resource Use.
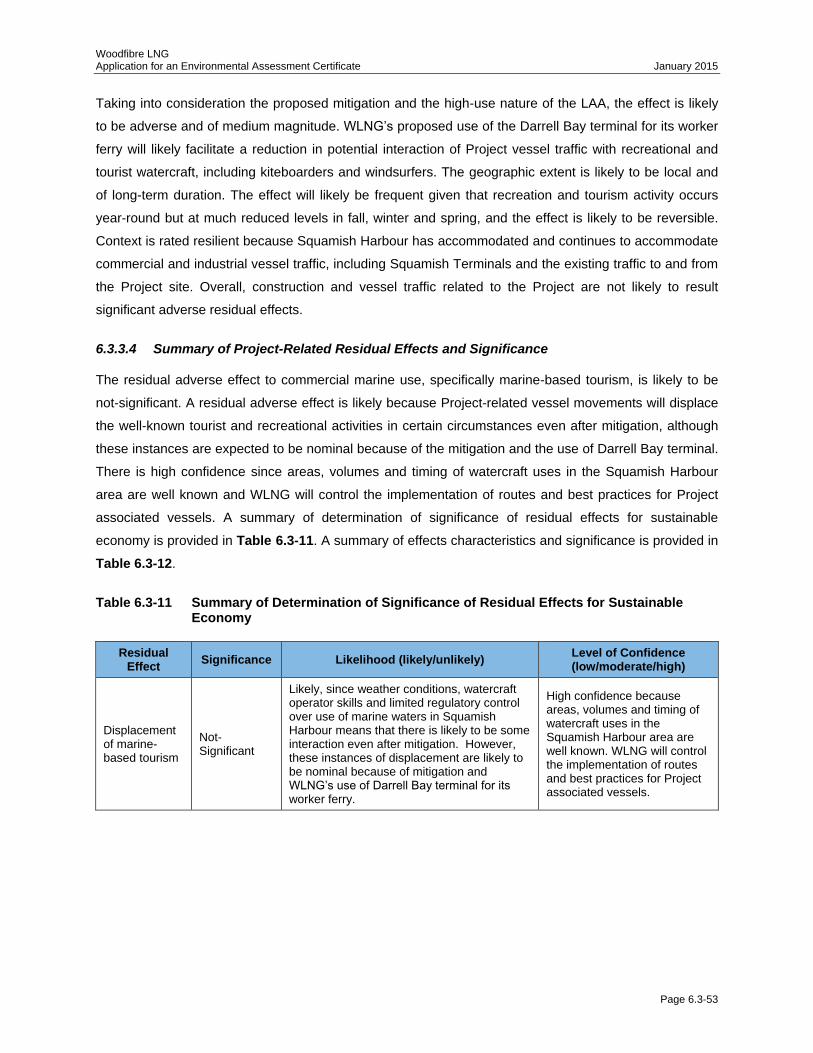
Woodfibre LNG Application for an Environmental Assessment Certificate January 2015
Page 6.3-53
Taking into consideration the proposed mitigation and the high-use nature of the LAA, the effect is likely
to be adverse and of medium magnitude. WLNG’s proposed use of the Darrell Bay terminal for its worker
ferry will likely facilitate a reduction in potential interaction of Project vessel traffic with recreational and
tourist watercraft, including kiteboarders and windsurfers. The geographic extent is likely to be local and
of long-term duration. The effect will likely be frequent given that recreation and tourism activity occurs
year-round but at much reduced levels in fall, winter and spring, and the effect is likely to be reversible.
Context is rated resilient because Squamish Harbour has accommodated and continues to accommodate
commercial and industrial vessel traffic, including Squamish Terminals and the existing traffic to and from
the Project site. Overall, construction and vessel traffic related to the Project are not likely to result
significant adverse residual effects.
6.3.3.4 Summary of Project-Related Residual Effects and Significance
The residual adverse effect to commercial marine use, specifically marine-based tourism, is likely to be
not-significant. A residual adverse effect is likely because Project-related vessel movements will displace
the well-known tourist and recreational activities in certain circumstances even after mitigation, although
these instances are expected to be nominal because of the mitigation and the use of Darrell Bay terminal.
There is high confidence since areas, volumes and timing of watercraft uses in the Squamish Harbour
area are well known and WLNG will control the implementation of routes and best practices for Project
associated vessels. A summary of determination of significance of residual effects for sustainable
economy is provided in Table 6.3-11. A summary of effects characteristics and significance is provided in
Table 6.3-12.
Table 6.3-11 Summary of Determination of Significance of Residual Effects for Sustainable Economy
Residual Effect
Significance Likelihood (likely/unlikely) Level of Confidence (low/moderate/high)
Displacement of marine-based tourism
Not-Significant
Likely, since weather conditions, watercraft operator skills and limited regulatory control over use of marine waters in Squamish Harbour means that there is likely to be some interaction even after mitigation. However, these instances of displacement are likely to be nominal because of mitigation and WLNG’s use of Darrell Bay terminal for its worker ferry.
High confidence because areas, volumes and timing of watercraft uses in the Squamish Harbour area are well known. WLNG will control the implementation of routes and best practices for Project associated vessels.
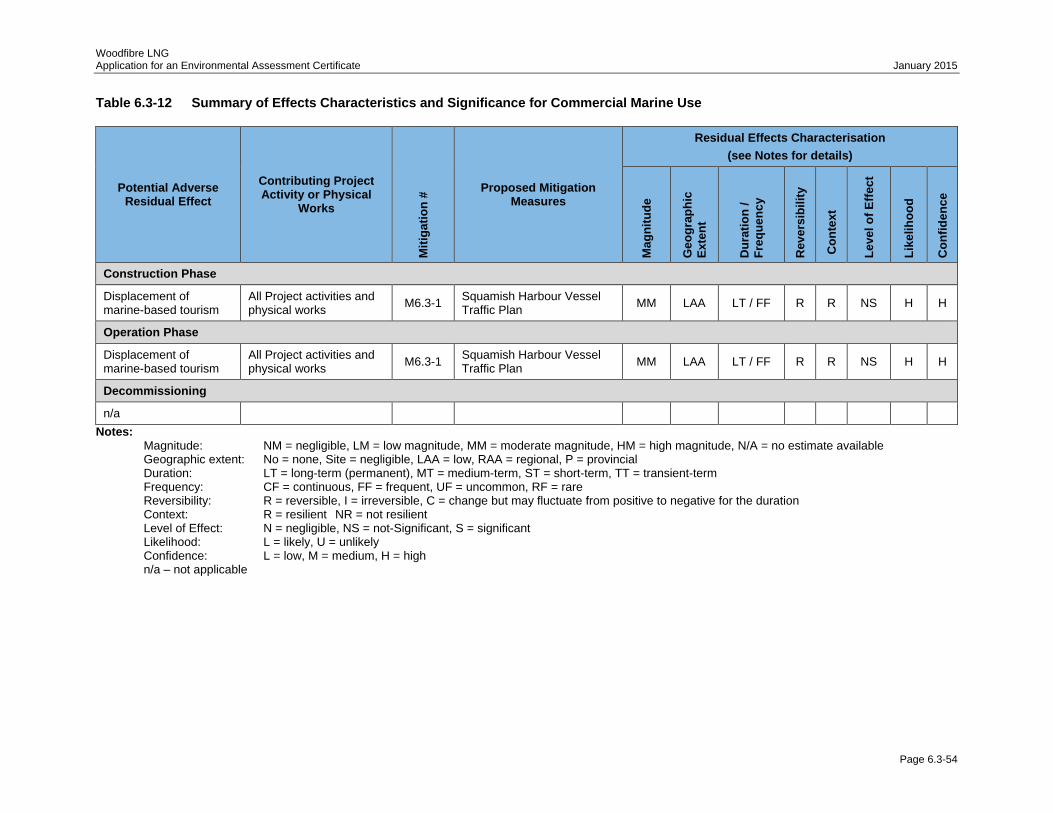
Woodfibre LNG Application for an Environmental Assessment Certificate January 2015
Page 6.3-54
Table 6.3-12 Summary of Effects Characteristics and Significance for Commercial Marine Use
Potential Adverse Residual Effect
Contributing Project Activity or Physical
Works
Mit
igati
on
# Proposed Mitigation
Measures
Residual Effects Characterisation
(see Notes for details)
Mag
nit
ud
e
Geo
gra
ph
ic
Exte
nt
Du
rati
on
/
Fre
qu
en
cy
Rev
ers
ibil
ity
Co
nte
xt
Level
of
Eff
ect
Lik
eli
ho
od
Co
nfi
den
ce
Construction Phase
Displacement of marine-based tourism
All Project activities and physical works
M6.3-1 Squamish Harbour Vessel Traffic Plan
MM LAA LT / FF R R NS H H
Operation Phase
Displacement of marine-based tourism
All Project activities and physical works
M6.3-1 Squamish Harbour Vessel Traffic Plan
MM LAA LT / FF R R NS H H
Decommissioning
n/a
Notes: Magnitude: NM = negligible, LM = low magnitude, MM = moderate magnitude, HM = high magnitude, N/A = no estimate available Geographic extent: No = none, Site = negligible, LAA = low, RAA = regional, P = provincial Duration: LT = long-term (permanent), MT = medium-term, ST = short-term, TT = transient-term Frequency: CF = continuous, FF = frequent, UF = uncommon, RF = rare Reversibility: R = reversible, I = irreversible, C = change but may fluctuate from positive to negative for the duration Context: R = resilient NR = not resilient Level of Effect: N = negligible, NS = not-Significant, S = significant Likelihood: L = likely, U = unlikely Confidence: L = low, M = medium, H = high n/a – not applicable
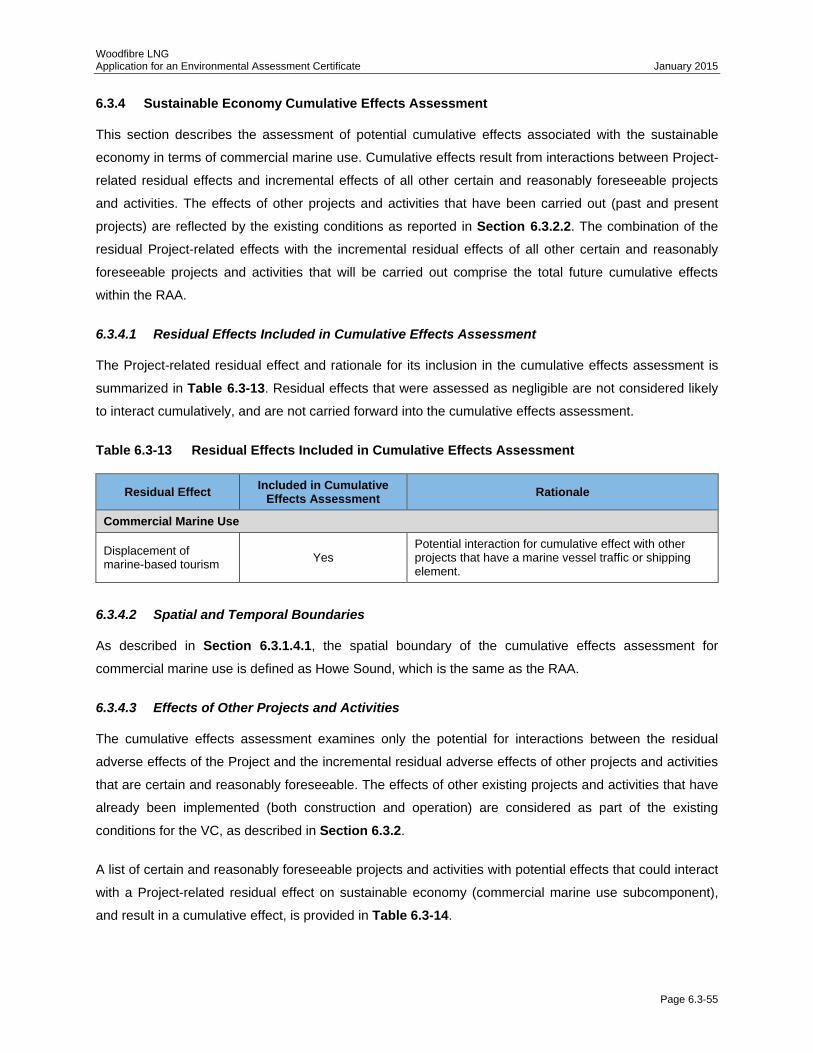
Woodfibre LNG Application for an Environmental Assessment Certificate January 2015
Page 6.3-55
6.3.4 Sustainable Economy Cumulative Effects Assessment
This section describes the assessment of potential cumulative effects associated with the sustainable
economy in terms of commercial marine use. Cumulative effects result from interactions between Project-
related residual effects and incremental effects of all other certain and reasonably foreseeable projects
and activities. The effects of other projects and activities that have been carried out (past and present
projects) are reflected by the existing conditions as reported in Section 6.3.2.2. The combination of the
residual Project-related effects with the incremental residual effects of all other certain and reasonably
foreseeable projects and activities that will be carried out comprise the total future cumulative effects
within the RAA.
6.3.4.1 Residual Effects Included in Cumulative Effects Assessment
The Project-related residual effect and rationale for its inclusion in the cumulative effects assessment is
summarized in Table 6.3-13. Residual effects that were assessed as negligible are not considered likely
to interact cumulatively, and are not carried forward into the cumulative effects assessment.
Table 6.3-13 Residual Effects Included in Cumulative Effects Assessment
Residual Effect Included in Cumulative
Effects Assessment Rationale
Commercial Marine Use
Displacement of marine-based tourism
Yes Potential interaction for cumulative effect with other projects that have a marine vessel traffic or shipping element.
6.3.4.2 Spatial and Temporal Boundaries
As described in Section 6.3.1.4.1, the spatial boundary of the cumulative effects assessment for
commercial marine use is defined as Howe Sound, which is the same as the RAA.
6.3.4.3 Effects of Other Projects and Activities
The cumulative effects assessment examines only the potential for interactions between the residual
adverse effects of the Project and the incremental residual adverse effects of other projects and activities
that are certain and reasonably foreseeable. The effects of other existing projects and activities that have
already been implemented (both construction and operation) are considered as part of the existing
conditions for the VC, as described in Section 6.3.2.
A list of certain and reasonably foreseeable projects and activities with potential effects that could interact
with a Project-related residual effect on sustainable economy (commercial marine use subcomponent),
and result in a cumulative effect, is provided in Table 6.3-14.
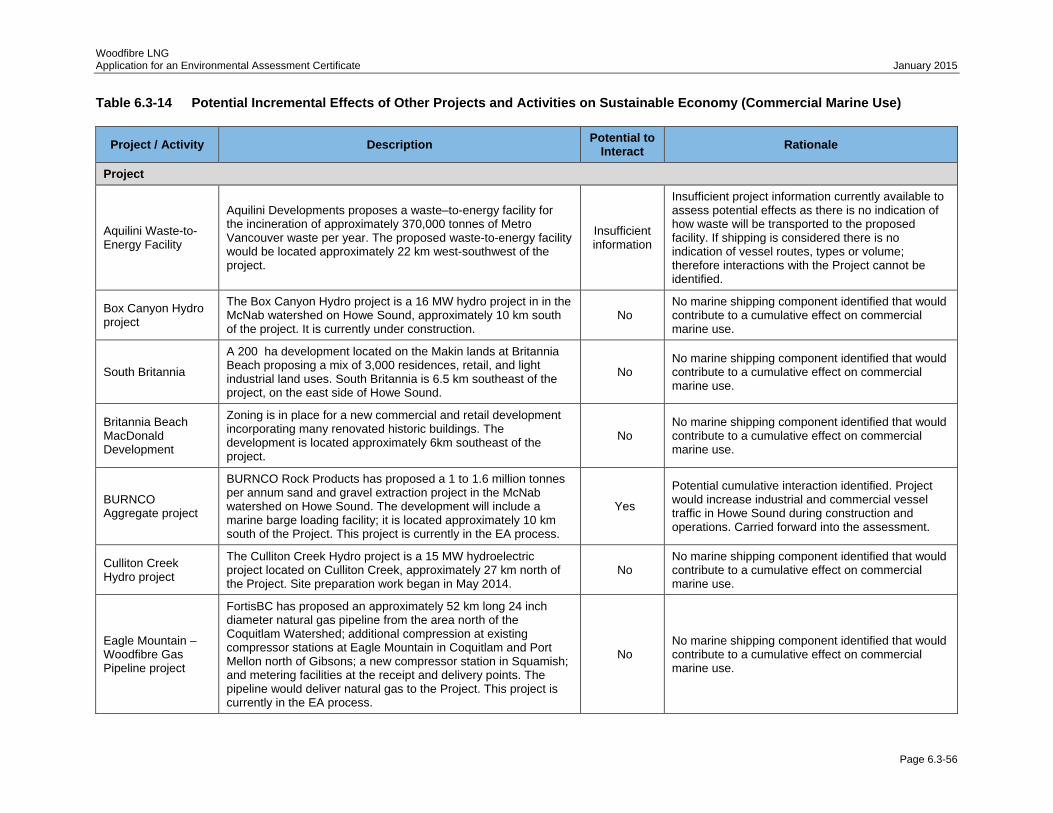
Woodfibre LNG Application for an Environmental Assessment Certificate January 2015
Page 6.3-56
Table 6.3-14 Potential Incremental Effects of Other Projects and Activities on Sustainable Economy (Commercial Marine Use)
Project / Activity Description Potential to
Interact Rationale
Project
Aquilini Waste-to-Energy Facility
Aquilini Developments proposes a waste–to-energy facility for the incineration of approximately 370,000 tonnes of Metro Vancouver waste per year. The proposed waste-to-energy facility would be located approximately 22 km west-southwest of the project.
Insufficient information
Insufficient project information currently available to assess potential effects as there is no indication of how waste will be transported to the proposed facility. If shipping is considered there is no indication of vessel routes, types or volume; therefore interactions with the Project cannot be identified.
Box Canyon Hydro project
The Box Canyon Hydro project is a 16 MW hydro project in in the McNab watershed on Howe Sound, approximately 10 km south of the project. It is currently under construction.
No No marine shipping component identified that would contribute to a cumulative effect on commercial marine use.
South Britannia
A 200 ha development located on the Makin lands at Britannia Beach proposing a mix of 3,000 residences, retail, and light industrial land uses. South Britannia is 6.5 km southeast of the project, on the east side of Howe Sound.
No No marine shipping component identified that would contribute to a cumulative effect on commercial marine use.
Britannia Beach MacDonald Development
Zoning is in place for a new commercial and retail development incorporating many renovated historic buildings. The development is located approximately 6km southeast of the project.
No No marine shipping component identified that would contribute to a cumulative effect on commercial marine use.
BURNCO Aggregate project
BURNCO Rock Products has proposed a 1 to 1.6 million tonnes per annum sand and gravel extraction project in the McNab watershed on Howe Sound. The development will include a marine barge loading facility; it is located approximately 10 km south of the Project. This project is currently in the EA process.
Yes
Potential cumulative interaction identified. Project would increase industrial and commercial vessel traffic in Howe Sound during construction and operations. Carried forward into the assessment.
Culliton Creek Hydro project
The Culliton Creek Hydro project is a 15 MW hydroelectric project located on Culliton Creek, approximately 27 km north of the Project. Site preparation work began in May 2014.
No No marine shipping component identified that would contribute to a cumulative effect on commercial marine use.
Eagle Mountain – Woodfibre Gas Pipeline project
FortisBC has proposed an approximately 52 km long 24 inch diameter natural gas pipeline from the area north of the Coquitlam Watershed; additional compression at existing compressor stations at Eagle Mountain in Coquitlam and Port Mellon north of Gibsons; a new compressor station in Squamish; and metering facilities at the receipt and delivery points. The pipeline would deliver natural gas to the Project. This project is currently in the EA process.
No No marine shipping component identified that would contribute to a cumulative effect on commercial marine use.
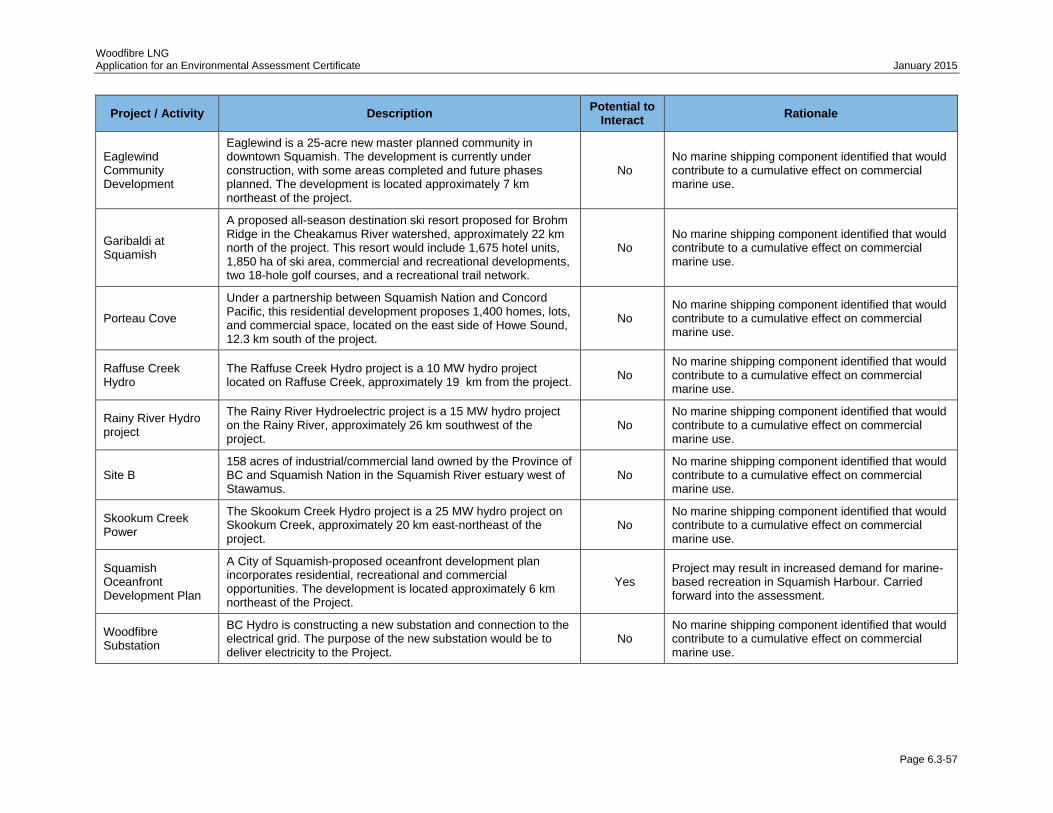
Woodfibre LNG Application for an Environmental Assessment Certificate January 2015
Page 6.3-57
Project / Activity Description Potential to
Interact Rationale
Eaglewind Community Development
Eaglewind is a 25-acre new master planned community in downtown Squamish. The development is currently under construction, with some areas completed and future phases planned. The development is located approximately 7 km northeast of the project.
No No marine shipping component identified that would contribute to a cumulative effect on commercial marine use.
Garibaldi at Squamish
A proposed all-season destination ski resort proposed for Brohm Ridge in the Cheakamus River watershed, approximately 22 km north of the project. This resort would include 1,675 hotel units, 1,850 ha of ski area, commercial and recreational developments, two 18-hole golf courses, and a recreational trail network.
No No marine shipping component identified that would contribute to a cumulative effect on commercial marine use.
Porteau Cove
Under a partnership between Squamish Nation and Concord Pacific, this residential development proposes 1,400 homes, lots, and commercial space, located on the east side of Howe Sound, 12.3 km south of the project.
No No marine shipping component identified that would contribute to a cumulative effect on commercial marine use.
Raffuse Creek Hydro
The Raffuse Creek Hydro project is a 10 MW hydro project located on Raffuse Creek, approximately 19 km from the project.
No No marine shipping component identified that would contribute to a cumulative effect on commercial marine use.
Rainy River Hydro project
The Rainy River Hydroelectric project is a 15 MW hydro project on the Rainy River, approximately 26 km southwest of the project.
No No marine shipping component identified that would contribute to a cumulative effect on commercial marine use.
Site B 158 acres of industrial/commercial land owned by the Province of BC and Squamish Nation in the Squamish River estuary west of Stawamus.
No No marine shipping component identified that would contribute to a cumulative effect on commercial marine use.
Skookum Creek Power
The Skookum Creek Hydro project is a 25 MW hydro project on Skookum Creek, approximately 20 km east-northeast of the project.
No No marine shipping component identified that would contribute to a cumulative effect on commercial marine use.
Squamish Oceanfront Development Plan
A City of Squamish-proposed oceanfront development plan incorporates residential, recreational and commercial opportunities. The development is located approximately 6 km northeast of the Project.
Yes Project may result in increased demand for marine-based recreation in Squamish Harbour. Carried forward into the assessment.
Woodfibre Substation
BC Hydro is constructing a new substation and connection to the electrical grid. The purpose of the new substation would be to deliver electricity to the Project.
No No marine shipping component identified that would contribute to a cumulative effect on commercial marine use.
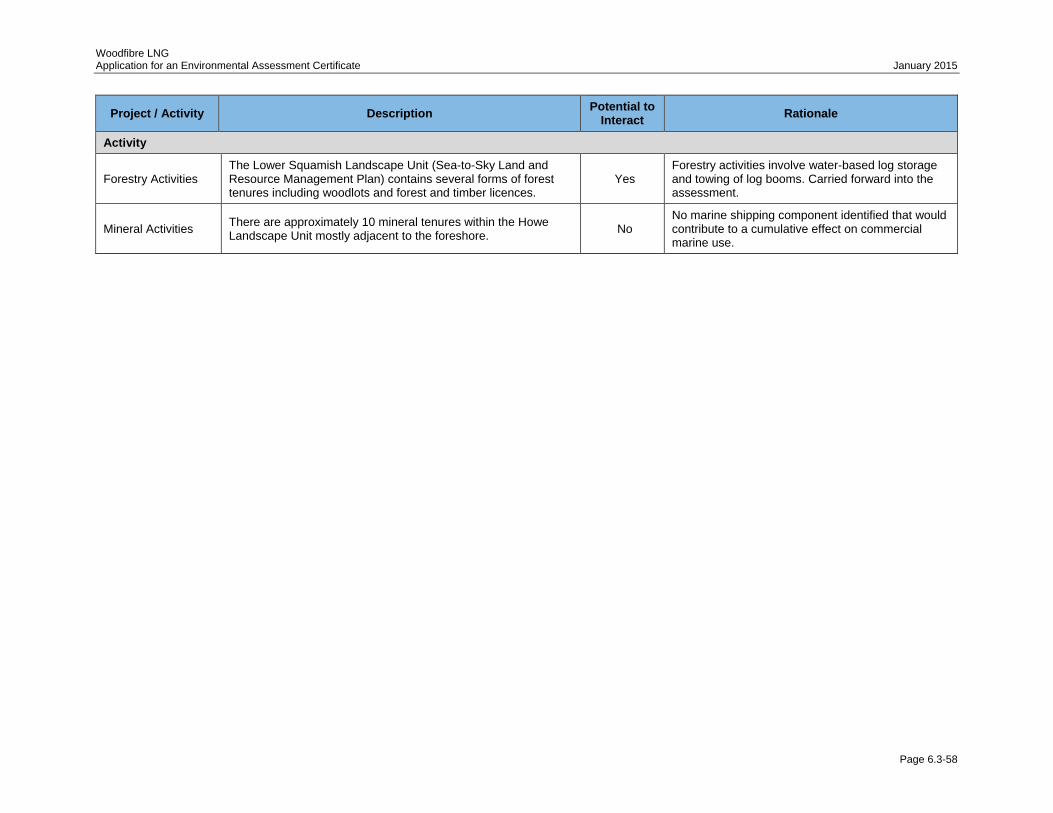
Woodfibre LNG Application for an Environmental Assessment Certificate January 2015
Page 6.3-58
Project / Activity Description Potential to
Interact Rationale
Activity
Forestry Activities The Lower Squamish Landscape Unit (Sea-to-Sky Land and Resource Management Plan) contains several forms of forest tenures including woodlots and forest and timber licences.
Yes Forestry activities involve water-based log storage and towing of log booms. Carried forward into the assessment.
Mineral Activities There are approximately 10 mineral tenures within the Howe Landscape Unit mostly adjacent to the foreshore.
No No marine shipping component identified that would contribute to a cumulative effect on commercial marine use.

Woodfibre LNG Application for an Environmental Assessment Certificate January 2015
Page 6.3-59
6.3.4.4 Potential Interactions with Other Projects
This section identifies the potential interactions between Project-related residual effects and
the incremental effects of other certain and reasonably foreseeable projects and activities, as listed in
Table 6.3-14. The potential for interaction between a Project activity and a Project-related residual effect
that could result in a cumulative adverse effect to sustainable economy (commercial marine use
subcomponent) is summarized in Table 6.3-15. The potential cumulative effects resulting from these
interactions are described in the following sections.
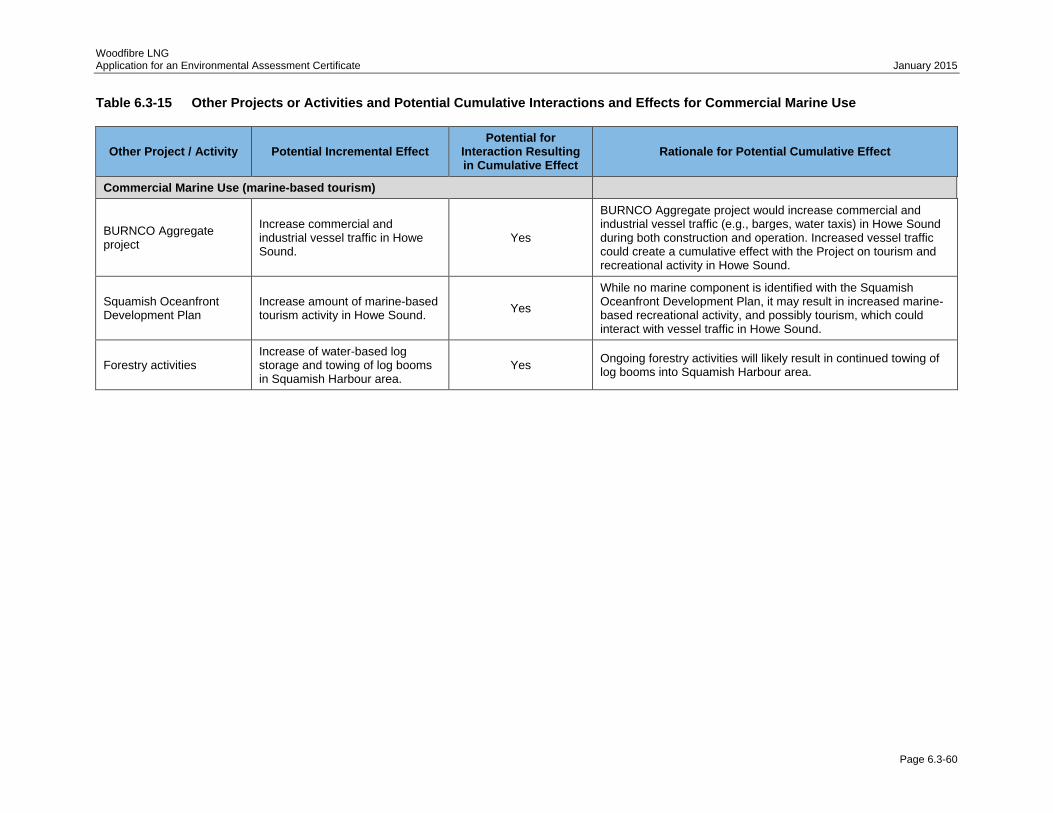
Woodfibre LNG Application for an Environmental Assessment Certificate January 2015
Page 6.3-60
Table 6.3-15 Other Projects or Activities and Potential Cumulative Interactions and Effects for Commercial Marine Use
Other Project / Activity Potential Incremental Effect Potential for
Interaction Resulting in Cumulative Effect
Rationale for Potential Cumulative Effect
Commercial Marine Use (marine-based tourism)
BURNCO Aggregate project
Increase commercial and industrial vessel traffic in Howe Sound.
Yes
BURNCO Aggregate project would increase commercial and industrial vessel traffic (e.g., barges, water taxis) in Howe Sound during both construction and operation. Increased vessel traffic could create a cumulative effect with the Project on tourism and recreational activity in Howe Sound.
Squamish Oceanfront Development Plan
Increase amount of marine-based tourism activity in Howe Sound.
Yes
While no marine component is identified with the Squamish Oceanfront Development Plan, it may result in increased marine-based recreational activity, and possibly tourism, which could interact with vessel traffic in Howe Sound.
Forestry activities Increase of water-based log storage and towing of log booms in Squamish Harbour area.
Yes Ongoing forestry activities will likely result in continued towing of log booms into Squamish Harbour area.
Woodfibre LNG Application for an Environmental Assessment Certificate January 2015
Page 6.3-61
6.3.4.4.1 Potential Interaction and Cumulative Effects to Commercial Marine Use
The BURNCO Aggregate project is the only foreseeable project that would increase commercial and
industrial vessel traffic in Howe Sound during the Project’s construction and operation phases, although
other proposed projects may involve a limited marine component during the construction phase. The
BURNCO Aggregate project is anticipated to generate barge traffic from the McNab Creek area through
either Ramillies Channel or Thornbrough Channel and then through Queen Charlotte Channel.
Given the location of the BURNCO project and its shipping routes, this project is not expected to have an
adverse effect on tourism activity in the LAA. Within Howe Sound, the additional barging traffic from the
BURNCO Aggregate project combined with LNG carrier movements would increase larger vessel traffic
by an estimated 3% per year. However, vessel traffic generated from the BURNCO Aggregate project
and Project-associated vessel traffic will only overlap within Queen Charlotte Channel and with mitigation
as identified in Section 7.3 Marine Transport; no navigational concerns are likely. The BURNCO
Aggregate project will have limited overlap with the Project’s marine activities and together the
two projects are likely to only have a small cumulative effect on the total amount of large vessel traffic in
Howe Sound. Consequently, this cumulative adverse residual effect is likely to be minor and therefore
not significant.
An increase in forestry activity from baseline conditions that involves water-storage of logs in Squamish
Harbour area and towing of log booms to and from the Squamish Harbour area is not foreseen, in part
because of planned development of certain Squamish waterfront lands around Mamquam Blind Channel.
This cumulative adverse residual effect is therefore likely to be negligible.
In August 2014, the Squamish Oceanfront Lands final agreements were signed, which commit Matthews
Southwest and Bethel Lands Corporation) to building the developments of the Oceanfront Sub-Area Plan.
The Purchase and Sale Agreement outlines the terms and conditions required for the land transaction to
occur, and a final transaction completion date of April 2015 is anticipated (Squamish Oceanfront
Development Corporation n.d.). The Squamish Oceanfront Peninsula Sub Area Plan outlines a number of
projects and actions that would foster and increase more marine-based recreation and tourism
opportunities in the Squamish Harbour area over the course of that project’s phased development,
including marinas, docks, boat ramps and launching points. The Squamish Oceanfront Peninsula Sub
Area Plan would be implemented as market conditions justify and as community amenities are funded
(District of Squamish 2012c). The marine-based activity associated with the Squamish Oceanfront Lands
is anticipated to be recreation-focused so its displacement effect on existing recreation activity in the
vicinity of Squamish Harbour is likely to be negligible.
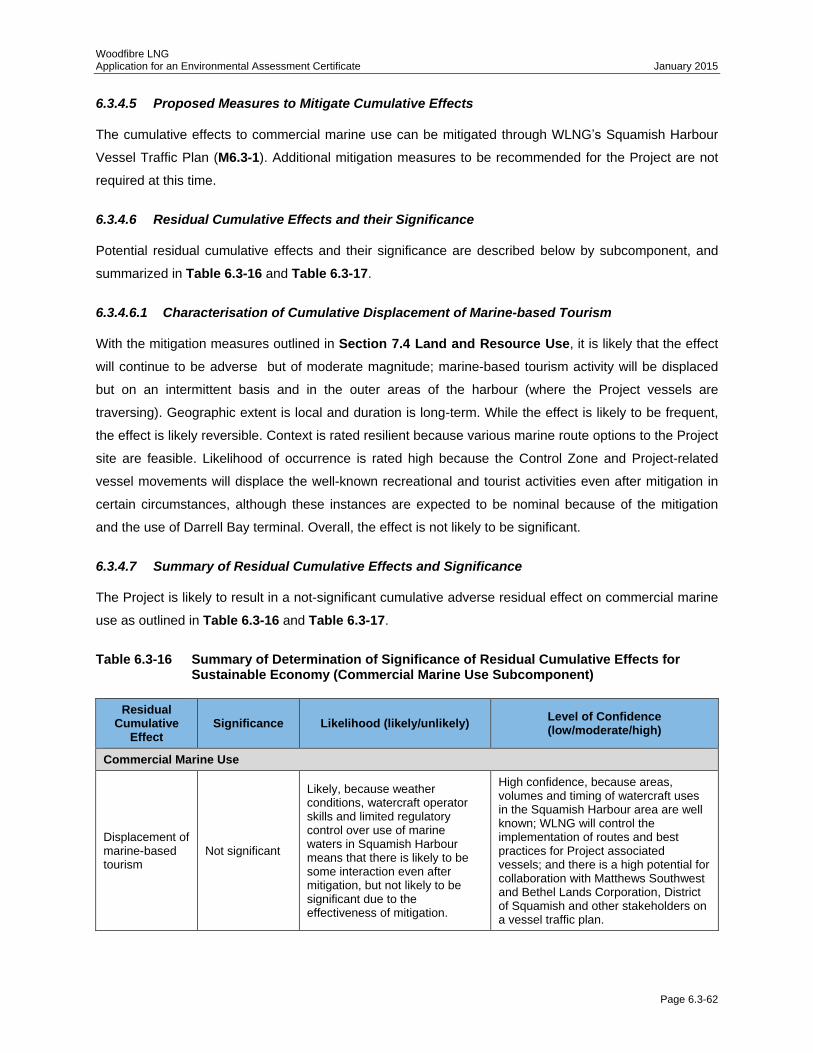
Woodfibre LNG Application for an Environmental Assessment Certificate January 2015
Page 6.3-62
6.3.4.5 Proposed Measures to Mitigate Cumulative Effects
The cumulative effects to commercial marine use can be mitigated through WLNG’s Squamish Harbour
Vessel Traffic Plan (M6.3-1). Additional mitigation measures to be recommended for the Project are not
required at this time.
6.3.4.6 Residual Cumulative Effects and their Significance
Potential residual cumulative effects and their significance are described below by subcomponent, and
summarized in Table 6.3-16 and Table 6.3-17.
6.3.4.6.1 Characterisation of Cumulative Displacement of Marine-based Tourism
With the mitigation measures outlined in Section 7.4 Land and Resource Use, it is likely that the effect
will continue to be adverse but of moderate magnitude; marine-based tourism activity will be displaced
but on an intermittent basis and in the outer areas of the harbour (where the Project vessels are
traversing). Geographic extent is local and duration is long-term. While the effect is likely to be frequent,
the effect is likely reversible. Context is rated resilient because various marine route options to the Project
site are feasible. Likelihood of occurrence is rated high because the Control Zone and Project-related
vessel movements will displace the well-known recreational and tourist activities even after mitigation in
certain circumstances, although these instances are expected to be nominal because of the mitigation
and the use of Darrell Bay terminal. Overall, the effect is not likely to be significant.
6.3.4.7 Summary of Residual Cumulative Effects and Significance
The Project is likely to result in a not-significant cumulative adverse residual effect on commercial marine
use as outlined in Table 6.3-16 and Table 6.3-17.
Table 6.3-16 Summary of Determination of Significance of Residual Cumulative Effects for Sustainable Economy (Commercial Marine Use Subcomponent)
Residual Cumulative
Effect Significance Likelihood (likely/unlikely)
Level of Confidence (low/moderate/high)
Commercial Marine Use
Displacement of marine-based tourism
Not significant
Likely, because weather conditions, watercraft operator skills and limited regulatory control over use of marine waters in Squamish Harbour means that there is likely to be some interaction even after mitigation, but not likely to be significant due to the effectiveness of mitigation.
High confidence, because areas, volumes and timing of watercraft uses in the Squamish Harbour area are well known; WLNG will control the implementation of routes and best practices for Project associated vessels; and there is a high potential for collaboration with Matthews Southwest and Bethel Lands Corporation, District of Squamish and other stakeholders on a vessel traffic plan.
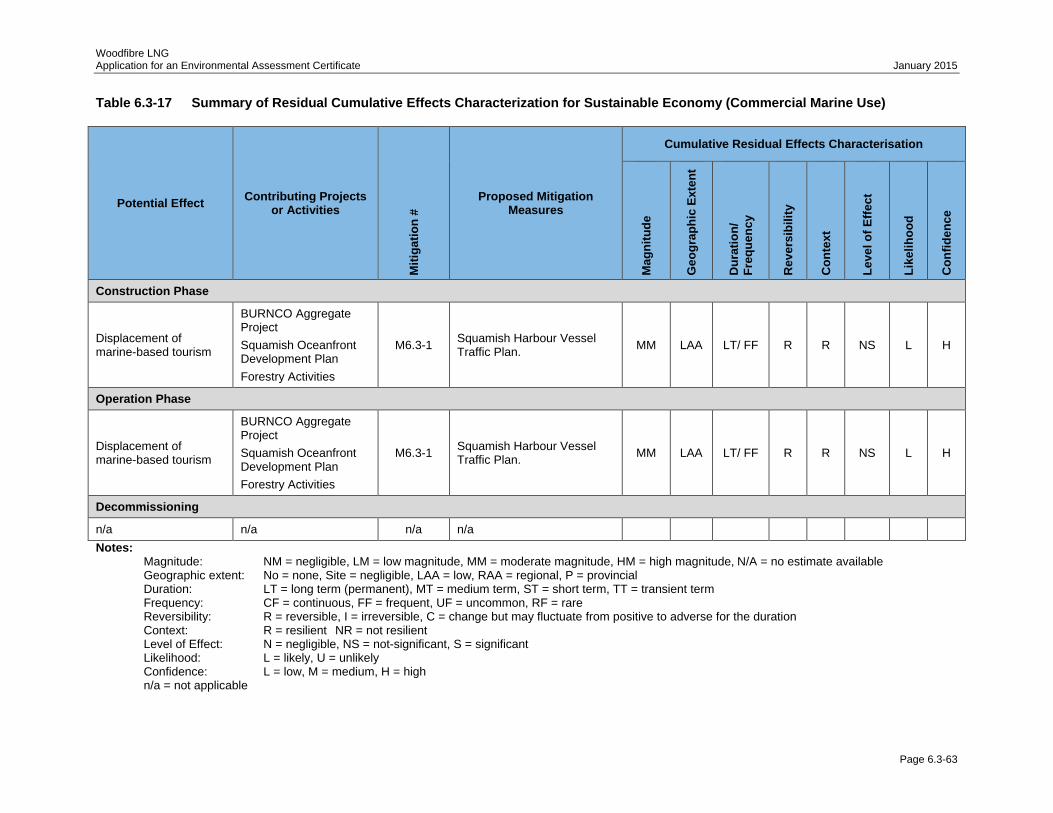
Woodfibre LNG Application for an Environmental Assessment Certificate January 2015
Page 6.3-63
Table 6.3-17 Summary of Residual Cumulative Effects Characterization for Sustainable Economy (Commercial Marine Use)
Potential Effect Contributing Projects
or Activities
Mit
igati
on
#
Proposed Mitigation Measures
Cumulative Residual Effects Characterisation
Mag
nit
ud
e
Geo
gra
ph
ic E
xte
nt
Du
rati
on
/
Fre
qu
en
cy
Rev
ers
ibil
ity
Co
nte
xt
Level
of
Eff
ect
Lik
eli
ho
od
Co
nfi
den
ce
Construction Phase
Displacement of marine-based tourism
BURNCO Aggregate Project
Squamish Oceanfront Development Plan
Forestry Activities
M6.3-1 Squamish Harbour Vessel Traffic Plan.
MM LAA LT/ FF R R NS L H
Operation Phase
Displacement of marine-based tourism
BURNCO Aggregate Project
Squamish Oceanfront Development Plan
Forestry Activities
M6.3-1 Squamish Harbour Vessel Traffic Plan.
MM LAA LT/ FF R R NS L H
Decommissioning
n/a n/a n/a n/a
Notes: Magnitude: NM = negligible, LM = low magnitude, MM = moderate magnitude, HM = high magnitude, N/A = no estimate available Geographic extent: No = none, Site = negligible, LAA = low, RAA = regional, P = provincial Duration: LT = long term (permanent), MT = medium term, ST = short term, TT = transient term Frequency: CF = continuous, FF = frequent, UF = uncommon, RF = rare Reversibility: R = reversible, I = irreversible, C = change but may fluctuate from positive to adverse for the duration Context: R = resilient NR = not resilient Level of Effect: N = negligible, NS = not-significant, S = significant Likelihood: L = likely, U = unlikely Confidence: L = low, M = medium, H = high n/a = not applicable
Woodfibre LNG Application for an Environmental Assessment Certificate January 2015
Page 6.3-64
6.3.5 Summary of Residual Project Effects and Residual Cumulative Effects
This section summarizes the potential residual effects of the Project and potential residual cumulative
effects due to interactions with other certain and reasonably foreseeable projects and activities.
6.3.5.1 Displacement of Marine-Based Tourism
The marine LAA is heavily used for tourism and recreation activities, including kiteboarding, windsurfing,
windsports instruction, guided kayaking, boating and marine charters. Tourism and recreation activities
are particularly concentrated close to Squamish, while much lower activity levels occur in or near the
Project area. It is anticipated that development of the Squamish Oceanfront Lands project will increase
marine-based tourism (and recreational) activity in the LAA as its marine-focused infrastructure is
developed.
To minimize displacement of marine tourism activities caused by overlap with the Project area and Project
related vessel traffic, WLNG will develop a coordinated Squamish Harbour Vessel Traffic Plan (mitigation
measure M6.3-1). Under the plan, WLNG will work with tourism operators, recreation user groups, District
of Squamish, and Matthews Southwest and Bethel Lands Corporation to minimize disruption by Project
associated ferry and water taxi traffic.
A residual cumulative adverse effect is likely, but not likely to be significant because Project-related
vessel movements, and marine activity associated with other foreseeable projects in the RAA, will
intermittently displace tourism- and recreation-based marine activities even after mitigation, albeit at a
nominal level of displacement post-mitigation.
Federal jurisdiction over offshore waters extends from the low water mark to 12 nautical miles along the
outer coastline, and includes management and protection of fish and shellfish habitat, ensuring maritime
safety through the Canadian Coast Guard, and maintaining the public right of navigation.
6.3.6 Monitoring and Follow-up Programs
The Squamish Harbour Vessel Traffic Plan will act as a monitoring and follow-up program as it will allow
concerns by stakeholders (e.g., tourism operators, recreation user groups, District of Squamish) to be
raised and addressed by WLNG.
Woodfibre LNG Application for an Environmental Assessment Certificate January 2015
Page 6.3-65
6.3.7 References
Aerial Kiteboarding School. 2014. Kiteboarding Instruction & Packages in Squamish. Available at:
http://aerialkiteboarding.com/index.php/packages/private-lessons. Accessed July 2014.
Aerial Kiteboarding School and Shop. 2014a. Stand Up Paddleboard Lessons and Rentals with Aerial
Kiteboarding in Vancouver and Squamish, BC, Canada. Available at:
http://squamishkiteboardinglessons.com/index.php/er/sup-rentals. Accessed July 2014.
Aerial Kiteboarding School and Shop. 2014b. Kayak Rental with Squamish Kiteboarding and Aerial
Kiteboarding Vancouver. Available at:
http://squamishkiteboardinglessons.com/index.php/er/kayak-rentals. Accessed July 2014.
Aerial Kiteboarding School and Shop. 2014c. SUP - Stand Up Paddleboard lessons, Stand Up
Paddleboard Rentals with Squamish Kiteboarding, Aerial Kiteboarding School. Available at:
http://squamishkiteboardinglessons.com/index.php/s-u-p. Accessed July 2014.
Aldous, R. 2013. Filming's impact in 2012: $1.5 million. Available at:
http://www.squamishchief.com/news/local-news/filming-s-impact-in-2012-1-5-million-1.1044038.
Accessed July 2014.
All-Terrain Excavating Ltd. 2011. All-Terrain Excavating Ltd. Available at: http://www.allterrainex.com/
Accessed July 2014.
Alpine Café and Catering Co. n.d. Alpine Café and Catering Co. Available at: http://www.alpinecafe.ca/.
Accessed July 2014.
BC Stats. 2013. Business Locations by Employee Size. Available at:
http://www.bcstats.gov.bc.ca/StatisticsBySubject/BusinessIndustry/BusinessCountsEmploymentB
yIndustry.aspx. Accessed May 2014.
Berniaz, K. 2009. Municipal Property Tax in BC: Principles and provincial strategies to shape local tax
distribution policy. Prepared for the Ministry of Community and Rural Development. Available at:
http://dspace.library.uvic.ca:8080/bitstream/handle/1828/1909/berniaz_kate.pdf?sequence=1.
Accessed June, 2014.
Black Tusk Helicopter Inc. n.d. Black Tusk Helicopter Inc. Available at:
http://www.blacktuskhelicopter.com/industryservices/filmservices.html. Accessed July 2014.
Business Squamish. n.d. Knowledge Based Industries. Available at:
http://www.squamish.ca/assets/PDF/4.2.3-Knowledge-Based-Industries.pdf. Accessed July 2014.
Woodfibre LNG Application for an Environmental Assessment Certificate January 2015
Page 6.3-66
Canadian Tire.2014. My Canadian Tire Store. Available at:
http://canadiantire.shoplocal.com/CanadiantireSneakPeek/StoreLocation/Index/?StoreID=240053
8&MapCityStateZip=V8B%200H5. Accessed July 2014.
Cascade Environmental Resources Group Ltd. 2008. Black Tusk Helicopter Inc. Management Plan.
Available at:
http://www.arfd.gov.bc.ca/ApplicationPosting/getfile.jsp?PostID=3138&FileID=5367&action=view.
Accessed July 2014.
Central 1 Credit Union. 2014. Economy Analysis of British Columbia. Volume 3 Issue 1. Available at:
http://www.central1.com/sites/default/files/uploads/files/analysis_report/report_file/ea%202014_0
1%20bc.pdf. Accessed July 2014.
Coast Aggregates. 2012. Services. Available at: http://coastaggregates.com/pages/products-
services/services.php. Accessed July 2014.
Coast River Kayak. 2014. Personal communication with Coast River Kayak and Golder Associates Ltd
July 4 2014.
Context Research Ltd. 2012. Connecting Canada’s Pacific Gateway: Enhancing Planning Capacity in
Metro Vancouver Region. Available at:
http://www.gvgc.org/pdf/APGST%20Final%20Report%20Enhancing%20Planning%20/Capacity.p
df. Accessed May 2014.
Coyne, T. 2013. Massive Squamish Nation Mall may be coming to North Vancouver in 2014. Available at:
http://www.northshoreoutlook.com/news/massive-squamish-nation-mall-may-be-coming-to-north-
vancouver-in-2014-1.909940. Accessed July 2014.
Fisheries and Oceans Canada (DFO). 2011. 2011/12 Prawn and Shrimp by Trap Integrated Fisheries
Management Plan. Available at: http://www.dfo-mpo.gc.ca/Library/343253.pdf. Accessed July
2014.
DFO. 2013a. 2013/14 Shrimp Trawl Integrated Fisheries Management Plan. Available at:
http://www.pac.dfo-mpo.gc.ca/fm-gp/mplans/2013/shrimp_trawl-crevette_chalut-2013-eng.pdf.
Accessed July 2014.
DFO. 2013b. Commercial Fishing Areas, Pacific Region. Available at: http://www.pac.dfo-mpo.gc.ca/fm-
gp/licence-permis/areas-secteurs-eng.html. Accessed July 2014.
DFO. 2014a. Personal communication with DFO and Golder Associates Ltd July 26, 2014.
DFO. 2014b. Commercial Fishing Data. Documents on file. Accessed July 2014.
Woodfibre LNG Application for an Environmental Assessment Certificate January 2015
Page 6.3-67
DFO. 2014c. Integrated Fisheries Management Plan Summary Prawn & Shrimp by Trap. Available at:
http://www.pac.dfo-mpo.gc.ca/fm-gp/mplans/2014/prawnshrimp-trap-crevette-casier-sm-eng.pdf.
Accessed July 2014.
DFO. 2014d. Commercial Fish Slip Data. Documents on file. Accessed July 2014.
DFO. 2014e. Personal communication with DFO and Golder Associates Ltd July 2, 2014.
DFO. 2014f. 2014/15 Prawn and Shrimp by Trap Integrated Fisheries Management Plan Summary.
Available at: http://www.pac.dfo-mpo.gc.ca/fm-gp/mplans/2014/prawnshrimp-trap-crevette-casier-
sm-eng.pdf. Accessed July 2014.
DFO. 2014g. Integrated Fisheries Management Plan Summary Shrimp Trawl. Available at:
http://www.pac.dfo-mpo.gc.ca/fm-gp/mplans/2014/shrimp_trawl-crevette_chalut-sm-2014-
eng.pdf. Accessed July 2014.
DFO. 2014h. 2014 Crab Integrated Fisheries Management Plan. Available at: http://www.pac.dfo-
mpo.gc.ca/fm-gp/mplans/2014/crab-crabe-2014-eng.pdf. Accessed July 2014.
District of Squamish. 2008. District of Squamish 2008 Annual Report. Available at:
http://www.squamish.ca/assets/annual-report-Email-web-version-with-financials-0.pdf. Accessed
May 2014.
District of Squamish. 2009. 2009 Annual Report. Available at: http://www.squamish.ca/assets/annual-
report-Email-web-version-with-financials-0.pdf. Accessed May 2014.
District of Squamish. n.d. Outline for Economic Development Activities: District of Squamish 2011–2015.
Available at: http://www.squamish.ca/assets/PDF/4.2.3-Outline-for-Economic-Development-
Activities-2011-2015.pdf. Accessed November 2014.
District of Squamish. 2011. District of Squamish 2010 Annual Report. Available at:
http://www.squamish.ca/assets/2010-DOS-Annual-Report-web.pdf. Accessed May 2014.
District of Squamish. 2012a. Invest & Grow. Available at: http://squamish.ca/business-and-
development/economic-development/invest-and-grow/. Accessed May 2014.
District of Squamish. 2012b. District of Squamish Consolidated Financial Statements for the year ended
December 31, 2011. Available at: http://squamish.ca/assets/District-of-Squamish-2011-FS.pdf.
Accessed May 2014.
District of Squamish. 2012c. Schedule “B” to Bylaw 2157, 2010 Squamish Oceanfront Peninsula Sub
Area Plan. Available at: http://squamish.ca/assets/Land-Use-Policies/Squamish-Oceanfront-
Peninsula-Sub-Area-Plan-s.pdf. Accessed September 2014.
Woodfibre LNG Application for an Environmental Assessment Certificate January 2015
Page 6.3-68
District of Squamish. 2013a. Development & Building in Squamish. Available at:
http://squamish.ca/assets/Economic-Development/development-and-building-20-24.pdf.
Accessed May 2014.
District of Squamish. 2013b. Film & Events Manager joins District of Squamish. Available at:
http://www.squamish.ca/yourgovernment/news/film-and-events-manager-joins-district-of-
squamish/. Accessed July 2014.
District of Squamish. 2014a. Memorandum of Understanding Signed for the Squamish Oceanfront Lands.
Available at: http://squamish.ca/yourgovernment/news/oceanfront-mou/. Accessed July 2014.
District of Squamish. 2014b. Budget 2014: explained. Available at: http://www.squamish.ca/assets/2014-
budget/2014-budget-insert-for-web3.pdf. Accessed July 2014.
District of Squamish. 2014c. 2014-2018 Financial Plan. Available at:
http://www.squamish.ca/assets/2014-budget/March-12-Public-Meeting-Presentation-2014-2018-
Financial-Plan.pdf. Accessed July 2014.
District of Squamish. 2014d. Film & Event Update. Available at:
https://squamish.civicweb.net/FileStorage/543D51A977A345708109B87645248764-
Council%20Report%20-%20Departmental%20Report%20July%208th%20-%20Fi.pdf. Accessed
July 2014.
District of Squamish. 2014e. Personal communication with District of Squamish and Golder Associates
Ltd July 2014.
District of Squamish. 2014f. Personal communication with District of Squamish and Golder Associates Ltd
July 7, 2014.
District of Squamish. n.d.a. Education. Available at: http://www.squamish.ca/assets/PDF/4.2.3-Education-
Industry.pdf. Accessed July 22, 2014.
District of Squamish. n.d.b. Transportation. Available at: http://www.squamish.ca/assets/PDF/4.2.3-
Transportation-Industry.pdf. Accessed July 2014.
Furry Creek Golf and Country Club. 2014. Furry Creek Golf and Country Club. Available at:
http://www.golfbc.com/courses/furry_creek. Accessed July 2014.
Gambier Island Water Taxi.n.d. Gambier Water Taxi. Available at: http://gambierwatertaxi.com/. Accessed
July 2014.
Woodfibre LNG Application for an Environmental Assessment Certificate January 2015
Page 6.3-69
Government of British Columbia (BC). 2013. British Columbia’s Liquefied Natural Gas Strategy One Year
Update. Available at:
http://www.gov.bc.ca/com/attachments/LNGreport_update2013_web130207.pdf. Accessed July
2014.
Hans Demolition & Excavating Ltd. 2013. Our Services. Available at: http://hansdemo.ca/services.html
Accessed July 2014.
Hedberg and Associates Consulting Ltd. 2008. Our Services. Available at:
http://www.hedbergassociates.com/our-services/forestry/planning.htm. Accessed July 2014.
Home Hardware Stores Ltd. 2014. Squamish Home Hardware. Available at:
http://www.homehardware.ca/en/dealer. Accessed July 2014.
Land and Resources Committee Squamish Nation. 2001. Xay Temíxw Land Use Plan - First Draft.
Available at: http://www.squamish.net/files/PDF/XayFirstDraft.pdf. Accessed August 2013.
Metro Vancouver. 2011. Metro Vancouver 2040 Shaping our Future. Regional Growth Strategy Bylaw No.
1136, 2010. Adopted by the Greater Vancouver Regional District Board on July 29, 2011.
Available at:
http://www.metrovancouver.org/planning/development/strategy/RGSDocs/RGSAdoptedbyGVRD
BoardJuly292011.pdf. Accessed May 2014.
Metro Vancouver. 2014. Regional Economy. Available at:
http://www.metrovancouver.org/services/statistics/Pages/default.aspx. Accessed July 2014.
Ministry of Energy, Mines and Natural Gas. 2014. British Columbia’s Liquefied Natural Gas Strategy: One
year update. Available at:
http://www.gov.bc.ca/com/attachments/LNGreport_update2013_web130207.pdf. Accessed July
2014.
Ministry of Jobs, Tourism and Skills Training. 2013. Major Projects Inventory BC. Available at:
http://www.jtst.gov.bc.ca/ministry/major_projects_inventory/index.htm. Accessed July 2014.
New West Partnership Trade Agreement. 2010. Available from:
http://www.newwestpartnershiptrade.ca/pdf/NewWestPartnershipTradeAgreement.pdf. Accessed
November, 2014.
Pacific Prawn Fishermen’s Association. 2014. Personal communication with Pacific Prawn Fishermen’s
Association and Golder Associates Ltd July 3, 2014.
Parry, J. 2014. Positive Economic Outlook for BC. Cities: Report. Available at:
http://www.bcbusiness.ca/finance/positive-economic-outlook-for-bc-cities-report. Accessed July
2014.
Woodfibre LNG Application for an Environmental Assessment Certificate January 2015
Page 6.3-70
Resort Municipality of Whistler (RMOW). 2007. Whistler 2020: Moving Toward a Sustainable Future.
Available at:
http://www.whistler.ca/sites/default/files/1.3_plans_and_strategies__whistler2020_vision_docume
nt_-_2nd_ed.pdf. Accessed June 2014.
RMOW. 2013a. Economic Development in Whistler. Available at:
http://www.whistler.ca/business/economic-development-whistler. Accessed May 2014.
RMOW. 2013b. Strategies and Plans. Available at: http://www.whistler.ca/municipal-gov/strategies-and-
plans. Accessed May 2014.
RMOW. n.d. Total Estimated Commercial Sector Spending by Consumer Type (Annual). Available at:
http://www.whistler.ca/sites/default/files/related/business/total-spending-for-website.gif. Accessed
May 2014.
Restraint Consulting. 2010. Economic Development Recommendations. Prepared for the District of
Squamish. Available at: http://www.squamish.ca/assets/PDF/4.2.3-Economic-Development-
Recommendations.pdf. Accessed May 2014.
Sea to Sky Gondola. 2014. Personal communication with Sea-to-Sky Gondola and Golder Associates Ltd
July 2, 2014.
Sea-to-Sky Kiteboarding. n.d. Kiteboarding Shop. Available at:
http://www.seatoskykiteboarding.com/#!squamish-kiteboarding-shop-/c1s9t. Accessed July 2014.
Sewell’s Landing Inc. 2014. Personal communication with Sewell’s Landing Inc. and Golder Associates
Ltd July 2, 2014.
Sewell’s Marina. n.d. Guided Group Nature Eco Tours and Vancouver Sightseeing Trips from Sewell’s
Marina. Available at: http://www.sewellsmarina.com/safari.html. Accessed July 2014.
Snetsinger, J. 2011. Rationale for Allowable Annual Cut (AAC) Determination. Available at:
https://www.for.gov.bc.ca/hts/tsa/tsa31/tsr3/31tsra11.pdf. Accessed September 2014.
Squamish Chamber of Commerce. 2012 Squamish Business Directory. Available at:
http://web.squamishchamber.com/search. Accessed July 2014.
Squamish Chamber of Commerce. 2014. Personal communication with Squamish Chamber of
Commerce and Golder Associates Ltd July 2014.
Squamish Harbour Authority. 2014. Personal communication with Squamish Harbour Authority and
Golder Associates Ltd July 10, 2014.
Woodfibre LNG Application for an Environmental Assessment Certificate January 2015
Page 6.3-71
Squamish Kiteboarding School. n.d. Squamish kiteboarding lessons. Available at:
http://www.squamishkiteboardingschool.com/squamish-kiteboarding-lessons.html. Accessed July
2014.
Squamish Marine Services Ltd. 2014. Personal communication with Squamish Marine Services Ltd. and
Golder Associates Ltd July 2, 2014.
Squamish Nation. 2012. Squamish Nation Small Business Directory. Available at:
http://www.squamish.net/wp/wp-content/uploads/2013/03/SN_Small-Business-
Directory2011_042413.pdf. Accessed May 2014.
Squamish Nation. 2013a. Business and Revenue Services. Available at:
http://www.squamish.net/government/departments/intergovernmental-relations/business-and-
revenue-services/. Accessed May 2014.
Squamish Nation. 2013b. Project Negotiation and Development. Available at:
http://www.squamish.net/government/departments/intergovernmental-relations/project-
negotiation-and-development/. Accessed July 2014.
Squamish Nation. 2013c. Xay Temixw (Sacred Land) Land Use Plan. Available at:
http://www.squamish.net/about-us/our-land/xay-temixw-sacred-land-land-use-plan/. Accessed
May 2014.
Squamish Nation. 2014 Squamish Nation. Available at: https://www.facebook.com/SquamishNation/info.
Accessed July 2014.
Squamish Oceanfront Development Corporation. n.d. Final Agreements Signed for the Squamish
Oceanfront Lands. Available at: http://www.squamishoceanfront.com/news/final-agreements-
signed-squamish-oceanfront-lands. Accessed September 2014.
Squamish Terminals Ltd. 2012a. What We Do. Available at: http://www.sqterminals.com/about-us/what-
we-do/. Accessed July 2014.
Squamish Terminals Ltd. 2012b. Berths. Available at: http://www.sqterminals.com/operations-
services/berths/. Accessed July 2014.
Squamish Terminals Ltd. 2014 Squamish Terminals. Available at: http://www.sqterminals.com/wp-
content/uploads/2012/06/SqT-eBrochure-April-2014.pdf. Accessed July 2014.
Squamish Windsports Society. 2014a. Personal communication with Squamish Windsports Society and
Golder Associates Ltd July 4 2014.
Woodfibre LNG Application for an Environmental Assessment Certificate January 2015
Page 6.3-72
Squamish Windsports Society. 2014b. Squamish Windsports Society signs new 5 year lease at the spit.
Available at: http://www.squamishwindsports.com/news/sws-signs-new-5-year-lease-at-the-spit/.
Accessed July 2014.
Squamish-Lillooet Regional District. 2010. Squamish-Lillooet Regional District Regional Growth Strategy.
Bylaw No. 1062, 2008. Available at: http://www.slrd.bc.ca/sites/default/files/pdfs/BL1062.pdf.
Accessed May 2014.
Squamish-Lillooet Regional District. 2012. Financial Statements for the year ended December 31, 2012.
Available at: https://slrd.civicweb.net/Documents/DocumentList.aspx?ID=34633. Accessed May
2014.
Squamish Yacht Club. 2014. Personal communication with Squamish Yacht Club and Golder Associates
Ltd July 2014.
Statistics Canada. 2002a. Squamish, British Columbia. 2001 Community Profiles. Released June 27,
2002. Last modified: 2005-11-30. Statistics Canada Catalogue no. 93F0053XIE. Available at:
http://www12.statcan.ca/english/profil01/CP01/Details/Page.cfm?Lang=E&Geo1=CSD&Code1=5
931006&Geo2=PR&Code2=59&Data=Count&SearchText=squamish&SearchType=Begins&Sear
chPR=59&B1=All&Custom=. Accessed June 2014.
Statistics Canada.2002b. Whistler, British Columbia. 2001 Community Profiles. Released June 27, 2002.
Last modified: 2005-11-30. Statistics Canada Catalogue no. 93F0053XIE. Available at:
http://www12.statcan.ca/english/profil01/CP01/Details/Page.cfm?Lang=E&Geo1=CSD&Code1=5
931020&Geo2=PR&Code2=59&Data=Count&SearchText=whistler&SearchType=Begins&Search
PR=59&B1=All&Custom=. Accessed June 2014.
Statistics Canada. 2002c. Vancouver, British Columbia. 2001 Community Profiles. Released June 27,
2002. Last modified: 2005-11-30. Statistics Canada Catalogue no. 93F0053XIE. Available at:
http://www12.statcan.ca/english/profil01/CP01/Details/Page.cfm?Lang=E&Geo1=CMA&Code1=9
33__&Geo2=PR&Code2=59&Data=Count&SearchText=vancouver&SearchType=Begins&Search
PR=59&B1=All&Custom=. Accessed June 2014.
Statistics Canada. 2002d. Squamish-Lillooet D. 2001 Community Profiles. Released June 27, 2002. Last
modified: 2005-11-30. Statistics Canada Catalogue no. 93F0053XIE. Available at:
http://www12.statcan.ca/english/Profil01/CP01/Details/Page.cfm?Lang=E&Geo1=CSD&Code1=5
931021&Geo2=PR&Code2=59&Data=Count&SearchText=squamish&SearchType=Begins&Sear
chPR=01&B1=All&Custom=. Accessed June 2014.
Statistics Canada. 2007a. Squamish, British Columbia (Code5931006) (table). 2006 Community Profiles.
2006 Census. Statistics Canada Catalogue no. 92-591-XWE. Ottawa. Released March 13, 2007.
Available at: http://www12.statcan.ca/census-recensement/2006/dp-pd/prof/92-
591/index.cfm?Lang=E. Accessed June 2014.
Woodfibre LNG Application for an Environmental Assessment Certificate January 2015
Page 6.3-73
Statistics Canada. 2007b. Whistler, British Columbia (Code5931020) (table). 2006 Community Profiles.
2006 Census. Statistics Canada Catalogue no. 92-591-XWE. Ottawa. Released March 13, 2007.
Available at: http://www12.statcan.ca/census-recensement/2006/dp-pd/prof/92-
591/index.cfm?Lang=E. Accessed June 2014.
Statistics Canada. 2007c. Vancouver, British Columbia (Code933) (table). 2006 Community Profiles.
2006 Census. Statistics Canada Catalogue no. 92-591-XWE. Ottawa. Released March 13, 2007.
Available at: http://www12.statcan.ca/census-recensement/2006/dp-pd/prof/92-
591/index.cfm?Lang=E. Accessed June 2014.
Statistics Canada. 2007d. Squamish-Lillooet D (Code5931021) (table). 2006 Community Profiles. 2006
Census. Statistics Canada Catalogue no. 92-591-XWE. Ottawa. Released March 13, 2007.
Available at: http://www12.statcan.ca/census-recensement/2006/dp-pd/prof/92-
594/index.cfm?Lang=E. Accessed June 2014.
Statistics Canada. 2007e. Squamish, British Columbia (Code630446) (table). Aboriginal Population
Profile. 2006 Census. Statistics Canada Catalogue no. 92-594-XWE. Ottawa. Released January
15, 2008. Available at: http://www12.statcan.ca/census-recensement/2006/dp-pd/prof/92-
594/index.cfm?Lang=E. Accessed June 2014.
Statistics Canada. 2012. National Input-Output Tables. Statistics Canada Catalogue no. 15F0041XDB.
Released November 19, 2012. Available at: http://www5.statcan.gc.ca/bsolc/olc-cel/olc-
cel?lang=eng&catno=15F0041X. Accessed June 2014.
Statistics Canada. 2013a. Squamish, DM, British Columbia (Code 5931006) (table). National Household
Survey (NHS) Profile. 2011 Census. Statistics Canada Catalogue no. 99-004-XWE. Ottawa.
Released June 26, 2013. Available at: http://www12.statcan.gc.ca/nhs-enm/2011/dp-
pd/prof/index.cfm?Lang=E. Accessed June 2014.
Statistics Canada. 2013b. Whistler, DM, British Columbia (Code 5931020) (table). National Household
Survey (NHS) Profile. 2011 Census. Statistics Canada Catalogue no. 99-004-XWE. Ottawa.
Released June 26, 2013. Available at: http://www12.statcan.gc.ca/nhs-enm/2011/dp-
pd/prof/index.cfm?Lang=E. Accessed June 2014.
Statistics Canada. 2013c. Vancouver, CMA, British Columbia (Code 933) (table). National Household
Survey (NHS) Profile. 2011 Census. Statistics Canada Catalogue no. 99-004-XWE. Ottawa.
Released June 26, 2013. Available at: http://www12.statcan.gc.ca/nhs-enm/2011/dp-
pd/prof/index.cfm?Lang=E. Accessed June 2014.
Statistics Canada. 2013d British Columbia (Code 59) (table). National Household Survey (NHS) Profile.
2011 Census. Statistics Canada Catalogue no. 99-004-XWE. Ottawa. Released June 26, 2013.
Available at: http://www12.statcan.gc.ca/nhs-enm/2011/dp-pd/prof/index.cfm?Lang=E. Accessed
June 2014.
Woodfibre LNG Application for an Environmental Assessment Certificate January 2015
Page 6.3-74
Statistics Canada. 2013e. Squamish, Indian band area, British Columbia (Code 630555) (table). National
Household Survey (NHS) Aboriginal Population Profile. 2011 National Household Survey.
Statistics Canada Catalogue no. 99-011-X2011007. Ottawa. Released November 13, 2013.
Available at: http://www12.statcan.gc.ca/nhs-enm/2011/dp-pd/aprof/index.cfm?Lang=E.
Accessed June 2014.
Sunshine Kayaking. 2014. Personal communication with representative of Sunshine Kayaking and Golder
Associates Ltd. July 2, 2014.
Tourism Squamish. 2013. Tourism Squamish Strategic Plan 2014 - 2016. Available at:
http://www.tourismsquamish.com/files/tourismsquamishstrategicplan2014-16.pdf. Accessed July
2014.
Tourism Squamish. n.d. Tourism Industry. Available at: http://www.squamish.ca/assets/PDF/4.2.3-
Tourism-Industry.pdf. Accessed July 2014.
Tourism Whistler. 2014a. Whistler Statistics & Research. Available at: http://events.whistler.com/about-
whistler/statistics-and-research/. Accessed May 2014.
Tourism Whistler. 2014b Business Directory. Available at: http://www.whistler.com/business-directory/.
Accessed May 2014.
Tourism Whistle. 2014c. Local Caterers. Available at:
http://meetings.whistler.com/plan/celebrate/caterers/. Accessed July 2014.
Vancouver Economic Commission. 2014a. Think Vancouver. Available at:
http://www.vancouvereconomic.com/. Accessed July 2014.
Vancouver Economic Commission. 2014b. Key Sectors. Available at:
http://www.vancouvereconomic.com/. Accessed July 2014.
Vancouver Kiteboarding School. n.d. Kiteboarding School in Squamish. Available at:
http://www.vancouverkiteboardingschool.com/Kiteboarding/about/. Accessed July 2014.
Western Forest Products Inc. 2014. Personal communication with Western Forest Products Inc. and
Golder Associates Ltd July 4, 2014.
Westward Sales Ltd. n.d. Overview. Available at: http://www.westwardsales.ca/en/. Accessed July 2014.
Whistler Centre for Sustainability (WCS) & Resort Municipality of Whistler (RMOW). 2011a. Ensuring
Economic Viability. Available at: http://www.whistler2020.ca/priority/ensuring_economic_viability.
Accessed May 2014.
Woodfibre LNG Application for an Environmental Assessment Certificate January 2015
Page 6.3-75
WCS & RMOW. 2011b. 2012 Visitor Number. Available at:
http://www.whistler2020.ca/Indicators/2012/Visitor_Number. Accessed July 2014.
WCS & RMOW. 2011c. What is Whistler 2020. Available at:
http://www.whistler2020.ca/About/what_is_whistler_2020. Accessed May 2014.
Whistler Chamber of Commerce. 2014. Personal communication with Whistler Chamber of Commerce
and Golder Associates Ltd July 8, 2014.
Whistler Chamber of Commerce. n.d. Directory Listings. Available at:
https://www.whistlerchamber.com/component/option,com_dirlistings/Itemid,240/. Accessed July
2014.
Wildwood Restaurant Group. 2006. Wild Wood Catering Company. Available at:
http://www.wildwoodrestaurants.ca/htm/catering.html. Accessed July 2014.
Yellow Pages. 2014a Squamish Valley Gas Bar. Available at: http://www.yellowpages.ca/bus/British-
Columbia/Squamish/Squamish-Valley-Gas-Bar/6617682.html. Accessed July 2014.
Yellow Pages. 2014b. Squamish Petro Canada. Available at: http://www.yellowpages.ca/bus/British-
Columbia/Squamish/Petro-Canada/6247000.html. Accessed July 2014.
Yellow Pages. 2014c. Callaghan Concrete Products Ltd. Available at:
http://www.yellowpages.ca/bus/British-Columbia/Whistler/Callaghan-Concrete-Products-
Ltd/8225204.html. Accessed July 2014.
Related Documents