NOX EMISSION REDUCTION BY OSCILLATING COMBUSTION FINAL REPORT (September 1996 to December 2003) Prepared by John C. Wagner Gas Technology Institute 1700 S. Mount Prospect Rd. Des Plaines, IL 60018 GTI Project No. 61111 For U.S. Department of Energy Contract No. DE-FC36-96EE41260 March 2004

Welcome message from author
This document is posted to help you gain knowledge. Please leave a comment to let me know what you think about it! Share it to your friends and learn new things together.
Transcript
NOX EMISSION REDUCTION BY OSCILLATING COMBUSTION
FINAL REPORT (September 1996 to December 2003)
Prepared by John C. Wagner
Gas Technology Institute 1700 S. Mount Prospect Rd.
Des Plaines, IL 60018
GTI Project No. 61111
For U.S. Department of Energy
Contract No. DE-FC36-96EE41260
March 2004

LEGAL NOTICE This report was prepared by Gas Technology Institute (GTI) as an account of work sponsored by Gas Research Institute (GRI). Neither GRI, GTI, members of GRI or GTI, nor any person acting on behalf of either:
a. MAKES ANY WARRANTY OR REPRESENTATION, EXPRESS OR IMPLIED WITH RESPECT TO THE ACCURACY, COMPLETENESS, OR USEFULNESS OF THE INFORMATION CONTAINED IN THIS REPORT, OR THAT THE USE OF ANY INFORMATION, APPARATUS, METHOD, OR PROCESS DISCLOSED IN THIS REPORT MAY NOT INFRINGE PRIVATELY OWNED RIGHTS, OR b. ASSUMES ANY LIABILITY WITH RESPECT TO THE USE OF, OR FOR ANY AND ALL DAMAGES RESULTING FROM THE USE OF, ANY INFORMATION, APPARATUS, METHOD, OR PROCESS DISCLOSED IN THIS REPORT.
References to trade names or specific commercial products, commodities, or services in this report does not represent or constitute an endorsement, recommendation, or favoring by GRI or its contractors of the specific commercial product, commodity, or service.
(61111 final report.doc) iii
EXECUTIVE SUMMARY
High-temperature, natural gas-fired furnaces, especially those fired with preheated air, produce
large quantities of NOx per ton of material processed. Regulations on emissions from industrial furnaces
are becoming increasingly more stringent. In addition, competition is forcing operators to make their
furnaces more productive and/or efficient. Switching from preheated air to industrial oxygen can increase
efficiency and reduce NOx, but oxygen is significantly more costly than air and may not be compatible
with the material being heated. What was needed, and what was developed during this project, is a
technology that reduces NOx emissions while increasing furnace efficiency for both air- and oxy-fired
furnaces.
Oscillating combustion is a retrofit technology that involves the forced oscillation of the fuel flow
rate to a furnace. These oscillations create successive, fuel-rich and fuel-lean zones within the furnace.
Heat transfer from the flame to the load increases due to the more luminous fuel-rich zones, a longer
overall flame length, and the breakup of the thermal boundary layer. The increased heat transfer shortens
heat up times, thereby increasing furnace productivity, and reduces the heat going up the stack, thereby
increasing efficiency. The fuel-rich and fuel-lean zones also produce substantially less NOx than firing at
a constant excess air level. The longer flames and higher heat transfer rate reduces overall peak flame
temperature and thus reduces additional NOx formation from the eventual mixing of the zones and
burnout of combustibles from the rich zones.
This project involved the development of hardware to implement oscillating combustion on an
industrial scale, the laboratory testing of oscillating combustion on various types of industrial burners,
and the field testing of oscillating combustion on several types of industrial furnace. Before laboratory
testing began, a market study was conducted, based on the attributes of oscillating combustion and on the
results of an earlier project at GTI and Air Liquide, to determine which applications for oscillating
combustion would show the greatest probability for technical success and greatest probability for market
acceptability. The market study indicated that furnaces in the steel, glass, and metal melting industries
would perform well in both categories. These findings guided the selection of burners for laboratory
testing and, with the results of the laboratory testing, guided the selection of field test sites.
Laboratory testing showed that oscillating combustion can produce substantial increases in heat
transfer and reductions in NOx emissions on many types of industrial burners. Heat transfer increases of
up to 13% and NOx reductions of 31% to 67% were recorded. The highest levels of NOx emissions
reduction were achieved with burners that use a nozzle-mixing approach and/or preheated or oxygen-
enriched combustion air, while the highest levels of heat transfer increase were achieved with burners
using ambient air, though the heat transfer increase was still significant (up to 6%) with burners using

(61111 final report.doc) iv
preheated combustion. Oscillating combustion was not found suitable for burners using staging or high-
momentum approaches. The large amount of NOx emissions reduction achieved when the combustion air
was enriched with oxygen suggest that a combined retrofit of oscillating combustion and oxygen
enrichment would offer the increased furnace efficiency inherent with oxygen enrichment without the
increase in NOx emissions associated with oxygen enrichment alone.
Field testing showed that oscillating combustion can produce substantial increases in furnace
efficiency and reductions in NOx emissions on many types of industrial furnaces using conventional
burners. Field tests included a ladle preheater, a forging furnace, an annealing furnace, a glass melter, and
a reheat furnace. Efficiency gains of up to 5% and NOx reductions of 28% to 55% were recorded.
Greater NOx reductions were achieved for higher temperature furnaces using low excess air levels. No
impacts on general furnace operation were observed with properly selected oscillation parameters. No
elevation in noise levels, no loss of flame sensing signal, and no adverse impacts on product quality were
observed. In some cases, a tertiary benefit, such as reduced furnace crown temperature, lower oxygen
usage, or improved temperature uniformity, was recorded. These have been attributed to the change in
flame shape (i.e., longer flames). Two of the furnaces that were field tested were put into continuous
operation with oscillating combustion at the conclusion of the field testing. One of these operated with
oscillating combustion for over three years. The other continues to operate with oscillating combustion.
Modeling showed that oscillating flames have a lower peak temperature and a longer length than
non-oscillating flames, which supports the results achieved during laboratory testing and field testing.
The valves and controllers used to implement oscillating combustion were sufficiently developed
to be applied for long-term (three to four years) operation on industrial furnaces. Two types of valves
were developed; one for small- to medium-sized burners (0.2 MMBtu/h to 6.8 MMBtu/h), and one for
medium- to large-sized burners (5 MMBtu/h to 25 MMBtu/h). With minor modifications to the gas
supply systems on furnaces, and no modifications to the burners or furnaces themselves, the oscillating
combustion system was found able to be installed with minimal downtime and with transparency to
normal furnace operation.
Oscillating combustion should have a wide applicability to increase efficiency and reduce NOx
emissions for steel, glass, petrochemical, aluminum, cement, and metal heating furnaces.
(61111 final report.doc) v
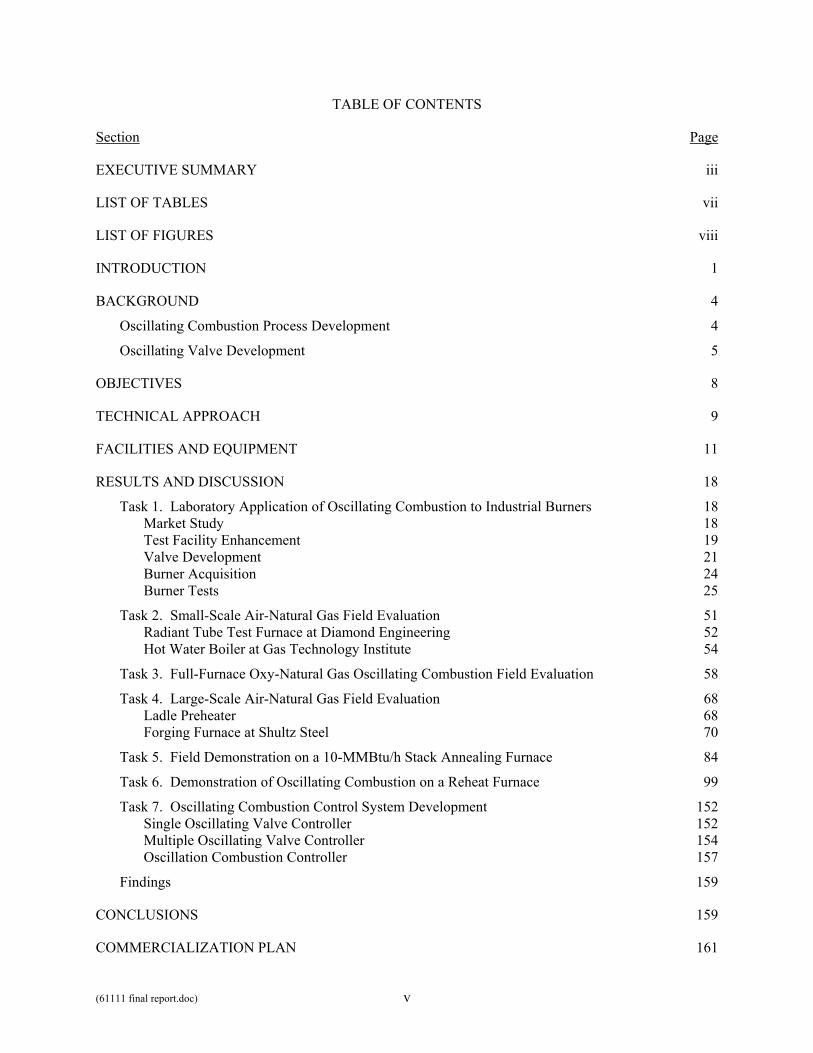
TABLE OF CONTENTS
Section Page
EXECUTIVE SUMMARY iii
LIST OF TABLES vii
LIST OF FIGURES viii
INTRODUCTION 1
BACKGROUND 4
Oscillating Combustion Process Development 4
Oscillating Valve Development 5
OBJECTIVES 8
TECHNICAL APPROACH 9
FACILITIES AND EQUIPMENT 11
RESULTS AND DISCUSSION 18
Task 1. Laboratory Application of Oscillating Combustion to Industrial Burners 18 Market Study 18 Test Facility Enhancement 19 Valve Development 21 Burner Acquisition 24 Burner Tests 25
Task 2. Small-Scale Air-Natural Gas Field Evaluation 51 Radiant Tube Test Furnace at Diamond Engineering 52 Hot Water Boiler at Gas Technology Institute 54
Task 3. Full-Furnace Oxy-Natural Gas Oscillating Combustion Field Evaluation 58
Task 4. Large-Scale Air-Natural Gas Field Evaluation 68 Ladle Preheater 68 Forging Furnace at Shultz Steel 70
Task 5. Field Demonstration on a 10-MMBtu/h Stack Annealing Furnace 84
Task 6. Demonstration of Oscillating Combustion on a Reheat Furnace 99
Task 7. Oscillating Combustion Control System Development 152 Single Oscillating Valve Controller 152 Multiple Oscillating Valve Controller 154 Oscillation Combustion Controller 157
Findings 159
CONCLUSIONS 159
COMMERCIALIZATION PLAN 161
(61111 final report.doc) vi
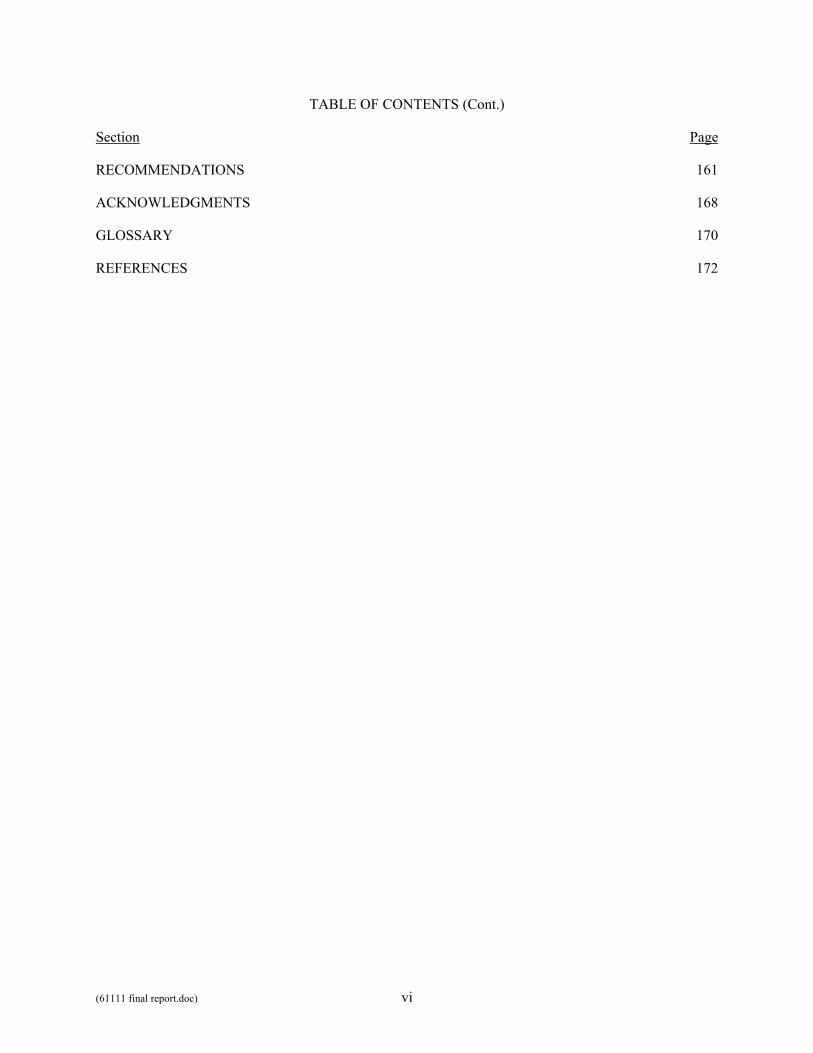
TABLE OF CONTENTS (Cont.)
Section Page
RECOMMENDATIONS 161
ACKNOWLEDGMENTS 168
GLOSSARY 170
REFERENCES 172
(61111 final report.doc) vii
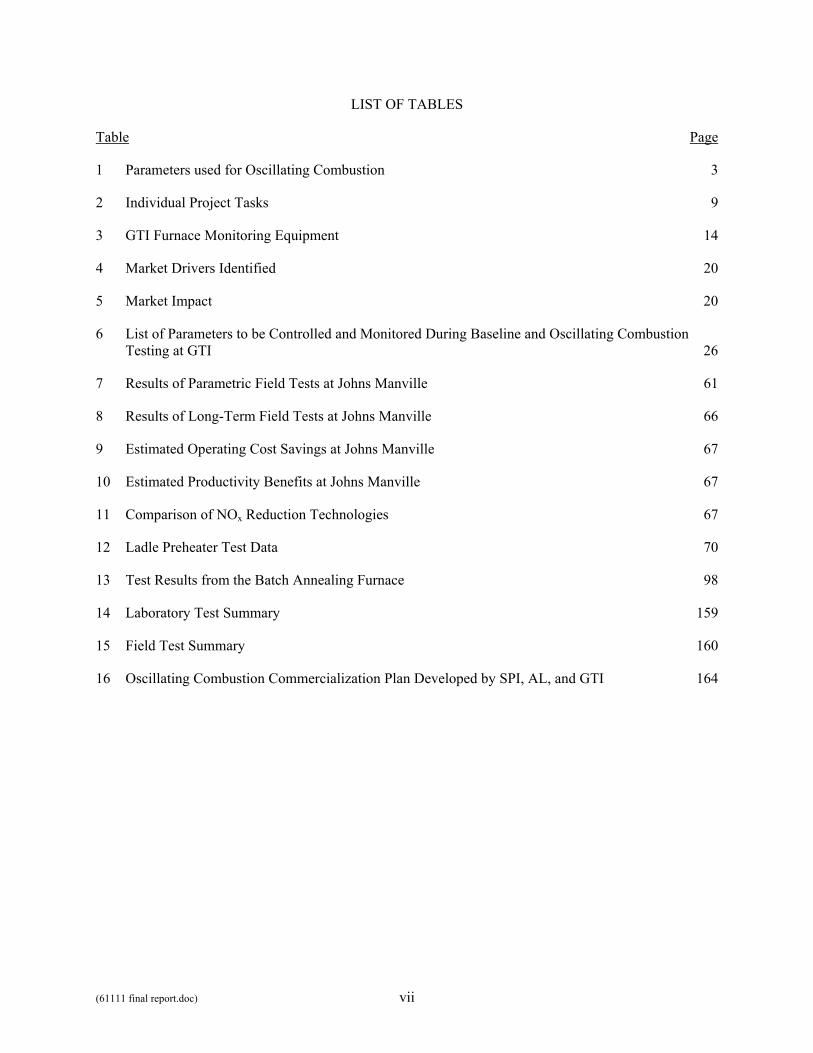
LIST OF TABLES
Table Page
1 Parameters used for Oscillating Combustion 3
2 Individual Project Tasks 9
3 GTI Furnace Monitoring Equipment 14
4 Market Drivers Identified 20
5 Market Impact 20
6 List of Parameters to be Controlled and Monitored During Baseline and Oscillating Combustion Testing at GTI 26
7 Results of Parametric Field Tests at Johns Manville 61
8 Results of Long-Term Field Tests at Johns Manville 66
9 Estimated Operating Cost Savings at Johns Manville 67
10 Estimated Productivity Benefits at Johns Manville 67
11 Comparison of NOx Reduction Technologies 67
12 Ladle Preheater Test Data 70
13 Test Results from the Batch Annealing Furnace 98
14 Laboratory Test Summary 159
15 Field Test Summary 160
16 Oscillating Combustion Commercialization Plan Developed by SPI, AL, and GTI 164
(61111 final report.doc) viii
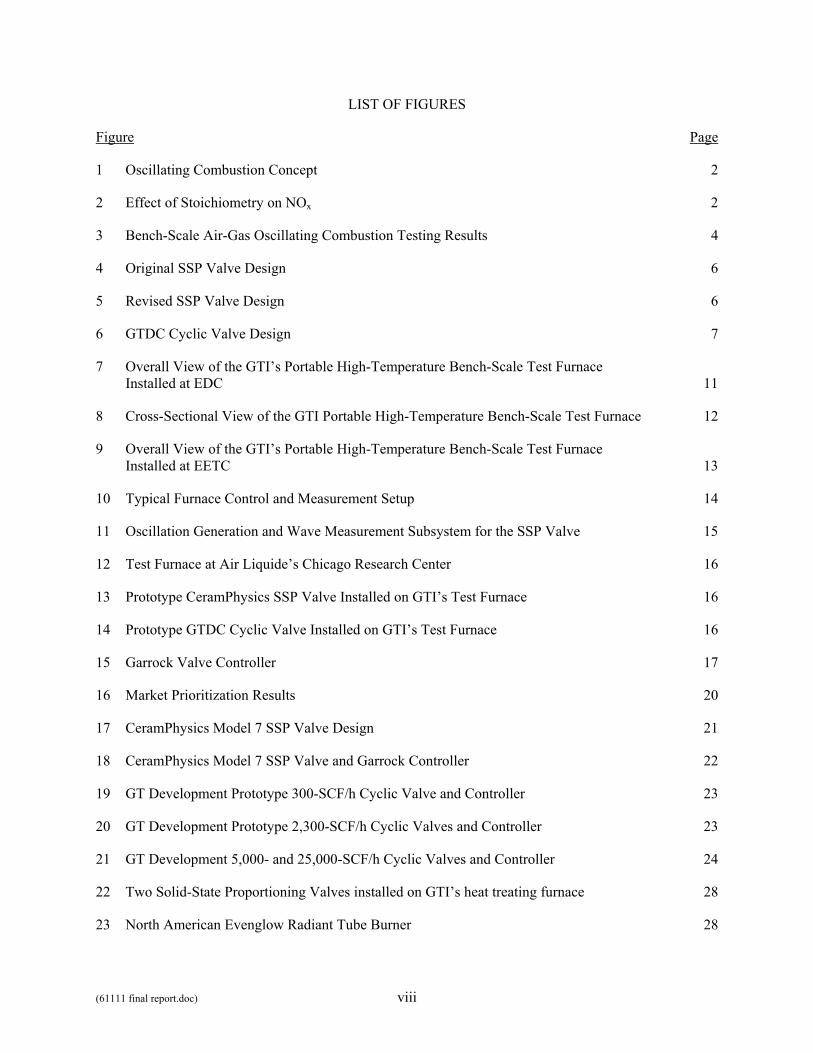
LIST OF FIGURES
Figure Page
1 Oscillating Combustion Concept 2
2 Effect of Stoichiometry on NOx 2
3 Bench-Scale Air-Gas Oscillating Combustion Testing Results 4
4 Original SSP Valve Design 6
5 Revised SSP Valve Design 6
6 GTDC Cyclic Valve Design 7
7 Overall View of the GTI’s Portable High-Temperature Bench-Scale Test Furnace Installed at EDC 11
8 Cross-Sectional View of the GTI Portable High-Temperature Bench-Scale Test Furnace 12
9 Overall View of the GTI’s Portable High-Temperature Bench-Scale Test Furnace Installed at EETC 13
10 Typical Furnace Control and Measurement Setup 14
11 Oscillation Generation and Wave Measurement Subsystem for the SSP Valve 15
12 Test Furnace at Air Liquide’s Chicago Research Center 16
13 Prototype CeramPhysics SSP Valve Installed on GTI’s Test Furnace 16
14 Prototype GTDC Cyclic Valve Installed on GTI’s Test Furnace 16
15 Garrock Valve Controller 17
16 Market Prioritization Results 20
17 CeramPhysics Model 7 SSP Valve Design 21
18 CeramPhysics Model 7 SSP Valve and Garrock Controller 22
19 GT Development Prototype 300-SCF/h Cyclic Valve and Controller 23
20 GT Development Prototype 2,300-SCF/h Cyclic Valves and Controller 23
21 GT Development 5,000- and 25,000-SCF/h Cyclic Valves and Controller 24
22 Two Solid-State Proportioning Valves installed on GTI’s heat treating furnace 28
23 North American Evenglow Radiant Tube Burner 28
(61111 final report.doc) ix
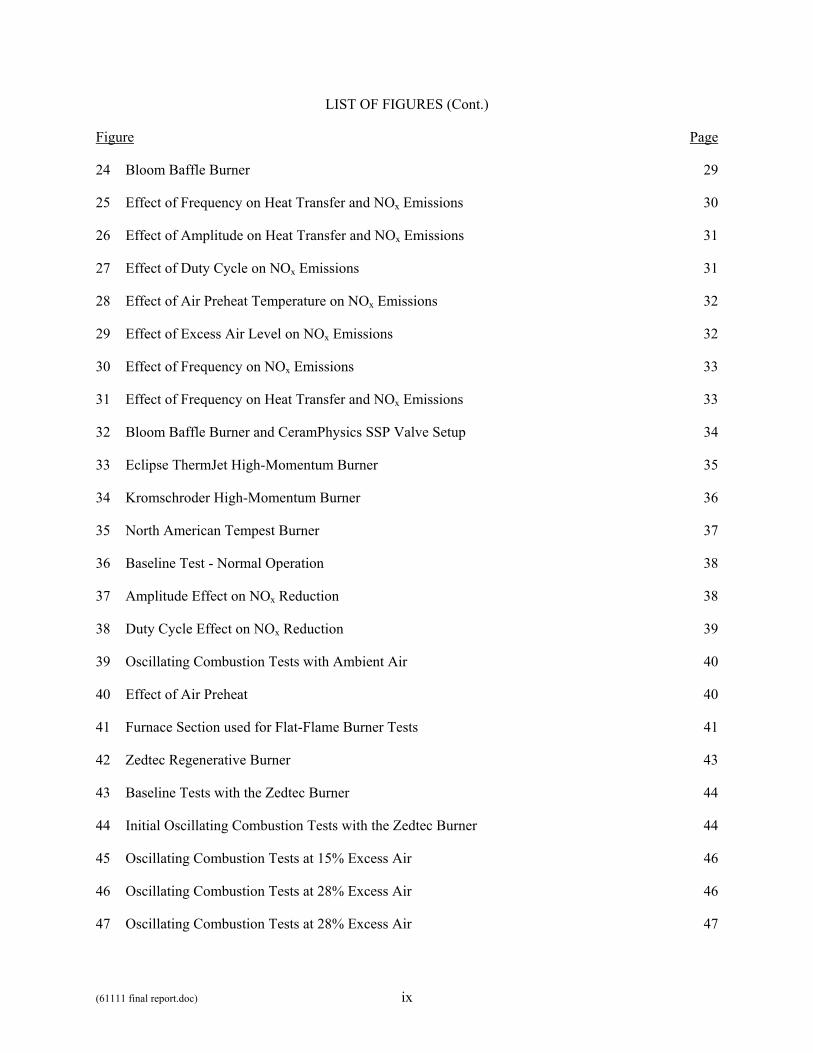
LIST OF FIGURES (Cont.)
Figure Page
24 Bloom Baffle Burner 29
25 Effect of Frequency on Heat Transfer and NOx Emissions 30
26 Effect of Amplitude on Heat Transfer and NOx Emissions 31
27 Effect of Duty Cycle on NOx Emissions 31
28 Effect of Air Preheat Temperature on NOx Emissions 32
29 Effect of Excess Air Level on NOx Emissions 32
30 Effect of Frequency on NOx Emissions 33
31 Effect of Frequency on Heat Transfer and NOx Emissions 33
32 Bloom Baffle Burner and CeramPhysics SSP Valve Setup 34
33 Eclipse ThermJet High-Momentum Burner 35
34 Kromschroder High-Momentum Burner 36
35 North American Tempest Burner 37
36 Baseline Test - Normal Operation 38
37 Amplitude Effect on NOx Reduction 38
38 Duty Cycle Effect on NOx Reduction 39
39 Oscillating Combustion Tests with Ambient Air 40
40 Effect of Air Preheat 40
41 Furnace Section used for Flat-Flame Burner Tests 41
42 Zedtec Regenerative Burner 43
43 Baseline Tests with the Zedtec Burner 44
44 Initial Oscillating Combustion Tests with the Zedtec Burner 44
45 Oscillating Combustion Tests at 15% Excess Air 46
46 Oscillating Combustion Tests at 28% Excess Air 46
47 Oscillating Combustion Tests at 28% Excess Air 47
(61111 final report.doc) x
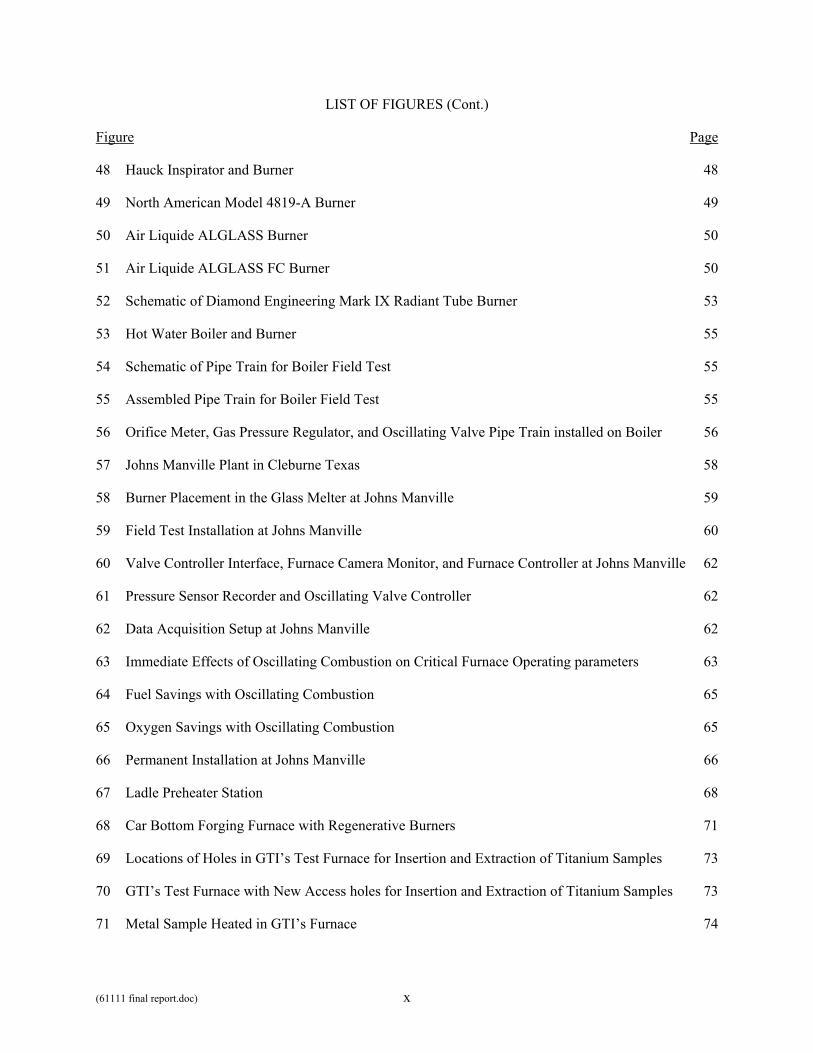
LIST OF FIGURES (Cont.)
Figure Page
48 Hauck Inspirator and Burner 48
49 North American Model 4819-A Burner 49
50 Air Liquide ALGLASS Burner 50
51 Air Liquide ALGLASS FC Burner 50
52 Schematic of Diamond Engineering Mark IX Radiant Tube Burner 53
53 Hot Water Boiler and Burner 55
54 Schematic of Pipe Train for Boiler Field Test 55
55 Assembled Pipe Train for Boiler Field Test 55
56 Orifice Meter, Gas Pressure Regulator, and Oscillating Valve Pipe Train installed on Boiler 56
57 Johns Manville Plant in Cleburne Texas 58
58 Burner Placement in the Glass Melter at Johns Manville 59
59 Field Test Installation at Johns Manville 60
60 Valve Controller Interface, Furnace Camera Monitor, and Furnace Controller at Johns Manville 62
61 Pressure Sensor Recorder and Oscillating Valve Controller 62
62 Data Acquisition Setup at Johns Manville 62
63 Immediate Effects of Oscillating Combustion on Critical Furnace Operating parameters 63
64 Fuel Savings with Oscillating Combustion 65
65 Oxygen Savings with Oscillating Combustion 65
66 Permanent Installation at Johns Manville 66
67 Ladle Preheater Station 68
68 Car Bottom Forging Furnace with Regenerative Burners 71
69 Locations of Holes in GTI’s Test Furnace for Insertion and Extraction of Titanium Samples 73
70 GTI’s Test Furnace with New Access holes for Insertion and Extraction of Titanium Samples 73
71 Metal Sample Heated in GTI’s Furnace 74
(61111 final report.doc) xi
LIST OF FIGURES (Cont.)
Figure Page
72 Mock-Up of Piping and Constraints 74
73 The CeramPhysics Model 7E SSP Valve 75
74 Final Design of the Oscillating Valve Pipe Trains for the Retrofit Installation Design 75
75 GTI CEM and Temperature Instrumentation Installed Inside Trailer 76
76 Typical Downstream Pressure Wave from Oscillating Valve 76
77 Oscillating Valve Train 77
78 Oscillating Valve Controller 77
79 Air Supply, Fuel Supply, and Air-Fuel Ratio Subsystems 78
80 Original Baseline 81
81 NOx Reduction With High Excess Air 83
82 NOx Reduction With Low Excess Air 83
83 Four-Stack Batch Annealing furnace with Ten Burners 85
84 Piping Assembly Used for SSP Valve Installation on the Batch Annealing Furnace at BSC 86
85 Valve Train and Controller Installation at BSC 87
86 Original Gas Flow Control Subsystem 88
87 Retrofit Gas Flow Control Subsystem 88
88 GTI Instrumentation Trailer 89
89 GTI CEM and Temperature Instrumentation 89
90 Oscillating Phasing Schemes for the Batch Annealing Furnace 91
91 Fuel Usage and NOx Emissions for the Second Test Campaign 94
92 Pulse Generator (Bottom) and Distribution Panel (Top) 96
93 Oscillating Valve Control for the Annealing Furnace 97
94 Fuel Usage and NOx Emissions for the Fifth Test Campaign 97
95 Approach for Bottom Charge Zones 102
(61111 final report.doc) xii
LIST OF FIGURES (Cont.)
Figure Page
96 Approach for Top Charge and Heat Zones 102
97 BSC Reheat Furnace Burner Locations 106
98 GTI’s Portable High-Temperature Bench-Scale Test Furnace 107
99 Baseline Emissions as a Function of Firing Rate 108
100 Baseline Emissions as a Function of Combustion Air Temperature 108
101 Baseline Emissions as a Function of Furnace Temperature 109
102 Baseline Emissions as a Function of Excess Air Level Showing the Typical Bell-Shaped Curve 109
103 Initial Oscillating Combustion Tests Showed a 35% Reduction in NOx and a 4% Increase in Heat Transfer over Baseline Values 110
104 Frequency Variation Test 111
105 Amplitude Variation Test 111
106 Duty Cycle Variation Test 112
107 Multiple Parameter Variation Test #1 112
108 Multiple Parameter Variation Test #2 113
109 Multiple Parameter Variation Test #3 113
110 Earlier Cyclic Valves and Valve Controllers 114
111 Cutaway View of the Cyclic Valve 117
112 Flow Testing of the 50k Cyclic Valve 118
113 Flow Testing of the 10k Cyclic Valve 118
114 Operator Interface (Level II Controller) in Temporary Enclosure Showing Flow Test Program 119
115 Level II Controller Assembly and Display Screen Detail Showing Oscillating Valve Control Program 120
116 Completed Valves with Controller 121
117 Typical Downstream Pressure Wave from Cyclic Valve 121
118 Modeling Base Case (No Oscillations) 124
(61111 final report.doc) xiii
LIST OF FIGURES (Cont.)
Figure Page
119 Temperature of Slab As It Traverses Furnace 124
120 Slab Temperature Profiles 125
121 Quasi-Transient Combustion Characteristics 125
122 Steady State Combustion Characteristics 126
123 Temperature Profile in a Pseudo Single-Burner Furnace as Predicted During a Transient Simulation 127
124 Time Average of Species Concentration Along a Pseudo Single-Burner Furnace 127
125 Longitudinal Temperature Variation in the Flame for Steady and Oscillating Flames (Average Values) 127
126 Piping Change Needed to Install Oscillating Valves on Top Charge Zone and Heat Zone Burners at BSC 129
127 Piping Change Needed to Install Oscillating Valves on Bottom Charge Zone Burners at BSC 129
128 Time Proportional Firing Control Circuit Modifications 130
129 GTI Instrumentation Package Being Assembled 131
130 Proposed Concept for Scale Removal and Temperature Measurement of Slabs from Reheat Furnace at BSC 132
131 Nucor Steel Reheat Furnace Burner Locations 133
132 Piping Change Needed to Install Oscillating Valves on Heat Zone Burners at Nucor Steel 136
133 Continuous Emissions Monitors and Flow Control Cabinet 138
134 Trailer Housing GTI’s Instrumentation 138
135 Sampling Locations at Nucor Steel 139
136 Oscillating Valves and Controller Installed at Nucor Steel 143
137 Limit of NOx Reduction with Oscillating Combustion 149
138 Natural Gas Usage without and with Oscillating Combustion 149
139 OCTrim System Concept 150
140 Pulse Width Modulation Technique 153
(61111 final report.doc) xiv
LIST OF FIGURES (Cont.)
Figure Page
141 Single-Valve Oscillating Valve Control Program 155
142 Controlling the Oscillation of Multiple Valves 155
143 Eight-Valve Oscillating Valve Control Program 156
144 Oscillating Valve Hardware Interface 156
145 Oscillating Valve Control Program for Shultz Steel Field Test 157
146 Oscillating Combustion Display Screen 158
(61111 final report.doc) 1
INTRODUCTION
High-temperature, natural gas-fired furnaces, especially those fired with preheated air, produce
large quantities of NOx* per ton of material processed. Regulations on emissions from industrial furnaces
are becoming increasingly more stringent. In addition, competition is forcing operators to make their
furnaces more productive and/or efficient. Switching from preheated air to industrial oxygen can increase
efficiency but does not necessarily reduce NOx due to NOx formation from nitrogen present in the
industrial oxygen, in the natural gas, in the air trapped within the raw materials, and in air that infiltrates
into the furnace through cracks or discontinuities in the furnace’s shell. Use of cryogenic oxygen (with
almost no nitrogen) does help reduce NOx compared to industrial oxygen (with 5%-10% nitrogen), but
this oxygen is significantly more costly.
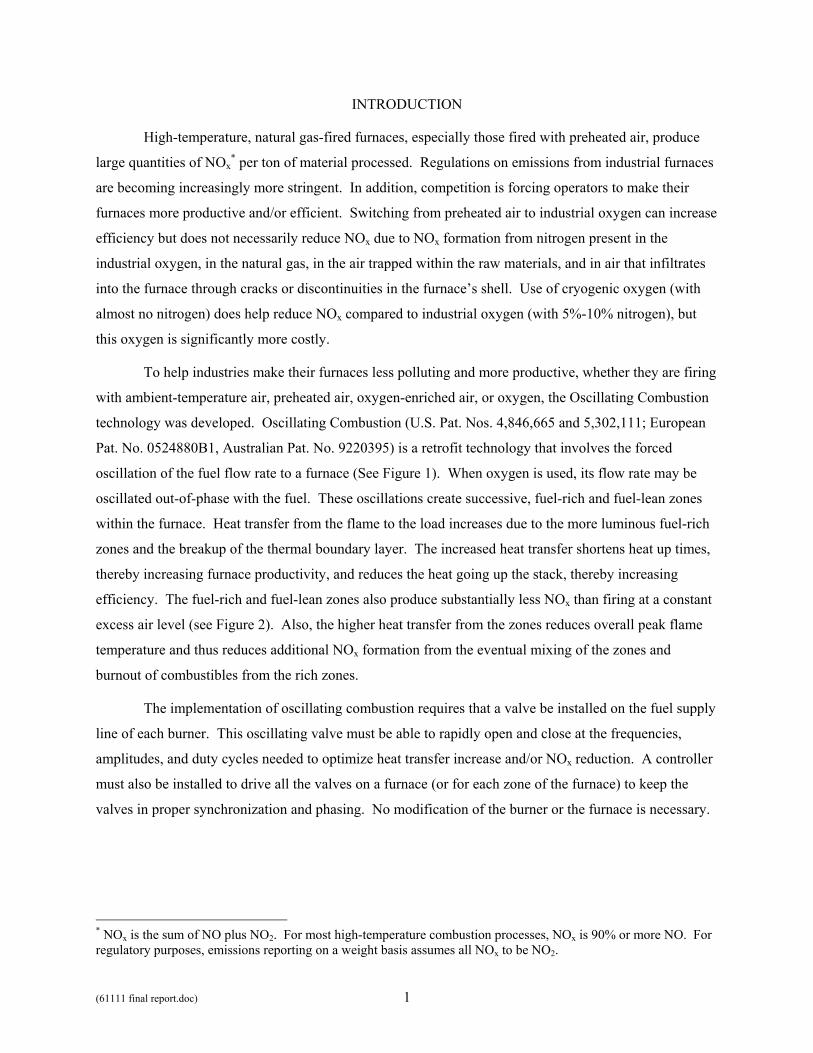
To help industries make their furnaces less polluting and more productive, whether they are firing
with ambient-temperature air, preheated air, oxygen-enriched air, or oxygen, the Oscillating Combustion
technology was developed. Oscillating Combustion (U.S. Pat. Nos. 4,846,665 and 5,302,111; European
Pat. No. 0524880B1, Australian Pat. No. 9220395) is a retrofit technology that involves the forced
oscillation of the fuel flow rate to a furnace (See Figure 1). When oxygen is used, its flow rate may be
oscillated out-of-phase with the fuel. These oscillations create successive, fuel-rich and fuel-lean zones
within the furnace. Heat transfer from the flame to the load increases due to the more luminous fuel-rich
zones and the breakup of the thermal boundary layer. The increased heat transfer shortens heat up times,
thereby increasing furnace productivity, and reduces the heat going up the stack, thereby increasing
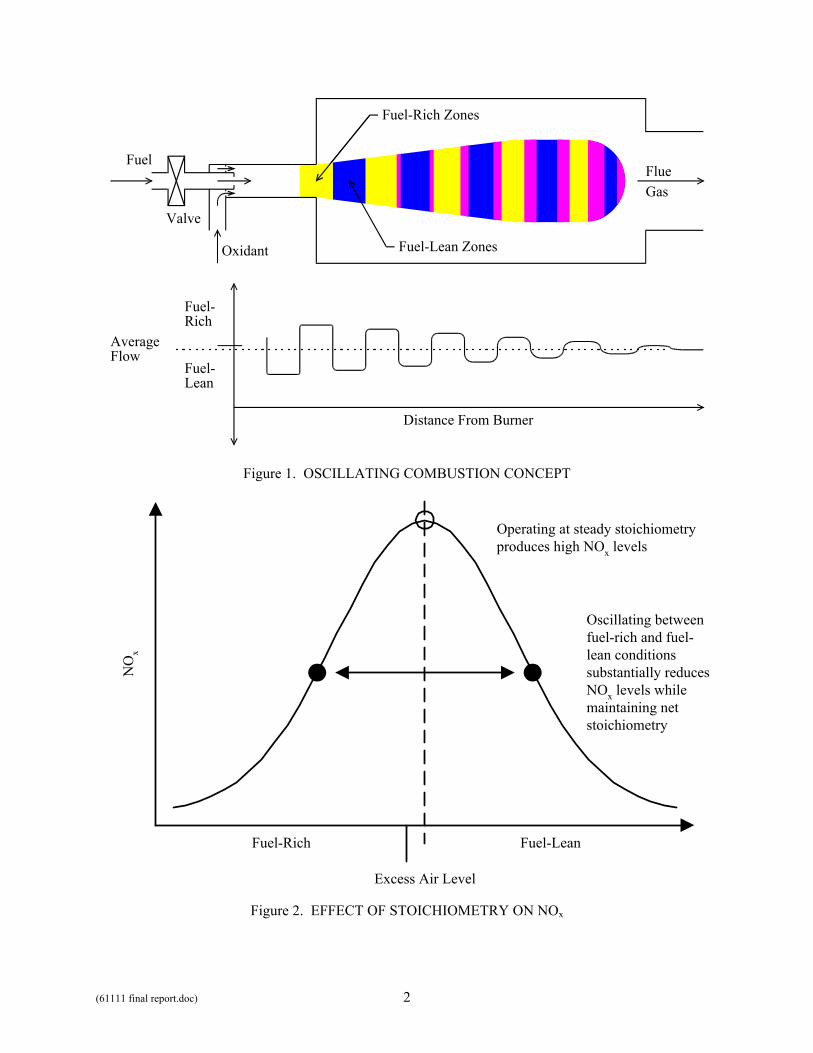
efficiency. The fuel-rich and fuel-lean zones also produce substantially less NOx than firing at a constant
excess air level (see Figure 2). Also, the higher heat transfer from the zones reduces overall peak flame
temperature and thus reduces additional NOx formation from the eventual mixing of the zones and
burnout of combustibles from the rich zones.
The implementation of oscillating combustion requires that a valve be installed on the fuel supply
line of each burner. This oscillating valve must be able to rapidly open and close at the frequencies,
amplitudes, and duty cycles needed to optimize heat transfer increase and/or NOx reduction. A controller
must also be installed to drive all the valves on a furnace (or for each zone of the furnace) to keep the
valves in proper synchronization and phasing. No modification of the burner or the furnace is necessary.
* NOx is the sum of NO plus NO2. For most high-temperature combustion processes, NOx is 90% or more NO. For regulatory purposes, emissions reporting on a weight basis assumes all NOx to be NO2.
(61111 final report.doc) 2
Distance From Burner
FlueGas
Fuel-Lean Zones
Fuel-Rich Zones
Fuel
Oxidant
Valve
Fuel-Rich
Fuel-Lean
AverageFlow
Figure 1. OSCILLATING COMBUSTION CONCEPT
Fuel-Lean
Excess Air Level
NO
x
Fuel-Rich
Operating at steady stoichiometryproduces high NOx levels
Oscillating betweenfuel-rich and fuel-lean conditionssubstantially reducesNOx levels whilemaintaining netstoichiometry
Figure 2. EFFECT OF STOICHIOMETRY ON NOx
(61111 final report.doc) 3
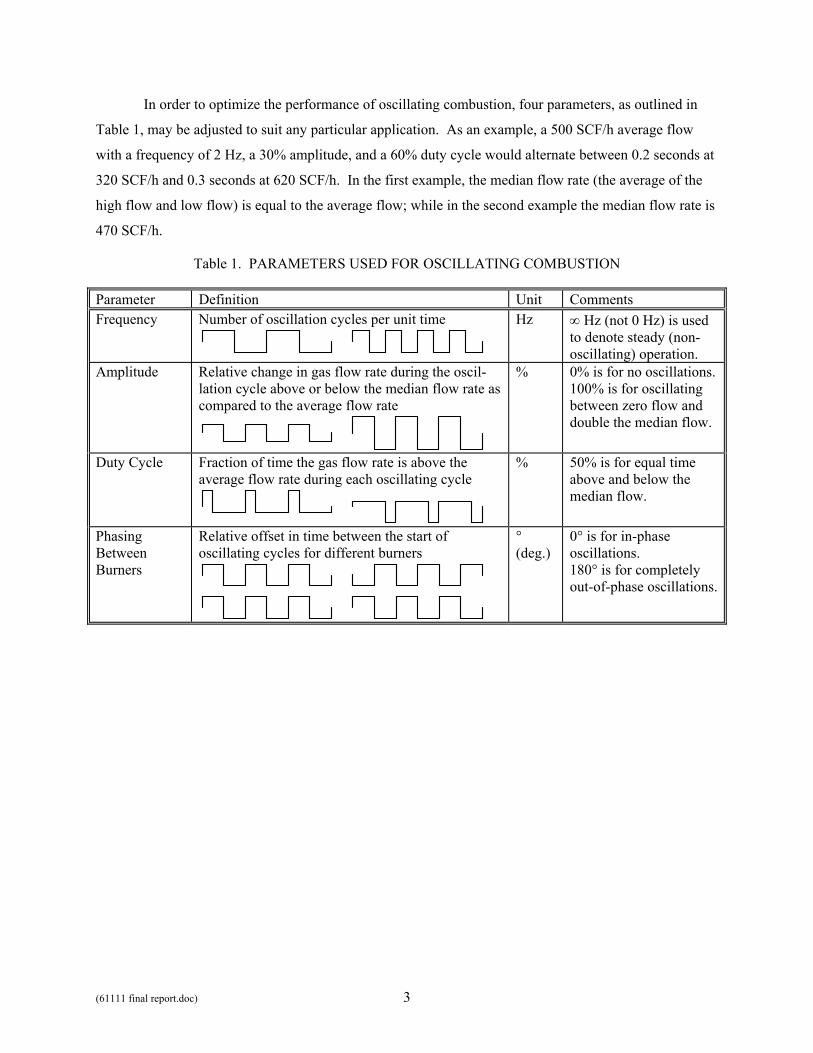
In order to optimize the performance of oscillating combustion, four parameters, as outlined in
Table 1, may be adjusted to suit any particular application. As an example, a 500 SCF/h average flow
with a frequency of 2 Hz, a 30% amplitude, and a 60% duty cycle would alternate between 0.2 seconds at
320 SCF/h and 0.3 seconds at 620 SCF/h. In the first example, the median flow rate (the average of the
high flow and low flow) is equal to the average flow; while in the second example the median flow rate is
470 SCF/h.
Table 1. PARAMETERS USED FOR OSCILLATING COMBUSTION
Parameter Definition Unit Comments Frequency Number of oscillation cycles per unit time
Hz ∞ Hz (not 0 Hz) is used to denote steady (non-oscillating) operation.
Amplitude Relative change in gas flow rate during the oscil-lation cycle above or below the median flow rate as compared to the average flow rate
% 0% is for no oscillations.100% is for oscillating between zero flow and double the median flow.
Duty Cycle Fraction of time the gas flow rate is above the average flow rate during each oscillating cycle
% 50% is for equal time above and below the median flow.
Phasing Between Burners
Relative offset in time between the start of oscillating cycles for different burners
° (deg.)
0° is for in-phase oscillations. 180° is for completely out-of-phase oscillations.
(61111 final report.doc) 4
BACKGROUND
The oscillating combustion technology was the focus of an ongoing R&D program at Gas
Technology Institute (GTI†) and at Air Liquide’s Chicago Research Center. Support is being or has been
provided by Air Liquide (AL), California Air Resources Board (CARB), Columbia Energy Group-Energy
Consulting Services‡, Gas Technology Canada§, the Gas Research Institute (GRI), Southern California
Gas Company, the U.S. Department of Energy-Office of Industrial Technologies (DOE-OIT), and GTI’s
Sustaining Membership Program (SMP).
Oscillating Combustion Process Development
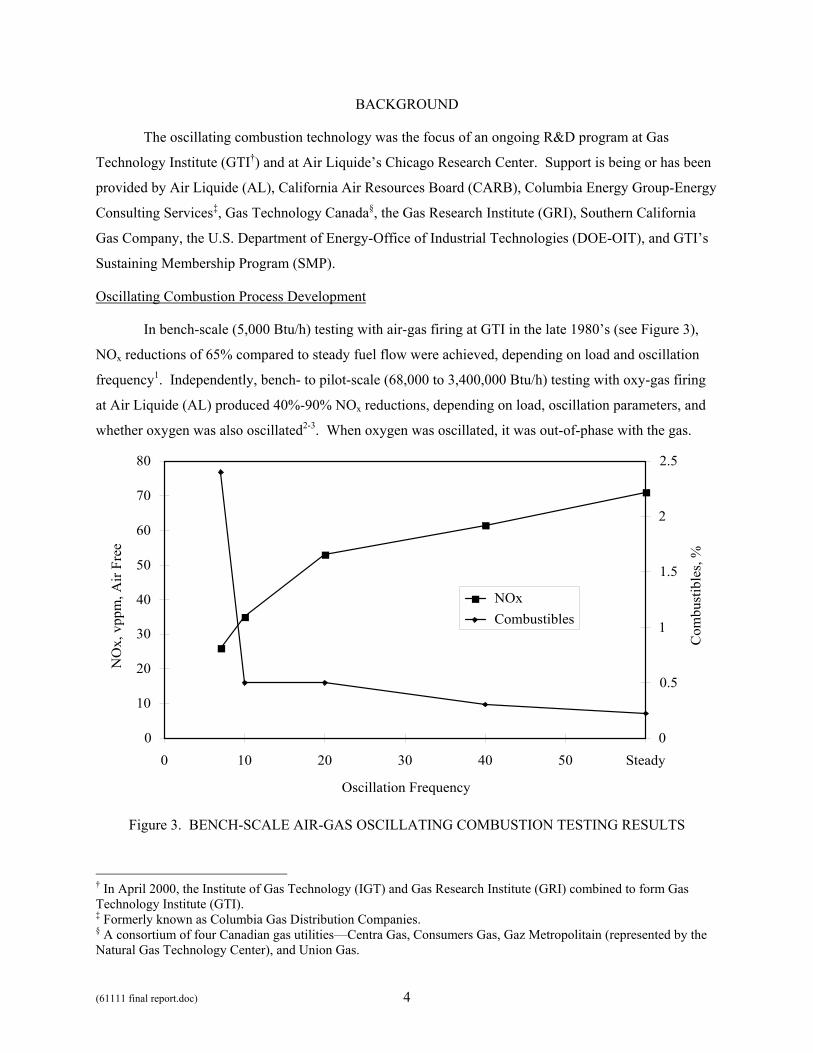
In bench-scale (5,000 Btu/h) testing with air-gas firing at GTI in the late 1980’s (see Figure 3),
NOx reductions of 65% compared to steady fuel flow were achieved, depending on load and oscillation
frequency1. Independently, bench- to pilot-scale (68,000 to 3,400,000 Btu/h) testing with oxy-gas firing
at Air Liquide (AL) produced 40%-90% NOx reductions, depending on load, oscillation parameters, and
whether oxygen was also oscillated2-3. When oxygen was oscillated, it was out-of-phase with the gas.
0
10
20
30
40
50
60
70
80
0 10 20 30 40 50 Steady
Oscillation Frequency
NO
x, v
ppm
, Air
Free
0
0.5
1
1.5
2
2.5
Com
bust
ible
s, %
NOxCombustibles
Figure 3. BENCH-SCALE AIR-GAS OSCILLATING COMBUSTION TESTING RESULTS
† In April 2000, the Institute of Gas Technology (IGT) and Gas Research Institute (GRI) combined to form Gas Technology Institute (GTI). ‡ Formerly known as Columbia Gas Distribution Companies. § A consortium of four Canadian gas utilities—Centra Gas, Consumers Gas, Gaz Metropolitain (represented by the Natural Gas Technology Center), and Union Gas.
(61111 final report.doc) 5
In 1994, AL licensed GTI’s oscillating combustion patents and know-how to gain world-wide
exclusive rights to the technology. Since then, the license has been renegotiated so that GTI retains a
nonexclusive right for air-gas-fired applications.
In 1995, a project4 was started at GTI and AL to 1) prove the effectiveness of a particular valve
when applied to oscillating combustion, 2) parameterize the operational characteristics of oscillating
combustion, and 3) perform a field test of oscillating combustion on an oxy-gas-fired industrial furnace.
The valve studied in this previous project was the CeramPhysics (CPI) Solid-State Proportioning (SSP)
valve. The operational characteristics of oscillating combustion were studied on an North American
model 4825-5 Hot Air burner on GTI’s high-temperature test furnace. Heat transfer increases of 13% and
2%, and NOx emissions reductions of 65% and 75% were observed when oscillating combustion was
applied to this burner when fired with ambient air and air preheated to 875°F, respectively. Tests at AL
with their ALGLASS tube-in-tube oxy-gas burner showed a 68% NOx reduction. AL performed a field
test on a oxy-gas-fired rotary iron melter, which used a AL MF6 water-cooled oxy-gas burner. While
NOx reduction was minimal for this application due to air infiltrations and the often fuel-rich conditions in
the melter, fuel savings of 10% to 16% and cycle time reductions of 12% to 20% were seen.
Oscillating Valve Development
GTI’s tests in the late 1980’s used a solenoid valve or a solenoid-based EGR (exhaust gas
recirculation) valve, while AL’s early tests used a rotary plug valve. All of these valves had drawbacks
that made them unsuitable for industrial applications. The solenoid valves did not have a long lifetime,
and the rotary plug valve was expensive. Also, none of these valves provided an adjustable oscillation
amplitude (adjustable high (open) and low (closed) flow rates).
A valve apparently meeting the requirements of low cost and long life was being developed by
CeramPhysics, Inc. (CPI) of Westerville, Ohio, in 1994 for other applications under support from
Columbia Energy Group and Southern California Gas Company. At that time this valve, known as the
Solid-State Proportioning (SSP) valve (U.S. Patent No. 5,222,713), had a flow capacity of only 40 SCF/h,
but it was shown that it could operate at high frequencies (20 Hz) and produce fairly square flow rate
pulses. It was also virtually noise free.
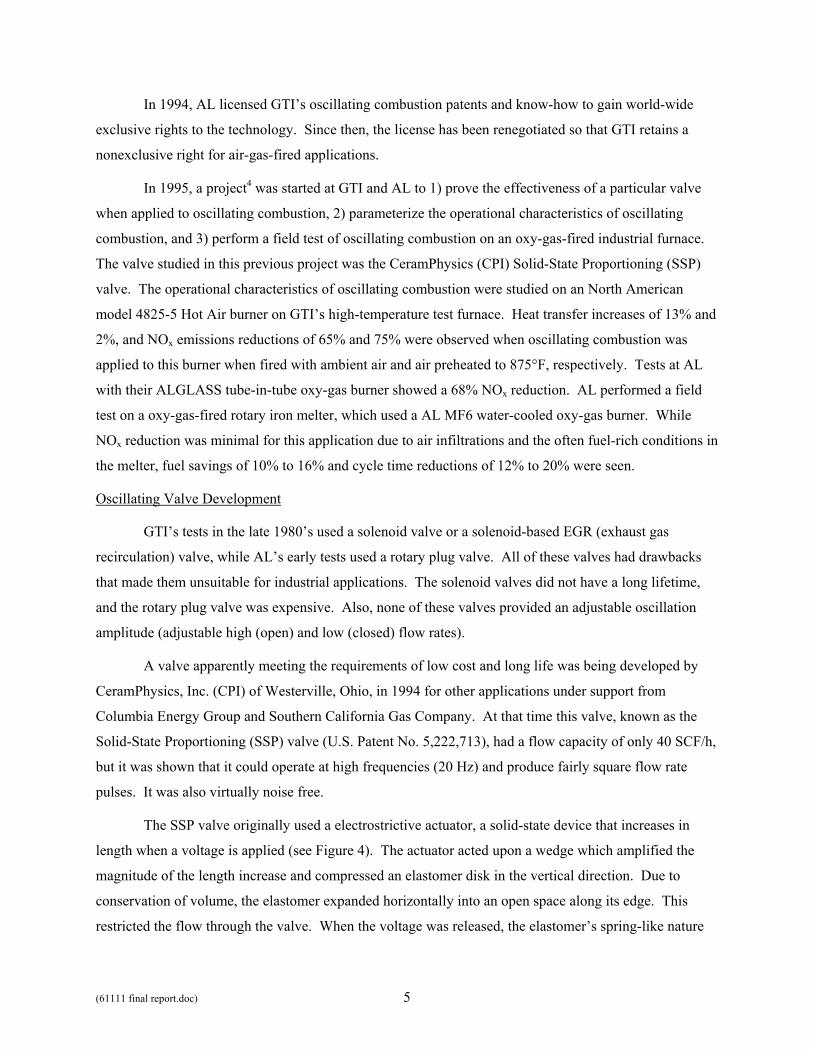
The SSP valve originally used a electrostrictive actuator, a solid-state device that increases in
length when a voltage is applied (see Figure 4). The actuator acted upon a wedge which amplified the
magnitude of the length increase and compressed an elastomer disk in the vertical direction. Due to
conservation of volume, the elastomer expanded horizontally into an open space along its edge. This
restricted the flow through the valve. When the voltage was released, the elastomer’s spring-like nature
(61111 final report.doc) 6
restored the system to its starting point. The valve could open and close in 1/20th of a second, and
varying the amount of voltage applied (0 to 250 VDC) would vary how far the valve is opened or closed,
so the oscillation amplitude is adjustable electronically.
Electro-strictiveActuator
ElastomerWedge
In In
OutOutOpen Closed
Wedge
Fixed Fixed
Figure 4. ORIGINAL SSP VALVE DESIGN
Fixed
Movable
Fixed
Movable
InductiveActuator
Elastomer
In In
OutOutOpen Closed
Figure 5. REVISED
SSP VALVE DESIGN
In the previous project4, the SSP valve design was scaled up and redesigned by CPI. This new
design (see Figure 5) featured an inductive (solenoid-type) actuator and an annular space for the gas flow.
The inductive actuator used a lower voltage, 24 volts DC or 60 volts DC, depending on application, than
the electrostrictive actuator. The annular space allows for much higher valve capacities. CeramPhysics
scaled-up the SSP valve first to 500-SCF/h (equal to 250 SCF/h average flow when the flow is oscillated)
and then to 3,000-SCF/h (equal to 1,500 SCF/h when oscillated) and subcontracted Garrock Electronic
Engineering Services to develop a 2-valve controller. GTI extensively tested the 500-SCF/h SSP on its
test furnace during the course of its oscillating combustion tests. AL extensively tested the 3,000-SCF/h
SSP on its test furnace and used this size valve and the Garrock valve controller for the first field tests of
oscillating combustion. CPI performed accelerated lifecycle testing on the SSP valve and found no
degradation in performance for over 110 million cycles.
In this current project being reported on herein, 1,000-SCF/h and 1,400-SCF/h SSP valves were
produced for GTI laboratory studies, while 2,100-SCF/h and 3,000-SCF/h SSP valves and Garrock valve
controllers were produced for field testing by Air Liquide and GTI. All of the flow rate capacities cited
above are at a 1.5-psi pressure drop through the SSP valve. Details of the SSP valve development for this
project have been reported on previously5.
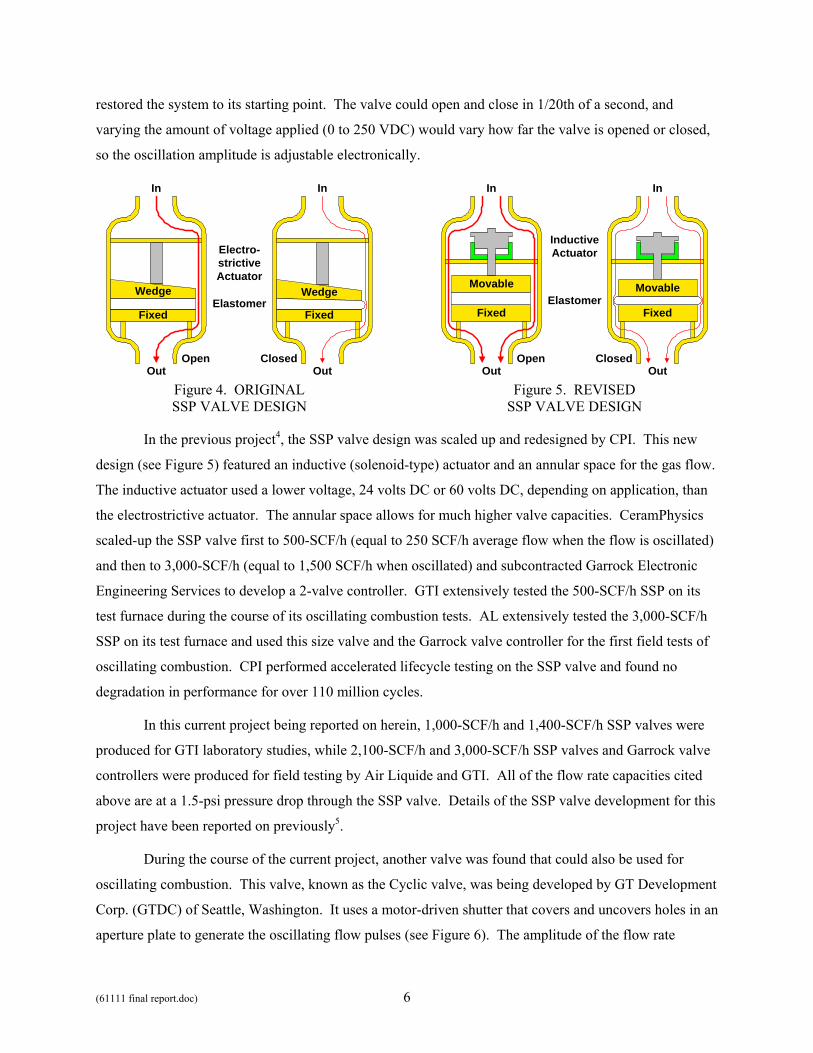
During the course of the current project, another valve was found that could also be used for
oscillating combustion. This valve, known as the Cyclic valve, was being developed by GT Development
Corp. (GTDC) of Seattle, Washington. It uses a motor-driven shutter that covers and uncovers holes in an
aperture plate to generate the oscillating flow pulses (see Figure 6). The amplitude of the flow rate
(61111 final report.doc) 7
oscillations produced by this valve is adjusted mechanically instead of electrically as with the SSP valve,
so the Cyclic valve is somewhat less flexible than the SSP valve, but the Cyclic valve does appear to be
easier to scale up to large industrial sizes.
Figure 6. GTDC CYCLIC VALVE DESIGN
The Cyclic valve was also extensively tested by GTI and AL. Two sizes of valves were
evaluated, a 1,200 SCF/h (equal to 600 SCF/h average flow when oscillating) valve and a pair of 4,500
SCF/h valves. NOx emission reductions from the Cyclic valve were very similar to those from the SSP
valve when tested on the same burner. The Cyclic valve was used for one of the field tests in Task 2 of
this project. After further development of the Cyclic valve, which was performed by Outsource Tech Inc.
(OTI) of Seattle, Washington, The Cyclic valve was used in the field test in Task 6 of this project. OTI
also developed a multiplexing controller for the Cyclic valve.
(61111 final report.doc) 8
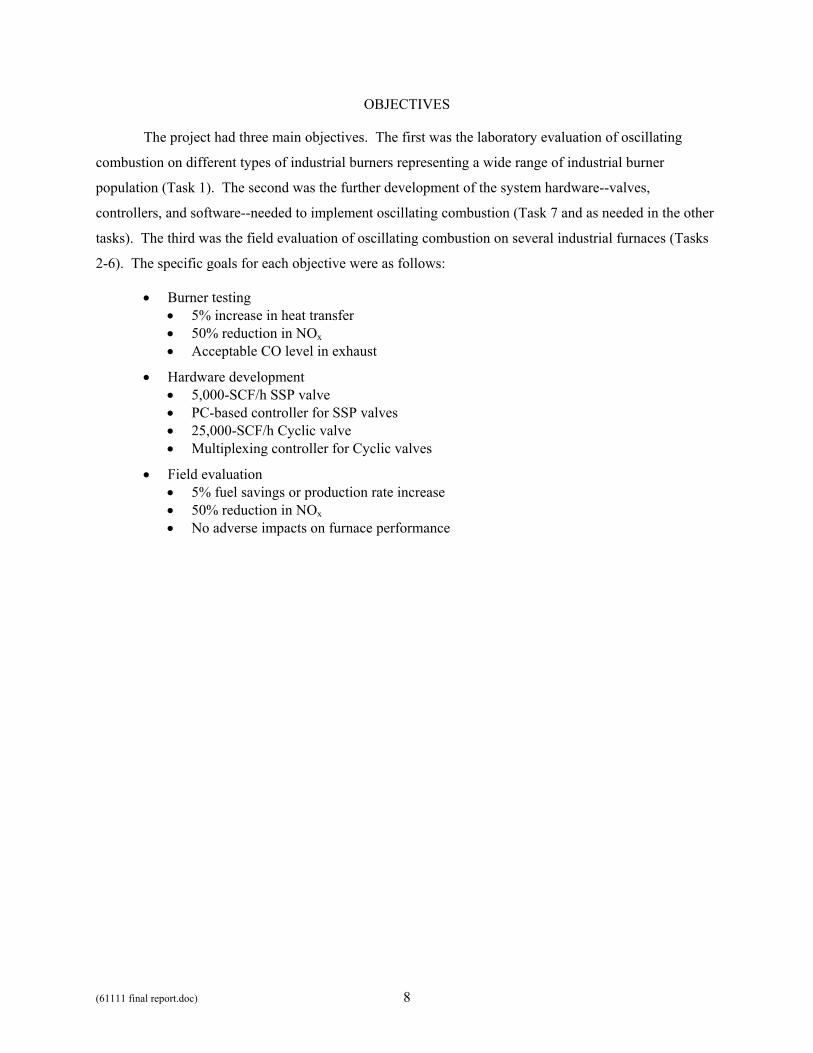
OBJECTIVES
The project had three main objectives. The first was the laboratory evaluation of oscillating
combustion on different types of industrial burners representing a wide range of industrial burner
population (Task 1). The second was the further development of the system hardware--valves,
controllers, and software--needed to implement oscillating combustion (Task 7 and as needed in the other
tasks). The third was the field evaluation of oscillating combustion on several industrial furnaces (Tasks
2-6). The specific goals for each objective were as follows:
• Burner testing • 5% increase in heat transfer • 50% reduction in NOx • Acceptable CO level in exhaust
• Hardware development • 5,000-SCF/h SSP valve • PC-based controller for SSP valves • 25,000-SCF/h Cyclic valve • Multiplexing controller for Cyclic valves
• Field evaluation • 5% fuel savings or production rate increase • 50% reduction in NOx • No adverse impacts on furnace performance

(61111 final report.doc) 9
TECHNICAL APPROACH
This project consisted of 7 tasks (see Table 2). Task 1 involved the laboratory evaluation of
oscillating combustion on different types of industrial burners representing a wide range of industrial
burner population. Each burner was first baseline tested and then put through a series of variations of
individual and multiple oscillating combustion parameters. The baseline tests usually involved variations
of excess air level, firing rate, furnace load, and air preheat level. The oscillating combustion tests
sometimes varied one of these parameters in conjunction with variation of an oscillating combustion
parameter. Originally eight burners were planned to be tested, but this was reduced to six with the
incorporation of a market study into Task 1. Oscillating valve development work was also incorporated
into this task, except for the large-scale Cyclic valve, which were developed in Task 6.
Table 2. INDIVIDUAL PROJECT TASKS
Task Title Dates 1 Laboratory Application of Oscillating Combustion to Industrial Burners Oct. 1996 - Mar. 19992 Small-Scale Air-Natural Gas Field Evaluation Apr. 1997 - Jul. 1998 3 Full-Furnace Oxy-Natural Gas Oscillating Combustion Field Evaluation Oct. 1997 - Dec. 19994 Large-Scale Air-Natural Gas Field Evaluation Jul. 1997 - Mar. 2001 5 Field Demonstration on a 10-MMBtu/h Stack Annealing Furnace Mar. 1998 - Sep. 19986 Demonstration of Oscillating Combustion on a Reheat Furnace Oct. 1999 – Dec. 20037 Oscillating Combustion Control System Development Oct. 1998 - Mar. 2001
Tasks 2 and 4 involved the field evaluation of oscillating combustion on small and large air-
natural gas industrial furnaces, respectively. Task 3 involved the field evaluation of oscillating
combustion on an oxy-natural gas industrial furnace. Tasks 5 and 6 involved the field evaluation of
oscillating combustion on stack annealing and steel reheat furnaces, respectively. For each of these tasks,
the plan was to evaluate candidate sites in terms of the potential for increased furnace efficiency and/or
decreased NOx emissions, select the most promising sites, develop a installation plan, conduct baseline
testing, install the oscillating combustion hardware, conduct oscillating combustion tests, evaluate the
results, and then determine if the oscillating combustion hardware should remain installed.
Task 7 involved the development of a control system to effectively implement oscillating
combustion. This included hardware to drive the oscillating valves and monitor their performance, and
computer software to set and/or control the oscillating combustion parameters based on furnace and
oscillating valve conditions.
The original proposed effort only consisted of Tasks 1-4. Task 5 was added when the opportunity
to demonstrate oscillating combustion for a DOE-OIT technology showcase for the steel industry arose.
The level of effort needed for field testing oscillating combustion on a reheat furnace, which is over 10
(61111 final report.doc) 10
times larger than the size of the field sites original proposed for Task 4, plus the development of new,
larger oscillating valves and valve control hardware, necessitated a separately funded task (Task 6). Task
7 was added when the need for a system to control the overall oscillating combustion process, and not just
the valves themselves, was recognized.
GTI carried out the bulk of the effort during Tasks 1-2 and 4-7. Air Liquide (AL) performed the
bulk of the effort during Task 3, and also carried out lab testing during Task 1, field testing during Task 2,
and modeling during Task 6. CeramPhysics, Inc. (CPI) provided the oscillating valves (SSP valves) for
Tasks 1-5, while GT Development Corp. (GTDC) and Outsource Tech Inc. (OTI) provided the oscillating
valves (Cyclic valves) for Tasks 1-2 and 6.
(61111 final report.doc) 11
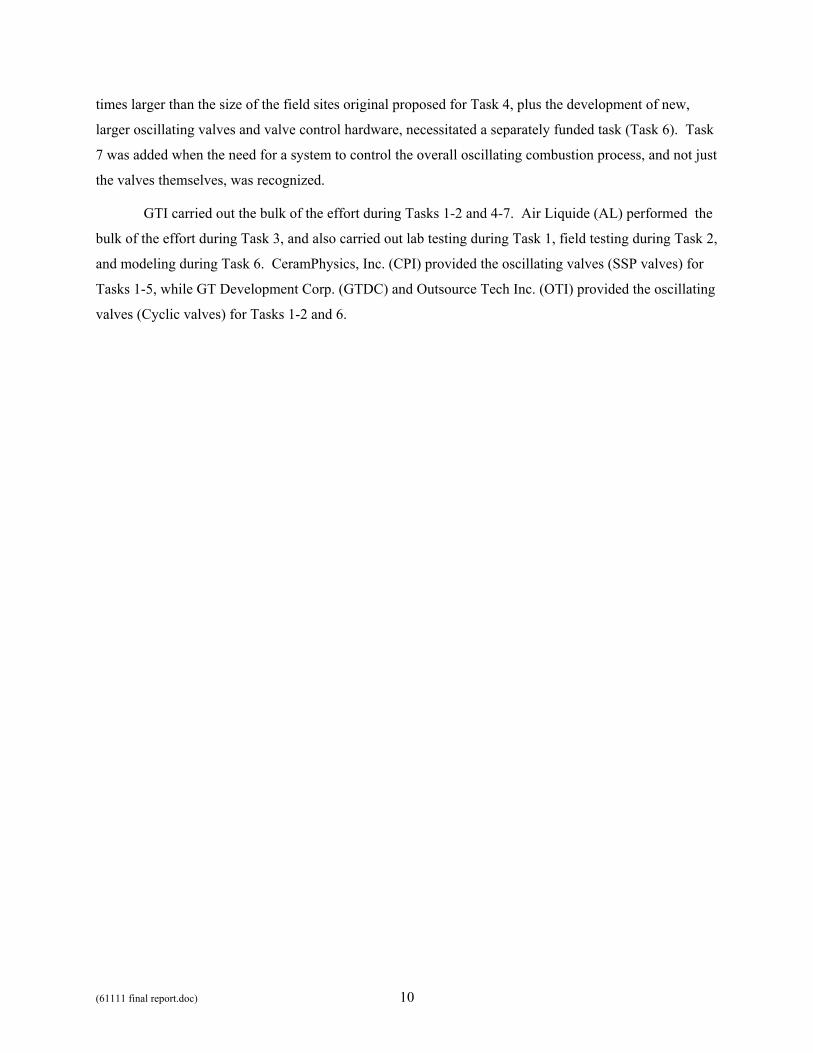
FACILITIES AND EQUIPMENT
The laboratory oscillating combustion tests for Tasks 1, 5, and 6 of this project were carried out
in GTI’s portable high-temperature, bench-scale test furnace (see Figure 7), then located at GTI’s Energy
Development Center (EDC) in Chicago, IL. GTI’s combustion laboratory, including this furnace, have
since been relocated to GTI’s Emerging Energy Technology Campus, which is adjacent to GTI’s
Headquarters in Des Plaines, IL. Oscillating combustion testing on burners specific to Tasks 4 and 6
were conducted at the newer facility.
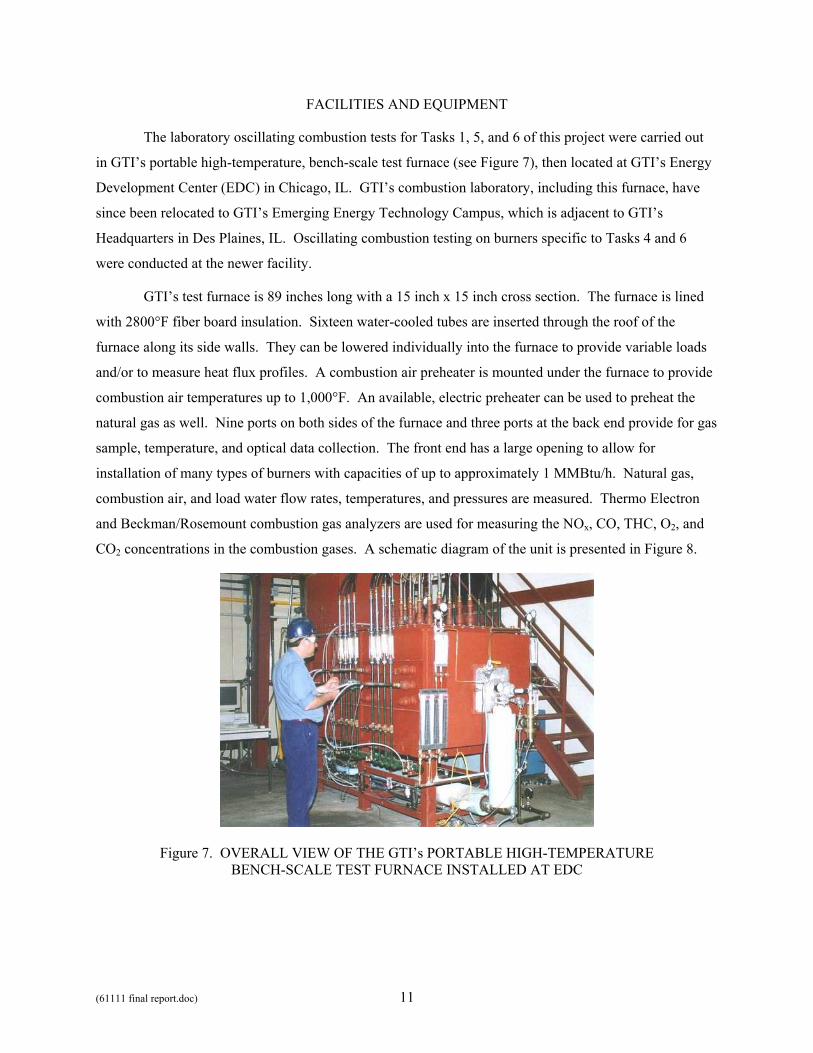
GTI’s test furnace is 89 inches long with a 15 inch x 15 inch cross section. The furnace is lined
with 2800°F fiber board insulation. Sixteen water-cooled tubes are inserted through the roof of the
furnace along its side walls. They can be lowered individually into the furnace to provide variable loads
and/or to measure heat flux profiles. A combustion air preheater is mounted under the furnace to provide
combustion air temperatures up to 1,000°F. An available, electric preheater can be used to preheat the
natural gas as well. Nine ports on both sides of the furnace and three ports at the back end provide for gas
sample, temperature, and optical data collection. The front end has a large opening to allow for
installation of many types of burners with capacities of up to approximately 1 MMBtu/h. Natural gas,
combustion air, and load water flow rates, temperatures, and pressures are measured. Thermo Electron
and Beckman/Rosemount combustion gas analyzers are used for measuring the NOx, CO, THC, O2, and
CO2 concentrations in the combustion gases. A schematic diagram of the unit is presented in Figure 8.
Figure 7. OVERALL VIEW OF THE GTI’s PORTABLE HIGH-TEMPERATURE BENCH-SCALE TEST FURNACE INSTALLED AT EDC
(61111 final report.doc) 12
15 in
.
ExtractiveSamplingProbeLocation
Variable Load/Heat FluxMeasurement (16 points)
Burner
89 in.
View orSamplingPorts(21 points)
(Cross Section As Viewed From Top)
Burner
15 in
.
15 in.
24 in
.
89 in.
Variable Load/Heat FluxMeasurement (16 points)
31 in
.
ExtractiveSamplingProbe
View orSamplingPorts(21 points)
(Cross Section As Viewed From Right Side)
Figure 8. CROSS-SECTIONAL VIEW OF THE GTI PORTABLE HIGH-TEMPERATURE BENCH-SCALE TEST FURNACE
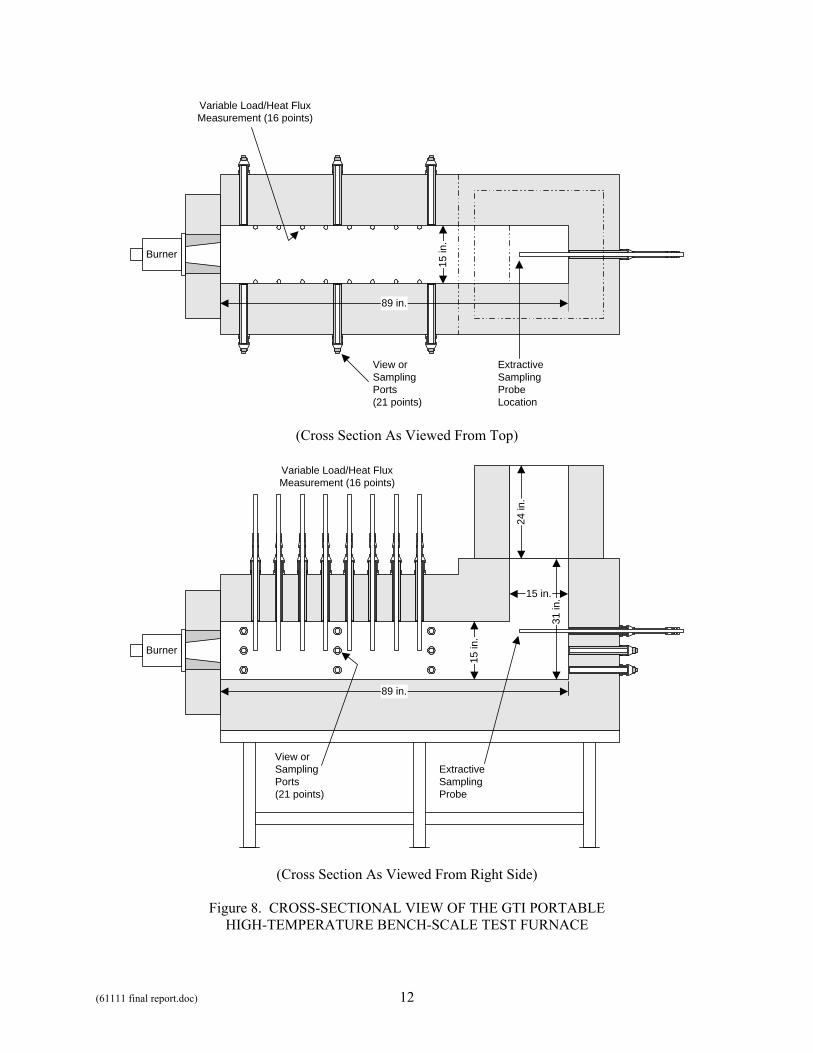
(61111 final report.doc) 13
Figure 9. OVERALL VIEW OF THE GTI’s PORTABLE HIGH-TEMPERATURE BENCH-SCALE TEST FURNACE INSTALLED AT EETC
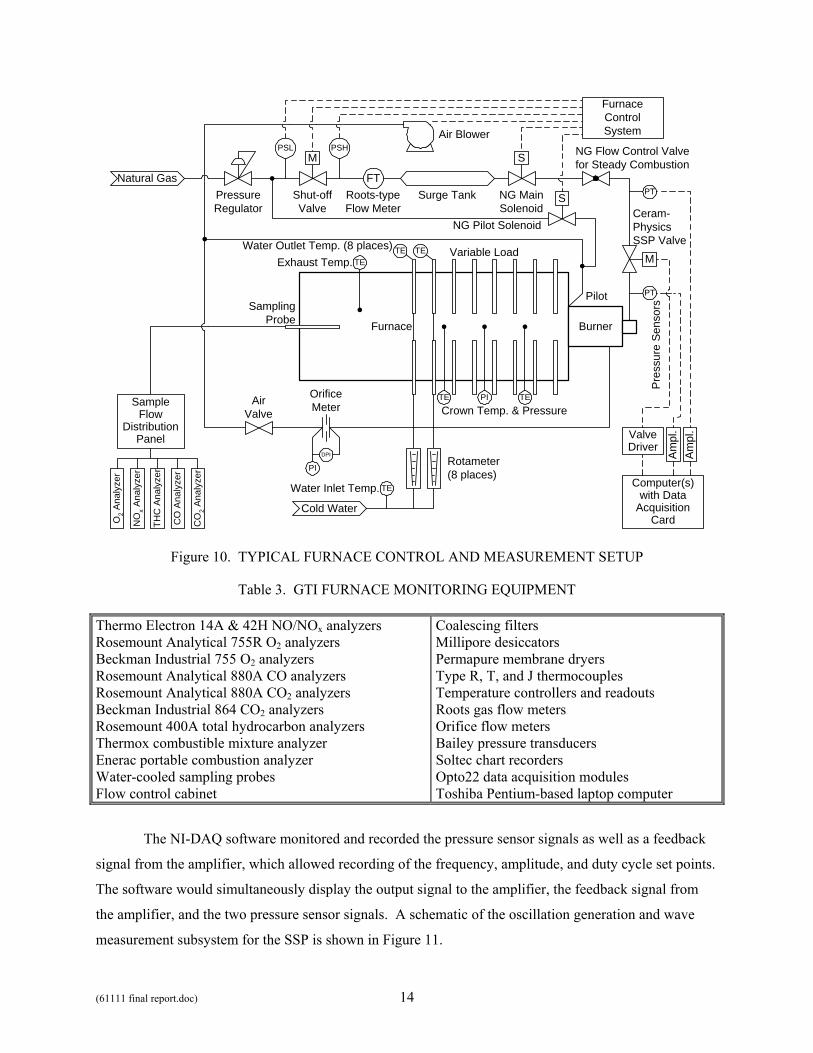
During the tests, the furnace was typically set up as shown in Figure 10. The furnace control
system provides for the ignition and flame safety monitoring of the combustion process. Fast (1 ms)
response pressure sensors (Omega PX236-005GV) were installed on the natural gas line downstream and
upstream of the oscillating valve to measure the squareness of the downstream flow pulses and the
amplitude of the upstream pressure pulses. A 4-inch diameter by 18-inch long surge tank installed axially
in the gas line helped to dampen these upstream pulses.
Burner testing in Task 1 and field testing in Tasks 2 and 4-6 used furnace monitoring equipment
from GTI’s Combustion Laboratory. The relevant equipment is listed in Table 3.
Early burner tests during Task 1 used an 80286-based computer (Bentley 286) with a data
acquisition card (National Instruments PCLab 128) to control the oscillating valve and occasionally to
record the pressure sensor readings. The software (NI-DAQ) that came with the card controlled the
frequency, amplitude, and duty cycle. A custom-built valve driver (amplifier), made with off-the-shelf
parts (including an Apex µtech PA236 op amp and a Sola SLS-24-024 power supply), converted the low
current 0-5 VDC signal from the data acquisition card to 0-24 VDC signal needed by the valve with up to
2 amps of current. The amplifier could be set up in a constant voltage or a constant current mode. Signal
converters (Dwyer/Love Iso-Verter II Model 4380) transformed the 0-50 mVDC signals from the
pressure sensors into 0-5 VDC signals for input to the data acquisition card.
(61111 final report.doc) 14
Furnace Burner
Natural Gas
AirValve
OrificeMeter
PressureRegulator
Shut-offValve
Air Blower
Ceram-PhysicsSSP Valve
NG MainSolenoid
NG Pilot Solenoid
Computer(s)with Data
AcquisitionCard
SamplingProbe
PT
PT
S
M S
Pilot
FTRoots-typeFlow Meter
NG Flow Control Valvefor Steady Combustion
SampleFlow
DistributionPanel
Surge Tank
FurnaceControlSystem
PSHPSL
TE
PITE TE
Variable Load
Crown Temp. & Pressure
O2 A
naly
zer
NO
x Ana
lyze
r
CO
2 Ana
lyze
r
CO
Ana
lyze
r
THC
Ana
lyze
r PI
DPI
Pres
sure
Sen
sors
ValveDriver
M
Cold Water
Rotameter(8 places)
TEWater Outlet Temp. (8 places)Exhaust Temp.
Ampl
.Am
pl.
TEWater Inlet Temp.
TE
Figure 10. TYPICAL FURNACE CONTROL AND MEASUREMENT SETUP
Table 3. GTI FURNACE MONITORING EQUIPMENT
Thermo Electron 14A & 42H NO/NOx analyzers Rosemount Analytical 755R O2 analyzers Beckman Industrial 755 O2 analyzers Rosemount Analytical 880A CO analyzers Rosemount Analytical 880A CO2 analyzers Beckman Industrial 864 CO2 analyzers Rosemount 400A total hydrocarbon analyzers Thermox combustible mixture analyzer Enerac portable combustion analyzer Water-cooled sampling probes Flow control cabinet
Coalescing filters Millipore desiccators Permapure membrane dryers Type R, T, and J thermocouples Temperature controllers and readouts Roots gas flow meters Orifice flow meters Bailey pressure transducers Soltec chart recorders Opto22 data acquisition modules Toshiba Pentium-based laptop computer
The NI-DAQ software monitored and recorded the pressure sensor signals as well as a feedback
signal from the amplifier, which allowed recording of the frequency, amplitude, and duty cycle set points.
The software would simultaneously display the output signal to the amplifier, the feedback signal from
the amplifier, and the two pressure sensor signals. A schematic of the oscillation generation and wave
measurement subsystem for the SSP is shown in Figure 11.

(61111 final report.doc) 15
Computer
4.7:1 VoltageAmplifier
4.7:1 Divider
CPIValve
PressureSensor
BurnerDisplay: Signal to Valve,
Amplified Signal,Pressure Sensor Signal
Data AcquisitionCard
Out0
In0
In1
In2
GasSupply
Input: Frequency, OffsetAmplitude, Duty Cycle
24 VDCSupply
10 VDCSupply
Figure 11. OSCILLATION GENERATION AND WAVE MEASUREMENT SUBSYSTEM FOR THE SSP VALVE
After misconnection of wires between the data acquisition card and the 24-volt DC power supply
(more specifically, the 110-VAC input side of the 24-volt DC power supply) led to a failure of the card, a
function generator was procured to generate the 0-5 VDC signals being sent to the amplifier. While the
function generator provided the range of frequencies, amplitudes, and duty cycles needed, the analog
knobs of function generator could in no way match the 12-bit (1 part in 4096 (software limited to 1 part in
500)) digital resolution of the data acquisition card. Therefore, a more precise way of setting the
oscillation parameters was sought, which led to the development of a new computer-based valve
controller. This is described in detail in Task 7.
When the data acquisition card and 80286-based computer was replaced by the function generator
and later by the computer-based valve controller, the monitoring of the pressure sensors was then handled
by a DataQ portable data acquisition unit connected to a 80486-based computer (Gateway 4DX2/50).
Laboratory tests of oxy-gas oscillating combustion performed by Air Liquide (AL) were
conducted on AL’s 600 kW (2 MMBtu/h) test furnace (see Figure 12) in its Chicago Research Center
located in Countryside, IL, about 8 miles from GTI’s Energy Development Center and about 19 miles
from GTI’s Des Plaines, IL, headquarters. The internal dimensions of this furnace are 1 m x 1 m x 4 m
(width x height x length). The furnace is equipped with a water-cooled load, 2900°F insulation, mass
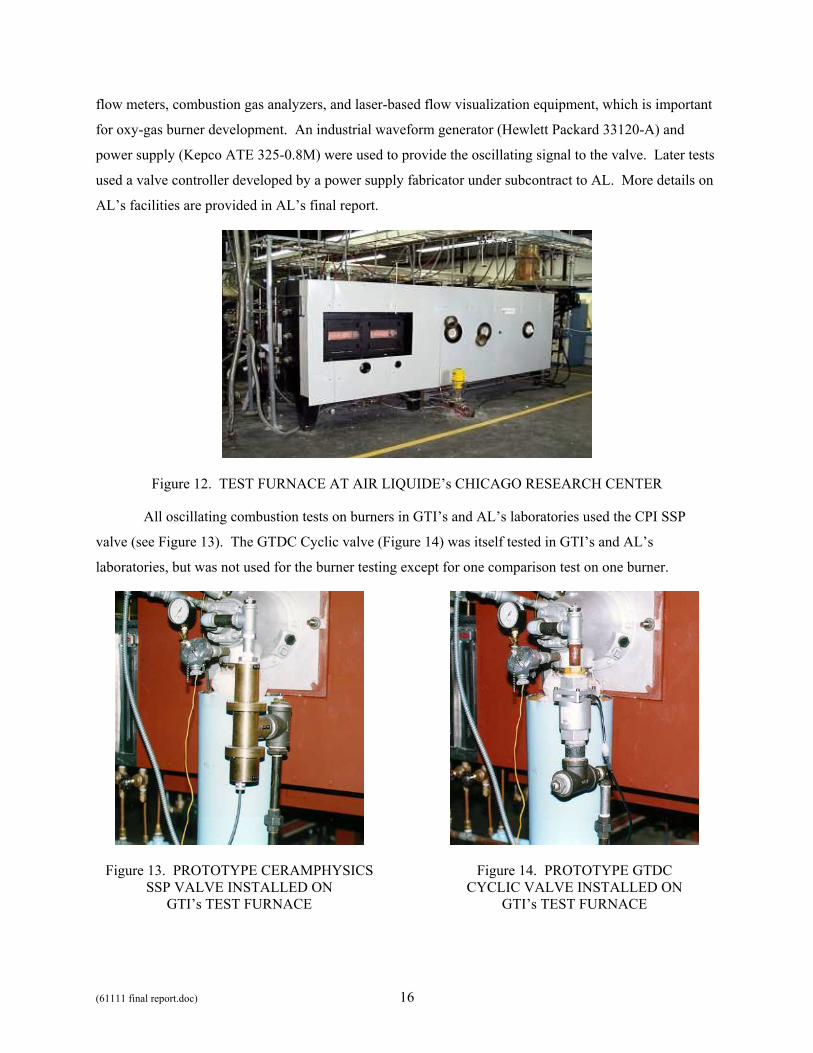
(61111 final report.doc) 16
flow meters, combustion gas analyzers, and laser-based flow visualization equipment, which is important
for oxy-gas burner development. An industrial waveform generator (Hewlett Packard 33120-A) and
power supply (Kepco ATE 325-0.8M) were used to provide the oscillating signal to the valve. Later tests
used a valve controller developed by a power supply fabricator under subcontract to AL. More details on
AL’s facilities are provided in AL’s final report.
Figure 12. TEST FURNACE AT AIR LIQUIDE’s CHICAGO RESEARCH CENTER
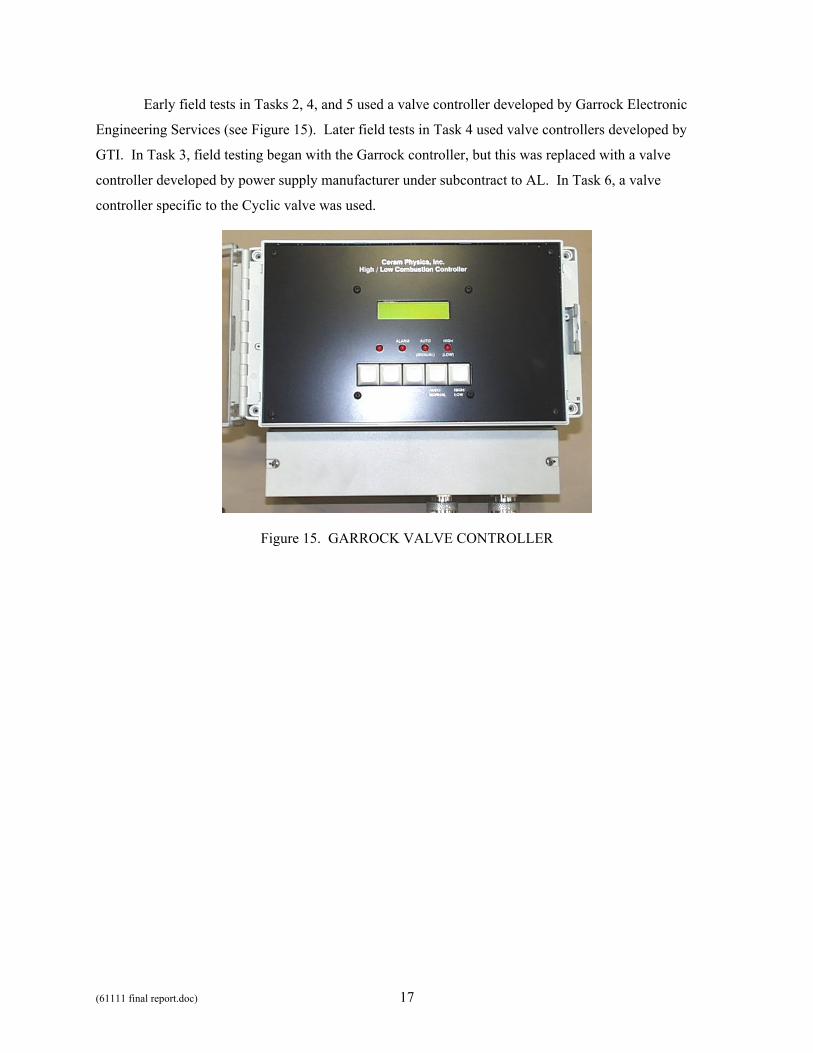
All oscillating combustion tests on burners in GTI’s and AL’s laboratories used the CPI SSP
valve (see Figure 13). The GTDC Cyclic valve (Figure 14) was itself tested in GTI’s and AL’s
laboratories, but was not used for the burner testing except for one comparison test on one burner.
Figure 13. PROTOTYPE CERAMPHYSICS SSP VALVE INSTALLED ON
GTI’s TEST FURNACE
Figure 14. PROTOTYPE GTDC CYCLIC VALVE INSTALLED ON
GTI’s TEST FURNACE
(61111 final report.doc) 17
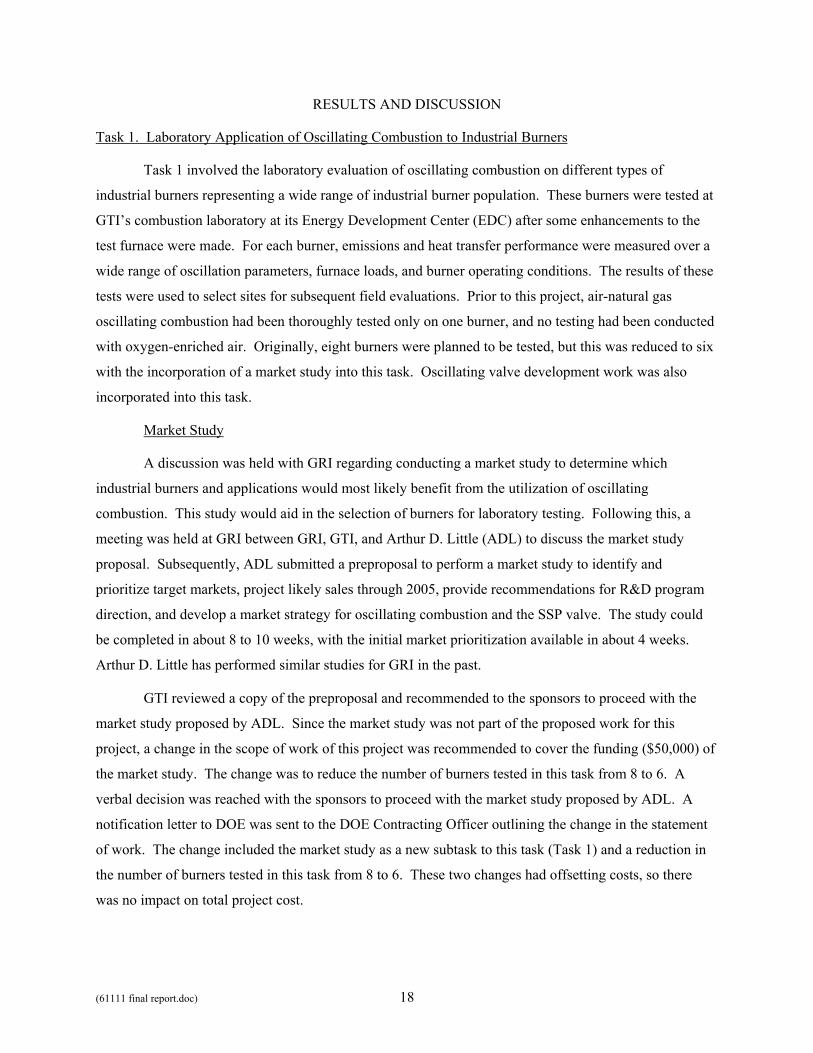
Early field tests in Tasks 2, 4, and 5 used a valve controller developed by Garrock Electronic
Engineering Services (see Figure 15). Later field tests in Task 4 used valve controllers developed by
GTI. In Task 3, field testing began with the Garrock controller, but this was replaced with a valve
controller developed by power supply manufacturer under subcontract to AL. In Task 6, a valve
controller specific to the Cyclic valve was used.
Figure 15. GARROCK VALVE CONTROLLER
(61111 final report.doc) 18
RESULTS AND DISCUSSION
Task 1. Laboratory Application of Oscillating Combustion to Industrial Burners
Task 1 involved the laboratory evaluation of oscillating combustion on different types of
industrial burners representing a wide range of industrial burner population. These burners were tested at
GTI’s combustion laboratory at its Energy Development Center (EDC) after some enhancements to the
test furnace were made. For each burner, emissions and heat transfer performance were measured over a
wide range of oscillation parameters, furnace loads, and burner operating conditions. The results of these
tests were used to select sites for subsequent field evaluations. Prior to this project, air-natural gas
oscillating combustion had been thoroughly tested only on one burner, and no testing had been conducted
with oxygen-enriched air. Originally, eight burners were planned to be tested, but this was reduced to six
with the incorporation of a market study into this task. Oscillating valve development work was also
incorporated into this task.
Market Study
A discussion was held with GRI regarding conducting a market study to determine which
industrial burners and applications would most likely benefit from the utilization of oscillating
combustion. This study would aid in the selection of burners for laboratory testing. Following this, a
meeting was held at GRI between GRI, GTI, and Arthur D. Little (ADL) to discuss the market study
proposal. Subsequently, ADL submitted a preproposal to perform a market study to identify and
prioritize target markets, project likely sales through 2005, provide recommendations for R&D program
direction, and develop a market strategy for oscillating combustion and the SSP valve. The study could
be completed in about 8 to 10 weeks, with the initial market prioritization available in about 4 weeks.
Arthur D. Little has performed similar studies for GRI in the past.
GTI reviewed a copy of the preproposal and recommended to the sponsors to proceed with the
market study proposed by ADL. Since the market study was not part of the proposed work for this
project, a change in the scope of work of this project was recommended to cover the funding ($50,000) of
the market study. The change was to reduce the number of burners tested in this task from 8 to 6. A
verbal decision was reached with the sponsors to proceed with the market study proposed by ADL. A
notification letter to DOE was sent to the DOE Contracting Officer outlining the change in the statement
of work. The change included the market study as a new subtask to this task (Task 1) and a reduction in
the number of burners tested in this task from 8 to 6. These two changes had offsetting costs, so there
was no impact on total project cost.
(61111 final report.doc) 19
The final proposal for the market study was received from ADL and a subcontract for it was
forwarded to ADL. The subcontract was subsequently executed. A conference call was held with ADL
to discuss technical aspects of the oscillating combustion process. Topics included expected NOx
emission reduction and heat transfer increase; process and valve noise; applicable burner and furnace
types; scalability of the process and the valve; and hardware and installation costs. ADL then sent GTI a
draft of the description and form for their market survey.
The baseline technical performance description and market prioritization criteria form to be used
in ADL’s market survey was reviewed by GTI. GTI’s comments and recommended changes were
compiled and forwarded to ADL.
A market prioritization was completed by ADL. Thirteen markets were considered. The top four
markets in terms of likelihood of success and market attractiveness were glass furnaces, steel furnaces,
metal melting furnaces, and clay and brick furnaces (see Figure 16). Markets that ranked lower, relative
to the top four markets, included heat treating furnaces, rotary kilns, petroleum and process heaters, and
commercial and industrial boilers.
A questionnaire and interviewee list was prepared by ADL for the industry interviews. These
documents were reviewed by GTI, and comments sent to ADL. After revising their questionnaire, ADL
conducted interviews with the manufacturers and end users and projected sales in the top three markets
identified by the market prioritization. ADL then submitted an initial draft report, which GTI reviewed
and returned for some revisions. A second draft was then submitted and sent out for review to the other
oscillating combustion project participants. A final version of the market study report was subsequently
submitted and distributed to the oscillating combustion sponsors and team members. The main findings
of the report are illustrated in Figure 16,
Table 4, and
Table 5.
Test Facility Enhancement
Most of the burners tested at GTI were tested on GTI’s high-temperature test furnace (see Figure
7 and Figure 8). Prior to testing the first burner during this project, the front wall of the test furnace was
modified to accommodate the various burner block sizes. In addition, the stainless-steel chimney section
was replaced with a refractory-lined version. These modifications allowed testing of burners at 500,000
Btu/h, up from the 250,000 Btu/h rate used during the prior project (Phase I)4.

(61111 final report.doc) 20
HeatTreatingFurnaces
Rotary Kilns
FiretubeBoilers
CommercialBoilers
Chemical &PetroleumProcessHeaters
WT: 50-250MMBth/h
WT: >250MMBtu/h
WT: <50 MMBtu/h
Clay & BrickFurnaces
Metals MeltingFurnaces
GlassFurnaces
SteelFurnaces
Low
High
Low HighPotential for Success
Mar
ket A
ttrac
tiven
ess
Figure 16. MARKET PRIORITIZATION RESULTS
Table 4. MARKET DRIVERS IDENTIFIED
• Productivity improvements and energy savings • Payback period of 1-3 years • Valves in sizes of 1,000-50,000 SCF/h • NOx reduction only in certain regions
Table 5. MARKET IMPACT
Year Oscillating Combustion Annual Gas Consumption (BCF) 2000 2002 2004
Glass Melting 0.36 3.04 8.17
Steel Reheat 0.13 1.14 3.11
Non-ferrous Melting 0.04 0.31 0.85
App
licat
ion
Total 0.53 4.5 12.1
(61111 final report.doc) 21
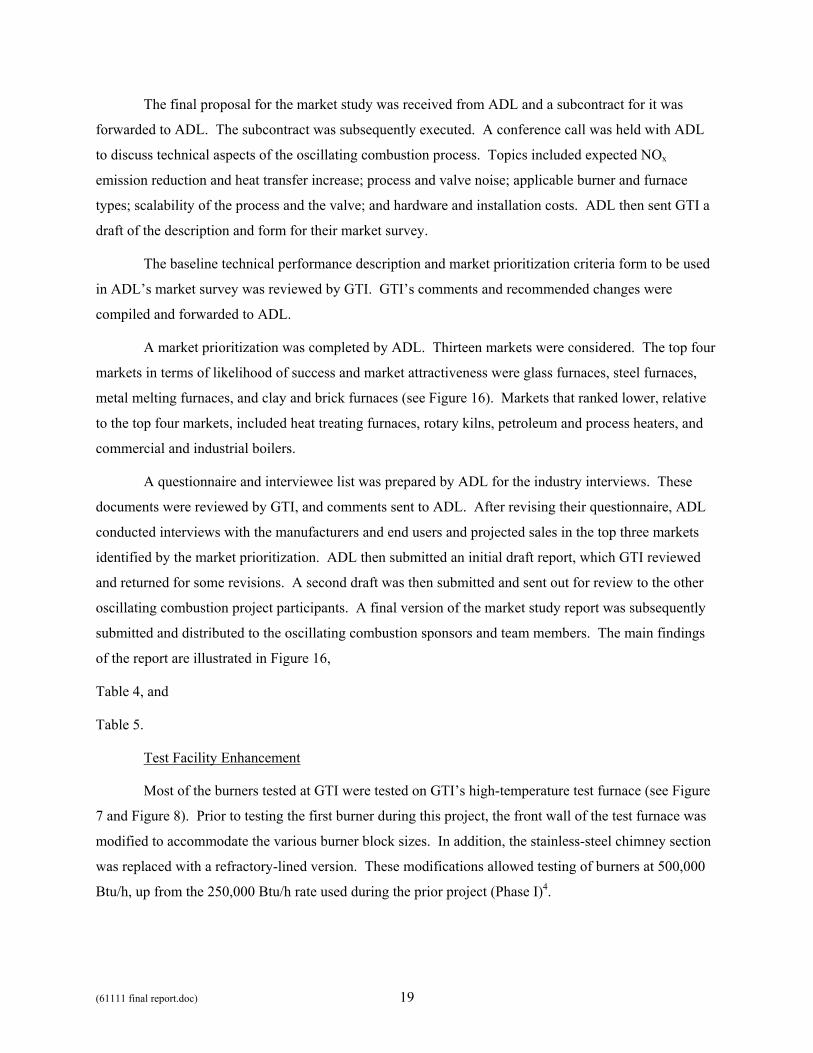
Valve Development
CeramPhysics SSP Valve
With the furnace now capable of handling larger burners, a larger oscillating valve than the 250-
SCF/h capacity CeramPhysics model 5 SSP valve used in the prior project was needed. Therefore
CeramPhysics, Inc. (CPI) was subcontracted5 to fabricate two larger SSP valves, 500-SCF/h and 750-
SCF/h. These valves were of the newer Model 7 design (see Figure 17). When compared to the model 5
valve, the model 7 valve offered not only larger capacity but also adjustability without disassembly.
Figure 17. CERAMPHYSICS MODEL 7 SSP VALVE DESIGN
The subcontract with CPI also called for the fabrication of SSP valves for field test applications,
which were of the Model 7 design, but with capacities up to 1,500 SCF/h. In addition, the subcontract
effort included an updating of the valve controller (see Figure 18) developed by Garrock Electronic
Engineering Services5. This controller was for some of the field testing during Tasks 2, 4, and 5.
All above capacities are average flow rate when oscillating at 100% amplitude (i.e., one-half of
the full open flow) at 1.5 psi (42 in wc) pressure drop across the valve at full open flow. Unless otherwise
indicated, the 500-SCF/h SSP valve was used for the burner tests at GTI reported on below. This valve
had a more flexible amplitude range for firing both at the base condition of 500,000 Btu/h and at a lower
firing rate of 250,000 Btu/h than the SSP valve with the 750-SCF/h capacity. Sufficient pressure was
available in the gas supply line to the burner to flow 750 SCF/h through the 500-SCF/h valve when
needed.
Further details on the development of the SSP valve can be found in a previously-issued report5.

(61111 final report.doc) 22
Figure 18. CERAMPHYSICS MODEL 7 SSP VALVE AND GARROCK CONTROLLER
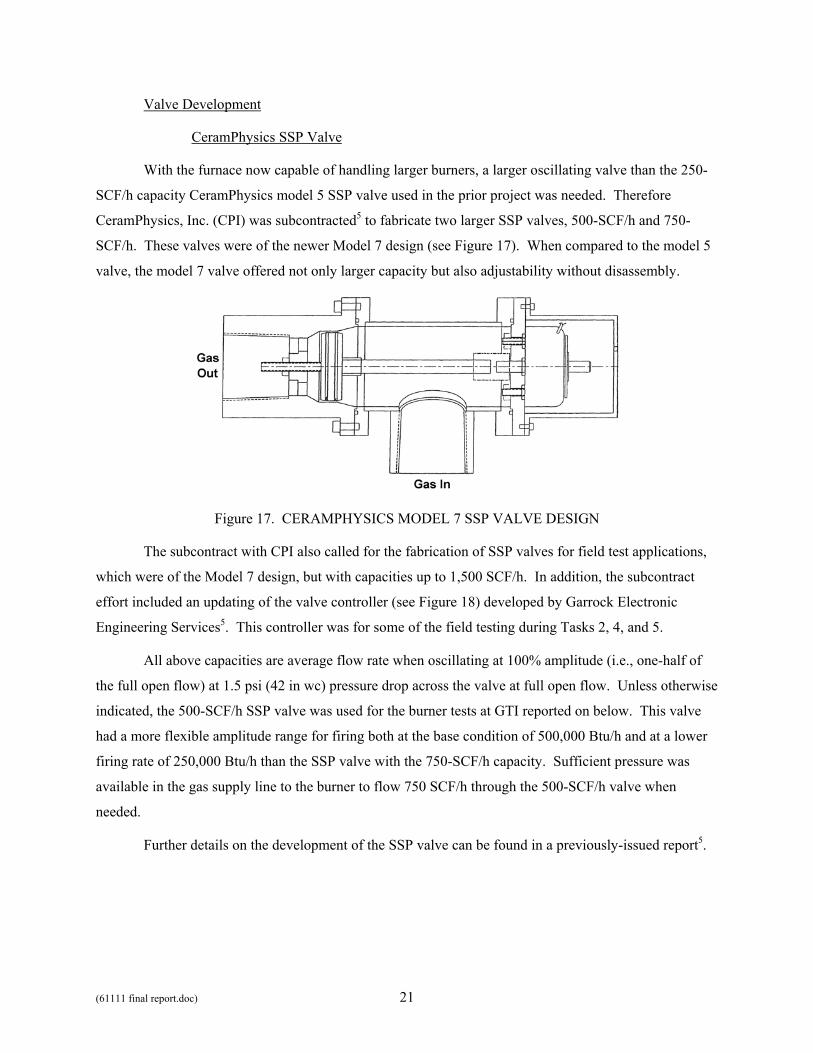
GT Development Cyclic Valve
After GT Development Corporation’s (GTDC’s) Cyclic valve concept was brought to GTI’s
attention, GTI procured from GTDC a prototype Cyclic valve and controller (see Figure 19). The
prototype valve had a capacity of 300-SCF/h (average flow when oscillating at 100% amplitude) at a 1-
psi pressure drop. Its continuously spinning rotor (see Figure 6) was driven by a stepper motor. The
prototype controller was basically an off-the-shelf stepper motor controller, which GTDC was using for
applications in their truck component business. This valve was tested at the same frequency and
amplitude as the CPI SSP valve on one of the burners undergoing oscillating combustion tests at GTI’s
combustion lab. The test results showed the Cyclic valve produced the same level of NOx emissions
reductions at the SSP valve.
During the Task 5 field test on the annealing furnace, a short demonstration of oscillating
combustion on a pair of burners on a reheat furnace at the 80" hot strip mill at Bethlehem Steel (not the
reheat furnace used for the field test in Task 6) was being considered. GTDC was subcontracted to
produce a pair of larger Cyclic valves and a valve controller (see Figure 20) capable of keeping the two
valves either in-sync or 180° out-of-sync for in-phase or out-of-phase oscillations, respectively. Each
valve had an oscillating flow capacity of 2,300-SCF/h, and used a continuously spinning rotor that was
driven by a stepper motor. An encoder was attached to each stepper motor so that the angular position of
each valve’s rotor could be monitored by the valve controller. This allowed the valve controller to keep
the valves in-sync (or 180° out-of-sync) and also to alert the operator should one of both rotors stop
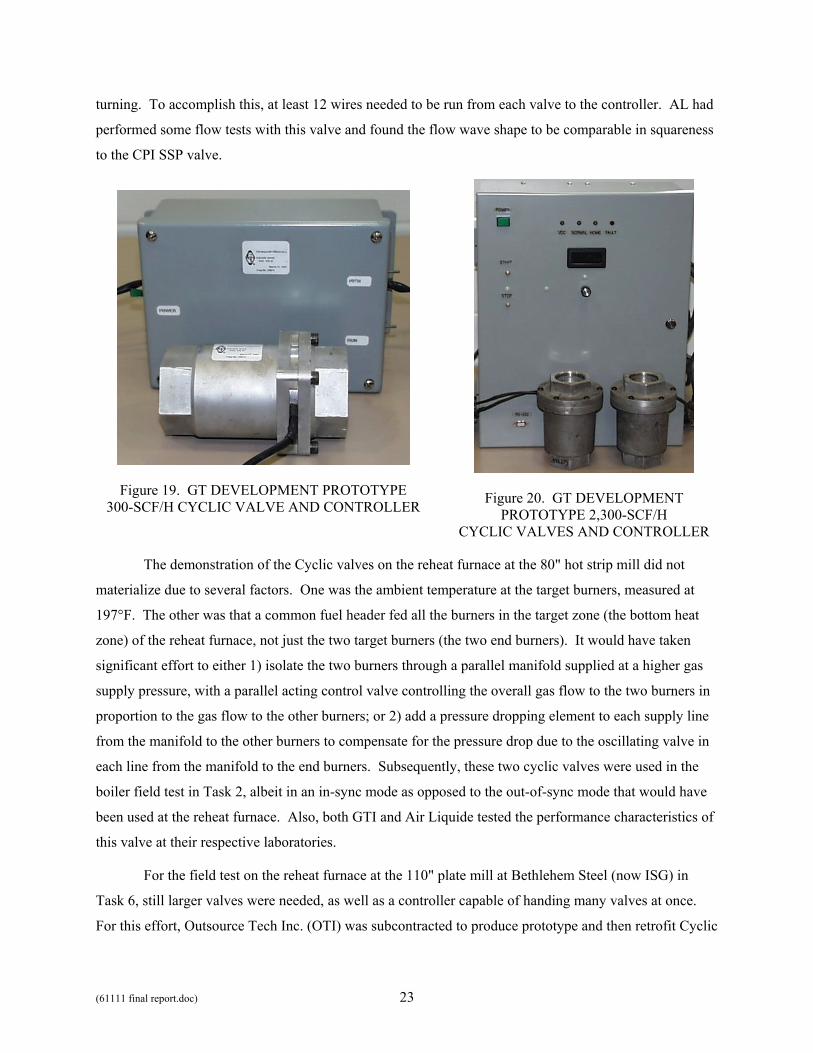
(61111 final report.doc) 23
turning. To accomplish this, at least 12 wires needed to be run from each valve to the controller. AL had
performed some flow tests with this valve and found the flow wave shape to be comparable in squareness
to the CPI SSP valve.
Figure 19. GT DEVELOPMENT PROTOTYPE 300-SCF/H CYCLIC VALVE AND CONTROLLER
Figure 20. GT DEVELOPMENT PROTOTYPE 2,300-SCF/H
CYCLIC VALVES AND CONTROLLER
The demonstration of the Cyclic valves on the reheat furnace at the 80" hot strip mill did not
materialize due to several factors. One was the ambient temperature at the target burners, measured at
197°F. The other was that a common fuel header fed all the burners in the target zone (the bottom heat
zone) of the reheat furnace, not just the two target burners (the two end burners). It would have taken
significant effort to either 1) isolate the two burners through a parallel manifold supplied at a higher gas
supply pressure, with a parallel acting control valve controlling the overall gas flow to the two burners in
proportion to the gas flow to the other burners; or 2) add a pressure dropping element to each supply line
from the manifold to the other burners to compensate for the pressure drop due to the oscillating valve in
each line from the manifold to the end burners. Subsequently, these two cyclic valves were used in the
boiler field test in Task 2, albeit in an in-sync mode as opposed to the out-of-sync mode that would have
been used at the reheat furnace. Also, both GTI and Air Liquide tested the performance characteristics of
this valve at their respective laboratories.
For the field test on the reheat furnace at the 110" plate mill at Bethlehem Steel (now ISG) in
Task 6, still larger valves were needed, as well as a controller capable of handing many valves at once.
For this effort, Outsource Tech Inc. (OTI) was subcontracted to produce prototype and then retrofit Cyclic
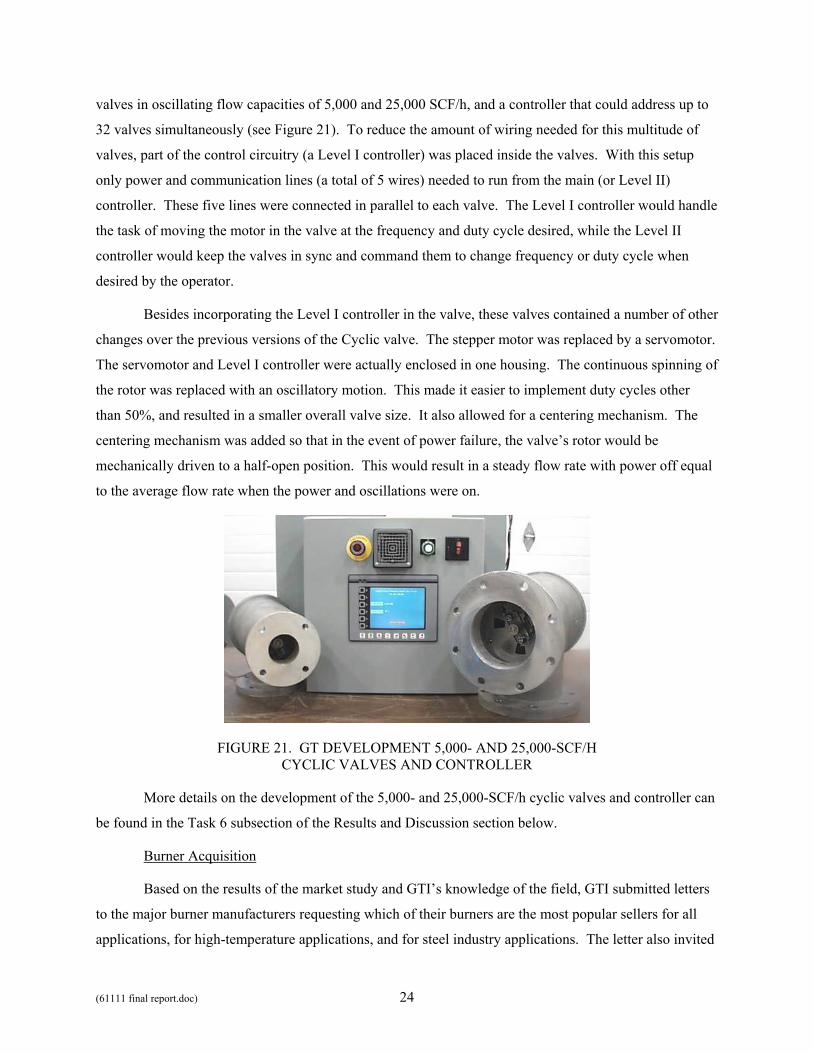
(61111 final report.doc) 24
valves in oscillating flow capacities of 5,000 and 25,000 SCF/h, and a controller that could address up to
32 valves simultaneously (see Figure 21). To reduce the amount of wiring needed for this multitude of
valves, part of the control circuitry (a Level I controller) was placed inside the valves. With this setup
only power and communication lines (a total of 5 wires) needed to run from the main (or Level II)
controller. These five lines were connected in parallel to each valve. The Level I controller would handle
the task of moving the motor in the valve at the frequency and duty cycle desired, while the Level II
controller would keep the valves in sync and command them to change frequency or duty cycle when
desired by the operator.
Besides incorporating the Level I controller in the valve, these valves contained a number of other
changes over the previous versions of the Cyclic valve. The stepper motor was replaced by a servomotor.
The servomotor and Level I controller were actually enclosed in one housing. The continuous spinning of
the rotor was replaced with an oscillatory motion. This made it easier to implement duty cycles other
than 50%, and resulted in a smaller overall valve size. It also allowed for a centering mechanism. The
centering mechanism was added so that in the event of power failure, the valve’s rotor would be
mechanically driven to a half-open position. This would result in a steady flow rate with power off equal
to the average flow rate when the power and oscillations were on.
FIGURE 21. GT DEVELOPMENT 5,000- AND 25,000-SCF/H CYCLIC VALVES AND CONTROLLER
More details on the development of the 5,000- and 25,000-SCF/h cyclic valves and controller can
be found in the Task 6 subsection of the Results and Discussion section below.
Burner Acquisition
Based on the results of the market study and GTI’s knowledge of the field, GTI submitted letters
to the major burner manufacturers requesting which of their burners are the most popular sellers for all
applications, for high-temperature applications, and for steel industry applications. The letter also invited

(61111 final report.doc) 25
their participation in the oscillating combustion program by inquiring if they could supply a burner for the
laboratory testing. Four companies--Bloom Engineering, Kromschroder, Eclipse Combustion, and North
American Manufacturing Company--responded and supplied burners for testing. Two other companies
indicated that they did not want to participate.
Bloom supplied a baffle burner, which is used in steel reheat furnace applications. North
American supplied their Tempest burner, a high velocity nozzle-mixed burner used in tunnel kilns,
forging furnaces, and other heating and drying applications. Eclipse and Kromschroder both supplied
high-momentum burners, which have applications similar to those of the North American burner. Later
on in the project, Zedtec (Dyson Hotwork) supplied a regenerative burner. This type of burner is used in
forging furnaces.
GTI purchased a couple of additional burners. A flat flame burner was purchased from North
American for comparison of laboratory test results with field test results on the annealing furnace in
Task 5. An inspirated burner was purchased from Hauck. This type of burner is used in radiant tubes.
GTI had on-hand a partial-premixed radiant tube burner from North American. Other burners considered
for laboratory testing were a swirl type used for boilers, a fully premixed type used for forehearths of
glass melters, a gas injection type used for the main chamber of glass melters, a natural draft type used for
process heater applications and a rotary kiln burner. The boiler burner became the subject of a field test
in Task 2, while the other burners could have been tested in the laboratory had the opportunity for a field
test involving that type of burner been available. One additional burner, a North American refractory-
lined burner, was tested in Task 6 to support the field test in that Task, but this activity is beyond the
scope of this report.
Air Liquide tested oscillating combustion on its ALGLASS oxy-gas burner and on a Bloom baffle
burner using oxygen-enriched air.
Burner Tests
For each burner tested on the high-temperature furnace in its combustion lab, GTI used the
following procedure:
• Collect baseline emissions and heat transfer data while varying one or more of the following operating parameters: excess air level, firing rate, furnace load, air preheat level (if applicable), and oxygen enrichment level (if applicable)
• Select one or more sets of operating parameters to conduct oscillating combustion tests on
• Collect emissions and heat transfer data while varying one or more of the following oscillating combustion parameters: frequency, amplitude, and duty cycle (see Table 1)
(61111 final report.doc) 26
• Determine the combination of oscillating combustion parameters that maximize heat transfer increase and/or NOx reduction by reviewing data and/or running additional tests
In addition to establishing a set of operational parameters for the subsequent oscillating combustion tests,
the baseline tests also allowed GTI to assess, and to get an overall feel for, the operation of the burner. A
fourth oscillation parameter was phasing between burners (see Table 1), which could not be tested on
GTI’s furnace since it can have only one burner installed. This parameter was to be varied only during
field testing.
During baseline tests, the excess air level was varied from very fuel-lean to very fuel-rich. This
was accomplished by either varying the air flow rate and/or the fuel flow rate. The purpose of this was to
gage the amount of oscillation amplitude needed for 50% NOx reduction.
Occasionally, depending on the burner tested, data was collected while varying an operating
parameter with a fixed set of oscillating combustion parameters. A list of the specific data collected is
shown in Table 6. For pilot-ignited burners, the pilot gas was turned off during baseline and oscillating
combustion tests, unless trying to match specific field conditions. The pilot air, and UV sensor cooling
air if used, were left on. Not all operating parameters were varied for all burners as some burners were
not designed for preheated and/or oxygen-enriched air.
Table 6. LIST OF PARAMETERS TO BE CONTROLLED AND MONITORED DURING BASELINE AND OSCILLATING COMBUSTION TESTING AT GTI
Controlled
Baseline Oscillating Combustion
Excess Air Level Firing Rate Furnace Load Air Preheat Level Oxygen Enrichment Level
Frequency Amplitude Duty Cycle
Monitored
Natural Gas Pressure, Temperature, and Flow Rate Combustion Air Pressure, Temperature, and Flow Rate Pilot Air Temperature and Flow Rate Oxygen Enrichment Level Exhaust Gas Composition (NOx, CO, THC, CO2, O2) Furnace Pressure Furnace Crown and Exhaust Temperatures Heat Transfer to Load Flame Length Barometric Pressure, Temperature, and Humidity
(61111 final report.doc) 27
Below is a presentation and discussion of results from testing oscillating combustion on each of
the different burners. They are listed in a more-or-less chronological order.
North American Evenglow Model 4725-3 Radiant Tube Burner
This was the first burner tested at GTI’s combustion laboratory under this project. A pair of these
burners were tested on radiant U-tubes installed in GTI’s Surface Combustion heat treating furnace. The
testing took place while the market study and modifications to the high-temperature test furnace were
underway. This appeared to be a good application for oscillating combustion since there are about
250,000 radiant U-tubes in operation in the United States, and field tests of oscillating combustion on a
Diamond Engineering radiant tube burner (see Task 2) were very encouraging.
These tests used the CPI model 5 SSP valve that was used during the prior project4, plus a second
CPI model 5 SSP valve that was acquired specifically for this test. An electronic switching circuit was
added to the existing valve controller to allow oscillating two valves simultaneously, but out-of-phase
with each other. Analytical instrumentation (continuous emission monitors) were moved from the high-
temperature, bench-scale test furnace to the heat treating furnace. The heat treat furnace had been used to
test ceramic radiant tubes.
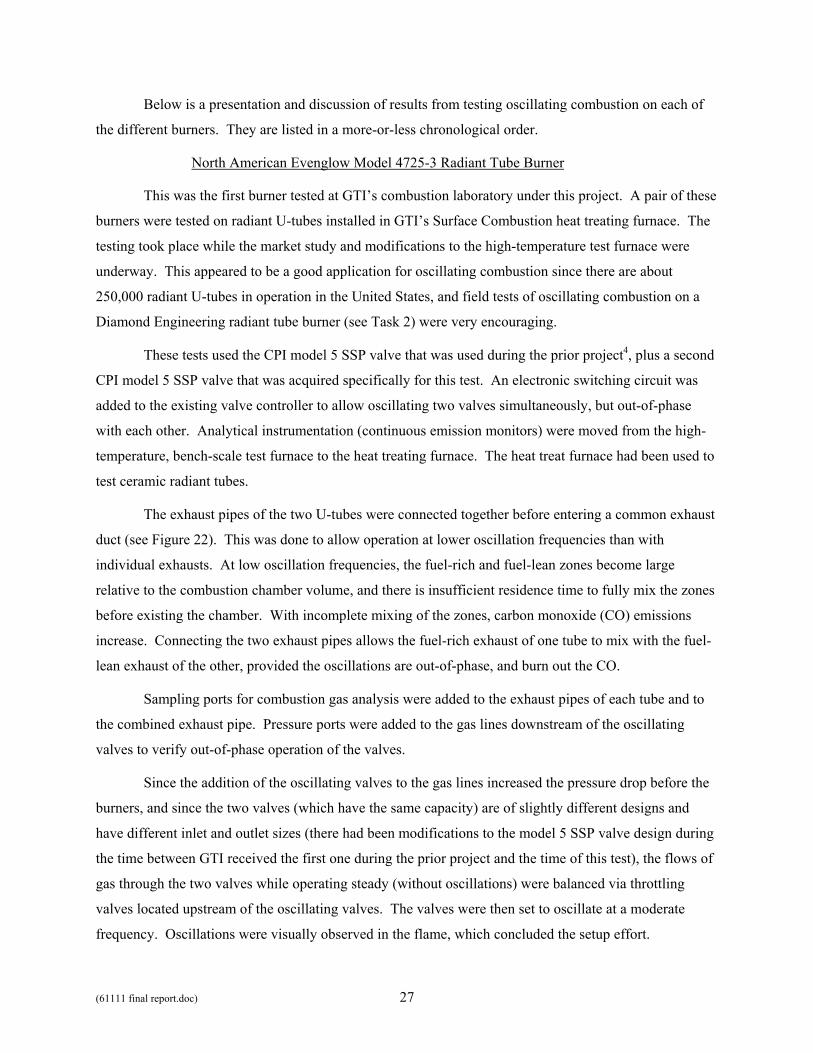
The exhaust pipes of the two U-tubes were connected together before entering a common exhaust
duct (see Figure 22). This was done to allow operation at lower oscillation frequencies than with
individual exhausts. At low oscillation frequencies, the fuel-rich and fuel-lean zones become large
relative to the combustion chamber volume, and there is insufficient residence time to fully mix the zones
before existing the chamber. With incomplete mixing of the zones, carbon monoxide (CO) emissions
increase. Connecting the two exhaust pipes allows the fuel-rich exhaust of one tube to mix with the fuel-
lean exhaust of the other, provided the oscillations are out-of-phase, and burn out the CO.
Sampling ports for combustion gas analysis were added to the exhaust pipes of each tube and to
the combined exhaust pipe. Pressure ports were added to the gas lines downstream of the oscillating
valves to verify out-of-phase operation of the valves.
Since the addition of the oscillating valves to the gas lines increased the pressure drop before the
burners, and since the two valves (which have the same capacity) are of slightly different designs and
have different inlet and outlet sizes (there had been modifications to the model 5 SSP valve design during
the time between GTI received the first one during the prior project and the time of this test), the flows of
gas through the two valves while operating steady (without oscillations) were balanced via throttling
valves located upstream of the oscillating valves. The valves were then set to oscillate at a moderate
frequency. Oscillations were visually observed in the flame, which concluded the setup effort.
(61111 final report.doc) 28
SSPV
Burner
SSPV
Burner
ExhuastDuct
ExhaustDuct
ValveControl
Equipment
Figure 22. TWO SOLID-STATE PROPORTIONING VALVES INSTALLED ON GTI’S HEAT TREATING FURNACE
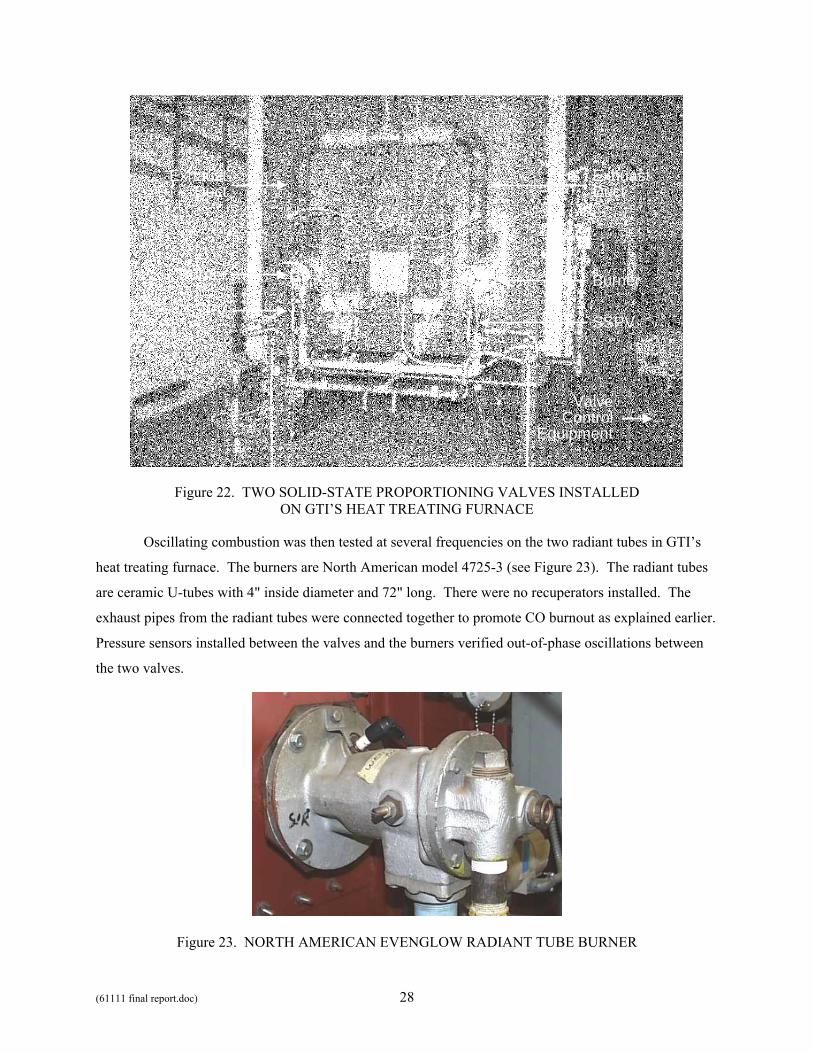
Oscillating combustion was then tested at several frequencies on the two radiant tubes in GTI’s
heat treating furnace. The burners are North American model 4725-3 (see Figure 23). The radiant tubes
are ceramic U-tubes with 4" inside diameter and 72" long. There were no recuperators installed. The
exhaust pipes from the radiant tubes were connected together to promote CO burnout as explained earlier.
Pressure sensors installed between the valves and the burners verified out-of-phase oscillations between
the two valves.
Figure 23. NORTH AMERICAN EVENGLOW RADIANT TUBE BURNER
(61111 final report.doc) 29
The burners were fired at 320,000 Btu/h each, with 3.0-3.5% oxygen in the exhaust. Baseline
(steady) conditions were 77 ppmv NOx and 16 ppmv CO. Oscillating combustion was initiated at 20 Hz
and was lowered in steps down to 2 Hz. At 5 Hz the oscillation in the flame was readily apparent.
Emission of NOx from one tube remained practically unchanged at any frequency, while emissions of CO
increased dramatically below 5 Hz. For the other tube, results were similar down to 5 Hz, but below
5 Hz, the flame became unstable, though NOx fell to 48 ppmv at 3 Hz, a 38% decrease from the baseline
condition. Below 3 Hz, the flame could not be maintained.
An investigation of the burner showed that it had a staged design, with about 30% of the
combustion air being mixed with the natural gas in a primary zone and the rest of the combustion being
sent further down the radiant tube to prolong the flame length. Most likely the oscillations only affected
the primary zone of the flame, which was already fuel-rich. Therefore, the oscillations were between
more fuel-rich and less fuel-rich in the primary zone and the net result was no decrease in NOx emission.
The short residence time in the tube exacerbated the CO emissions.
Tube temperature profile measurements were also made during the tests. The tube surface
temperature was monitored at 10 locations along the length of the tube and 4 locations around the
circumference of the tube. The difference between the highest and lowest temperature is used as a
measure of the (lack of) tube temperature uniformity. A comparison was made of tube temperature
uniformity during oscillating combustion with that during steady combustion. It was found that
oscillating combustion did not improve the tube temperature uniformity. It may take a redesigned burner
to properly utilize oscillating combustion for enhanced tube temperature uniformity and NOx reduction.
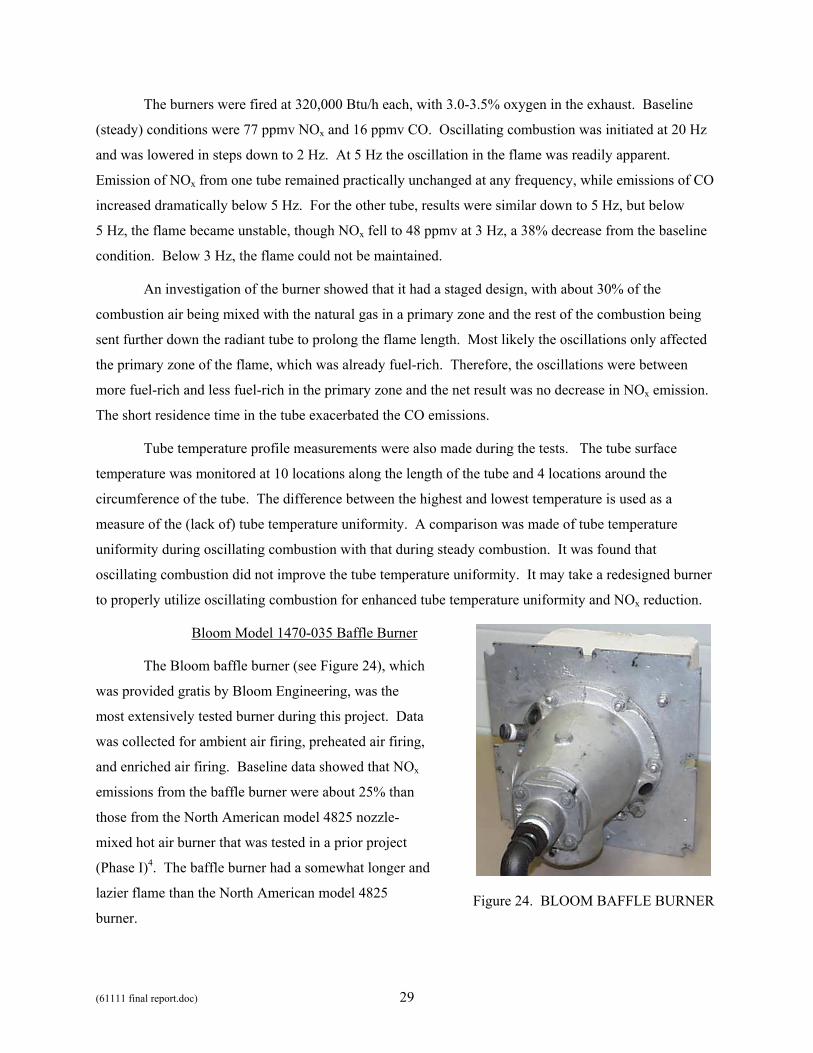
Bloom Model 1470-035 Baffle Burner
The Bloom baffle burner (see Figure 24), which
was provided gratis by Bloom Engineering, was the
most extensively tested burner during this project. Data
was collected for ambient air firing, preheated air firing,
and enriched air firing. Baseline data showed that NOx
emissions from the baffle burner were about 25% than
those from the North American model 4825 nozzle-
mixed hot air burner that was tested in a prior project
(Phase I)4. The baffle burner had a somewhat longer and
lazier flame than the North American model 4825
burner.
Figure 24. BLOOM BAFFLE BURNER
(61111 final report.doc) 30
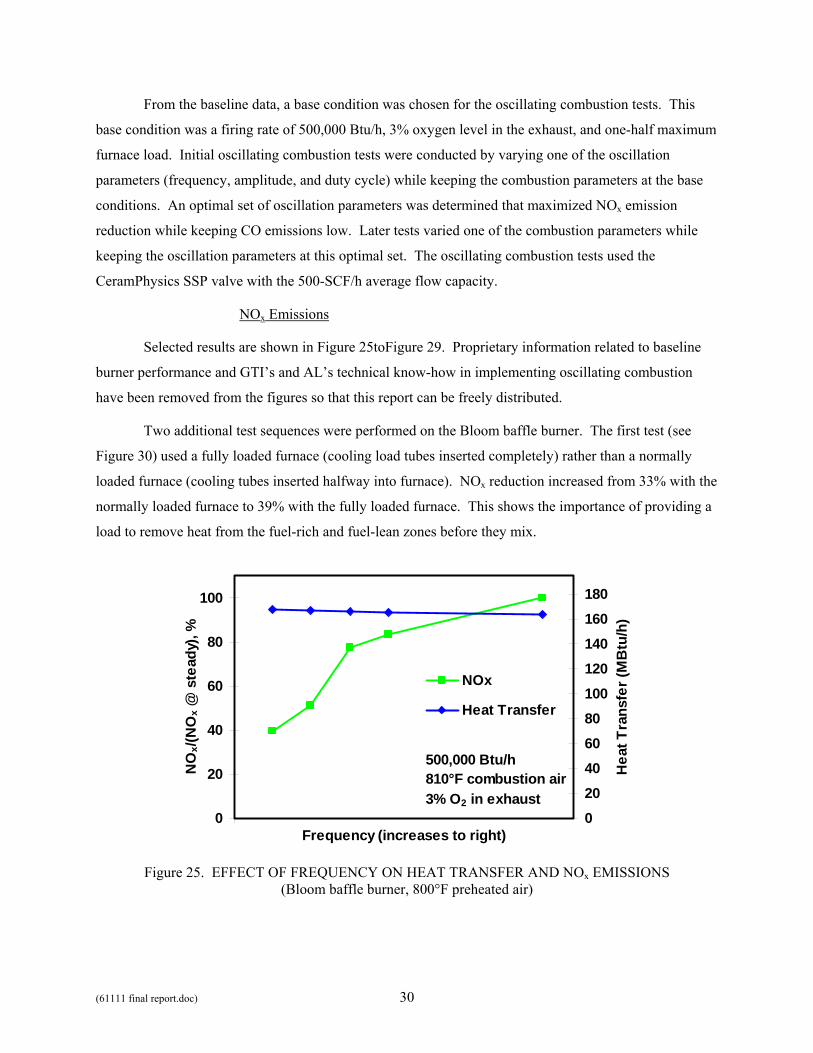
From the baseline data, a base condition was chosen for the oscillating combustion tests. This
base condition was a firing rate of 500,000 Btu/h, 3% oxygen level in the exhaust, and one-half maximum
furnace load. Initial oscillating combustion tests were conducted by varying one of the oscillation
parameters (frequency, amplitude, and duty cycle) while keeping the combustion parameters at the base
conditions. An optimal set of oscillation parameters was determined that maximized NOx emission
reduction while keeping CO emissions low. Later tests varied one of the combustion parameters while
keeping the oscillation parameters at this optimal set. The oscillating combustion tests used the
CeramPhysics SSP valve with the 500-SCF/h average flow capacity.
NOx Emissions
Selected results are shown in Figure 25toFigure 29. Proprietary information related to baseline
burner performance and GTI’s and AL’s technical know-how in implementing oscillating combustion
have been removed from the figures so that this report can be freely distributed.
Two additional test sequences were performed on the Bloom baffle burner. The first test (see
Figure 30) used a fully loaded furnace (cooling load tubes inserted completely) rather than a normally
loaded furnace (cooling tubes inserted halfway into furnace). NOx reduction increased from 33% with the
normally loaded furnace to 39% with the fully loaded furnace. This shows the importance of providing a
load to remove heat from the fuel-rich and fuel-lean zones before they mix.
0
20
40
60
80
100
Frequency (increases to right)
NO
x/(N
Ox @
ste
ady)
, %
0
20
40
60
80
100
120
140
160
180
Hea
t Tra
nsfe
r (M
Btu
/h)
NOx
Heat Transfer
500,000 Btu/h810°F combustion air3% O2 in exhaust
Figure 25. EFFECT OF FREQUENCY ON HEAT TRANSFER AND NOx EMISSIONS
(Bloom baffle burner, 800°F preheated air)
(61111 final report.doc) 31
0
20
40
60
80
100
Amplitude (increases to right)
NO
x/(N
Ox
@ S
tead
y), %
0
20
40
60
80
100
120
140
Hea
t Tra
nsfe
r, M
Btu
/h
NOxHeat Transfer
500,000 Btu/hAmbient air3% O2 in exhaust
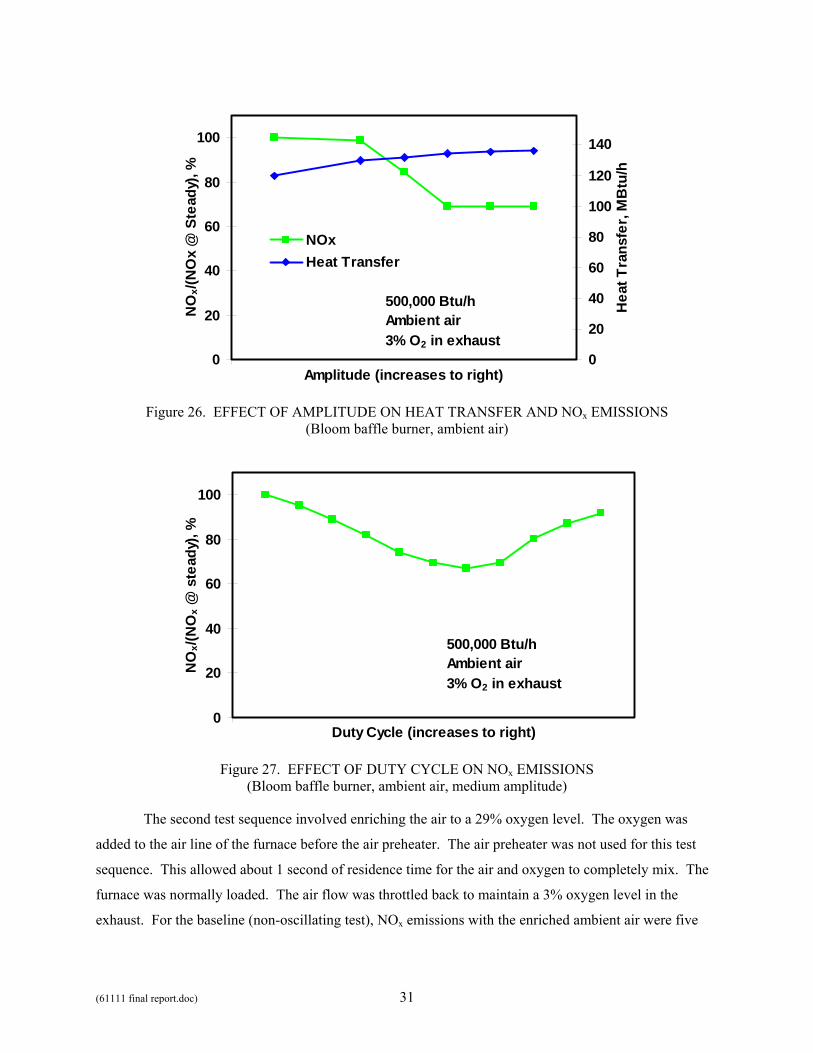
Figure 26. EFFECT OF AMPLITUDE ON HEAT TRANSFER AND NOx EMISSIONS
(Bloom baffle burner, ambient air)
0
20
40
60
80
100
Duty Cycle (increases to right)
NO
x/(N
Ox @
ste
ady)
, %
500,000 Btu/hAmbient air3% O2 in exhaust
Figure 27. EFFECT OF DUTY CYCLE ON NOx EMISSIONS
(Bloom baffle burner, ambient air, medium amplitude)
The second test sequence involved enriching the air to a 29% oxygen level. The oxygen was
added to the air line of the furnace before the air preheater. The air preheater was not used for this test
sequence. This allowed about 1 second of residence time for the air and oxygen to completely mix. The
furnace was normally loaded. The air flow was throttled back to maintain a 3% oxygen level in the
exhaust. For the baseline (non-oscillating test), NOx emissions with the enriched ambient air were five
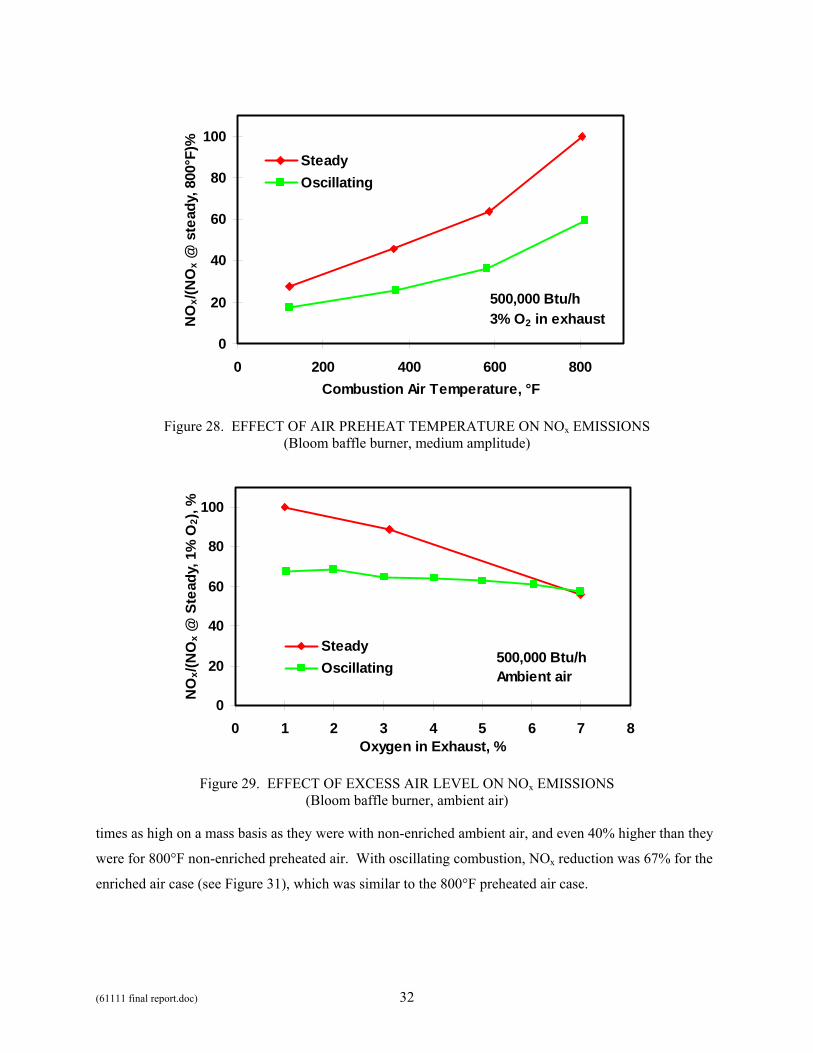
(61111 final report.doc) 32
0
20
40
60
80
100
0 200 400 600 800Combustion Air Temperature, °F
NO
x/(N
Ox @
ste
ady,
800
°F)%
SteadyOscillating
500,000 Btu/h3% O2 in exhaust
Figure 28. EFFECT OF AIR PREHEAT TEMPERATURE ON NOx EMISSIONS
(Bloom baffle burner, medium amplitude)
0
20
40
60
80
100
0 1 2 3 4 5 6 7 8Oxygen in Exhaust, %
NO
x/(N
Ox @
Ste
ady,
1%
O2)
, %
SteadyOscillating
500,000 Btu/hAmbient air
Figure 29. EFFECT OF EXCESS AIR LEVEL ON NOx EMISSIONS
(Bloom baffle burner, ambient air)
times as high on a mass basis as they were with non-enriched ambient air, and even 40% higher than they
were for 800°F non-enriched preheated air. With oscillating combustion, NOx reduction was 67% for the
enriched air case (see Figure 31), which was similar to the 800°F preheated air case.
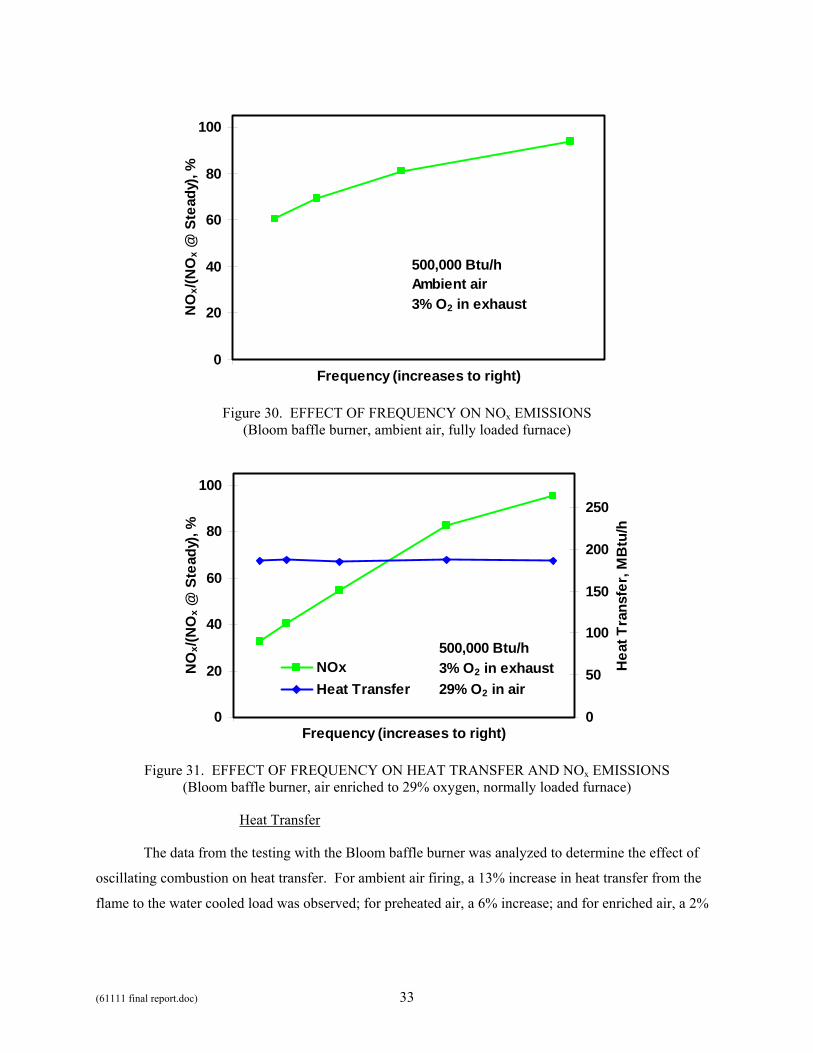
(61111 final report.doc) 33
0
20
40
60
80
100
Frequency (increases to right)
NO
x/(N
Ox @
Ste
ady)
, %
500,000 Btu/hAmbient air3% O2 in exhaust
Figure 30. EFFECT OF FREQUENCY ON NOx EMISSIONS
(Bloom baffle burner, ambient air, fully loaded furnace)
0
20
40
60
80
100
Frequency (increases to right)
NO
x/(N
Ox @
Ste
ady)
, %
0
50
100
150
200
250
Hea
t Tra
nsfe
r, M
Btu
/h
NOxHeat Transfer
500,000 Btu/h3% O2 in exhaust29% O2 in air
Figure 31. EFFECT OF FREQUENCY ON HEAT TRANSFER AND NOx EMISSIONS
(Bloom baffle burner, air enriched to 29% oxygen, normally loaded furnace)
Heat Transfer
The data from the testing with the Bloom baffle burner was analyzed to determine the effect of
oscillating combustion on heat transfer. For ambient air firing, a 13% increase in heat transfer from the
flame to the water cooled load was observed; for preheated air, a 6% increase; and for enriched air, a 2%
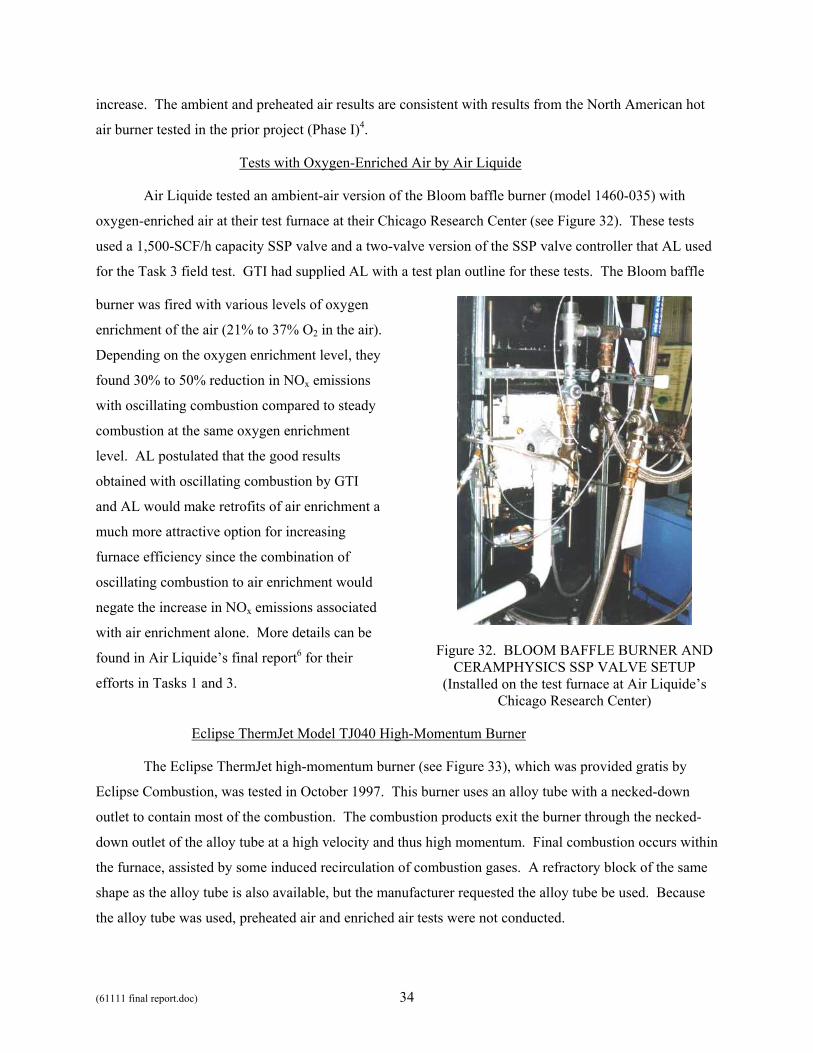
(61111 final report.doc) 34
increase. The ambient and preheated air results are consistent with results from the North American hot
air burner tested in the prior project (Phase I)4.
Tests with Oxygen-Enriched Air by Air Liquide
Air Liquide tested an ambient-air version of the Bloom baffle burner (model 1460-035) with
oxygen-enriched air at their test furnace at their Chicago Research Center (see Figure 32). These tests
used a 1,500-SCF/h capacity SSP valve and a two-valve version of the SSP valve controller that AL used
for the Task 3 field test. GTI had supplied AL with a test plan outline for these tests. The Bloom baffle
burner was fired with various levels of oxygen
enrichment of the air (21% to 37% O2 in the air).
Depending on the oxygen enrichment level, they
found 30% to 50% reduction in NOx emissions
with oscillating combustion compared to steady
combustion at the same oxygen enrichment
level. AL postulated that the good results
obtained with oscillating combustion by GTI
and AL would make retrofits of air enrichment a
much more attractive option for increasing
furnace efficiency since the combination of
oscillating combustion to air enrichment would
negate the increase in NOx emissions associated
with air enrichment alone. More details can be
found in Air Liquide’s final report6 for their
efforts in Tasks 1 and 3.
Figure 32. BLOOM BAFFLE BURNER AND CERAMPHYSICS SSP VALVE SETUP
(Installed on the test furnace at Air Liquide’s Chicago Research Center)
Eclipse ThermJet Model TJ040 High-Momentum Burner
The Eclipse ThermJet high-momentum burner (see Figure 33), which was provided gratis by
Eclipse Combustion, was tested in October 1997. This burner uses an alloy tube with a necked-down
outlet to contain most of the combustion. The combustion products exit the burner through the necked-
down outlet of the alloy tube at a high velocity and thus high momentum. Final combustion occurs within
the furnace, assisted by some induced recirculation of combustion gases. A refractory block of the same
shape as the alloy tube is also available, but the manufacturer requested the alloy tube be used. Because
the alloy tube was used, preheated air and enriched air tests were not conducted.
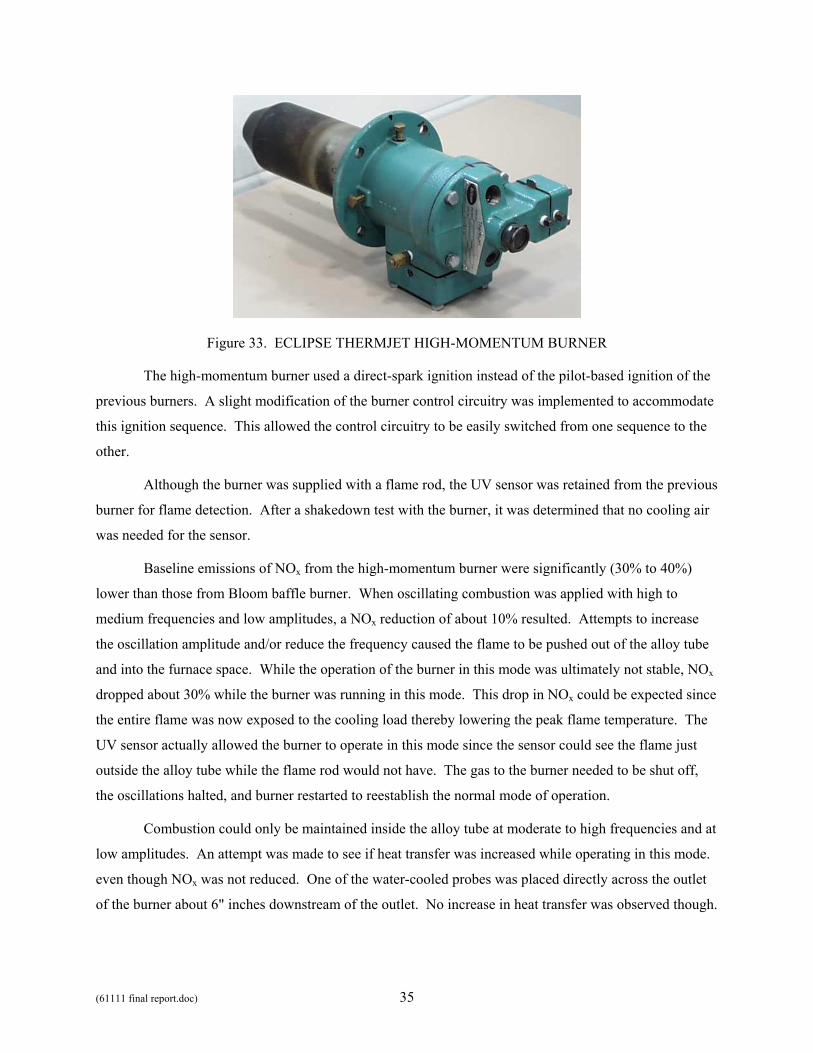
(61111 final report.doc) 35
Figure 33. ECLIPSE THERMJET HIGH-MOMENTUM BURNER
The high-momentum burner used a direct-spark ignition instead of the pilot-based ignition of the
previous burners. A slight modification of the burner control circuitry was implemented to accommodate
this ignition sequence. This allowed the control circuitry to be easily switched from one sequence to the
other.
Although the burner was supplied with a flame rod, the UV sensor was retained from the previous
burner for flame detection. After a shakedown test with the burner, it was determined that no cooling air
was needed for the sensor.
Baseline emissions of NOx from the high-momentum burner were significantly (30% to 40%)
lower than those from Bloom baffle burner. When oscillating combustion was applied with high to
medium frequencies and low amplitudes, a NOx reduction of about 10% resulted. Attempts to increase
the oscillation amplitude and/or reduce the frequency caused the flame to be pushed out of the alloy tube
and into the furnace space. While the operation of the burner in this mode was ultimately not stable, NOx
dropped about 30% while the burner was running in this mode. This drop in NOx could be expected since
the entire flame was now exposed to the cooling load thereby lowering the peak flame temperature. The
UV sensor actually allowed the burner to operate in this mode since the sensor could see the flame just
outside the alloy tube while the flame rod would not have. The gas to the burner needed to be shut off,
the oscillations halted, and burner restarted to reestablish the normal mode of operation.
Combustion could only be maintained inside the alloy tube at moderate to high frequencies and at
low amplitudes. An attempt was made to see if heat transfer was increased while operating in this mode.
even though NOx was not reduced. One of the water-cooled probes was placed directly across the outlet
of the burner about 6" inches downstream of the outlet. No increase in heat transfer was observed though.
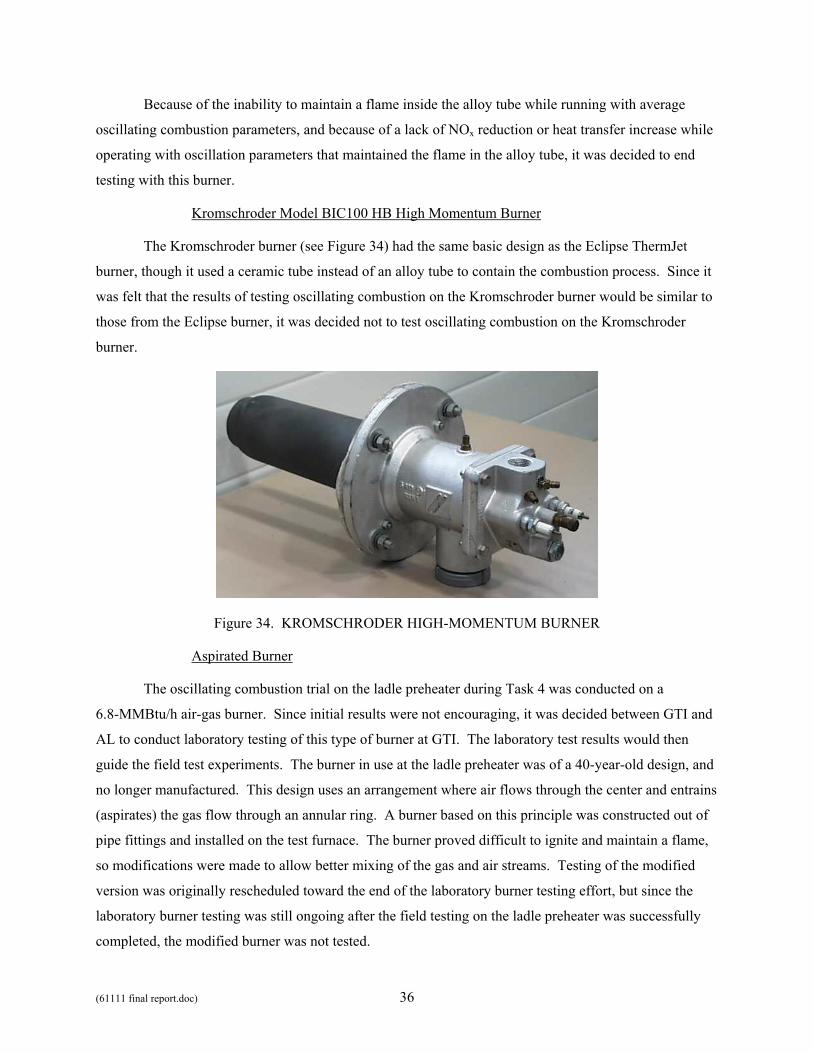
(61111 final report.doc) 36
Because of the inability to maintain a flame inside the alloy tube while running with average
oscillating combustion parameters, and because of a lack of NOx reduction or heat transfer increase while
operating with oscillation parameters that maintained the flame in the alloy tube, it was decided to end
testing with this burner.
Kromschroder Model BIC100 HB High Momentum Burner
The Kromschroder burner (see Figure 34) had the same basic design as the Eclipse ThermJet
burner, though it used a ceramic tube instead of an alloy tube to contain the combustion process. Since it
was felt that the results of testing oscillating combustion on the Kromschroder burner would be similar to
those from the Eclipse burner, it was decided not to test oscillating combustion on the Kromschroder
burner.
Figure 34. KROMSCHRODER HIGH-MOMENTUM BURNER
Aspirated Burner
The oscillating combustion trial on the ladle preheater during Task 4 was conducted on a
6.8-MMBtu/h air-gas burner. Since initial results were not encouraging, it was decided between GTI and
AL to conduct laboratory testing of this type of burner at GTI. The laboratory test results would then
guide the field test experiments. The burner in use at the ladle preheater was of a 40-year-old design, and
no longer manufactured. This design uses an arrangement where air flows through the center and entrains
(aspirates) the gas flow through an annular ring. A burner based on this principle was constructed out of
pipe fittings and installed on the test furnace. The burner proved difficult to ignite and maintain a flame,
so modifications were made to allow better mixing of the gas and air streams. Testing of the modified
version was originally rescheduled toward the end of the laboratory burner testing effort, but since the
laboratory burner testing was still ongoing after the field testing on the ladle preheater was successfully
completed, the modified burner was not tested.
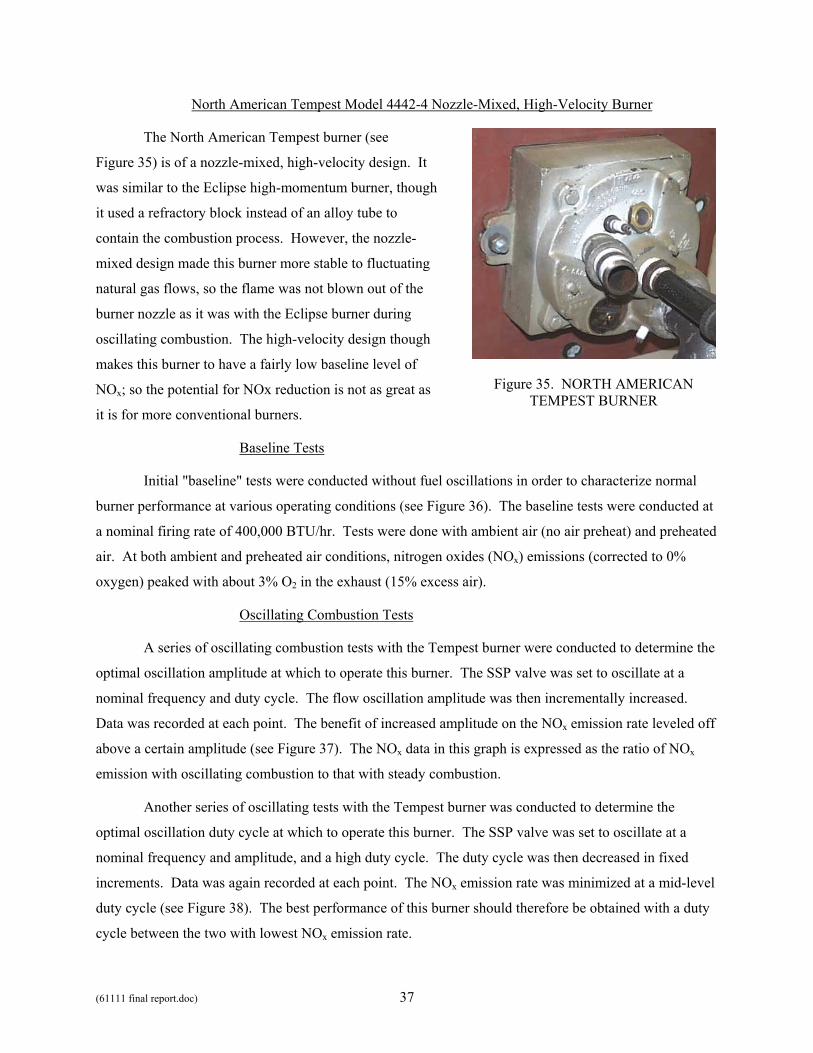
(61111 final report.doc) 37
North American Tempest Model 4442-4 Nozzle-Mixed, High-Velocity Burner
The North American Tempest burner (see
Figure 35) is of a nozzle-mixed, high-velocity design. It
was similar to the Eclipse high-momentum burner, though
it used a refractory block instead of an alloy tube to
contain the combustion process. However, the nozzle-
mixed design made this burner more stable to fluctuating
natural gas flows, so the flame was not blown out of the
burner nozzle as it was with the Eclipse burner during
oscillating combustion. The high-velocity design though
makes this burner to have a fairly low baseline level of
NOx; so the potential for NOx reduction is not as great as
it is for more conventional burners.
Figure 35. NORTH AMERICAN TEMPEST BURNER
Baseline Tests
Initial "baseline" tests were conducted without fuel oscillations in order to characterize normal
burner performance at various operating conditions (see Figure 36). The baseline tests were conducted at
a nominal firing rate of 400,000 BTU/hr. Tests were done with ambient air (no air preheat) and preheated
air. At both ambient and preheated air conditions, nitrogen oxides (NOx) emissions (corrected to 0%
oxygen) peaked with about 3% O2 in the exhaust (15% excess air).
Oscillating Combustion Tests
A series of oscillating combustion tests with the Tempest burner were conducted to determine the
optimal oscillation amplitude at which to operate this burner. The SSP valve was set to oscillate at a
nominal frequency and duty cycle. The flow oscillation amplitude was then incrementally increased.
Data was recorded at each point. The benefit of increased amplitude on the NOx emission rate leveled off
above a certain amplitude (see Figure 37). The NOx data in this graph is expressed as the ratio of NOx
emission with oscillating combustion to that with steady combustion.
Another series of oscillating tests with the Tempest burner was conducted to determine the
optimal oscillation duty cycle at which to operate this burner. The SSP valve was set to oscillate at a
nominal frequency and amplitude, and a high duty cycle. The duty cycle was then decreased in fixed
increments. Data was again recorded at each point. The NOx emission rate was minimized at a mid-level
duty cycle (see Figure 38). The best performance of this burner should therefore be obtained with a duty
cycle between the two with lowest NOx emission rate.
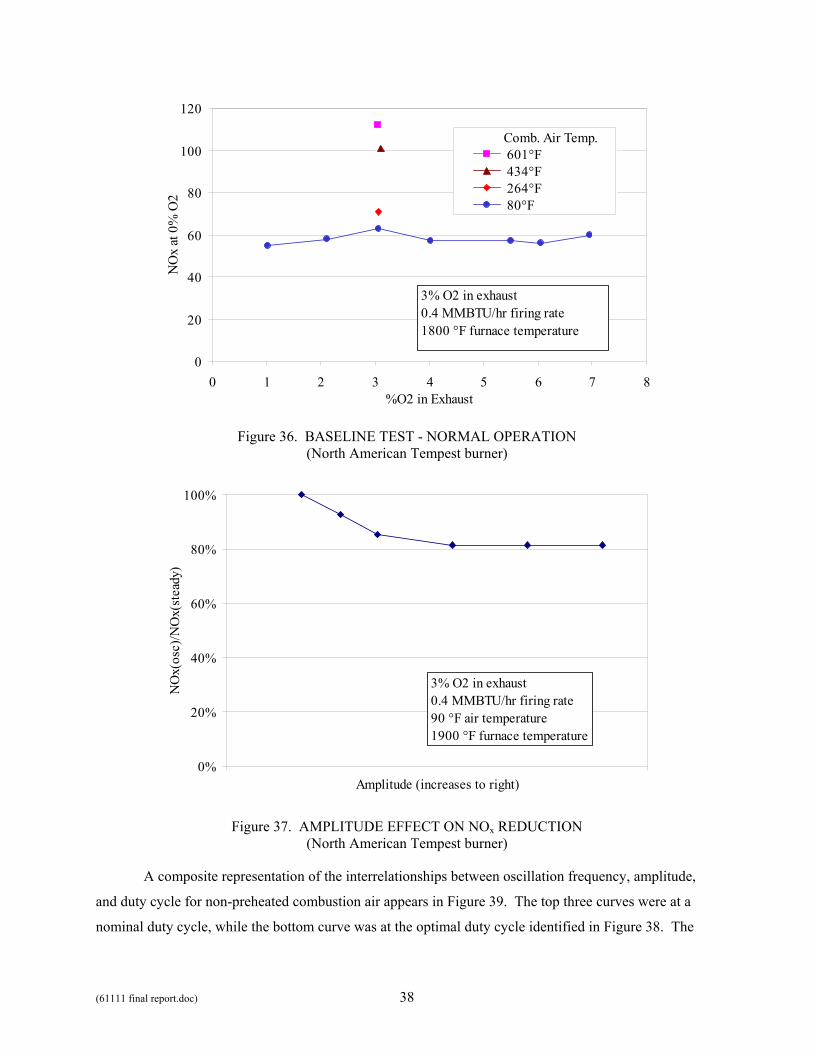
(61111 final report.doc) 38
0
20
40
60
80
100
120
0 1 2 3 4 5 6 7 8%O2 in Exhaust
NO
x at
0%
O2
Comb. Air Temp. 601°F 434°F 264°F 80°F
3% O2 in exhaust0.4 MMBTU/hr firing rate1800 °F furnace temperature
Figure 36. BASELINE TEST - NORMAL OPERATION (North American Tempest burner)
0%
20%
40%
60%
80%
100%
Amplitude (increases to right)
NO
x(os
c)/N
Ox(
stea
dy)
3% O2 in exhaust0.4 MMBTU/hr firing rate90 °F air temperature1900 °F furnace temperature
Figure 37. AMPLITUDE EFFECT ON NOx REDUCTION (North American Tempest burner)
A composite representation of the interrelationships between oscillation frequency, amplitude,
and duty cycle for non-preheated combustion air appears in Figure 39. The top three curves were at a
nominal duty cycle, while the bottom curve was at the optimal duty cycle identified in Figure 38. The
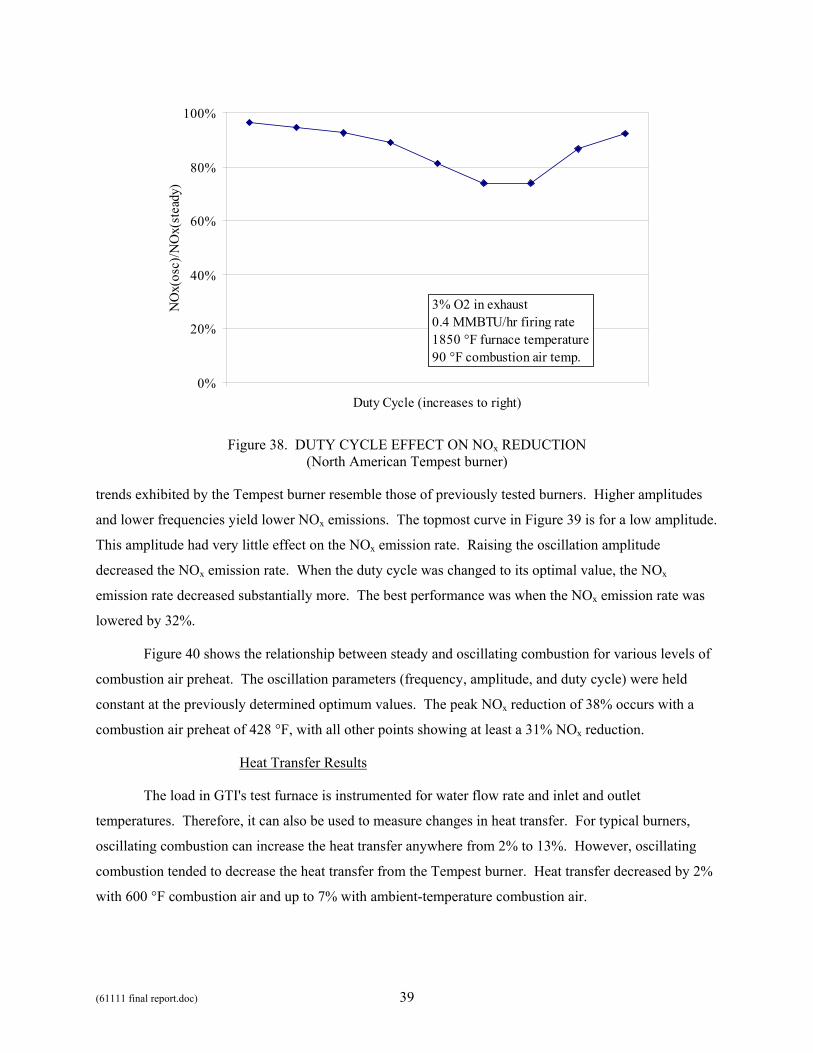
(61111 final report.doc) 39
0%
20%
40%
60%
80%
100%
Duty Cycle (increases to right)
NO
x(os
c)/N
Ox(
stea
dy)
3% O2 in exhaust0.4 MMBTU/hr firing rate1850 °F furnace temperature90 °F combustion air temp.
Figure 38. DUTY CYCLE EFFECT ON NOx REDUCTION (North American Tempest burner)
trends exhibited by the Tempest burner resemble those of previously tested burners. Higher amplitudes
and lower frequencies yield lower NOx emissions. The topmost curve in Figure 39 is for a low amplitude.
This amplitude had very little effect on the NOx emission rate. Raising the oscillation amplitude
decreased the NOx emission rate. When the duty cycle was changed to its optimal value, the NOx
emission rate decreased substantially more. The best performance was when the NOx emission rate was
lowered by 32%.
Figure 40 shows the relationship between steady and oscillating combustion for various levels of
combustion air preheat. The oscillation parameters (frequency, amplitude, and duty cycle) were held
constant at the previously determined optimum values. The peak NOx reduction of 38% occurs with a
combustion air preheat of 428 °F, with all other points showing at least a 31% NOx reduction.
Heat Transfer Results
The load in GTI's test furnace is instrumented for water flow rate and inlet and outlet
temperatures. Therefore, it can also be used to measure changes in heat transfer. For typical burners,
oscillating combustion can increase the heat transfer anywhere from 2% to 13%. However, oscillating
combustion tended to decrease the heat transfer from the Tempest burner. Heat transfer decreased by 2%
with 600 °F combustion air and up to 7% with ambient-temperature combustion air.
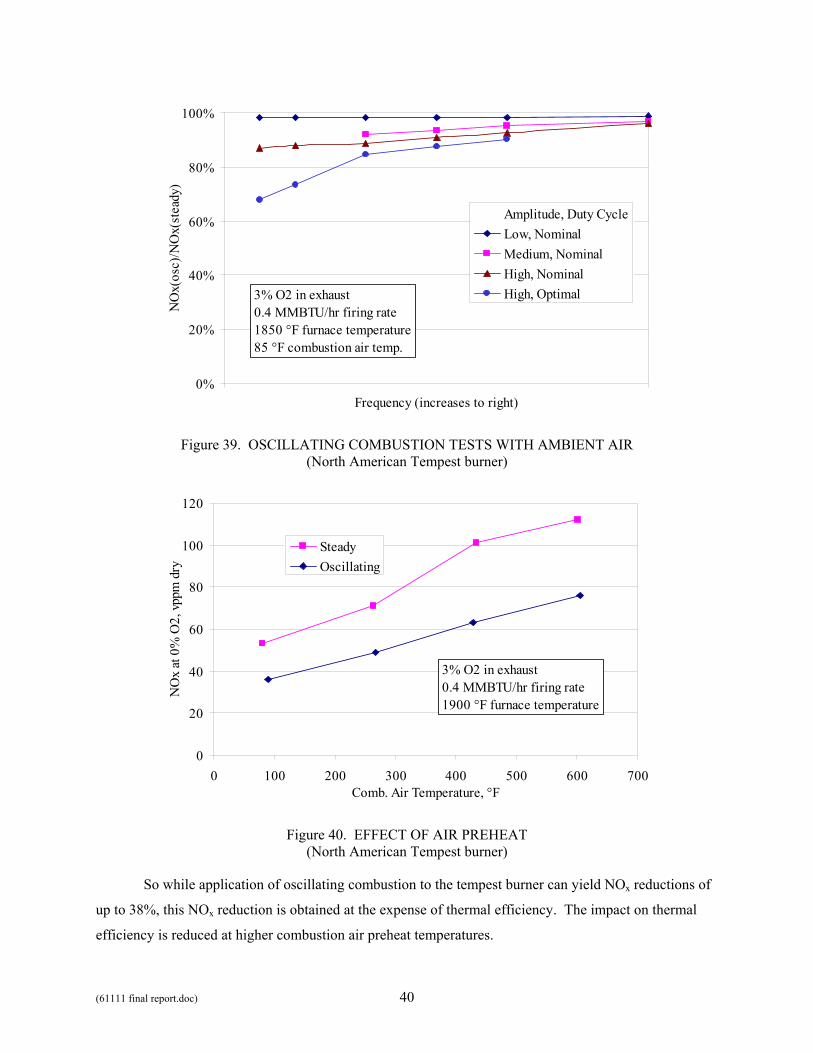
(61111 final report.doc) 40
0%
20%
40%
60%
80%
100%
Frequency (increases to right)
NO
x(os
c)/N
Ox(
stea
dy)
Amplitude, Duty CycleLow, NominalMedium, NominalHigh, NominalHigh, Optimal3% O2 in exhaust
0.4 MMBTU/hr firing rate1850 °F furnace temperature85 °F combustion air temp.
Figure 39. OSCILLATING COMBUSTION TESTS WITH AMBIENT AIR (North American Tempest burner)
0
20
40
60
80
100
120
0 100 200 300 400 500 600 700Comb. Air Temperature, °F
NO
x at
0%
O2,
vppm
dry
SteadyOscillating
3% O2 in exhaust0.4 MMBTU/hr firing rate1900 °F furnace temperature
Figure 40. EFFECT OF AIR PREHEAT (North American Tempest burner)
So while application of oscillating combustion to the tempest burner can yield NOx reductions of
up to 38%, this NOx reduction is obtained at the expense of thermal efficiency. The impact on thermal
efficiency is reduced at higher combustion air preheat temperatures.

(61111 final report.doc) 41
North American Flat Flame Burner Model 4832-4
The North American flat flame burner was tested in GTI’s combustion laboratory to support the
annealing furnace field testing efforts of Task 5. It was also tested to gage how much NOx reduction
might occur if oscillating combustion is applied to the soak zone of a reheat furnace, where this type of
burner is commonly used, or to the heat zone of a reheat furnace, where this type of burner is occasionally
used. Since the flat flame burner’s refractory block and flame shape are too large in the radial direction to
install in GTI’s high-temperature test furnace, a simple test stand was set up. This stand was made from a
3'-long section of a 4'-wide x 4'-tall (internal dimensions) modular furnace (see Figure 41). A water-
cooled wall was fabricated to act as a load for the flat flame burner. The wall also serves to close the
combustion space opposite the burner. A view port was installed through the wall for visual observance
of the flame in the axial direct. The furnace section had slots in the side wall for observation in the radial
direction.
Figure 41. FURNACE SECTION USED FOR FLAT-FLAME BURNER TESTS (Shown with flat-flame burner installed)
The North American flat flame burner was first tested with ambient air. Baseline (steady
combustion) tests showed NOx levels of about 40 ppmv, which are similar to those obtained at the
annealing furnace at Bethlehem Steel after startup of the furnace when the combustion air is still cold.
Oscillating combustion tested showed NOx reductions of about 25%, also similar to the results obtained
at the annealing furnace.
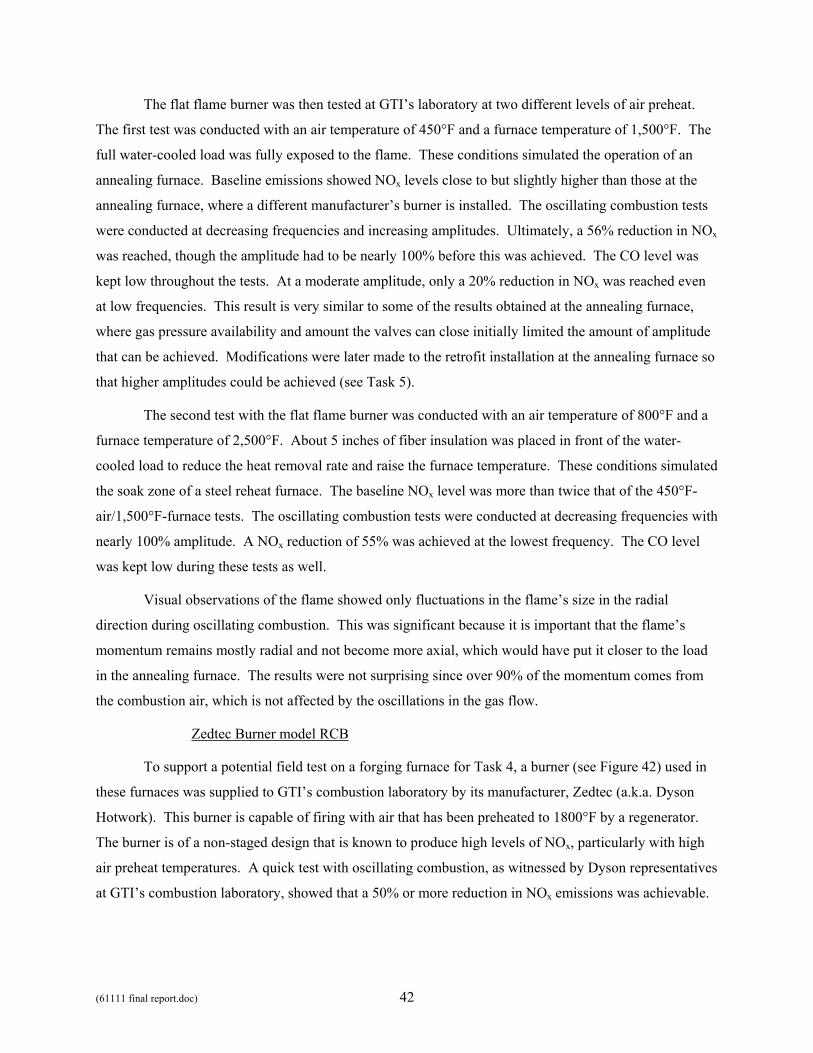
(61111 final report.doc) 42
The flat flame burner was then tested at GTI’s laboratory at two different levels of air preheat.
The first test was conducted with an air temperature of 450°F and a furnace temperature of 1,500°F. The
full water-cooled load was fully exposed to the flame. These conditions simulated the operation of an
annealing furnace. Baseline emissions showed NOx levels close to but slightly higher than those at the
annealing furnace, where a different manufacturer’s burner is installed. The oscillating combustion tests
were conducted at decreasing frequencies and increasing amplitudes. Ultimately, a 56% reduction in NOx
was reached, though the amplitude had to be nearly 100% before this was achieved. The CO level was
kept low throughout the tests. At a moderate amplitude, only a 20% reduction in NOx was reached even
at low frequencies. This result is very similar to some of the results obtained at the annealing furnace,
where gas pressure availability and amount the valves can close initially limited the amount of amplitude
that can be achieved. Modifications were later made to the retrofit installation at the annealing furnace so
that higher amplitudes could be achieved (see Task 5).
The second test with the flat flame burner was conducted with an air temperature of 800°F and a
furnace temperature of 2,500°F. About 5 inches of fiber insulation was placed in front of the water-
cooled load to reduce the heat removal rate and raise the furnace temperature. These conditions simulated
the soak zone of a steel reheat furnace. The baseline NOx level was more than twice that of the 450°F-
air/1,500°F-furnace tests. The oscillating combustion tests were conducted at decreasing frequencies with
nearly 100% amplitude. A NOx reduction of 55% was achieved at the lowest frequency. The CO level
was kept low during these tests as well.
Visual observations of the flame showed only fluctuations in the flame’s size in the radial
direction during oscillating combustion. This was significant because it is important that the flame’s
momentum remains mostly radial and not become more axial, which would have put it closer to the load
in the annealing furnace. The results were not surprising since over 90% of the momentum comes from
the combustion air, which is not affected by the oscillations in the gas flow.
Zedtec Burner model RCB
To support a potential field test on a forging furnace for Task 4, a burner (see Figure 42) used in
these furnaces was supplied to GTI’s combustion laboratory by its manufacturer, Zedtec (a.k.a. Dyson
Hotwork). This burner is capable of firing with air that has been preheated to 1800°F by a regenerator.
The burner is of a non-staged design that is known to produce high levels of NOx, particularly with high
air preheat temperatures. A quick test with oscillating combustion, as witnessed by Dyson representatives
at GTI’s combustion laboratory, showed that a 50% or more reduction in NOx emissions was achievable.
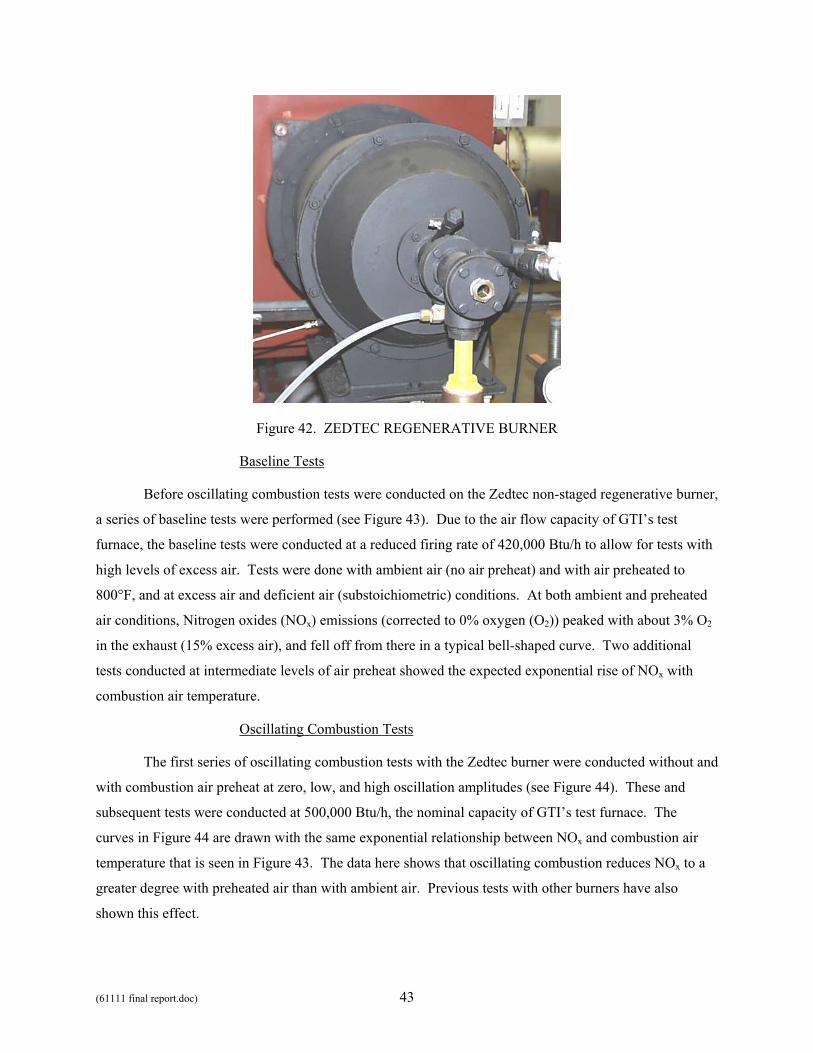
(61111 final report.doc) 43
Figure 42. ZEDTEC REGENERATIVE BURNER
Baseline Tests
Before oscillating combustion tests were conducted on the Zedtec non-staged regenerative burner,
a series of baseline tests were performed (see Figure 43). Due to the air flow capacity of GTI’s test
furnace, the baseline tests were conducted at a reduced firing rate of 420,000 Btu/h to allow for tests with
high levels of excess air. Tests were done with ambient air (no air preheat) and with air preheated to
800°F, and at excess air and deficient air (substoichiometric) conditions. At both ambient and preheated
air conditions, Nitrogen oxides (NOx) emissions (corrected to 0% oxygen (O2)) peaked with about 3% O2
in the exhaust (15% excess air), and fell off from there in a typical bell-shaped curve. Two additional
tests conducted at intermediate levels of air preheat showed the expected exponential rise of NOx with
combustion air temperature.
Oscillating Combustion Tests
The first series of oscillating combustion tests with the Zedtec burner were conducted without and
with combustion air preheat at zero, low, and high oscillation amplitudes (see Figure 44). These and
subsequent tests were conducted at 500,000 Btu/h, the nominal capacity of GTI’s test furnace. The
curves in Figure 44 are drawn with the same exponential relationship between NOx and combustion air
temperature that is seen in Figure 43. The data here shows that oscillating combustion reduces NOx to a
greater degree with preheated air than with ambient air. Previous tests with other burners have also
shown this effect.
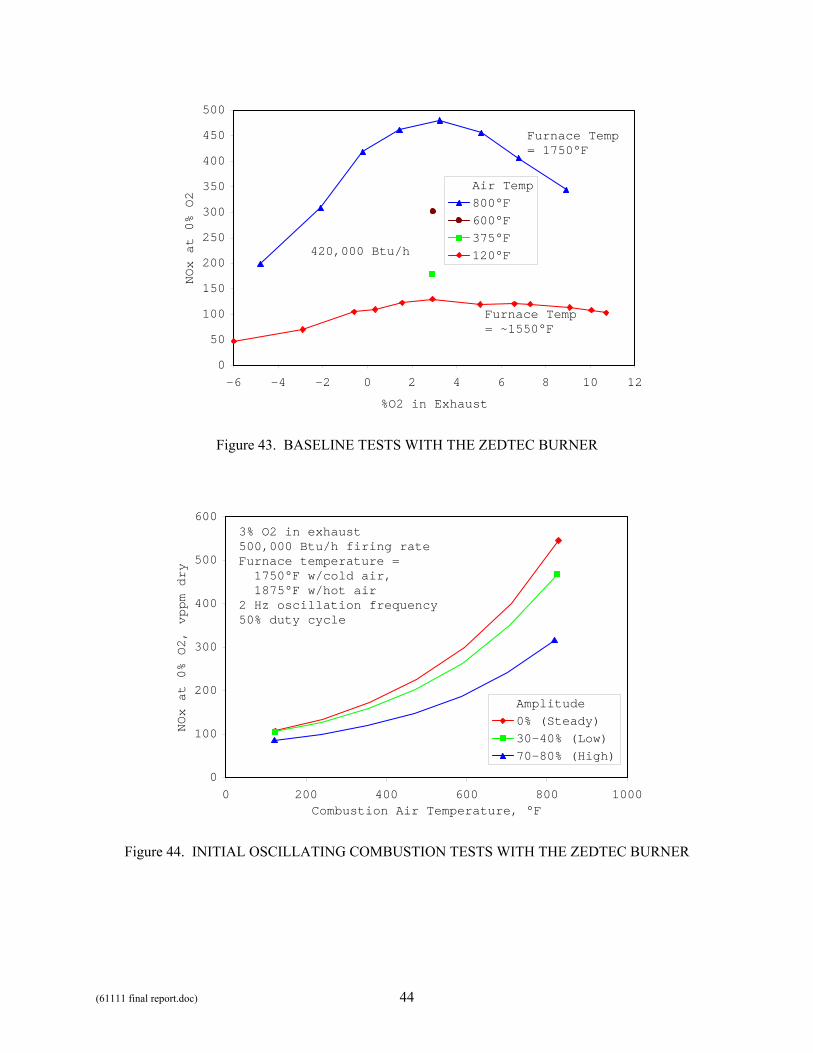
(61111 final report.doc) 44
0
50
100
150
200
250
300
350
400
450
500
-6 -4 -2 0 2 4 6 8 10 12
%O2 in Exhaust
NOx at 0% O2
Air Temp800°F600°F375°F120°F420,000 Btu/h
Furnace Temp = ~1550°F
Furnace Temp = 1750°F
Figure 43. BASELINE TESTS WITH THE ZEDTEC BURNER
0
100
200
300
400
500
600
0 200 400 600 800 1000Combustion Air Temperature, °F
NOx at 0% O2, vppm dry
Amplitude0% (Steady)30-40% (Low)70-80% (High)
3% O2 in exhaust500,000 Btu/h firing rateFurnace temperature = 1750°F w/cold air, 1875°F w/hot air2 Hz oscillation frequency50% duty cycle
Figure 44. INITIAL OSCILLATING COMBUSTION TESTS WITH THE ZEDTEC BURNER
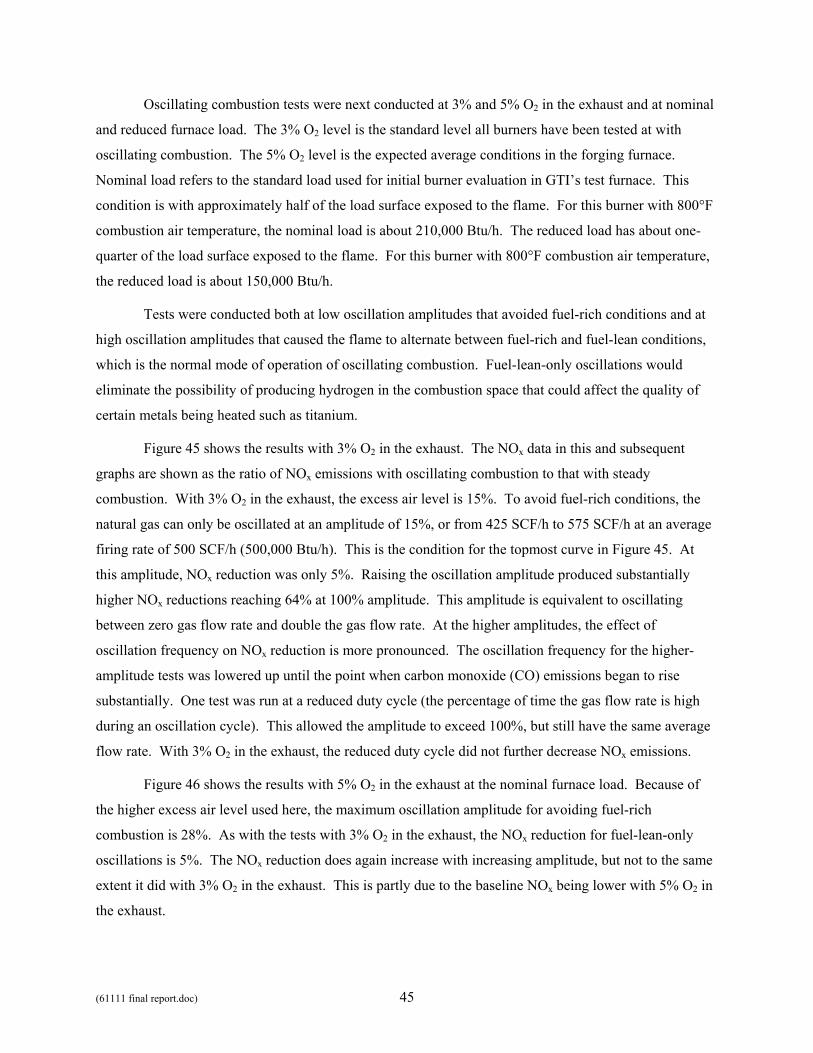
(61111 final report.doc) 45
Oscillating combustion tests were next conducted at 3% and 5% O2 in the exhaust and at nominal
and reduced furnace load. The 3% O2 level is the standard level all burners have been tested at with
oscillating combustion. The 5% O2 level is the expected average conditions in the forging furnace.
Nominal load refers to the standard load used for initial burner evaluation in GTI’s test furnace. This
condition is with approximately half of the load surface exposed to the flame. For this burner with 800°F
combustion air temperature, the nominal load is about 210,000 Btu/h. The reduced load has about one-
quarter of the load surface exposed to the flame. For this burner with 800°F combustion air temperature,
the reduced load is about 150,000 Btu/h.
Tests were conducted both at low oscillation amplitudes that avoided fuel-rich conditions and at
high oscillation amplitudes that caused the flame to alternate between fuel-rich and fuel-lean conditions,
which is the normal mode of operation of oscillating combustion. Fuel-lean-only oscillations would
eliminate the possibility of producing hydrogen in the combustion space that could affect the quality of
certain metals being heated such as titanium.
Figure 45 shows the results with 3% O2 in the exhaust. The NOx data in this and subsequent
graphs are shown as the ratio of NOx emissions with oscillating combustion to that with steady
combustion. With 3% O2 in the exhaust, the excess air level is 15%. To avoid fuel-rich conditions, the
natural gas can only be oscillated at an amplitude of 15%, or from 425 SCF/h to 575 SCF/h at an average
firing rate of 500 SCF/h (500,000 Btu/h). This is the condition for the topmost curve in Figure 45. At
this amplitude, NOx reduction was only 5%. Raising the oscillation amplitude produced substantially
higher NOx reductions reaching 64% at 100% amplitude. This amplitude is equivalent to oscillating
between zero gas flow rate and double the gas flow rate. At the higher amplitudes, the effect of
oscillation frequency on NOx reduction is more pronounced. The oscillation frequency for the higher-
amplitude tests was lowered up until the point when carbon monoxide (CO) emissions began to rise
substantially. One test was run at a reduced duty cycle (the percentage of time the gas flow rate is high
during an oscillation cycle). This allowed the amplitude to exceed 100%, but still have the same average
flow rate. With 3% O2 in the exhaust, the reduced duty cycle did not further decrease NOx emissions.
Figure 46 shows the results with 5% O2 in the exhaust at the nominal furnace load. Because of
the higher excess air level used here, the maximum oscillation amplitude for avoiding fuel-rich
combustion is 28%. As with the tests with 3% O2 in the exhaust, the NOx reduction for fuel-lean-only
oscillations is 5%. The NOx reduction does again increase with increasing amplitude, but not to the same
extent it did with 3% O2 in the exhaust. This is partly due to the baseline NOx being lower with 5% O2 in
the exhaust.
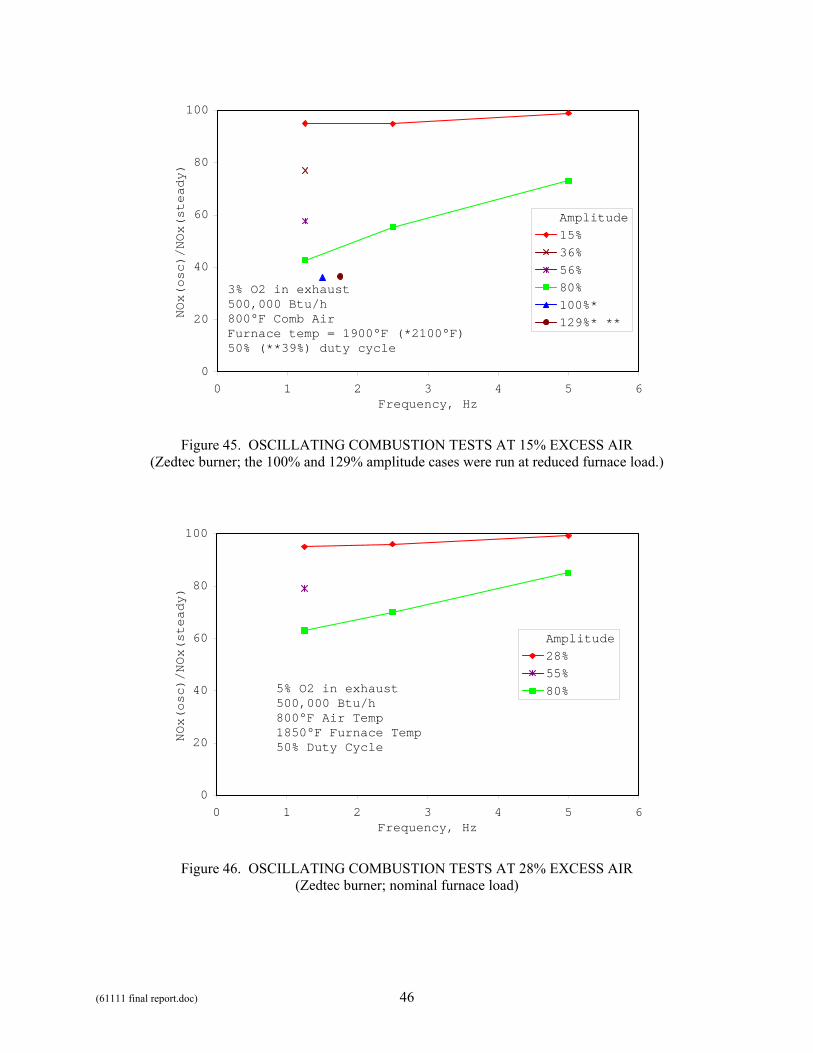
(61111 final report.doc) 46
0
20
40
60
80
100
0 1 2 3 4 5 6Frequency, Hz
NOx(osc)/NOx(steady)
Amplitude15%36%56%80%100%*129%* **
3% O2 in exhaust500,000 Btu/h800°F Comb AirFurnace temp = 1900°F (*2100°F)50% (**39%) duty cycle
Figure 45. OSCILLATING COMBUSTION TESTS AT 15% EXCESS AIR (Zedtec burner; the 100% and 129% amplitude cases were run at reduced furnace load.)
0
20
40
60
80
100
0 1 2 3 4 5 6Frequency, Hz
NOx(osc)/NOx(steady)
Amplitude28%55%80%5% O2 in exhaust
500,000 Btu/h800°F Air Temp1850°F Furnace Temp50% Duty Cycle
Figure 46. OSCILLATING COMBUSTION TESTS AT 28% EXCESS AIR (Zedtec burner; nominal furnace load)
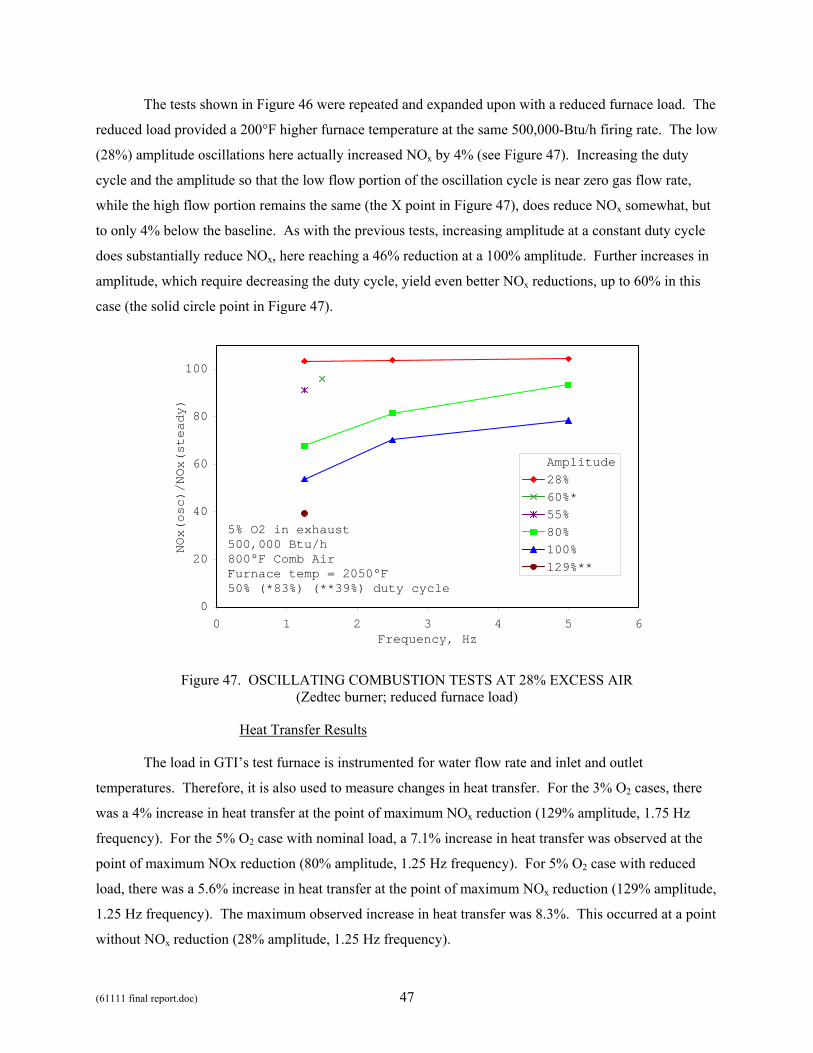
(61111 final report.doc) 47
The tests shown in Figure 46 were repeated and expanded upon with a reduced furnace load. The
reduced load provided a 200°F higher furnace temperature at the same 500,000-Btu/h firing rate. The low
(28%) amplitude oscillations here actually increased NOx by 4% (see Figure 47). Increasing the duty
cycle and the amplitude so that the low flow portion of the oscillation cycle is near zero gas flow rate,
while the high flow portion remains the same (the X point in Figure 47), does reduce NOx somewhat, but
to only 4% below the baseline. As with the previous tests, increasing amplitude at a constant duty cycle
does substantially reduce NOx, here reaching a 46% reduction at a 100% amplitude. Further increases in
amplitude, which require decreasing the duty cycle, yield even better NOx reductions, up to 60% in this
case (the solid circle point in Figure 47).
0
20
40
60
80
100
0 1 2 3 4 5 6Frequency, Hz
NOx(osc)/NOx(steady)
Amplitude28%60%*55%80%100%129%**
5% O2 in exhaust500,000 Btu/h800°F Comb AirFurnace temp = 2050°F50% (*83%) (**39%) duty cycle
Figure 47. OSCILLATING COMBUSTION TESTS AT 28% EXCESS AIR (Zedtec burner; reduced furnace load)
Heat Transfer Results
The load in GTI’s test furnace is instrumented for water flow rate and inlet and outlet
temperatures. Therefore, it is also used to measure changes in heat transfer. For the 3% O2 cases, there
was a 4% increase in heat transfer at the point of maximum NOx reduction (129% amplitude, 1.75 Hz
frequency). For the 5% O2 case with nominal load, a 7.1% increase in heat transfer was observed at the
point of maximum NOx reduction (80% amplitude, 1.25 Hz frequency). For 5% O2 case with reduced
load, there was a 5.6% increase in heat transfer at the point of maximum NOx reduction (129% amplitude,
1.25 Hz frequency). The maximum observed increase in heat transfer was 8.3%. This occurred at a point
without NOx reduction (28% amplitude, 1.25 Hz frequency).
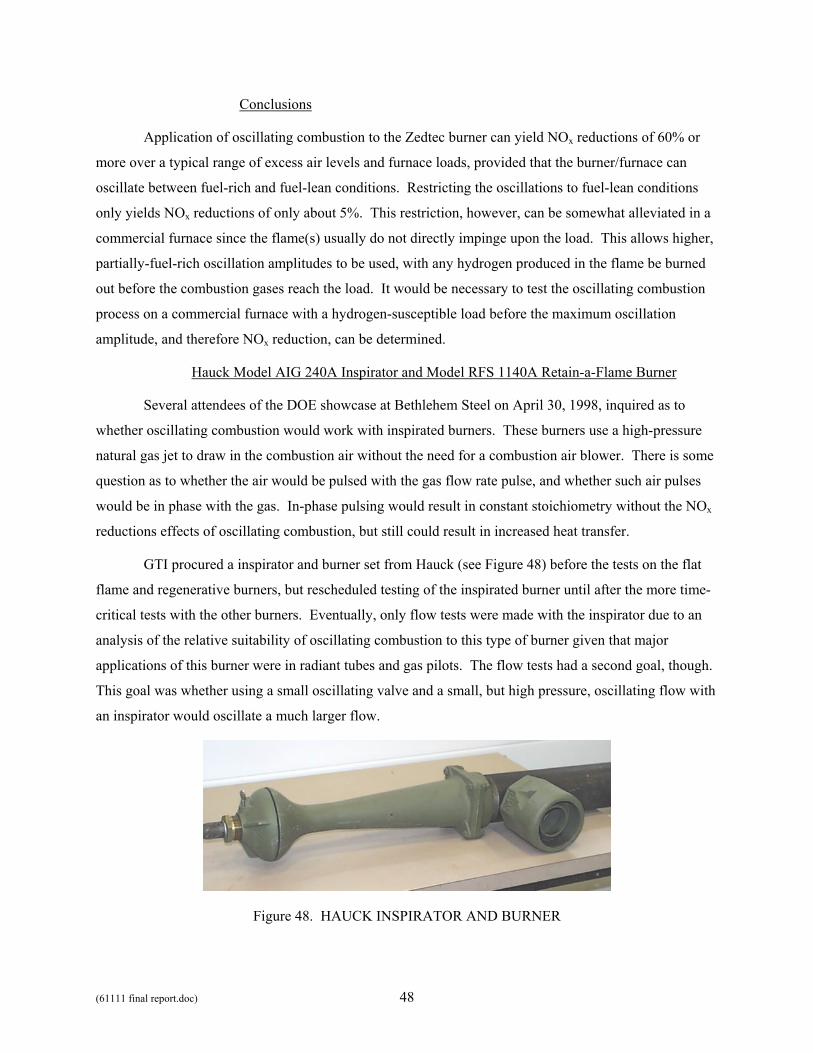
(61111 final report.doc) 48
Conclusions
Application of oscillating combustion to the Zedtec burner can yield NOx reductions of 60% or
more over a typical range of excess air levels and furnace loads, provided that the burner/furnace can
oscillate between fuel-rich and fuel-lean conditions. Restricting the oscillations to fuel-lean conditions
only yields NOx reductions of only about 5%. This restriction, however, can be somewhat alleviated in a
commercial furnace since the flame(s) usually do not directly impinge upon the load. This allows higher,
partially-fuel-rich oscillation amplitudes to be used, with any hydrogen produced in the flame be burned
out before the combustion gases reach the load. It would be necessary to test the oscillating combustion
process on a commercial furnace with a hydrogen-susceptible load before the maximum oscillation
amplitude, and therefore NOx reduction, can be determined.
Hauck Model AIG 240A Inspirator and Model RFS 1140A Retain-a-Flame Burner
Several attendees of the DOE showcase at Bethlehem Steel on April 30, 1998, inquired as to
whether oscillating combustion would work with inspirated burners. These burners use a high-pressure
natural gas jet to draw in the combustion air without the need for a combustion air blower. There is some
question as to whether the air would be pulsed with the gas flow rate pulse, and whether such air pulses
would be in phase with the gas. In-phase pulsing would result in constant stoichiometry without the NOx
reductions effects of oscillating combustion, but still could result in increased heat transfer.
GTI procured a inspirator and burner set from Hauck (see Figure 48) before the tests on the flat
flame and regenerative burners, but rescheduled testing of the inspirated burner until after the more time-
critical tests with the other burners. Eventually, only flow tests were made with the inspirator due to an
analysis of the relative suitability of oscillating combustion to this type of burner given that major
applications of this burner were in radiant tubes and gas pilots. The flow tests had a second goal, though.
This goal was whether using a small oscillating valve and a small, but high pressure, oscillating flow with
an inspirator would oscillate a much larger flow.
Figure 48. HAUCK INSPIRATOR AND BURNER
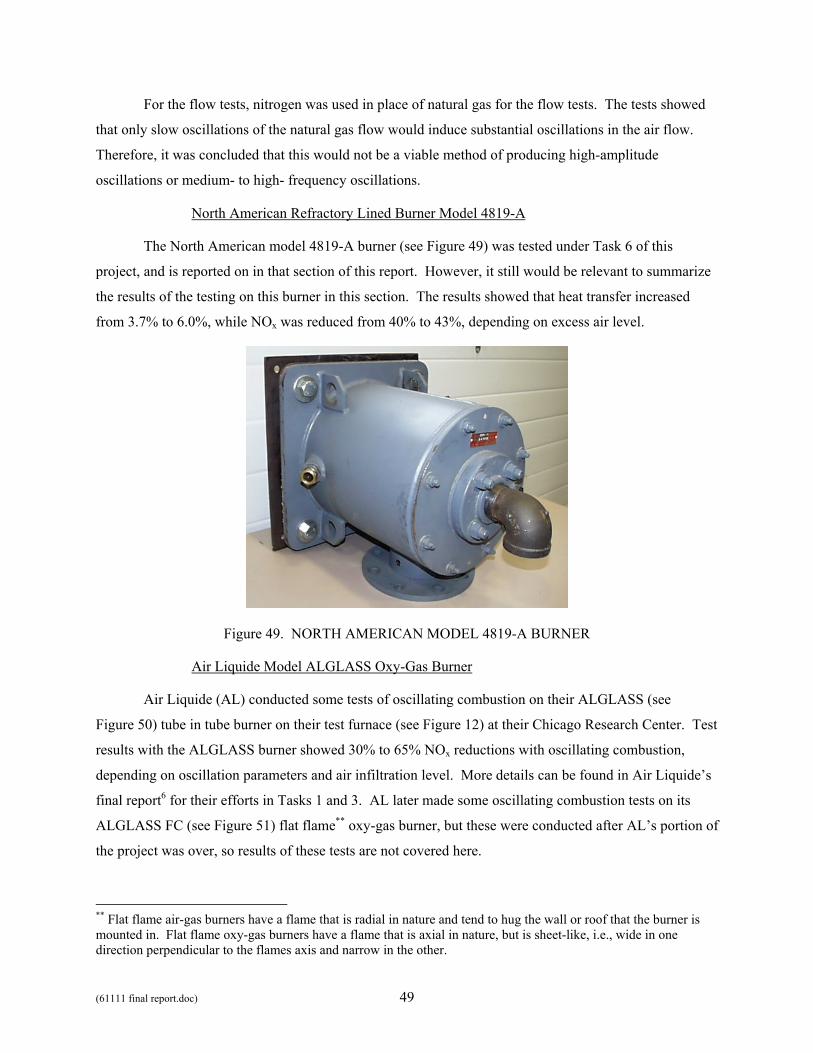
(61111 final report.doc) 49
For the flow tests, nitrogen was used in place of natural gas for the flow tests. The tests showed
that only slow oscillations of the natural gas flow would induce substantial oscillations in the air flow.
Therefore, it was concluded that this would not be a viable method of producing high-amplitude
oscillations or medium- to high- frequency oscillations.
North American Refractory Lined Burner Model 4819-A
The North American model 4819-A burner (see Figure 49) was tested under Task 6 of this
project, and is reported on in that section of this report. However, it still would be relevant to summarize
the results of the testing on this burner in this section. The results showed that heat transfer increased
from 3.7% to 6.0%, while NOx was reduced from 40% to 43%, depending on excess air level.
Figure 49. NORTH AMERICAN MODEL 4819-A BURNER
Air Liquide Model ALGLASS Oxy-Gas Burner
Air Liquide (AL) conducted some tests of oscillating combustion on their ALGLASS (see
Figure 50) tube in tube burner on their test furnace (see Figure 12) at their Chicago Research Center. Test
results with the ALGLASS burner showed 30% to 65% NOx reductions with oscillating combustion,
depending on oscillation parameters and air infiltration level. More details can be found in Air Liquide’s
final report6 for their efforts in Tasks 1 and 3. AL later made some oscillating combustion tests on its
ALGLASS FC (see Figure 51) flat flame** oxy-gas burner, but these were conducted after AL’s portion of
the project was over, so results of these tests are not covered here.
** Flat flame air-gas burners have a flame that is radial in nature and tend to hug the wall or roof that the burner is mounted in. Flat flame oxy-gas burners have a flame that is axial in nature, but is sheet-like, i.e., wide in one direction perpendicular to the flames axis and narrow in the other.
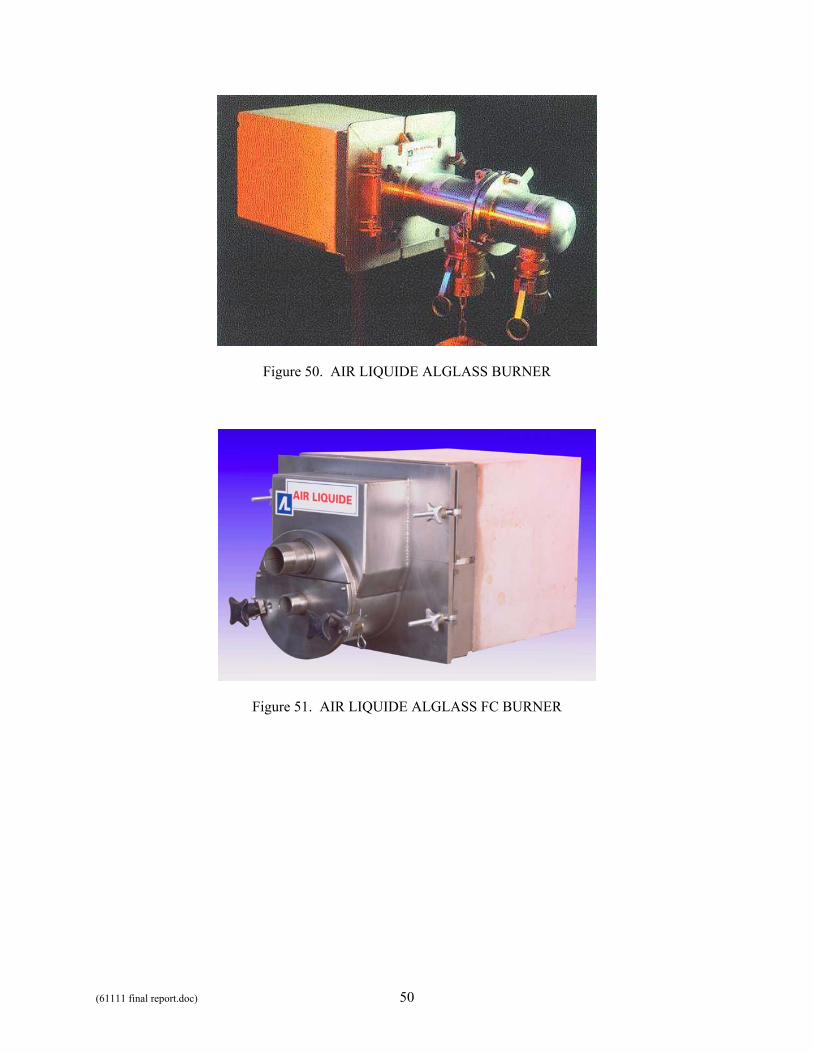
(61111 final report.doc) 50
Figure 50. AIR LIQUIDE ALGLASS BURNER
Figure 51. AIR LIQUIDE ALGLASS FC BURNER
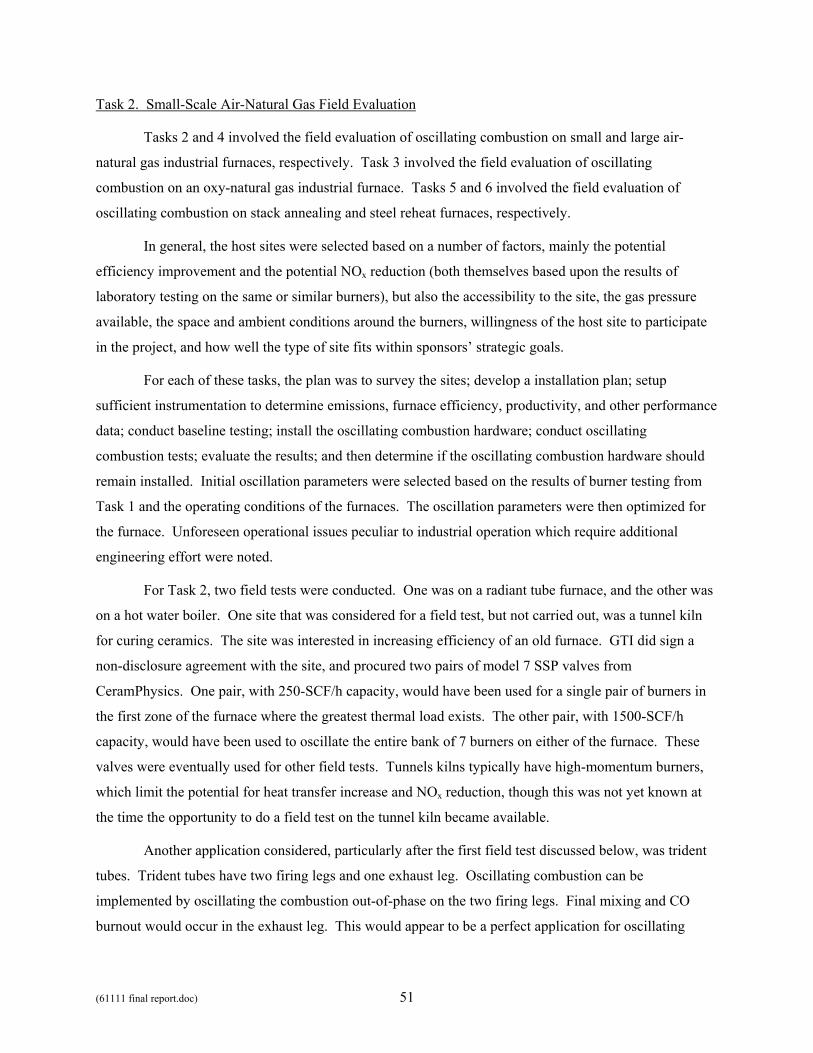
(61111 final report.doc) 51
Task 2. Small-Scale Air-Natural Gas Field Evaluation
Tasks 2 and 4 involved the field evaluation of oscillating combustion on small and large air-
natural gas industrial furnaces, respectively. Task 3 involved the field evaluation of oscillating
combustion on an oxy-natural gas industrial furnace. Tasks 5 and 6 involved the field evaluation of
oscillating combustion on stack annealing and steel reheat furnaces, respectively.
In general, the host sites were selected based on a number of factors, mainly the potential
efficiency improvement and the potential NOx reduction (both themselves based upon the results of
laboratory testing on the same or similar burners), but also the accessibility to the site, the gas pressure
available, the space and ambient conditions around the burners, willingness of the host site to participate
in the project, and how well the type of site fits within sponsors’ strategic goals.
For each of these tasks, the plan was to survey the sites; develop a installation plan; setup
sufficient instrumentation to determine emissions, furnace efficiency, productivity, and other performance
data; conduct baseline testing; install the oscillating combustion hardware; conduct oscillating
combustion tests; evaluate the results; and then determine if the oscillating combustion hardware should
remain installed. Initial oscillation parameters were selected based on the results of burner testing from
Task 1 and the operating conditions of the furnaces. The oscillation parameters were then optimized for
the furnace. Unforeseen operational issues peculiar to industrial operation which require additional
engineering effort were noted.
For Task 2, two field tests were conducted. One was on a radiant tube furnace, and the other was
on a hot water boiler. One site that was considered for a field test, but not carried out, was a tunnel kiln
for curing ceramics. The site was interested in increasing efficiency of an old furnace. GTI did sign a
non-disclosure agreement with the site, and procured two pairs of model 7 SSP valves from
CeramPhysics. One pair, with 250-SCF/h capacity, would have been used for a single pair of burners in
the first zone of the furnace where the greatest thermal load exists. The other pair, with 1500-SCF/h
capacity, would have been used to oscillate the entire bank of 7 burners on either of the furnace. These
valves were eventually used for other field tests. Tunnels kilns typically have high-momentum burners,
which limit the potential for heat transfer increase and NOx reduction, though this was not yet known at
the time the opportunity to do a field test on the tunnel kiln became available.
Another application considered, particularly after the first field test discussed below, was trident
tubes. Trident tubes have two firing legs and one exhaust leg. Oscillating combustion can be
implemented by oscillating the combustion out-of-phase on the two firing legs. Final mixing and CO
burnout would occur in the exhaust leg. This would appear to be a perfect application for oscillating
(61111 final report.doc) 52
combustion. However, the number of installed tubes is very small compared to other radiant tubes such
as U-tubes, and the residence time in the trident tube may be as short as it is in U-tubes.
Radiant Tube Test Furnace at Diamond Engineering
One of the other applications for the CeramPhysics SSP valve and the Garrock valve controller is
high-low (and high-off) control for maintaining the temperature of furnaces. The Garrock controller is
also capable of oxygen trim control. The Garrock controller used for oscillating combustion is actually an
enhancement of the Garrock controller used for high-low control.
As a follow-on to a project7 at GTI that involved the development of the SSP valve and the high-
low controller, a burner-valve-controller package was being put together by Diamond Engineering†† for a
field demonstration on a continuous annealing furnace. Since the oscillating combustion enhancements to
the Garrock high-controller were already in place by that time, the opportunity arose in December 1996 to
test oscillating combustion with this burner-valve-controller package on a test furnace at Diamond
Engineering’s facilities in Fort Wayne, Indiana.
The test furnace at Diamond Engineering is about 8' long by 4' wide by 2' tall. Refractory bricks
line the walls and the floor of the furnace and fiber insulation lines the ceiling. The furnace contains a
60" long by 5" diameter metal radiant U-tube, mounted in a horizontal-horizontal position, i.e., the two
legs of the tube lie in one plane parallel to the ground. A Diamond Engineering Mark IX burner (see
Figure 52) was attached to the tube’s left leg, while an elbow and 2' long duct was attached to the right
leg. No recuperator was installed. Thermocouples were installed along the tube to measure temperature
uniformity. Combustion air was supplied by a regenerative blower through a Kromschroder solenoid-
type butterfly valve and a manual trim valve. A bleed valve was installed after the blower to relieve
pressure during off-fire cycles. Natural gas was supplied through a dry gas meter and safety train.
A CeramPhysics model 5 SSP valve was installed on the gas line about 6" and two 90° elbows
before the burner. The valve was mounted with the axial end as the inlet and the side opening as the
outlet. This arrangement allows for a higher valve flow capacity under certain levels of gas inlet pressure.
The valve was connected to a Garrock High-Low controller (HLC). The HLC was connected to the
furnace temperature’s controller for high-off control. The low fire condition of the HLC and the air and
gas valves were set for off fire rather than low fire as this approach (high-off) reduces hot spots on the
radiant tube near the burner that would occur during low fire.
†† Diamond Engineering was subsequently bought out by Maxon Corporation, and Diamond Engineering’s facilities in Fort Wayne, Indiana, were moved to Maxon’s corporate headquarters in Muncie, Indiana.
(61111 final report.doc) 53
Figure 52. SCHEMATIC OF DIAMOND ENGINEERING MARK IX RADIANT TUBE BURNER
During operation, the furnace temperature was about 1250°F and the tube’s exhaust temperature
was about 1500°F. An Enerac model 3000 Combustion Analyzer was used to measure and set oxygen
levels in the exhaust. A stainless steel probe was inserted into the exhaust end of the tube with the inlet of
the probe at the furnace wall. The Enerac was also used to measure NOx and CO levels in the exhaust.
The oxygen cell in the Enerac had to be replaced before the testing. The NOx cell was replaced before the
trip, but after installation the cell was found to have been the wrong working range, so all NOx
measurements reported here are proportional to the actual value. This does not affect any percent
reduction measurements though. A baseline NOx reading was taken with the Enerac during steady gas
and air flows at 2.8% oxygen in the exhaust and a gas flow of about 180 SCF/h. The Enerac was
calibrated with this reading scaled to read 105 ppmv.
An Omega model PX236 high-speed pressure sensor was installed on a tee between the SSP
valve and the burner. It was connected through a Dwyer/Love model 4380-II voltage amplifier to a
DataQ portable data acquisition system (DAS). The DAS’s display was set up to show the sensor’s
output at 50 samples/sec.
The Garrock High-Low Controller (HLC) was programmed for oscillating combustion mode at 5
Hz. The SSP valve setting on the HLC was reduced from 100% (wide open) to 90% and the amplitude on
oscillations was set at 10%, i.e., the valve was set to oscillate from 80% open to 100% open. At this
condition, the DAS showed no pressure pulses downstream of the valve. The valve setting on the HLC
was then reduced to 80% and the amplitude increased to 20%. A small 5 Hz ripple was now seen in the
pressure pulses on the DAS. The valve’s actuator could be felt to be oscillating. The gas flow rate
dropped slightly and the oxygen level in the exhaust rose slightly. No change in NOx readings was
noticed on the Enerac 3000 portable combustion analyzer. The valve setting on the HLC was next
reduced to 50% and the amplitude increased to 50%. Large, 5-Hz pressure pulses were now shown on the
(61111 final report.doc) 54
DAS. The valve’s actuator could now be seen to be oscillating. The gas flow rate dropped again and the
oxygen level in the exhaust rose. The gas supply pressure was raised at the gas regulator to compensate
for the drop in flow rate. The NOx reading on the Enerac decreased to about 89 ppmv. The CO reading
on the Enerac remained low.
The HLC was then set for a frequency of 3 Hz, but, while the HLC displayed 3 Hz, the valve was
still oscillating at 5 Hz. CeramPhysics was called to resolve this problem. CeramPhysics referred GTI to
Garrock, who explained that for a change in frequency to be accepted by the HLC, the HLC has to be
toggled from high fire to low (off) fire and then from low fire to high fire.
The system was left to oscillate at 5 Hz during a lunch break. After the break, the furnace was
still operating, but was not oscillating as the DAS show no pressure pulses downstream of the valve. The
HLC still showed an oscillation amplitude of 50%, but its display initially jumped to 0% when an attempt
was made to adjust this value. The HLC was then reset for 50% amplitude and the frequency was reset
for 3 Hz. The HLC was toggled from high fire to low fire and then from low fire to high fire. The
oscillations again stopped, but resetting the amplitude to 50% started the oscillations at the desired 3 Hz.
The zeroing of the amplitude after high-low and low-high toggles was documented and later forwarded to
Garrock along with other observations of the HLC’s operation. Apparently during the break the furnace’s
temperature controller toggled the HLC to low (off) fire when its set point was reached and later to high
fire when heat was needed. The HLC was then put in manual mode to avoid any additional automatic
requests for toggling the firing condition.
The duty cycle was adjusted from 50% to 40% and to 60%. In each case this value represents the
percentage of time during each oscillation cycle that the flow rate is high. Only small changes were seen
in the pressure pulses and no effect was seen on NOx emissions. Also, the average gas flow changed
slightly each time. The HLC was reset to 50% for the remainder of the tests.
Measurements of NOx and CO were taken for oscillation frequency of 1, 2, and 3 Hz. NOx
readings were 34, 48, and 70 ppmv, respectively, indicating 65% reduction in NOx was achievable. CO
levels were off-scale for 1 and 2 Hz and less than 100 for 3 Hz. At 1 and 2 Hz, the flame was observed to
extend out the exhaust stack, corroborating the CO readings. GTI suggested to Diamond that the gas
orifice size in the burner be doubled in area to lower the gas velocity.
Hot Water Boiler at Gas Technology Institute
One potential field site for Task 4 was a package boiler at a chemical plant. To gage the potential
of oscillating combustion on a boiler, GTI decided to conduct a field test on one of the hot water boilers at
its headquarters in Des Plaines, IL. The boilers are used for building heating in winter and also for
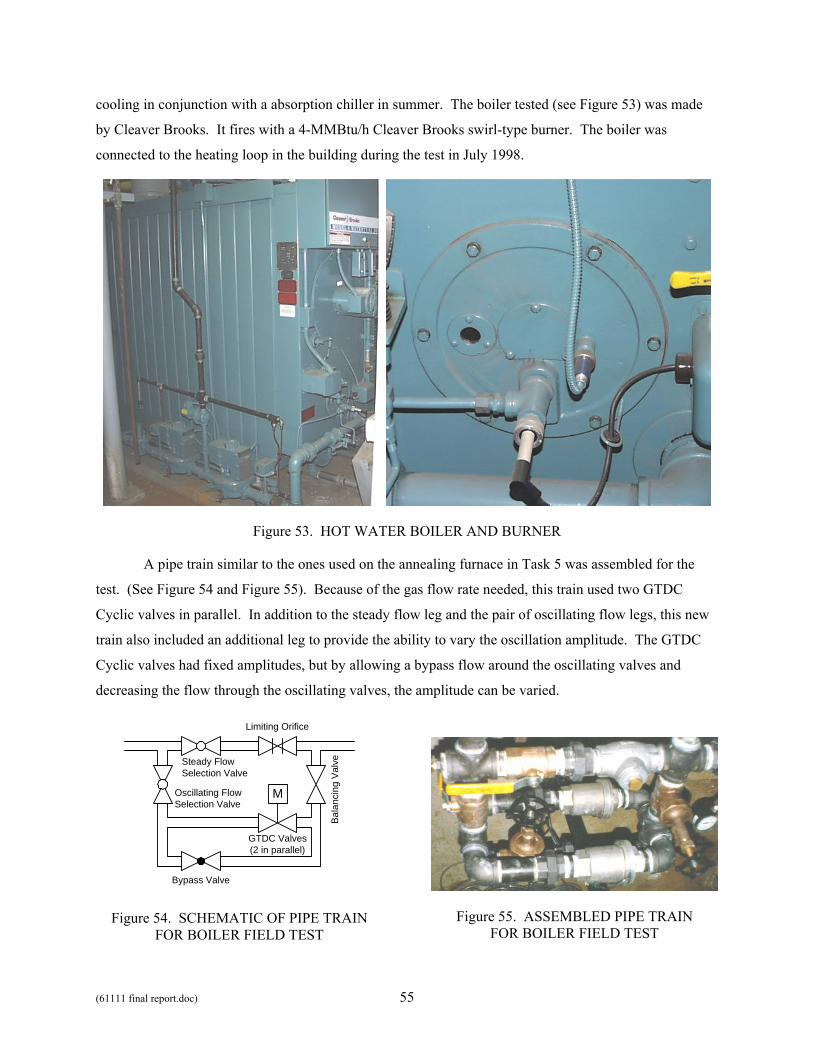
(61111 final report.doc) 55
cooling in conjunction with a absorption chiller in summer. The boiler tested (see Figure 53) was made
by Cleaver Brooks. It fires with a 4-MMBtu/h Cleaver Brooks swirl-type burner. The boiler was
connected to the heating loop in the building during the test in July 1998.
Figure 53. HOT WATER BOILER AND BURNER
A pipe train similar to the ones used on the annealing furnace in Task 5 was assembled for the
test. (See Figure 54 and Figure 55). Because of the gas flow rate needed, this train used two GTDC
Cyclic valves in parallel. In addition to the steady flow leg and the pair of oscillating flow legs, this new
train also included an additional leg to provide the ability to vary the oscillation amplitude. The GTDC
Cyclic valves had fixed amplitudes, but by allowing a bypass flow around the oscillating valves and
decreasing the flow through the oscillating valves, the amplitude can be varied.
M
Limiting Orifice
GTDC Valves(2 in parallel)
Bypass Valve
Bal
anci
ng V
alveSteady Flow
Selection Valve
Oscillating FlowSelection Valve
Figure 54. SCHEMATIC OF PIPE TRAIN FOR BOILER FIELD TEST
Figure 55. ASSEMBLED PIPE TRAIN FOR BOILER FIELD TEST
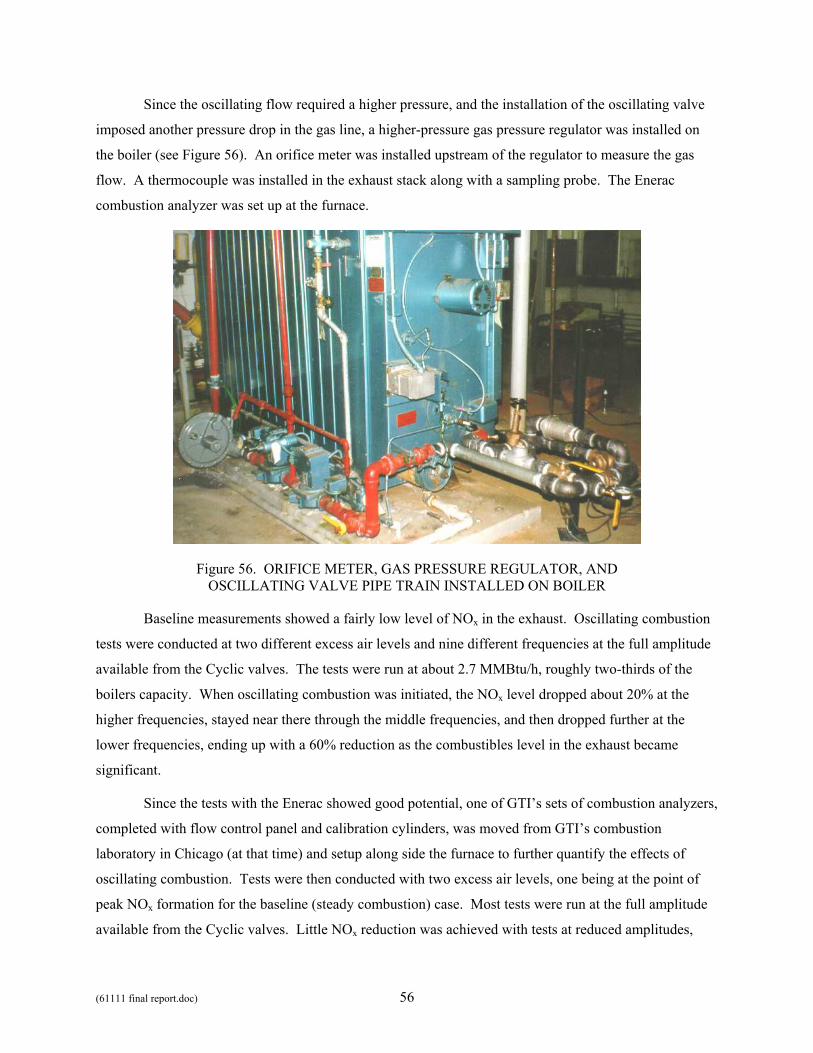
(61111 final report.doc) 56
Since the oscillating flow required a higher pressure, and the installation of the oscillating valve
imposed another pressure drop in the gas line, a higher-pressure gas pressure regulator was installed on
the boiler (see Figure 56). An orifice meter was installed upstream of the regulator to measure the gas
flow. A thermocouple was installed in the exhaust stack along with a sampling probe. The Enerac
combustion analyzer was set up at the furnace.
Figure 56. ORIFICE METER, GAS PRESSURE REGULATOR, AND OSCILLATING VALVE PIPE TRAIN INSTALLED ON BOILER
Baseline measurements showed a fairly low level of NOx in the exhaust. Oscillating combustion
tests were conducted at two different excess air levels and nine different frequencies at the full amplitude
available from the Cyclic valves. The tests were run at about 2.7 MMBtu/h, roughly two-thirds of the
boilers capacity. When oscillating combustion was initiated, the NOx level dropped about 20% at the
higher frequencies, stayed near there through the middle frequencies, and then dropped further at the
lower frequencies, ending up with a 60% reduction as the combustibles level in the exhaust became
significant.
Since the tests with the Enerac showed good potential, one of GTI’s sets of combustion analyzers,
completed with flow control panel and calibration cylinders, was moved from GTI’s combustion
laboratory in Chicago (at that time) and setup along side the furnace to further quantify the effects of
oscillating combustion. Tests were then conducted with two excess air levels, one being at the point of
peak NOx formation for the baseline (steady combustion) case. Most tests were run at the full amplitude
available from the Cyclic valves. Little NOx reduction was achieved with tests at reduced amplitudes,
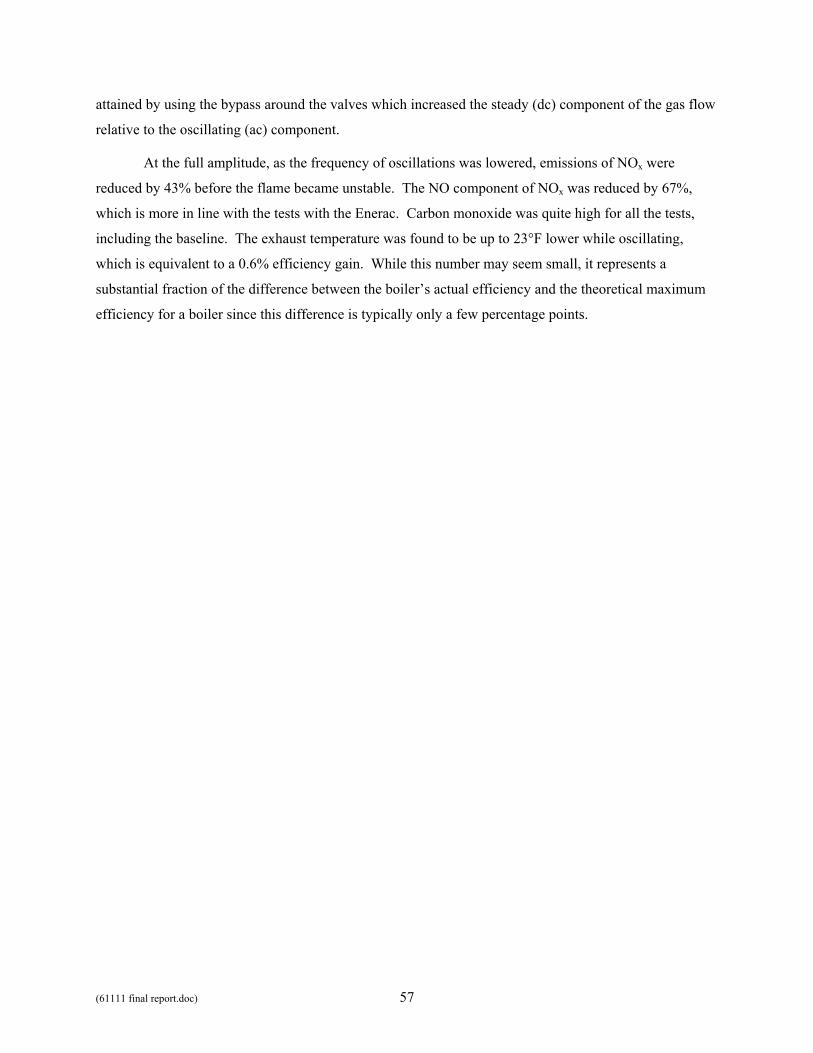
(61111 final report.doc) 57
attained by using the bypass around the valves which increased the steady (dc) component of the gas flow
relative to the oscillating (ac) component.
At the full amplitude, as the frequency of oscillations was lowered, emissions of NOx were
reduced by 43% before the flame became unstable. The NO component of NOx was reduced by 67%,
which is more in line with the tests with the Enerac. Carbon monoxide was quite high for all the tests,
including the baseline. The exhaust temperature was found to be up to 23°F lower while oscillating,
which is equivalent to a 0.6% efficiency gain. While this number may seem small, it represents a
substantial fraction of the difference between the boiler’s actual efficiency and the theoretical maximum
efficiency for a boiler since this difference is typically only a few percentage points.
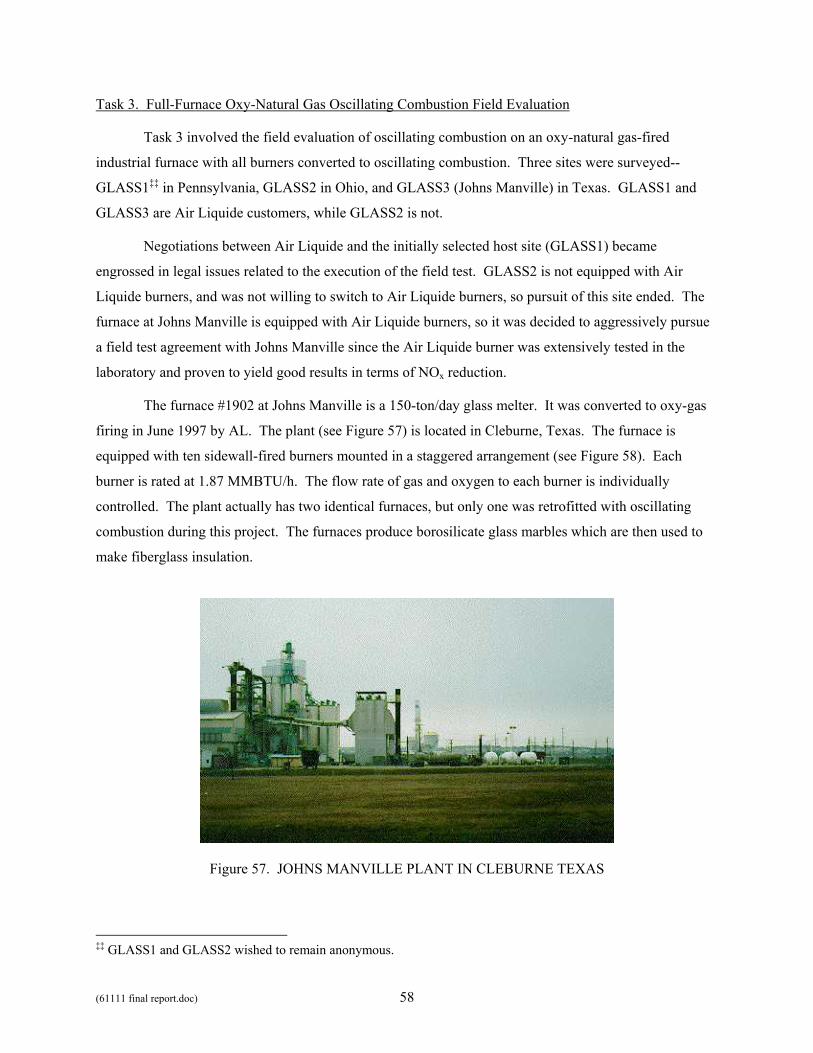
(61111 final report.doc) 58
Task 3. Full-Furnace Oxy-Natural Gas Oscillating Combustion Field Evaluation
Task 3 involved the field evaluation of oscillating combustion on an oxy-natural gas-fired
industrial furnace with all burners converted to oscillating combustion. Three sites were surveyed--
GLASS1‡‡ in Pennsylvania, GLASS2 in Ohio, and GLASS3 (Johns Manville) in Texas. GLASS1 and
GLASS3 are Air Liquide customers, while GLASS2 is not.
Negotiations between Air Liquide and the initially selected host site (GLASS1) became
engrossed in legal issues related to the execution of the field test. GLASS2 is not equipped with Air
Liquide burners, and was not willing to switch to Air Liquide burners, so pursuit of this site ended. The
furnace at Johns Manville is equipped with Air Liquide burners, so it was decided to aggressively pursue
a field test agreement with Johns Manville since the Air Liquide burner was extensively tested in the
laboratory and proven to yield good results in terms of NOx reduction.
The furnace #1902 at Johns Manville is a 150-ton/day glass melter. It was converted to oxy-gas
firing in June 1997 by AL. The plant (see Figure 57) is located in Cleburne, Texas. The furnace is
equipped with ten sidewall-fired burners mounted in a staggered arrangement (see Figure 58). Each
burner is rated at 1.87 MMBTU/h. The flow rate of gas and oxygen to each burner is individually
controlled. The plant actually has two identical furnaces, but only one was retrofitted with oscillating
combustion during this project. The furnaces produce borosilicate glass marbles which are then used to
make fiberglass insulation.
Figure 57. JOHNS MANVILLE PLANT IN CLEBURNE TEXAS
‡‡ GLASS1 and GLASS2 wished to remain anonymous.
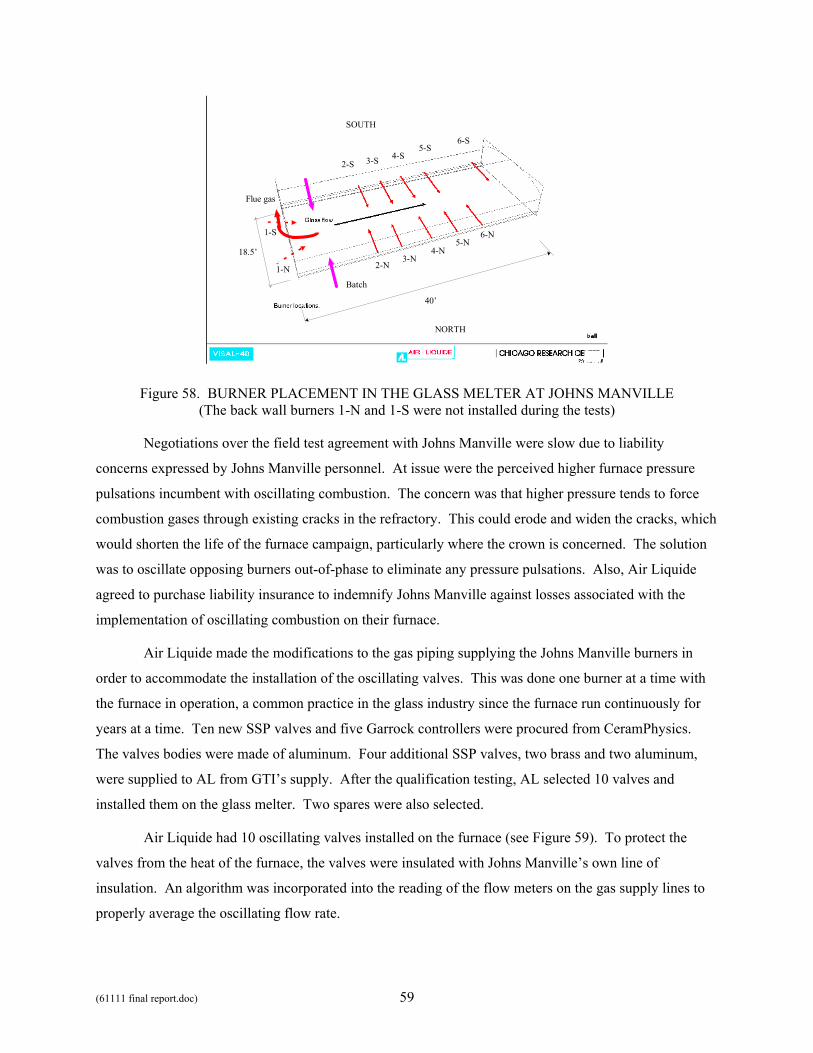
(61111 final report.doc) 59
40’
18.5’2-N
3-N4-N
5-N6-N
2-S 3-S 4-S5-S
6-S
SOUTH
NORTH
Batch
Flue gas
1-N
1-S
Figure 58. BURNER PLACEMENT IN THE GLASS MELTER AT JOHNS MANVILLE (The back wall burners 1-N and 1-S were not installed during the tests)
Negotiations over the field test agreement with Johns Manville were slow due to liability
concerns expressed by Johns Manville personnel. At issue were the perceived higher furnace pressure
pulsations incumbent with oscillating combustion. The concern was that higher pressure tends to force
combustion gases through existing cracks in the refractory. This could erode and widen the cracks, which
would shorten the life of the furnace campaign, particularly where the crown is concerned. The solution
was to oscillate opposing burners out-of-phase to eliminate any pressure pulsations. Also, Air Liquide
agreed to purchase liability insurance to indemnify Johns Manville against losses associated with the
implementation of oscillating combustion on their furnace.
Air Liquide made the modifications to the gas piping supplying the Johns Manville burners in
order to accommodate the installation of the oscillating valves. This was done one burner at a time with
the furnace in operation, a common practice in the glass industry since the furnace run continuously for
years at a time. Ten new SSP valves and five Garrock controllers were procured from CeramPhysics.
The valves bodies were made of aluminum. Four additional SSP valves, two brass and two aluminum,
were supplied to AL from GTI’s supply. After the qualification testing, AL selected 10 valves and
installed them on the glass melter. Two spares were also selected.
Air Liquide had 10 oscillating valves installed on the furnace (see Figure 59). To protect the
valves from the heat of the furnace, the valves were insulated with Johns Manville’s own line of
insulation. An algorithm was incorporated into the reading of the flow meters on the gas supply lines to
properly average the oscillating flow rate.
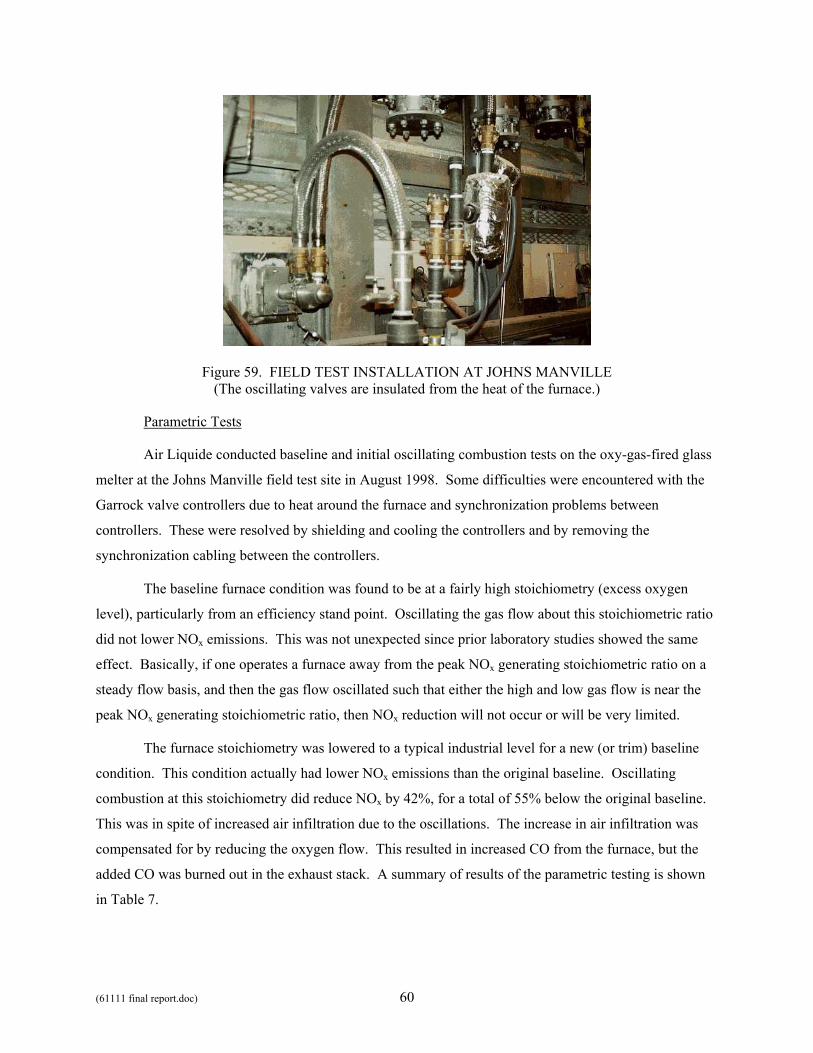
(61111 final report.doc) 60
Figure 59. FIELD TEST INSTALLATION AT JOHNS MANVILLE (The oscillating valves are insulated from the heat of the furnace.)
Parametric Tests
Air Liquide conducted baseline and initial oscillating combustion tests on the oxy-gas-fired glass
melter at the Johns Manville field test site in August 1998. Some difficulties were encountered with the
Garrock valve controllers due to heat around the furnace and synchronization problems between
controllers. These were resolved by shielding and cooling the controllers and by removing the
synchronization cabling between the controllers.
The baseline furnace condition was found to be at a fairly high stoichiometry (excess oxygen
level), particularly from an efficiency stand point. Oscillating the gas flow about this stoichiometric ratio
did not lower NOx emissions. This was not unexpected since prior laboratory studies showed the same
effect. Basically, if one operates a furnace away from the peak NOx generating stoichiometric ratio on a
steady flow basis, and then the gas flow oscillated such that either the high and low gas flow is near the
peak NOx generating stoichiometric ratio, then NOx reduction will not occur or will be very limited.
The furnace stoichiometry was lowered to a typical industrial level for a new (or trim) baseline
condition. This condition actually had lower NOx emissions than the original baseline. Oscillating
combustion at this stoichiometry did reduce NOx by 42%, for a total of 55% below the original baseline.
This was in spite of increased air infiltration due to the oscillations. The increase in air infiltration was
compensated for by reducing the oxygen flow. This resulted in increased CO from the furnace, but the
added CO was burned out in the exhaust stack. A summary of results of the parametric testing is shown
in Table 7.
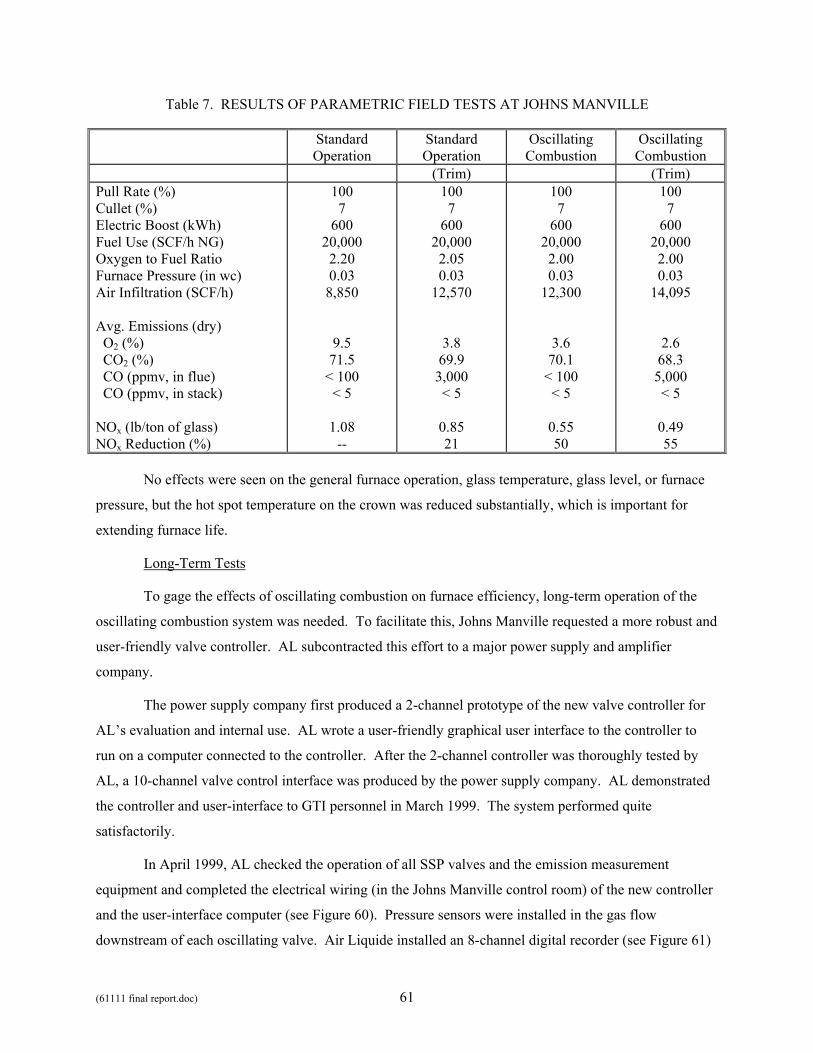
(61111 final report.doc) 61
Table 7. RESULTS OF PARAMETRIC FIELD TESTS AT JOHNS MANVILLE
Standard Operation
Standard Operation
Oscillating Combustion
Oscillating Combustion
(Trim) (Trim) Pull Rate (%) Cullet (%) Electric Boost (kWh) Fuel Use (SCF/h NG) Oxygen to Fuel Ratio Furnace Pressure (in wc) Air Infiltration (SCF/h) Avg. Emissions (dry) O2 (%) CO2 (%) CO (ppmv, in flue) CO (ppmv, in stack) NOx (lb/ton of glass) NOx Reduction (%)
100 7
600 20,000 2.20 0.03 8,850
9.5 71.5
< 100 < 5
1.08
--
100 7
600 20,000 2.05 0.03
12,570
3.8 69.9 3,000 < 5
0.85 21
100 7
600 20,000 2.00 0.03
12,300
3.6 70.1
< 100 < 5
0.55 50
100 7
600 20,000 2.00 0.03
14,095
2.6 68.3 5,000 < 5
0.49 55
No effects were seen on the general furnace operation, glass temperature, glass level, or furnace
pressure, but the hot spot temperature on the crown was reduced substantially, which is important for
extending furnace life.
Long-Term Tests
To gage the effects of oscillating combustion on furnace efficiency, long-term operation of the
oscillating combustion system was needed. To facilitate this, Johns Manville requested a more robust and
user-friendly valve controller. AL subcontracted this effort to a major power supply and amplifier
company.
The power supply company first produced a 2-channel prototype of the new valve controller for
AL’s evaluation and internal use. AL wrote a user-friendly graphical user interface to the controller to
run on a computer connected to the controller. After the 2-channel controller was thoroughly tested by
AL, a 10-channel valve control interface was produced by the power supply company. AL demonstrated
the controller and user-interface to GTI personnel in March 1999. The system performed quite
satisfactorily.
In April 1999, AL checked the operation of all SSP valves and the emission measurement
equipment and completed the electrical wiring (in the Johns Manville control room) of the new controller
and the user-interface computer (see Figure 60). Pressure sensors were installed in the gas flow
downstream of each oscillating valve. Air Liquide installed an 8-channel digital recorder (see Figure 61)
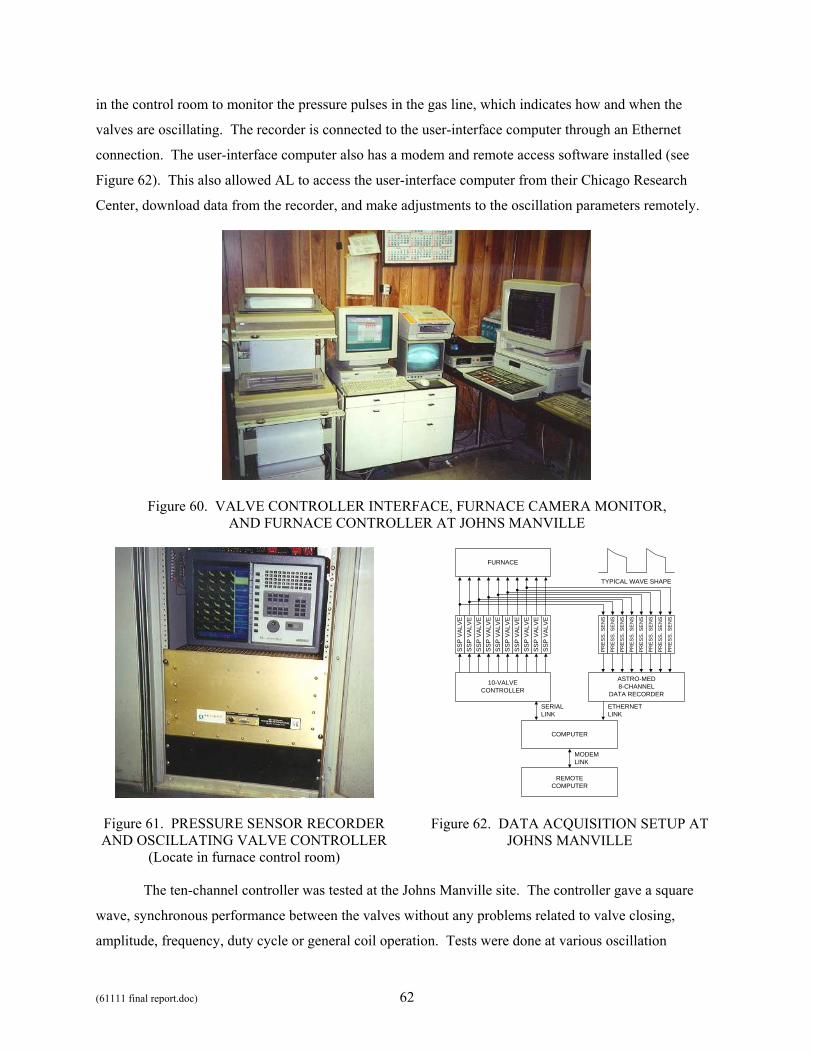
(61111 final report.doc) 62
in the control room to monitor the pressure pulses in the gas line, which indicates how and when the
valves are oscillating. The recorder is connected to the user-interface computer through an Ethernet
connection. The user-interface computer also has a modem and remote access software installed (see
Figure 62). This also allowed AL to access the user-interface computer from their Chicago Research
Center, download data from the recorder, and make adjustments to the oscillation parameters remotely.
Figure 60. VALVE CONTROLLER INTERFACE, FURNACE CAMERA MONITOR, AND FURNACE CONTROLLER AT JOHNS MANVILLE
Figure 61. PRESSURE SENSOR RECORDER AND OSCILLATING VALVE CONTROLLER
(Locate in furnace control room)
10-VALVECONTROLLER
COMPUTER
ASTRO-MED8-CHANNEL
DATA RECORDER
REMOTECOMPUTER
SSP
VALV
E
FURNACE
PR
ES
S. S
EN
S.
PR
ES
S. S
EN
S.
PR
ES
S. S
EN
S.
PR
ES
S. S
EN
S.
PR
ES
S. S
EN
S.
PR
ES
S. S
EN
S.
PR
ES
S. S
EN
S.
PR
ES
S. S
EN
S.
SSP
VALV
ESS
P VA
LVE
SSP
VALV
ESS
P VA
LVE
SSP
VALV
ESS
P VA
LVE
SSP
VALV
ESS
P VA
LVE
SSP
VALV
E
TYPICAL WAVE SHAPE
SERIALLINK
ETHERNETLINK
MODEMLINK
Figure 62. DATA ACQUISITION SETUP AT JOHNS MANVILLE
The ten-channel controller was tested at the Johns Manville site. The controller gave a square
wave, synchronous performance between the valves without any problems related to valve closing,
amplitude, frequency, duty cycle or general coil operation. Tests were done at various oscillation
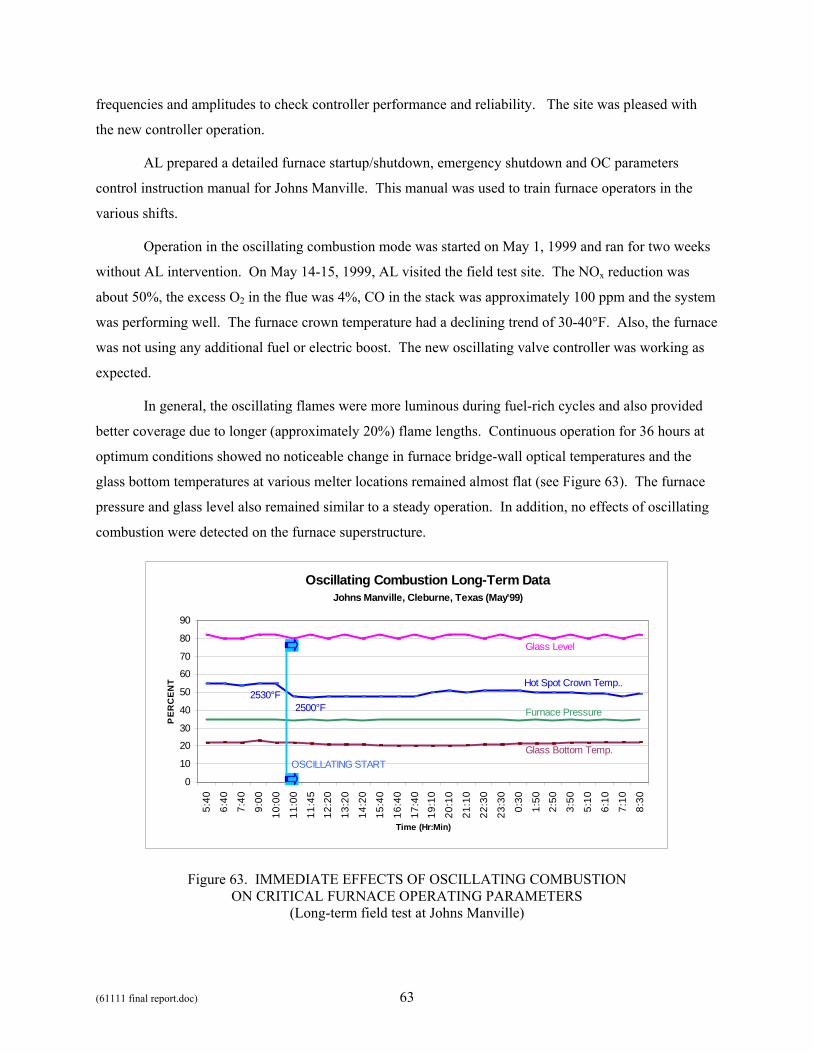
(61111 final report.doc) 63
frequencies and amplitudes to check controller performance and reliability. The site was pleased with
the new controller operation.
AL prepared a detailed furnace startup/shutdown, emergency shutdown and OC parameters
control instruction manual for Johns Manville. This manual was used to train furnace operators in the
various shifts.
Operation in the oscillating combustion mode was started on May 1, 1999 and ran for two weeks
without AL intervention. On May 14-15, 1999, AL visited the field test site. The NOx reduction was
about 50%, the excess O2 in the flue was 4%, CO in the stack was approximately 100 ppm and the system
was performing well. The furnace crown temperature had a declining trend of 30-40°F. Also, the furnace
was not using any additional fuel or electric boost. The new oscillating valve controller was working as
expected.
In general, the oscillating flames were more luminous during fuel-rich cycles and also provided
better coverage due to longer (approximately 20%) flame lengths. Continuous operation for 36 hours at
optimum conditions showed no noticeable change in furnace bridge-wall optical temperatures and the
glass bottom temperatures at various melter locations remained almost flat (see Figure 63). The furnace
pressure and glass level also remained similar to a steady operation. In addition, no effects of oscillating
combustion were detected on the furnace superstructure.
Oscillating Combustion Long-Term DataJohns Manville, Cleburne, Texas (May'99)
0
10
20
30
40
50
60
70
80
90
5:40
6:40
7:40
9:00
10:0
0
11:0
0
11:4
512
:20
13:2
0
14:2
0
15:4
0
16:4
0
17:4
019
:10
20:1
0
21:1
0
22:3
0
23:3
0
0:30
1:50
2:50
3:50
5:10
6:10
7:10
8:30
Time (Hr:Min)
PER
CEN
T
OSCILLATING START
Hot Spot Crown Temp..
Glass Level
Furnace Pressure
Glass Bottom Temp.
2530°F2500°F
Figure 63. IMMEDIATE EFFECTS OF OSCILLATING COMBUSTION ON CRITICAL FURNACE OPERATING PARAMETERS
(Long-term field test at Johns Manville)
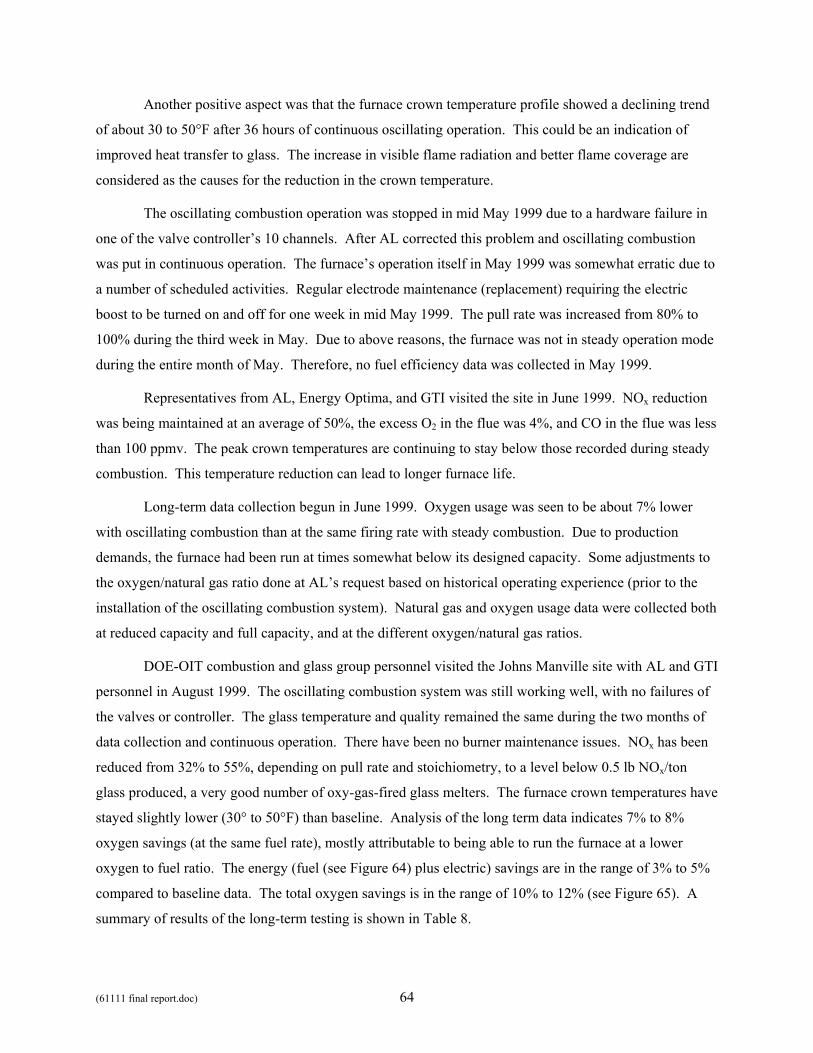
(61111 final report.doc) 64
Another positive aspect was that the furnace crown temperature profile showed a declining trend
of about 30 to 50°F after 36 hours of continuous oscillating operation. This could be an indication of
improved heat transfer to glass. The increase in visible flame radiation and better flame coverage are
considered as the causes for the reduction in the crown temperature.
The oscillating combustion operation was stopped in mid May 1999 due to a hardware failure in
one of the valve controller’s 10 channels. After AL corrected this problem and oscillating combustion
was put in continuous operation. The furnace’s operation itself in May 1999 was somewhat erratic due to
a number of scheduled activities. Regular electrode maintenance (replacement) requiring the electric
boost to be turned on and off for one week in mid May 1999. The pull rate was increased from 80% to
100% during the third week in May. Due to above reasons, the furnace was not in steady operation mode
during the entire month of May. Therefore, no fuel efficiency data was collected in May 1999.
Representatives from AL, Energy Optima, and GTI visited the site in June 1999. NOx reduction
was being maintained at an average of 50%, the excess O2 in the flue was 4%, and CO in the flue was less
than 100 ppmv. The peak crown temperatures are continuing to stay below those recorded during steady
combustion. This temperature reduction can lead to longer furnace life.
Long-term data collection begun in June 1999. Oxygen usage was seen to be about 7% lower
with oscillating combustion than at the same firing rate with steady combustion. Due to production
demands, the furnace had been run at times somewhat below its designed capacity. Some adjustments to
the oxygen/natural gas ratio done at AL’s request based on historical operating experience (prior to the
installation of the oscillating combustion system). Natural gas and oxygen usage data were collected both
at reduced capacity and full capacity, and at the different oxygen/natural gas ratios.
DOE-OIT combustion and glass group personnel visited the Johns Manville site with AL and GTI
personnel in August 1999. The oscillating combustion system was still working well, with no failures of
the valves or controller. The glass temperature and quality remained the same during the two months of
data collection and continuous operation. There have been no burner maintenance issues. NOx has been
reduced from 32% to 55%, depending on pull rate and stoichiometry, to a level below 0.5 lb NOx/ton
glass produced, a very good number of oxy-gas-fired glass melters. The furnace crown temperatures have
stayed slightly lower (30° to 50°F) than baseline. Analysis of the long term data indicates 7% to 8%
oxygen savings (at the same fuel rate), mostly attributable to being able to run the furnace at a lower
oxygen to fuel ratio. The energy (fuel (see Figure 64) plus electric) savings are in the range of 3% to 5%
compared to baseline data. The total oxygen savings is in the range of 10% to 12% (see Figure 65). A
summary of results of the long-term testing is shown in Table 8.
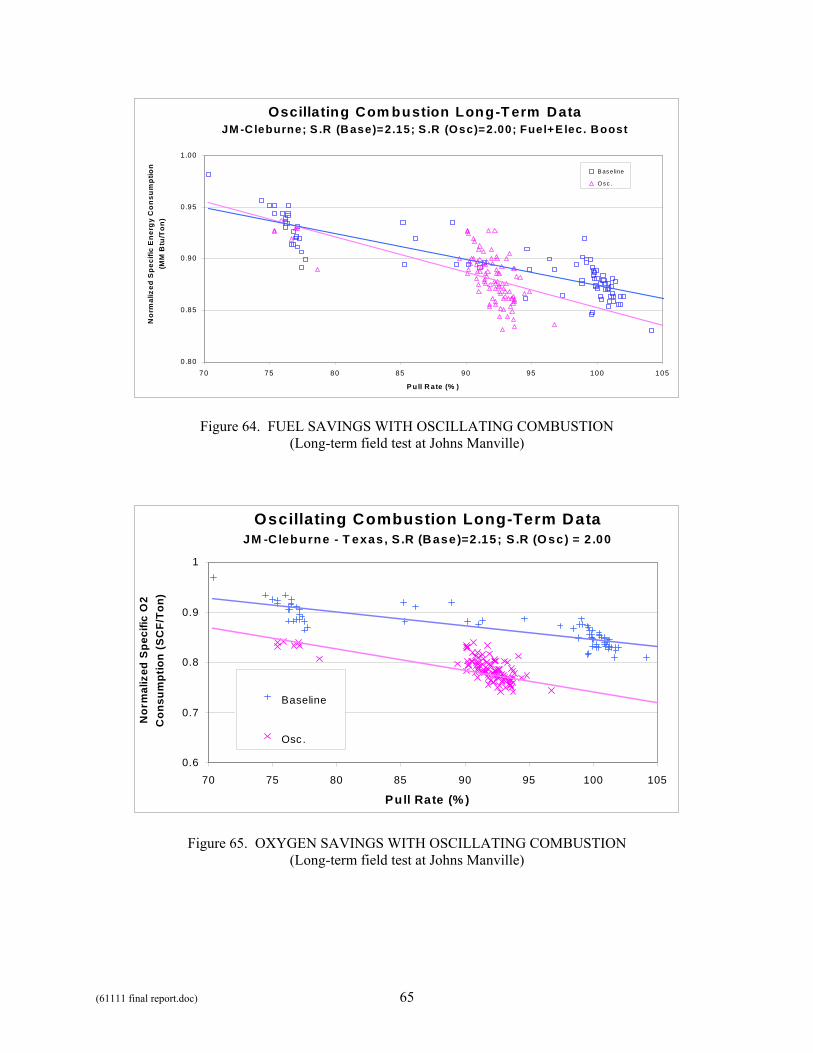
(61111 final report.doc) 65
Oscillating Com bustion Long-T erm DataJM -Cleburne; S .R (Base)=2.15; S .R (Osc)=2.00; Fuel+E lec. Boost
0.80
0.85
0.90
0.95
1.00
70 75 80 85 90 95 100 105
P ull R ate (% )
No
rmal
ized
Sp
ecifi
c E
ner
gy
Co
nsu
mp
tion
(M
M B
tu/T
on
)B as eline
O s c .
Figure 64. FUEL SAVINGS WITH OSCILLATING COMBUSTION (Long-term field test at Johns Manville)
Oscillating Combustion Long-Term DataJM -C leburne - T exas , S .R (B ase)=2 .15; S .R (O sc) = 2 .00
0.6
0.7
0.8
0.9
1
70 75 80 85 90 95 100 105
Pull Rate (% )
Nor
mal
ized
Spe
cific
O2
Con
sum
ptio
n (S
CF/
Ton)
Baseline
Osc.
Figure 65. OXYGEN SAVINGS WITH OSCILLATING COMBUSTION (Long-term field test at Johns Manville)

(61111 final report.doc) 66
Table 8. RESULTS OF LONG-TERM FIELD TESTS AT JOHNS MANVILLE
Standard Operation
Oscillating Combustion
Pull Rate (%) Cullet (%) Electric Boost (kWh) Fuel Use (SCF/h NG) Oxygen to Fuel Ratio Furnace Pressure (in wc) Air Infiltration (SCF/h) Avg. Emissions (dry) O2 (%) CO2 (%) CO (ppmv, in flue) CO (ppmv, in stack) NOx (lb/ton of glass) NOx Reduction (%)
91 10
600 18,139 2.15 0.042 4,660
4.9 82.4 <100 < 5
0.57
--
91 10
600 17,413 2.00 0.042 5,100
2.9 81.8 <100 < 5
0.39 32
With the success of the long-term testing of the oscillating combustion system, it was decided to
convert the field test installation into a permanent installation. Piping and electrical modifications to the
oscillating combustion system were made to allow easier access to the burners and furnace system for
maintenance. Improved insulation was put around the oscillating valves (see Figure 66). This effort was
Figure 66. PERMANENT INSTALLATION AT JOHNS MANVILLE (The oscillating valves are in the aluminum cylinders,
insulated from the heat of the furnace.)
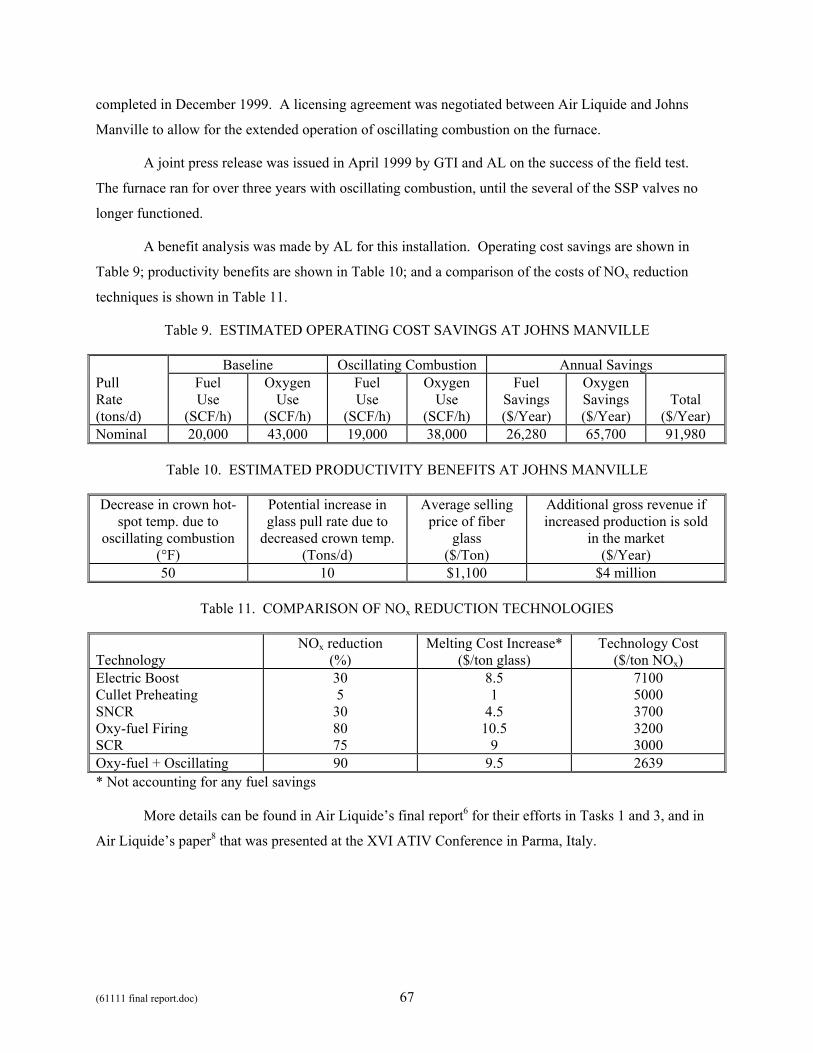
(61111 final report.doc) 67
completed in December 1999. A licensing agreement was negotiated between Air Liquide and Johns
Manville to allow for the extended operation of oscillating combustion on the furnace.
A joint press release was issued in April 1999 by GTI and AL on the success of the field test.
The furnace ran for over three years with oscillating combustion, until the several of the SSP valves no
longer functioned.
A benefit analysis was made by AL for this installation. Operating cost savings are shown in
Table 9; productivity benefits are shown in Table 10; and a comparison of the costs of NOx reduction
techniques is shown in Table 11.
Table 9. ESTIMATED OPERATING COST SAVINGS AT JOHNS MANVILLE
Baseline Oscillating Combustion Annual Savings Pull Rate (tons/d)
Fuel Use
(SCF/h)
Oxygen Use
(SCF/h)
Fuel Use
(SCF/h)
Oxygen Use
(SCF/h)
Fuel Savings ($/Year)
Oxygen Savings ($/Year)
Total
($/Year) Nominal 20,000 43,000 19,000 38,000 26,280 65,700 91,980
Table 10. ESTIMATED PRODUCTIVITY BENEFITS AT JOHNS MANVILLE
Decrease in crown hot-spot temp. due to
oscillating combustion (°F)
Potential increase in glass pull rate due to
decreased crown temp. (Tons/d)
Average selling price of fiber
glass ($/Ton)
Additional gross revenue if increased production is sold
in the market ($/Year)
50 10 $1,100 $4 million
Table 11. COMPARISON OF NOx REDUCTION TECHNOLOGIES
Technology
NOx reduction (%)
Melting Cost Increase* ($/ton glass)
Technology Cost ($/ton NOx)
Electric Boost Cullet Preheating SNCR Oxy-fuel Firing SCR
30 5
30 80 75
8.5 1
4.5 10.5
9
7100 5000 3700 3200 3000
Oxy-fuel + Oscillating 90 9.5 2639 * Not accounting for any fuel savings More details can be found in Air Liquide’s final report6 for their efforts in Tasks 1 and 3, and in
Air Liquide’s paper8 that was presented at the XVI ATIV Conference in Parma, Italy.
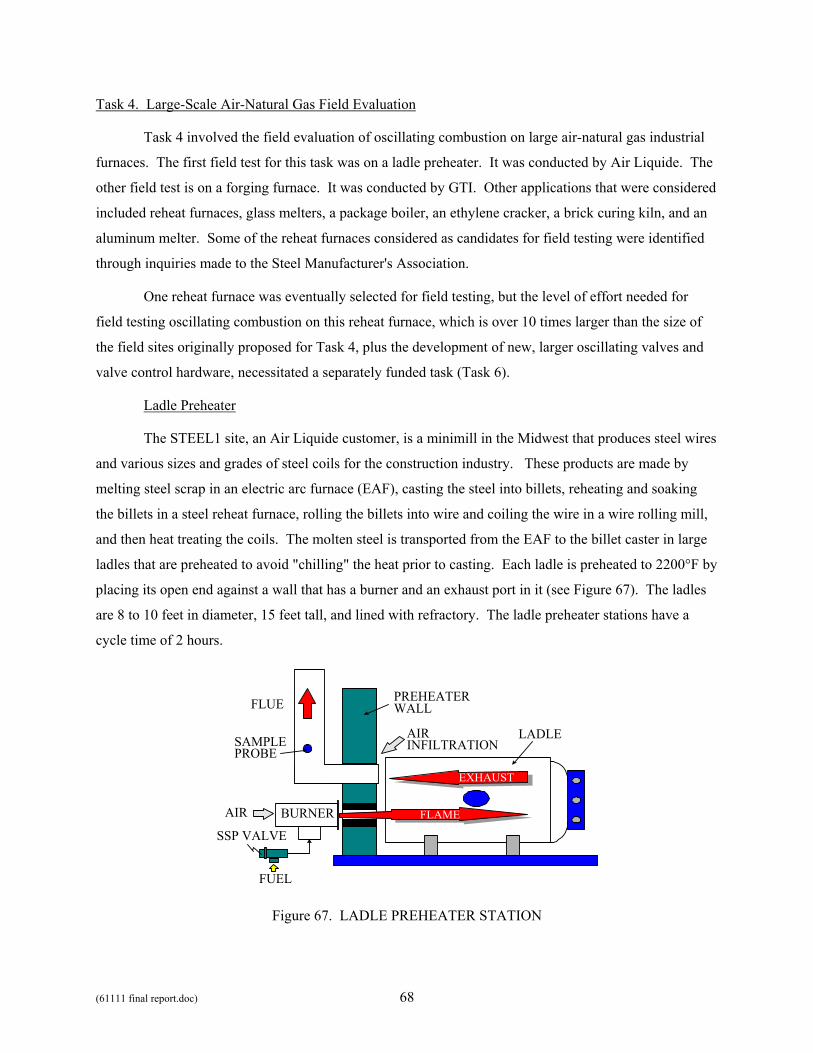
(61111 final report.doc) 68
Task 4. Large-Scale Air-Natural Gas Field Evaluation
Task 4 involved the field evaluation of oscillating combustion on large air-natural gas industrial
furnaces. The first field test for this task was on a ladle preheater. It was conducted by Air Liquide. The
other field test is on a forging furnace. It was conducted by GTI. Other applications that were considered
included reheat furnaces, glass melters, a package boiler, an ethylene cracker, a brick curing kiln, and an
aluminum melter. Some of the reheat furnaces considered as candidates for field testing were identified
through inquiries made to the Steel Manufacturer's Association.
One reheat furnace was eventually selected for field testing, but the level of effort needed for
field testing oscillating combustion on this reheat furnace, which is over 10 times larger than the size of
the field sites originally proposed for Task 4, plus the development of new, larger oscillating valves and
valve control hardware, necessitated a separately funded task (Task 6).
Ladle Preheater
The STEEL1 site, an Air Liquide customer, is a minimill in the Midwest that produces steel wires
and various sizes and grades of steel coils for the construction industry. These products are made by
melting steel scrap in an electric arc furnace (EAF), casting the steel into billets, reheating and soaking
the billets in a steel reheat furnace, rolling the billets into wire and coiling the wire in a wire rolling mill,
and then heat treating the coils. The molten steel is transported from the EAF to the billet caster in large
ladles that are preheated to avoid "chilling" the heat prior to casting. Each ladle is preheated to 2200°F by
placing its open end against a wall that has a burner and an exhaust port in it (see Figure 67). The ladles
are 8 to 10 feet in diameter, 15 feet tall, and lined with refractory. The ladle preheater stations have a
cycle time of 2 hours.
FLUE
FUEL
AIR
AIRINFILTRATION
LADLESAMPLEPROBE
EXHAUST
PREHEATERWALL
BURNER
SSP VALVEFLAME
Figure 67. LADLE PREHEATER STATION

(61111 final report.doc) 69
Each ladle preheater station is equipped with a North American model 4545-8B burner with a
maximum firing rate of 7 MMBtu/h. Ambient (non-preheated) air is used as the oxidant. The burner,
which was already obsolete at the time of the field test, is unlike conventional burners in that the air flow
is through the center while the gas is pulled in from an annular space around the air. This was useful 40
years ago, when the burner was designed, because the available natural gas pressure then was very low.
The gas flow is controlled through a standard, cross-connected air-gas ratio regulator.
Since the gas flow rate needed was more than twice the capacity of the largest SSP valve
available at that time, and since the supply pressure could not be raised high enough to compensate (even
with the replacement of the gas pressure regulator with one of larger capacity), four SSP valves were
assembled into a cluster with a common inlet and outlet. The cluster incorporated a pressure sensor on
the inlet and outlet manifolds. Ball valves were incorporated in the lines between one of the manifolds
and the valves to isolate any valve. This was useful since although four SSP valves were in the cluster,
only three were fully operational, so the fourth was isolated. The SSP valves were driven by a pair of
Garrock valve controllers.
Rather than subcontracting the installation effort, AL itself installed the valve cluster at the site to
offset the cost of the additional SSP valves and the assembly of the cluster. AL also installed their own
continuous emissions monitoring and data logging equipment at the site. The controllers were installed in
a transportable enclosure and brought to the site by AL. More details on the field test setup can be found
in AL’s final report9.
The oscillating combustion field test was conducted on several cycles over a two week period in
September 1997. Baseline testing preceded the oscillating combustion testing. During the tests, pressure
sensors mounted on the outlet manifold of the valve cluster monitored the flow rate pulses downstream of
the valve, and the flue gases at the exhaust port were sampled for NOx, CO, CO2, and O2.
Various oscillation frequencies and amplitudes were tested. The frequencies were varied between
0.5f and 3f, where f is a reference frequency. Only moderate oscillation amplitudes were used; higher
amplitudes were not possible since they caused the flame to extend beyond the exhaust port and impinge
on an overhead platform.
The results from the testing appear in Table 12. The baseline emissions data are an average of
two tests. The average baseline NOx emissions corrected to 0% O2 were 100 ppmv. During oscillating
combustion, NOx was reduced by 30% at a similar ladle temperature. NOx emissions went up with
temperature after that, but this is expected since NOx is highly temperature dependent. Further reductions
in NOx may have been possible if the oscillation amplitudes could have been increased. CO emissions
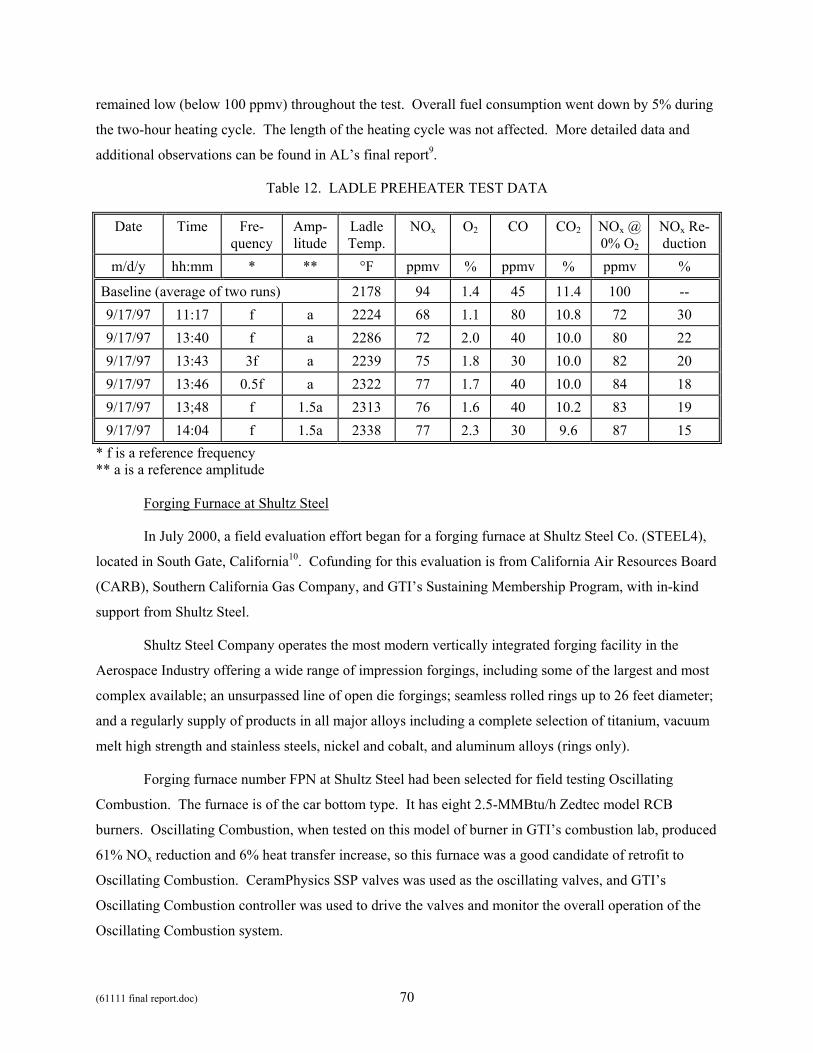
(61111 final report.doc) 70
remained low (below 100 ppmv) throughout the test. Overall fuel consumption went down by 5% during
the two-hour heating cycle. The length of the heating cycle was not affected. More detailed data and
additional observations can be found in AL’s final report9.
Table 12. LADLE PREHEATER TEST DATA
Date Time Fre-quency
Amp-litude
Ladle Temp.
NOx O2 CO CO2 NOx @ 0% O2
NOx Re-duction
m/d/y hh:mm * ** °F ppmv % ppmv % ppmv %
Baseline (average of two runs) 2178 94 1.4 45 11.4 100 -- 9/17/97 11:17 f a 2224 68 1.1 80 10.8 72 30 9/17/97 13:40 f a 2286 72 2.0 40 10.0 80 22 9/17/97 13:43 3f a 2239 75 1.8 30 10.0 82 20 9/17/97 13:46 0.5f a 2322 77 1.7 40 10.0 84 18 9/17/97 13;48 f 1.5a 2313 76 1.6 40 10.2 83 19 9/17/97 14:04 f 1.5a 2338 77 2.3 30 9.6 87 15
* f is a reference frequency ** a is a reference amplitude
Forging Furnace at Shultz Steel
In July 2000, a field evaluation effort began for a forging furnace at Shultz Steel Co. (STEEL4),
located in South Gate, California10. Cofunding for this evaluation is from California Air Resources Board
(CARB), Southern California Gas Company, and GTI’s Sustaining Membership Program, with in-kind
support from Shultz Steel.
Shultz Steel Company operates the most modern vertically integrated forging facility in the
Aerospace Industry offering a wide range of impression forgings, including some of the largest and most
complex available; an unsurpassed line of open die forgings; seamless rolled rings up to 26 feet diameter;
and a regularly supply of products in all major alloys including a complete selection of titanium, vacuum
melt high strength and stainless steels, nickel and cobalt, and aluminum alloys (rings only).
Forging furnace number FPN at Shultz Steel had been selected for field testing Oscillating
Combustion. The furnace is of the car bottom type. It has eight 2.5-MMBtu/h Zedtec model RCB
burners. Oscillating Combustion, when tested on this model of burner in GTI’s combustion lab, produced
61% NOx reduction and 6% heat transfer increase, so this furnace was a good candidate of retrofit to
Oscillating Combustion. CeramPhysics SSP valves was used as the oscillating valves, and GTI’s
Oscillating Combustion controller was used to drive the valves and monitor the overall operation of the
Oscillating Combustion system.
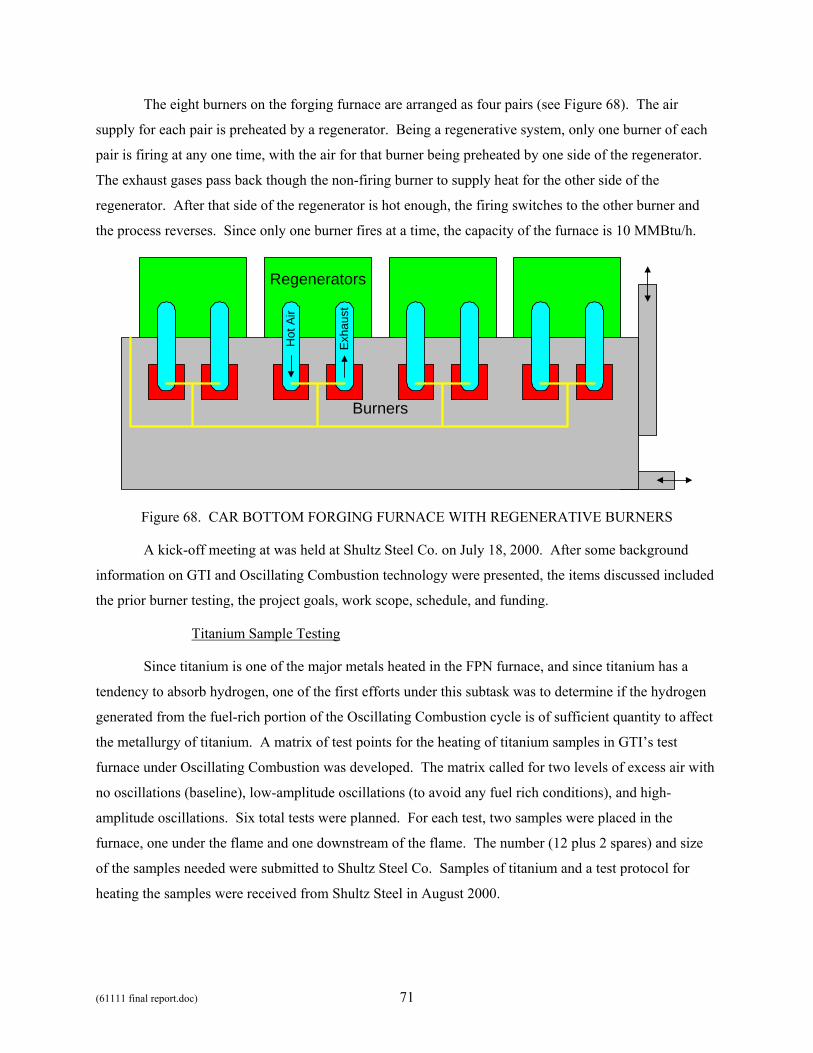
(61111 final report.doc) 71
The eight burners on the forging furnace are arranged as four pairs (see Figure 68). The air
supply for each pair is preheated by a regenerator. Being a regenerative system, only one burner of each
pair is firing at any one time, with the air for that burner being preheated by one side of the regenerator.
The exhaust gases pass back though the non-firing burner to supply heat for the other side of the
regenerator. After that side of the regenerator is hot enough, the firing switches to the other burner and
the process reverses. Since only one burner fires at a time, the capacity of the furnace is 10 MMBtu/h.
Regenerators
Burners
Hot
Air
Exh
aust
Figure 68. CAR BOTTOM FORGING FURNACE WITH REGENERATIVE BURNERS
A kick-off meeting at was held at Shultz Steel Co. on July 18, 2000. After some background
information on GTI and Oscillating Combustion technology were presented, the items discussed included
the prior burner testing, the project goals, work scope, schedule, and funding.
Titanium Sample Testing
Since titanium is one of the major metals heated in the FPN furnace, and since titanium has a
tendency to absorb hydrogen, one of the first efforts under this subtask was to determine if the hydrogen
generated from the fuel-rich portion of the Oscillating Combustion cycle is of sufficient quantity to affect
the metallurgy of titanium. A matrix of test points for the heating of titanium samples in GTI’s test
furnace under Oscillating Combustion was developed. The matrix called for two levels of excess air with
no oscillations (baseline), low-amplitude oscillations (to avoid any fuel rich conditions), and high-
amplitude oscillations. Six total tests were planned. For each test, two samples were placed in the
furnace, one under the flame and one downstream of the flame. The number (12 plus 2 spares) and size
of the samples needed were submitted to Shultz Steel Co. Samples of titanium and a test protocol for
heating the samples were received from Shultz Steel in August 2000.
(61111 final report.doc) 72
Since GTI’s test furnace has no access doors to bring samples into and out of the furnace, two
holes were cut into the side of the furnace. The locations of these are shown in Figure 69 and Figure 70.
A dry run of the furnace was made to determine the proper gas and air flow rates to maintain the furnace
at desired temperature for heating titanium at the two different excess air levels.
The testing of the titanium samples in GTI’s furnace was completed in October 2000 (see
Figure 71). The samples were heated in GTI’s test furnace using Shultz Steel’s protocol under the six
predetermined test conditions. Ceramic bars were used for the insertion and removal of the titanium
samples. For each test, two samples were placed simultaneously in the furnace, with one directly under
the flame and one downstream of the flame.
Shultz Steel analyzed the titanium samples heated in GTI’s test furnace under various oscillating
combustion conditions. In all cases, the level of hydrogen in the titanium samples was less than about
half of the allowable limit, even for samples directly under the flame with high (80%) amplitude
oscillations. The samples downstream of the flame picked up even less hydrogen, and were close in
concentration to those samples heated without oscillating combustion.
Site Survey
A trip was made to the forging furnace at Shultz Steel in mid October 2000. The purpose of the
visit was to find space to place GTI's instrumentation, locate positions on the furnace or exhaust duct for
temperature and sample probes, measure the dimensions of the gas supply lines to each burner pair,
ascertain the amount of available space around the gas supply lines near each burner pair, survey the gas
pressure and flow regulators, and determine if any interfacing would be needed between the oscillating
valve, control system, and the furnace control system. This information was used to help complete the
design of the retrofit package. The design of the retrofit installation and the instrumentation package was
based on that used for the previous field test on a stack annealing furnace in Task 5 (see Figure 84).
Retrofit Design
Based upon measurements made in the field, GTI created an in-house mock-up (see Figure 72) of
the pertinent piping and constraining space that exist near the burners on the furnace at Shultz Steel.
About a half-dozen possible arrangements for the placement of the oscillating valve (see Figure 73) and
bypass line were considered. The mock-up was used to visually observe the placement and fit of the
oscillating valve and bypass line with respect to accessibility and the distances from the burner, furnace
wall, and existing gas and air piping. This was done to ensure that the retrofit package would be installed
with minimal effort and downtime.
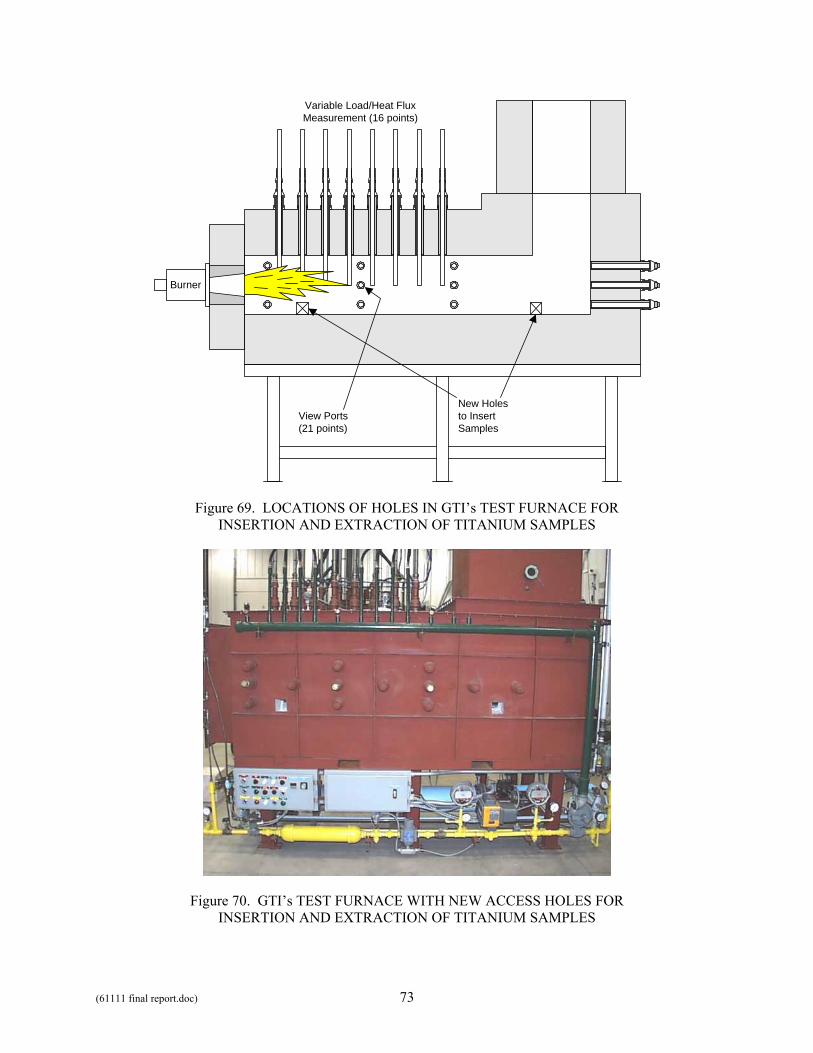
(61111 final report.doc) 73
Burner
Variable Load/Heat FluxMeasurement (16 points)
New Holesto InsertSamples
View Ports(21 points)
Figure 69. LOCATIONS OF HOLES IN GTI’s TEST FURNACE FOR INSERTION AND EXTRACTION OF TITANIUM SAMPLES
Figure 70. GTI’s TEST FURNACE WITH NEW ACCESS HOLES FOR INSERTION AND EXTRACTION OF TITANIUM SAMPLES
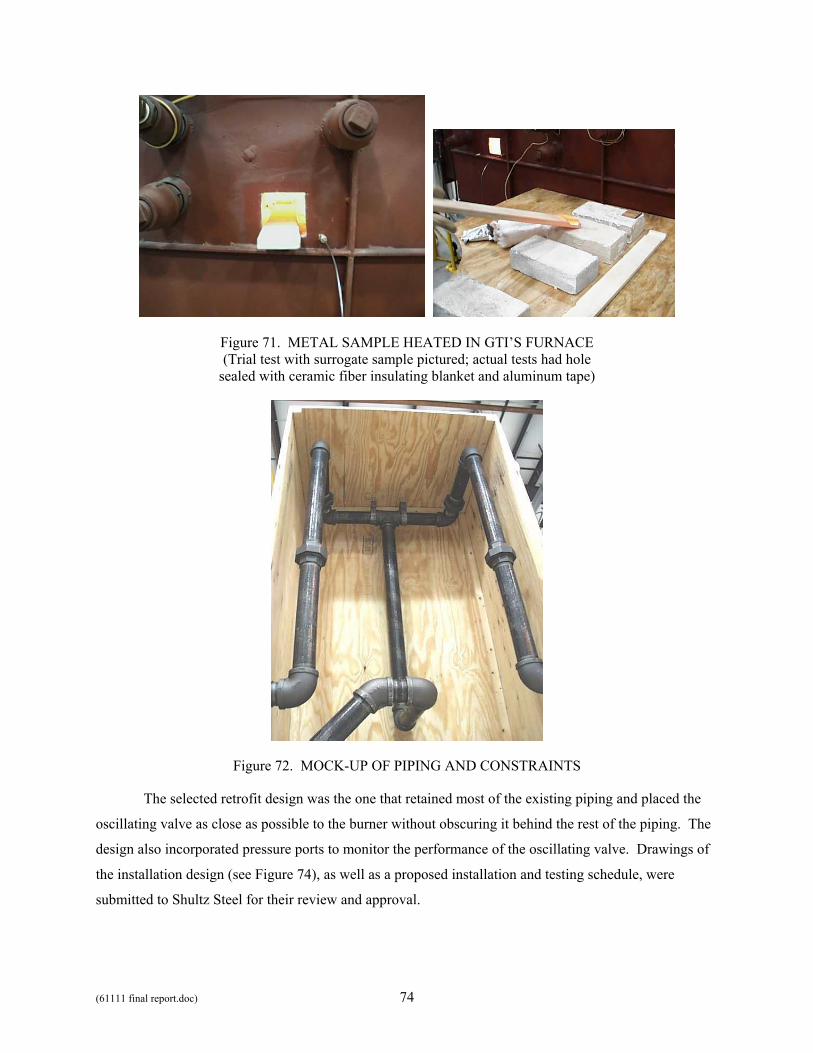
(61111 final report.doc) 74
Figure 71. METAL SAMPLE HEATED IN GTI’S FURNACE (Trial test with surrogate sample pictured; actual tests had hole
sealed with ceramic fiber insulating blanket and aluminum tape)
Figure 72. MOCK-UP OF PIPING AND CONSTRAINTS
The selected retrofit design was the one that retained most of the existing piping and placed the
oscillating valve as close as possible to the burner without obscuring it behind the rest of the piping. The
design also incorporated pressure ports to monitor the performance of the oscillating valve. Drawings of
the installation design (see Figure 74), as well as a proposed installation and testing schedule, were
submitted to Shultz Steel for their review and approval.
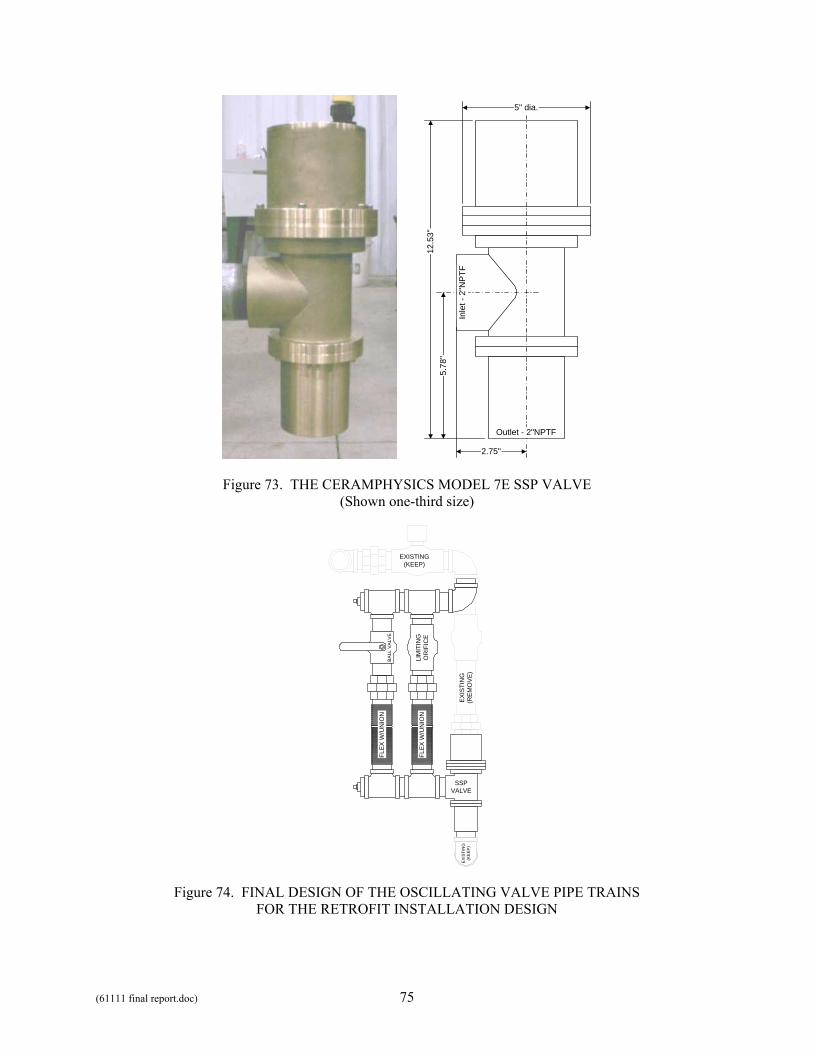
(61111 final report.doc) 75
5.
78"
12.5
3"
2.75"
5" dia.
Outlet - 2"NPTF
Inle
t - 2
"NP
TF
Figure 73. THE CERAMPHYSICS MODEL 7E SSP VALVE (Shown one-third size)
EXIS
TIN
G(R
EMO
VE)
LIM
ITIN
GO
RIF
ICE
BALL
VAL
VE
SSPVALVE
FLEX
W/U
NIO
N
FLEX
W/U
NIO
N
EXISTING(KEEP)
EX
ISTI
NG
(KEE
P)
Figure 74. FINAL DESIGN OF THE OSCILLATING VALVE PIPE TRAINS FOR THE RETROFIT INSTALLATION DESIGN
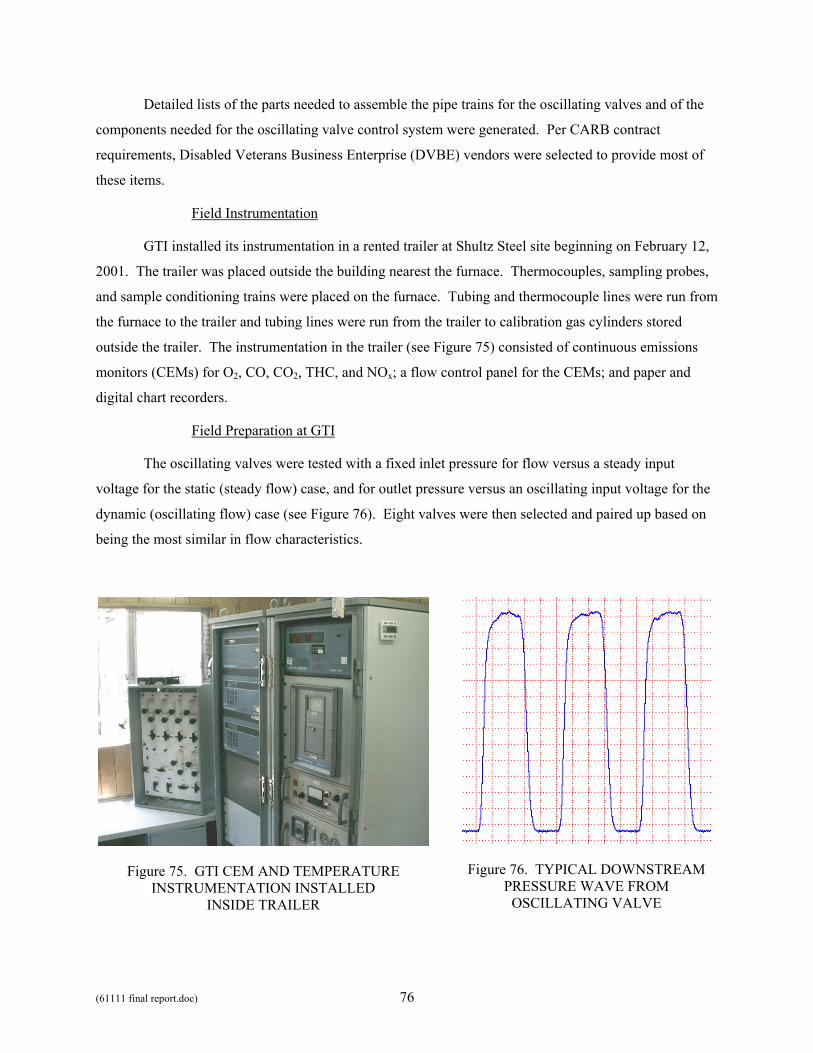
(61111 final report.doc) 76
Detailed lists of the parts needed to assemble the pipe trains for the oscillating valves and of the
components needed for the oscillating valve control system were generated. Per CARB contract
requirements, Disabled Veterans Business Enterprise (DVBE) vendors were selected to provide most of
these items.
Field Instrumentation
GTI installed its instrumentation in a rented trailer at Shultz Steel site beginning on February 12,
2001. The trailer was placed outside the building nearest the furnace. Thermocouples, sampling probes,
and sample conditioning trains were placed on the furnace. Tubing and thermocouple lines were run from
the furnace to the trailer and tubing lines were run from the trailer to calibration gas cylinders stored
outside the trailer. The instrumentation in the trailer (see Figure 75) consisted of continuous emissions
monitors (CEMs) for O2, CO, CO2, THC, and NOx; a flow control panel for the CEMs; and paper and
digital chart recorders.
Field Preparation at GTI
The oscillating valves were tested with a fixed inlet pressure for flow versus a steady input
voltage for the static (steady flow) case, and for outlet pressure versus an oscillating input voltage for the
dynamic (oscillating flow) case (see Figure 76). Eight valves were then selected and paired up based on
being the most similar in flow characteristics.
Figure 75. GTI CEM AND TEMPERATURE INSTRUMENTATION INSTALLED
INSIDE TRAILER
Figure 76. TYPICAL DOWNSTREAM PRESSURE WAVE FROM
OSCILLATING VALVE
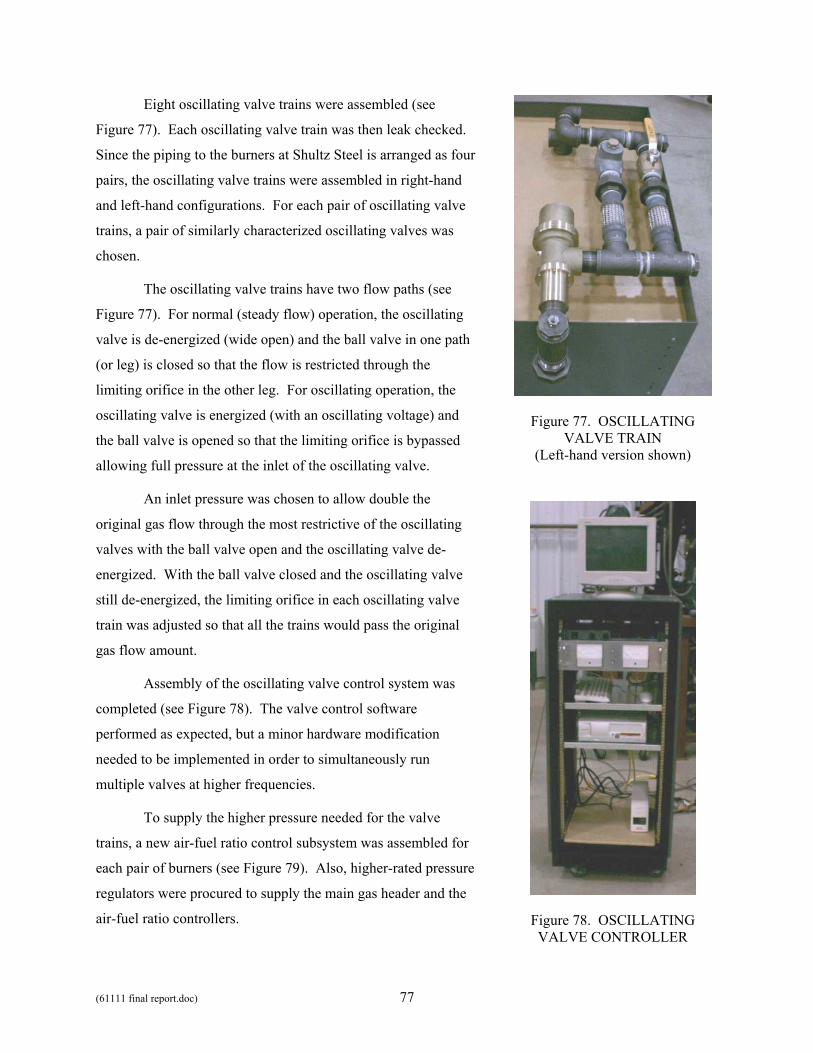
(61111 final report.doc) 77
Eight oscillating valve trains were assembled (see
Figure 77). Each oscillating valve train was then leak checked.
Since the piping to the burners at Shultz Steel is arranged as four
pairs, the oscillating valve trains were assembled in right-hand
and left-hand configurations. For each pair of oscillating valve
trains, a pair of similarly characterized oscillating valves was
chosen.
The oscillating valve trains have two flow paths (see
Figure 77). For normal (steady flow) operation, the oscillating
valve is de-energized (wide open) and the ball valve in one path
(or leg) is closed so that the flow is restricted through the
limiting orifice in the other leg. For oscillating operation, the
oscillating valve is energized (with an oscillating voltage) and
the ball valve is opened so that the limiting orifice is bypassed
allowing full pressure at the inlet of the oscillating valve.
An inlet pressure was chosen to allow double the
original gas flow through the most restrictive of the oscillating
valves with the ball valve open and the oscillating valve de-
energized. With the ball valve closed and the oscillating valve
still de-energized, the limiting orifice in each oscillating valve
train was adjusted so that all the trains would pass the original
gas flow amount.
Assembly of the oscillating valve control system was
completed (see Figure 78). The valve control software
performed as expected, but a minor hardware modification
needed to be implemented in order to simultaneously run
multiple valves at higher frequencies.
To supply the higher pressure needed for the valve
trains, a new air-fuel ratio control subsystem was assembled for
each pair of burners (see Figure 79). Also, higher-rated pressure
regulators were procured to supply the main gas header and the
air-fuel ratio controllers.
Figure 77. OSCILLATING VALVE TRAIN
(Left-hand version shown)
Figure 78. OSCILLATING VALVE CONTROLLER
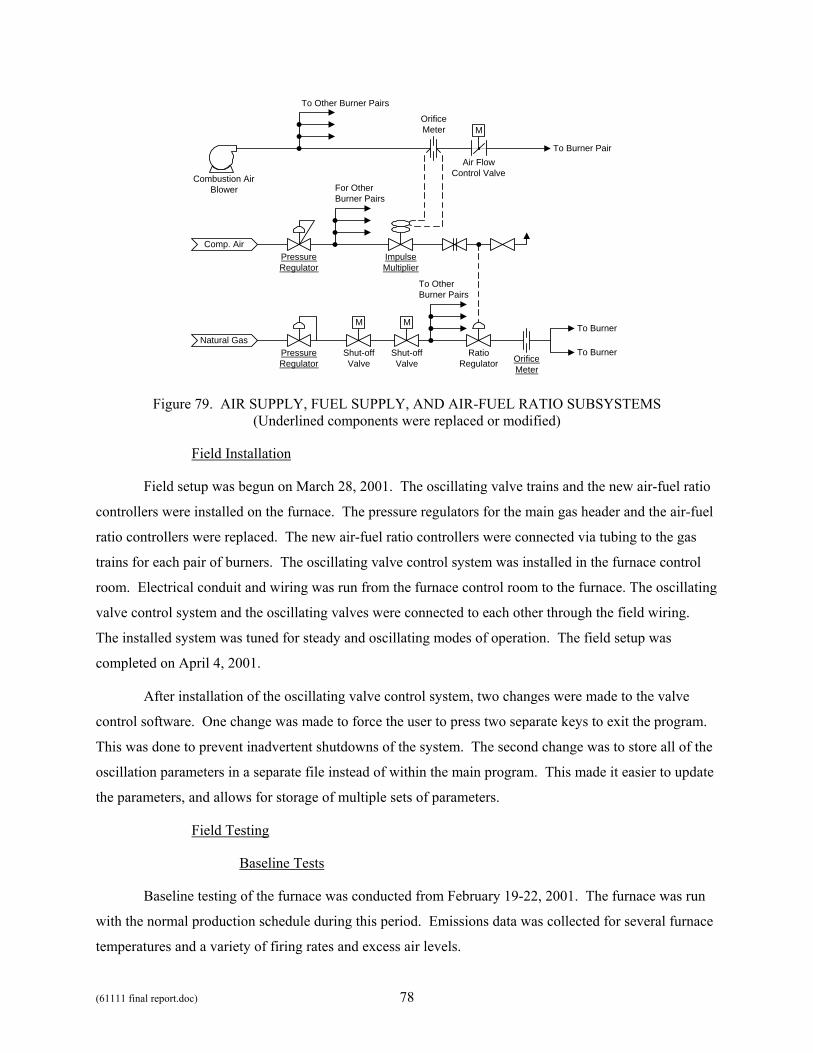
(61111 final report.doc) 78
Natural GasPressureRegulator
Shut-offValve
M
M
Combustion AirBlower
Air FlowControl Valve
ImpulseMultiplier
RatioRegulator
To Burner
To Burner
To Burner Pair
OrificeMeter
PressureRegulator
Comp. Air
OrificeMeter
M
Shut-offValve
To OtherBurner Pairs
To Other Burner Pairs
For OtherBurner Pairs
Figure 79. AIR SUPPLY, FUEL SUPPLY, AND AIR-FUEL RATIO SUBSYSTEMS (Underlined components were replaced or modified)
Field Installation
Field setup was begun on March 28, 2001. The oscillating valve trains and the new air-fuel ratio
controllers were installed on the furnace. The pressure regulators for the main gas header and the air-fuel
ratio controllers were replaced. The new air-fuel ratio controllers were connected via tubing to the gas
trains for each pair of burners. The oscillating valve control system was installed in the furnace control
room. Electrical conduit and wiring was run from the furnace control room to the furnace. The oscillating
valve control system and the oscillating valves were connected to each other through the field wiring.
The installed system was tuned for steady and oscillating modes of operation. The field setup was
completed on April 4, 2001.
After installation of the oscillating valve control system, two changes were made to the valve
control software. One change was made to force the user to press two separate keys to exit the program.
This was done to prevent inadvertent shutdowns of the system. The second change was to store all of the
oscillation parameters in a separate file instead of within the main program. This made it easier to update
the parameters, and allows for storage of multiple sets of parameters.
Field Testing
Baseline Tests
Baseline testing of the furnace was conducted from February 19-22, 2001. The furnace was run
with the normal production schedule during this period. Emissions data was collected for several furnace
temperatures and a variety of firing rates and excess air levels.
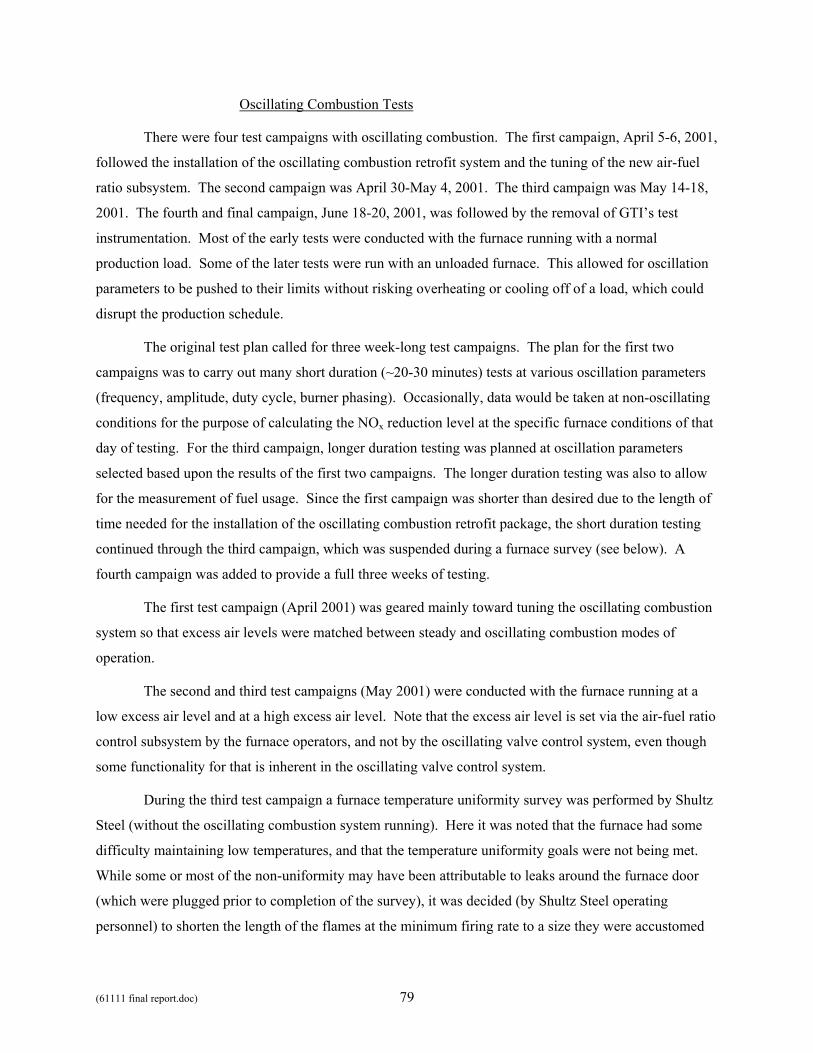
(61111 final report.doc) 79
Oscillating Combustion Tests
There were four test campaigns with oscillating combustion. The first campaign, April 5-6, 2001,
followed the installation of the oscillating combustion retrofit system and the tuning of the new air-fuel
ratio subsystem. The second campaign was April 30-May 4, 2001. The third campaign was May 14-18,
2001. The fourth and final campaign, June 18-20, 2001, was followed by the removal of GTI’s test
instrumentation. Most of the early tests were conducted with the furnace running with a normal
production load. Some of the later tests were run with an unloaded furnace. This allowed for oscillation
parameters to be pushed to their limits without risking overheating or cooling off of a load, which could
disrupt the production schedule.
The original test plan called for three week-long test campaigns. The plan for the first two
campaigns was to carry out many short duration (~20-30 minutes) tests at various oscillation parameters
(frequency, amplitude, duty cycle, burner phasing). Occasionally, data would be taken at non-oscillating
conditions for the purpose of calculating the NOx reduction level at the specific furnace conditions of that
day of testing. For the third campaign, longer duration testing was planned at oscillation parameters
selected based upon the results of the first two campaigns. The longer duration testing was also to allow
for the measurement of fuel usage. Since the first campaign was shorter than desired due to the length of
time needed for the installation of the oscillating combustion retrofit package, the short duration testing
continued through the third campaign, which was suspended during a furnace survey (see below). A
fourth campaign was added to provide a full three weeks of testing.
The first test campaign (April 2001) was geared mainly toward tuning the oscillating combustion
system so that excess air levels were matched between steady and oscillating combustion modes of
operation.
The second and third test campaigns (May 2001) were conducted with the furnace running at a
low excess air level and at a high excess air level. Note that the excess air level is set via the air-fuel ratio
control subsystem by the furnace operators, and not by the oscillating valve control system, even though
some functionality for that is inherent in the oscillating valve control system.
During the third test campaign a furnace temperature uniformity survey was performed by Shultz
Steel (without the oscillating combustion system running). Here it was noted that the furnace had some
difficulty maintaining low temperatures, and that the temperature uniformity goals were not being met.
While some or most of the non-uniformity may have been attributable to leaks around the furnace door
(which were plugged prior to completion of the survey), it was decided (by Shultz Steel operating
personnel) to shorten the length of the flames at the minimum firing rate to a size they were accustomed
(61111 final report.doc) 80
to. To accomplish this, the excess air level at the minimum firing rate was increased via adjustments to
the air-fuel ratio subsystem. The survey was then completed within specification. The unanticipated
consequence of increasing the excess air level at the minimum firing rate was that the excess air level at
the middle firing rate range, where the furnace operates most of the time, was also increased.
After the survey, the oscillating combustion parameters were optimized for high excess air levels.
Since the oscillating combustion parameters were not yet optimized for operation at low excess air levels,
due to the suspension in testing during the furnace survey, the fourth campaign of testing was added.
The fourth test campaign (June 2001) used the inherent functionality of the oscillating
combustion system to temporarily lower the excess air levels. This was done to optimize the oscillating
combustion parameters for low excess levels. Tests were also conducted with the furnace operating at
high-excess air levels, so that fuel usage data could be collected with and without oscillating combustion
with the furnace running with a normal production load.
After the testing campaign was concluded, GTI’s test equipment was packed and palletized for
delivery to GTI. Sampling lines were left in place on the furnace to accommodate any possible future
testing. The trailer and calibration cylinders were picked by their respective suppliers. The oscillating
combustion system itself was left installed on the furnace and ready for operation.
The oscillating valve control system functioned properly during field testing. No changes were
made to the system after the first test campaign. Other observations include that the burners relit
satisfactorily while the gas flow was oscillating after each reversal (switchover of firing from one burner
of each regenerative pair to the other burner); the burners stayed lit while the gas flow is oscillating when
the furnace door is opened to remove or insert a work piece; and there is little to no difference in furnace
pressure with and without oscillating combustion.
Data Analysis
Baseline Tests
Analysis of the baseline data collected in February 2001 consisted of calculating an average of
readings from several exhaust duct and in-furnace measurements over different excess air levels (see
Figure 80). The exhaust duct and in-furnace measurements were consistent with each other when
corrected to 0% O2 to remove dilution effects due to air entrainment into the exhaust duct. As expected,
NOx emission levels increased as furnace temperature increased. The graph in Figure 80 is shown for
reference only since new baseline data was taken for each oscillating combustion test. Actual magnitudes
of the NOx emission levels and furnace temperatures are not shown due to their proprietary nature.
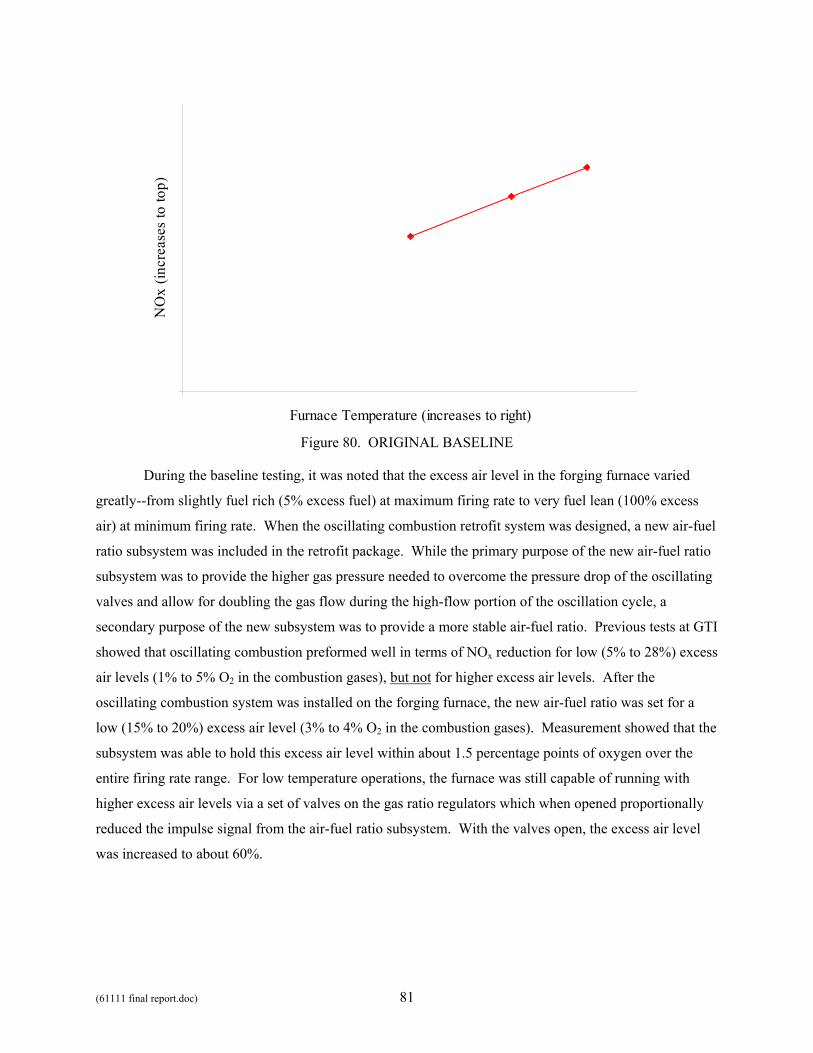
(61111 final report.doc) 81
Furnace Temperature (increases to right)
NO
x (in
crea
ses
to to
p)
Figure 80. ORIGINAL BASELINE
During the baseline testing, it was noted that the excess air level in the forging furnace varied
greatly--from slightly fuel rich (5% excess fuel) at maximum firing rate to very fuel lean (100% excess
air) at minimum firing rate. When the oscillating combustion retrofit system was designed, a new air-fuel
ratio subsystem was included in the retrofit package. While the primary purpose of the new air-fuel ratio
subsystem was to provide the higher gas pressure needed to overcome the pressure drop of the oscillating
valves and allow for doubling the gas flow during the high-flow portion of the oscillation cycle, a
secondary purpose of the new subsystem was to provide a more stable air-fuel ratio. Previous tests at GTI
showed that oscillating combustion preformed well in terms of NOx reduction for low (5% to 28%) excess
air levels (1% to 5% O2 in the combustion gases), but not for higher excess air levels. After the
oscillating combustion system was installed on the forging furnace, the new air-fuel ratio was set for a
low (15% to 20%) excess air level (3% to 4% O2 in the combustion gases). Measurement showed that the
subsystem was able to hold this excess air level within about 1.5 percentage points of oxygen over the
entire firing rate range. For low temperature operations, the furnace was still capable of running with
higher excess air levels via a set of valves on the gas ratio regulators which when opened proportionally
reduced the impulse signal from the air-fuel ratio subsystem. With the valves open, the excess air level
was increased to about 60%.
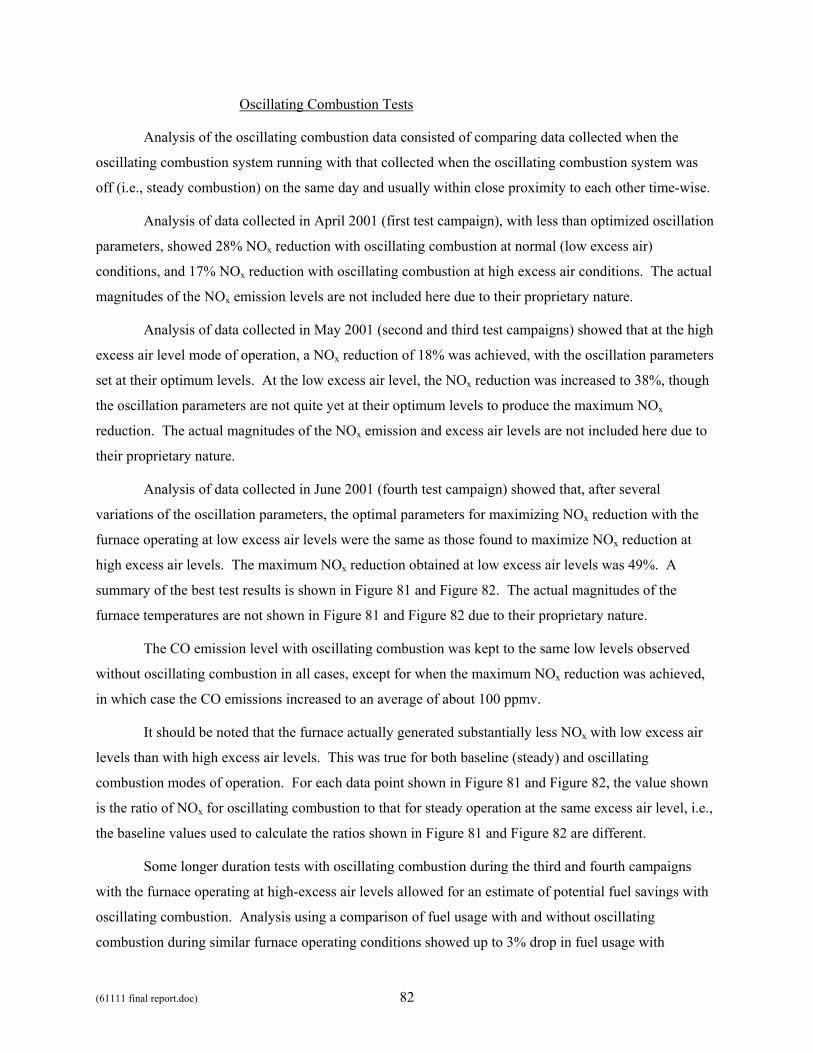
(61111 final report.doc) 82
Oscillating Combustion Tests
Analysis of the oscillating combustion data consisted of comparing data collected when the
oscillating combustion system running with that collected when the oscillating combustion system was
off (i.e., steady combustion) on the same day and usually within close proximity to each other time-wise.
Analysis of data collected in April 2001 (first test campaign), with less than optimized oscillation
parameters, showed 28% NOx reduction with oscillating combustion at normal (low excess air)
conditions, and 17% NOx reduction with oscillating combustion at high excess air conditions. The actual
magnitudes of the NOx emission levels are not included here due to their proprietary nature.
Analysis of data collected in May 2001 (second and third test campaigns) showed that at the high
excess air level mode of operation, a NOx reduction of 18% was achieved, with the oscillation parameters
set at their optimum levels. At the low excess air level, the NOx reduction was increased to 38%, though
the oscillation parameters are not quite yet at their optimum levels to produce the maximum NOx
reduction. The actual magnitudes of the NOx emission and excess air levels are not included here due to
their proprietary nature.
Analysis of data collected in June 2001 (fourth test campaign) showed that, after several
variations of the oscillation parameters, the optimal parameters for maximizing NOx reduction with the
furnace operating at low excess air levels were the same as those found to maximize NOx reduction at
high excess air levels. The maximum NOx reduction obtained at low excess air levels was 49%. A
summary of the best test results is shown in Figure 81 and Figure 82. The actual magnitudes of the
furnace temperatures are not shown in Figure 81 and Figure 82 due to their proprietary nature.
The CO emission level with oscillating combustion was kept to the same low levels observed
without oscillating combustion in all cases, except for when the maximum NOx reduction was achieved,
in which case the CO emissions increased to an average of about 100 ppmv.
It should be noted that the furnace actually generated substantially less NOx with low excess air
levels than with high excess air levels. This was true for both baseline (steady) and oscillating
combustion modes of operation. For each data point shown in Figure 81 and Figure 82, the value shown
is the ratio of NOx for oscillating combustion to that for steady operation at the same excess air level, i.e.,
the baseline values used to calculate the ratios shown in Figure 81 and Figure 82 are different.
Some longer duration tests with oscillating combustion during the third and fourth campaigns
with the furnace operating at high-excess air levels allowed for an estimate of potential fuel savings with
oscillating combustion. Analysis using a comparison of fuel usage with and without oscillating
combustion during similar furnace operating conditions showed up to 3% drop in fuel usage with
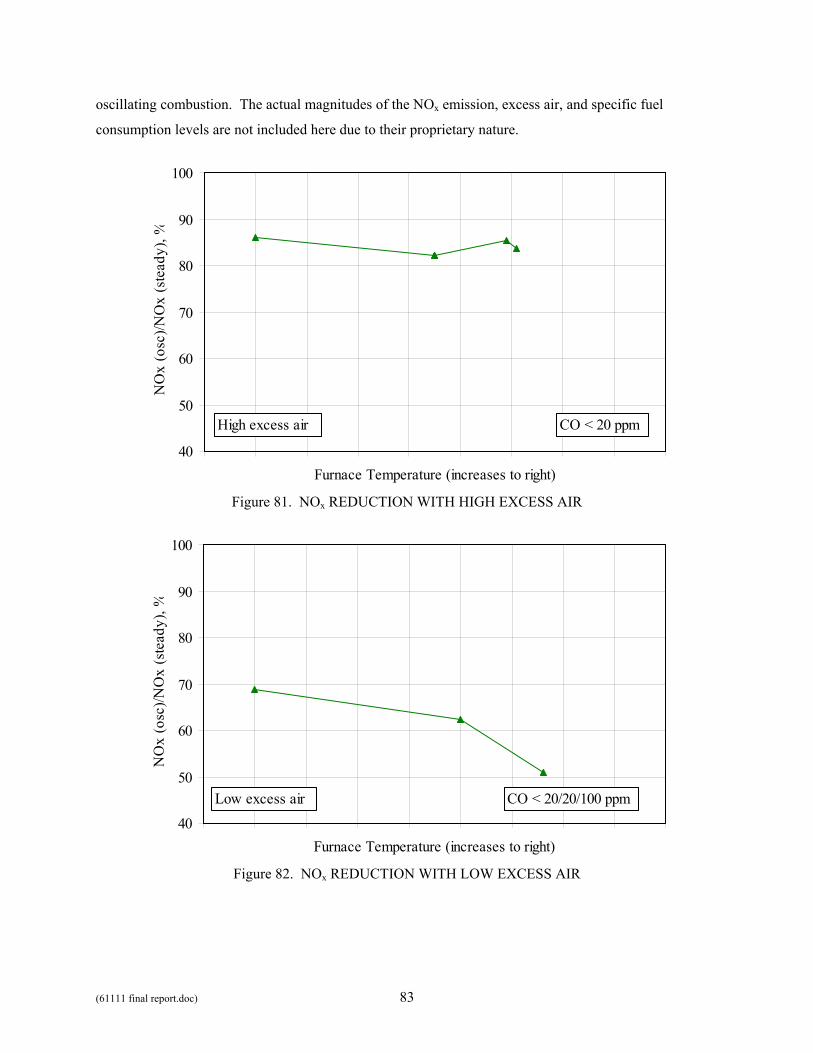
(61111 final report.doc) 83
oscillating combustion. The actual magnitudes of the NOx emission, excess air, and specific fuel
consumption levels are not included here due to their proprietary nature.
40
50
60
70
80
90
100
Furnace Temperature (increases to right)
NO
x (o
sc)/N
Ox
(ste
ady)
, %
High excess air CO < 20 ppm
Figure 81. NOx REDUCTION WITH HIGH EXCESS AIR
40
50
60
70
80
90
100
Furnace Temperature (increases to right)
NO
x (o
sc)/N
Ox
(ste
ady)
, %
Low excess air CO < 20/20/100 ppm
Figure 82. NOx REDUCTION WITH LOW EXCESS AIR
(61111 final report.doc) 84
Task 5. Field Demonstration on a 10-MMBtu/h Stack Annealing Furnace
In February 1998, a field evaluation effort began for a batch annealing furnace at the cold mill of
the Burns Harbor facility of Bethlehem Steel Corporation (BSC) (now ISG), located in Burns Harbor,
Indiana. The installation was part of a showcase demonstration of eleven U.S. DOE-OIT-sponsored
technologies being demonstrated at BSC. The showcase was held on April 30, 1998. Funding for the
field evaluation was from U.S. DOE-OIT, with in-kind support from BSC.
Bethlehem Steel (now ISG) produces a wide variety of steel mill products including hot-rolled,
cold-rolled and coated sheets, tin mill products, carbon and alloy plates, rail, specialty blooms, carbon and
alloy bars and large diameter pipe. Its principal markets include automotive, construction, machinery and
equipment, appliance, containers, service centers, rail and pipe.
Batch annealing furnace No. 8 at BSC was selected for field testing Oscillating Combustion.
Two other furnaces at BSC were examined as candidates for the showcase demonstration. One was a
ladle preheater, and the other was a reheat furnace. The batch annealing furnace was chosen because its
burners had capacities that could be accommodated by the oscillating valves available at that time, a ladle
preheater had already been tested, and the reheat furnace would only be a partial retrofit, whereas the
batch annealing furnace could be fully retrofitted.
Batch annealing furnaces are used to anneal coils of steel strip after they have been cold-rolled to
the desired thickness. This process restores the formability and malleability of the steel to make it easier
to further cold roll or stamp into shapes. The plant has several batch annealing furnaces, and they move
from base to base. The furnaces themselves have no floor. Coils of steel to be annealed are stacked on
four bases and a cover is placed over each stack. A protective atmosphere is injected into the stack covers
from underneath. A furnace is then lifted and placed over the stacks. Next the furnace is run through an
annealing cycle lasting anywhere from about 30 to about 60 hours in length. Then the furnace is lifted off
the base and placed over the next base where a fresh set of stacks awaits. The stacks are still hot when the
furnace is lifted off the base. Fuel, power, and control lines are disconnected before the furnace is lifted,
and reconnected when the furnace is placed on the next base.
Batch annealing furnace No. 8 has ten Bloom Engineering flat-flame burners. The furnace has a
total capacity of 10 MMBtu/h. The furnace is shown schematically in Figure 83. There are five burners
on each side of the furnace. They are placed so as not to directly impinge upon the four stack covers in
the furnace. The furnace has recuperators that use the waste heat from the exhaust gases to preheat the
combustion air to about 450°F. Typical furnace temperature is 1500°F, and a typical load is 300 tons.
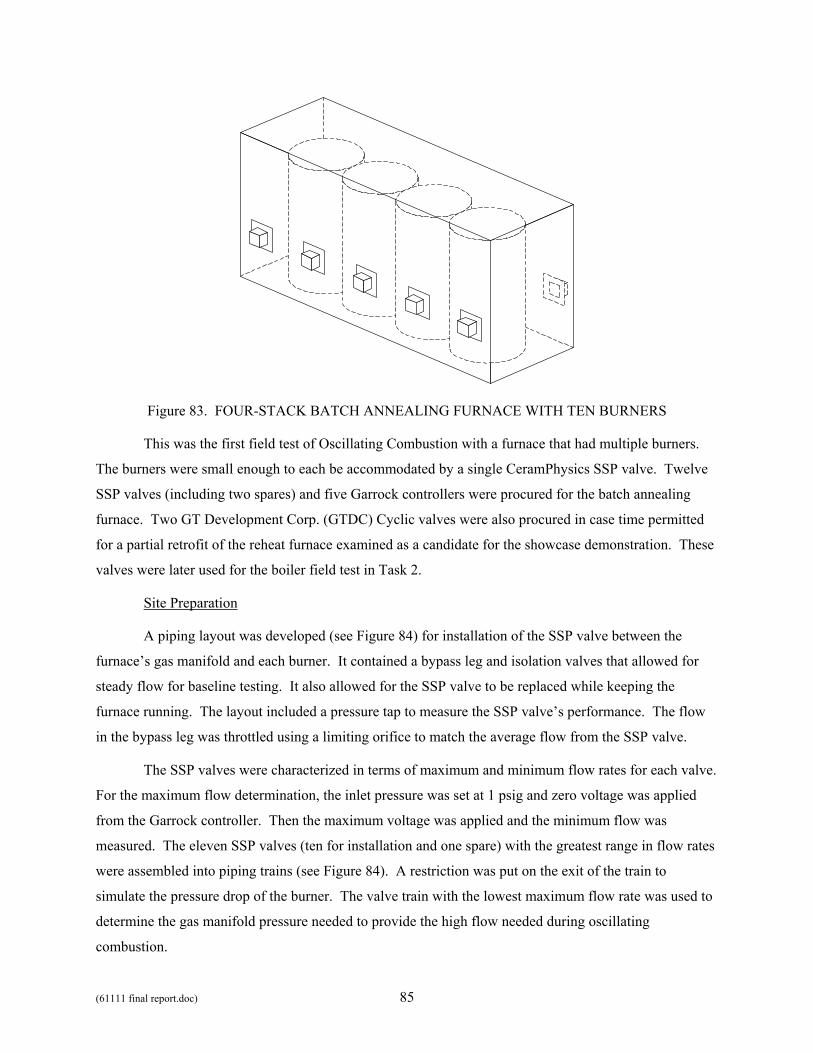
(61111 final report.doc) 85
Figure 83. FOUR-STACK BATCH ANNEALING FURNACE WITH TEN BURNERS
This was the first field test of Oscillating Combustion with a furnace that had multiple burners.
The burners were small enough to each be accommodated by a single CeramPhysics SSP valve. Twelve
SSP valves (including two spares) and five Garrock controllers were procured for the batch annealing
furnace. Two GT Development Corp. (GTDC) Cyclic valves were also procured in case time permitted
for a partial retrofit of the reheat furnace examined as a candidate for the showcase demonstration. These
valves were later used for the boiler field test in Task 2.
Site Preparation
A piping layout was developed (see Figure 84) for installation of the SSP valve between the
furnace’s gas manifold and each burner. It contained a bypass leg and isolation valves that allowed for
steady flow for baseline testing. It also allowed for the SSP valve to be replaced while keeping the
furnace running. The layout included a pressure tap to measure the SSP valve’s performance. The flow
in the bypass leg was throttled using a limiting orifice to match the average flow from the SSP valve.
The SSP valves were characterized in terms of maximum and minimum flow rates for each valve.
For the maximum flow determination, the inlet pressure was set at 1 psig and zero voltage was applied
from the Garrock controller. Then the maximum voltage was applied and the minimum flow was
measured. The eleven SSP valves (ten for installation and one spare) with the greatest range in flow rates
were assembled into piping trains (see Figure 84). A restriction was put on the exit of the train to
simulate the pressure drop of the burner. The valve train with the lowest maximum flow rate was used to
determine the gas manifold pressure needed to provide the high flow needed during oscillating
combustion.
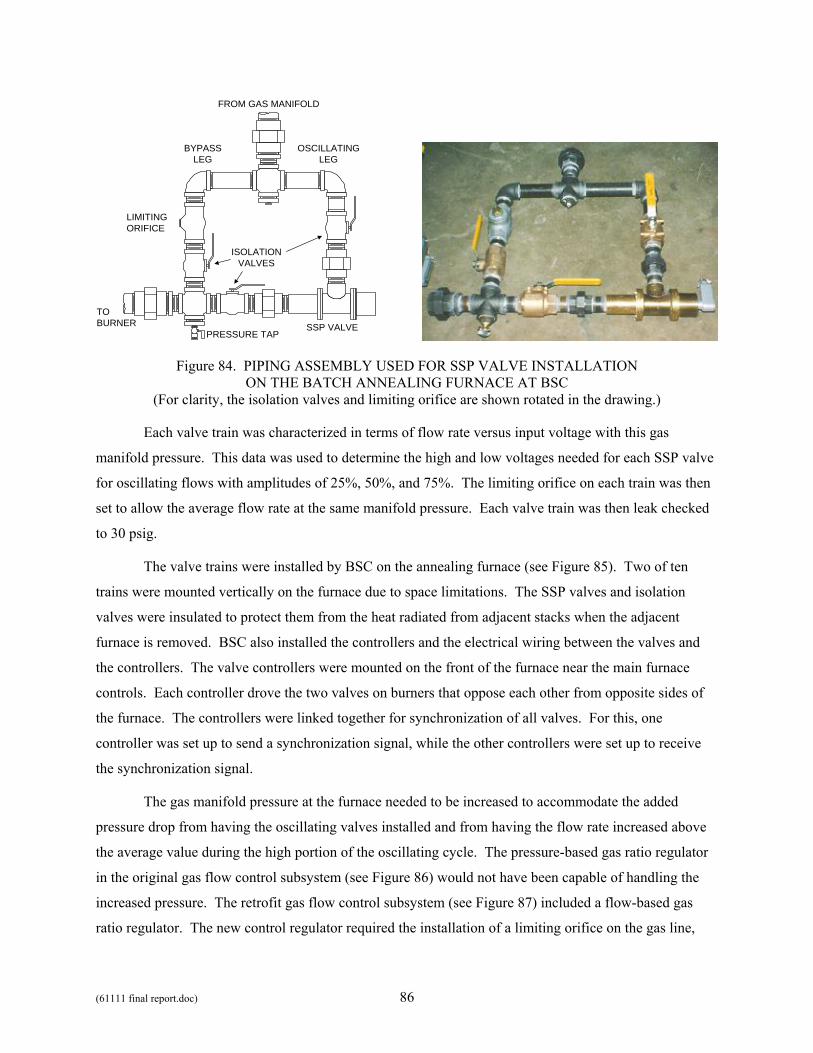
(61111 final report.doc) 86
FROM GAS MANIFOLD
TOBURNER SSP VALVE
LIMITINGORIFICE
ISOLATIONVALVES
PRESSURE TAP
BYPASSLEG
OSCILLATINGLEG
Figure 84. PIPING ASSEMBLY USED FOR SSP VALVE INSTALLATION ON THE BATCH ANNEALING FURNACE AT BSC
(For clarity, the isolation valves and limiting orifice are shown rotated in the drawing.)
Each valve train was characterized in terms of flow rate versus input voltage with this gas
manifold pressure. This data was used to determine the high and low voltages needed for each SSP valve
for oscillating flows with amplitudes of 25%, 50%, and 75%. The limiting orifice on each train was then
set to allow the average flow rate at the same manifold pressure. Each valve train was then leak checked
to 30 psig.
The valve trains were installed by BSC on the annealing furnace (see Figure 85). Two of ten
trains were mounted vertically on the furnace due to space limitations. The SSP valves and isolation
valves were insulated to protect them from the heat radiated from adjacent stacks when the adjacent
furnace is removed. BSC also installed the controllers and the electrical wiring between the valves and
the controllers. The valve controllers were mounted on the front of the furnace near the main furnace
controls. Each controller drove the two valves on burners that oppose each other from opposite sides of
the furnace. The controllers were linked together for synchronization of all valves. For this, one
controller was set up to send a synchronization signal, while the other controllers were set up to receive
the synchronization signal.
The gas manifold pressure at the furnace needed to be increased to accommodate the added
pressure drop from having the oscillating valves installed and from having the flow rate increased above
the average value during the high portion of the oscillating cycle. The pressure-based gas ratio regulator
in the original gas flow control subsystem (see Figure 86) would not have been capable of handling the
increased pressure. The retrofit gas flow control subsystem (see Figure 87) included a flow-based gas
ratio regulator. The new control regulator required the installation of a limiting orifice on the gas line,
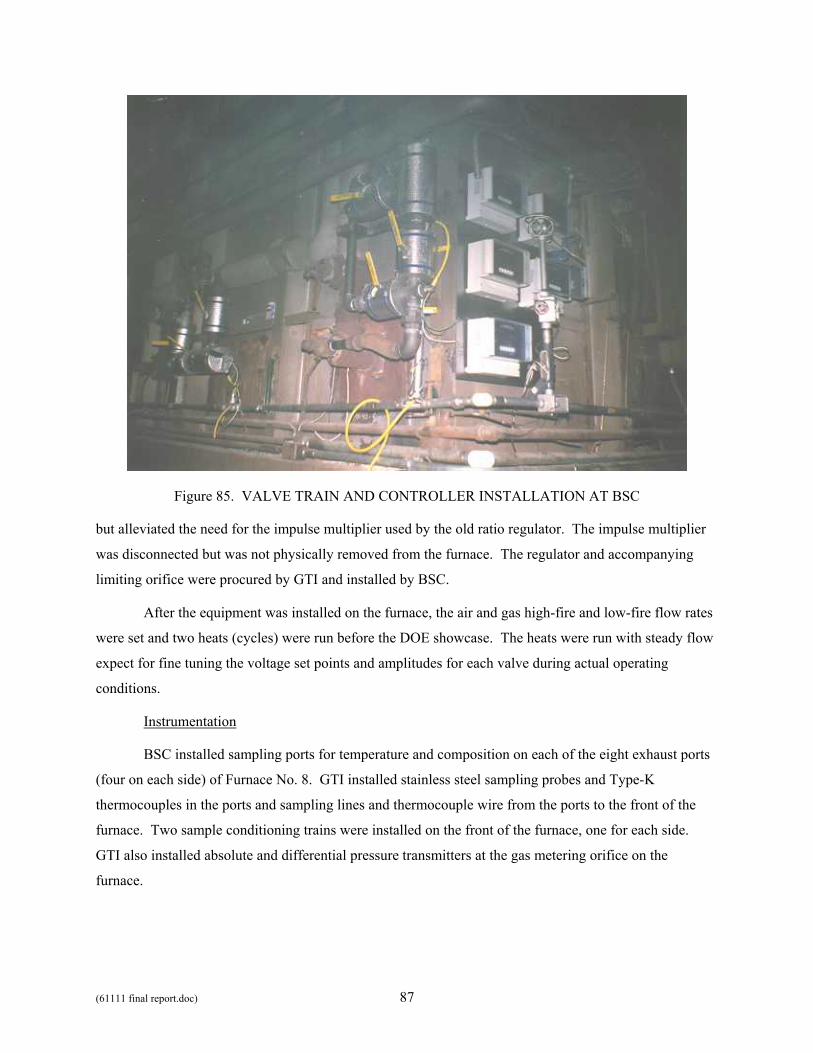
(61111 final report.doc) 87
Figure 85. VALVE TRAIN AND CONTROLLER INSTALLATION AT BSC
but alleviated the need for the impulse multiplier used by the old ratio regulator. The impulse multiplier
was disconnected but was not physically removed from the furnace. The regulator and accompanying
limiting orifice were procured by GTI and installed by BSC.
After the equipment was installed on the furnace, the air and gas high-fire and low-fire flow rates
were set and two heats (cycles) were run before the DOE showcase. The heats were run with steady flow
expect for fine tuning the voltage set points and amplitudes for each valve during actual operating
conditions.
Instrumentation
BSC installed sampling ports for temperature and composition on each of the eight exhaust ports
(four on each side) of Furnace No. 8. GTI installed stainless steel sampling probes and Type-K
thermocouples in the ports and sampling lines and thermocouple wire from the ports to the front of the
furnace. Two sample conditioning trains were installed on the front of the furnace, one for each side.
GTI also installed absolute and differential pressure transmitters at the gas metering orifice on the
furnace.

(61111 final report.doc) 88
Natural Gas
OrificeMeter
PressureRegulator
Shut-offValve
To Recuperators
M
M
AirBlower
AirVenturi
Air ControlValve
ImpulseMultiplier
Gas FlowRegulator
To Burners
To Burners
To Recuperators
AirInlet
Figure 86. ORIGINAL GAS FLOW CONTROL SUBSYSTEM
Natural Gas
OrificeMeter
PressureRegulator
Shut-offValve
M
M
AirBlower
AirVenturi
Air ControlValve
Gas FlowRegulator
To Burners
To BurnersLimitingOrifice
To Recuperators
To Recuperators
AirInlet
ImpulseMultiplier
Figure 87. RETROFIT GAS FLOW CONTROL SUBSYSTEM (The impulse multiplier was not used, but was not removed)
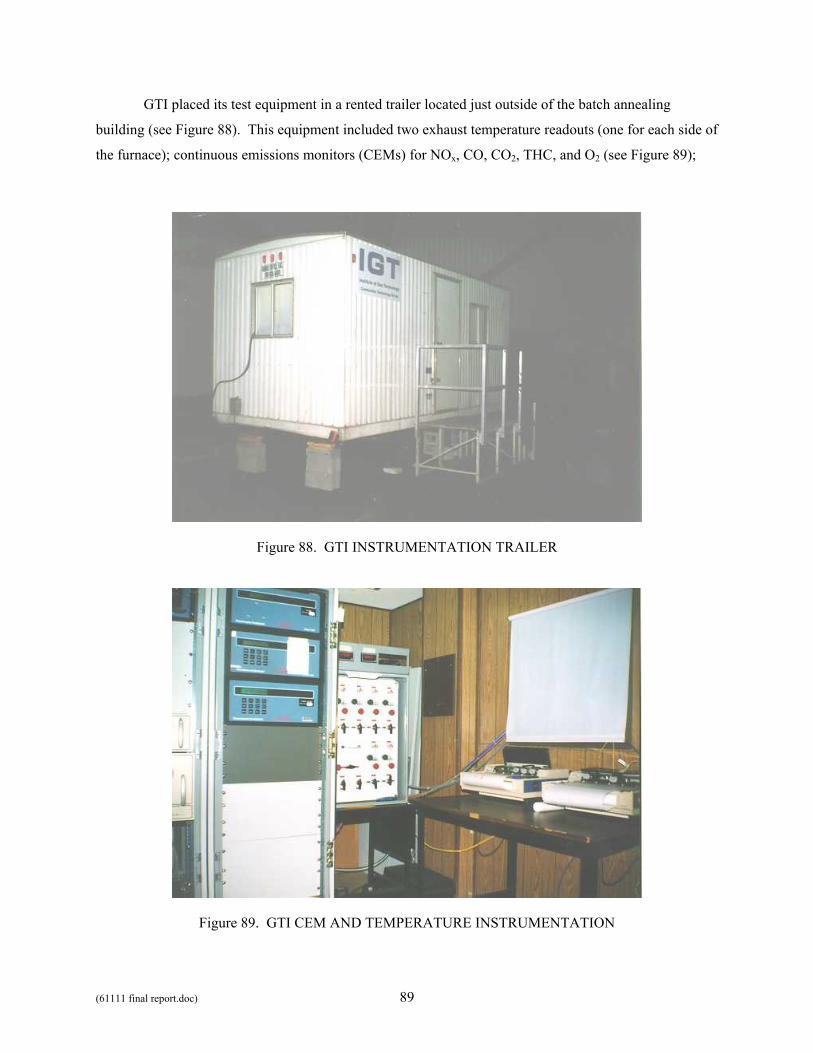
(61111 final report.doc) 89
GTI placed its test equipment in a rented trailer located just outside of the batch annealing
building (see Figure 88). This equipment included two exhaust temperature readouts (one for each side of
the furnace); continuous emissions monitors (CEMs) for NOx, CO, CO2, THC, and O2 (see Figure 89);
Figure 88. GTI INSTRUMENTATION TRAILER
Figure 89. GTI CEM AND TEMPERATURE INSTRUMENTATION
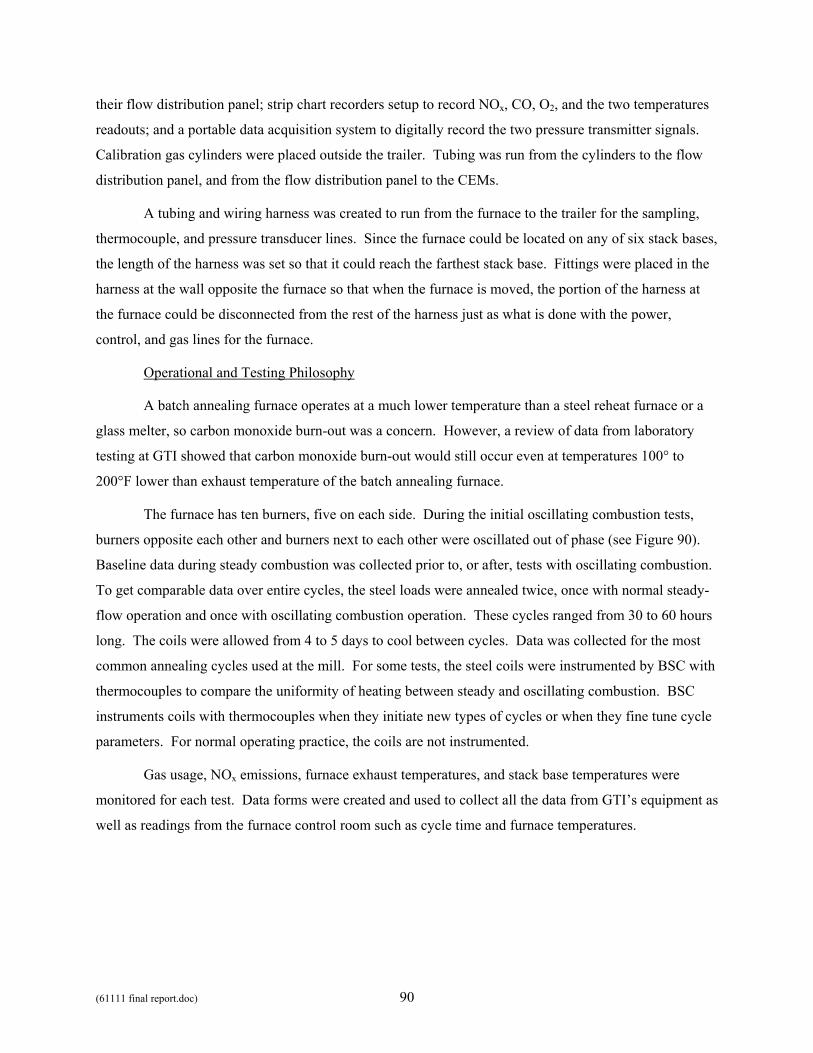
(61111 final report.doc) 90
their flow distribution panel; strip chart recorders setup to record NOx, CO, O2, and the two temperatures
readouts; and a portable data acquisition system to digitally record the two pressure transmitter signals.
Calibration gas cylinders were placed outside the trailer. Tubing was run from the cylinders to the flow
distribution panel, and from the flow distribution panel to the CEMs.
A tubing and wiring harness was created to run from the furnace to the trailer for the sampling,
thermocouple, and pressure transducer lines. Since the furnace could be located on any of six stack bases,
the length of the harness was set so that it could reach the farthest stack base. Fittings were placed in the
harness at the wall opposite the furnace so that when the furnace is moved, the portion of the harness at
the furnace could be disconnected from the rest of the harness just as what is done with the power,
control, and gas lines for the furnace.
Operational and Testing Philosophy
A batch annealing furnace operates at a much lower temperature than a steel reheat furnace or a
glass melter, so carbon monoxide burn-out was a concern. However, a review of data from laboratory
testing at GTI showed that carbon monoxide burn-out would still occur even at temperatures 100° to
200°F lower than exhaust temperature of the batch annealing furnace.
The furnace has ten burners, five on each side. During the initial oscillating combustion tests,
burners opposite each other and burners next to each other were oscillated out of phase (see Figure 90).
Baseline data during steady combustion was collected prior to, or after, tests with oscillating combustion.
To get comparable data over entire cycles, the steel loads were annealed twice, once with normal steady-
flow operation and once with oscillating combustion operation. These cycles ranged from 30 to 60 hours
long. The coils were allowed from 4 to 5 days to cool between cycles. Data was collected for the most
common annealing cycles used at the mill. For some tests, the steel coils were instrumented by BSC with
thermocouples to compare the uniformity of heating between steady and oscillating combustion. BSC
instruments coils with thermocouples when they initiate new types of cycles or when they fine tune cycle
parameters. For normal operating practice, the coils are not instrumented.
Gas usage, NOx emissions, furnace exhaust temperatures, and stack base temperatures were
monitored for each test. Data forms were created and used to collect all the data from GTI’s equipment as
well as readings from the furnace control room such as cycle time and furnace temperatures.
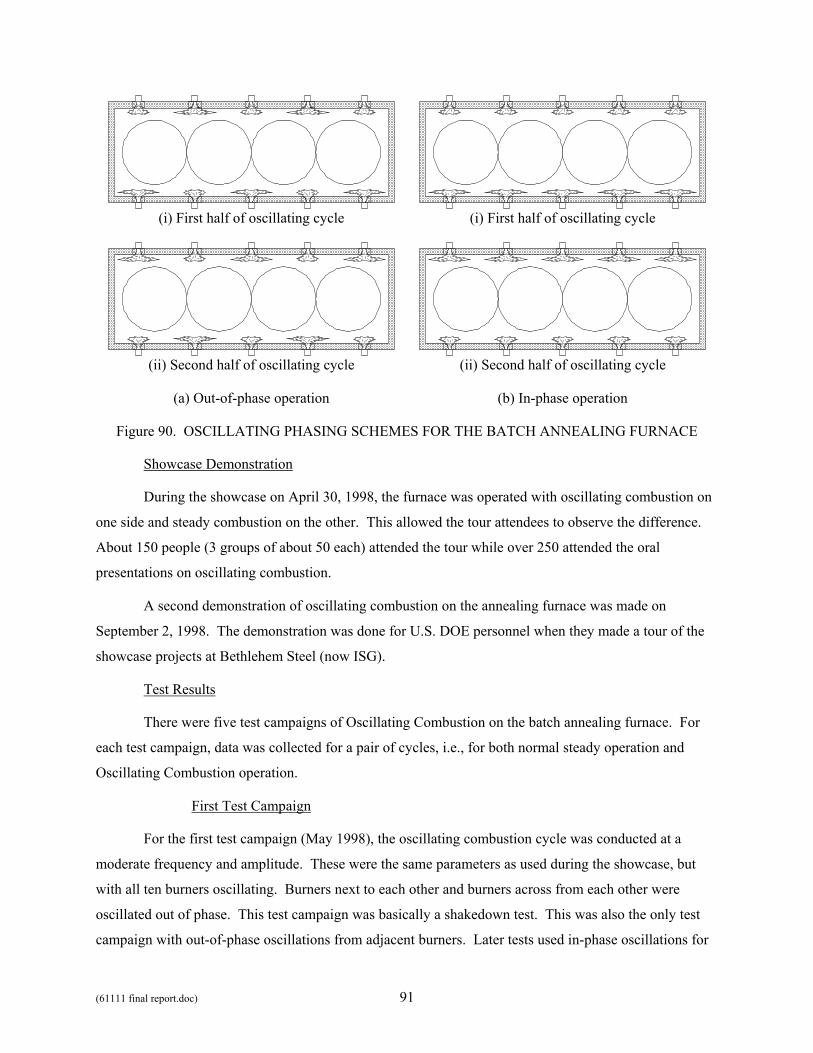
(61111 final report.doc) 91
(i) First half of oscillating cycle (i) First half of oscillating cycle
(ii) Second half of oscillating cycle (ii) Second half of oscillating cycle
(a) Out-of-phase operation (b) In-phase operation
Figure 90. OSCILLATING PHASING SCHEMES FOR THE BATCH ANNEALING FURNACE
Showcase Demonstration
During the showcase on April 30, 1998, the furnace was operated with oscillating combustion on
one side and steady combustion on the other. This allowed the tour attendees to observe the difference.
About 150 people (3 groups of about 50 each) attended the tour while over 250 attended the oral
presentations on oscillating combustion.
A second demonstration of oscillating combustion on the annealing furnace was made on
September 2, 1998. The demonstration was done for U.S. DOE personnel when they made a tour of the
showcase projects at Bethlehem Steel (now ISG).
Test Results
There were five test campaigns of Oscillating Combustion on the batch annealing furnace. For
each test campaign, data was collected for a pair of cycles, i.e., for both normal steady operation and
Oscillating Combustion operation.
First Test Campaign
For the first test campaign (May 1998), the oscillating combustion cycle was conducted at a
moderate frequency and amplitude. These were the same parameters as used during the showcase, but
with all ten burners oscillating. Burners next to each other and burners across from each other were
oscillated out of phase. This test campaign was basically a shakedown test. This was also the only test
campaign with out-of-phase oscillations from adjacent burners. Later tests used in-phase oscillations for
(61111 final report.doc) 92
adjacent burners to eliminate mixing of the fuel-rich zones from one burner with the fuel-lean zones.
Even though the out-of-phase oscillation of adjacent burners reduces gas flow rate oscillations in the
upstream gas supply line, the premature mixing of the zones is counterproductive towards NOx reduction.
All test campaigns used out-of-phase oscillation from opposing burners, so that the fuel delivery
system saw a relative steady flow rate of gas. The stacks in the center of the furnace essentially isolated
one side of the furnace from the other, so premature mixing was not an issue from opposing burners.
The same steel coil load was used for both cycles. The coils were instrumented with
thermocouples. The load was allowed to cool to ambient temperature for four days between the cycles.
A review of the data showed a small (11%) reduction in NOx during the oscillating combustion
cycle when comparing to equivalent points in the baseline cycle where the firing rate was from middle to
high fire. Insufficient data was collected to calculate the total NOx generation over the entire cycles.
Integration of the gas flow rate data from the pressure transmitters showed a 0.6% decrease in fuel use
with oscillating combustion.
Parameterization Tests
Based on the results of the first test campaign, it was decided to perform some parameterization
tests on non-instrumented loads to try to optimize the oscillation parameters. Three parameterization tests
were conducted in May-June 1998.
During the first parameterization test, with steady combustion, the excess air level for the whole
furnace was varied from -5% (i.e., fuel rich) to +40% (i.e., fuel lean). This is equivalent to oscillating at a
infinitely slow frequency with all burners oscillating in-phase. The typical bell-shaped curve of NOx
emissions versus excess air level was generated. NOx was found to decrease by 60% at the extremes of
the excess air level compared to normal operation (5% to 15% excess air). A 25% oscillation amplitude
was deemed sufficient to substantially reduce NOx, but a 38% (50% more) was chosen for subsequent test
campaigns to overcome mixing effects in the furnace between the flames from different burners and
between the flames and the combustion gases. For a quick test, the three middle burners on one side of
the furnace were set to oscillate at this amplitude, with burners next to each other oscillating out-of-phase,
and at a 60% lower frequency than the first test campaign. Emissions were measured at the exhaust ports
above the center of these three burners. With these parametric changes, NOx reduction increased to 20%.
The second parameterization test, involved the measurement of the squareness of the oscillating
flow rate wave and the measurement of NOx at slow oscillation frequencies with burners on both sides of
the furnace oscillating. Using a fast pressure sensor (the same one used during earlier laboratory testing),
the squareness of the flow rate wave was found to be within 15% of a square wave. With the three middle
(61111 final report.doc) 93
burners on each side of the furnace oscillating at a slow frequency, NOx reduction was found to increase
to 31%. Burners next to each other and burners across from each other were oscillating out-of-phase at an
amplitude of 38%.
The third parameterization test involved the measurement of NOx at slow and very slow
oscillation frequencies with burners on each side of the furnace oscillating in-phase and the measurement
of the amplitude of the oscillating flow rate wave actually achieved at the burners. With burners next to
each other set to oscillate in phase, and burners opposite each other set to oscillate out of phase, NOx
reduction was found to be 24% at a slow frequency, and 31% at a very slow frequency. The 38%
amplitude was used for most burners, which represents a balance between the maximum achievable flow
(restricted by pressure availability) and the minimum achievable flow (restricted by how much the valves
can close). Based on manometer readings at each burner, one of the corner burner oscillating valves was
found not be able to be close below the position that produces the equivalent steady flow rate. Since the
steady flow rate when not oscillating has to be the average of the high and low flow rates when
oscillating, and since the low flow rate was equal to the steady flow rate, the high flow rate must also
have been equal to the steady flow rate, and therefore the amplitude was zero for this valve. The valve
was removed and tested on a field-erected flow station, but adjustments to the valve could not make the
valve close any further. The valve was replaced with one of the spares.
Second Test Campaign
For the second test campaign (June 1998), the oscillating combustion cycle was conducted at a
very low frequency and a medium amplitude as determined by the parametric testing. In should be noted
that the baseline and oscillating cycles were not exactly identical for this test campaign. The baseline
cycle contained an 8-hour “shelf”, or holding temperature that allowed the oils on the steel to be driven
off to improve surface quality. The oscillating cycle had 12 hours of shelf time. This was due to a
programmatic change at the mill. (This is a production furnace with a production load, so some aspects of
operation are beyond the control of the research investigators.) The extra 4-hours of time, where the
furnace and load temperatures were held steady, as well as the gas usage and emissions during this time
were removed from the total values for the purpose of comparison analysis. The firing rate during this 4-
hour time was fairly low.
Integration of the data collected to calculate total fuel used and NOx emitted over the entire cycle
showed that the oscillating cycle used 5% less fuel, was 2% shorter in time, and emitted 18% less NOx.
During the oscillating cycle, NOx was often reduced by 30%, and the reduction exceeded 40% during the
heat up portion of the cycle (see Figure 91). NOx would have been reduced even if the extra four hours
were included in the integration.
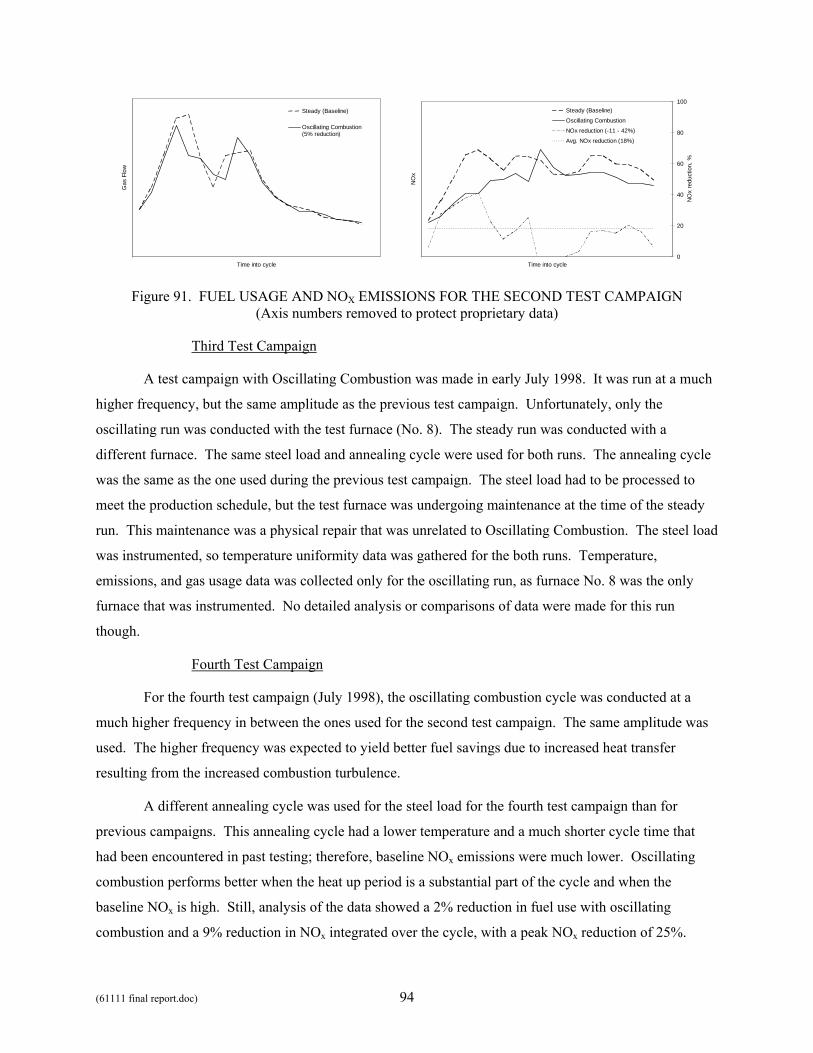
(61111 final report.doc) 94
Time into cycle
Gas
Flo
w
Steady (Baseline)
Oscillating Combustion(5% reduction)
Time into cycle
NO
x
0
20
40
60
80
100
NO
x re
duct
ion,
%
Steady (Baseline)
Oscillating Combustion
NOx reduction (-11 - 42%)
Avg. NOx reduction (18%)
Figure 91. FUEL USAGE AND NOX EMISSIONS FOR THE SECOND TEST CAMPAIGN (Axis numbers removed to protect proprietary data)
Third Test Campaign
A test campaign with Oscillating Combustion was made in early July 1998. It was run at a much
higher frequency, but the same amplitude as the previous test campaign. Unfortunately, only the
oscillating run was conducted with the test furnace (No. 8). The steady run was conducted with a
different furnace. The same steel load and annealing cycle were used for both runs. The annealing cycle
was the same as the one used during the previous test campaign. The steel load had to be processed to
meet the production schedule, but the test furnace was undergoing maintenance at the time of the steady
run. This maintenance was a physical repair that was unrelated to Oscillating Combustion. The steel load
was instrumented, so temperature uniformity data was gathered for the both runs. Temperature,
emissions, and gas usage data was collected only for the oscillating run, as furnace No. 8 was the only
furnace that was instrumented. No detailed analysis or comparisons of data were made for this run
though.
Fourth Test Campaign
For the fourth test campaign (July 1998), the oscillating combustion cycle was conducted at a
much higher frequency in between the ones used for the second test campaign. The same amplitude was
used. The higher frequency was expected to yield better fuel savings due to increased heat transfer
resulting from the increased combustion turbulence.
A different annealing cycle was used for the steel load for the fourth test campaign than for
previous campaigns. This annealing cycle had a lower temperature and a much shorter cycle time that
had been encountered in past testing; therefore, baseline NOx emissions were much lower. Oscillating
combustion performs better when the heat up period is a substantial part of the cycle and when the
baseline NOx is high. Still, analysis of the data showed a 2% reduction in fuel use with oscillating
combustion and a 9% reduction in NOx integrated over the cycle, with a peak NOx reduction of 25%.
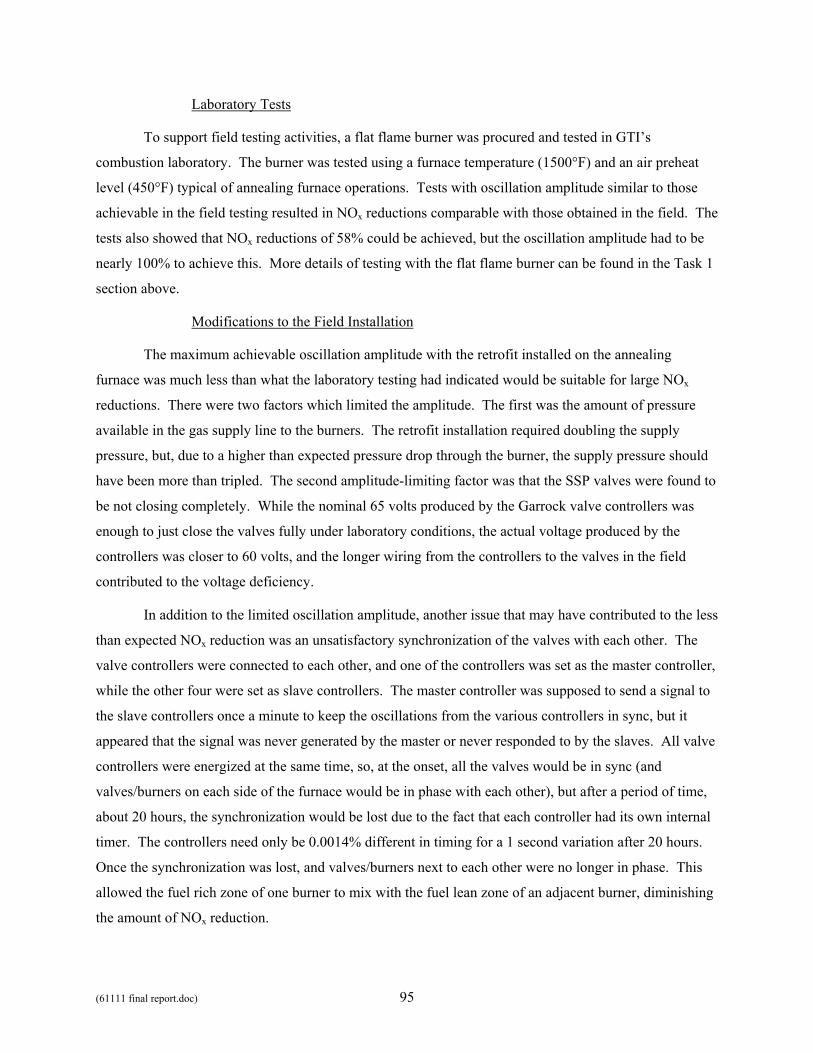
(61111 final report.doc) 95
Laboratory Tests
To support field testing activities, a flat flame burner was procured and tested in GTI’s
combustion laboratory. The burner was tested using a furnace temperature (1500°F) and an air preheat
level (450°F) typical of annealing furnace operations. Tests with oscillation amplitude similar to those
achievable in the field testing resulted in NOx reductions comparable with those obtained in the field. The
tests also showed that NOx reductions of 58% could be achieved, but the oscillation amplitude had to be
nearly 100% to achieve this. More details of testing with the flat flame burner can be found in the Task 1
section above.
Modifications to the Field Installation
The maximum achievable oscillation amplitude with the retrofit installed on the annealing
furnace was much less than what the laboratory testing had indicated would be suitable for large NOx
reductions. There were two factors which limited the amplitude. The first was the amount of pressure
available in the gas supply line to the burners. The retrofit installation required doubling the supply
pressure, but, due to a higher than expected pressure drop through the burner, the supply pressure should
have been more than tripled. The second amplitude-limiting factor was that the SSP valves were found to
be not closing completely. While the nominal 65 volts produced by the Garrock valve controllers was
enough to just close the valves fully under laboratory conditions, the actual voltage produced by the
controllers was closer to 60 volts, and the longer wiring from the controllers to the valves in the field
contributed to the voltage deficiency.
In addition to the limited oscillation amplitude, another issue that may have contributed to the less
than expected NOx reduction was an unsatisfactory synchronization of the valves with each other. The
valve controllers were connected to each other, and one of the controllers was set as the master controller,
while the other four were set as slave controllers. The master controller was supposed to send a signal to
the slave controllers once a minute to keep the oscillations from the various controllers in sync, but it
appeared that the signal was never generated by the master or never responded to by the slaves. All valve
controllers were energized at the same time, so, at the onset, all the valves would be in sync (and
valves/burners on each side of the furnace would be in phase with each other), but after a period of time,
about 20 hours, the synchronization would be lost due to the fact that each controller had its own internal
timer. The controllers need only be 0.0014% different in timing for a 1 second variation after 20 hours.
Once the synchronization was lost, and valves/burners next to each other were no longer in phase. This
allowed the fuel rich zone of one burner to mix with the fuel lean zone of an adjacent burner, diminishing
the amount of NOx reduction.
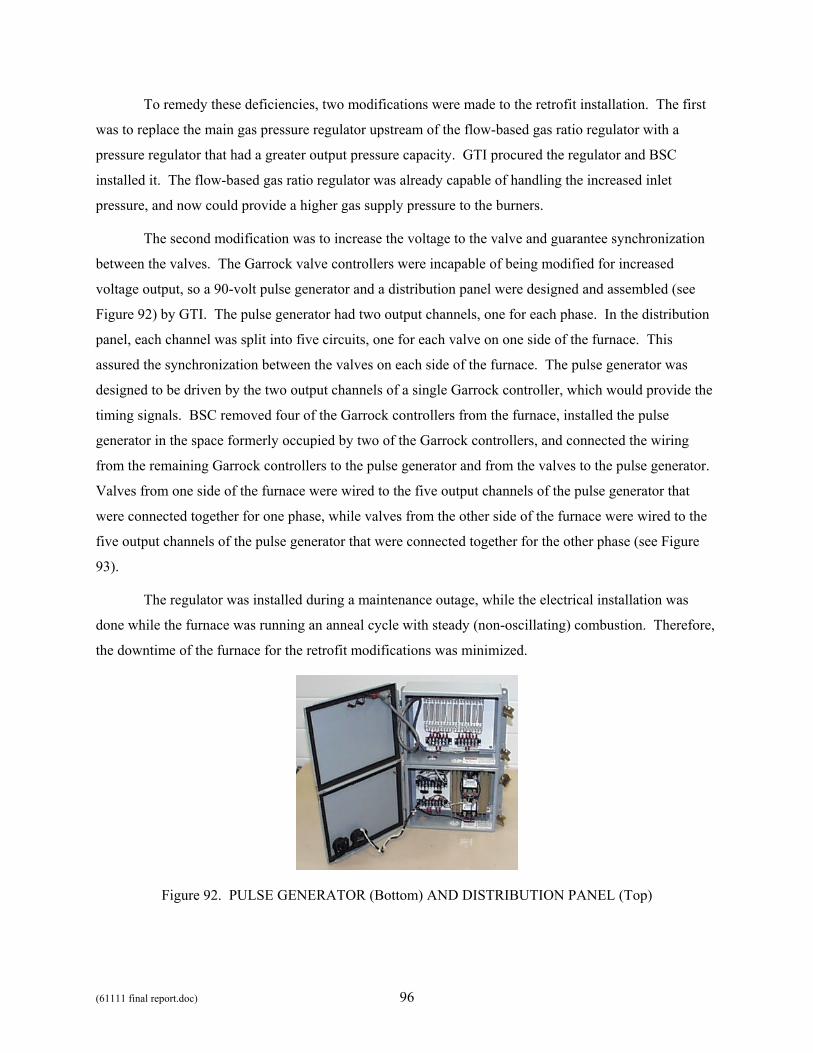
(61111 final report.doc) 96
To remedy these deficiencies, two modifications were made to the retrofit installation. The first
was to replace the main gas pressure regulator upstream of the flow-based gas ratio regulator with a
pressure regulator that had a greater output pressure capacity. GTI procured the regulator and BSC
installed it. The flow-based gas ratio regulator was already capable of handling the increased inlet
pressure, and now could provide a higher gas supply pressure to the burners.
The second modification was to increase the voltage to the valve and guarantee synchronization
between the valves. The Garrock valve controllers were incapable of being modified for increased
voltage output, so a 90-volt pulse generator and a distribution panel were designed and assembled (see
Figure 92) by GTI. The pulse generator had two output channels, one for each phase. In the distribution
panel, each channel was split into five circuits, one for each valve on one side of the furnace. This
assured the synchronization between the valves on each side of the furnace. The pulse generator was
designed to be driven by the two output channels of a single Garrock controller, which would provide the
timing signals. BSC removed four of the Garrock controllers from the furnace, installed the pulse
generator in the space formerly occupied by two of the Garrock controllers, and connected the wiring
from the remaining Garrock controllers to the pulse generator and from the valves to the pulse generator.
Valves from one side of the furnace were wired to the five output channels of the pulse generator that
were connected together for one phase, while valves from the other side of the furnace were wired to the
five output channels of the pulse generator that were connected together for the other phase (see Figure
93).
The regulator was installed during a maintenance outage, while the electrical installation was
done while the furnace was running an anneal cycle with steady (non-oscillating) combustion. Therefore,
the downtime of the furnace for the retrofit modifications was minimized.
Figure 92. PULSE GENERATOR (Bottom) AND DISTRIBUTION PANEL (Top)
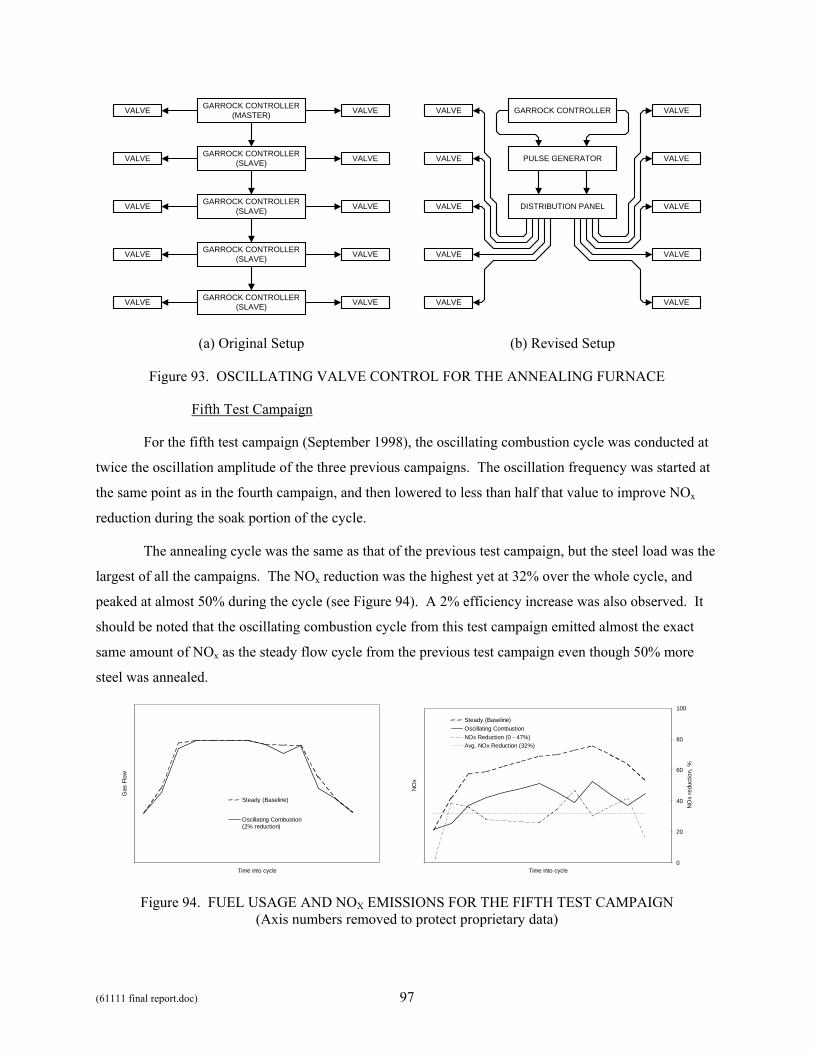
(61111 final report.doc) 97
GARROCK CONTROLLER(MASTER)VALVE
GARROCK CONTROLLER(SLAVE)
GARROCK CONTROLLER(SLAVE)
GARROCK CONTROLLER(SLAVE)
GARROCK CONTROLLER(SLAVE)
VALVE
VALVE VALVE
VALVE VALVE
VALVE VALVE
VALVE VALVE
GARROCK CONTROLLERVALVE
PULSE GENERATOR
DISTRIBUTION PANEL
VALVE
VALVE VALVE
VALVE VALVE
VALVE VALVE
VALVE VALVE
(a) Original Setup (b) Revised Setup
Figure 93. OSCILLATING VALVE CONTROL FOR THE ANNEALING FURNACE
Fifth Test Campaign
For the fifth test campaign (September 1998), the oscillating combustion cycle was conducted at
twice the oscillation amplitude of the three previous campaigns. The oscillation frequency was started at
the same point as in the fourth campaign, and then lowered to less than half that value to improve NOx
reduction during the soak portion of the cycle.
The annealing cycle was the same as that of the previous test campaign, but the steel load was the
largest of all the campaigns. The NOx reduction was the highest yet at 32% over the whole cycle, and
peaked at almost 50% during the cycle (see Figure 94). A 2% efficiency increase was also observed. It
should be noted that the oscillating combustion cycle from this test campaign emitted almost the exact
same amount of NOx as the steady flow cycle from the previous test campaign even though 50% more
steel was annealed.
Time into cycle
Gas
Flo
w
Steady (Baseline)
Oscillating Combustion(2% reduction)
Time into cycle
NO
x
0
20
40
60
80
100
NO
x re
duct
ion,
%
Steady (Baseline)Oscillating CombustionNOx Reduction (0 - 47%)Avg. NOx Reduction (32%)
Figure 94. FUEL USAGE AND NOX EMISSIONS FOR THE FIFTH TEST CAMPAIGN (Axis numbers removed to protect proprietary data)
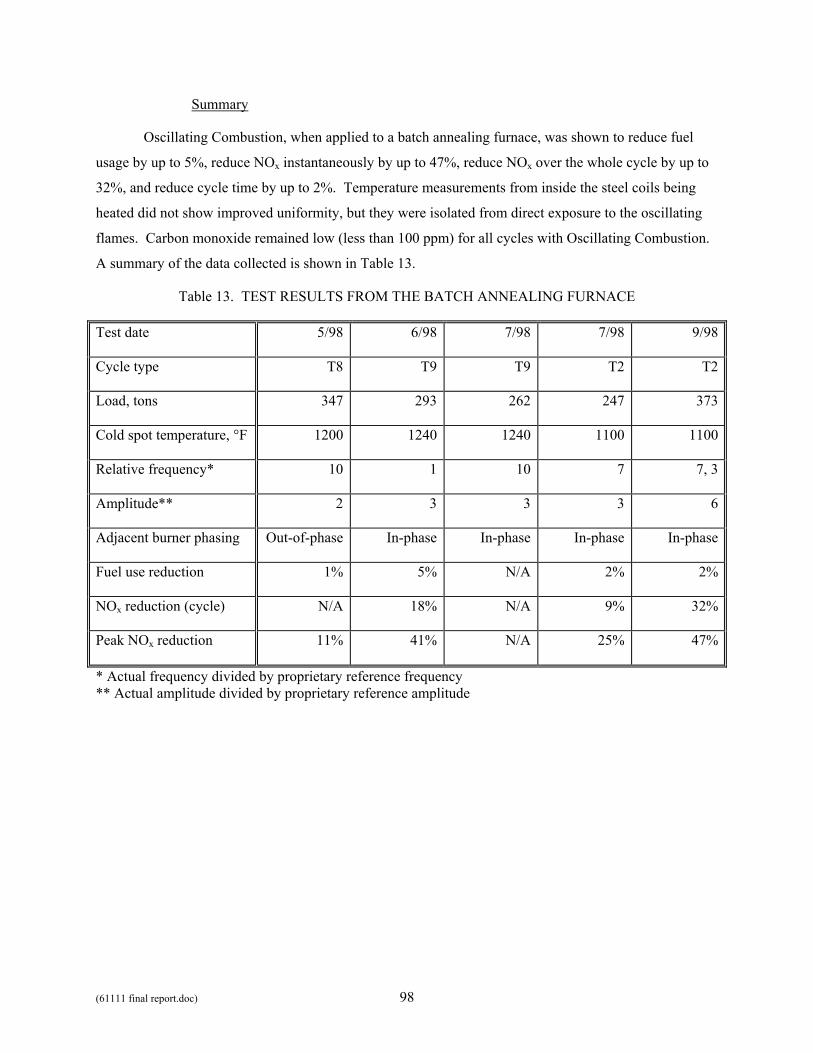
(61111 final report.doc) 98
Summary
Oscillating Combustion, when applied to a batch annealing furnace, was shown to reduce fuel
usage by up to 5%, reduce NOx instantaneously by up to 47%, reduce NOx over the whole cycle by up to
32%, and reduce cycle time by up to 2%. Temperature measurements from inside the steel coils being
heated did not show improved uniformity, but they were isolated from direct exposure to the oscillating
flames. Carbon monoxide remained low (less than 100 ppm) for all cycles with Oscillating Combustion.
A summary of the data collected is shown in Table 13.
Table 13. TEST RESULTS FROM THE BATCH ANNEALING FURNACE
Test date 5/98 6/98 7/98 7/98 9/98
Cycle type T8 T9 T9 T2 T2
Load, tons 347 293 262 247 373
Cold spot temperature, °F 1200 1240 1240 1100 1100
Relative frequency* 10 1 10 7 7, 3
Amplitude** 2 3 3 3 6
Adjacent burner phasing Out-of-phase In-phase In-phase In-phase In-phase
Fuel use reduction 1% 5% N/A 2% 2%
NOx reduction (cycle) N/A 18% N/A 9% 32%
Peak NOx reduction 11% 41% N/A 25% 47%
* Actual frequency divided by proprietary reference frequency ** Actual amplitude divided by proprietary reference amplitude
(61111 final report.doc) 99
Task 6. Demonstration of Oscillating Combustion on a Reheat Furnace
The overall objective of this task was to successfully demonstrate the benefits of oscillating
combustion on a steel reheat furnace. The expected results from this effort were a more uniformly heated
product, reduced energy consumption, and increased productivity while simultaneously reducing NOx
emissions. The results from the field demonstration will be used to illustrate performance gains with
oscillating combustion that can be used to promote commercialization of the technology.
The specific goals for the original site were
• 10% fuel savings with oscillating combustion (14% if oscillating combustion is combined with time proportional firing (TPF))
• 50°F (50%) reduction in product temperature gradient
• 50% reduction in NOx emissions from the retrofitted zones
• No adverse impacts on scaling or furnace operations
The specific goals for the replacement site were
• 45% reduction in NOx emissions from the furnace with oscillating combustion
• 2% fuel savings or increase in production rate
• No adverse impacts on other emissions or furnace operations
Brief Description of the Task
This task originally involved a field demonstration of oscillating combustion on a steel reheat
furnace at Bethlehem Steel Corporation’s (now ISG’s) Burns Harbor Division in Indiana. BSC produces
a wide variety of steel mill products including hot-rolled, cold-rolled and coated sheets, tin mill products,
carbon and alloy plates, rail, specialty blooms, carbon and alloy bars and large diameter pipe. Its principal
markets include automotive, construction, machinery and equipment, appliance, containers, service
centers, rail and pipe.
BSC personnel reported the reheat furnaces in the 110" Plate Mill heat the top slab surface
substantially more than the bottom surface. This effect stems from the design of the bottom charge zone,
which causes the flames from the opposing sidewall burners to meet (impinge) in the center of the furnace
and overheat the slab. To alleviate this problem, alternate burners on either side were shut off, leaving a
staggered pattern of flames, which resulted in less thermal input being delivered to this zone. The bottom
of the slab is therefore not as hot as the top. This causes differential deformation during the rolling
process and an unusual edge profile in the finished product. The edge must be trimmed which results in a
yield loss. This amounts to a significant amount of steel scrapped over the course of a year in addition to
the extra processing cost.
(61111 final report.doc) 100
To alleviate the problem with the differential surface temperature of the slab, as well as to
increase furnace efficiency and reduce NOx emissions, oscillating combustion was proposed to be
installed on the charge and heat zones of Furnace #2 in the 110" Plate Mill. For the bottom charge zone,
all but 2 of burners would be reactivated, and opposing burners would be run with out-of-phase
oscillation cycles. Because the length of the flame changes when it is oscillated, the impingement point
of two flames from opposite walls would no longer be constantly in the center of the furnace, but would
rather sweep back and forth across the width of the furnace, effectively painting the heat release across
the slabs in the furnace. The higher heat release in the bottom charge zone would alleviate the
temperature differential of the slab.
In addition to the more uniform temperature of the slab, the rearrangement of heat input would
lower the overall heat demand and NOx emissions since the top charge zone would no longer have to be
run at such a high heat load (which equals higher flame temperature and higher wall heat losses) to make
up for the lack of heat in the bottom charge zone. This reduction in fuel usage and NOx emissions would
be in addition to that resulting from the oscillating combustion process itself.
Before field testing could begin on this furnace, the 110" Plate Mill was furloughed in October
2000 due to the business environment. Initially it was envisioned that the mill would be restarted with the
onset of the Millennium Pipeline project, for which the mill would supply steel, but delays in that project
led GTI to seek alternate host sites. In late 2002 contact was made with Nucor Steel, and in early 2003 a
replacement host site was located—the walking hearth steel billet reheat furnace in the #2 Roll Mill at the
Nucor Steel facility in Plymouth, Utah. Nucor Corporation is the second largest steel producer in the U.S.
and has over $4.1 billion in sales annually. Nucor is also the nation’s largest recycler, recycling over 13
million tons of scrap steel annually. The company is headquartered in Charlotte, North Carolina and has
operating facilities in 14 states. Products produced are carbon and alloy steel in bars, beams, sheet, and
plate; steel joists and joist girders; steel deck; cold finished steel; steel fasteners; metal building systems;
and light gauge steel framing.
Nucor Steel – Utah is a world-class producer of hot rolled carbon steel products. They offer the
most extensive product/size range of carbon steel angles, channels, flat bars, rounds and squares in the
western states, in addition to concrete reinforcing steel. The plant is also the largest recycler in the west.
Nucor Steel – Utah began operations in 1980 and has expanded to produce over 1,000,000 tons annually.
Nucor personnel reported that the facility in Utah, as well as other, but not all, Nucor facilities in
the U.S. would be subject to a consent decree to lower NOx emissions by 2006. They were also interested
in increasing the production rate of their reheat furnace.
(61111 final report.doc) 101
To implement oscillating combustion on this furnace, it was proposed to install an oscillating
valve on each of ten of the burners in the Heat Zone, which makes up about 72% of the heat load for the
furnace.
The oscillating valves and valve controllers being used for the demonstration were scaled up and
fabricated by Outsource Tech Inc (OTI), on referral from the valves original developer, GT Development
Corporation (GTDC). OTI, which was located in Mill Creek, Washington, was a consulting engineering
company that provided product design and development services from product “concept to production”
for the consumer products, medical products, aircraft, and other industries.
The sponsors of this task were GRI GTI’s Sustaining Membership Program, U.S. DOE-OIT, and,
with the selection of the Nucor Steel facility, Questar Gas. In-kind support came from BSC, Air Liquide
of America, Nucor Steel, and OTI.
Approach
The approach followed to conduct this field demonstration was as follows:
• Survey the furnace.
• Evaluate oscillating combustion on the same model of burner in GTI’s combustion laboratory (for BSC only; GTI had already tested oscillating combustion the same type of burner that is used at Nucor).
• Scale up the Cyclic valve and its associated controls to the sizes needed for the field demonstration.
• Model the furnace to evaluate thermal performance and determine initial oscillation parameters (for BSC site only).
• Spot check the emissions from the reheat furnace (for Nucor site only).
• Design the retrofit installation and instrumentation package.
• Submit design to host site for approval and work scheduling.
• Conduct baseline testing.
• Install oscillating valves and controls for the bottom charge zones and conduct field testing (for BSC site only).
• Install oscillating valves and controls for the top charge zone (for BSC site only) and heat zone and conduct field testing.
• Install TPF for the bottom charge zones (BCZs) and conduct field testing (for BSC site only).
• Train furnace operators in use of the oscillating combustion system.
• Analyze and report test data.
The approach for the two sites is detailed in the following sections.
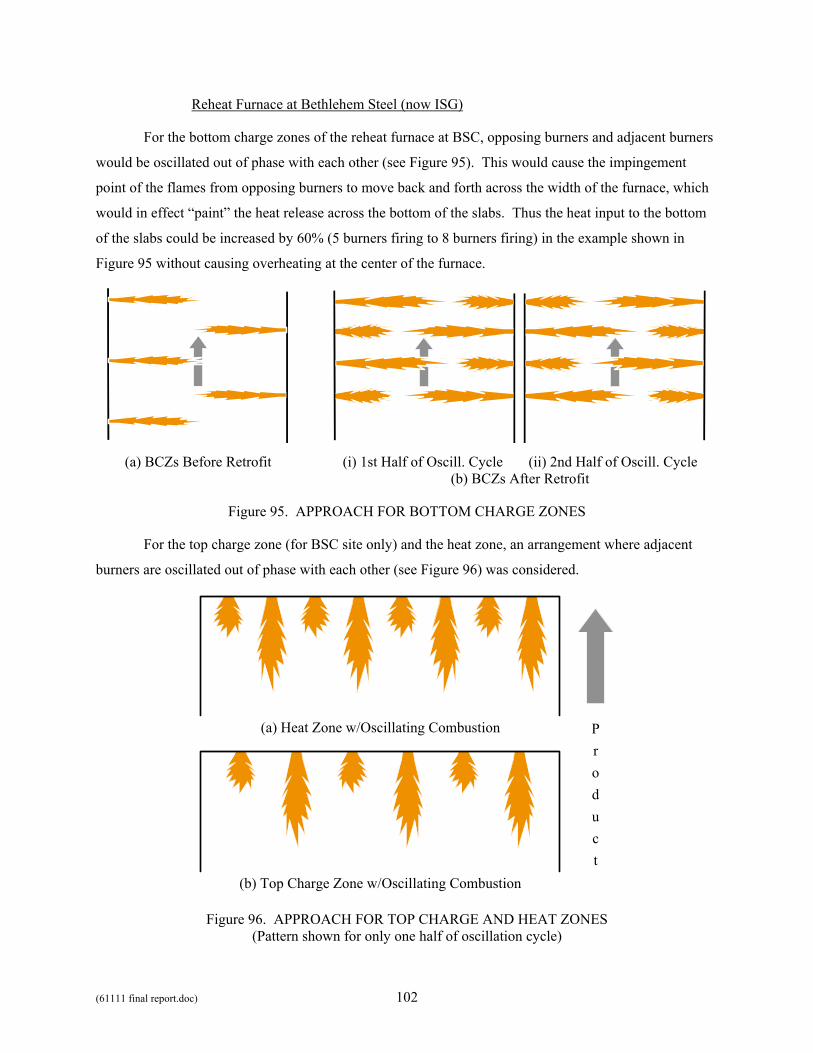
(61111 final report.doc) 102
Reheat Furnace at Bethlehem Steel (now ISG)
For the bottom charge zones of the reheat furnace at BSC, opposing burners and adjacent burners
would be oscillated out of phase with each other (see Figure 95). This would cause the impingement
point of the flames from opposing burners to move back and forth across the width of the furnace, which
would in effect “paint” the heat release across the bottom of the slabs. Thus the heat input to the bottom
of the slabs could be increased by 60% (5 burners firing to 8 burners firing) in the example shown in
Figure 95 without causing overheating at the center of the furnace.
(a) BCZs Before Retrofit (i) 1st Half of Oscill. Cycle (ii) 2nd Half of Oscill. Cycle (b) BCZs After Retrofit
Figure 95. APPROACH FOR BOTTOM CHARGE ZONES
For the top charge zone (for BSC site only) and the heat zone, an arrangement where adjacent
burners are oscillated out of phase with each other (see Figure 96) was considered.
(a) Heat Zone w/Oscillating Combustion
(b) Top Charge Zone w/Oscillating Combustion
Product
Figure 96. APPROACH FOR TOP CHARGE AND HEAT ZONES (Pattern shown for only one half of oscillation cycle)
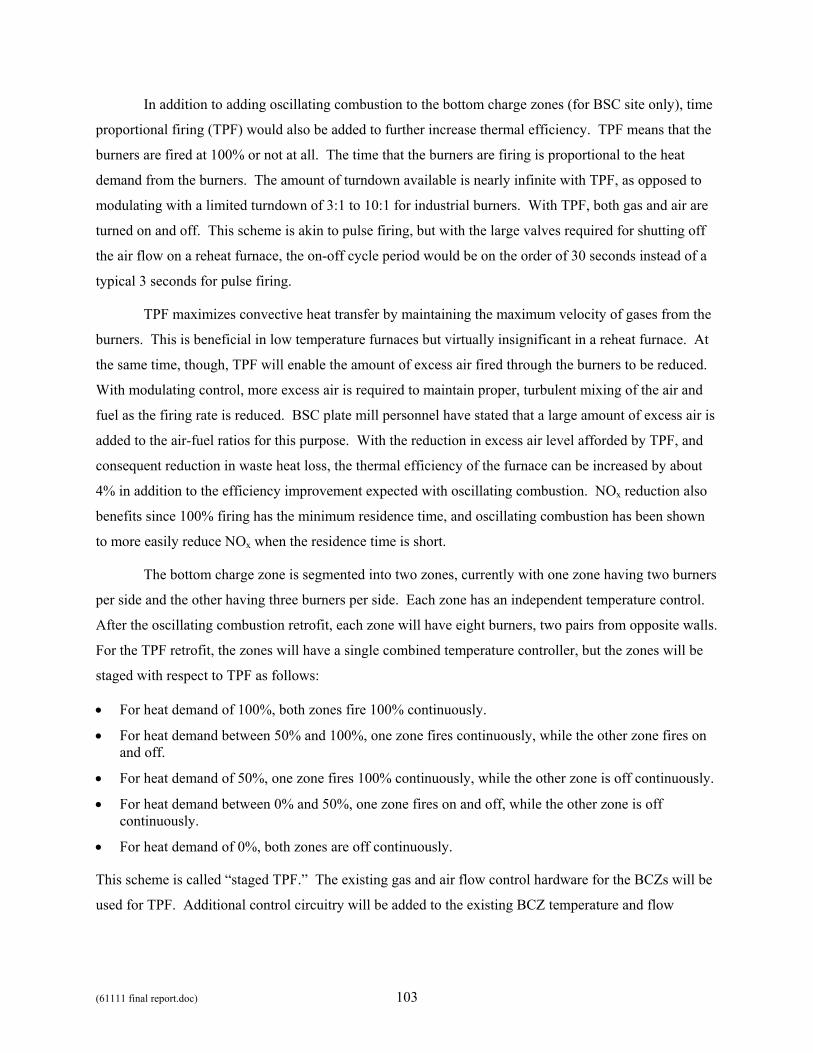
(61111 final report.doc) 103
In addition to adding oscillating combustion to the bottom charge zones (for BSC site only), time
proportional firing (TPF) would also be added to further increase thermal efficiency. TPF means that the
burners are fired at 100% or not at all. The time that the burners are firing is proportional to the heat
demand from the burners. The amount of turndown available is nearly infinite with TPF, as opposed to
modulating with a limited turndown of 3:1 to 10:1 for industrial burners. With TPF, both gas and air are
turned on and off. This scheme is akin to pulse firing, but with the large valves required for shutting off
the air flow on a reheat furnace, the on-off cycle period would be on the order of 30 seconds instead of a
typical 3 seconds for pulse firing.
TPF maximizes convective heat transfer by maintaining the maximum velocity of gases from the
burners. This is beneficial in low temperature furnaces but virtually insignificant in a reheat furnace. At
the same time, though, TPF will enable the amount of excess air fired through the burners to be reduced.
With modulating control, more excess air is required to maintain proper, turbulent mixing of the air and
fuel as the firing rate is reduced. BSC plate mill personnel have stated that a large amount of excess air is
added to the air-fuel ratios for this purpose. With the reduction in excess air level afforded by TPF, and
consequent reduction in waste heat loss, the thermal efficiency of the furnace can be increased by about
4% in addition to the efficiency improvement expected with oscillating combustion. NOx reduction also
benefits since 100% firing has the minimum residence time, and oscillating combustion has been shown
to more easily reduce NOx when the residence time is short.
The bottom charge zone is segmented into two zones, currently with one zone having two burners
per side and the other having three burners per side. Each zone has an independent temperature control.
After the oscillating combustion retrofit, each zone will have eight burners, two pairs from opposite walls.
For the TPF retrofit, the zones will have a single combined temperature controller, but the zones will be
staged with respect to TPF as follows:
• For heat demand of 100%, both zones fire 100% continuously.
• For heat demand between 50% and 100%, one zone fires continuously, while the other zone fires on and off.
• For heat demand of 50%, one zone fires 100% continuously, while the other zone is off continuously.
• For heat demand between 0% and 50%, one zone fires on and off, while the other zone is off continuously.
• For heat demand of 0%, both zones are off continuously.
This scheme is called “staged TPF.” The existing gas and air flow control hardware for the BCZs will be
used for TPF. Additional control circuitry will be added to the existing BCZ temperature and flow
(61111 final report.doc) 104
controllers. Oscillating combustion will only occur when the burners are on, though the oscillating valves
themselves will operate continuously.
Reheat Furnace at Nucor Steel
For the reheat furnace at Nucor Steel, only the Heat Zone was targeted for retrofit. The approach
used was the same as intended for the top heat zone of the reheat furnace at BSC (see Figure 96), albeit
for ten burners instead of eight.
Work Performed
The reheat furnaces were surveyed to learn gas piping details, operational history, and level of
current instrumentation. This was partially done for the BSC furnace before the project officially started
in October 1999, and was done for the Nucor furnace partially in April 2003, when a spot check of
emissions was made to verify that this furnace was indeed a good candidate for oscillating combustion,
and completed in June 2003, when locations for GTI instrumentation package were selected.
Oscillating combustion was tested at GTI’s combustion laboratory on the same make and model
burner that is used on the BSC reheat furnace. Oscillating combustion had already been tested in an
earlier project at GTI on the same make and model burner that is used on the Nucor reheat furnace.
Oscillating combustion parameters were determined that maximized the amount of heat transfer increase
and NOx reduction.
Modeling of the BSC reheat furnace and the oscillating combustion process was conducted at Air
Liquide using a variant of their ATHENA code. This work was done under subcontract to GTI which
was half cost shared by Air Liquide.
An oscillating valve, the key component to oscillating combustion, was scaled up to the sizes
needed for application to the reheat furnace. This work was done by Outsource Tech Inc. (OTI) under
subcontract to GTI which was partially cost shared by OTI. Prototype valves of two sizes and a
multiplexing valve controller were fabricated by OTI and then tested by GTI. Valves for the retrofit
application and two additional valve controllers were then fabricated by OTI and then tested by GTI.
Some deficiencies were noted in the valves’ and controllers’ performance, and resolution to these was
pursued with OTI.
The reheat furnaces were surveyed further to determine locations for the oscillating valves and
GTI’s instrumentation. A retrofit installation plan was developed for the oscillating valves and, for the
BSC furnace, the TPF system. Additional instrumentation was procured for the BSC furnace.
(61111 final report.doc) 105
In October 2000, the BSC furnace, and in fact the whole 110" Plate Mill, was furloughed due to
business conditions. It initially had been expected that the mill would be restarted within 6 months of that
date, when a gas utility endeavor known as the Millennium Pipeline project would begin construction.
That project has been delayed at least to Fall 2002. Other potential field demonstration sites, both at other
Bethlehem Steel (now ISG) mills, and at other companies’ steel mills, were investigated, and Nucor Steel
agreed to participate in the project in early 2003.
In June 2003, GTI installed test instrumentation and conducted baseline testing at Nucor Steel.
This was followed in July and August 2003 with the preparation of an installation plan and the
preparation of the oscillating valves and controller. In September 2003 the oscillating valves and
controller were installed on the reheat furnace. Field testing was conducted in September, October, and
November 2003. GTI removed test instrumentation in November 2003, and left the furnace with the
oscillating combustion system in continuous operation.
Results
In October 1999, the field demonstration of oscillating combustion on a reheat furnace began.
The following section describes the results of the work performed. The sections below break the work
down into finer detail than in the Work Performed section above.
Reheat Furnace at Bethlehem Steel
Furnace Survey
Reheat furnace No. 2 at the 110” Plate Mill at BSC is of the walking beam type (see Figure 97).
It has ten 18-MMBtu/h North American 6819A burners in the bottom charge zones (Zones 2 and 3), six
16-MMBtu/h North American 6819A burners in the top charge zone (Zone 1), and six 4-MMBtu/h North
American 6819A burners in the top heat zone (Zone 4), plus 30 flat flame burners in the soak and screen
zones (Zones 5 and 6). The total capacity of the furnace is 350 MMBtu/h. The bottom charge zone
burners are fired from the two sides and are split into two control zones. Only 5 of the bottom charge
zone burners are used (one from each side in a staggered formation), which results in a substantial
temperature differential between the top and the bottom of the slab. If all 10 burners are used, there is
flame impingement, and this results in overheating of the portion of the slabs at the center of the furnace.

(61111 final report.doc) 106
1
2 3
45 6
Figure 97. BSC REHEAT FURNACE BURNER LOCATIONS
Oscillating Combustion was targeted for a total of 22 burners in Zones 1-4. For the bottom
charge zone, it was expected that Oscillating Combustion will allow the use of eight opposed burners
instead of five staggered burners since flame impingement will no longer be in one place (the center) but
rather it will be swept across the bottom of the slabs. The opposing burners would have opposite
oscillation phases. The “painting of the heat” across the slab would result in a more uniform temperature
distribution in the slabs, and the additional firing capacity would equalize the temperature of top and
bottom of the slab.
A kick-off meeting for the project was held at BSC’s Burns Harbor facility on December 2, 1999.
The work scope and schedule were reviewed, the mechanics of measuring the thermal and emissions
performance of the Oscillating Combustion retrofit were discussed, the logistics of mill access and where
to place the test equipment were gone over, and contact information was exchanged.
Prior to the start of the project GTI had visited the site to collect operating data on May 11, 1999.
This data was used to calculate the projected benefits in terms of temperature uniformity, fuel savings,
and NOx reduction.
Burner Testing
GTI procured from North American Manufacturing Company a gas-only version (model 4819A)
of the dual-fuel burners (model 6819A) used on the reheat furnace at BSC. The burners at BSC are used
in a gas-only mode. A refractory block and adapter flange were obtained from local sources for
connecting the burner to GTI's test furnace, which had been recently relocated from GTI’s Energy
Development Center in Chicago, Illinois, to GTI’s Emerging Energy Technology Campus, located across
the street from GTI’s headquarters in Des Plaines, Illinois.
The burner, mounting adapter flange, and refractory block were installed on the furnace, along
with a pilot and UV flame sensor. A CeramPhysics SSP model 7B oscillating valve was mounted on the
gas line just upstream of the burner. A photograph of the furnace setup is shown in Figure 98.
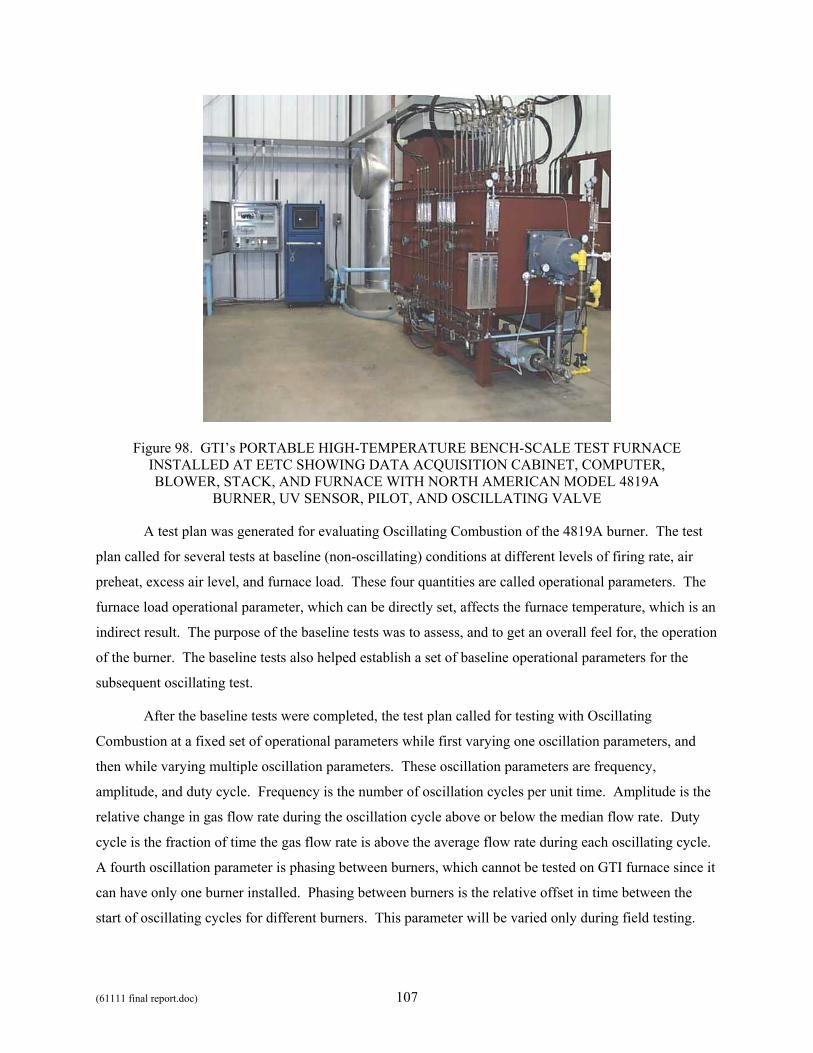
(61111 final report.doc) 107
Figure 98. GTI’s PORTABLE HIGH-TEMPERATURE BENCH-SCALE TEST FURNACE INSTALLED AT EETC SHOWING DATA ACQUISITION CABINET, COMPUTER, BLOWER, STACK, AND FURNACE WITH NORTH AMERICAN MODEL 4819A
BURNER, UV SENSOR, PILOT, AND OSCILLATING VALVE
A test plan was generated for evaluating Oscillating Combustion of the 4819A burner. The test
plan called for several tests at baseline (non-oscillating) conditions at different levels of firing rate, air
preheat, excess air level, and furnace load. These four quantities are called operational parameters. The
furnace load operational parameter, which can be directly set, affects the furnace temperature, which is an
indirect result. The purpose of the baseline tests was to assess, and to get an overall feel for, the operation
of the burner. The baseline tests also helped establish a set of baseline operational parameters for the
subsequent oscillating test.
After the baseline tests were completed, the test plan called for testing with Oscillating
Combustion at a fixed set of operational parameters while first varying one oscillation parameters, and
then while varying multiple oscillation parameters. These oscillation parameters are frequency,
amplitude, and duty cycle. Frequency is the number of oscillation cycles per unit time. Amplitude is the
relative change in gas flow rate during the oscillation cycle above or below the median flow rate. Duty
cycle is the fraction of time the gas flow rate is above the average flow rate during each oscillating cycle.
A fourth oscillation parameter is phasing between burners, which cannot be tested on GTI furnace since it
can have only one burner installed. Phasing between burners is the relative offset in time between the
start of oscillating cycles for different burners. This parameter will be varied only during field testing.
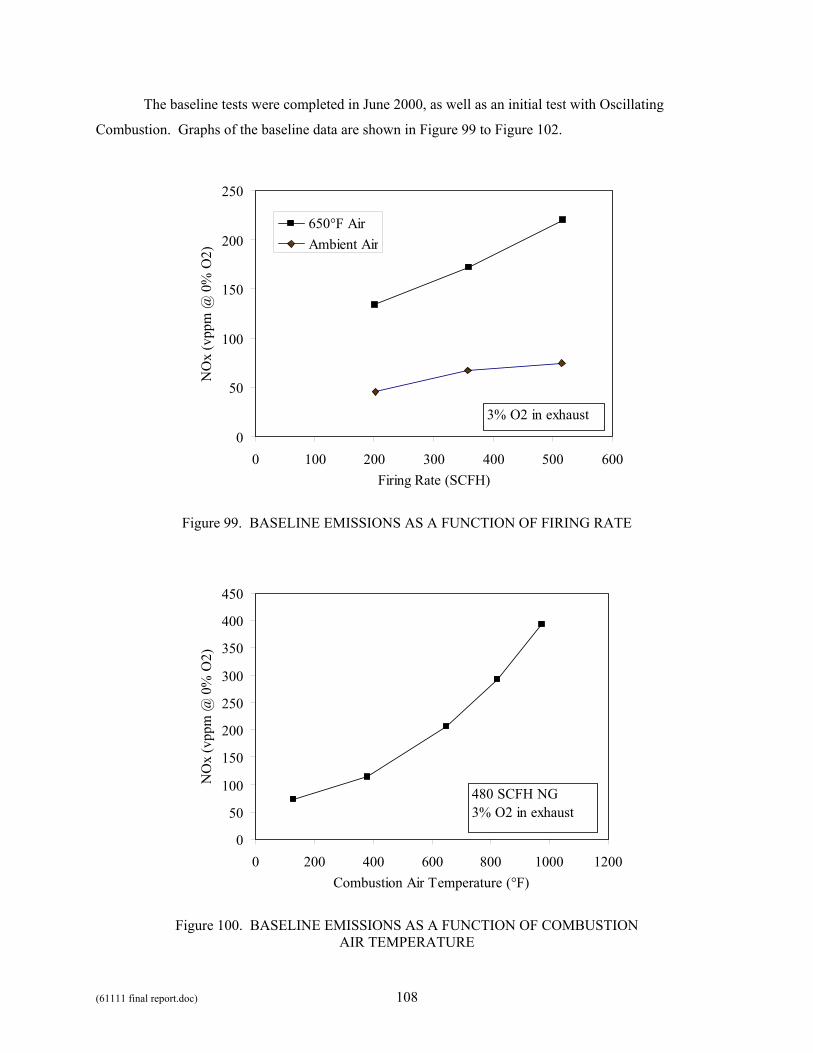
(61111 final report.doc) 108
The baseline tests were completed in June 2000, as well as an initial test with Oscillating
Combustion. Graphs of the baseline data are shown in Figure 99 to Figure 102.
0
50
100
150
200
250
0 100 200 300 400 500 600Firing Rate (SCFH)
NO
x (v
ppm
@ 0
% O
2)650°F AirAmbient Air
3% O2 in exhaust
Figure 99. BASELINE EMISSIONS AS A FUNCTION OF FIRING RATE
0
50
100
150
200
250
300
350
400
450
0 200 400 600 800 1000 1200Combustion Air Temperature (°F)
NO
x (v
ppm
@ 0
% O
2)
480 SCFH NG3% O2 in exhaust
Figure 100. BASELINE EMISSIONS AS A FUNCTION OF COMBUSTION AIR TEMPERATURE
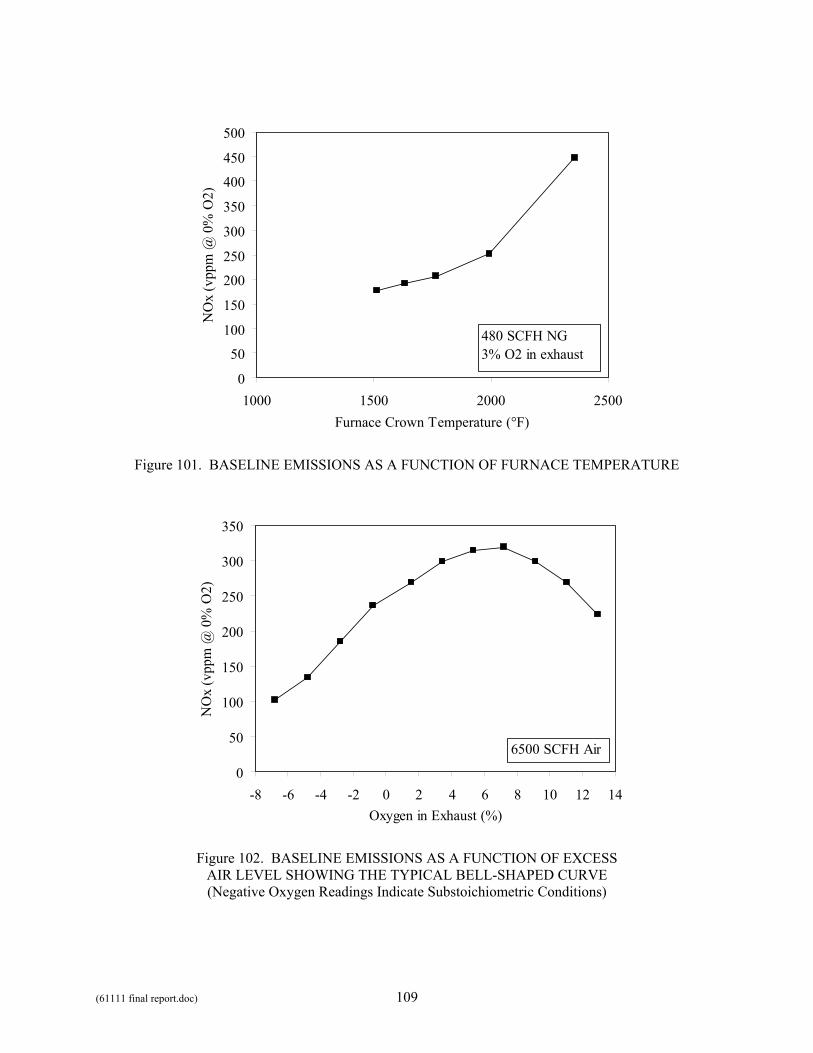
(61111 final report.doc) 109
0
50
100
150
200
250
300
350
400
450
500
1000 1500 2000 2500Furnace Crown Temperature (°F)
NO
x (v
ppm
@ 0
% O
2)
480 SCFH NG3% O2 in exhaust
Figure 101. BASELINE EMISSIONS AS A FUNCTION OF FURNACE TEMPERATURE
0
50
100
150
200
250
300
350
-8 -6 -4 -2 0 2 4 6 8 10 12 14Oxygen in Exhaust (%)
NO
x (v
ppm
@ 0
% O
2)
6500 SCFH Air
Figure 102. BASELINE EMISSIONS AS A FUNCTION OF EXCESS AIR LEVEL SHOWING THE TYPICAL BELL-SHAPED CURVE (Negative Oxygen Readings Indicate Substoichiometric Conditions)
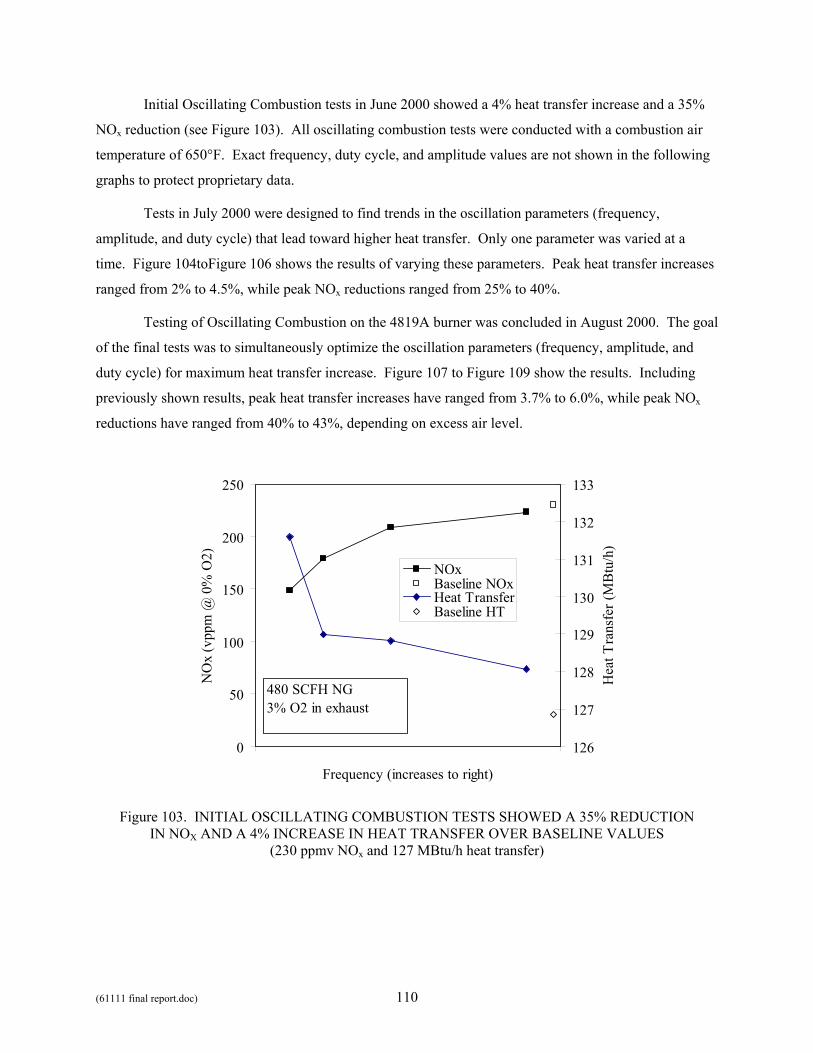
(61111 final report.doc) 110
Initial Oscillating Combustion tests in June 2000 showed a 4% heat transfer increase and a 35%
NOx reduction (see Figure 103). All oscillating combustion tests were conducted with a combustion air
temperature of 650°F. Exact frequency, duty cycle, and amplitude values are not shown in the following
graphs to protect proprietary data.
Tests in July 2000 were designed to find trends in the oscillation parameters (frequency,
amplitude, and duty cycle) that lead toward higher heat transfer. Only one parameter was varied at a
time. Figure 104toFigure 106 shows the results of varying these parameters. Peak heat transfer increases
ranged from 2% to 4.5%, while peak NOx reductions ranged from 25% to 40%.
Testing of Oscillating Combustion on the 4819A burner was concluded in August 2000. The goal
of the final tests was to simultaneously optimize the oscillation parameters (frequency, amplitude, and
duty cycle) for maximum heat transfer increase. Figure 107 to Figure 109 show the results. Including
previously shown results, peak heat transfer increases have ranged from 3.7% to 6.0%, while peak NOx
reductions have ranged from 40% to 43%, depending on excess air level.
0
50
100
150
200
250
Frequency (increases to right)
NO
x (v
ppm
@ 0
% O
2)
126
127
128
129
130
131
132
133
Hea
t Tra
nsfe
r (M
Btu
/h)
NOxBaseline NOxHeat TransferBaseline HT
480 SCFH NG3% O2 in exhaust
Figure 103. INITIAL OSCILLATING COMBUSTION TESTS SHOWED A 35% REDUCTION IN NOX AND A 4% INCREASE IN HEAT TRANSFER OVER BASELINE VALUES
(230 ppmv NOx and 127 MBtu/h heat transfer)
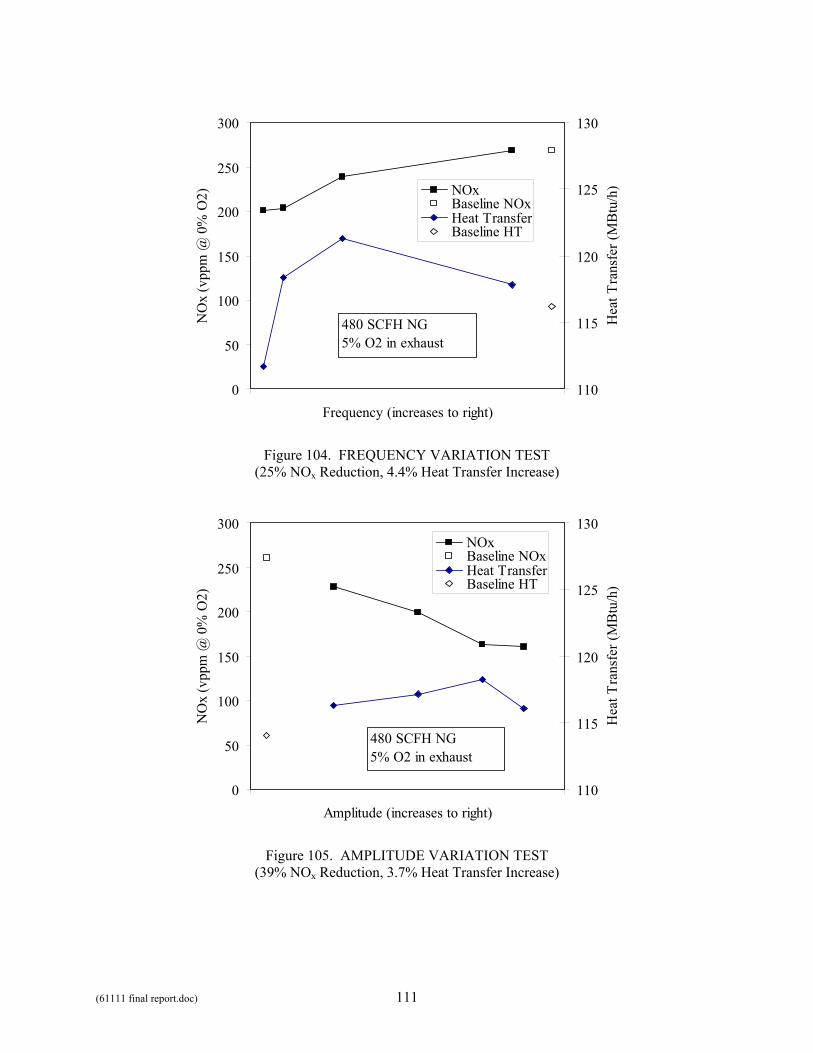
(61111 final report.doc) 111
0
50
100
150
200
250
300
Frequency (increases to right)
NO
x (v
ppm
@ 0
% O
2)
110
115
120
125
130
Hea
t Tra
nsfe
r (M
Btu
/h)NOx
Baseline NOxHeat TransferBaseline HT
480 SCFH NG5% O2 in exhaust
Figure 104. FREQUENCY VARIATION TEST (25% NOx Reduction, 4.4% Heat Transfer Increase)
0
50
100
150
200
250
300
Amplitude (increases to right)
NO
x (v
ppm
@ 0
% O
2)
110
115
120
125
130
Hea
t Tra
nsfe
r (M
Btu
/h)
NOxBaseline NOxHeat TransferBaseline HT
480 SCFH NG5% O2 in exhaust
Figure 105. AMPLITUDE VARIATION TEST (39% NOx Reduction, 3.7% Heat Transfer Increase)
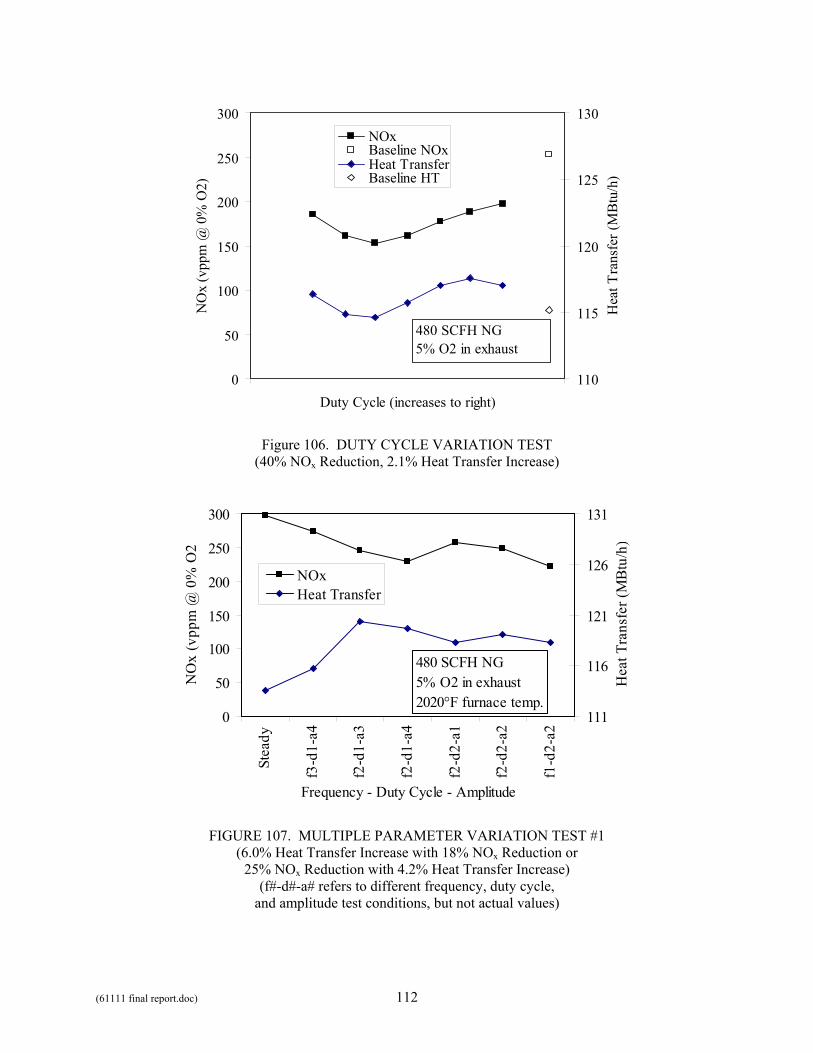
(61111 final report.doc) 112
0
50
100
150
200
250
300
Duty Cycle (increases to right)
NO
x (v
ppm
@ 0
% O
2)
110
115
120
125
130
Hea
t Tra
nsfe
r (M
Btu
/h)
NOxBaseline NOxHeat TransferBaseline HT
480 SCFH NG5% O2 in exhaust
Figure 106. DUTY CYCLE VARIATION TEST (40% NOx Reduction, 2.1% Heat Transfer Increase)
0
50
100
150
200
250
300
Stea
dy
f3-d
1-a4
f2-d
1-a3
f2-d
1-a4
f2-d
2-a1
f2-d
2-a2
f1-d
2-a2
Frequency - Duty Cycle - Amplitude
NO
x (v
ppm
@ 0
% O
2
111
116
121
126
131
Hea
t Tra
nsfe
r (M
Btu
/h)
NOxHeat Transfer
480 SCFH NG5% O2 in exhaust2020°F furnace temp.
FIGURE 107. MULTIPLE PARAMETER VARIATION TEST #1 (6.0% Heat Transfer Increase with 18% NOx Reduction or
25% NOx Reduction with 4.2% Heat Transfer Increase) (f#-d#-a# refers to different frequency, duty cycle,
and amplitude test conditions, but not actual values)
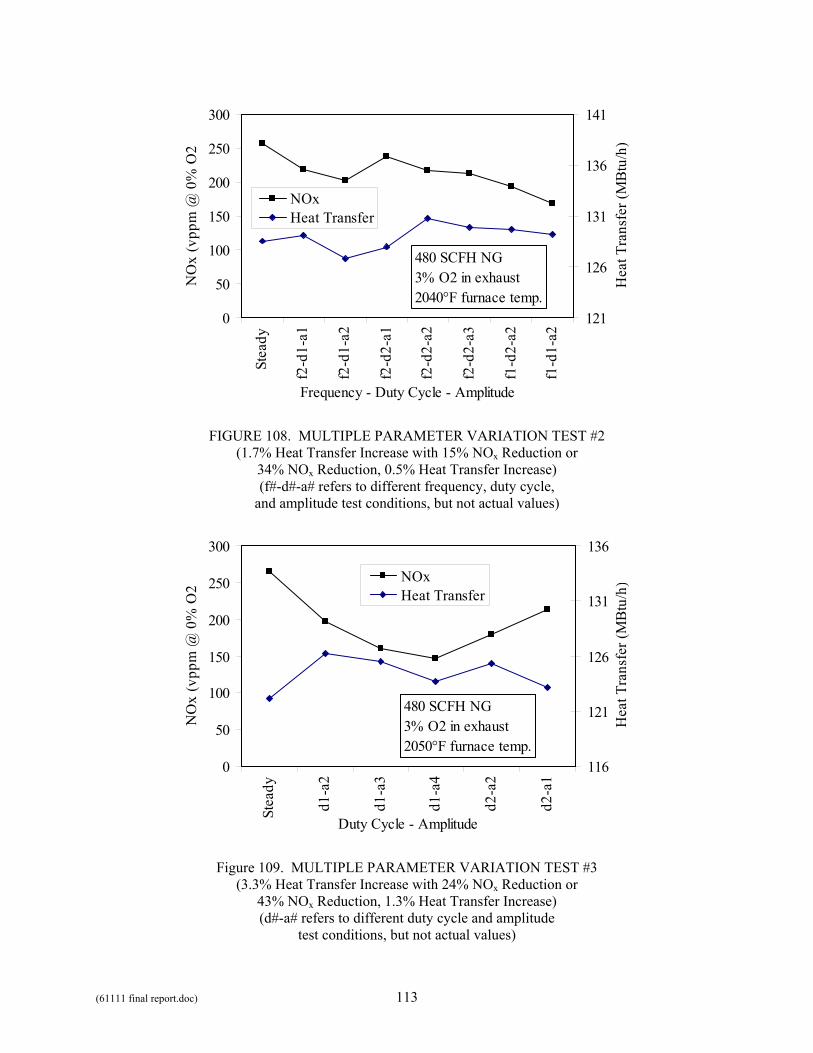
(61111 final report.doc) 113
0
50
100
150
200
250
300
Stea
dy
f2-d
1-a1
f2-d
1-a2
f2-d
2-a1
f2-d
2-a2
f2-d
2-a3
f1-d
2-a2
f1-d
1-a2
Frequency - Duty Cycle - Amplitude
NO
x (v
ppm
@ 0
% O
2
121
126
131
136
141
Hea
t Tra
nsfe
r (M
Btu
/h)
NOxHeat Transfer
480 SCFH NG3% O2 in exhaust2040°F furnace temp.
FIGURE 108. MULTIPLE PARAMETER VARIATION TEST #2 (1.7% Heat Transfer Increase with 15% NOx Reduction or
34% NOx Reduction, 0.5% Heat Transfer Increase) (f#-d#-a# refers to different frequency, duty cycle,
and amplitude test conditions, but not actual values)
0
50
100
150
200
250
300
Stea
dy
d1-a
2
d1-a
3
d1-a
4
d2-a
2
d2-a
1
Duty Cycle - Amplitude
NO
x (v
ppm
@ 0
% O
2
116
121
126
131
136
Hea
t Tra
nsfe
r (M
Btu
/h)NOx
Heat Transfer
480 SCFH NG3% O2 in exhaust2050°F furnace temp.
Figure 109. MULTIPLE PARAMETER VARIATION TEST #3 (3.3% Heat Transfer Increase with 24% NOx Reduction or
43% NOx Reduction, 1.3% Heat Transfer Increase) (d#-a# refers to different duty cycle and amplitude
test conditions, but not actual values)
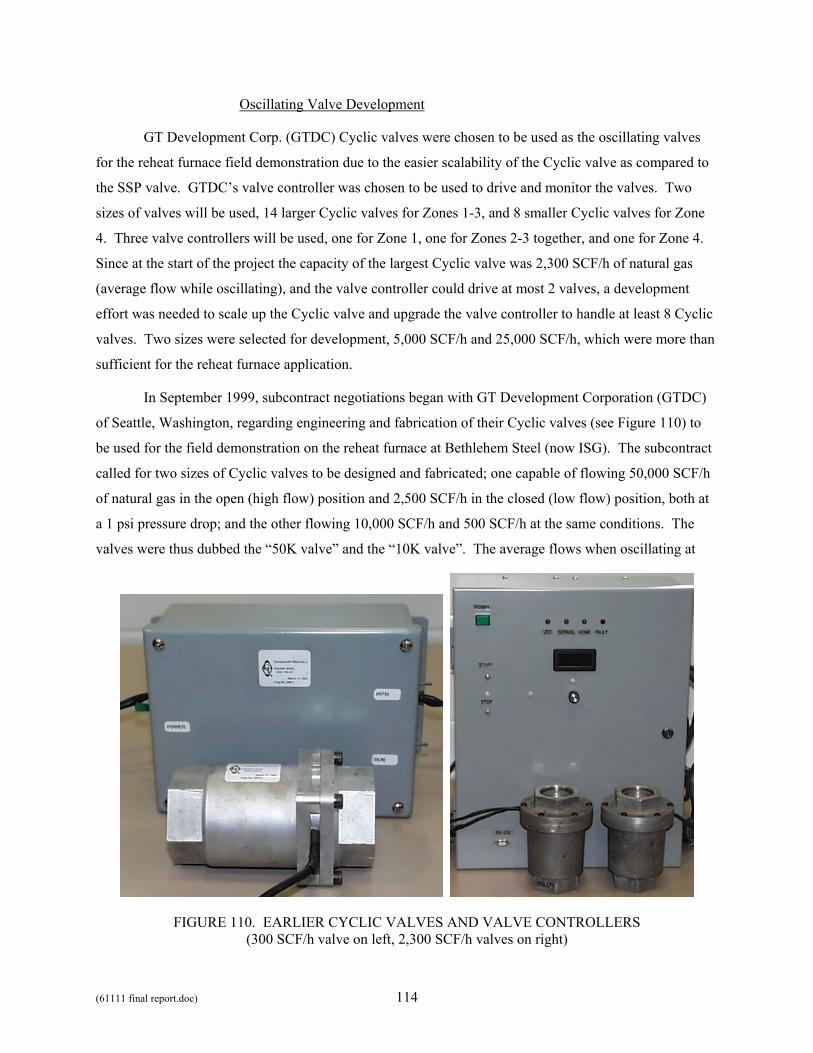
(61111 final report.doc) 114
Oscillating Valve Development
GT Development Corp. (GTDC) Cyclic valves were chosen to be used as the oscillating valves
for the reheat furnace field demonstration due to the easier scalability of the Cyclic valve as compared to
the SSP valve. GTDC’s valve controller was chosen to be used to drive and monitor the valves. Two
sizes of valves will be used, 14 larger Cyclic valves for Zones 1-3, and 8 smaller Cyclic valves for Zone
4. Three valve controllers will be used, one for Zone 1, one for Zones 2-3 together, and one for Zone 4.
Since at the start of the project the capacity of the largest Cyclic valve was 2,300 SCF/h of natural gas
(average flow while oscillating), and the valve controller could drive at most 2 valves, a development
effort was needed to scale up the Cyclic valve and upgrade the valve controller to handle at least 8 Cyclic
valves. Two sizes were selected for development, 5,000 SCF/h and 25,000 SCF/h, which were more than
sufficient for the reheat furnace application.
In September 1999, subcontract negotiations began with GT Development Corporation (GTDC)
of Seattle, Washington, regarding engineering and fabrication of their Cyclic valves (see Figure 110) to
be used for the field demonstration on the reheat furnace at Bethlehem Steel (now ISG). The subcontract
called for two sizes of Cyclic valves to be designed and fabricated; one capable of flowing 50,000 SCF/h
of natural gas in the open (high flow) position and 2,500 SCF/h in the closed (low flow) position, both at
a 1 psi pressure drop; and the other flowing 10,000 SCF/h and 500 SCF/h at the same conditions. The
valves were thus dubbed the “50K valve” and the “10K valve”. The average flows when oscillating at
FIGURE 110. EARLIER CYCLIC VALVES AND VALVE CONTROLLERS (300 SCF/h valve on left, 2,300 SCF/h valves on right)
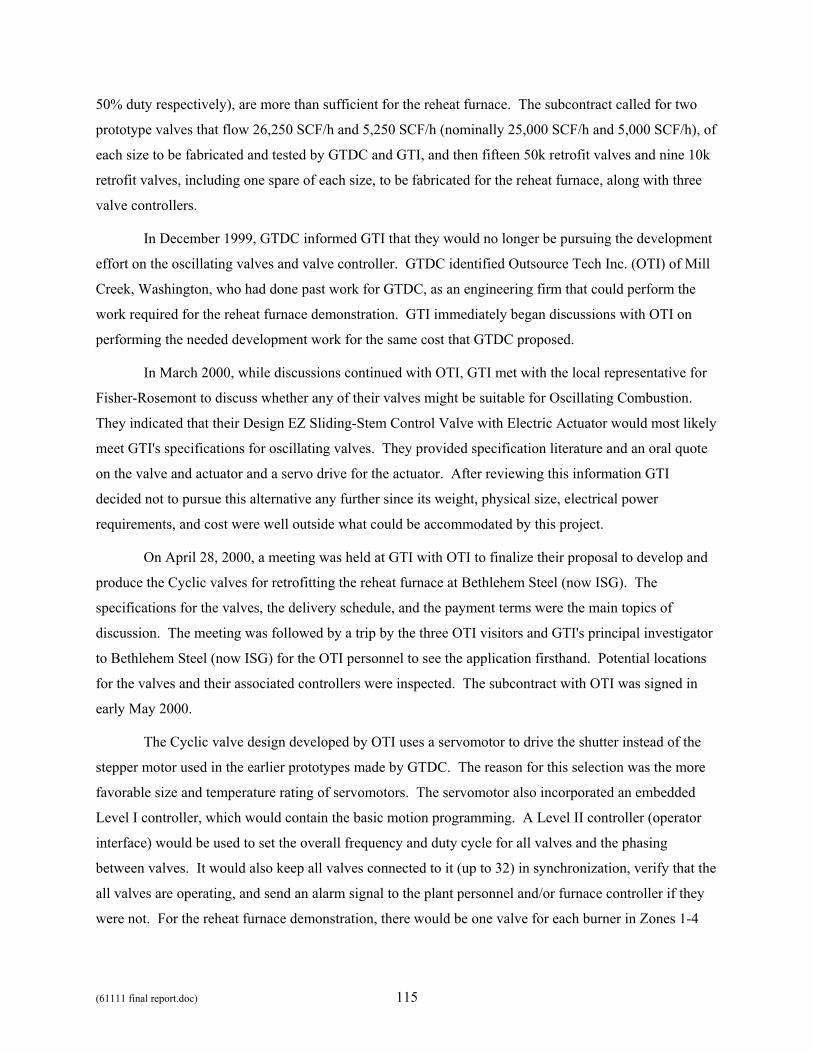
(61111 final report.doc) 115
50% duty respectively), are more than sufficient for the reheat furnace. The subcontract called for two
prototype valves that flow 26,250 SCF/h and 5,250 SCF/h (nominally 25,000 SCF/h and 5,000 SCF/h), of
each size to be fabricated and tested by GTDC and GTI, and then fifteen 50k retrofit valves and nine 10k
retrofit valves, including one spare of each size, to be fabricated for the reheat furnace, along with three
valve controllers.
In December 1999, GTDC informed GTI that they would no longer be pursuing the development
effort on the oscillating valves and valve controller. GTDC identified Outsource Tech Inc. (OTI) of Mill
Creek, Washington, who had done past work for GTDC, as an engineering firm that could perform the
work required for the reheat furnace demonstration. GTI immediately began discussions with OTI on
performing the needed development work for the same cost that GTDC proposed.
In March 2000, while discussions continued with OTI, GTI met with the local representative for
Fisher-Rosemont to discuss whether any of their valves might be suitable for Oscillating Combustion.
They indicated that their Design EZ Sliding-Stem Control Valve with Electric Actuator would most likely
meet GTI's specifications for oscillating valves. They provided specification literature and an oral quote
on the valve and actuator and a servo drive for the actuator. After reviewing this information GTI
decided not to pursue this alternative any further since its weight, physical size, electrical power
requirements, and cost were well outside what could be accommodated by this project.
On April 28, 2000, a meeting was held at GTI with OTI to finalize their proposal to develop and
produce the Cyclic valves for retrofitting the reheat furnace at Bethlehem Steel (now ISG). The
specifications for the valves, the delivery schedule, and the payment terms were the main topics of
discussion. The meeting was followed by a trip by the three OTI visitors and GTI's principal investigator
to Bethlehem Steel (now ISG) for the OTI personnel to see the application firsthand. Potential locations
for the valves and their associated controllers were inspected. The subcontract with OTI was signed in
early May 2000.
The Cyclic valve design developed by OTI uses a servomotor to drive the shutter instead of the
stepper motor used in the earlier prototypes made by GTDC. The reason for this selection was the more
favorable size and temperature rating of servomotors. The servomotor also incorporated an embedded
Level I controller, which would contain the basic motion programming. A Level II controller (operator
interface) would be used to set the overall frequency and duty cycle for all valves and the phasing
between valves. It would also keep all valves connected to it (up to 32) in synchronization, verify that the
all valves are operating, and send an alarm signal to the plant personnel and/or furnace controller if they
were not. For the reheat furnace demonstration, there would be one valve for each burner in Zones 1-4
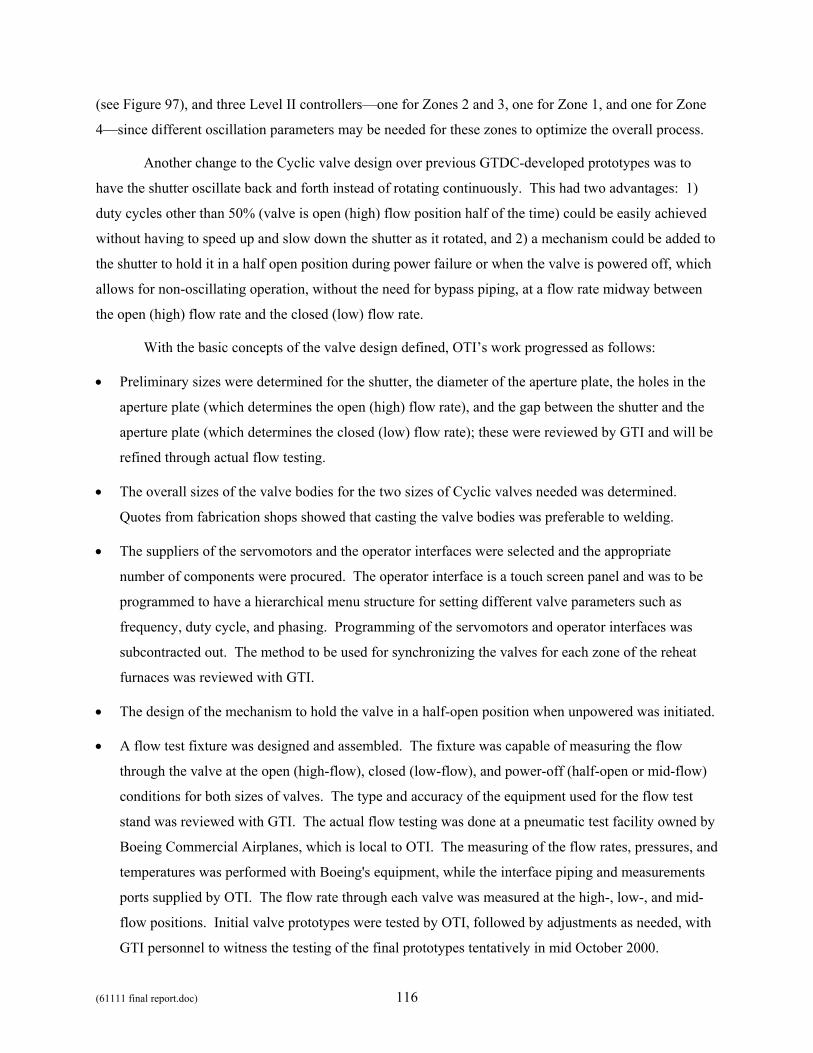
(61111 final report.doc) 116
(see Figure 97), and three Level II controllers—one for Zones 2 and 3, one for Zone 1, and one for Zone
4—since different oscillation parameters may be needed for these zones to optimize the overall process.
Another change to the Cyclic valve design over previous GTDC-developed prototypes was to
have the shutter oscillate back and forth instead of rotating continuously. This had two advantages: 1)
duty cycles other than 50% (valve is open (high) flow position half of the time) could be easily achieved
without having to speed up and slow down the shutter as it rotated, and 2) a mechanism could be added to
the shutter to hold it in a half open position during power failure or when the valve is powered off, which
allows for non-oscillating operation, without the need for bypass piping, at a flow rate midway between
the open (high) flow rate and the closed (low) flow rate.
With the basic concepts of the valve design defined, OTI’s work progressed as follows:
• Preliminary sizes were determined for the shutter, the diameter of the aperture plate, the holes in the
aperture plate (which determines the open (high) flow rate), and the gap between the shutter and the
aperture plate (which determines the closed (low) flow rate); these were reviewed by GTI and will be
refined through actual flow testing.
• The overall sizes of the valve bodies for the two sizes of Cyclic valves needed was determined.
Quotes from fabrication shops showed that casting the valve bodies was preferable to welding.
• The suppliers of the servomotors and the operator interfaces were selected and the appropriate
number of components were procured. The operator interface is a touch screen panel and was to be
programmed to have a hierarchical menu structure for setting different valve parameters such as
frequency, duty cycle, and phasing. Programming of the servomotors and operator interfaces was
subcontracted out. The method to be used for synchronizing the valves for each zone of the reheat
furnaces was reviewed with GTI.
• The design of the mechanism to hold the valve in a half-open position when unpowered was initiated.
• A flow test fixture was designed and assembled. The fixture was capable of measuring the flow
through the valve at the open (high-flow), closed (low-flow), and power-off (half-open or mid-flow)
conditions for both sizes of valves. The type and accuracy of the equipment used for the flow test
stand was reviewed with GTI. The actual flow testing was done at a pneumatic test facility owned by
Boeing Commercial Airplanes, which is local to OTI. The measuring of the flow rates, pressures, and
temperatures was performed with Boeing's equipment, while the interface piping and measurements
ports supplied by OTI. The flow rate through each valve was measured at the high-, low-, and mid-
flow positions. Initial valve prototypes were tested by OTI, followed by adjustments as needed, with
GTI personnel to witness the testing of the final prototypes tentatively in mid October 2000.
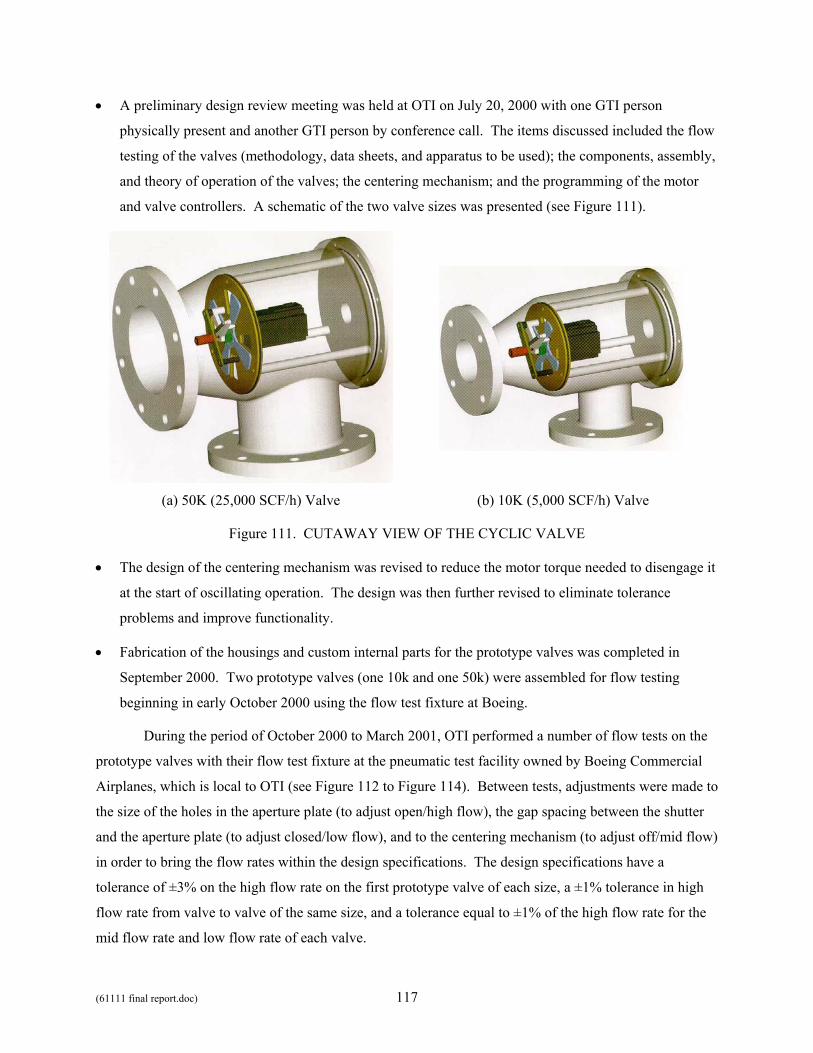
(61111 final report.doc) 117
• A preliminary design review meeting was held at OTI on July 20, 2000 with one GTI person
physically present and another GTI person by conference call. The items discussed included the flow
testing of the valves (methodology, data sheets, and apparatus to be used); the components, assembly,
and theory of operation of the valves; the centering mechanism; and the programming of the motor
and valve controllers. A schematic of the two valve sizes was presented (see Figure 111).
(a) 50K (25,000 SCF/h) Valve (b) 10K (5,000 SCF/h) Valve
Figure 111. CUTAWAY VIEW OF THE CYCLIC VALVE
• The design of the centering mechanism was revised to reduce the motor torque needed to disengage it
at the start of oscillating operation. The design was then further revised to eliminate tolerance
problems and improve functionality.
• Fabrication of the housings and custom internal parts for the prototype valves was completed in
September 2000. Two prototype valves (one 10k and one 50k) were assembled for flow testing
beginning in early October 2000 using the flow test fixture at Boeing.
During the period of October 2000 to March 2001, OTI performed a number of flow tests on the
prototype valves with their flow test fixture at the pneumatic test facility owned by Boeing Commercial
Airplanes, which is local to OTI (see Figure 112 to Figure 114). Between tests, adjustments were made to
the size of the holes in the aperture plate (to adjust open/high flow), the gap spacing between the shutter
and the aperture plate (to adjust closed/low flow), and to the centering mechanism (to adjust off/mid flow)
in order to bring the flow rates within the design specifications. The design specifications have a
tolerance of ±3% on the high flow rate on the first prototype valve of each size, a ±1% tolerance in high
flow rate from valve to valve of the same size, and a tolerance equal to ±1% of the high flow rate for the
mid flow rate and low flow rate of each valve.
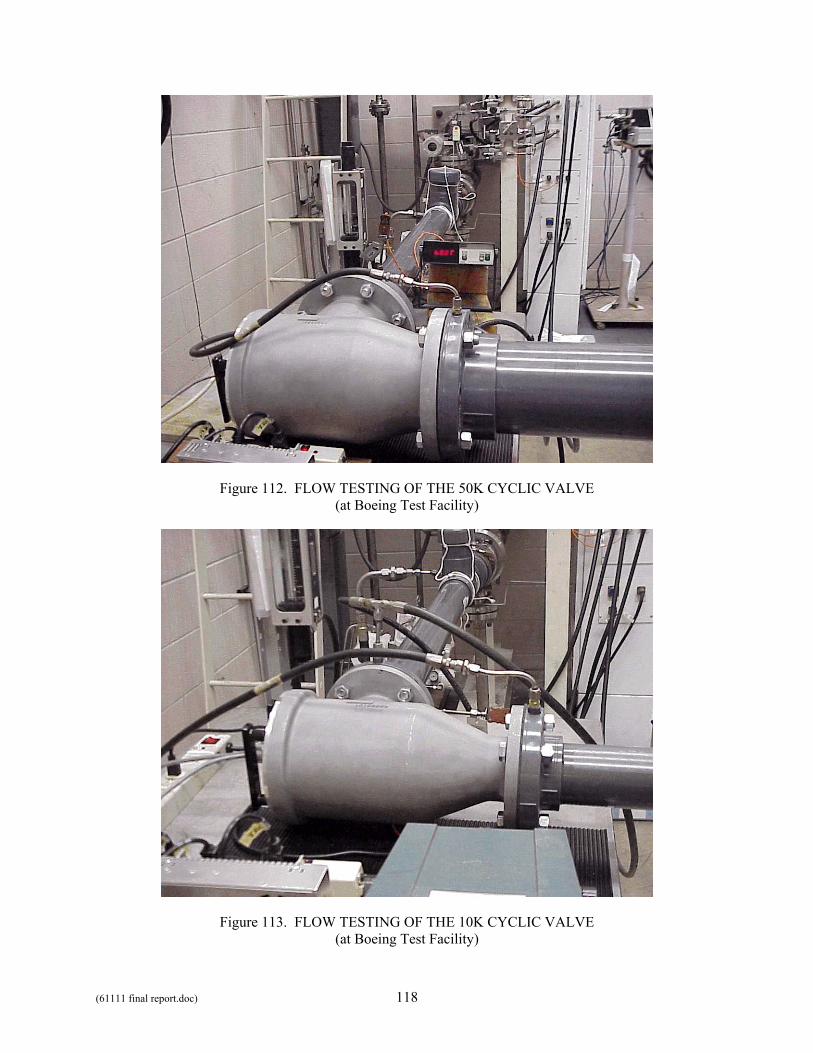
(61111 final report.doc) 118
Figure 112. FLOW TESTING OF THE 50K CYCLIC VALVE (at Boeing Test Facility)
Figure 113. FLOW TESTING OF THE 10K CYCLIC VALVE (at Boeing Test Facility)
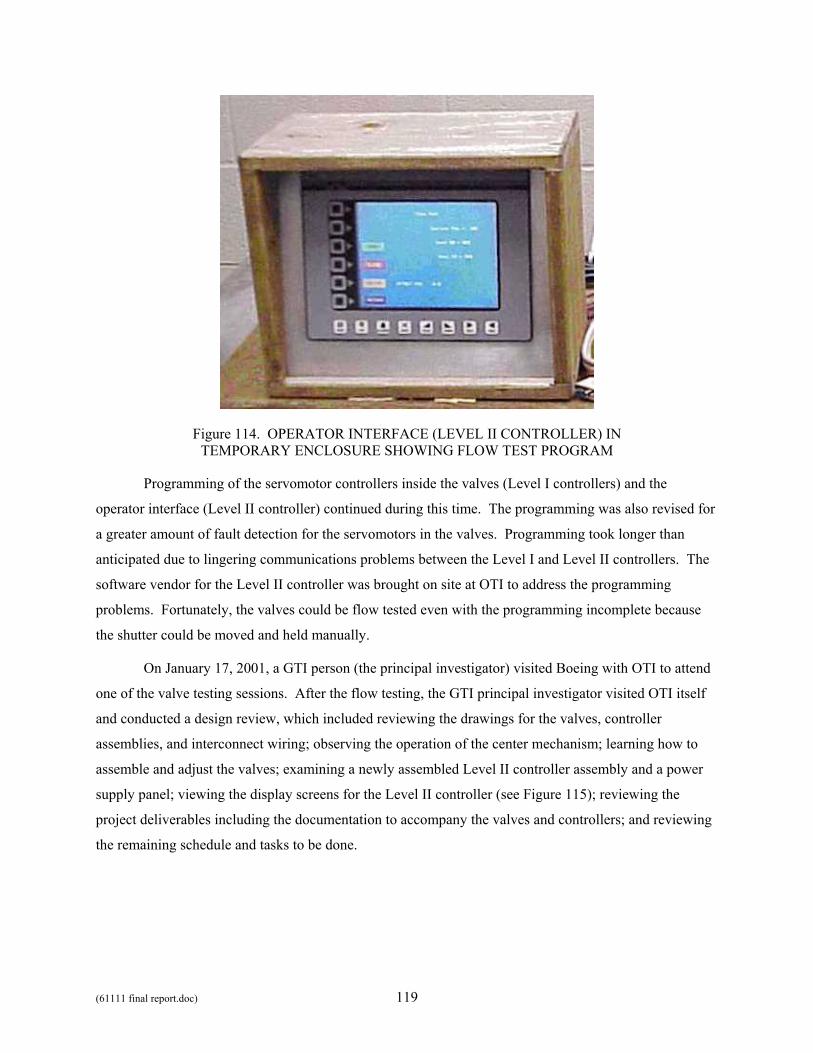
(61111 final report.doc) 119
Figure 114. OPERATOR INTERFACE (LEVEL II CONTROLLER) IN TEMPORARY ENCLOSURE SHOWING FLOW TEST PROGRAM
Programming of the servomotor controllers inside the valves (Level I controllers) and the
operator interface (Level II controller) continued during this time. The programming was also revised for
a greater amount of fault detection for the servomotors in the valves. Programming took longer than
anticipated due to lingering communications problems between the Level I and Level II controllers. The
software vendor for the Level II controller was brought on site at OTI to address the programming
problems. Fortunately, the valves could be flow tested even with the programming incomplete because
the shutter could be moved and held manually.
On January 17, 2001, a GTI person (the principal investigator) visited Boeing with OTI to attend
one of the valve testing sessions. After the flow testing, the GTI principal investigator visited OTI itself
and conducted a design review, which included reviewing the drawings for the valves, controller
assemblies, and interconnect wiring; observing the operation of the center mechanism; learning how to
assemble and adjust the valves; examining a newly assembled Level II controller assembly and a power
supply panel; viewing the display screens for the Level II controller (see Figure 115); reviewing the
project deliverables including the documentation to accompany the valves and controllers; and reviewing
the remaining schedule and tasks to be done.
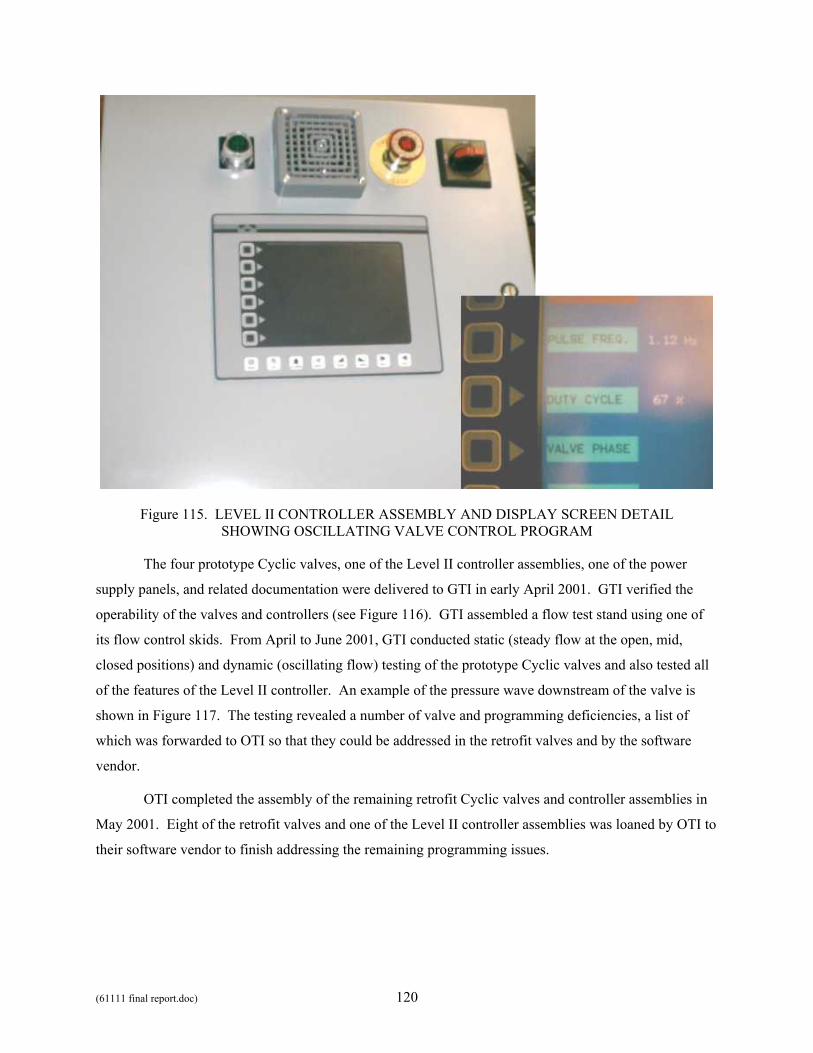
(61111 final report.doc) 120
Figure 115. LEVEL II CONTROLLER ASSEMBLY AND DISPLAY SCREEN DETAIL SHOWING OSCILLATING VALVE CONTROL PROGRAM
The four prototype Cyclic valves, one of the Level II controller assemblies, one of the power
supply panels, and related documentation were delivered to GTI in early April 2001. GTI verified the
operability of the valves and controllers (see Figure 116). GTI assembled a flow test stand using one of
its flow control skids. From April to June 2001, GTI conducted static (steady flow at the open, mid,
closed positions) and dynamic (oscillating flow) testing of the prototype Cyclic valves and also tested all
of the features of the Level II controller. An example of the pressure wave downstream of the valve is
shown in Figure 117. The testing revealed a number of valve and programming deficiencies, a list of
which was forwarded to OTI so that they could be addressed in the retrofit valves and by the software
vendor.
OTI completed the assembly of the remaining retrofit Cyclic valves and controller assemblies in
May 2001. Eight of the retrofit valves and one of the Level II controller assemblies was loaned by OTI to
their software vendor to finish addressing the remaining programming issues.
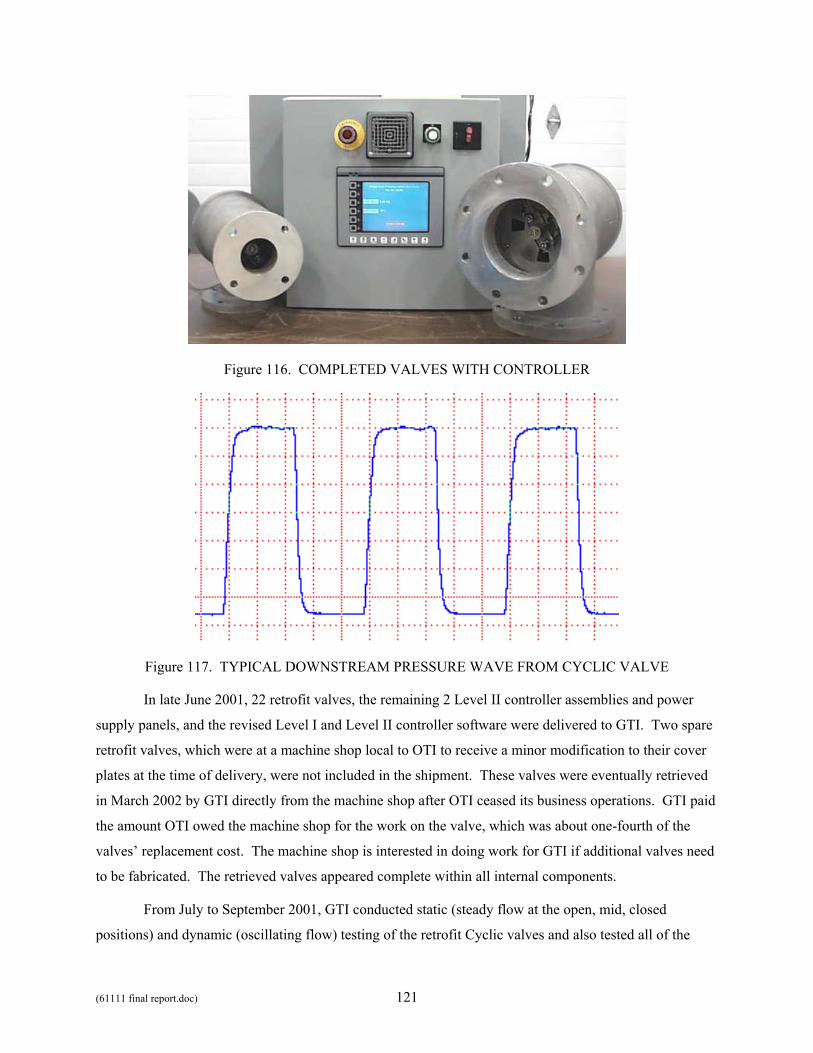
(61111 final report.doc) 121
Figure 116. COMPLETED VALVES WITH CONTROLLER
Figure 117. TYPICAL DOWNSTREAM PRESSURE WAVE FROM CYCLIC VALVE
In late June 2001, 22 retrofit valves, the remaining 2 Level II controller assemblies and power
supply panels, and the revised Level I and Level II controller software were delivered to GTI. Two spare
retrofit valves, which were at a machine shop local to OTI to receive a minor modification to their cover
plates at the time of delivery, were not included in the shipment. These valves were eventually retrieved
in March 2002 by GTI directly from the machine shop after OTI ceased its business operations. GTI paid
the amount OTI owed the machine shop for the work on the valve, which was about one-fourth of the
valves’ replacement cost. The machine shop is interested in doing work for GTI if additional valves need
to be fabricated. The retrieved valves appeared complete within all internal components.
From July to September 2001, GTI conducted static (steady flow at the open, mid, closed
positions) and dynamic (oscillating flow) testing of the retrofit Cyclic valves and also tested all of the
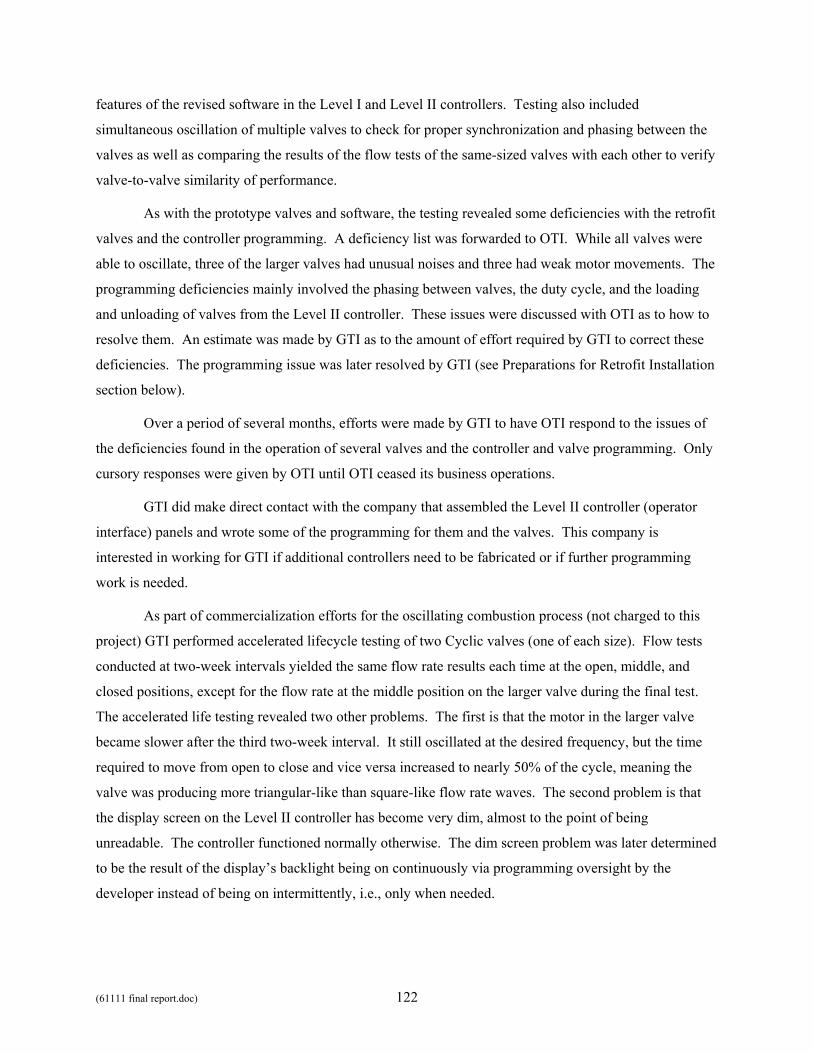
(61111 final report.doc) 122
features of the revised software in the Level I and Level II controllers. Testing also included
simultaneous oscillation of multiple valves to check for proper synchronization and phasing between the
valves as well as comparing the results of the flow tests of the same-sized valves with each other to verify
valve-to-valve similarity of performance.
As with the prototype valves and software, the testing revealed some deficiencies with the retrofit
valves and the controller programming. A deficiency list was forwarded to OTI. While all valves were
able to oscillate, three of the larger valves had unusual noises and three had weak motor movements. The
programming deficiencies mainly involved the phasing between valves, the duty cycle, and the loading
and unloading of valves from the Level II controller. These issues were discussed with OTI as to how to
resolve them. An estimate was made by GTI as to the amount of effort required by GTI to correct these
deficiencies. The programming issue was later resolved by GTI (see Preparations for Retrofit Installation
section below).
Over a period of several months, efforts were made by GTI to have OTI respond to the issues of
the deficiencies found in the operation of several valves and the controller and valve programming. Only
cursory responses were given by OTI until OTI ceased its business operations.
GTI did make direct contact with the company that assembled the Level II controller (operator
interface) panels and wrote some of the programming for them and the valves. This company is
interested in working for GTI if additional controllers need to be fabricated or if further programming
work is needed.
As part of commercialization efforts for the oscillating combustion process (not charged to this
project) GTI performed accelerated lifecycle testing of two Cyclic valves (one of each size). Flow tests
conducted at two-week intervals yielded the same flow rate results each time at the open, middle, and
closed positions, except for the flow rate at the middle position on the larger valve during the final test.
The accelerated life testing revealed two other problems. The first is that the motor in the larger valve
became slower after the third two-week interval. It still oscillated at the desired frequency, but the time
required to move from open to close and vice versa increased to nearly 50% of the cycle, meaning the
valve was producing more triangular-like than square-like flow rate waves. The second problem is that
the display screen on the Level II controller has become very dim, almost to the point of being
unreadable. The controller functioned normally otherwise. The dim screen problem was later determined
to be the result of the display’s backlight being on continuously via programming oversight by the
developer instead of being on intermittently, i.e., only when needed.
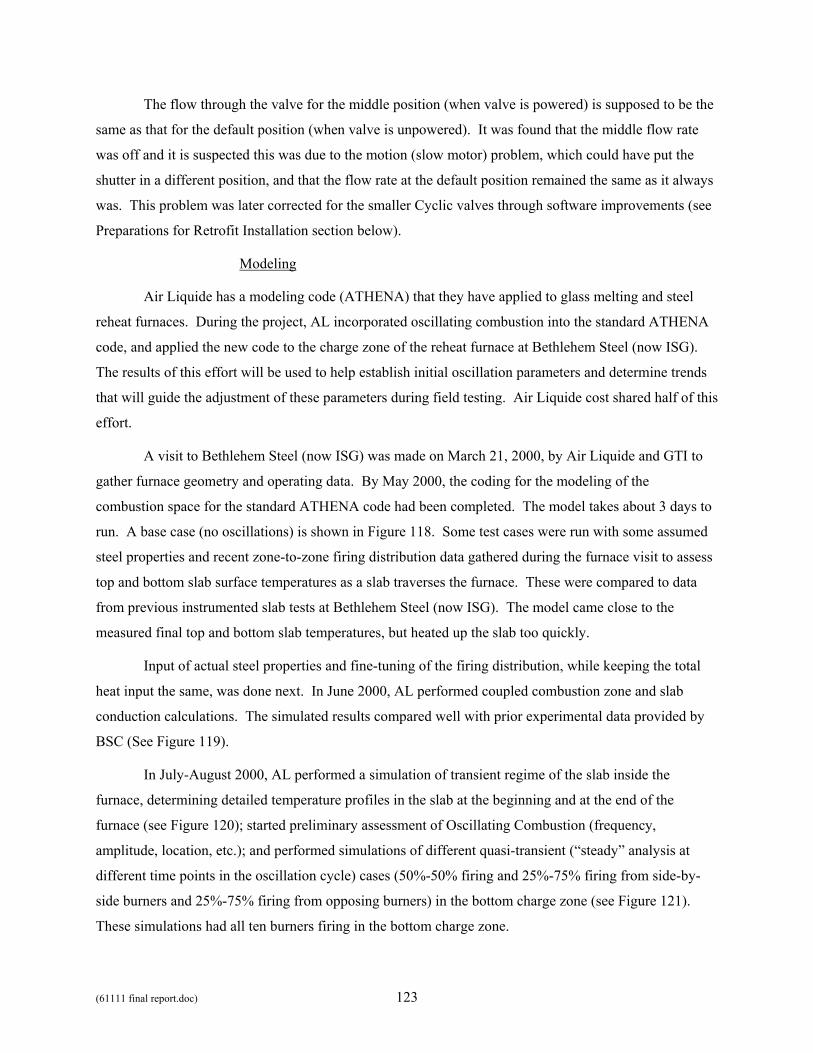
(61111 final report.doc) 123
The flow through the valve for the middle position (when valve is powered) is supposed to be the
same as that for the default position (when valve is unpowered). It was found that the middle flow rate
was off and it is suspected this was due to the motion (slow motor) problem, which could have put the
shutter in a different position, and that the flow rate at the default position remained the same as it always
was. This problem was later corrected for the smaller Cyclic valves through software improvements (see
Preparations for Retrofit Installation section below).
Modeling
Air Liquide has a modeling code (ATHENA) that they have applied to glass melting and steel
reheat furnaces. During the project, AL incorporated oscillating combustion into the standard ATHENA
code, and applied the new code to the charge zone of the reheat furnace at Bethlehem Steel (now ISG).
The results of this effort will be used to help establish initial oscillation parameters and determine trends
that will guide the adjustment of these parameters during field testing. Air Liquide cost shared half of this
effort.
A visit to Bethlehem Steel (now ISG) was made on March 21, 2000, by Air Liquide and GTI to
gather furnace geometry and operating data. By May 2000, the coding for the modeling of the
combustion space for the standard ATHENA code had been completed. The model takes about 3 days to
run. A base case (no oscillations) is shown in Figure 118. Some test cases were run with some assumed
steel properties and recent zone-to-zone firing distribution data gathered during the furnace visit to assess
top and bottom slab surface temperatures as a slab traverses the furnace. These were compared to data
from previous instrumented slab tests at Bethlehem Steel (now ISG). The model came close to the
measured final top and bottom slab temperatures, but heated up the slab too quickly.
Input of actual steel properties and fine-tuning of the firing distribution, while keeping the total
heat input the same, was done next. In June 2000, AL performed coupled combustion zone and slab
conduction calculations. The simulated results compared well with prior experimental data provided by
BSC (See Figure 119).
In July-August 2000, AL performed a simulation of transient regime of the slab inside the
furnace, determining detailed temperature profiles in the slab at the beginning and at the end of the
furnace (see Figure 120); started preliminary assessment of Oscillating Combustion (frequency,
amplitude, location, etc.); and performed simulations of different quasi-transient (“steady” analysis at
different time points in the oscillation cycle) cases (50%-50% firing and 25%-75% firing from side-by-
side burners and 25%-75% firing from opposing burners) in the bottom charge zone (see Figure 121).
These simulations had all ten burners firing in the bottom charge zone.
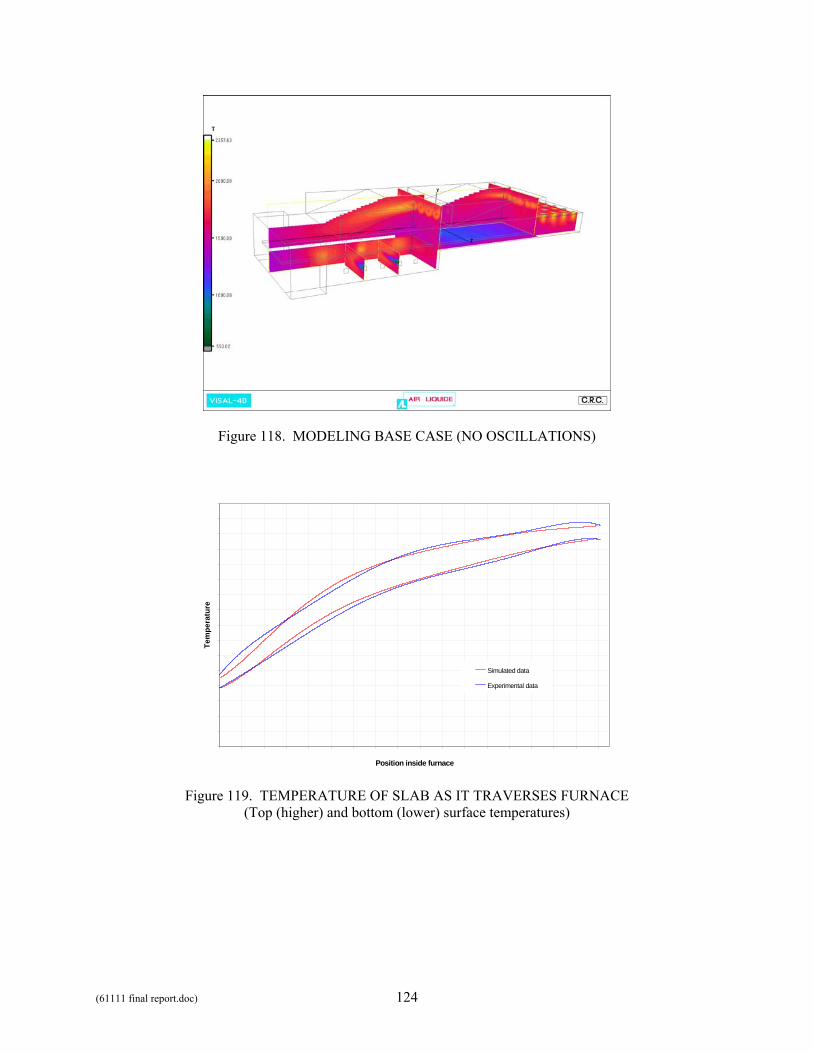
(61111 final report.doc) 124
Figure 118. MODELING BASE CASE (NO OSCILLATIONS)
Position inside furnace
Tem
pera
ture
Simulated data
Experimental data
Figure 119. TEMPERATURE OF SLAB AS IT TRAVERSES FURNACE (Top (higher) and bottom (lower) surface temperatures)
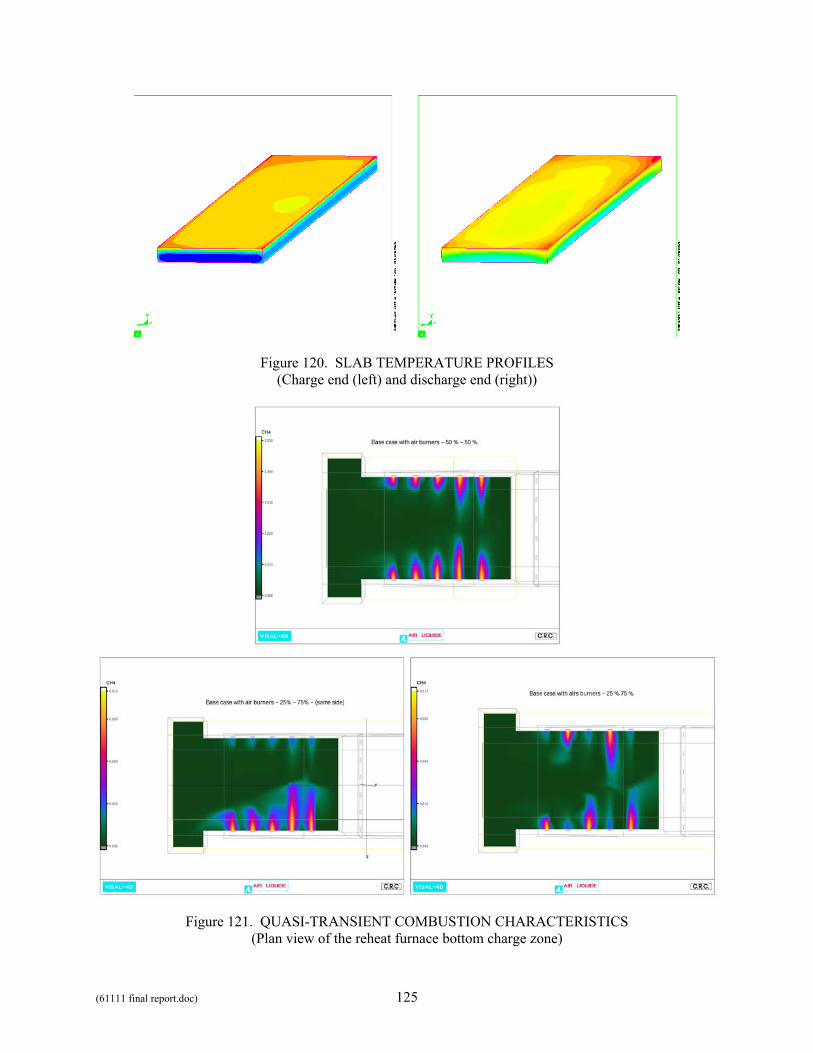
(61111 final report.doc) 125
Figure 120. SLAB TEMPERATURE PROFILES (Charge end (left) and discharge end (right))
Figure 121. QUASI-TRANSIENT COMBUSTION CHARACTERISTICS
(Plan view of the reheat furnace bottom charge zone)
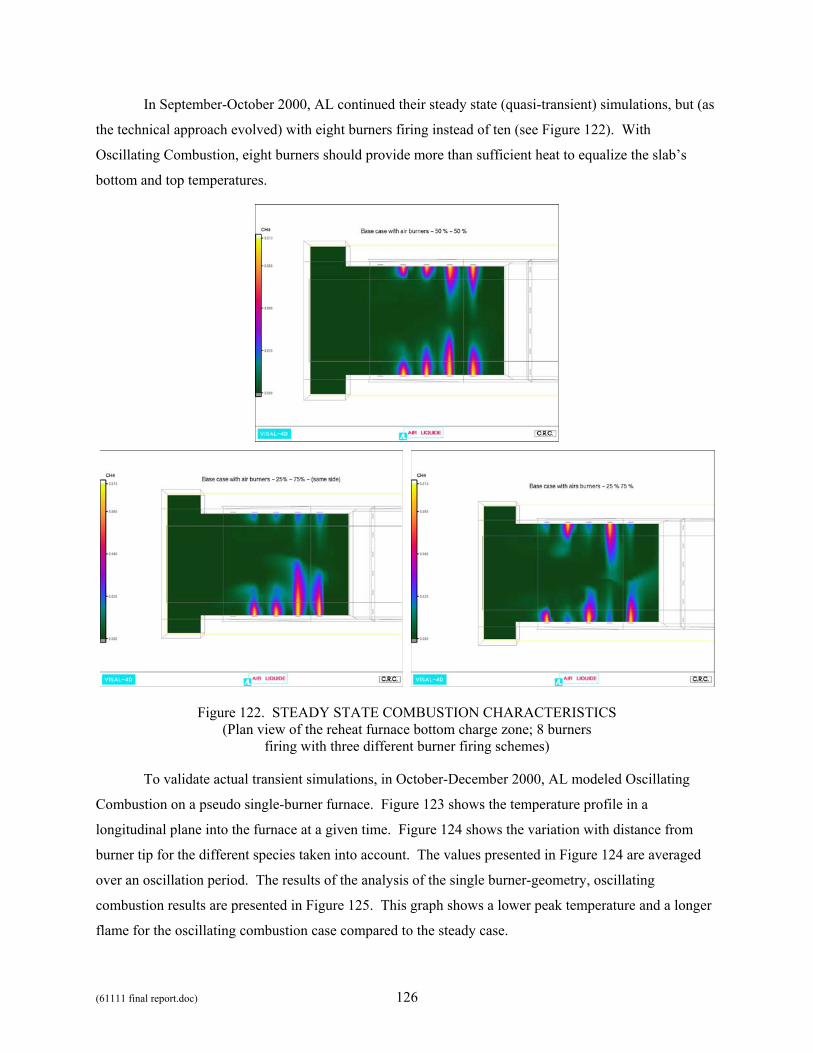
(61111 final report.doc) 126
In September-October 2000, AL continued their steady state (quasi-transient) simulations, but (as
the technical approach evolved) with eight burners firing instead of ten (see Figure 122). With
Oscillating Combustion, eight burners should provide more than sufficient heat to equalize the slab’s
bottom and top temperatures.
Figure 122. STEADY STATE COMBUSTION CHARACTERISTICS (Plan view of the reheat furnace bottom charge zone; 8 burners
firing with three different burner firing schemes)
To validate actual transient simulations, in October-December 2000, AL modeled Oscillating
Combustion on a pseudo single-burner furnace. Figure 123 shows the temperature profile in a
longitudinal plane into the furnace at a given time. Figure 124 shows the variation with distance from
burner tip for the different species taken into account. The values presented in Figure 124 are averaged
over an oscillation period. The results of the analysis of the single burner-geometry, oscillating
combustion results are presented in Figure 125. This graph shows a lower peak temperature and a longer
flame for the oscillating combustion case compared to the steady case.
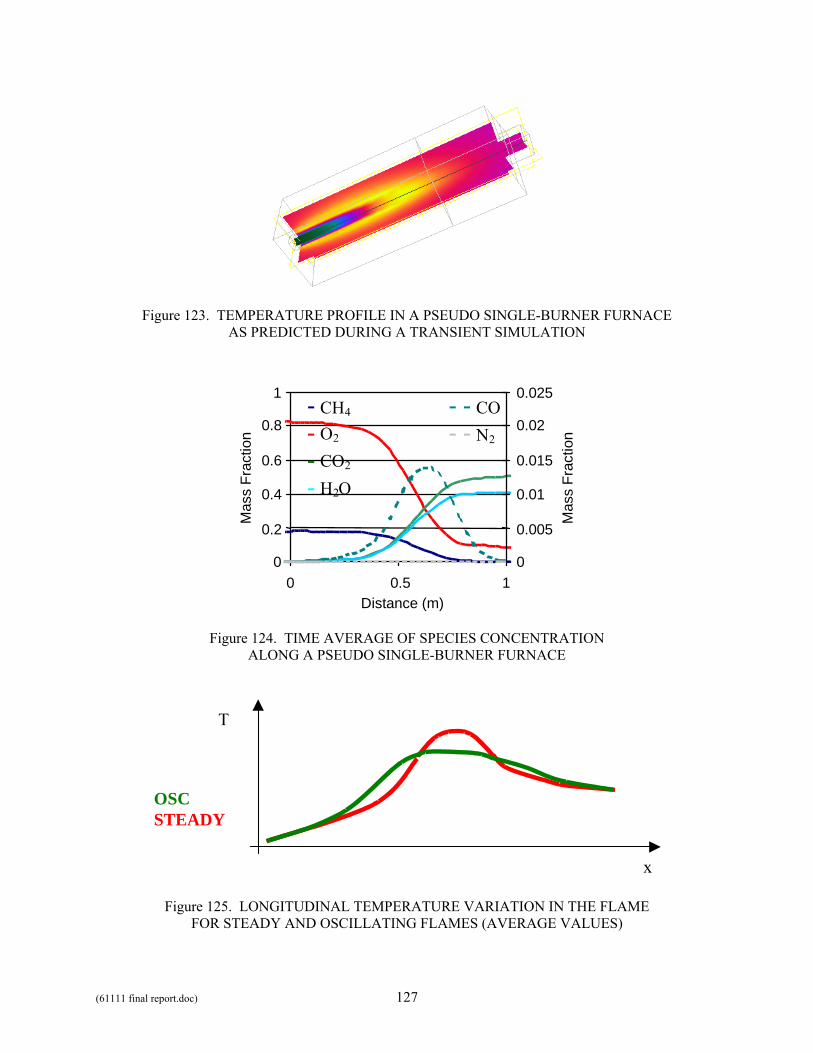
(61111 final report.doc) 127
Figure 123. TEMPERATURE PROFILE IN A PSEUDO SINGLE-BURNER FURNACE AS PREDICTED DURING A TRANSIENT SIMULATION
0
0.2
0.4
0.6
0.8
1
0 0.5 1Distance (m)
Mas
s Fr
actio
n
0
0.005
0.01
0.015
0.02
0.025- CH4
- O2
- CO2
- H2O
- - CO- - N2
Mas
s Fr
actio
n
Figure 124. TIME AVERAGE OF SPECIES CONCENTRATION ALONG A PSEUDO SINGLE-BURNER FURNACE
OSC STEADY
T
x
Figure 125. LONGITUDINAL TEMPERATURE VARIATION IN THE FLAME FOR STEADY AND OSCILLATING FLAMES (AVERAGE VALUES)
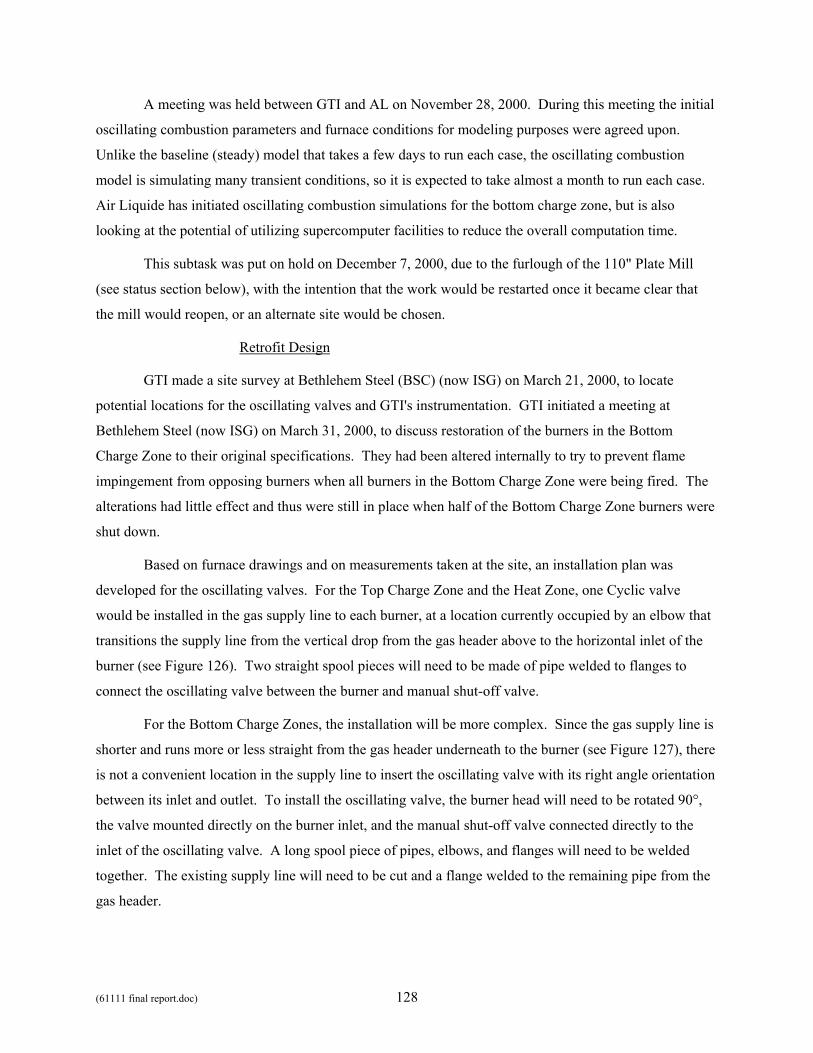
(61111 final report.doc) 128
A meeting was held between GTI and AL on November 28, 2000. During this meeting the initial
oscillating combustion parameters and furnace conditions for modeling purposes were agreed upon.
Unlike the baseline (steady) model that takes a few days to run each case, the oscillating combustion
model is simulating many transient conditions, so it is expected to take almost a month to run each case.
Air Liquide has initiated oscillating combustion simulations for the bottom charge zone, but is also
looking at the potential of utilizing supercomputer facilities to reduce the overall computation time.
This subtask was put on hold on December 7, 2000, due to the furlough of the 110" Plate Mill
(see status section below), with the intention that the work would be restarted once it became clear that
the mill would reopen, or an alternate site would be chosen.
Retrofit Design
GTI made a site survey at Bethlehem Steel (BSC) (now ISG) on March 21, 2000, to locate
potential locations for the oscillating valves and GTI's instrumentation. GTI initiated a meeting at
Bethlehem Steel (now ISG) on March 31, 2000, to discuss restoration of the burners in the Bottom
Charge Zone to their original specifications. They had been altered internally to try to prevent flame
impingement from opposing burners when all burners in the Bottom Charge Zone were being fired. The
alterations had little effect and thus were still in place when half of the Bottom Charge Zone burners were
shut down.
Based on furnace drawings and on measurements taken at the site, an installation plan was
developed for the oscillating valves. For the Top Charge Zone and the Heat Zone, one Cyclic valve
would be installed in the gas supply line to each burner, at a location currently occupied by an elbow that
transitions the supply line from the vertical drop from the gas header above to the horizontal inlet of the
burner (see Figure 126). Two straight spool pieces will need to be made of pipe welded to flanges to
connect the oscillating valve between the burner and manual shut-off valve.
For the Bottom Charge Zones, the installation will be more complex. Since the gas supply line is
shorter and runs more or less straight from the gas header underneath to the burner (see Figure 127), there
is not a convenient location in the supply line to insert the oscillating valve with its right angle orientation
between its inlet and outlet. To install the oscillating valve, the burner head will need to be rotated 90°,
the valve mounted directly on the burner inlet, and the manual shut-off valve connected directly to the
inlet of the oscillating valve. A long spool piece of pipes, elbows, and flanges will need to be welded
together. The existing supply line will need to be cut and a flange welded to the remaining pipe from the
gas header.
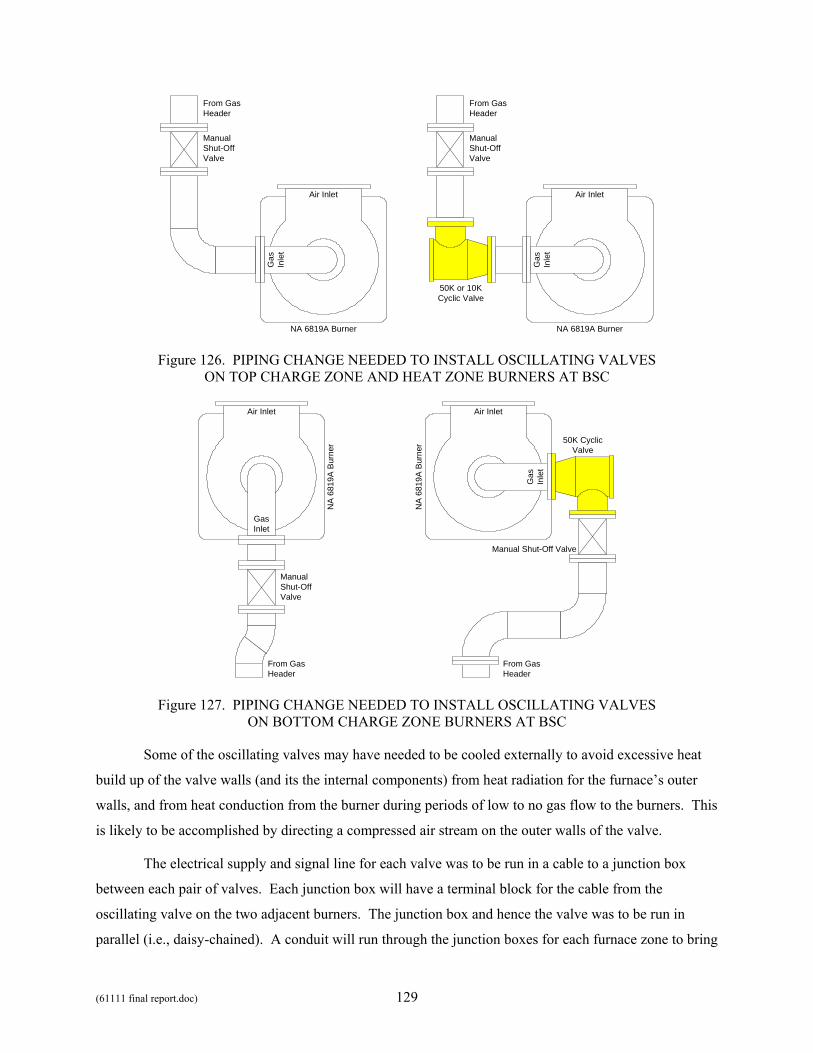
(61111 final report.doc) 129
NA 6819A Burner
Gas
Inle
t
Air Inlet
From GasHeader
ManualShut-OffValve
NA 6819A Burner
Gas
Inle
t
Air Inlet
From GasHeader
ManualShut-OffValve
50K or 10KCyclic Valve
Figure 126. PIPING CHANGE NEEDED TO INSTALL OSCILLATING VALVES ON TOP CHARGE ZONE AND HEAT ZONE BURNERS AT BSC
NA
681
9A B
urne
r
GasInlet
Gas
Inle
t
50K CyclicValve
From GasHeader
From GasHeader
ManualShut-OffValve
Manual Shut-Off Valve
Air InletN
A 6
819A
Bur
ner
Air Inlet
Figure 127. PIPING CHANGE NEEDED TO INSTALL OSCILLATING VALVES ON BOTTOM CHARGE ZONE BURNERS AT BSC
Some of the oscillating valves may have needed to be cooled externally to avoid excessive heat
build up of the valve walls (and its the internal components) from heat radiation for the furnace’s outer
walls, and from heat conduction from the burner during periods of low to no gas flow to the burners. This
is likely to be accomplished by directing a compressed air stream on the outer walls of the valve.
The electrical supply and signal line for each valve was to be run in a cable to a junction box
between each pair of valves. Each junction box will have a terminal block for the cable from the
oscillating valve on the two adjacent burners. The junction box and hence the valve was to be run in
parallel (i.e., daisy-chained). A conduit will run through the junction boxes for each furnace zone to bring
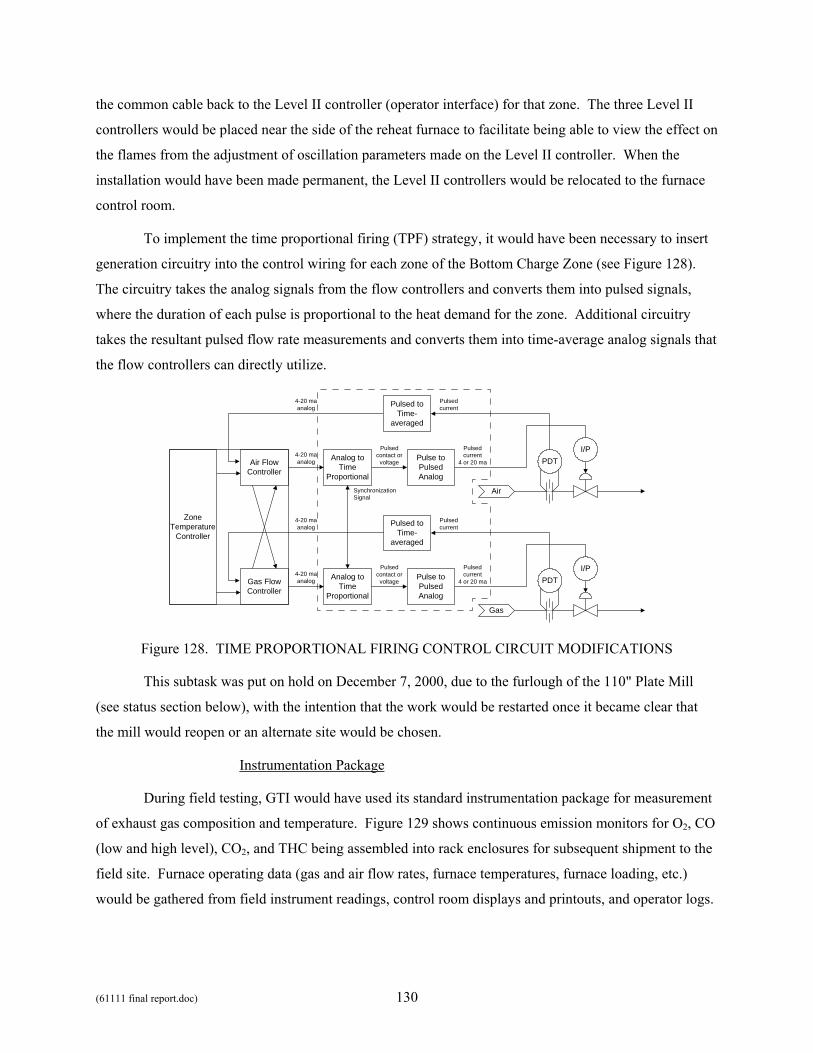
(61111 final report.doc) 130
the common cable back to the Level II controller (operator interface) for that zone. The three Level II
controllers would be placed near the side of the reheat furnace to facilitate being able to view the effect on
the flames from the adjustment of oscillation parameters made on the Level II controller. When the
installation would have been made permanent, the Level II controllers would be relocated to the furnace
control room.
To implement the time proportional firing (TPF) strategy, it would have been necessary to insert
generation circuitry into the control wiring for each zone of the Bottom Charge Zone (see Figure 128).
The circuitry takes the analog signals from the flow controllers and converts them into pulsed signals,
where the duration of each pulse is proportional to the heat demand for the zone. Additional circuitry
takes the resultant pulsed flow rate measurements and converts them into time-average analog signals that
the flow controllers can directly utilize.
Air FlowController
PDT
Air
Analog toTime
Proportional
4-20 maanalog Pulse to
PulsedAnalog
Pulsedcontact or
voltage
Pulsedcurrent
4 or 20 ma
I/P
Pulsed toTime-
averaged
4-20 maanalog
Pulsedcurrent
ZoneTemperature
Controller
Gas FlowController
PDT
Gas
Analog toTime
Proportional
Pulse toPulsedAnalog
Pulsedcontact or
voltage
Pulsedcurrent
4 or 20 ma
I/P
Pulsed toTime-
averaged
4-20 maanalog
Pulsedcurrent
4-20 maanalog
SynchronizationSignal
Figure 128. TIME PROPORTIONAL FIRING CONTROL CIRCUIT MODIFICATIONS
This subtask was put on hold on December 7, 2000, due to the furlough of the 110" Plate Mill
(see status section below), with the intention that the work would be restarted once it became clear that
the mill would reopen or an alternate site would be chosen.
Instrumentation Package
During field testing, GTI would have used its standard instrumentation package for measurement
of exhaust gas composition and temperature. Figure 129 shows continuous emission monitors for O2, CO
(low and high level), CO2, and THC being assembled into rack enclosures for subsequent shipment to the
field site. Furnace operating data (gas and air flow rates, furnace temperatures, furnace loading, etc.)
would be gathered from field instrument readings, control room displays and printouts, and operator logs.
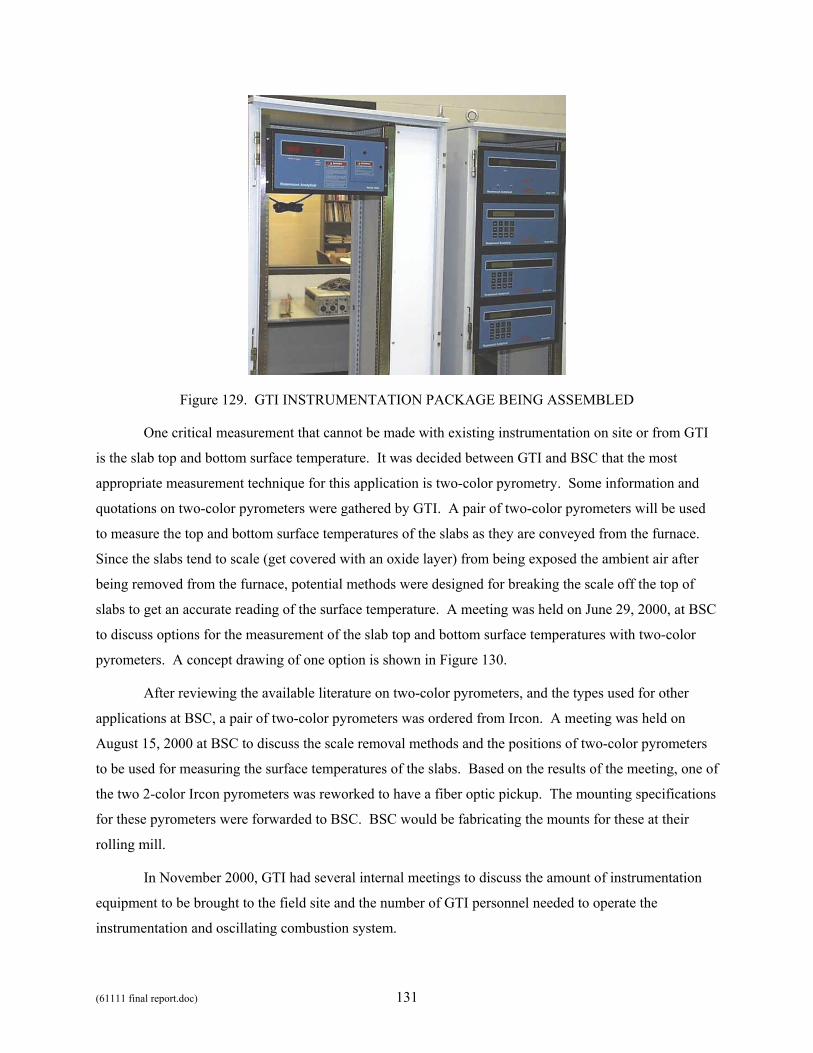
(61111 final report.doc) 131
Figure 129. GTI INSTRUMENTATION PACKAGE BEING ASSEMBLED
One critical measurement that cannot be made with existing instrumentation on site or from GTI
is the slab top and bottom surface temperature. It was decided between GTI and BSC that the most
appropriate measurement technique for this application is two-color pyrometry. Some information and
quotations on two-color pyrometers were gathered by GTI. A pair of two-color pyrometers will be used
to measure the top and bottom surface temperatures of the slabs as they are conveyed from the furnace.
Since the slabs tend to scale (get covered with an oxide layer) from being exposed the ambient air after
being removed from the furnace, potential methods were designed for breaking the scale off the top of
slabs to get an accurate reading of the surface temperature. A meeting was held on June 29, 2000, at BSC
to discuss options for the measurement of the slab top and bottom surface temperatures with two-color
pyrometers. A concept drawing of one option is shown in Figure 130.
After reviewing the available literature on two-color pyrometers, and the types used for other
applications at BSC, a pair of two-color pyrometers was ordered from Ircon. A meeting was held on
August 15, 2000 at BSC to discuss the scale removal methods and the positions of two-color pyrometers
to be used for measuring the surface temperatures of the slabs. Based on the results of the meeting, one of
the two 2-color Ircon pyrometers was reworked to have a fiber optic pickup. The mounting specifications
for these pyrometers were forwarded to BSC. BSC would be fabricating the mounts for these at their
rolling mill.
In November 2000, GTI had several internal meetings to discuss the amount of instrumentation
equipment to be brought to the field site and the number of GTI personnel needed to operate the
instrumentation and oscillating combustion system.
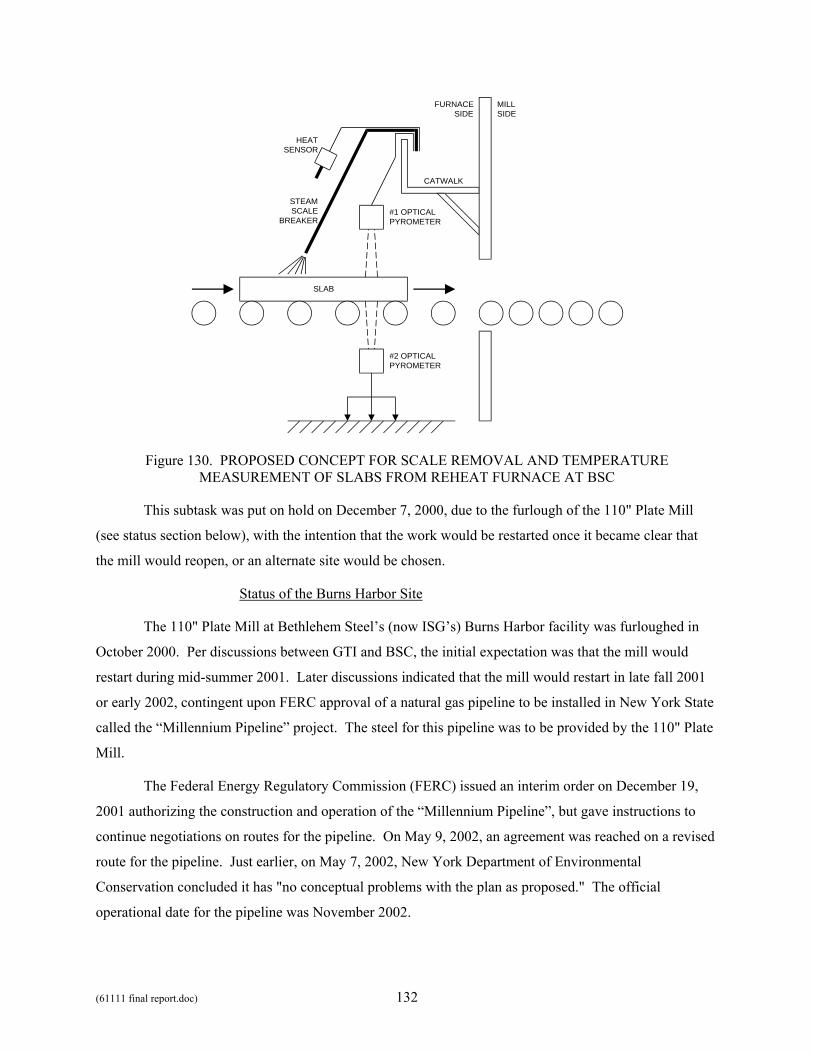
(61111 final report.doc) 132
SLAB
CATWALK
#1 OPTICALPYROMETER
#2 OPTICALPYROMETER
HEATSENSOR
STEAMSCALE
BREAKER
FURNACESIDE
MILLSIDE
Figure 130. PROPOSED CONCEPT FOR SCALE REMOVAL AND TEMPERATURE MEASUREMENT OF SLABS FROM REHEAT FURNACE AT BSC
This subtask was put on hold on December 7, 2000, due to the furlough of the 110" Plate Mill
(see status section below), with the intention that the work would be restarted once it became clear that
the mill would reopen, or an alternate site would be chosen.
Status of the Burns Harbor Site
The 110" Plate Mill at Bethlehem Steel’s (now ISG’s) Burns Harbor facility was furloughed in
October 2000. Per discussions between GTI and BSC, the initial expectation was that the mill would
restart during mid-summer 2001. Later discussions indicated that the mill would restart in late fall 2001
or early 2002, contingent upon FERC approval of a natural gas pipeline to be installed in New York State
called the “Millennium Pipeline” project. The steel for this pipeline was to be provided by the 110" Plate
Mill.
The Federal Energy Regulatory Commission (FERC) issued an interim order on December 19,
2001 authorizing the construction and operation of the “Millennium Pipeline”, but gave instructions to
continue negotiations on routes for the pipeline. On May 9, 2002, an agreement was reached on a revised
route for the pipeline. Just earlier, on May 7, 2002, New York Department of Environmental
Conservation concluded it has "no conceptual problems with the plan as proposed." The official
operational date for the pipeline was November 2002.
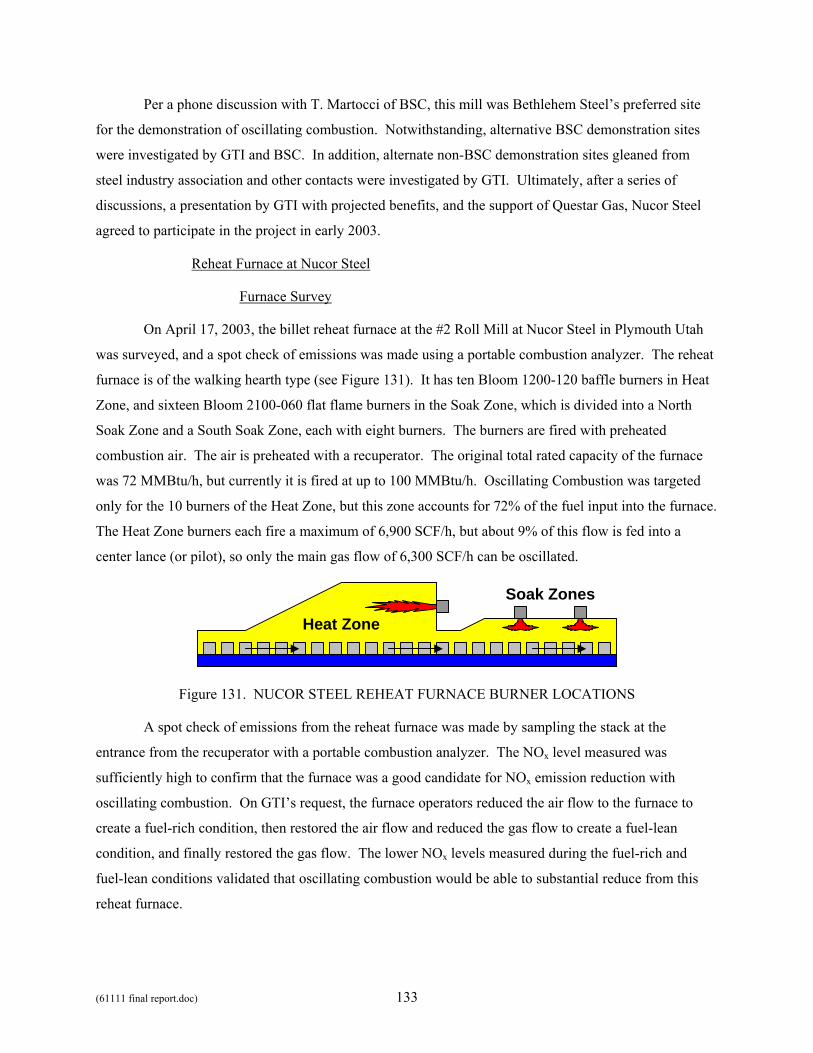
(61111 final report.doc) 133
Per a phone discussion with T. Martocci of BSC, this mill was Bethlehem Steel’s preferred site
for the demonstration of oscillating combustion. Notwithstanding, alternative BSC demonstration sites
were investigated by GTI and BSC. In addition, alternate non-BSC demonstration sites gleaned from
steel industry association and other contacts were investigated by GTI. Ultimately, after a series of
discussions, a presentation by GTI with projected benefits, and the support of Questar Gas, Nucor Steel
agreed to participate in the project in early 2003.
Reheat Furnace at Nucor Steel
Furnace Survey
On April 17, 2003, the billet reheat furnace at the #2 Roll Mill at Nucor Steel in Plymouth Utah
was surveyed, and a spot check of emissions was made using a portable combustion analyzer. The reheat
furnace is of the walking hearth type (see Figure 131). It has ten Bloom 1200-120 baffle burners in Heat
Zone, and sixteen Bloom 2100-060 flat flame burners in the Soak Zone, which is divided into a North
Soak Zone and a South Soak Zone, each with eight burners. The burners are fired with preheated
combustion air. The air is preheated with a recuperator. The original total rated capacity of the furnace
was 72 MMBtu/h, but currently it is fired at up to 100 MMBtu/h. Oscillating Combustion was targeted
only for the 10 burners of the Heat Zone, but this zone accounts for 72% of the fuel input into the furnace.
The Heat Zone burners each fire a maximum of 6,900 SCF/h, but about 9% of this flow is fed into a
center lance (or pilot), so only the main gas flow of 6,300 SCF/h can be oscillated.
Heat Zone
Soak Zones
Figure 131. NUCOR STEEL REHEAT FURNACE BURNER LOCATIONS
A spot check of emissions from the reheat furnace was made by sampling the stack at the
entrance from the recuperator with a portable combustion analyzer. The NOx level measured was
sufficiently high to confirm that the furnace was a good candidate for NOx emission reduction with
oscillating combustion. On GTI’s request, the furnace operators reduced the air flow to the furnace to
create a fuel-rich condition, then restored the air flow and reduced the gas flow to create a fuel-lean
condition, and finally restored the gas flow. The lower NOx levels measured during the fuel-rich and
fuel-lean conditions validated that oscillating combustion would be able to substantial reduce from this
reheat furnace.
(61111 final report.doc) 134
Burner Testing
In Task 1, GTI tested a Bloom baffle burner (model 1470-035) (see Figure 24) with Oscillating
Combustion in its test furnace (see Figure 7). With air preheated to 810°F, the laboratory tests showed a
NOx emission reduction of 60% and a heat transfer increase of 5% (see Figure 25). It was projected that
for applying Oscillating Combustion to just the Heat Zone of the reheat furnace at Nucor Steel, NOx
emissions could be reduced by 57% and fuel usage could be reduced by 3%, based on the actual amount
of combustion air preheating at Nucor Steel. This would mean that for the whole furnace, NOx emissions
could be reduced by 45% and fuel usage could be reduced by 2%.
Oscillating Valve Development
Two sizes of Cyclic valves had been fabricated for the BSC reheat furnace. For the Nucor reheat
furnace, only one size valve was needed. The 6,300 SCF/h maximum average flow for each burner is
closer to the 5,000 SCF/h average flow for the smaller (10K) Cyclic valve than the 25,000 SCF/h average
flow for the larger (50K) Cyclic valve, so the 10K Cyclic valve was chosen for the retrofit installation,
even though this meant needing to increase the pressure drop across the valve by about 50%.
All eleven (ten for retrofit plus one spare) Cyclic oscillating valves for the retrofit installation on
the reheat furnace were flow tested. A new gas header pressure was determined to accommodate the
largest gas flow rate expected. The programming in the servomotors in the valves was examined. A few
minor changes were made to address an issue concerning phasing (which valves are open and which
valves are closed at any given time) when the duty cycle (percentage of time a valve is open) is a value
other than 50%, and to allow for more flexibility in operation. The programming in the master (Level II)
controller for the valves was also examined. Several changes were made to ensure that oscillation
parameters are correctly computed and reliably transmitted to the valves. These changes eliminated many
of the programming deficiencies noted earlier.
All eleven Cyclic oscillating valves were mechanically adjusted so that they flow the same
amount in the unpowered condition. The exact position for the shutter in the valve was determined so
that, in the powered condition, all the valves flow the same amount in the fully open, 3/4 open, 1/4 open,
fully closed, and center positions. The center position corresponds to the position of the valve in the
unpowered condition. These values were programmed individually into each valve.
In a few valves, the centering mechanism springs were replaced and clearances were adjusted to
alleviate the slow and/or noisy motion problems noted earlier.
The programming in the master controller was updated for operation with 10 valves (instead of
the original 8) and to correct previously noted inconsistencies. Additional status screen display pages
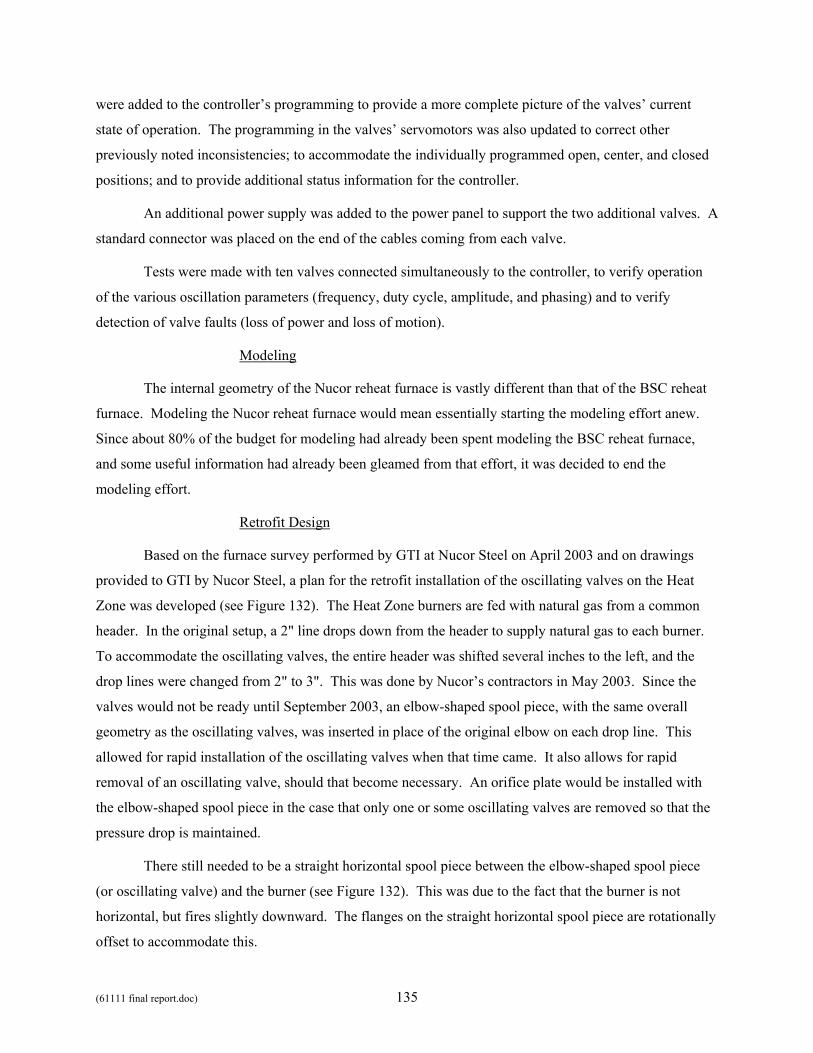
(61111 final report.doc) 135
were added to the controller’s programming to provide a more complete picture of the valves’ current
state of operation. The programming in the valves’ servomotors was also updated to correct other
previously noted inconsistencies; to accommodate the individually programmed open, center, and closed
positions; and to provide additional status information for the controller.
An additional power supply was added to the power panel to support the two additional valves. A
standard connector was placed on the end of the cables coming from each valve.
Tests were made with ten valves connected simultaneously to the controller, to verify operation
of the various oscillation parameters (frequency, duty cycle, amplitude, and phasing) and to verify
detection of valve faults (loss of power and loss of motion).
Modeling
The internal geometry of the Nucor reheat furnace is vastly different than that of the BSC reheat
furnace. Modeling the Nucor reheat furnace would mean essentially starting the modeling effort anew.
Since about 80% of the budget for modeling had already been spent modeling the BSC reheat furnace,
and some useful information had already been gleamed from that effort, it was decided to end the
modeling effort.
Retrofit Design
Based on the furnace survey performed by GTI at Nucor Steel on April 2003 and on drawings
provided to GTI by Nucor Steel, a plan for the retrofit installation of the oscillating valves on the Heat
Zone was developed (see Figure 132). The Heat Zone burners are fed with natural gas from a common
header. In the original setup, a 2" line drops down from the header to supply natural gas to each burner.
To accommodate the oscillating valves, the entire header was shifted several inches to the left, and the
drop lines were changed from 2" to 3". This was done by Nucor’s contractors in May 2003. Since the
valves would not be ready until September 2003, an elbow-shaped spool piece, with the same overall
geometry as the oscillating valves, was inserted in place of the original elbow on each drop line. This
allowed for rapid installation of the oscillating valves when that time came. It also allows for rapid
removal of an oscillating valve, should that become necessary. An orifice plate would be installed with
the elbow-shaped spool piece in the case that only one or some oscillating valves are removed so that the
pressure drop is maintained.
There still needed to be a straight horizontal spool piece between the elbow-shaped spool piece
(or oscillating valve) and the burner (see Figure 132). This was due to the fact that the burner is not
horizontal, but fires slightly downward. The flanges on the straight horizontal spool piece are rotationally
offset to accommodate this.
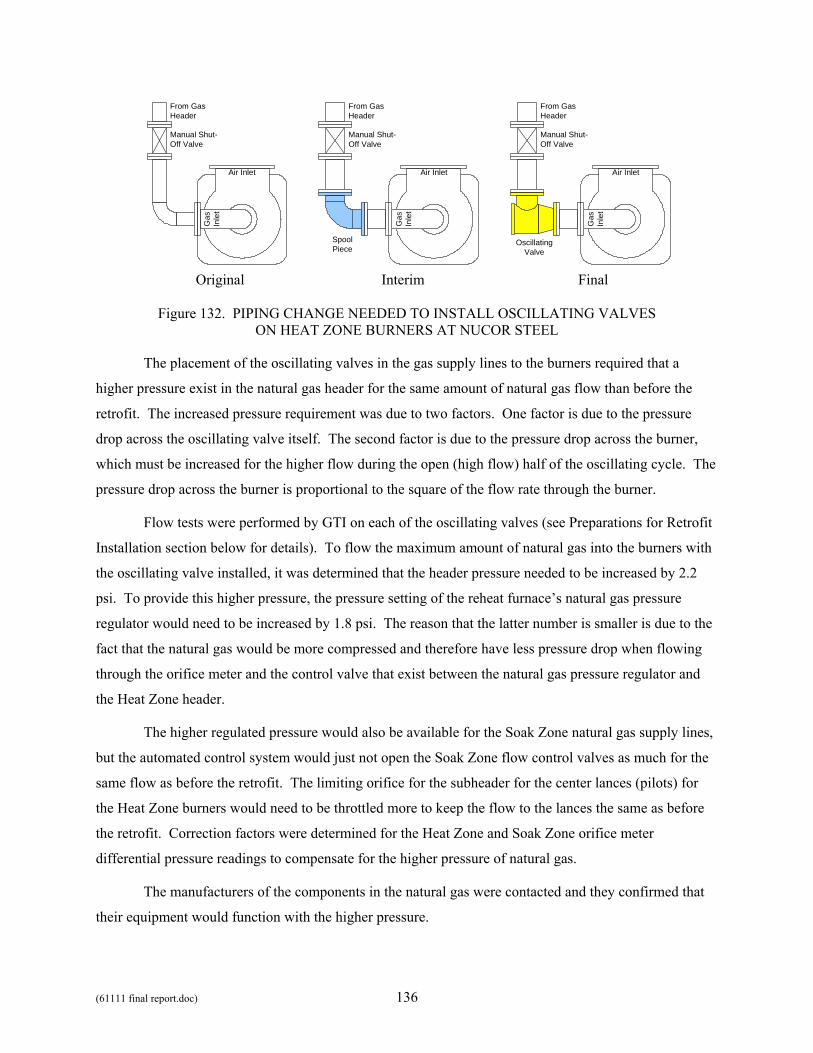
(61111 final report.doc) 136
Gas
Inle
t
Air Inlet
From GasHeader
Manual Shut-Off Valve
Gas
Inle
t
Air Inlet
From GasHeader
Manual Shut-Off Valve
Gas
Inle
t
Air Inlet
From GasHeader
Manual Shut-Off Valve
OscillatingValve
SpoolPiece
Original Interim Final
Figure 132. PIPING CHANGE NEEDED TO INSTALL OSCILLATING VALVES
ON HEAT ZONE BURNERS AT NUCOR STEEL
The placement of the oscillating valves in the gas supply lines to the burners required that a
higher pressure exist in the natural gas header for the same amount of natural gas flow than before the
retrofit. The increased pressure requirement was due to two factors. One factor is due to the pressure
drop across the oscillating valve itself. The second factor is due to the pressure drop across the burner,
which must be increased for the higher flow during the open (high flow) half of the oscillating cycle. The
pressure drop across the burner is proportional to the square of the flow rate through the burner.
Flow tests were performed by GTI on each of the oscillating valves (see Preparations for Retrofit
Installation section below for details). To flow the maximum amount of natural gas into the burners with
the oscillating valve installed, it was determined that the header pressure needed to be increased by 2.2
psi. To provide this higher pressure, the pressure setting of the reheat furnace’s natural gas pressure
regulator would need to be increased by 1.8 psi. The reason that the latter number is smaller is due to the
fact that the natural gas would be more compressed and therefore have less pressure drop when flowing
through the orifice meter and the control valve that exist between the natural gas pressure regulator and
the Heat Zone header.
The higher regulated pressure would also be available for the Soak Zone natural gas supply lines,
but the automated control system would just not open the Soak Zone flow control valves as much for the
same flow as before the retrofit. The limiting orifice for the subheader for the center lances (pilots) for
the Heat Zone burners would need to be throttled more to keep the flow to the lances the same as before
the retrofit. Correction factors were determined for the Heat Zone and Soak Zone orifice meter
differential pressure readings to compensate for the higher pressure of natural gas.
The manufacturers of the components in the natural gas were contacted and they confirmed that
their equipment would function with the higher pressure.
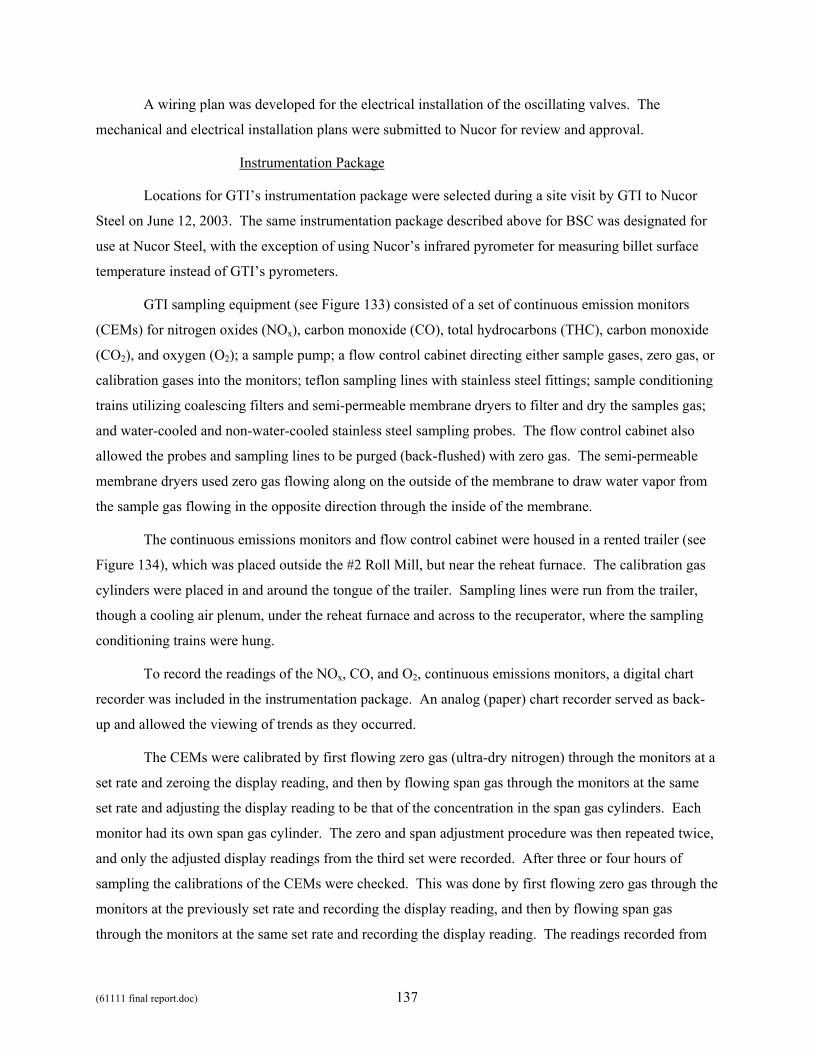
(61111 final report.doc) 137
A wiring plan was developed for the electrical installation of the oscillating valves. The
mechanical and electrical installation plans were submitted to Nucor for review and approval.
Instrumentation Package
Locations for GTI’s instrumentation package were selected during a site visit by GTI to Nucor
Steel on June 12, 2003. The same instrumentation package described above for BSC was designated for
use at Nucor Steel, with the exception of using Nucor’s infrared pyrometer for measuring billet surface
temperature instead of GTI’s pyrometers.
GTI sampling equipment (see Figure 133) consisted of a set of continuous emission monitors
(CEMs) for nitrogen oxides (NOx), carbon monoxide (CO), total hydrocarbons (THC), carbon monoxide
(CO2), and oxygen (O2); a sample pump; a flow control cabinet directing either sample gases, zero gas, or
calibration gases into the monitors; teflon sampling lines with stainless steel fittings; sample conditioning
trains utilizing coalescing filters and semi-permeable membrane dryers to filter and dry the samples gas;
and water-cooled and non-water-cooled stainless steel sampling probes. The flow control cabinet also
allowed the probes and sampling lines to be purged (back-flushed) with zero gas. The semi-permeable
membrane dryers used zero gas flowing along on the outside of the membrane to draw water vapor from
the sample gas flowing in the opposite direction through the inside of the membrane.
The continuous emissions monitors and flow control cabinet were housed in a rented trailer (see
Figure 134), which was placed outside the #2 Roll Mill, but near the reheat furnace. The calibration gas
cylinders were placed in and around the tongue of the trailer. Sampling lines were run from the trailer,
though a cooling air plenum, under the reheat furnace and across to the recuperator, where the sampling
conditioning trains were hung.
To record the readings of the NOx, CO, and O2, continuous emissions monitors, a digital chart
recorder was included in the instrumentation package. An analog (paper) chart recorder served as back-
up and allowed the viewing of trends as they occurred.
The CEMs were calibrated by first flowing zero gas (ultra-dry nitrogen) through the monitors at a
set rate and zeroing the display reading, and then by flowing span gas through the monitors at the same
set rate and adjusting the display reading to be that of the concentration in the span gas cylinders. Each
monitor had its own span gas cylinder. The zero and span adjustment procedure was then repeated twice,
and only the adjusted display readings from the third set were recorded. After three or four hours of
sampling the calibrations of the CEMs were checked. This was done by first flowing zero gas through the
monitors at the previously set rate and recording the display reading, and then by flowing span gas
through the monitors at the same set rate and recording the display reading. The readings recorded from
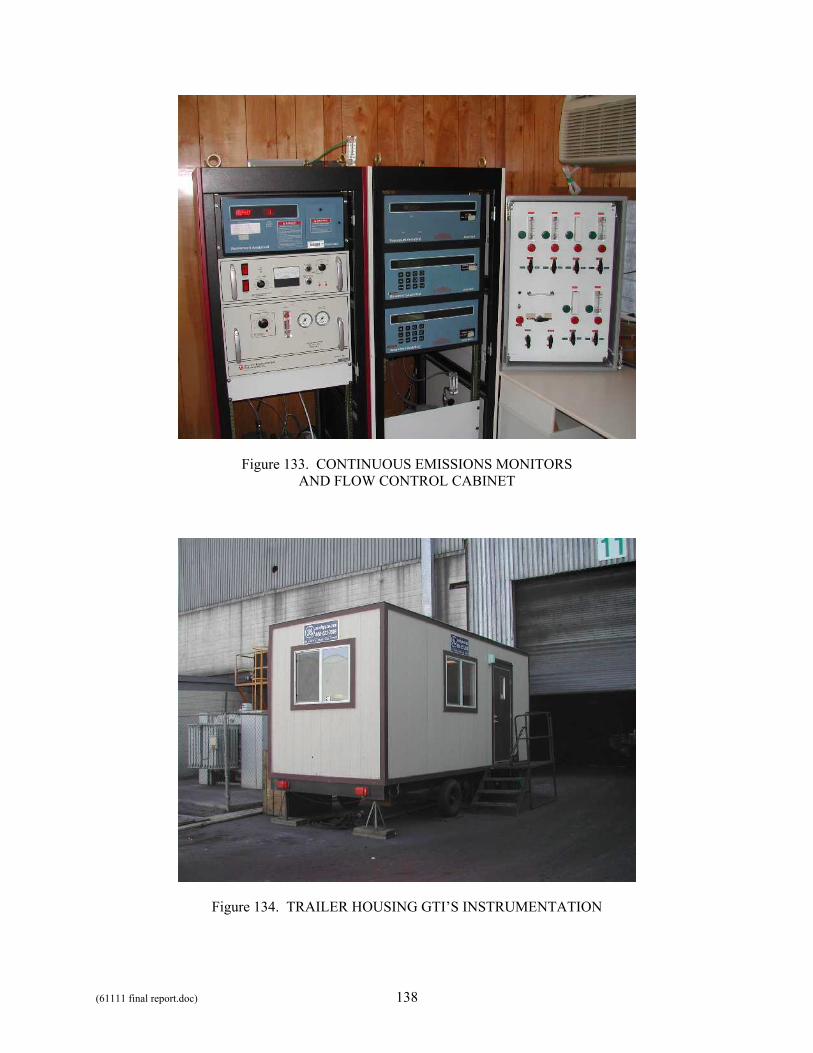
(61111 final report.doc) 138
Figure 133. CONTINUOUS EMISSIONS MONITORS AND FLOW CONTROL CABINET
Figure 134. TRAILER HOUSING GTI’S INSTRUMENTATION
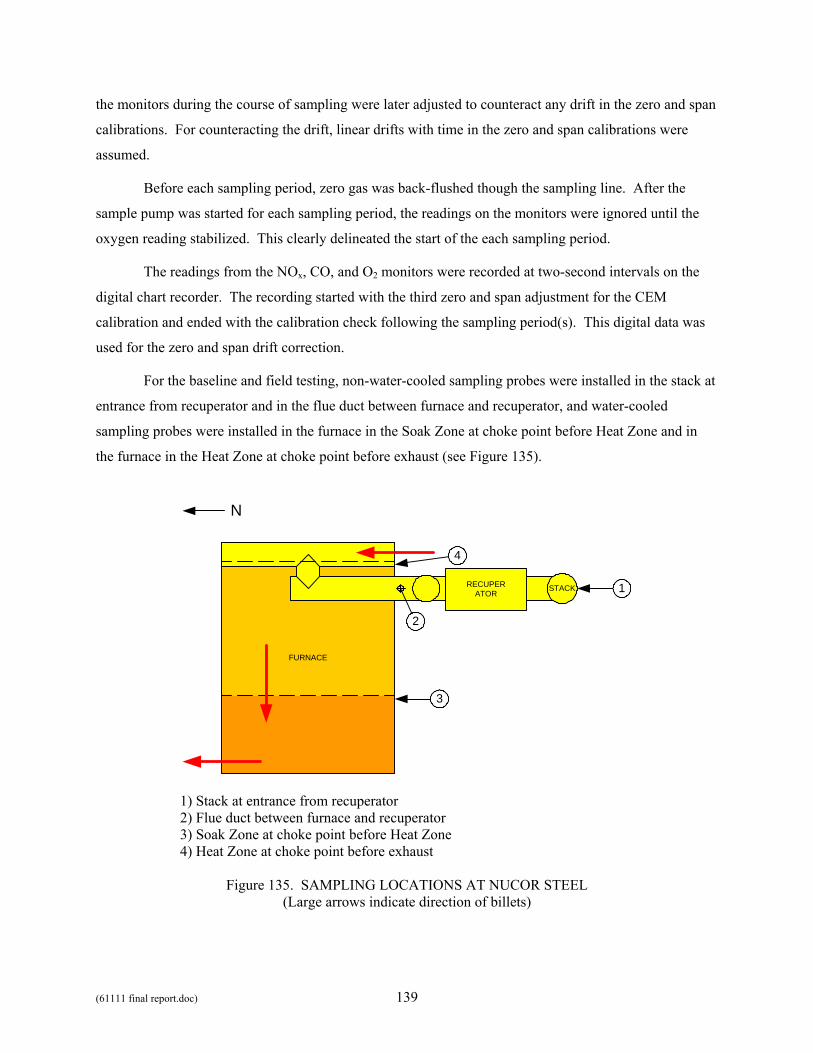
(61111 final report.doc) 139
the monitors during the course of sampling were later adjusted to counteract any drift in the zero and span
calibrations. For counteracting the drift, linear drifts with time in the zero and span calibrations were
assumed.
Before each sampling period, zero gas was back-flushed though the sampling line. After the
sample pump was started for each sampling period, the readings on the monitors were ignored until the
oxygen reading stabilized. This clearly delineated the start of the each sampling period.
The readings from the NOx, CO, and O2 monitors were recorded at two-second intervals on the
digital chart recorder. The recording started with the third zero and span adjustment for the CEM
calibration and ended with the calibration check following the sampling period(s). This digital data was
used for the zero and span drift correction.
For the baseline and field testing, non-water-cooled sampling probes were installed in the stack at
entrance from recuperator and in the flue duct between furnace and recuperator, and water-cooled
sampling probes were installed in the furnace in the Soak Zone at choke point before Heat Zone and in
the furnace in the Heat Zone at choke point before exhaust (see Figure 135).
FURNACE
RECUPERATOR
STACK
N
3
2
1
4
1) Stack at entrance from recuperator 2) Flue duct between furnace and recuperator 3) Soak Zone at choke point before Heat Zone 4) Heat Zone at choke point before exhaust
Figure 135. SAMPLING LOCATIONS AT NUCOR STEEL (Large arrows indicate direction of billets)
(61111 final report.doc) 140
The installation of the GTI’s test equipment occurred just prior to baseline testing. Setup was
completed on June 25, 2003. After installation, the sampling lines run from the sampling probes to the
sample pump, including the sample conditioning trains, were checked to make sure there was no leakage.
The leak check procedure was repeated after any time sample line was opened, such as when the
coalescing filters were drained of water.
Baseline Testing
During June 26 and 27, baseline data was collected for the furnace running under normal
operating conditions. Combustion gas samples were drawn from the Soak Zone exit, Heat Zone exit, the
flue duct between the furnace and the recuperator, and the stack. These data were combined with
readings from the furnace control room (fuel and air flow rates, furnace temperatures, production rate) to
determine NOx emissions rates from the furnace and the contribution of these emissions from the Soak
Zone and the Heat Zone. A time weighted average of emissions data showed the following:
• NOx emissions from furnace averaged 13.6 lb/h
• NOx contribution from Soak Zone averaged 3.7 lb/h or 27%
• Furnace operates with very low excess air, consequently furnace operation is efficient and NOx emissions are inherently low
Preparations for Retrofit Installation
Cyclic Oscillating Valves
All eleven (ten for the retrofit installation plus one spare) Cyclic oscillating valves were flow
tested in GTI’s Combustion Laboratory. A high-pressure (6 psig) blower was used to flow air through
each oscillating valve. Since air is denser than natural gas, the actual air flow rate used was less than the
simulated natural gas flow rate. A restriction was added downstream of the oscillating valve in the flow
test rig to simulate the pressure drop across the burner.
In the most open position, the pressure drop across each valve was measured at the same air flow
rate, with that air flow rate being equivalent to a natural gas flow rate of 190% of the maximum expected
natural gas flow rate for one burner on the reheat furnace during normal (non-oscillating) operation.
From these data the most restrictive of the eleven valves (the one with the highest pressure drop in the
most open position) was identified.
In the most closed position, the flow through each valve was measured at the same pressure drop
as was determined above. From these data the most unrestrictive of the eleven valves (the one with the
highest flow rate in the most closed position) was identified.
(61111 final report.doc) 141
The highest flow rate in the most closed position was actually closer to 15% of the maximum
expected natural gas flow rate for one burner on the reheat furnace during normal (non-oscillating)
operation, instead of the 10% that was expected based on the design specifications for the Cyclic valve.
This meant that the maximum oscillation amplitude was 85% instead of 90%. The pressure drop needed
for flowing 185% through most restrictive valve instead of 190% was calculated. From this result the
new gas header pressure for the Heat Zone of the reheat furnace was determined so that the even the most
restrictive valve could achieve the maximum expected natural gas flow rate. As stated in the Retrofit
Design section above, this new pressure had to be 2.2 psi higher than the original pressure.
The centering mechanism of all eleven oscillating valves were next mechanically adjusted so that
the valves all flow the same amount in the unpowered condition. This amount was set to be equal to the
average of the highest flow through the most restrictive valve in the most open (185%) position and the
lowest flow through the most unrestrictive valve in the most closed (15%) position. The exact position
for the shutter in the valve was then determined so that, in the powered condition, all the valves flow the
same amount in the fully open (185%), 3/4 open (142%), 1/4 open (58%), fully closed (15%), and center
(100%) positions. The center position corresponds to the position of the valve in the unpowered
condition. These values were later programmed individually into each valve.
Oscillating Valve Controller
The oscillating valve controller was originally designed to drive eight Cyclic oscillating valves.
Since ten valves were needed for the retrofit installation on the reheat furnace, and since it could not be
guaranteed that the oscillating valves would stay in sync if two oscillating valve controllers were used, the
oscillating valve controllers had to be upgraded by GTI to drive ten valves. The first hardware
modification was to add a fourth power supply to the power panel since each power supply can support
only three valves. The next modifications were to add fuses and fuse holders in the power supply panel
for the power supplying the two additional valves, and to replace the fuses in the display panel for the
main power input and power to the power supply panel with higher capacity fuses. Next some wiring in
the display panel was replaced with lower gage wire to handle the additional current. The last hardware
change was to route the power for the power supply panel through two poles of the main contactor instead
of one pole because of the increased current.
The software in the display panel (Level II controller) was also updated by GTI to handle ten
valves instead of the original eight. The software update consisted of adding buttons and readouts to
certain display pages, adding addresses for the two new valves, and adding subroutines to handle the two
new valves.

(61111 final report.doc) 142
The programming in the servomotors in the valves (Level I controllers) was examined by GTI to
find the source of previously noted inconsistencies. A few minor changes were made by GTI to address
an issue concerning phasing (which valves are open and which valves are closed at any given time) when
the duty cycle (percentage of time a valve is open) is a value other than 50%, and to allow for more
flexibility in operation.
The programming in the display panel (Level II controller) for the valves was also examined by
GTI to find the source of previously noted inconsistencies. Several changes were made by GTI to ensure
that oscillation parameters are correctly computed and reliably transmitted to the valves, and to ensure
that motion and communications errors were handled properly.
Additional updates were made by GTI to the display panel (Level II controller). These included
adding more status display pages to provide a more complete picture of the valves’ current state of
operation; adding the ability to set the valves for full (85%), half (42%), and no (0%) amplitude; reducing
the number of valve servomotor memory registers used in sending commands from the display panel to
the valve servomotors; consolidating the amplitude and phase configuration display pages into one
display page; and setting the timing schedule for valve synchronization to occur every five minutes
instead of every one minute.
Additional updates were also made by GTI to the servomotors in the valves (Level I controllers).
These included accommodating the individually programmed open (185%), 3/4 open (142%), center
(100%), 3/4 closed (58%), and closed (15%) positions; reducing the number of memory registers used in
receiving commands from the display panel; and providing additional status information for the
controller. The startup sequence was revised to better hold the center position when the valves are first
energized. Half of the valve servomotors were programmed to perform the homing sequence open-close-
center; and the other half, close-open-center. During the homing sequence the shutter is forced in each
direction to its extremes to allow the solenoids to grab and hold the centering mechanism out of the way
during normal operation. This programming split was done so that flow to the furnace remains relative
constant during the homing sequence.
Other Preparations
A standard connector was placed on the end of the cables coming from each valve. A set of five
junction boxes was prepared, each with mating connectors for two valves.
A plan for the electrical installation of the oscillating valves and the controller was prepared and
submitted to the site for their review. The plan included power, wiring, and connection requirements.

(61111 final report.doc) 143
Tests were made with ten valves connected simultaneously to the controller, to verify operation
of the various oscillation parameters (frequency, duty cycle, amplitude, and phasing) and to verify
detection of valve faults (loss of power and loss of motion). During this testing a quirk was noted in how
commands sent by the display panel were received by the servomotors in the valves. Apparently when
two global commands (single commands issued to all valves as opposed to individual commands sent to
individual valves) were sent in succession, only one of the two commands was received by the valves.
This quirk affected valve startup (reset and run commands sent in succession), valve synchronization
(stop and restart commands sent in succession), and frequency and duty cycle changes (open time and
closed time sent in succession). The discovery of this quirk finally explained some of the previously
noted inconsistencies. The programming in the display panel was revised to avoid sending two global
commands in succession by either forcing the user to press two separate buttons for startup and for
frequency and duty cycle changes, or by setting separate timing schedules for stop and restart for valve
synchronization.
Retrofit Installation
Oscillating Combustion System Installation
On Wednesday, September 10, 2003, during the middle of a semi-annual shutdown, the
oscillating valves were installed on the Heat Zone of the reheat furnace at Nucor Steel (see Figure 136) by
a mill contractor. This went fairly quickly because of the modifications made earlier that included elbow-
shaped spool pieces of the same dimensions as the valves (see Figure 132). Unfortunately, extra time was
needed to correct the orientation of some of flanges in the vertical spool piece above the valve. Some of
the flanges on the elbow-shaped spool pieces were likely misaligned.
Figure 136. OSCILLATING VALVES AND CONTROLLER INSTALLED AT NUCOR STEEL
(61111 final report.doc) 144
The controller panel and power supply panel were installed on a wall opposite the furnace (see
Figure 136). Electrical wire was pulled through previously installed conduits and connected at the panels
and at the junction boxes, which were also preinstalled. Cables were then connected between the junction
boxes and the oscillating valves. Insulation was installed around valve cables to help protect them from
heat from furnace.
After checking and correcting the polarity of the wiring at the junction boxes, the Oscillating
Combustion system was powered up and communication was established between the controller and the
oscillating valves. A set of oscillation parameters were entered into the controller, the oscillating valves
were test run, and all indications showed the valves operating properly. Some enhancements were next
made to the controller’s display pages. The Oscillating Combustion system was then powered down in
preparation for the furnace restart.
Furnace Control System Modifications
To account for the higher operating pressure needed to accommodate the installation of the
oscillating valves, a new higher range high pressure switch was installed on main gas line. A meeting
was held with mill personnel to brief them on aspects of furnace operation with increased operating
pressure.
On Friday, September 12, 2003, the furnace was restarted at a low firing rate, with only a few
burners running for the purpose of curing refractory installed during the shutdown. The operating
pressure was still as yet unchanged. The pressure transmitters for the orifice meters in the Heat Zone’s
gas line and Soak Zones’ gas lines were recalibrated to account for the higher operating pressure.
After all burners were lit in the Heat Zone, the pressure in the main gas line was increased at the
regulator to the value needed for the oscillating valves. The limiting orifice in the subheader for the
center lances (pilots) of the Heat Zone burners was throttled back so that the flow remains the same as
before. Over the course of the next two days, the furnace, and consequently the firing rate, was brought
up to near their full values. By Sunday, September 14, 2003, the furnace was heating billets. At the full
firing rate, the air/fuel ratio was slightly adjusted to avoid running the furnace too rich during transient
conditions. No other problems were noted with furnace operation over the next week and a half.
Field Testing
First Test Campaign
On Tuesday, September 23, 2003, GTI was informed that the body of one of the installed
oscillating valves had cracked near the inlet. This valve was replaced by the spare valve by mill
personnel. The cracked valve body was sent back to GTI for analysis and repair. The crack formation

(61111 final report.doc) 145
was most likely due to an error in manufacture and/or installation. The crack was later welded over and
the valve body returned to Nucor Steel to serve as a spare.
The cables connecting the oscillating valves to the junction boxes were tested to check for heat
related damage. All cables tested okay except one which was found to have a broken solder connection at
the valve end. The break did not appear to be heat related. The cable was replaced.
During the morning of Wednesday, September 24, 2003, emissions and operating data were
collected for the furnace running under normal operating conditions with the Oscillating Combustion
system off. In the afternoon, the Oscillating Combustion system was turned on, and one pair of
oscillating valves was run for 10 minutes at a low amplitude and frequency while monitoring furnace
operation and emissions from the Heat Zone in the area closest to the burners these valves were installed
on. This was followed by running each of the four other pairs of oscillating valves, one pair at a time for
10 minutes each, while monitoring furnace operation and emissions from the flue duct. Each time one of
the pairs of oscillating valves was run, the NOx emissions were seen to drop slightly. No increase in CO
emissions was noted.
On Thursday, September 25, 2003, a series of 4 parametric tests were made with all 10 oscillating
valves running. Each test was run for 10 to 20 minutes with a different set of amplitudes and frequencies.
During each test, NOx emissions were seen to be reduced in the range of 20% to 35%. The actual
magnitudes of the NOx emission rates are not repeated here in this general issue report due to their
proprietary nature.
On Friday, September 26, 2003, an additional 3 parametric tests were made, followed by 2 tests
of longer duration. During the first parametric test, a sizable increase in CO emissions was observed,
along with some intermittent smoke from the stack. During the second and third parametric tests, the
increase in CO emissions was substantially less, along with little to no smoke from the stack. In both
tests, NOx emissions were seen to be reduced by about 50%.
The first and second longer duration (1 hour each) tests were conducted at the same conditions as
the first and third parametric tests, respectively. As with the first parametric test, the first longer duration
test had a sizable increase in CO emissions that was observed, along with some intermittent smoke from
the stack. The opacity of the plume was still below the regulated level. It should be noted that the
furnace in general was running slightly richer than normal during the first longer duration test, which
itself is conducive to higher CO emissions and smoke formation. During the second longer duration test,
there was little to no increase in CO, and smoke did not appear in the plume from the stack. In both tests,
NOx emissions were again seen to be reduced by about 50%.
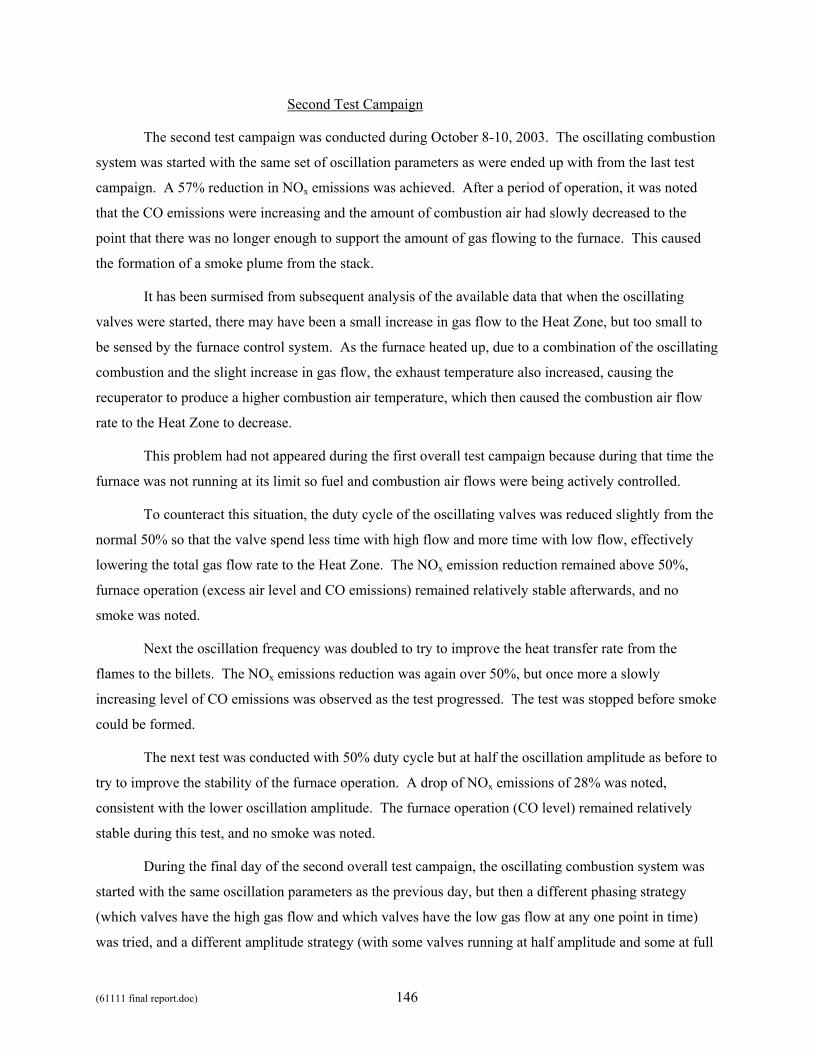
(61111 final report.doc) 146
Second Test Campaign
The second test campaign was conducted during October 8-10, 2003. The oscillating combustion
system was started with the same set of oscillation parameters as were ended up with from the last test
campaign. A 57% reduction in NOx emissions was achieved. After a period of operation, it was noted
that the CO emissions were increasing and the amount of combustion air had slowly decreased to the
point that there was no longer enough to support the amount of gas flowing to the furnace. This caused
the formation of a smoke plume from the stack.
It has been surmised from subsequent analysis of the available data that when the oscillating
valves were started, there may have been a small increase in gas flow to the Heat Zone, but too small to
be sensed by the furnace control system. As the furnace heated up, due to a combination of the oscillating
combustion and the slight increase in gas flow, the exhaust temperature also increased, causing the
recuperator to produce a higher combustion air temperature, which then caused the combustion air flow
rate to the Heat Zone to decrease.
This problem had not appeared during the first overall test campaign because during that time the
furnace was not running at its limit so fuel and combustion air flows were being actively controlled.
To counteract this situation, the duty cycle of the oscillating valves was reduced slightly from the
normal 50% so that the valve spend less time with high flow and more time with low flow, effectively
lowering the total gas flow rate to the Heat Zone. The NOx emission reduction remained above 50%,
furnace operation (excess air level and CO emissions) remained relatively stable afterwards, and no
smoke was noted.
Next the oscillation frequency was doubled to try to improve the heat transfer rate from the
flames to the billets. The NOx emissions reduction was again over 50%, but once more a slowly
increasing level of CO emissions was observed as the test progressed. The test was stopped before smoke
could be formed.
The next test was conducted with 50% duty cycle but at half the oscillation amplitude as before to
try to improve the stability of the furnace operation. A drop of NOx emissions of 28% was noted,
consistent with the lower oscillation amplitude. The furnace operation (CO level) remained relatively
stable during this test, and no smoke was noted.
During the final day of the second overall test campaign, the oscillating combustion system was
started with the same oscillation parameters as the previous day, but then a different phasing strategy
(which valves have the high gas flow and which valves have the low gas flow at any one point in time)
was tried, and a different amplitude strategy (with some valves running at half amplitude and some at full
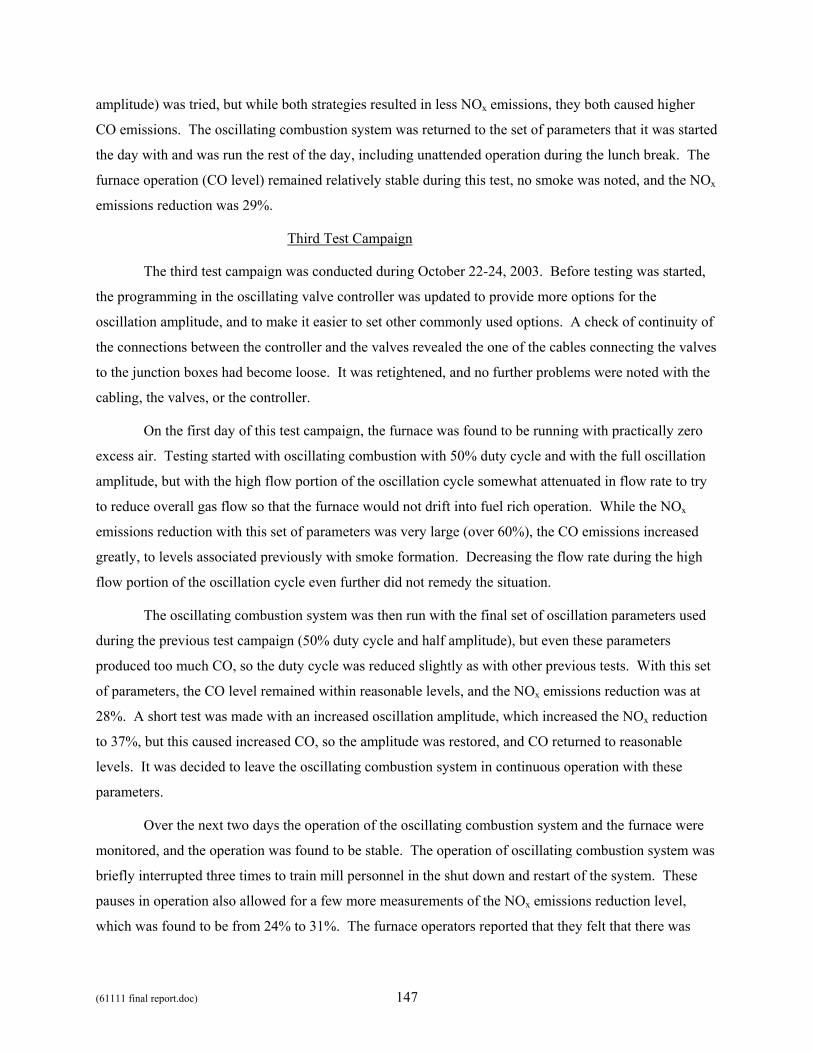
(61111 final report.doc) 147
amplitude) was tried, but while both strategies resulted in less NOx emissions, they both caused higher
CO emissions. The oscillating combustion system was returned to the set of parameters that it was started
the day with and was run the rest of the day, including unattended operation during the lunch break. The
furnace operation (CO level) remained relatively stable during this test, no smoke was noted, and the NOx
emissions reduction was 29%.
Third Test Campaign
The third test campaign was conducted during October 22-24, 2003. Before testing was started,
the programming in the oscillating valve controller was updated to provide more options for the
oscillation amplitude, and to make it easier to set other commonly used options. A check of continuity of
the connections between the controller and the valves revealed the one of the cables connecting the valves
to the junction boxes had become loose. It was retightened, and no further problems were noted with the
cabling, the valves, or the controller.
On the first day of this test campaign, the furnace was found to be running with practically zero
excess air. Testing started with oscillating combustion with 50% duty cycle and with the full oscillation
amplitude, but with the high flow portion of the oscillation cycle somewhat attenuated in flow rate to try
to reduce overall gas flow so that the furnace would not drift into fuel rich operation. While the NOx
emissions reduction with this set of parameters was very large (over 60%), the CO emissions increased
greatly, to levels associated previously with smoke formation. Decreasing the flow rate during the high
flow portion of the oscillation cycle even further did not remedy the situation.
The oscillating combustion system was then run with the final set of oscillation parameters used
during the previous test campaign (50% duty cycle and half amplitude), but even these parameters
produced too much CO, so the duty cycle was reduced slightly as with other previous tests. With this set
of parameters, the CO level remained within reasonable levels, and the NOx emissions reduction was at
28%. A short test was made with an increased oscillation amplitude, which increased the NOx reduction
to 37%, but this caused increased CO, so the amplitude was restored, and CO returned to reasonable
levels. It was decided to leave the oscillating combustion system in continuous operation with these
parameters.
Over the next two days the operation of the oscillating combustion system and the furnace were
monitored, and the operation was found to be stable. The operation of oscillating combustion system was
briefly interrupted three times to train mill personnel in the shut down and restart of the system. These
pauses in operation also allowed for a few more measurements of the NOx emissions reduction level,
which was found to be from 24% to 31%. The furnace operators reported that they felt that there was
(61111 final report.doc) 148
more heat in the furnace with the oscillating combustion system running. It was decided to leave the
oscillating combustion system in operation at the end of the test campaign.
Fourth Test Campaign
A spot check of operation of the oscillating combustion system on the reheat furnace at Nucor
Steel was made on November 17, 2003. The oscillating combustion system has been in near continuous
operation since October 22, except for a few short durations, which were mainly during their idle periods
for roll mill maintenance. Some spot checks of emissions were made in the stack, flue duct, and Soak
Zone, followed by three 1-hour sampling runs of the stack. Furnace operation was uneventful during the
three runs and the NOx emissions levels from the three runs were very consistent with each other, and
consistent with previous measurements, indicating a continued NOx reduction of about 28%.
Data were gathered on fuel usage and billet throughput for the two-week period before the
oscillating combustion system was put in continuous operation (i.e., the period of time between the
second and third test campaigns) and the three-week period of continuous operation of the oscillating
combustion system (i.e., the period of time between the starts of the third and fourth test campaigns).
The oscillating combustion system was left in operation at the end GTI’s visit. It is still in
operation at the time of this report.
Test Instrumentation Removal
During the period of November 18-19, 2003, immediately following the fourth test campaign,
GTI disassembled its test equipment and packed the equipment into crates. The equipment was
subsequently shipped back to GTI. After leaving the site, GTI arranged for the pickup of the rented trailer
and calibration gas cylinders.
Data Analysis and Reporting
During December 2003, GTI completed the analysis and validation of the data gathered during
the field test of the oscillating combustion system on the reheat furnace at Nucor Steel. The final analysis
showed an average 28% NOx reduction for the current, still running, mode of operation (half-amplitude),
and an average 54% NOx reduction during those earlier tests, where excess CO and opacity (smoking)
could occur when the oscillating valves were set for full-amplitude operation (see Figure 137).
The analysis of the fuel use data gathered between the second and fourth test campaigns was done
on a per shift basis (see Figure 138). The analysis showed an average 0.2%-0.5% drop in fuel use during
oscillating combustion in operation.
(61111 final report.doc) 149
Fuel Lean
NO
x
Baseline
Smoking limit
Normaloperatingenvelope
Fuel Rich
Half Amplitude
Full Amplitude
28% NOxreduction
54% NOxreduction
Figure 137. LIMIT OF NOX REDUCTION WITH OSCILLATING COMBUSTION
1.5
2
2.5
3
3.5
4
4.5
5
100 150 200 250 300 350 400 450 500 550billets/shift
NG
(MS
CF/
bille
t)
NormalOsc
Figure 138. NATURAL GAS USAGE WITHOUT AND WITH OSCILLATING COMBUSTION
A stack test report was written by GTI11 and sent to Nucor Steel for their submittal to the Utah
Department of Environmental Quality. The report covered the testing methodology, the NOx reductions
resulting from the parametric studies, and the final emissions values measured during the fourth test
campaign.
A project wrap up meeting was held on January 16, 2004, in Brigham City, Utah, to present the
final results and future options to Nucor Steel and Questar Gas. These options include the level of
technical support and technology transfer that GTI could provide Nucor Steel, and a proposed
augmentation to oscillating combustion system, called OCTrim (see Figure 139), that would utilize an
oxygen sensor in the flue duct to determine the level of oscillation amplitude so as to maximize NOx
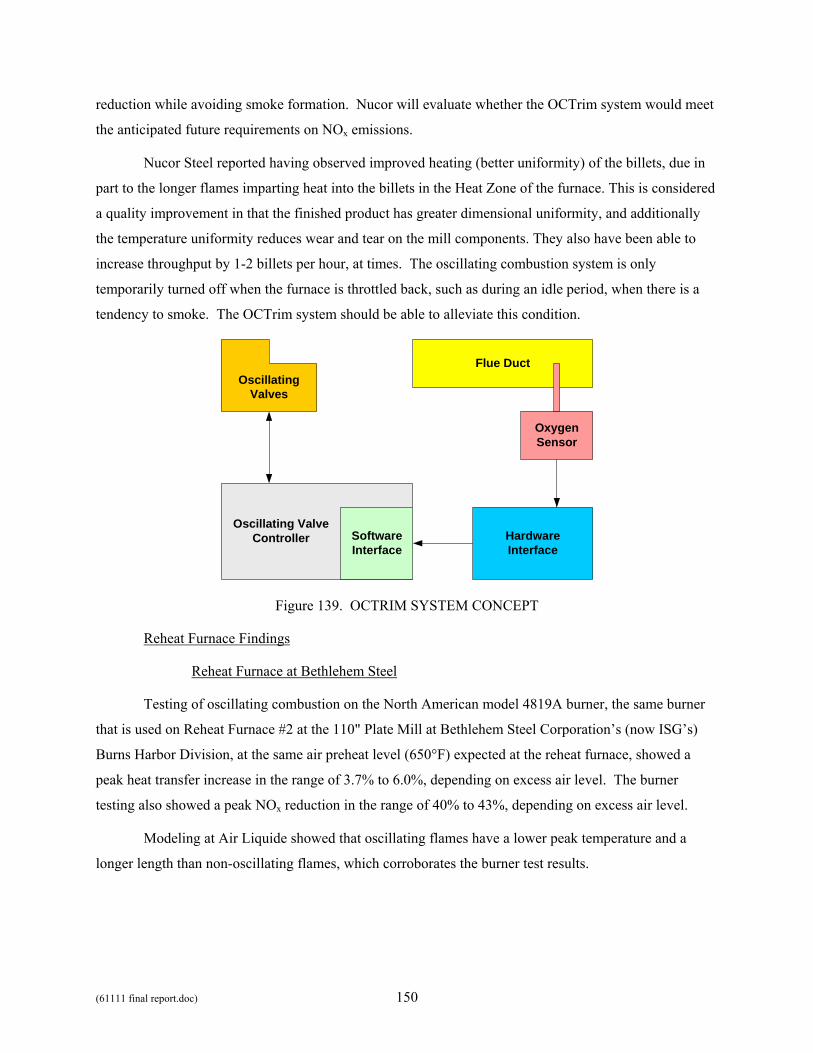
(61111 final report.doc) 150
reduction while avoiding smoke formation. Nucor will evaluate whether the OCTrim system would meet
the anticipated future requirements on NOx emissions.
Nucor Steel reported having observed improved heating (better uniformity) of the billets, due in
part to the longer flames imparting heat into the billets in the Heat Zone of the furnace. This is considered
a quality improvement in that the finished product has greater dimensional uniformity, and additionally
the temperature uniformity reduces wear and tear on the mill components. They also have been able to
increase throughput by 1-2 billets per hour, at times. The oscillating combustion system is only
temporarily turned off when the furnace is throttled back, such as during an idle period, when there is a
tendency to smoke. The OCTrim system should be able to alleviate this condition.
OscillatingValves
Oscillating ValveController
Flue Duct
SoftwareInterface
HardwareInterface
OxygenSensor
Figure 139. OCTRIM SYSTEM CONCEPT
Reheat Furnace Findings
Reheat Furnace at Bethlehem Steel
Testing of oscillating combustion on the North American model 4819A burner, the same burner
that is used on Reheat Furnace #2 at the 110" Plate Mill at Bethlehem Steel Corporation’s (now ISG’s)
Burns Harbor Division, at the same air preheat level (650°F) expected at the reheat furnace, showed a
peak heat transfer increase in the range of 3.7% to 6.0%, depending on excess air level. The burner
testing also showed a peak NOx reduction in the range of 40% to 43%, depending on excess air level.
Modeling at Air Liquide showed that oscillating flames have a lower peak temperature and a
longer length than non-oscillating flames, which corroborates the burner test results.
(61111 final report.doc) 151
Reheat Furnace at Nucor Steel
During parametric tests of oscillating combustion on the reheat furnace at Nucor Steel, it was
found that at full oscillation amplitude (gas flow rate oscillating between 185% and 15% of its normal
rate), NOx emissions were reduced by 54%, the Heat Zone temperature was observed to increase by 55°F
in 3 hours on one occasion and 41°F in 2.5 hours on another, but CO emissions were at times higher than
desired, and smoking occurred under certain conditions, particularly when the furnace was pushed hard.
After switching to half oscillation amplitude (gas flow rate oscillating between 142% and 58% of its
normal rate), it was found that NOx emissions were reduced by 28%, the Heat Zone temperature was
observed to increase by 34°F in 2 hours on one occasion, CO emissions remained within desired limits,
smoking was not observed. In either case, furnace pressure and ambient noise were unaffected.
After three weeks of near continuous operation of the oscillating combustion system at half
amplitude, it was found that the natural gas usage was reduced by 0.2%-0.5%. GTI estimated that if this
efficiency increase is used to increase production rate by 0.2%, the end product value (gross revenue) of
the increase throughput could by $400,000 per year (using $330 per ton and 600,000 ton per year).
The site reported that heating of the billets was improved (made more uniform with the longer
oscillating flames) with the oscillating combustion system in operation, and billet feed rate could be
increased at times over that of normal operation.
If one considers that the oscillating combustion system was only applied to the Heat Zone, which
account for 72% of the heat input and 73% of the NOx emissions under normal (non-oscillating)
operation, the amount of NOx reduction in the Heat Zone itself is 37% at half oscillation amplitude and
70% at full oscillation amplitude. If one further considers that the 9% of the heat input to the Heat Zone
goes through the lances (pilots) and not through the oscillating valves, then the NOx reduction in the Heat
Zone itself calculates to 41% and 77% for half and full amplitude, respectively.
(61111 final report.doc) 152
Task 7. Oscillating Combustion Control System Development
Task 7 involved the development of a PC-based control system to effectively implement
oscillating combustion. This included hardware to drive the oscillating valves and monitor their
performance, and computer software to set and control the oscillating combustion parameters. While
most of the development was geared toward a system for the SSP valves, certain aspects were applicable
to both the SSP valve and the Cyclic valves. The effort was funded by the GTI Sustaining Membership
Program.
Single Oscillating Valve Controller
In a prior project4, GTI fabricated a valve controller using a custom-made power amplifier and a
computer with a data acquisition card installed that included digital-to-analog (D/A) outputs. This setup
could drive one SSP valve and was used during that prior project and for the first burner testing in Task 1
of this project. In a separate project7, the Garrock valve controller, which had been developed to drive the
SSP valve for high-low firing applications, was upgraded to drive one or two SSP valves for oscillating
combustion applications. The Garrock controllers were used in field tests in Tasks 2, 4, and 5, and part of
Task 3. During Task 3, the Garrock controller was replaced by a custom-made valve (and costly)
controller fabricated by a power supply company. Near the end of Task 5, the Garrock controller was
augmented by circuitry to drive ten valves simultaneously in proper synchronization.
An attempt was made to replace the custom-made power amplifier with a commercially available
electronic control module made for proportional solenoid valves. This module converts a standard analog
input signal into the higher-voltage, high-current signal need for the valves. If the module was
compatible with the SSP valve, the valve driver circuitry in the Garrock controller could have been
replaced with simpler analog outputs, and the number of those outputs increased so that many SSP valves,
each with a module attached, could have been driven with the Garrock controller, instead of just two
valves. Unfortunately, the electronic control module did not seem to work as expected. The module
failed to actuate the valve, and was accompanied by a slight odor of burned electronics during testing.
Apparently the module could not handle the current needed for the valve, despite that current being within
the ratings of the module.
After hardware failures, the computer and data acquisition card of the original GTI valve
controller were replaced by a function generator, while keeping the custom-made power amplifier. It was
found to be very difficult to set the oscillation parameters precisely with the function generator. It was
also found that it was very cumbersome to set the oscillation parameters with the Garrock controller,
especially in the laboratory where changes had to be made very frequently for testing purposes. It was
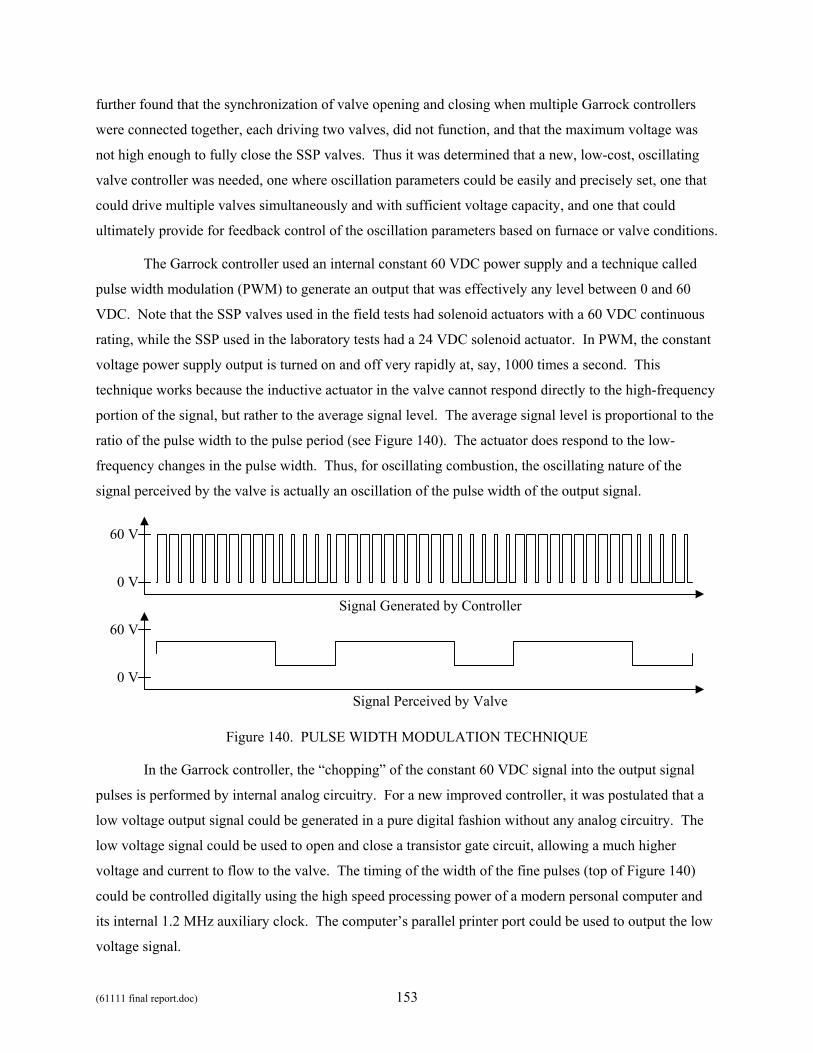
(61111 final report.doc) 153
further found that the synchronization of valve opening and closing when multiple Garrock controllers
were connected together, each driving two valves, did not function, and that the maximum voltage was
not high enough to fully close the SSP valves. Thus it was determined that a new, low-cost, oscillating
valve controller was needed, one where oscillation parameters could be easily and precisely set, one that
could drive multiple valves simultaneously and with sufficient voltage capacity, and one that could
ultimately provide for feedback control of the oscillation parameters based on furnace or valve conditions.
The Garrock controller used an internal constant 60 VDC power supply and a technique called
pulse width modulation (PWM) to generate an output that was effectively any level between 0 and 60
VDC. Note that the SSP valves used in the field tests had solenoid actuators with a 60 VDC continuous
rating, while the SSP used in the laboratory tests had a 24 VDC solenoid actuator. In PWM, the constant
voltage power supply output is turned on and off very rapidly at, say, 1000 times a second. This
technique works because the inductive actuator in the valve cannot respond directly to the high-frequency
portion of the signal, but rather to the average signal level. The average signal level is proportional to the
ratio of the pulse width to the pulse period (see Figure 140). The actuator does respond to the low-
frequency changes in the pulse width. Thus, for oscillating combustion, the oscillating nature of the
signal perceived by the valve is actually an oscillation of the pulse width of the output signal.
Signal Generated by Controller
Signal Perceived by Valve
0 V
60 V
0 V
60 V
Figure 140. PULSE WIDTH MODULATION TECHNIQUE
In the Garrock controller, the “chopping” of the constant 60 VDC signal into the output signal
pulses is performed by internal analog circuitry. For a new improved controller, it was postulated that a
low voltage output signal could be generated in a pure digital fashion without any analog circuitry. The
low voltage signal could be used to open and close a transistor gate circuit, allowing a much higher
voltage and current to flow to the valve. The timing of the width of the fine pulses (top of Figure 140)
could be controlled digitally using the high speed processing power of a modern personal computer and
its internal 1.2 MHz auxiliary clock. The computer’s parallel printer port could be used to output the low
voltage signal.
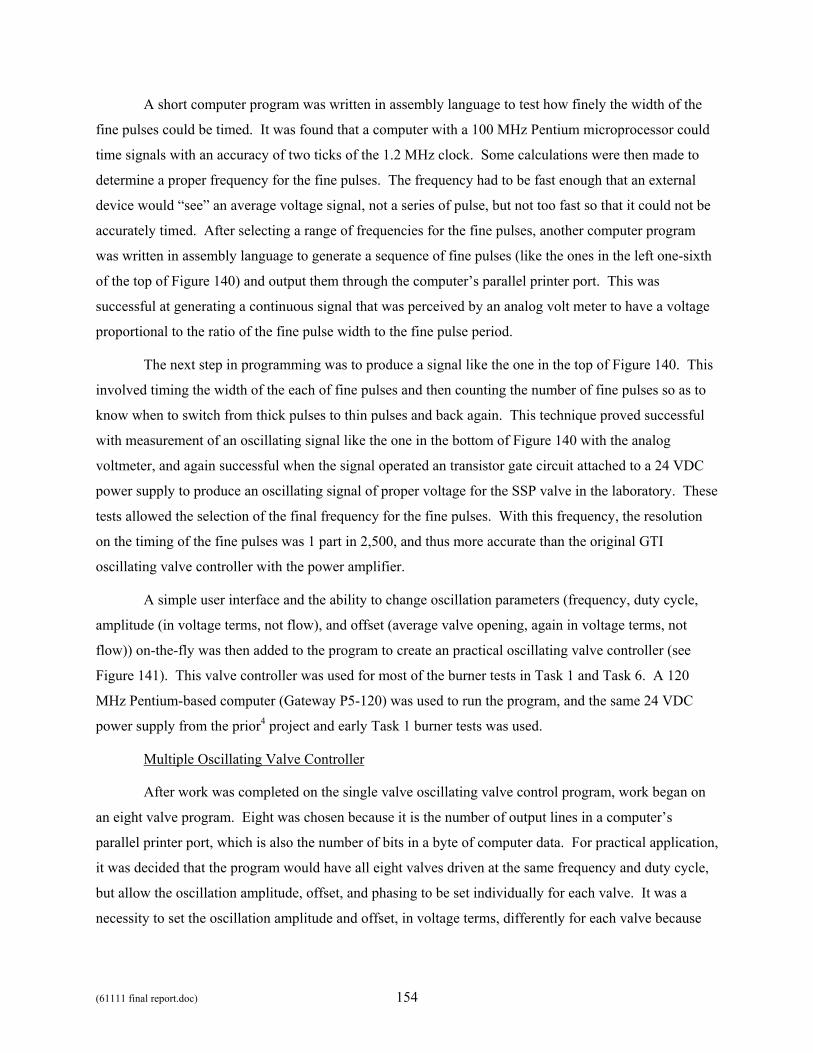
(61111 final report.doc) 154
A short computer program was written in assembly language to test how finely the width of the
fine pulses could be timed. It was found that a computer with a 100 MHz Pentium microprocessor could
time signals with an accuracy of two ticks of the 1.2 MHz clock. Some calculations were then made to
determine a proper frequency for the fine pulses. The frequency had to be fast enough that an external
device would “see” an average voltage signal, not a series of pulse, but not too fast so that it could not be
accurately timed. After selecting a range of frequencies for the fine pulses, another computer program
was written in assembly language to generate a sequence of fine pulses (like the ones in the left one-sixth
of the top of Figure 140) and output them through the computer’s parallel printer port. This was
successful at generating a continuous signal that was perceived by an analog volt meter to have a voltage
proportional to the ratio of the fine pulse width to the fine pulse period.
The next step in programming was to produce a signal like the one in the top of Figure 140. This
involved timing the width of the each of fine pulses and then counting the number of fine pulses so as to
know when to switch from thick pulses to thin pulses and back again. This technique proved successful
with measurement of an oscillating signal like the one in the bottom of Figure 140 with the analog
voltmeter, and again successful when the signal operated an transistor gate circuit attached to a 24 VDC
power supply to produce an oscillating signal of proper voltage for the SSP valve in the laboratory. These
tests allowed the selection of the final frequency for the fine pulses. With this frequency, the resolution
on the timing of the fine pulses was 1 part in 2,500, and thus more accurate than the original GTI
oscillating valve controller with the power amplifier.
A simple user interface and the ability to change oscillation parameters (frequency, duty cycle,
amplitude (in voltage terms, not flow), and offset (average valve opening, again in voltage terms, not
flow)) on-the-fly was then added to the program to create an practical oscillating valve controller (see
Figure 141). This valve controller was used for most of the burner tests in Task 1 and Task 6. A 120
MHz Pentium-based computer (Gateway P5-120) was used to run the program, and the same 24 VDC
power supply from the prior4 project and early Task 1 burner tests was used.
Multiple Oscillating Valve Controller
After work was completed on the single valve oscillating valve control program, work began on
an eight valve program. Eight was chosen because it is the number of output lines in a computer’s
parallel printer port, which is also the number of bits in a byte of computer data. For practical application,
it was decided that the program would have all eight valves driven at the same frequency and duty cycle,
but allow the oscillation amplitude, offset, and phasing to be set individually for each valve. It was a
necessity to set the oscillation amplitude and offset, in voltage terms, differently for each valve because
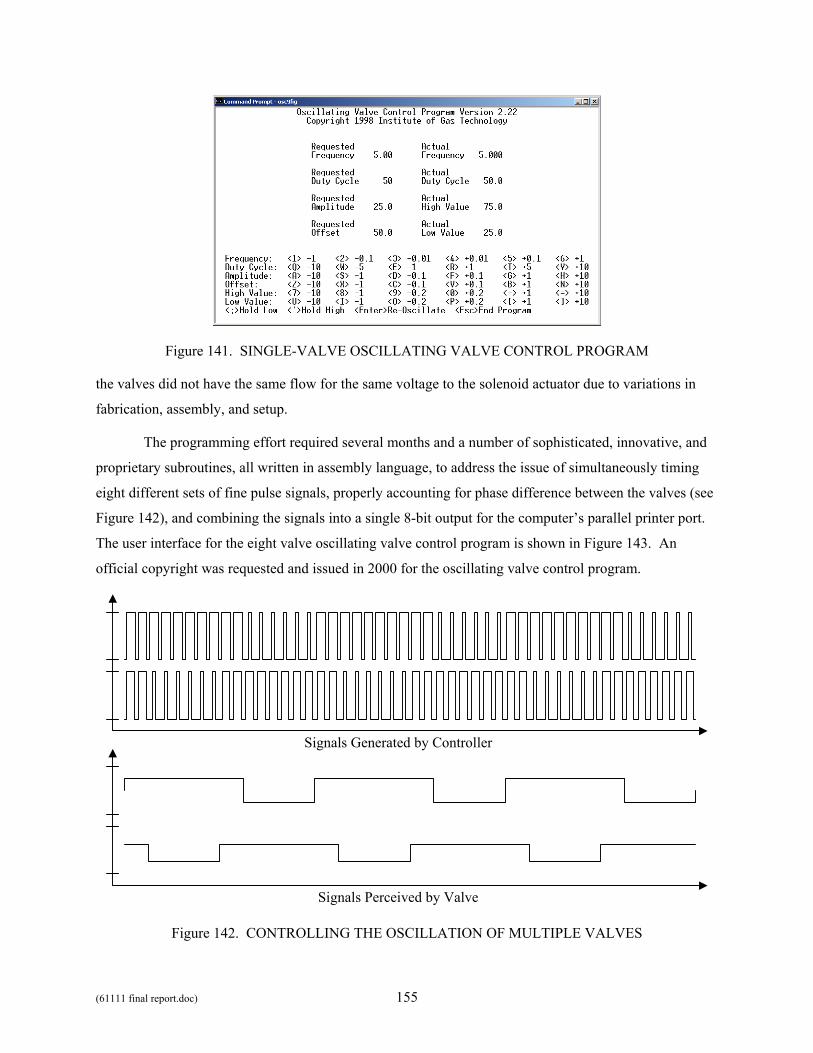
(61111 final report.doc) 155
Figure 141. SINGLE-VALVE OSCILLATING VALVE CONTROL PROGRAM
the valves did not have the same flow for the same voltage to the solenoid actuator due to variations in
fabrication, assembly, and setup.
The programming effort required several months and a number of sophisticated, innovative, and
proprietary subroutines, all written in assembly language, to address the issue of simultaneously timing
eight different sets of fine pulse signals, properly accounting for phase difference between the valves (see
Figure 142), and combining the signals into a single 8-bit output for the computer’s parallel printer port.
The user interface for the eight valve oscillating valve control program is shown in Figure 143. An
official copyright was requested and issued in 2000 for the oscillating valve control program.
Signals Generated by Controller
Signals Perceived by Valve
Figure 142. CONTROLLING THE OSCILLATION OF MULTIPLE VALVES
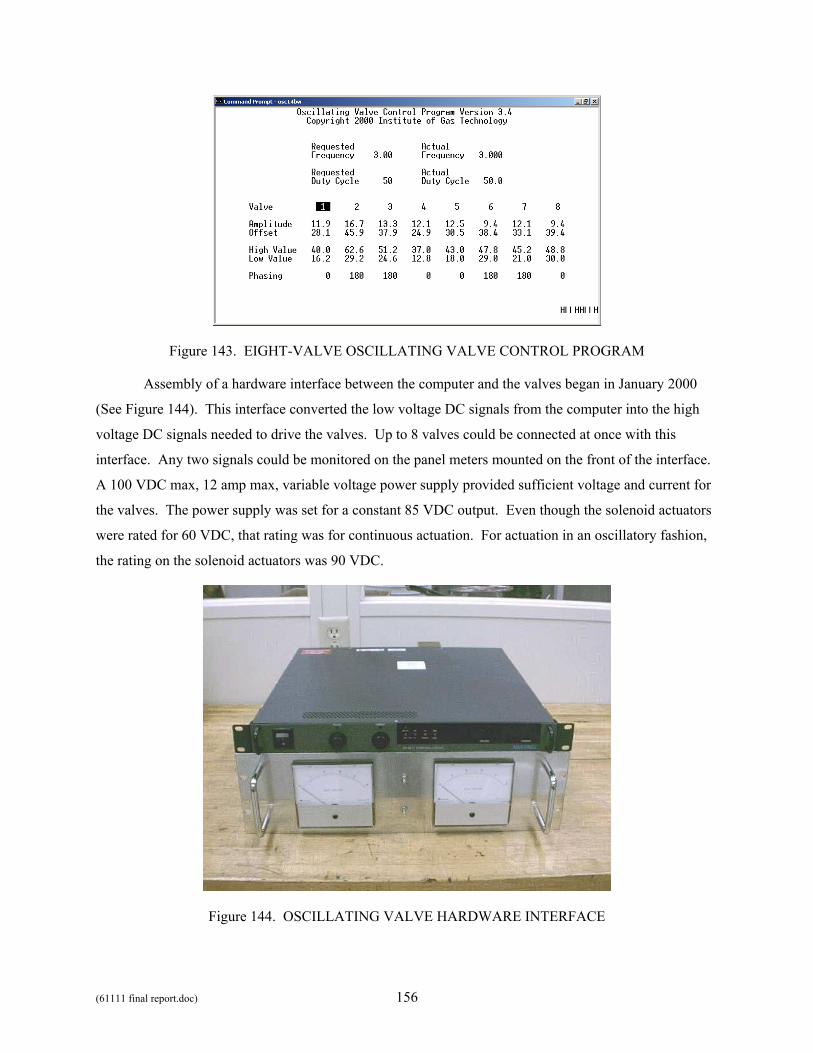
(61111 final report.doc) 156
Figure 143. EIGHT-VALVE OSCILLATING VALVE CONTROL PROGRAM
Assembly of a hardware interface between the computer and the valves began in January 2000
(See Figure 144). This interface converted the low voltage DC signals from the computer into the high
voltage DC signals needed to drive the valves. Up to 8 valves could be connected at once with this
interface. Any two signals could be monitored on the panel meters mounted on the front of the interface.
A 100 VDC max, 12 amp max, variable voltage power supply provided sufficient voltage and current for
the valves. The power supply was set for a constant 85 VDC output. Even though the solenoid actuators
were rated for 60 VDC, that rating was for continuous actuation. For actuation in an oscillatory fashion,
the rating on the solenoid actuators was 90 VDC.
Figure 144. OSCILLATING VALVE HARDWARE INTERFACE
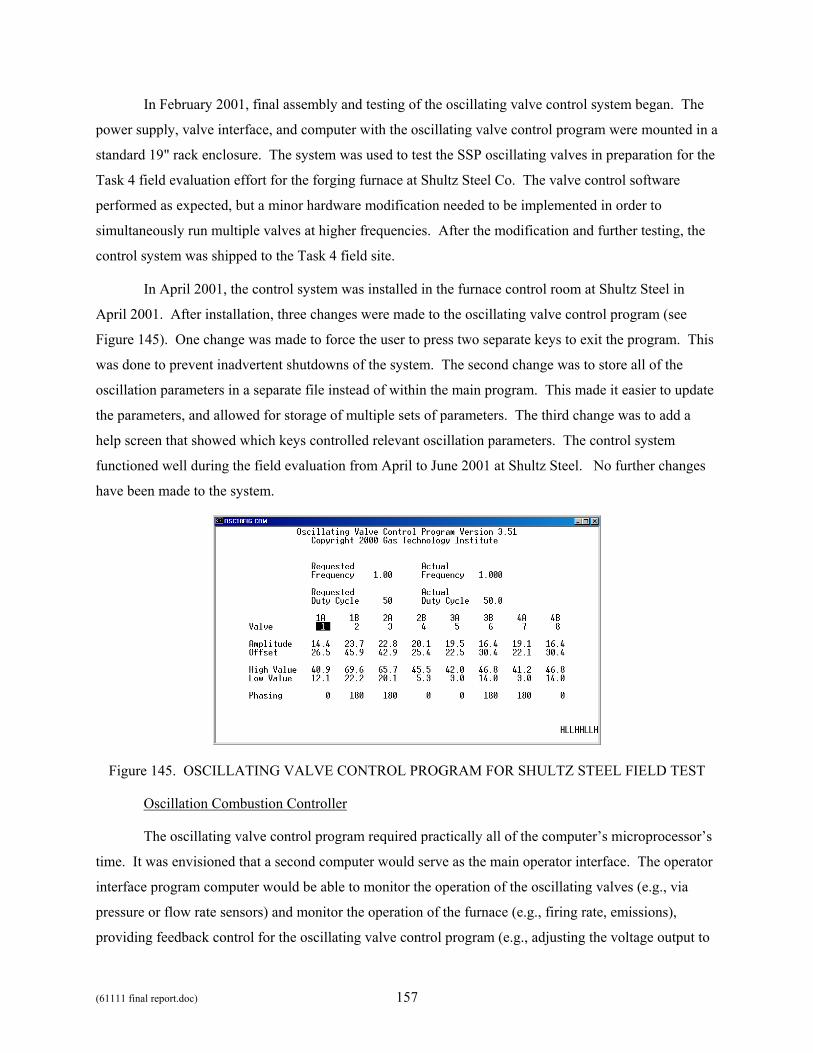
(61111 final report.doc) 157
In February 2001, final assembly and testing of the oscillating valve control system began. The
power supply, valve interface, and computer with the oscillating valve control program were mounted in a
standard 19" rack enclosure. The system was used to test the SSP oscillating valves in preparation for the
Task 4 field evaluation effort for the forging furnace at Shultz Steel Co. The valve control software
performed as expected, but a minor hardware modification needed to be implemented in order to
simultaneously run multiple valves at higher frequencies. After the modification and further testing, the
control system was shipped to the Task 4 field site.
In April 2001, the control system was installed in the furnace control room at Shultz Steel in
April 2001. After installation, three changes were made to the oscillating valve control program (see
Figure 145). One change was made to force the user to press two separate keys to exit the program. This
was done to prevent inadvertent shutdowns of the system. The second change was to store all of the
oscillation parameters in a separate file instead of within the main program. This made it easier to update
the parameters, and allowed for storage of multiple sets of parameters. The third change was to add a
help screen that showed which keys controlled relevant oscillation parameters. The control system
functioned well during the field evaluation from April to June 2001 at Shultz Steel. No further changes
have been made to the system.
Figure 145. OSCILLATING VALVE CONTROL PROGRAM FOR SHULTZ STEEL FIELD TEST
Oscillation Combustion Controller
The oscillating valve control program required practically all of the computer’s microprocessor’s
time. It was envisioned that a second computer would serve as the main operator interface. The operator
interface program computer would be able to monitor the operation of the oscillating valves (e.g., via
pressure or flow rate sensors) and monitor the operation of the furnace (e.g., firing rate, emissions),
providing feedback control for the oscillating valve control program (e.g., adjusting the voltage output to
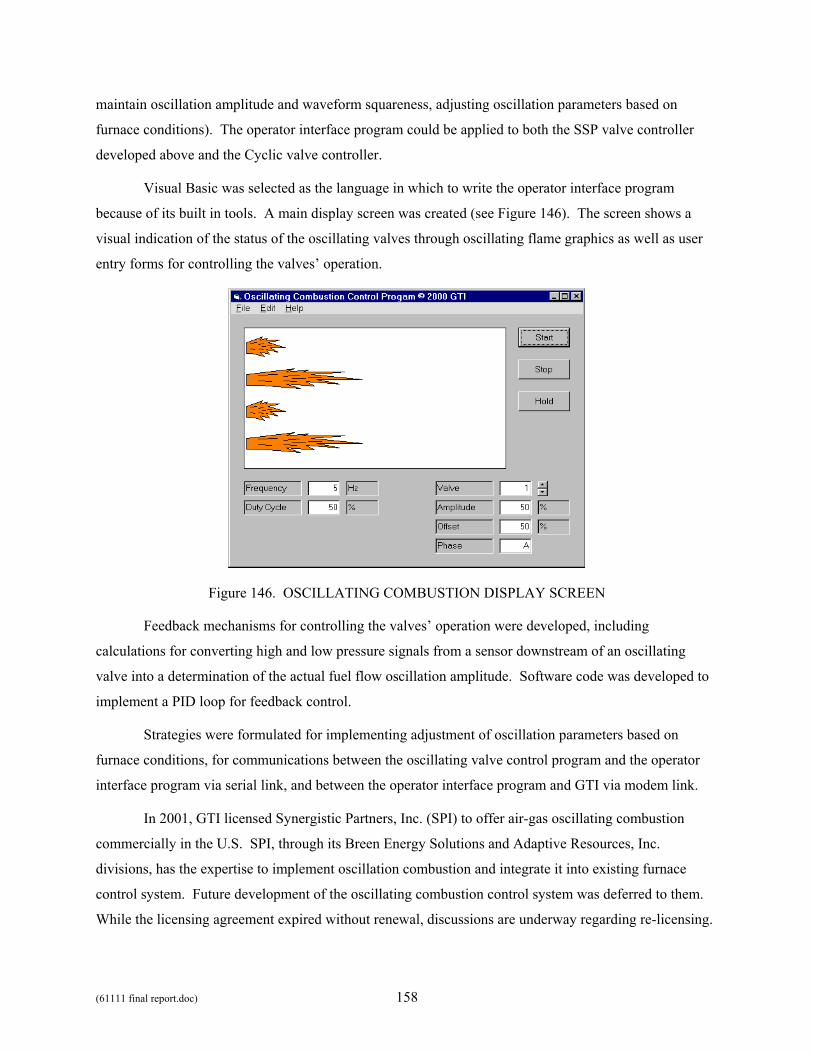
(61111 final report.doc) 158
maintain oscillation amplitude and waveform squareness, adjusting oscillation parameters based on
furnace conditions). The operator interface program could be applied to both the SSP valve controller
developed above and the Cyclic valve controller.
Visual Basic was selected as the language in which to write the operator interface program
because of its built in tools. A main display screen was created (see Figure 146). The screen shows a
visual indication of the status of the oscillating valves through oscillating flame graphics as well as user
entry forms for controlling the valves’ operation.
Figure 146. OSCILLATING COMBUSTION DISPLAY SCREEN
Feedback mechanisms for controlling the valves’ operation were developed, including
calculations for converting high and low pressure signals from a sensor downstream of an oscillating
valve into a determination of the actual fuel flow oscillation amplitude. Software code was developed to
implement a PID loop for feedback control.
Strategies were formulated for implementing adjustment of oscillation parameters based on
furnace conditions, for communications between the oscillating valve control program and the operator
interface program via serial link, and between the operator interface program and GTI via modem link.
In 2001, GTI licensed Synergistic Partners, Inc. (SPI) to offer air-gas oscillating combustion
commercially in the U.S. SPI, through its Breen Energy Solutions and Adaptive Resources, Inc.
divisions, has the expertise to implement oscillation combustion and integrate it into existing furnace
control system. Future development of the oscillating combustion control system was deferred to them.
While the licensing agreement expired without renewal, discussions are underway regarding re-licensing.
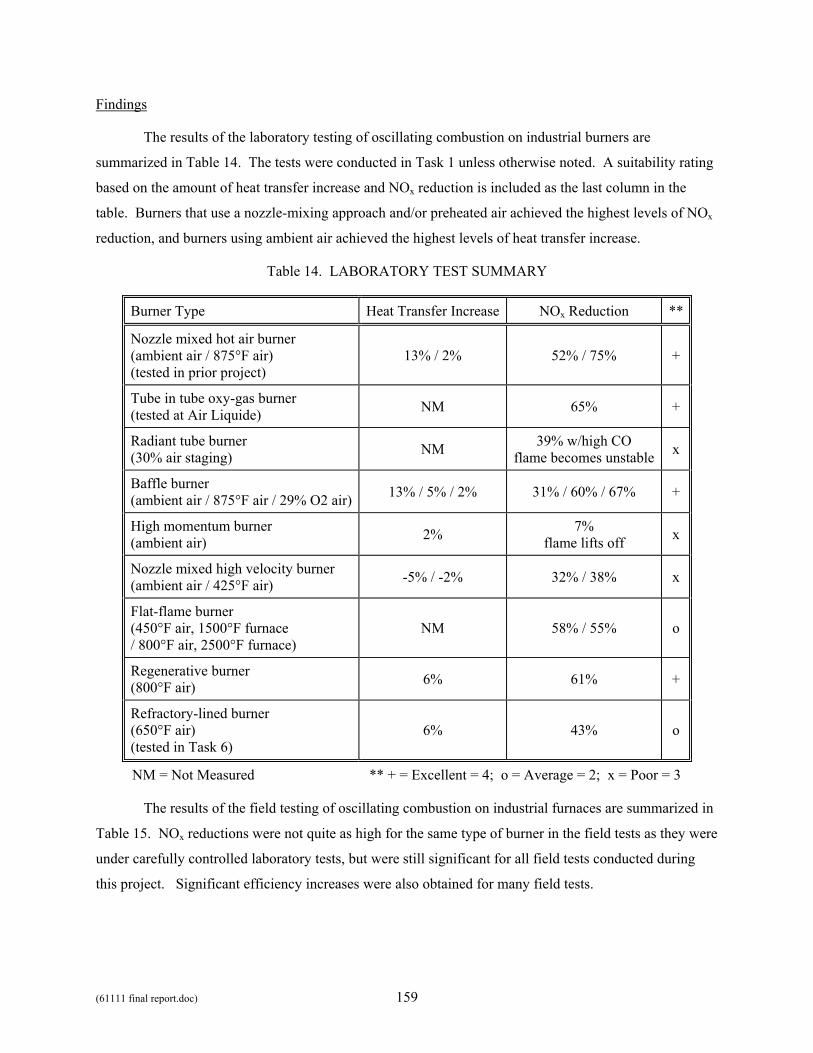
(61111 final report.doc) 159
Findings
The results of the laboratory testing of oscillating combustion on industrial burners are
summarized in Table 14. The tests were conducted in Task 1 unless otherwise noted. A suitability rating
based on the amount of heat transfer increase and NOx reduction is included as the last column in the
table. Burners that use a nozzle-mixing approach and/or preheated air achieved the highest levels of NOx
reduction, and burners using ambient air achieved the highest levels of heat transfer increase.
Table 14. LABORATORY TEST SUMMARY
Burner Type Heat Transfer Increase NOx Reduction **
Nozzle mixed hot air burner (ambient air / 875°F air) (tested in prior project)
13% / 2% 52% / 75% +
Tube in tube oxy-gas burner (tested at Air Liquide) NM 65% +
Radiant tube burner (30% air staging) NM 39% w/high CO
flame becomes unstable x
Baffle burner (ambient air / 875°F air / 29% O2 air) 13% / 5% / 2% 31% / 60% / 67% +
High momentum burner (ambient air) 2% 7%
flame lifts off x
Nozzle mixed high velocity burner (ambient air / 425°F air) -5% / -2% 32% / 38% x
Flat-flame burner (450°F air, 1500°F furnace / 800°F air, 2500°F furnace)
NM 58% / 55% o
Regenerative burner (800°F air) 6% 61% +
Refractory-lined burner (650°F air) (tested in Task 6)
6% 43% o
NM = Not Measured ** + = Excellent = 4; o = Average = 2; x = Poor = 3
The results of the field testing of oscillating combustion on industrial furnaces are summarized in
Table 15. NOx reductions were not quite as high for the same type of burner in the field tests as they were
under carefully controlled laboratory tests, but were still significant for all field tests conducted during
this project. Significant efficiency increases were also obtained for many field tests.
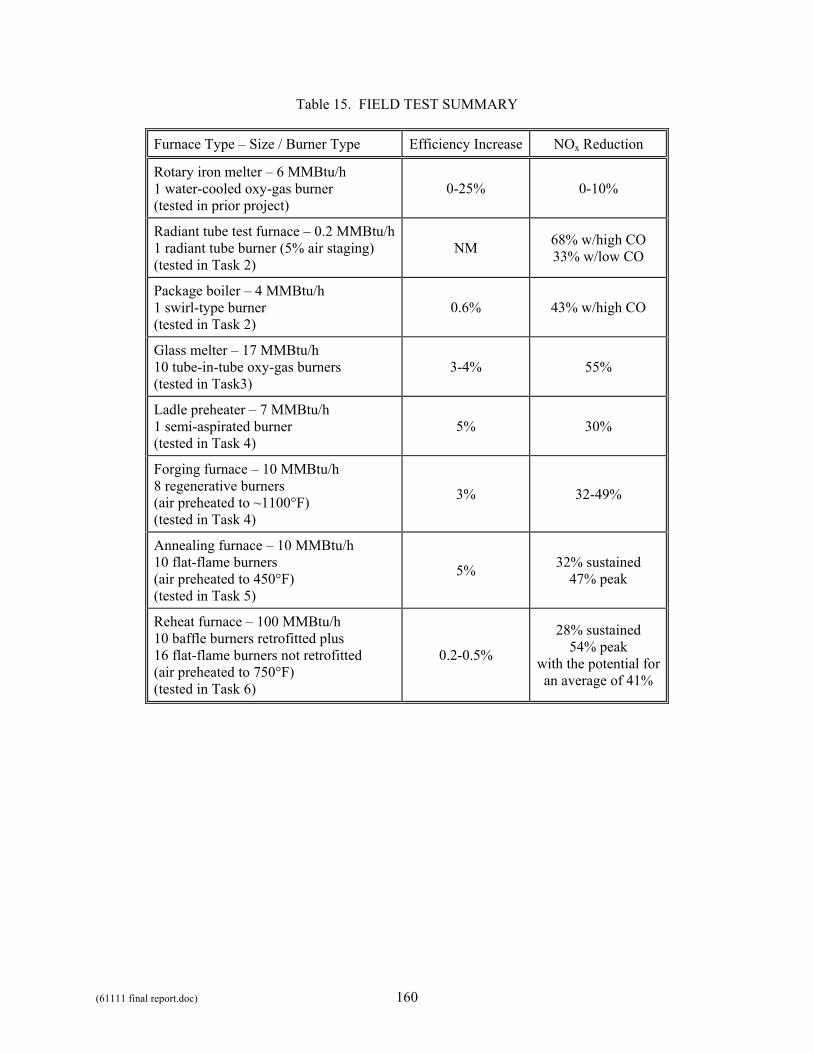
(61111 final report.doc) 160
Table 15. FIELD TEST SUMMARY
Furnace Type – Size / Burner Type Efficiency Increase NOx Reduction
Rotary iron melter – 6 MMBtu/h 1 water-cooled oxy-gas burner (tested in prior project)
0-25% 0-10%
Radiant tube test furnace – 0.2 MMBtu/h1 radiant tube burner (5% air staging) (tested in Task 2)
NM 68% w/high CO 33% w/low CO
Package boiler – 4 MMBtu/h 1 swirl-type burner (tested in Task 2)
0.6% 43% w/high CO
Glass melter – 17 MMBtu/h 10 tube-in-tube oxy-gas burners (tested in Task3)
3-4% 55%
Ladle preheater – 7 MMBtu/h 1 semi-aspirated burner (tested in Task 4)
5% 30%
Forging furnace – 10 MMBtu/h 8 regenerative burners (air preheated to ~1100°F) (tested in Task 4)
3% 32-49%
Annealing furnace – 10 MMBtu/h 10 flat-flame burners (air preheated to 450°F) (tested in Task 5)
5% 32% sustained 47% peak
Reheat furnace – 100 MMBtu/h 10 baffle burners retrofitted plus 16 flat-flame burners not retrofitted (air preheated to 750°F) (tested in Task 6)
0.2-0.5%
28% sustained 54% peak
with the potential for an average of 41%

(61111 final report.doc) 161
CONCLUSIONS
Laboratory testing has shown that oscillating combustion can produce substantial increases in
heat transfer and reductions in NOx emissions on many types of industrial burners. The highest levels of
NOx emissions reduction were achieved with burners that use a nozzle-mixing approach and/or preheated
or oxygen-enriched combustion air, while the highest levels of heat transfer increase were achieved with
burners using ambient air, though the heat transfer increase was still significant with burners using
preheated combustion. Oscillating combustion was not found suitable for burners using staging or high-
momentum approaches. The large amount of NOx emissions reduction achieved when the combustion air
was enriched with oxygen suggest that a combined retrofit of oscillating combustion and oxygen
enrichment would offer the increased furnace efficiency inherent with oxygen enrichment without the
increase in NOx emissions associated with oxygen enrichment alone.
Field testing has shown that oscillating combustion can produce substantial increases in furnace
efficiency and reductions in NOx emissions on many types of industrial furnaces using conventional
burners. Significant levels NOx emissions reductions were achieved for all field tests conducted during
this project, particularly with higher temperature furnaces using low excess air levels, though usually not
quite as high for the same type of burner as they were under carefully controlled laboratory tests.
Significant levels of efficiency increases were also obtained for many field tests. No impacts on general
furnace operation were observed with properly selected oscillation parameters. In some cases, the
oscillation parameters that produced the greatest NOx emissions reduction for some modes of furnace
operation could not be used for all modes of furnace operation, and this limited the amount of NOx
emissions reduction achieved. No elevation in noise levels, no loss of flame sensing signal, and no
adverse impacts on product quality were observed. In some cases, a tertiary benefit, such as reduced
furnace crown temperature, lower oxygen usage, or improved temperature uniformity, was recorded.
These have been attributed to the change in flame shape (i.e., longer flames).
Modeling showed that oscillating flames have a lower peak temperature and a longer length than
non-oscillating flames, which supports the results achieved during laboratory testing and field testing.
The valves and controllers used to implement oscillating combustion were sufficiently developed
to be applied for long-term (three to four years) operation on industrial furnaces. Two types of valves
were developed; one for small- to medium-sized burners, and one for medium- to large-sized burners.
With minor modifications to the gas supply systems on furnaces, and no modifications to the burners or
furnaces themselves, the oscillating combustion system was found able to be installed with minimal
downtime and with transparency to normal furnace operation.

(61111 final report.doc) 162
Overall, oscillating combustion should have a wide applicability to increase efficiency and reduce
NOx emissions for steel, glass, petrochemical, aluminum, cement, and metal heating furnaces.
(61111 final report.doc) 163
COMMERCIALIZATION PLAN
Air Liquide (AL) has a world-wide, exclusive right for oxy-gas oscillating combustion (OC) and
a nonexclusive right for air-gas OC. AL is marketing OC to its domestic and international industrial gas
customers through its existing sales, engineering, and support channels. In 1999, AL’s affiliate, Safmatic,
obtained a license from CeramPhysics, Inc. to manufacturer the SSP valve for OC applications. In 2000,
Safmatic developed a commercial version of the SSP valve. This valve was tested at AL’s Chicago
Research Center. The valve is sized to cover the normal range of oxy-gas applications (0.5-2 MW (1,700-
6,800 SCF/h)). AL has developed a controller for the SSP valve. The controller is fabricated by a major
power supply company.
AL has successfully field tested OC on a glass melter in Europe and on an oxygen-enrichment
application in Japan. Currently AL is planning on testing OC on an industrial boiler in Europe.
GTI has retained a nonexclusive right for air-gas OC. Initially, GTI attempted to license air-gas
OC to a burner or industrial controls manufacturer. While the interest in the technology was there, most
manufacturers were not convinced of the markets size to warrant investment in industrializing the OC
hardware. This was at the time however before Safmatic had developed its commercial version of the
SSP valve and before the development of the Cyclic valve. GTI and GRI then planned to form a
subsidiary, called Industrial Solutions or XYZ Corp., to market OC and other GTI and GRI developed
combustion technologies, but this was not pursued. In 2001, GTI licensed Synergistic Partners, Inc. (SPI)
of Pittsburgh, PA, who had previously licensed GRI’s Fuel Lean Gas Reburning technology, to offer air-
gas OC commercially in the U.S. Breen Energy Solutions was the specific division of SPI that was
involved. The period of the license was two years, and has now lapsed since no installations of OC were
made by SPI despite numerous leads, site visits, and proposals. During the license period, SPI would
have supported AL in oxy-gas OC applications as needed. SPI is still retained for technical support on a
subcontract basis in, for examples, GTI’s project with the Texas Commission on Environmental Quality
(TCEQ) to test OC for refinery heaters. Re-licensing discussions with Breen Energy Solutions and
Adaptive Resources, Inc. are underway.
GTI is able to procure Safmatic valves and controllers through AL. GTI is also attempting to
obtain a license for manufacturing and distributing the Cyclic valve, and would make Cyclic valves and
associated controls available to AL or an eventual licensee of air-gas OC.
While SPI was a licensee of air-gas OC, a commercialization plan was formed (see Table 16).
Each potential industrial site will likely be a site specific application of this technology, that is,
different burners, levels and means of recuperation, process cycling, product type, temperature of the
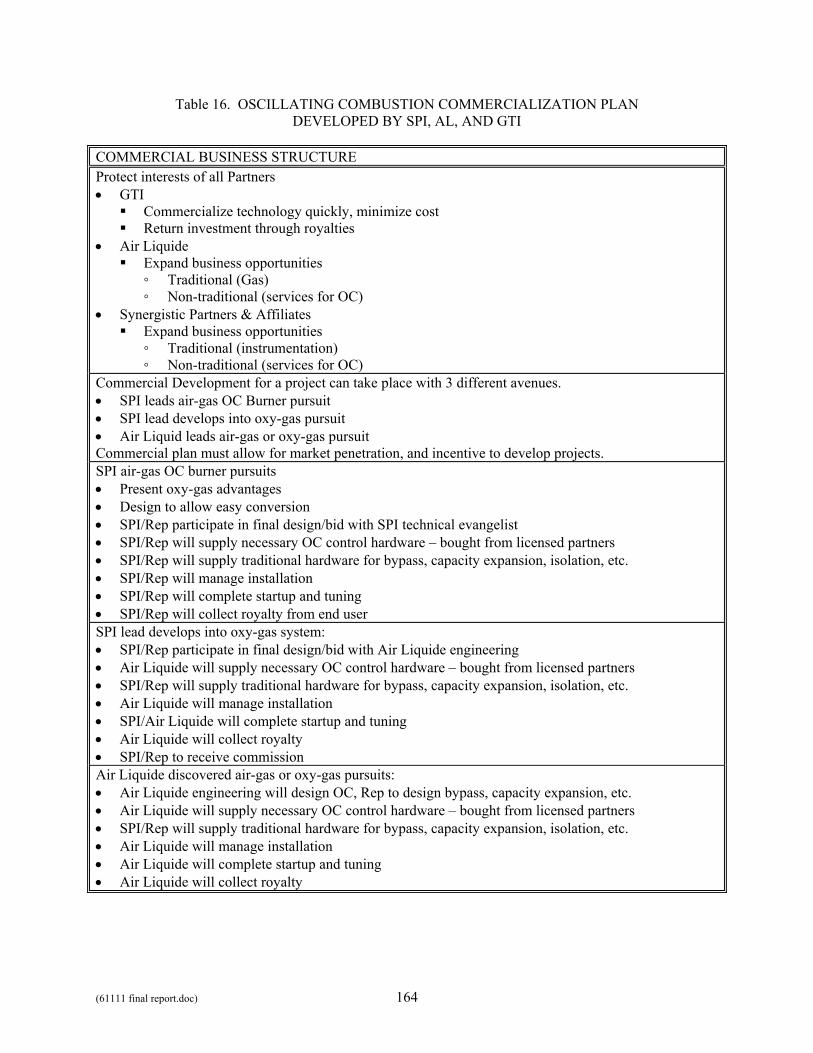
(61111 final report.doc) 164
Table 16. OSCILLATING COMBUSTION COMMERCIALIZATION PLAN DEVELOPED BY SPI, AL, AND GTI
COMMERCIAL BUSINESS STRUCTURE Protect interests of all Partners • GTI
Commercialize technology quickly, minimize cost Return investment through royalties
• Air Liquide Expand business opportunities
◦ Traditional (Gas) ◦ Non-traditional (services for OC)
• Synergistic Partners & Affiliates Expand business opportunities
◦ Traditional (instrumentation) ◦ Non-traditional (services for OC)
Commercial Development for a project can take place with 3 different avenues. • SPI leads air-gas OC Burner pursuit • SPI lead develops into oxy-gas pursuit • Air Liquid leads air-gas or oxy-gas pursuit Commercial plan must allow for market penetration, and incentive to develop projects. SPI air-gas OC burner pursuits • Present oxy-gas advantages • Design to allow easy conversion • SPI/Rep participate in final design/bid with SPI technical evangelist • SPI/Rep will supply necessary OC control hardware – bought from licensed partners • SPI/Rep will supply traditional hardware for bypass, capacity expansion, isolation, etc. • SPI/Rep will manage installation • SPI/Rep will complete startup and tuning • SPI/Rep will collect royalty from end user SPI lead develops into oxy-gas system: • SPI/Rep participate in final design/bid with Air Liquide engineering • Air Liquide will supply necessary OC control hardware – bought from licensed partners • SPI/Rep will supply traditional hardware for bypass, capacity expansion, isolation, etc. • Air Liquide will manage installation • SPI/Air Liquide will complete startup and tuning • Air Liquide will collect royalty • SPI/Rep to receive commission Air Liquide discovered air-gas or oxy-gas pursuits: • Air Liquide engineering will design OC, Rep to design bypass, capacity expansion, etc. • Air Liquide will supply necessary OC control hardware – bought from licensed partners • SPI/Rep will supply traditional hardware for bypass, capacity expansion, isolation, etc. • Air Liquide will manage installation • Air Liquide will complete startup and tuning • Air Liquide will collect royalty
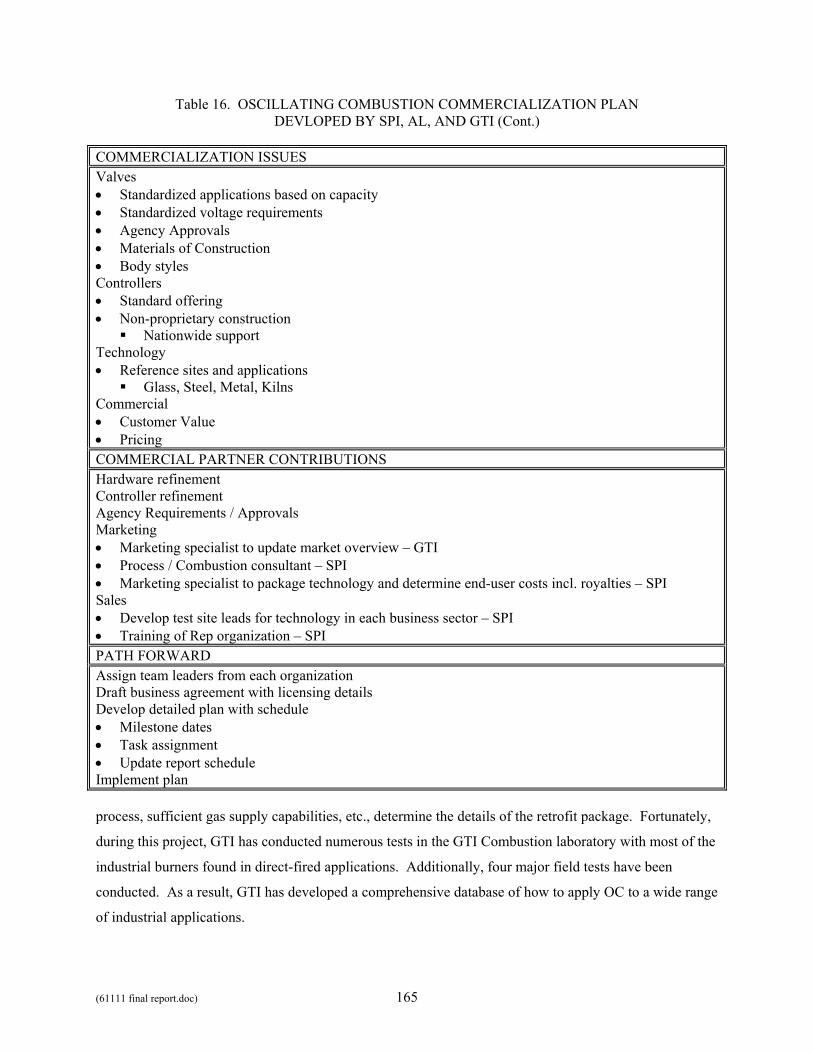
(61111 final report.doc) 165
Table 16. OSCILLATING COMBUSTION COMMERCIALIZATION PLAN DEVLOPED BY SPI, AL, AND GTI (Cont.)
COMMERCIALIZATION ISSUES Valves • Standardized applications based on capacity • Standardized voltage requirements • Agency Approvals • Materials of Construction • Body styles Controllers • Standard offering • Non-proprietary construction
Nationwide support Technology • Reference sites and applications
Glass, Steel, Metal, Kilns Commercial • Customer Value • Pricing COMMERCIAL PARTNER CONTRIBUTIONS Hardware refinement Controller refinement Agency Requirements / Approvals Marketing • Marketing specialist to update market overview – GTI • Process / Combustion consultant – SPI • Marketing specialist to package technology and determine end-user costs incl. royalties – SPI Sales • Develop test site leads for technology in each business sector – SPI • Training of Rep organization – SPI PATH FORWARD Assign team leaders from each organization Draft business agreement with licensing details Develop detailed plan with schedule • Milestone dates • Task assignment • Update report schedule Implement plan process, sufficient gas supply capabilities, etc., determine the details of the retrofit package. Fortunately,
during this project, GTI has conducted numerous tests in the GTI Combustion laboratory with most of the
industrial burners found in direct-fired applications. Additionally, four major field tests have been
conducted. As a result, GTI has developed a comprehensive database of how to apply OC to a wide range
of industrial applications.
(61111 final report.doc) 166
RECOMMENDATIONS
Recommendations are suggested here for both the oscillating combustion process and its
associated hardware.
Oscillating Combustion Process
In two of the field tests, there was insufficient control of the air-fuel ratio during normal
operation, and this limited the effectiveness of oscillating combustion. For best performance of
oscillating combustion in terms of percentage NOx emission reduction, a furnace should be operated with
a constant, low excess air level. This is usually also the most thermally efficient means of operation.
Essentially, good control of the air-fuel ratio is necessary for the successful implementation of oscillating
combustion. Two types of strategies have been formulated to address this issue. The first type involves
modifying the air-fuel ratio control system of the furnace, and applies where there is a need or tendency to
operate the furnace with high levels of excess air at times. The second type involves modifying the
oscillating combustion system, and applies where there is a need or tendency to operate the furnace with
very low to no excess air.
The first type of air-fuel ratio strategy is for facilities that might need a varying excess air level
(such as for a large turndown of the firing rate or for increasing convective flow within the furnace), a
number of air-fuel ratio strategies can be utilized that will minimize the amount of time the excess air
level is at less than favorable conditions for oscillating combustion.
For the large turndown case, one strategy would be to have the burner firing rate modulated at
constant air-fuel ratio down to the burners’ turndown limit, and, below that point, have the burners cycled
on and off (also called pulse firing). For furnaces with a relatively consistent load, a constant, low excess
air level can be readily achieved with little to no on-off burner cycling.
For the increased convection case, one strategy would be to have an air-fuel ratio subsystem that
can have a constant or slowly varying excess air level (by modulating both fuel and air) at high and mid
firing rates and a more quickly varying excess air level (by modulating only gas) or on-off operation at
low firing rates. This will allow the furnace to spend most of its time at low excess air levels. An air-fuel
ratio subsystem of this complexity would probably require direct control of both the air and fuel flow
rates without slaving them together, or it would be composed of two separate air-fuel ratio sub-
subsystems, one for higher firing rates and one for lower firing rates, and an automated switching means.
The second type of air-fuel ratio strategy is for furnaces that run with low to very low levels of
excess air and, at times, no excess air. For this type of strategy, called OCTrim, an oxygen sensor would
be installed in the exhaust of the furnace. The signal from this sensor, or a transformed version of it,
(61111 final report.doc) 167
would be fed into the oscillating valve control system. The software in the oscillating valve control
system would be modified to use this signal to determine which amplitude the oscillating valves should
run at. For moderate to low levels of excess air, the oscillating valves would run at their full amplitude,
providing the maximum NOx emissions reduction. For low to very low levels of excess air, the
oscillating valves would run at a lesser amplitude. This would provide some NOx emissions reduction
while avoiding the potential to generate excessive amounts of CO emissions or produce smoke. For the
infrequent occasions where there is a very low level of excess air or no excess air, the oscillating valves
would not run, since excessive CO emissions and smoke is almost unavoidable. The net effort would be
to produce a NOx emissions reduction greater than leaving the oscillating valve control system run
continuously at the lesser amplitude.
Oscillating Combustion Hardware
Recommendations for the SSP oscillating valve include increasing the capacity for a wider range
of applications, providing position feedback for positive indication of the actual oscillation amplitude,
industrializing the construction, and providing optional default positions upon power loss.
Recommendations for the SSP oscillating valve controller include improving the user-friendliness, using
standard voltages (24 or 48 VDC), and using standard process control hardware to drive the valves.
Recommendations for the Cyclic oscillating valve include providing the same flow testing and
programming enhancements for the larger Cyclic valves as was done with the smaller Cyclic valves, and
performing additional flow testing to find valve positions corresponding to additional oscillation
amplitudes. Recommendations for the Cyclic oscillating valve controller include improving the user-
friendliness, providing for additional fixed oscillation amplitudes, and providing an wide range of
oscillation amplitudes by interpolating between the fixed amplitudes.
For both oscillating valves, a means of cooling should be devised for applications where ambient
temperatures can regularly exceed 140°F.
Other Recommendations
The modeling effort should be completed and validated with the results of the field testing.
Additional spare parts, including valves and power supplies, should be provided to host sites for
continued, long-term operation.
The oscillating combustion technology should be transferred to the host sites’ parent companies
through a license agreement so that it can be applied at other facilities with the companies as commercial
applications as opposed to research projects.
(61111 final report.doc) 168
ACKNOWLEDGMENTS
GTI wishes to thank the following for their contributions to this project: Mr. Harley Borders, Mr.
Benjamin Bugeat, Mr. Olivier Charon, Mr. Eric Duchateau, Mr. Roman Grosman, Mr. Jean-Yves Iatrides,
Dr. Michael Joshi, Dr. Ovidiu Marin, Mr. Kenneth Mulderink, Mr. Bob Oesterreich, Mr. Erwin Penfornis,
Dr. Louis Phillipe, Mr. Philippe Queille, Dr. Roberto Ruiz, and Mr. Xavier Vigor of Air Liquide for their
in-kind support of the project; Mr. Jerome Hess, Mr. Norm Hodgson, Mr. Randy Jesch, and Mr. Tony
Martocci, of Bethlehem Steel (now ISG) for providing a field test furnace; Mr. Harry Finke of Bloom
Engineering Co., Inc. for providing a laboratory test burner; Mr. David Price of Buckeye Energy
Technology Applications for bringing together the oscillating combustion team and its sponsors; Ms.
Annmarie Mora and Mr. Richard Vincent of the California Air Resources Board for project cofunding;
Mr. Wayne Arnez, Dr. Fred Clark, and Dr. William Lawless of CeramPhysics, Inc. for SSP valve
development; Dr. Charles Hong (now at Energy Optima), Mr. William Morse, Mr. Robert Scott, Mr.
Tony Sutor, and Mr. David White of Columbia Energy Group-Energy Consulting Services for project
cofunding; David Collier of Eclipse Combustion, Inc. for providing a laboratory test burner; Dr. Charles
Hong of Energy Optima for project guidance; Mr. Garrick Maenle of Garrock Electronic Engineering
Services for controller development; Mr. Isaac Chan (now at DOE-ITP), Mr. Leslie Donaldson, Mr.
Richard Petrich, and Mr. Steve Sikirica (now at GTI) of the Gas Research Institute for project cofunding;
Mr. Edward Gasior, Mr. Peter Golobic, and Mr. Rob Rainford of Gas Technology Canada for project
cofunding; Mr. Alan Forsythe of GT Development Company for of the Cyclic valve development; Mr.
Pat Amsden, Mr. Donny Timms, Mr. Tom Kimberly, and Mr. Everett Wollitz of Johns Manville for
providing a field test furnace; Mr. George Paulonis of Kromschroder Inc. for providing a laboratory test
burner; Mr. Thomas Neville and Mr. Tom Robertson of the North American Manufacturing Company for
providing a laboratory test burner; Mr. Doug Adams and Mr. Doug Jones of Nucor Steel; Mr. Chris
Fleskes, Gary Graham Mr. Richard Morrisson and Mr. Bret Warrick of Outsource Tech Inc. for Cyclic
valve development; Ms. Susan Davis, Mr. Brad Markus, and Mr. Rick Saeed of Questar Gas for project
cofunding; Mr. Steve Makepeace and Mr. Peter Nash of Shultz Steel Company for providing a field test
furnace; Mr. Henry Mak and Mr. Cherif Youssef of Southern California Gas Co. for project cofunding;
Mr. Ben Breen; Mr. Larry Cates; Mr. Bob Schrecengost; Mr. Phil Szajnuk of Synergistic Parters, Inc.-
Breen Energy Solutions; Dr. Debo Aichbhaumik, Mr. Glenn Doyle, Mr. Simon Friedrich ,Dr. Robert
Gemmer, Mr. Isaac Chan, Mr. Joseph Mavec, Mr. Scott Richlen, Mr. Robert Trimberger, and Mr. Gideon
Varga of the U.S. Department of Energy-Office of Industrial Technologies for project cofunding; Mr.
Gordon Dickinson of Zedtec Combustion System, Inc. for providing a laboratory test burner; Mr. Richard
Biljetina, Mr. Vincent Fiore, and Mr. Ron Snedic of the GTI Sustaining Membership Program for project
cofunding; Mr. Hamid Abbasi, Dr. Jacque Binge, Mr. Matthew Fayerman, Mr. Kurt Johnson, Mr. Kevin

(61111 final report.doc) 169
Kawulia, Mr. Ken Kozlar, Dr. Aleksandr Kozlov, Mr. Walter Kunc, Mr. Harry Kurek, Ms. Olga Loo, Mr.
Jeff Mainzer, Mr. Brian Masterson, Mr. Doug Medynskyj, Dr. Serguei Nester, Mr. Dave Parham, Mr.
Lester Sherrow, Mr. Steve Sikirica, Mr. Vasilios Soupos, and Mr. Brian Zellmer of the Gas Technology
Institute for technical support.
(61111 final report.doc) 170
GLOSSARY
AL Air Liquide
Amplitude Relative change in gas flow rate during the oscillation cycle above or below the average flow rate; Unit is %; 0% is for no oscillations; 100% is for oscillating between zero flow and double the average flow.
BCF Billion Cubic Feet (of natural gas)
BCZs Bottom Charge Zones
BSC Bethlehem Steel Corporation (now ISG)
CARB California Air Resources Board
CO Carbon Monoxide
CO2 Carbon Dioxide
CPI CeramPhysics, Inc.
DOE-OIT U.S. Department of Energy - Office of Industrial Technologies
Duty Cycle Fraction of time the gas flow rate is above the average flow rate during each oscillating cycle; Unit is %; 50% is for equal time above and below the average flow.
Frequency Number of oscillation cycles per unit time; unit is Hz; ∞ Hz (not 0 Hz) is used to denote steady (non-oscillating) operation.
GRI Gas Research Institute
GTDC GT Development Corporation
GTI Gas Technology Institute
HLC Garrock High-Low controller
IGT Institute of Gas Technology
in wc inches water column
ISG International Steel Group Inc.
kWh Kilowatt-hour
MMBtu 1,000,000 Btu
NG Natural Gas
NOx Nitric Oxide (NO) plus Nitrogen Dioxide (NO2)
O2 Oxygen
OC or Osc Oscillating Combustion
PC Personal Computer
Phasing Between Burners Relative offset in time between the start of oscillating cycles for different burners; Unit is ° (deg.); 0° is for in-phase oscillations; 180° is for completely out-of-phase oscillations.
PID Proportional plus Integral plus Derivative (a process control method)
(61111 final report.doc) 171
ppm Parts Per Million (by volume for gases, by weight for liquids or solids)
ppmv Part Per Million by Volume
S.R Stoichiometric Ratio (Oxygen/NG)
SCF/h Standard Cubic Feet per Hour
SMP GTI Sustaining Membership Program
SPI Synergistic Partners, Inc.
SSP Solid-State Proportioning
THC Total Hydrocarbon
TPF Time Proportional Firing
(61111 final report.doc) 172
REFERENCES
1. Abbasi, Hamid A., Development of a NOx Control Technique by Oscillating Fuel Flow, Final Report
for Project 20287, Institute of Gas Technology, September 1987.
2. Charon, O., Jouvaud, D., and Genies, B., “Pulsated O2 / Fuel Flame as a New Technique for Low
NOx Emission,” Combustion Science and Tech., 1993, Vol. 90, pp. 1-12.
3. Drogue, S., Breininger, S., and Ruiz, R., “Minimization of NOx Emissions With Improved Oxy-Fuel
Combustion: Controlled Pulsated Combustion,” 54th Conference on Glass Problems, Oct. 26, 1993.
4. Wagner, John C., Proof-of-Concept Testing of the CeramPhysics Valve for Oscillating Combustion
(Phase I/II), Final Report for Project 40357/80031, Institute of Gas Technology, June 1998.
5. Wagner, John C., and Zelepouga, Serguei, NOx Reduction by Oscillating Combustion—SSP Valve
Development, Final Report for Project 40357-03, Institute of Gas Technology, June 2000.
6. Joshi, M.L., and Borders, H, NOx Emissions Reduction by Oscillating Combustion, Final Report for
IGT Subcontract S1-62981, American Air Liquide, January, 1999.
7. Wagner, John C., Development of a Solid-State Proportioning Valve for Control of Natural Gas,
Phase IV, Final Report for Project 40367, Institute of Gas Technology, March 1997.
8. Joshi, M., Borders, H., Legiret , T., Zucchelli, P., and Charon, O., “Optimum Oxy-Fuel Melter
Performance: Oscillating Combustion”, Presented at XVI ATIV Conference, Parma, Italy, September
29, 2000.
9. Proof-of-Concept Testing of the CeramPhysics Valve for Oscillating Combustion, Final Report for
IGT Subcontract S1-51688, American Air Liquide, 1997.
10. Wagner, John C., Demonstration of Oscillating Combustion on a High Temperature Forging Furnace,
Final Report for Project 40444, Gas Technology Institute, August 2001.
11. Gas Technology Institute, Results of Emissions Testing on a Reheat Furnace Operating with
Oscillating Combustion, GTI Project No. 61111-02, January 2004.
Related Documents