6.111 FINAL PROJECT MUSIC VISUALIZER Abstract This paper discusses the creation of a music visualization system, from planning to design, implementation, testing, and debugging. Working in a team of three, we each took control of a part of our project, and all worked to put the parts together to form the visualization system, which used the Verilog hardware description language. Our target was to create a system which could take in audio from a headphone jack and output a visualization of the audio, similar to ones seen in Winamp or Windows Media Player, to a television through an RCA connector. Building the visualizer as a team was a very valuable learning experience, illuminating many aspects of hardware design and planning.

Welcome message from author
This document is posted to help you gain knowledge. Please leave a comment to let me know what you think about it! Share it to your friends and learn new things together.
Transcript

��������������������� ������ � ��
6.111 FINAL PROJECT MUSIC VISUALIZER
Abstract This paper discusses the creation of a music visualization system, from planning to design, implementation, testing, and debugging. Working in a team of three, we each took control of a part of our project, and all worked to put the parts together to form the visualization system, which used the Verilog hardware description language. Our target was to create a system which could take in audio from a headphone jack and output a visualization of the audio, similar to ones seen in Winamp or Windows Media Player, to a television through an RCA connector. Building the visualizer as a team was a very valuable learning experience, illuminating many aspects of hardware design and planning.
��������������
��� �� ���
�����������

Table of Contents Abstract ............................................................................................................................... 1 Table of Contents................................................................................................................ 2 Table of Figures .................................................................................................................. 3 Introduction......................................................................................................................... 4 Description.......................................................................................................................... 4
The Analog Audio Processing Layer (Bradley Edwards)................................................ 5 Audio (Lab 3) Module ................................................................................................ 5 Recorder Module ........................................................................................................ 6 Bucketizer Module...................................................................................................... 7 Multiplier Module....................................................................................................... 7
The Visualizer Layer (Stephen Oney) ............................................................................. 8 Information Distribution Module................................................................................ 8 Address Module .......................................................................................................... 9 Visualization Selection Module.................................................................................. 9 The “Doer” Module .................................................................................................... 9 The Bar Visualization ................................................................................................. 9 The Diagonal Bar Visualization.................................................................................. 9 The “Radial” Visualization ....................................................................................... 10 The Intersecting Circles Visualization...................................................................... 10 The Visualizer Module ............................................................................................. 11
The Video Output Layer (Aston Motes)........................................................................ 11 Dual-Port RAM Module ........................................................................................... 11 RGB to YCrCb Module ............................................................................................ 11 Signal Generator/DAC Control................................................................................. 12 Horizontal and Vertical Position to RAM Address Module..................................... 14 Equalizer Module...................................................................................................... 14 PS/2 ASCII Input Module......................................................................................... 15 Bucket Generator Module......................................................................................... 15
Testing and Debugging ..................................................................................................... 15 Conclusion ........................................................................................................................ 17 Appendix – Source Code to Selected Modules................................................................. 19
Adv7194init.v ................................................................................................................ 19 Avtest.v .......................................................................................................................... 27 Equalizer.v ..................................................................................................................... 38 Gen_buckets.v................................................................................................................ 43
Ps2_kbd.v.......................................................................................................................... 45 Video.v........................................................................................................................... 49 Visualizer.v .................................................................................................................... 56 Audio (Lab 3.v) – included in Avtest.v ......................................................................... 70 Recorder. v ..................................................................................................................... 70 Bucketizer. v .................................................................................................................. 74 Multiplier.v .................................................................................................................... 76 Timing Diagram for 1024-pt FFT.................................................................................. 77

Table of Figures Figure 1 - The Audio Processing Layer .............................................................................. 5 Figure 2 - Schematic Symbol.............................................................................................. 7 Figure 3 - The Visualizer Layer.......................................................................................... 8 Figure 4 - The Video Output Layer .................................................................................. 11 Figure 5 - Digital Conversion Formulas ........................................................................... 12 Figure 6 - Actual Conversion Formulas............................................................................ 12 Figure 7 - Timing Mode 0, Slave Mode Timing Diagram................................................ 13
Introduction Our final project was to create an Audio Visualization System (AVS) using Verilog. The idea of the AVS is to allow a user to carry it around and to be able to, given any music source, such as an iPod, be able to plug one end into the headphone jack and the other into a television set, in order that the music can be heard and visualized on the television set. A secondary goal of this project was to create an equalizer system that the user could interface with, so that the user could change the sound quality of the music to add, for example, more bass or treble. The basic method of this was that we would take in the audio data, digitize it, place it in a set of buckets based upon the distribution of frequencies, create a visualization based on that, and then feed that data to the television. We would also take those buckets and modify the sound of certain buckets, and convert the data back into audio, so that we could control the sound.
Description The AVS is composed of three major parts to achieve its functionality: The analog audio processing front end, the digital frequency data processing and visualization production middle layer and the video output and equalization interface final stage. The analog audio processing section of the system is responsible for both input and output of audio data. On the input side, the first portion of the system does the processing of the analog audio that comes in from the microphone jack, transforming it into frequency- (rather than time-) domain representation via a Fast Fourier Transform, and then aggregating the data points of the transformed data into so-called buckets for the visualizer to use. The output of audio processing block, based on the equalizer coefficients sent back from the equalization interface (see below), modifies the frequency domain characterization of the audio signal, then sends these new frequency data points through an Inverse Fast Fourier Transform to create audio output with frequency outputs modified from the audio input as chosen by the user. The visualizer layer takes the buckets computed by the audio processing block and is responsible for turning these into images to be displayed on the television. A number of different and visually interesting visualizations are created within this block, basing the size, location, color, and velocity of on-screen objects on the magnitudes and rates of change for buckets of the various frequencies. All of these visualizations run in parallel, allowing them to also be combined in interesting ways. While computations are done on the buckets, the visualizer block is also writing pixel data in RGB format to a dual-port RAM which is used for communication and information storage between the visualization block and the output block. The video output block reads RGB pixel data back out of the dual-port RAM continuously in order to display information to the screen. Because the digital-to-analog converter which creates composite video output requires color data in YCrCb format, this color conversion is also done out of the RAM and before going into the DAC. In

addition, this block involved on-screen controls for an equalizer. In order to display bucket bars for the user to manipulate for equalization, another stage comes before the DAC, overlaying the equalizer when desired on top of the normal YCrCb output when it’s enabled. This interface is then controlled by a PS/2 keyboard which allows selection of a bucket, the ability to increase and decrease the magnitude of its expression, and then the confirmation of the configuration to be applied in the audio output stage.
The Analog Audio Processing Layer (Bradley Edwards) All of the analog signal processing occurs in the front end of the AVS, and it is done in three stages. An A/D conversion happens via the AC97 audio chip on the 6.111 labkit, which is followed by the use of the FFT to create the frequency response of the signal, and lastly this is followed by a frequency data accumulator which we have labeled a bucketizer. Ideally, even though we did not get a chance to implement it, a loop is created to run the sound back out through the AC97 chip. After providing the frequency data, the discrete signal would pass through an equalizer created by a GUI, after which the signal would be multiplied by the coefficients corresponding to the appropriate index. Then, the signal would pass through an IFFT followed by a low-pass filter before it got sent back to the AC97 audio out line.
Figure 1 - The Audio Processing Layer
Audio (Lab 3) Module Used as a framework for the handling of the audio signals, the lab 3 setup provides us with a black box interface to the AC97 audio chip. This module takes in data from the microphone jack on the 6.111 lab kit and provides us with an 8-bit sampled output (although the chip could go as high as 18-bit output). A handshaking-pin called the ready signal also comes out, letting us know when there is valid data to be had from the audio

chip. The ready signal goes high every 48kHz and this frequency becomes sampling frequency that is very important for calculations later on. In addition to a sampled output, this module also provides the avenue to run the sound back out to the headphones jack on the labkit, and a sample 20-bit 750hz sine wave to test that the chip is operating properly. Finally, embedded with in this module is the recorder module which serves as the control for the signals coming in and out of the AC97 black box.
Recorder Module Initially instantiated through lab 3, this module, which was created to hold on to data in the original lab, is the main workhorse of the front-end audio processing for our AVS. Aside from the new functionality that we put into the module, the module still has the property of deciding which value we feed to the AC97 output through the use of the enter button on the labkit: not pressed allows the user to hear the test sine wave while ideally, pressing the enter button would have allowed the user to hear the data after it came from the equalizer. The new functionality of the recorder comes from the addition and creation of the Fast Fourier Transform (FFT). In general, the Fourier transform provides the frequency analysis of a given signal. The FFT we used is a 1024-pt FFT which takes in 8-bit real and imaginary data. This means that when the FFT receives 1024 samples of 8-bit data, it will begin processing immediately. Given that we are receiving real signals from the AC97, we made the imaginary input to the FFT zero. Because we chose not to use the scaling option given to us by the IP CoreGenerator, we were provided with 19-bit signed real and imaginary output. Another important aspect of the FFT is the associate architecture of processing the given signal. We decided on the streaming, pipelined architecture (2-stage pipeline), but that required that we have data at every clock cycle. Although we are running on a 27MHz system clock, the use of the clock enable allows us to circumvent this potential problem. We tied the clock enable signal to the ready signal from the audio chip so that the FFT is directly tied to the AC97 data, and the FFT only takes in values when there is valid data to be had. The upshot to using the IP Core to create this FFT is that once we knew that the forward core was operating properly, we only had to change one signal to instantiate an inverse Fourier transform. Figure 1 shows a concrete representation of the FFT and its numerous control signals. Showing inputs on the left; outputs on the right. (Note: not every signal was used or asserted due to our particular architecture, see Appendix A for a timing diagram of our specific architecture)

Figure 2 - Schematic Symbol
Also, included in the recorder module is the code for a low pass filter. Note: This is a derivative of Ike Chuang’s code for filtering a DDS module. The module is built using the IP CoreGenerator, but the .coe file used for the filter was created directly from his coefficients. Although this was not implemented within the entire system, as regenerating the sound for the IFFT proved quite challenging, this is the filter that the real output of the IFFT would have passed through before reaching the AC97 chip. The IP Core that is used is a Distributed Arithmetic FIR.
Bucketizer Module Both the real and imaginary output of the FFT become fed into this module. So as not to get bogged down with long calculations, we only take the top 8 bits of the real and imaginary signals coming in. The job of the bucketizer is to evenly divide the 1024 samples coming out of the FFT into 8 buckets and send out the corresponding index. This is accomplished by sending the square of the magnitude into each bucket then taking the average. Using signed multipliers (generated using the IP Core) to square the 8-bit real and imaginary parts, we then add the values of the same index together to get the magnitude of a particular index. We use a temporary magnitude variable to accumulate the 128 samples (1024 samples / 8 buckets) of each bucket and then shift the value down by 7 (>> 7 = divide by 128) and update the bucket magnitude variable and the bucket index which the visualization layer uses and processes.
Multiplier Module This equalizer helper module acts as a processing/handshaking device between the GUI and the IFFT before the sound gets passed back through the AC97. Just like the bucketizer, this only takes the top 8-bits of the real and imaginary outputs of the FFT and the respective index. Functionality of the multiplier includes acquiring the appropriate coefficient by which to multiply a particular signal. The multiplier gets these 8-bit

coefficients from the equalizer module, given a particular index provided by the index from the FFT. Again, for simplification of the calculations, we’ve used signed multipliers that multiply 8-bit by 8-bit numbers and return the 17-bit output to the IFFT.
The Visualizer Layer (Stephen Oney) The visualizer layer contains modules that do the work of taking in the buckets, creating visualizations based upon the data coming from the buckets, and then outputting this data to the video output layer, deciding when and where to write the data into the RAM in this layer, which is discussed in the next section.
Figure 3 - The Visualizer Layer
Information Distribution Module The role of the information distribution module is to take in the bucket data, which is sent bucket by bucket from the audio processing layer, and to output the latest value averaged

with the value before it, to avoid misleading spikes or depressions in bucket averages that might happen for only one or two cycles. It does its job by using two sets of registers, each 16 bits wide – one set representing the values that are output and one temporarily storing the raw value of the latest updated bucket. Whenever a new value is available during a clock cycle, that value is stored in the temporary register. Whenever the video output layer reports that a frame is done during a clock cycle, we take the average of the value that is currently being outputted and the new value which we had stored, and make that the outputted value. We only do this upon getting a signal saying that the frame is done writing so that we don’t get values which change mid-screen write, resulting in flickering visualizations.
Address Module The address module is a very simple module, mainly present for modularity. It is to convert the row and column of some location on the screen into an address for the RAM. The address conversion is discussed below, in the notes for the video output layer, so the actual formula will not be discussed here.
Visualization Selection Module The visualization selection module allows users to select between multiple visualizations. Its inputs are the data of all of the running visualizations, and its output is the visualization selected by a set of two selection bits.
The “Doer” Module The purpose of the “doer” module is to determine where in the RAM we should write. We want to make sure we never write to a location that is being used by the video output layer. Thus, we look at the current vcount and set the row we write to be the vcount divided by 2, whenever we know that the video output layer just finished writing to that row. The doer module must also enable writing at the right time only, so it only has write enable (we) set high when the column is less than 360 (meaning we are on screen) or we started a new row. This ensures we don’t write to a memory location that represents something that is off-screen.
The Bar Visualization The Bar visualization is the simplest and most direct visualization. It simply has parameters for the X and Y coordinates of the bottom left part of the rectangle, another for the width, and one for the color of the rectangle. It takes as a parameter the height of the bar and simply checks to see if the current pixel whose value we are working with is within the rectangle. If it is, then it draws whatever color we specified with the parameter (the default is blue). Otherwise, it will draw a black pixel for the background. To form the complete visualization, the outputs from each module for the bars are ORed together.
The Diagonal Bar Visualization The Diagonal Bar Visualization has two parts – one part is the diagonal bars, and the other is moving balls. The module for diagonal bars takes in as parameters the X and Y

locations for the center of the bar, and the width of the bar and the color of the bar. The module then forms a thick line segment based on the formula: hcount+vcount = X + Y Where X and Y represents the center point of the line. It then limits it to a circle whose radius is the height of the bar, around the pixel with position (X, Y). The way the diagonal bars are shown, however, is such that only one side of the line segment is shown on the screen. Thus, they look more like diagonal bars. The ball component of the visualization has two parts. The first, simple part is the ball module, which simply draws a ball centered at some given coordinates. The second part is the physics module, which approximates what the physics of a ball falling would be like. It does this with the help of the “divider” module, which fires at 100Hz. The physics module keeps track of the x and y coordinates and velocities of the ball, updating the y velocity in accordance with the acceleration, and both the x and y coordinates in accordance with their velocities. The balls are set to move with the bars until the bar goes above a certain threshold, at which point the bar “lets go” of the ball, and the physics takes effect. The idea of this visualization is to make it seem as if the diagonal bars are shooting off the balls, which eventually fall. All of the pixels from these modules are ORed together to form the complete visualization.
The “Radial” Visualization The idea of the “radial” visualization is to display the magnitude of each of the buckets with an area heading radially outward from the center of the screen. This is done with a module for each area. Each module first checks to see if any given pixel is within an appropriate radius of the center (that appropriate radius is the magnitude of the bucket. It then checks to make sure that it is in the right range of angles. If both of these criteria are met, it returns a pixels whose color is specified by a parameter to the module. If not, it outputs a white pixel. These pixels are ANDed together to form the whole visualization.
The Intersecting Circles Visualization The point of the intersecting circles visualization is to create a circle for each bucket which looks like a transparent lens, so that the circles for the buckets can intersect, making it look like the user is looking through two lenses. The intersecting circles visualization is made up of a component which first checks to see if any given pixel is on the border of a circle whose radius is the magnitude of the given bucket centered at some X and Y given by the parameters to the module. If it is, then it sets that pixel to the color specified by the Color parameter. Then, it checks to see if that pixel is within the border. If it is, then it returns the color specified by the Color parameter ANDed with 16'b0111101111101111, which makes the pixel a lighter form of the color. The output from this module on every bucket is ANDed together.

The Visualizer Module The visualizer module brings together all of the visualizations that are discussed above and outputs them simultaneously, with the logic mentioned above.
The Video Output Layer (Aston Motes) The video front end is composed of a few modules which do the work of translating from a RAM representation of the television screen to an output signal suitable for viewing on any composite-video compatible video device. In addition, an equalizer block with a couple sub-systems is a part of this user facing sub-section.
Figure 4 - The Video Output Layer
Dual-Port RAM Module The RAM used here is a BRAM created on the lab kit with a 16-bit depth (for 16-bit RGB) and exactly enough locations for representing the approximately 720x446 pixel screen image at half resolution in both dimensions (360x243). One of the ports for the RAM is write-only, allowing the visualization system to store the pixel data for the output stage, and the other port is read-only for reading out from the memory and display the data to the screen.
RGB to YCrCb Module The data format being used in our system for color representation in the RAM is 16-bit RGB split 5:6:5—that is, 5 bits reserved for expressing the degree of red, 6 bits for the degree of green, and 5 bits for the degree of blue. The human eye is more sensitive to green than the other colors, thus the (commonly used) increased number of bits expression for green. RGB was chosen as the output of the visualization system due to its familiarity and linear behavior.

The expected data format for the ADV7194 DAC is an alternating stream of Y, Cr, and Cb data points in a 10-bit unsigned integer format (a more typical expression of YCrCb color is 8 bits for each color dimension, using an unsigned integer for the Y dimension and signed integers. Given these changes, the traditional 24-bit RGB (8-bits for each dimension) to 24-bit YCrCb was modified to move the results into the positive range for all three dimensions of the YCrCb space and to fill up the full 10-bit precision. The coefficients for color conversion were chosen to closely match the ITU-R BT.601/CCIR 601 color standard, however in order to avoid the computation-costly operations of either division or multiplication by floating point numbers, constant integer multiplication and bit shifts were employed, providing a very good approximation to the real numbers. The formulas used are below, understanding X >> A to mean that quantity X is shifted down A bits, and X << A meaning a shift upwards:
Figure 5 - Digital Conversion Formulas
All of which approximate (with an up shift of two bits)
Figure 6 - Actual Conversion Formulas
Signal Generator/DAC Control Note: Much of the code in this module was written by Nathan Ickes. I modified and extended it to fit our purposes, however a substantial amount of the work done to overcome the technical difficulties in interfacing with the DAC were his work. The ADV7194 chip is first initialized with a number of values setting its mode of operation. While the chip has myriad options including selection of the filter for luminance values (Y of the YCrCb color space) and options for closed-captioning, there are only a few options that were crucial to be specified for our project to operate correctly. The first was selection of NTSC as the video standard (for American televisions—the chip also does PAL for other types of screens), and next square pixel mode, which requires a clock other than the board standard 27mhz was not used. 720 pixels were chosen for the active video line duration, and 10-bit ports were determined sufficient for our use. The typical interlaced display mode was chosen (that is, progressive scan mode disabled). All of these settings are initialized within Ickes’ i2c interface module, writing to the ADV7194’s MR mode registers.
2)12810)*579*579((
2)12810)*720*720((2)10)*117*601*306((
<<+>>−=<<+>>−=
<<>>++=
YRCb
YRCr
BGRY
128565.0*)(
128713.0*)(114.0*587.0*299.0
+−=+−=
++=
YBCb
YRCr
BGRY

The video mode selected is Mode 0 (CCIR-656): Slave Option by the nomenclature of the data sheet. Quoting from the data sheet, The ADV7194 is controlled by the SAV (Start Active Video) and EAV (End Active Video) Time Codes in the Pixel Data. All timing information is transmitted using a 4-byte synchronization pattern. A synchronization pattern is sent immediately before and after each line during active picture and retrace. These SAV and EAV codes which are sent (again, by the framework provided by Ickes) and the timing diagram showing the relationship between the data sent and the analog output is below:
Figure 7 - Timing Mode 0, Slave Mode Timing Diagram As shown at the far right of the timing diagram, the YCrCb data is sent in so-called 4:2:2 format, where the Y signals are interleaved and the Y signal is sent twice as often as the other two signals, and the 4 pieces of data make up a single colored pixel on the television. The YCrCb data is sent from the RGB to YCrCb (through the equalizer module, explained later) and on into the DAC when the timing is appropriate according to the above diagram. In addition to controlling the DAC, this module was also responsible for dispatching signals about the current location of the analog television trace back to the visualization system so as to ensure that full frames are pulled from the RAM before that data is overwritten by the new visualization frame. After each row is completed, a single-clock-width pulse signal row_done is sent back, as is the current row, and after the entire frame has been drawn, a pulse frame_done signal is dispatched. Because the television trace is interlaced, first the even rows and then the odd rows are drawn, so while row_dones are sent after every horizontal trace, frame_done is sent every two vertical traces of the screen (waiting until the entire frame is drawn). In addition, the horizontal position of the trace is available if this information is at all helpful. There are two approaches for writing to the RAM given these signals which seemed best for our project. The first is following the horizontal position and the vertical position,

writing a new pixel where a pixel was just read using code which knows based on those two variables which pixel should be placed. This method was used in order to fill the screen with solid colors for testing (more on this in the testing section). The second is to trigger the drawing code on every row_done, to fill in that row with appropriate pixels as the trace goes to the next row. This method was used in the final visualizations with good success. This module also passed the horizontal and vertical position through a conversion to get the memory address for the given pixel so that the output of the RAM is continually the correct location to be displayed on screen.
Horizontal and Vertical Position to RAM Address Module The formula to convert from an address to an address is fairly simply:
360*___ positionvpositionhaddressmemory += Due to its simplicity, while drawn as its own module on diagrams for clarity about the flow of information, in Verilog this type of conversion is done with less complication by simply assigning something similar to the above formula to an output wire for a bigger module like the signal generator, as was chosen in this case.
Equalizer Module The equalizer module is an upper-level module that handles all of the work of user input for equalization. The module’s final output is the YCrCb data to be sent to the screen and the values to use to modify individual buckets of frequencies in the audio processing sub-system. The module takes in the YCrCb data that are intended to be sent directly to the screen so that when the equalizer module is enabled, the bars that the user is to manipulate can be placed in an overlay on top of the currently running visualization, a more impressive effect than switching totally to a new display mode when a user wants to equalize their audio. Each bar is produced by a YCrCb Blob module which, given parameters about where it should be placed and its height as well as the requested pixel position either returns a color value or all zero’s for Y, Cr, and Cb. While this is actually a real color given some TV’s (some sort of green), having zeros is convenient for combining their output. Another feature of these bars was a signal which noted whether the bar was selected, changing its appearance to place a bright border around it to differentiate it from other bars. The EQ Bars drawing module instantiates 8 of these blobs to be drawn to screen, given the appropriate heights, and it returns their combined YCrCb data (all of the data is OR’d so that since blank = 0, non-blank colors are kept).

Then the Equalizer Module instantiates the EQ Bars, wiring the input heights to a temporary bank of coefficient values. These temporary values are modified as the user inputs left and right (for moving between buckets) and up and down (for raising and lowering the coefficient values), however they are not output from the module until the enter signal is sent, confirming that the user wants to cause their changes to go into effect. At this point, the data in the temporary registers is pushed into the output registers, and the module continues as before. The equalizer module’s left, right, up, down, and enter signals are, in our project, driven by PS/2 keyboard input.
PS/2 ASCII Input Module Note: This module was written by Chris Terman and Isaac Chaung The PS/2 keyboard module, after being connected to the keyboard port on the lab kit, pulls key data from the FIFO and processes the keys, converting key codes into their 8-bit ASCII character representation, allowing us to use most of the keys on the keyboard to drive our system. Following the tradition of keyboard driven computer games, the WASD configuration was mapped directly on to up, left, down, and right, exactly as would make sense given how they appear on a QWERTY keyboard. The enter key, as might be expected, is used to drive the enter signal. The keyboard’s built in repeat rate worked well for our purposes, moving nicely between buckets and up and down the bucket sizes appropriately.
Bucket Generator Module For an extended period of time, the project was not integrated well enough in order to test visualizations on screen using the planned processed audio input, so this small module was made in order to simulate data coming from the sound card with random-looking but pleasingly periodic input data which exercises the full range of output visualizations object sizes and looked prettier than real data. While not technically a functional part of the project, as part of the project is producing desirable visual stimulation, and this fits the bill.
Testing and Debugging In practice, audio processing has a lot of specifics which need to be met in order for things to work properly. While interfacing the audio chip with the FFT was a matter of connecting the ready signal to the clock enable, connecting the FFT to the IFFT was a clocking challenge which eventually did not get completed. Uncertainty about the IFFT functioning came in the picture, too. A created Fourier transform of a sine wave (one pulse in 1024 samples) was created to attempt to hear a sine wave from the AC97. Ultimately, white noise was the result. Another unexpected problem came while examining the bucketizer. While in theory (i.e. in testbenches) the bucketizer was exhibiting the proper functionality, observations from the logic analyzer proved differently. The problem was that the bucket index was updating when there was not any data going into the bucket; a consequence of the
sampling frequency or the ready signal from the AC97. To that end, a variable was created to examine whether or not it was appropriate to update the count for a particular bucket. The central difficulty in getting the video output working was the fairly confusing documentation which, in its vagueness about a number of very important and fundamental topics, delayed the production of a sub-system we thought could be completed fairly early on in the project. Had we not discovered Nathan Ickes’ code, the front-end project could have become a very long exercise in interfacing with a chip using the I2C interface, and we may not have even managed video output. That said, there were still details left omitted, the foremost of which was producing accurate colors on the screen. While the test code advertised that it was to display the MIT logo on screen, nothing this daring was approached, instead opting for an almost white box (with slight hue changes) on a green background. From this example, the color format was not at all clear, and the documentation made a passing mention to typical ranges of the YCrCb data (“Y typically has a range of 16 to 235, Cr and Cb typically have a range of 128+/–112; however, it is possible to input data from 1 to 254 on both Y, Cb, and Cr.”) but considering that the data ports being used were 10-bits rather than 8, it seemed unclear whether these numbers would still be appropriate. Hours were spent alternately trying known YCrCb data values for colors, maximizing and minimizing the ranges of the colors, and comparing what came out on screen to what might have been expected. Though simple colors seemed to be able to be forced out (like blue and red), when other colors (like white) were attempted, the output was not correct. At some point in this very lengthy process, however, I decided that perhaps the data for all of the colors was 10-bit and unsigned, attempted it, and was able to, for the first time, achieve a black screen for RGB input of all zeros. Having achieved this not-so-small feat, I was able to quickly discover that I had actually switched the values of Cr and Cb in the RGB conversion step through wiring the R, G and B inputs to lab kit switches and moving through in 3 bit color. The rest of the video output modules fell into place fairly nicely, at least compared to that difficult step. The equalizer was tested incrementally, first in its most atomic form as a simple modification on the normal blob, then after modifying the blob for output of bars with a passed in height, then ensuring that the output of the blob where it was not to appear was, indeed, zeroed out as desired. Then, the blobs were combined into equalizer bars and tested again, where a number of small bugs were found. Finally, the equalizer bars were placed in the top level equalizer module to be overlaid on the typical YCrCb data from the RAM. This, too, had some bugs in the logic, but they were ironed out without too much headache. Toggling the selected signal for the blobs highlighted or did not highlight the blobs as expected on the first try.

The next step was to work on the coefficient side of the equalizer, first making sure that given an enter input, data passed correctly from the temporary registers to the output registers by placing the output register data on the lab kit LED’s and sending the input from the on-board enter button into the module. Next was to create and test other button handling functionality, feeding in the on-board buttons and again keeping the output register data from a bucket on the LED’s. The task of making sure that the correct bucket was being modified was slightly tricky without a visual representation of what was happening, but by carefully counting button presses, the functionality was confirmed. After deciding both sides of the module worked, they were combined, giving at long last a visual representation of the buckets which seemed to work, but when played around with for a while revealed a decent oversight: One could reduce the size of the bar below zero, effectively causing the bar height to loop around again to the top. The visual and data storage aspects of the equalizer seemed to work after fixing the logic for this problem. While the keyboard input we ended up using was pretty much completely done (other than understanding the code) by Terman and Chaung, I attempted for a substantial amount of time to use the arrow keys on the keyboard rather than letters. After taking some time to get a sense of what was going on in the given code, I found I wasn’t successful attempting to add to the ASCII translation table, even having the key codes for the arrows translating to the same ASCII codes as the WASD keys being used. I was, however, successful in retrieving key codes from the arrow keys directly, though the output was somewhat unclean. Adding a bit of code similar to the ascii_ready signal gave clean registered key code output, but apparently the ascii_ready signal itself (or some portion of it) was never registered on the key press, and I was never in my many attempts able to get a signal like it from the module. Converting the registered key code signal to a pulse meant that repeated presses were impossible, and forcing the signal to reset periodically gave sporadic response to user presses. Though I never figured out exactly what differed between the arrow keys and the letters, it became evident as the project deadline approached that it might be best to compromise and simply go with what worked.
Conclusion The TV output ended up working nicely, and the equalization interface, while the data itself was not used, overlaid exactly as envisioned over the smooth running visualizations. Many of our concerns about small mis-syncs causing weird looking screen refreshes were successfully avoided through careful timing and signaling, and the color reproduction was quite good. If the project were to be redone or updated, one of the first changes that would be made in the equalizer would be figuring out how to use arrow keys rather than letters. Also, dimming the background visualization while the equalizer bars are present would have been a nice effect, though fairly different to pull off in YCrCb space, I eventually found

out. In fact, in retrospect, placing the equalizer module before the YCrCb conversion of the RGB data would have allowed a bit more control over things like that, as well as simplified the process of combining multiple images with an OR. Also, we were forced early to compromise on our goal of a full-resolution storage of a buffer due to space constraints on memory on the lab kit. Choosing a different type of memory may have led us to be able to have a higher resolution picture. In addition, the video output could have been enhanced significantly by a double-buffering scheme, writing to one memory while drawing from another, then after finishing the frame, using a few simple muxes to switch to their roles. More complex effects could have been achieved, perhaps by applying visual filters to the output or drawing in multiple layers on the same frame with the extra time gained by using the double-buffering scheme. As a last improvement to the video output system, adding more types of video output (S-Video, VGA) would have increased the compatibility of our project, in the event that we wanted to demo what we had but the target TV lacked composite input.
Appendix – Source Code to Selected Modules
Adv7194init.v // // Register 0 // `define CHROMA_FILTER_SELECT 3'h0 // 0: 1.3MHz low-pass // 1: 0.65MHz low-pass // 2: 1.0MHz low-pass // 3: 2.0MHz low-pass // 4: [Not valid] // 5: CIF // 6: QCIF // 7: 3.0MHz low-pass `define LUMA_FILTER_SELECT 3'h0 // 0: Low-pass (NTSC) // 1: Low-pass (PAL) // 2: Notch (NTSC) // 3: Notch (PAL) // 4: Extended mode // 5: CIF // 6: QCIF // 7: [Not valid] `define VIDEO_STANDARD_SELECT 2'h0 // 0: NTSC // 1: PAL (B, D, G, H, I) // 2: [Not valid] // 3: PAL (N) `define ADV7194_REGISTER_0 {`CHROMA_FILTER_SELECT, `LUMA_FILTER_SELECT, `VIDEO_STANDARD_SELECT} // // Register 1 // `define FOUR_TIMES_OVERSAMPLING 1'b1 `define DAC_A_ENABLE 1'b0 `define DAC_B_ENABLE 1'b0 `define DAC_C_ENABLE 1'b0 `define DAC_D_ENABLE 1'b1 // Composite video DAC `define DAC_E_ENABLE 1'b1 // S-video cluma DAC `define DAC_F_ENABLE 1'b1 // S-video chroma DAC `define ADV7194_REGISTER_1 {1'b0, `FOUR_TIMES_OVERSAMPLING, `DAC_A_ENABLE, `DAC_B_ENABLE, `DAC_C_ENABLE, `DAC_D_ENABLE, `DAC_E_ENABLE, `DAC_F_ENABLE} //
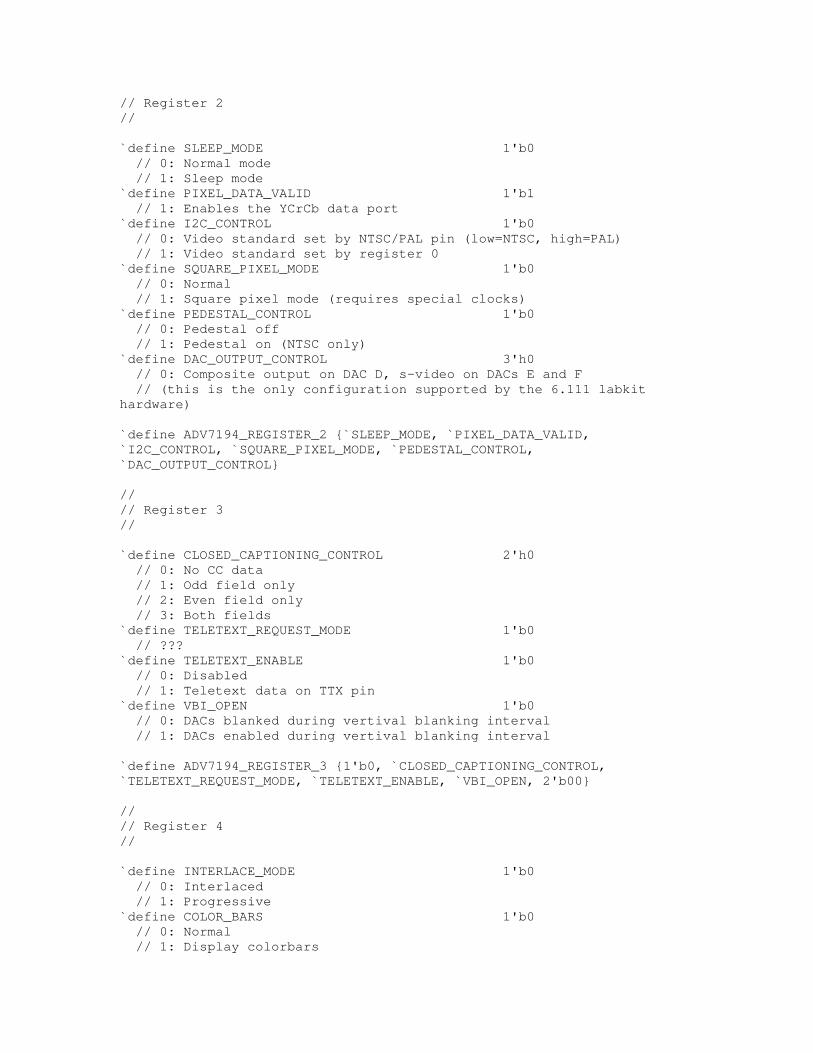
// Register 2 // `define SLEEP_MODE 1'b0 // 0: Normal mode // 1: Sleep mode `define PIXEL_DATA_VALID 1'b1 // 1: Enables the YCrCb data port `define I2C_CONTROL 1'b0 // 0: Video standard set by NTSC/PAL pin (low=NTSC, high=PAL) // 1: Video standard set by register 0 `define SQUARE_PIXEL_MODE 1'b0 // 0: Normal // 1: Square pixel mode (requires special clocks) `define PEDESTAL_CONTROL 1'b0 // 0: Pedestal off // 1: Pedestal on (NTSC only) `define DAC_OUTPUT_CONTROL 3'h0 // 0: Composite output on DAC D, s-video on DACs E and F // (this is the only configuration supported by the 6.111 labkit hardware) `define ADV7194_REGISTER_2 {`SLEEP_MODE, `PIXEL_DATA_VALID, `I2C_CONTROL, `SQUARE_PIXEL_MODE, `PEDESTAL_CONTROL, `DAC_OUTPUT_CONTROL} // // Register 3 // `define CLOSED_CAPTIONING_CONTROL 2'h0 // 0: No CC data // 1: Odd field only // 2: Even field only // 3: Both fields `define TELETEXT_REQUEST_MODE 1'b0 // ??? `define TELETEXT_ENABLE 1'b0 // 0: Disabled // 1: Teletext data on TTX pin `define VBI_OPEN 1'b0 // 0: DACs blanked during vertival blanking interval // 1: DACs enabled during vertival blanking interval `define ADV7194_REGISTER_3 {1'b0, `CLOSED_CAPTIONING_CONTROL, `TELETEXT_REQUEST_MODE, `TELETEXT_ENABLE, `VBI_OPEN, 2'b00} // // Register 4 // `define INTERLACE_MODE 1'b0 // 0: Interlaced // 1: Progressive `define COLOR_BARS 1'b0 // 0: Normal // 1: Display colorbars
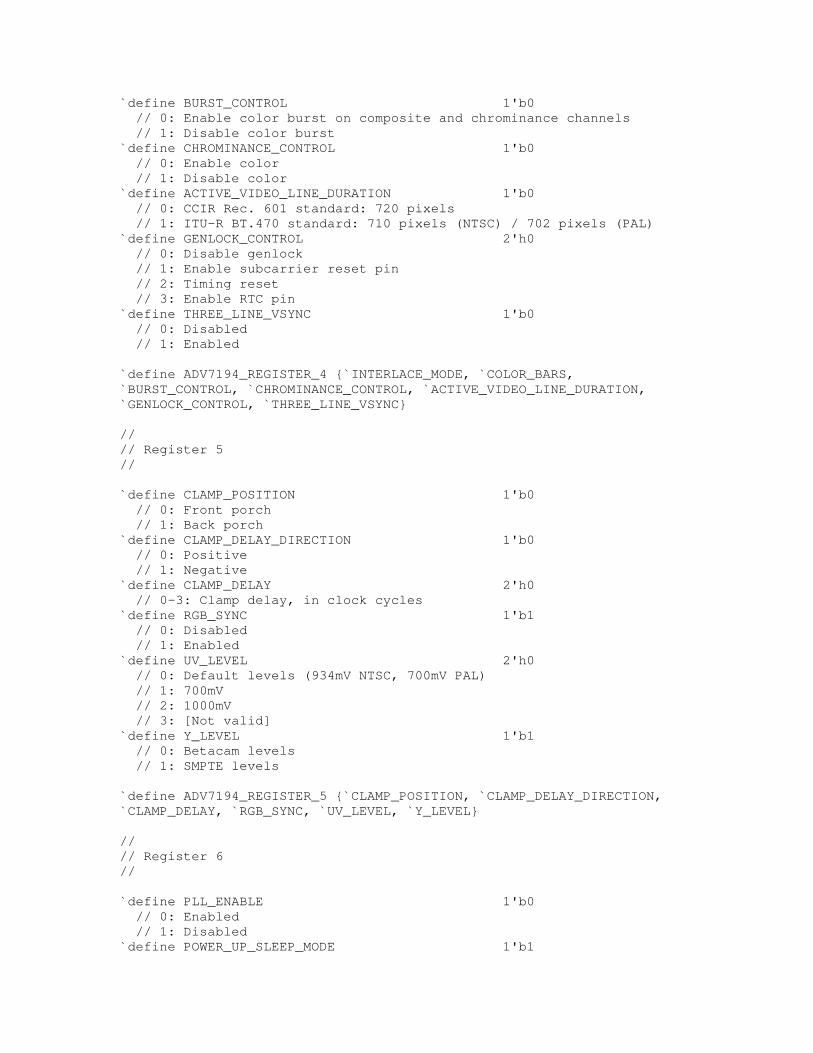
`define BURST_CONTROL 1'b0 // 0: Enable color burst on composite and chrominance channels // 1: Disable color burst `define CHROMINANCE_CONTROL 1'b0 // 0: Enable color // 1: Disable color `define ACTIVE_VIDEO_LINE_DURATION 1'b0 // 0: CCIR Rec. 601 standard: 720 pixels // 1: ITU-R BT.470 standard: 710 pixels (NTSC) / 702 pixels (PAL) `define GENLOCK_CONTROL 2'h0 // 0: Disable genlock // 1: Enable subcarrier reset pin // 2: Timing reset // 3: Enable RTC pin `define THREE_LINE_VSYNC 1'b0 // 0: Disabled // 1: Enabled `define ADV7194_REGISTER_4 {`INTERLACE_MODE, `COLOR_BARS, `BURST_CONTROL, `CHROMINANCE_CONTROL, `ACTIVE_VIDEO_LINE_DURATION, `GENLOCK_CONTROL, `THREE_LINE_VSYNC} // // Register 5 // `define CLAMP_POSITION 1'b0 // 0: Front porch // 1: Back porch `define CLAMP_DELAY_DIRECTION 1'b0 // 0: Positive // 1: Negative `define CLAMP_DELAY 2'h0 // 0-3: Clamp delay, in clock cycles `define RGB_SYNC 1'b1 // 0: Disabled // 1: Enabled `define UV_LEVEL 2'h0 // 0: Default levels (934mV NTSC, 700mV PAL) // 1: 700mV // 2: 1000mV // 3: [Not valid] `define Y_LEVEL 1'b1 // 0: Betacam levels // 1: SMPTE levels `define ADV7194_REGISTER_5 {`CLAMP_POSITION, `CLAMP_DELAY_DIRECTION, `CLAMP_DELAY, `RGB_SYNC, `UV_LEVEL, `Y_LEVEL} // // Register 6 // `define PLL_ENABLE 1'b0 // 0: Enabled // 1: Disabled `define POWER_UP_SLEEP_MODE 1'b1
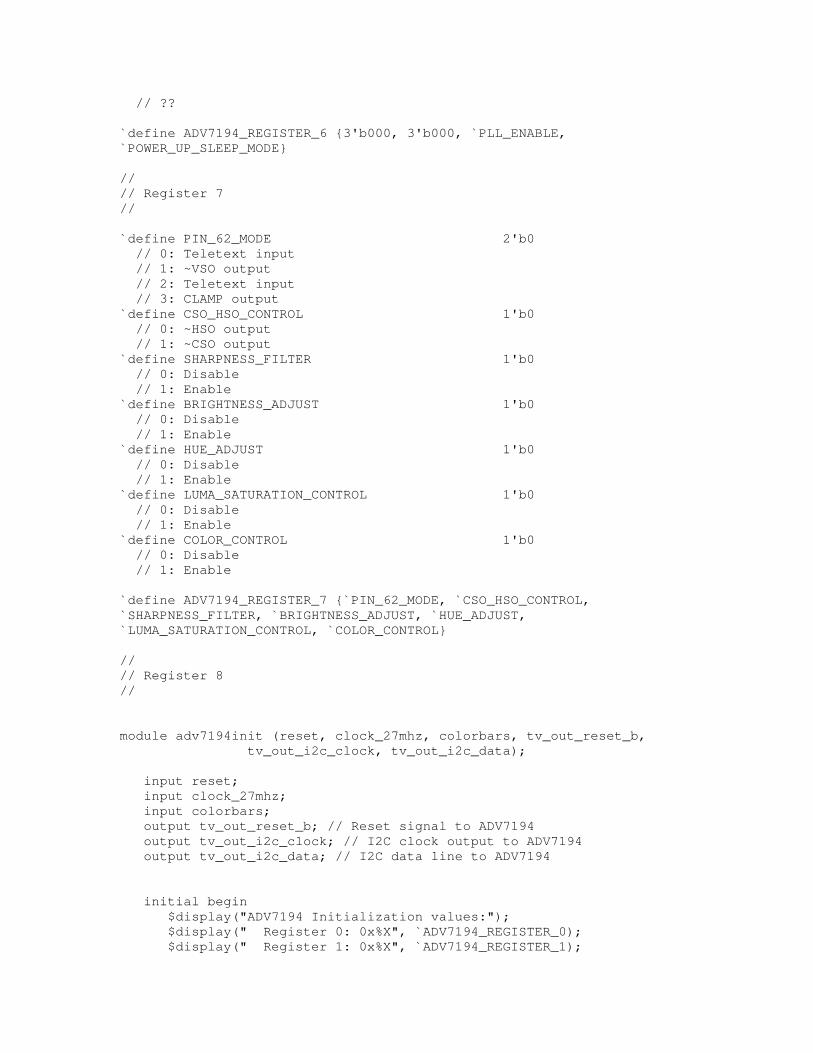
// ?? `define ADV7194_REGISTER_6 {3'b000, 3'b000, `PLL_ENABLE, `POWER_UP_SLEEP_MODE} // // Register 7 // `define PIN_62_MODE 2'b0 // 0: Teletext input // 1: ~VSO output // 2: Teletext input // 3: CLAMP output `define CSO_HSO_CONTROL 1'b0 // 0: ~HSO output // 1: ~CSO output `define SHARPNESS_FILTER 1'b0 // 0: Disable // 1: Enable `define BRIGHTNESS_ADJUST 1'b0 // 0: Disable // 1: Enable `define HUE_ADJUST 1'b0 // 0: Disable // 1: Enable `define LUMA_SATURATION_CONTROL 1'b0 // 0: Disable // 1: Enable `define COLOR_CONTROL 1'b0 // 0: Disable // 1: Enable `define ADV7194_REGISTER_7 {`PIN_62_MODE, `CSO_HSO_CONTROL, `SHARPNESS_FILTER, `BRIGHTNESS_ADJUST, `HUE_ADJUST, `LUMA_SATURATION_CONTROL, `COLOR_CONTROL} // // Register 8 // module adv7194init (reset, clock_27mhz, colorbars, tv_out_reset_b, tv_out_i2c_clock, tv_out_i2c_data); input reset; input clock_27mhz; input colorbars; output tv_out_reset_b; // Reset signal to ADV7194 output tv_out_i2c_clock; // I2C clock output to ADV7194 output tv_out_i2c_data; // I2C data line to ADV7194 initial begin $display("ADV7194 Initialization values:"); $display(" Register 0: 0x%X", `ADV7194_REGISTER_0); $display(" Register 1: 0x%X", `ADV7194_REGISTER_1);

$display(" Register 2: 0x%X", `ADV7194_REGISTER_2); $display(" Register 3: 0x%X", `ADV7194_REGISTER_3); $display(" Register 4: 0x%X", `ADV7194_REGISTER_4); $display(" Register 5: 0x%X", `ADV7194_REGISTER_5); $display(" Register 6: 0x%X", `ADV7194_REGISTER_6); $display(" Register 7: 0x%X", `ADV7194_REGISTER_7); end // // Generate a 1MHz for the I2C driver (resulting I2C clock rate is 250kHz) // reg [7:0] clk_div_count, reset_count; reg clock_slow; wire reset_slow; initial begin clk_div_count <= 8'h00; // synthesis attribute init of clk_div_count is "00"; clock_slow <= 1'b0; // synthesis attribute init of clock_slow is "0"; end always @(posedge clock_27mhz) if (clk_div_count == 26) begin clock_slow <= ~clock_slow; clk_div_count <= 0; end else clk_div_count <= clk_div_count+1; always @(posedge clock_27mhz) if (reset) reset_count <= 100; else reset_count <= (reset_count==0) ? 0 : reset_count-1; assign reset_slow = reset_count != 0; // // I2C driver // reg load; reg [7:0] data; wire ack, idle; i2c i2c(.reset(reset_slow), .clock4x(clock_slow), .data(data), .load(load), .ack(ack), .idle(idle), .scl(tv_out_i2c_clock), .sda(tv_out_i2c_data)); // // State machine

// reg [7:0] state; reg tv_out_reset_b; reg old_colorbars; always @(posedge clock_slow) if (reset_slow) begin state <= 0; data <= 0; load <= 0; tv_out_reset_b <= 0; end else case (state) 8'h00: begin // Assert reset load <= 1'b0; tv_out_reset_b <= 1'b0; if (!ack) state <= state+1; end 8'h01: begin state <= state+1; end 8'h02: begin // Release reset tv_out_reset_b <= 1'b1; state <= state+1; end 8'h03: begin // Send ADV7194 address data <= 8'h56; load <= 1'b1; if (ack) state <= state+1; end 8'h04: begin // Send subaddress of first register data <= 8'h00; if (ack) state <= state+1; end 8'h05: begin // Write to register 0 data <= `ADV7194_REGISTER_0; if (ack) state <= state+1; end 8'h06: begin // Write to register 1 data <= `ADV7194_REGISTER_1; if (ack) state <= state+1; end 8'h07: begin // Write to register 2 data <= `ADV7194_REGISTER_2; if (ack) state <= state+1; end 8'h08: begin

// Write to register 3 data <= `ADV7194_REGISTER_3; if (ack) state <= state+1; end 8'h09: begin // Write to register 4 data <= `ADV7194_REGISTER_4 | {1'b0, colorbars, 6'b000000}; if (ack) state <= state+1; end 8'h0A: begin // Write to register 5 data <= `ADV7194_REGISTER_5; if (ack) state <= state+1; end 8'h0B: begin // Write to register 6 data <= `ADV7194_REGISTER_6; if (ack) state <= state+1; end 8'h0C: begin // Write to register 7 data <= `ADV7194_REGISTER_7; if (ack) state <= state+1; end 8'h0D: begin // Wait for I2C transmitter to finish load <= 1'b0; if (idle) state <= state+1; end 8'h0E: begin // Idle if (old_colorbars != colorbars) state <= state+1; old_colorbars <= colorbars; end 8'h0F: begin // Send ADV7194 address data <= 8'h56; load <= 1'b1; if (ack) state <= state+1; end 8'h10: begin // Send subaddress of register 4 data <= 8'h04; if (ack) state <= state+1; end 8'h11: begin // Write to register 4 data <= `ADV7194_REGISTER_4 | {1'b0, colorbars, 6'b000000}; if (ack) state <= state+1; end 8'h12: begin // Wait for I2C transmitter to finish load <= 1'b0; if (idle) state <= 8'h0E; end endcase

endmodule

Avtest.v /////////////////////////////////////////////////////////////////////////////// // // 6.111 FPGA Labkit -- Audio/Video Test // // For Labkit Revision 004 // // // Created: November 3, 2004 // Author: Nathan Ickes // /////////////////////////////////////////////////////////////////////////////// /*`include "audio.v" `include "vga.v" `include "video.v" `include "display.v" //Don't do these includes -- Xilinx handles it for you */ module labkit (beep, audio_reset_b, ac97_sdata_out, ac97_sdata_in, ac97_synch, ac97_bit_clock, vga_out_red, vga_out_green, vga_out_blue, vga_out_sync_b, vga_out_blank_b, vga_out_pixel_clock, vga_out_hsync, vga_out_vsync, tv_out_ycrcb, tv_out_reset_b, tv_out_clock, tv_out_i2c_clock, tv_out_i2c_data, tv_out_pal_ntsc, tv_out_hsync_b, tv_out_vsync_b, tv_out_blank_b, tv_out_subcar_reset, tv_in_ycrcb, tv_in_data_valid, tv_in_line_clock1, tv_in_line_clock2, tv_in_aef, tv_in_hff, tv_in_aff, tv_in_i2c_clock, tv_in_i2c_data, tv_in_fifo_read, tv_in_fifo_clock, tv_in_iso, tv_in_reset_b, tv_in_clock, ram0_data, ram0_address, ram0_adv_ld, ram0_clk, ram0_cen_b, ram0_ce_b, ram0_oe_b, ram0_we_b, ram0_bwe_b, ram1_data, ram1_address, ram1_adv_ld, ram1_clk, ram1_cen_b, ram1_ce_b, ram1_oe_b, ram1_we_b, ram1_bwe_b, clock_feedback_out, clock_feedback_in, flash_data, flash_address, flash_ce_b, flash_oe_b, flash_we_b, flash_reset_b, flash_sts, flash_byte_b, rs232_txd, rs232_rxd, rs232_rts, rs232_cts,
mouse_clock, mouse_data, keyboard_clock, keyboard_data, clock_27mhz, clock1, clock2, disp_blank, disp_data_out, disp_clock, disp_rs, disp_ce_b, disp_reset_b, disp_data_in, button0, button1, button2, button3, button_enter, button_right, button_left, button_down, button_up, switch, led, user1, user2, user3, user4, daughtercard, systemace_data, systemace_address, systemace_ce_b, systemace_we_b, systemace_oe_b, systemace_irq, systemace_mpbrdy, analyzer1_data, analyzer1_clock, analyzer2_data, analyzer2_clock, analyzer3_data, analyzer3_clock, analyzer4_data, analyzer4_clock); output beep, audio_reset_b, ac97_synch, ac97_sdata_out; input ac97_bit_clock, ac97_sdata_in; output [7:0] vga_out_red, vga_out_green, vga_out_blue; output vga_out_sync_b, vga_out_blank_b, vga_out_pixel_clock, vga_out_hsync, vga_out_vsync; output [9:0] tv_out_ycrcb; output tv_out_reset_b, tv_out_clock, tv_out_i2c_clock, tv_out_i2c_data, tv_out_pal_ntsc, tv_out_hsync_b, tv_out_vsync_b, tv_out_blank_b, tv_out_subcar_reset; input [19:0] tv_in_ycrcb; input tv_in_data_valid, tv_in_line_clock1, tv_in_line_clock2, tv_in_aef, tv_in_hff, tv_in_aff; output tv_in_i2c_clock, tv_in_i2c_data, tv_in_fifo_read, tv_in_fifo_clock, tv_in_iso, tv_in_reset_b, tv_in_clock; inout [35:0] ram0_data; output [20:0] ram0_address; output ram0_adv_ld, ram0_clk, ram0_cen_b, ram0_ce_b, ram0_oe_b, ram0_we_b; output [3:0] ram0_bwe_b;

inout [35:0] ram1_data; output [20:0] ram1_address; output ram1_adv_ld, ram1_clk, ram1_cen_b, ram1_ce_b, ram1_oe_b, ram1_we_b; output [3:0] ram1_bwe_b; input clock_feedback_in; output clock_feedback_out; inout [15:0] flash_data; output [24:0] flash_address; output flash_ce_b, flash_oe_b, flash_we_b, flash_reset_b, flash_byte_b; input flash_sts; output rs232_txd, rs232_rts; input rs232_rxd, rs232_cts; input mouse_clock, mouse_data, keyboard_clock, keyboard_data; input clock_27mhz, clock1, clock2; output disp_blank, disp_clock, disp_rs, disp_ce_b, disp_reset_b; output disp_data_out; input disp_data_in; input button0, button1, button2, button3, button_enter, button_right, button_left, button_down, button_up; input [7:0] switch; output [7:0] led; inout [31:0] user1, user2, user3, user4; inout [43:0] daughtercard; inout [15:0] systemace_data; output [6:0] systemace_address; output systemace_ce_b, systemace_we_b, systemace_oe_b; input systemace_irq, systemace_mpbrdy; output [15:0] analyzer1_data, analyzer2_data, analyzer3_data, analyzer4_data; output analyzer1_clock, analyzer2_clock, analyzer3_clock, analyzer4_clock; //////////////////////////////////////////////////////////////////////////// // // Reset Generation // // A shift register primitive is used to generate an active-high reset // signal that remains high for 16 clock cycles after configuration finishes
// and the FPGA's internal clocks begin toggling. // //////////////////////////////////////////////////////////////////////////// wire reset; SRL16 reset_sr (.D(1'b0), .CLK(clock_27mhz), .Q(reset), .A0(1'b1), .A1(1'b1), .A2(1'b1), .A3(1'b1)); defparam reset_sr.INIT = 16'hFFFF; //////KEYBOARD INPUT////////////////// wire [7:0] ascii; wire [7:0] keycode; reg [7:0] key; reg [7:0] lastkey; wire key_pressed; wire ascii_ready; ps2_ascii_input kbd(clock_27mhz, reset, keyboard_clock, keyboard_data, ascii, keycode, ascii_ready); ////////////////////////////////////// /////////////////////////wires//// wire [7:0] from_ac97_data, to_ac97_data; wire ready; wire busy,done; wire [15:0] xk_re, xk_im; wire signed [16:0] re_squared; wire signed [16:0] im_squared; wire [16:0] magnitude; wire [16:0] tmp_mag; //////////////////////////////////////////////////////////////////////////// // // Video I/O // //////////////////////////////////////////////////////////////////////////// wire [1:0] videomode; parameter mode = 2'd1; //0 = bars, 1 = normal output wire [9:0] h_position, v_position; wire [9:0] y, cr, cb; wire [15:0] pixel_data; wire row_done, frame_done; wire sreset; assign sreset = (h_position == 1) && (v_position == 0);

/////////////STEPHEN'S VISUALIZATION CODE////////////// wire we; wire [16:0] write_addr; wire [15:0] rgb_data; reg switch_we; reg [16:0] switch_write_addr; reg [15:0] switch_rgb_data; wire [9:0] s_y, s_cr, s_cb; wire [16:0] g_bkt_mag; wire [2:0] g_bkt_index; wire [16:0] fft_bkt_mag; wire [2:0] fft_bkt_index; wire [16:0] bkt_mag; wire [2:0] bkt_index; wire [6:0] xk_index; assign bkt_index = switch[4] ? g_bkt_index : fft_bkt_index; assign bkt_mag = switch[4] ? g_bkt_mag : fft_bkt_mag; allvis vis(clock_27mhz, bkt_mag[16:1], bkt_index, 1, row_done, v_position, frame_done, we, write_addr, rgb_data, switch[1:0]); //generate the bucket signals gen_buckets bgen(reset, clock_27mhz, switch[5], g_bkt_index, g_bkt_mag); ////////////////////////////// //Initialize the TV output and get it running video video_test (reset, clock_27mhz, tv_out_reset_b, tv_out_clock, tv_out_i2c_clock, tv_out_i2c_data, tv_out_pal_ntsc, tv_out_hsync_b, tv_out_vsync_b, tv_out_blank_b, tv_out_subcar_reset, mode); //generate video signals and generate data for screen videodraw vid(reset, clock_27mhz, y, cr, cb, h_position, v_position, row_done, frame_done, tv_out_ycrcb); wire [16:0] read_addr; //instantiate a memory for pixel data //all of these inputs are muxed for demo/testing purposes, switching between RAM RGB data and switch RGB data (3 bit) wire [15:0] rgb_data_in = switch[6] ? rgb_data : switch_rgb_data; wire we_in = switch[6] ? we : switch_we; wire [16:0] write_addr_in = switch[6] ? write_addr : switch_write_addr; video_mem mem(write_addr_in,read_addr,clock_27mhz,clock_27mhz,rgb_data_in,pixel_data,we_in); //fake_mem mem(switch,pixel_data);

//and drive the address to memory from the videodraw module for ycrcb data pos2addr convert(h_position, v_position, read_addr); rgb_data2ycrcb_data r2y(pixel_data, s_y, s_cr, s_cb); ///////////////////////////////////////////////////// // // Bradley's Stuff // ///////////////////////////////////////////////////// // AC97 driver audio a(clock_27mhz, reset, from_ac97_data, to_ac97_data, ready, audio_reset_b, ac97_sdata_out, ac97_sdata_in, ac97_synch, ac97_bit_clock); wire playback; debounce benter(reset, clock_27mhz, button_enter, playback); // record module recorder r(clock_27mhz, reset, playback, ready, from_ac97_data, to_ac97_data, fft_bkt_mag, fft_bkt_index, xk_index, busy,xk_re,xk_im,done); //////////DEBUGGING/////////////// /*assign led[7] = ~done; assign led[6] = ~busy;*/ /* wire b_enter,b_up,b_down,b_left,b_right; wire b_entert,b_upt,b_downt,b_leftt,b_rightt; assign playback = b_enter; synchronize benter(clock_27mhz, button_enter, b_entert); synchronize bleft(clock_27mhz, button_left, b_leftt); synchronize bright(clock_27mhz, button_right, b_rightt); synchronize bup(clock_27mhz, button_up, b_upt); synchronize bdown(clock_27mhz, button_down, b_downt); pulser x1(clock_27mhz, ~b_entert, b_enter); pulser x2(clock_27mhz, ~b_leftt, b_left); pulser x3(clock_27mhz, ~b_rightt, b_right); pulser x4(clock_27mhz, ~b_upt, b_up); pulser x5(clock_27mhz, ~b_downt, b_down); */ /////////////////////////////////// assign b_enter = (ascii == 8'h0D) && ascii_ready; assign b_left = (ascii == 8'h41) && ascii_ready; assign b_right = (ascii == 8'h44) && ascii_ready; assign b_down = (ascii == 8'h53) && ascii_ready; assign b_up = (ascii == 8'h57) && ascii_ready;

//////EQUALIZER//////////////////////////////// wire [7:0] coeff; wire [2:0] pick; equalizer eq(reset, clock_27mhz, switch[7], b_left, b_right, b_up, b_down, b_enter, s_y, s_cr, s_cb,h_position, v_position,0,y,cr,cb, coeff, pick); ////////////////////////////////////////////// assign led = ~coeff; //look at the coefficient for the first bucket (for demo) // // Solid Color RAM Writer // reg [9:0] c = 0; reg col = 0; reg dir = 1; wire [15:0] switch_colors; //using the first three switches, create 5:6:5 data assign switch_colors = {switch[2],switch[2],switch[2],switch[2],switch[2], switch[1],switch[1],switch[1],switch[1],switch[1],switch[1], switch[0],switch[0],switch[0],switch[0],switch[0]}; always @ (posedge clock_27mhz) begin if (reset == 1) begin switch_write_addr <= 0; //reset the register variables on a system reset switch_we <= 0; end else switch_write_addr <= read_addr - 1; //always lag one behind the current read address for writing if (reset == 1) switch_rgb_data <= 0; //reset the rgb data on a system reset else begin if(switch_write_addr == 87479) c <= c + 1; if(c == 0) begin col <= col + 1; switch_rgb_data <= switch_colors; //(rgb_data == 16'hFFFF) ? 0 : rgb_data + 1; //cycle through all 16 bits
// data <= (data == 16'b1111111111011111) ? 0 : data + 16'b0000100001000001; //grayscale end switch_we <= 1; end end PULLUP pu_in (.O(tv_in_i2c_data)); PULLUP pu_out (.O(tv_out_i2c_data)); assign user1 = {6'b000000, tv_in_line_clock1, // 25 tv_in_i2c_clock, // 24 tv_in_i2c_data, // 23 tv_in_ycrcb[19:10], // 22-13 clock_27mhz, // 12 tv_out_i2c_clock, // 11 tv_out_i2c_data, // 10 tv_out_ycrcb}; // 9-0 //Analyzer assignments for debugging fun assign analyzer1_clock = clock_27mhz; assign analyzer1_data = {bkt_index}; /*{tv_out_i2c_clock, tv_out_i2c_data, 4'h0, tv_out_ycrcb};*/ assign analyzer2_clock = clock_27mhz; assign analyzer2_data = {tmp_mag[16:1]}; assign analyzer3_clock = clock_27mhz; assign analyzer3_data = {bkt_mag[7:0]};//{xk_re[15:8],xk_im[15:8]}; display_16hex hexdisp1(reset, clock_27mhz, {ascii}, disp_blank, disp_clock, disp_rs, disp_ce_b, disp_reset_b, disp_data_out); //////////////////////////////////////////////////////////////////////////// // // Default I/O Assignments // ////////////////////////////////////////////////////////////////////////////

// SRAMs assign ram0_data = 36'hZ; assign ram0_address = 21'h0; assign ram0_adv_ld = 1'b0; assign ram0_clk = 1'b0; assign ram0_cen_b = 1'b1; assign ram0_ce_b = 1'b1; assign ram0_oe_b = 1'b1; assign ram0_we_b = 1'b1; assign ram0_bwe_b = 4'hF; assign ram1_data = 36'hZ; assign ram1_address = 21'h0; assign ram1_adv_ld = 1'b0; assign ram1_clk = 1'b0; assign ram1_cen_b = 1'b1; assign ram1_ce_b = 1'b1; assign ram1_oe_b = 1'b1; assign ram1_we_b = 1'b1; assign ram1_bwe_b = 4'hF; assign clock_feedback_out = 1'b0; // Flash ROM assign flash_data = 16'hZ; assign flash_address = 15'h0; assign flash_ce_b = 1'b1; assign flash_oe_b = 1'b1; assign flash_we_b = 1'b1; assign flash_reset_b = 1'b0; assign flash_byte_b = 1'b1; // RS-232 Interface assign rs232_txd = 1'b1; assign rs232_rts = 1'b1; // Buttons, Switches, and Individual LEDs //assign led = 8'hFF; // User I/Os assign user2 = 32'hZ; assign user3 = 32'hZ; assign user4 = 32'hZ; // Daughtercard Connectors assign daughtercard = 44'hZ; // SystemACE Microprocessor Port assign systemace_data = 16'hZ; assign systemace_address = 7'h0; assign systemace_ce_b = 1'b1; assign systemace_we_b = 1'b1; assign systemace_oe_b = 1'b1; // Logic Analyzer //assign analyzer3_data = 16'h0; //assign analyzer3_clock = 1'b1; assign analyzer4_data = 16'h0; assign analyzer4_clock = 1'b1;

// Video Input assign tv_in_i2c_clock = 1'b0; assign tv_in_fifo_read = 1'b0; assign tv_in_fifo_clock = 1'b0; assign tv_in_iso = 1'b0; assign tv_in_reset_b = 1'b0; assign tv_in_clock = 1'b0; assign tv_in_i2c_data = 1'bZ; // tv_in_ycrcb, tv_in_data_valid, tv_in_line_clock1, tv_in_line_clock2, // tv_in_aef, tv_in_hff, and tv_in_aff are inputs endmodule /////////////////////////////////////////////////////////////////////////////// // // Switch Debounce Module // /////////////////////////////////////////////////////////////////////////////// module debounce (reset, clock, noisy, clean); input reset, clock, noisy; output clean; reg [18:0] count; reg new, clean; always @(posedge clock) if (reset) begin count <= 0; new <= noisy; clean <= noisy; end else if (noisy != new) begin new <= noisy; count <= 0; end else if (count == 270000) clean <= new; else count <= count+1; endmodule /////////////////////////////////////////////////////////////////////////////// // // Hold to Pulse convertor (borrowed from the 6.111 Quiz Solutions because it was more elegant than mine) //

/////////////////////////////////////////////////////////////////////////////// module pulser (clock, signal, pulse); input clock, signal; output pulse; reg old,pulse; always @(posedge clock) begin old <= signal; pulse <= signal & ~old; end endmodule

Equalizer.v /////////////////////////////////////////////////////////////////////////////// // // Equalizer // /////////////////////////////////////////////////////////////////////////////// module equalizer (reset, clock, enable, left, right, up, down, enter, y_in, cr_in, cb_in, h_position, v_position, coeff_ind, y, cr, cb, coeff, bucket); input reset; input clock; input enable; //signals that coefficients should be adjusted input left,right, up, down; //button inputs input enter; input [9:0] v_position, h_position; //position being drawn on screen input [9:0] y_in,cr_in,cb_in; //input ycrcb output [9:0] y, cr, cb; //output ycrcb input [2:0] coeff_ind; output [7:0] coeff; //memory for coefficients reg [7:0] coeffs [7:0]; reg [7:0] temp_coeffs [7:0]; //hold coefficients for display, but don't save them output [2:0] bucket; reg [2:0] bucket = 0; //keep track of the selected bucket parameter STEP = 32; //number of steps to increment/decrement bucket values by. should divide 256 assign coeff = coeffs[coeff_ind]; wire [9:0] by, bcr, bcb; //draw the bars to visualize this module's behavior eq_bars graphics(bucket, temp_coeffs[0], temp_coeffs[1], temp_coeffs[2], temp_coeffs[3], temp_coeffs[4], temp_coeffs[5], temp_coeffs[6], temp_coeffs[7], v_position, h_position, by, bcr, bcb); //if the bar y is non-zero, use the bar data //otherwise use what was already there at half brightness //if not enabled, pass through assign y = (by == 0) | ~enable ? y_in : by; assign cr = (by == 0) | ~enable ? cr_in : bcr;

assign cb = (by == 0) | ~enable ? cb_in : bcb; always @ (posedge clock) begin if (reset) //Start all of the bars at their peak value begin coeffs[0] <= 8'hFF; coeffs[1] <= 8'hFF; coeffs[2] <= 8'hFF; coeffs[3] <= 8'hFF; coeffs[4] <= 8'hFF; coeffs[5] <= 8'hFF; coeffs[6] <= 8'hFF; coeffs[7] <= 8'hFF; temp_coeffs[0] <= 8'hFF; temp_coeffs[1] <= 8'hFF; temp_coeffs[2] <= 8'hFF; temp_coeffs[3] <= 8'hFF; temp_coeffs[4] <= 8'hFF; temp_coeffs[5] <= 8'hFF; temp_coeffs[6] <= 8'hFF; temp_coeffs[7] <= 8'hFF; end else begin if(enable) begin ///HANDLE BUTTON PRESSES/// if(enter == 1) //store the temporary values to the output begin coeffs[0] <= temp_coeffs[0]; coeffs[1] <= temp_coeffs[1]; coeffs[2] <= temp_coeffs[2]; coeffs[3] <= temp_coeffs[3]; coeffs[4] <= temp_coeffs[4]; coeffs[5] <= temp_coeffs[5]; coeffs[6] <= temp_coeffs[6]; coeffs[7] <= temp_coeffs[7]; end else if(left == 1) begin bucket <= bucket + 7; //move one to the left, loops automatically end else if(right == 1) begin bucket <= bucket + 1; //move one to the right, loops automatically end else if(up == 1) begin if(temp_coeffs[bucket] + STEP < 8'hFF) temp_coeffs[bucket] <= temp_coeffs[bucket] + STEP;

else temp_coeffs[bucket] <= 8'hFF; end else if(down == 1) begin if(temp_coeffs[bucket] > STEP) temp_coeffs[bucket] <= temp_coeffs[bucket] - STEP; else temp_coeffs[bucket] <= 1; end end end end endmodule module ycrcb_blob(vcount, hcount, outline, height_in, y , cr, cb); //Returns the correct pixel for a square with bottom left @x,y parameter WIDTH = 40; parameter X = 0; parameter Y = 320; ///Color of bars is grey, so Y=some lightness, no cr, cb parameter Y_COLOR = 10'd116; parameter CR_COLOR = 10'd432; parameter CB_COLOR = 10'd1023; parameter Y_BRIGHT = 10'b1000000000; input [9:0] hcount; input [9:0] vcount, height_in; output [9:0] y,cr,cb; input outline; reg [9:0] y,cr,cb; wire [9:0] height; assign height = height_in >> 1; always @ (height or hcount or vcount) begin if(hcount>=X && hcount < X+WIDTH && vcount <= Y && vcount + height > Y) begin //test for border, the last two pixels on every side of the box if(outline && (X == hcount || X == hcount - 1 || X + WIDTH == hcount + 1 || X + WIDTH == hcount + 2 || vcount == Y || vcount + 1 == Y || vcount + height == Y + 1 || vcount + height == Y + 2)) y <= Y_BRIGHT; //highlight this else y <= Y_COLOR; //or use the normal color

cr <= CR_COLOR; cb <= CB_COLOR; end else begin //this is a real color, but y = 0 signals not to use it, and it ors correctly y <= 0; cr <= 0; cb <= 0; end end endmodule module eq_bars(selected, b0in, b1in, b2in, b3in, b4in, b5in, b6in, b7in, vcount, hcount, y, cr, cb); input [2:0] selected; input [7:0] b0in ; input [7:0] b1in ; input [7:0] b2in ; input [7:0] b3in ; input [7:0] b4in ; input [7:0] b5in ; input [7:0] b6in ; input [7:0] b7in ; input [9:0] vcount; input [9:0] hcount; output [9:0] y, cr, cb; wire [9:0] y0,y1,y2,y3,y4,y5,y6,y7; wire [9:0] cr0,cr1,cr2,cr3,cr4,cr5,cr6,cr7; wire [9:0] cb0,cb1,cb2,cb3,cb4,cb5,cb6,cb7; //instantiate all of these modules ycrcb_blob a(vcount, hcount, (selected == 0), b0in, y0 , cr0, cb0); defparam a.X=200; ycrcb_blob b(vcount, hcount, (selected == 1), b1in, y1 , cr1, cb1); defparam b.X=250; ycrcb_blob c(vcount, hcount, (selected == 2), b2in, y2 , cr2, cb2); defparam c.X=300; ycrcb_blob d(vcount, hcount, (selected == 3), b3in, y3 , cr3, cb3); defparam d.X=350; ycrcb_blob e(vcount, hcount, (selected == 4), b4in, y4 , cr4, cb4); defparam e.X=400; ycrcb_blob f(vcount, hcount, (selected == 5), b5in, y5 , cr5, cb5); defparam f.X=450; ycrcb_blob g(vcount, hcount, (selected == 6), b6in, y6 , cr6, cb6);

defparam g.X=500; ycrcb_blob h(vcount, hcount, (selected == 7), b7in, y7 , cr7, cb7); defparam h.X=550; //Or all of the output together assign y = y0 | y1 | y2 | y3 | y4 | y5 | y6 | y7; assign cr = cr0 | cr1 | cr2 | cr3 | cr4 | cr5 | cr6 | cr7; assign cb = cb0 | cb1 | cb2 | cb3 | cb4 | cb5 | cb6 | cb7; endmodule
Gen_buckets.v module gen_buckets(reset, clock, switch, bkt_ind, bkt_mag); input clock, reset, switch; output [2:0] bkt_ind; reg [2:0] bkt_ind; output [16:0] bkt_mag; reg [16:0] bkt_mag; reg [3:0] offset; reg [7:0] store [15:0]; wire [2:0]location; assign location = offset + bkt_ind + 1; //keep moving through the possible values always @(posedge clock) begin if(reset) begin bkt_ind <= 0; //reset the outputs bkt_mag <= 0; offset <= 0; //reset the offset variable //set default values to move through the buckets store[0] <= 3; store[1] <= 255; store[2] <= 100; store[3] <= 50; store[4] <= 65; store[5] <= 200; store[6] <= 20; store[7] <= 15; store[8] <= 0; store[9] <= 220; store[10] <= 156; store[11] <= 88; store[12] <= 253; store[13] <= 69; store[14] <= 140; store[15] <= 160; end else begin bkt_mag <= store[location]; //store the magnitude based on index and offset bkt_ind <= bkt_ind + 1; //work on next bucket if(bkt_ind == 7) //drew last bucket begin if(switch == 1) offset <= offset + 1; //change the offset

end end end endmodule

Ps2_kbd.v // // File: ps2_kbd.v // Date: 24-Oct-05 // Author: C. Terman / I. Chuang // // PS2 keyboard input for 6.111 labkit // // INPUTS: // // clock_27mhz - master clock // reset - active high // clock - ps2 interface clock // data - ps2 interface data // // OUTPUTS: // // ascii - 8 bit ascii code for current character // ascii_ready - one clock cycle pulse indicating new char received ///////////////////////////////////////////////////////////////////////////// module ps2_ascii_input(clock_27mhz, reset, clock, data, ascii, keycode, ascii_ready); // module to generate ascii code for keyboard input // this is module works synchronously with the system clock input clock_27mhz; input reset; // Active high asynchronous reset input clock; // PS/2 clock input data; // PS/2 data output [7:0] ascii; // ascii code (1 character) output [7:0] keycode; //keycode output ascii_ready; // ascii ready (one clock_27mhz cycle active high) reg [7:0] ascii_val; // internal combinatorial ascii decoded value reg [7:0] lastkey; // last keycode reg [7:0] curkey; // current keycode reg [7:0] keycode; // current keycode reg [7:0] ascii; // ascii output (latched & synchronous) reg ascii_ready; // synchronous one-cycle ready flag wire fifo_rd; // keyboard read request wire [7:0] fifo_data; // keyboard data wire fifo_empty; // flag: no keyboard data wire fifo_overflow; // keyboard data overflow ps2 myps2(reset, clock_27mhz, clock, data, fifo_rd, fifo_data, fifo_empty,fifo_overflow);

assign fifo_rd = ~fifo_empty; // continous read reg key_ready; always @(posedge clock_27mhz) begin // get key if ready curkey <= ~fifo_empty ? fifo_data : curkey; lastkey <= ~fifo_empty ? curkey : lastkey; key_ready <= ~fifo_empty; // raise ascii_ready for last key which was read ascii_ready <= key_ready & ~(curkey[7]|lastkey[7]); ascii <= (key_ready & ~(curkey[7]|lastkey[7])) ? ascii_val : ascii; keycode <= (key_ready & ~(curkey[7]|lastkey[7])) ? curkey : keycode; end always @(curkey) begin //convert PS/2 keyboard make code ==> ascii code case (curkey) 8'h1C: ascii_val = 8'h41; //A 8'h32: ascii_val = 8'h42; //B 8'h21: ascii_val = 8'h43; //C 8'h23: ascii_val = 8'h44; //D 8'h24: ascii_val = 8'h45; //E 8'h2B: ascii_val = 8'h46; //F 8'h34: ascii_val = 8'h47; //G 8'h33: ascii_val = 8'h48; //H 8'h43: ascii_val = 8'h49; //I 8'h3B: ascii_val = 8'h4A; //J 8'h42: ascii_val = 8'h4B; //K 8'h4B: ascii_val = 8'h4C; //L 8'h3A: ascii_val = 8'h4D; //M 8'h31: ascii_val = 8'h4E; //N 8'h44: ascii_val = 8'h4F; //O 8'h4D: ascii_val = 8'h50; //P 8'h15: ascii_val = 8'h51; //Q 8'h2D: ascii_val = 8'h52; //R 8'h1B: ascii_val = 8'h53; //S 8'h2C: ascii_val = 8'h54; //T 8'h3C: ascii_val = 8'h55; //U 8'h2A: ascii_val = 8'h56; //V 8'h1D: ascii_val = 8'h57; //W 8'h22: ascii_val = 8'h58; //X 8'h35: ascii_val = 8'h59; //Y 8'h1A: ascii_val = 8'h5A; //Z 8'h45: ascii_val = 8'h30; //0 8'h16: ascii_val = 8'h31; //1 8'h1E: ascii_val = 8'h32; //2 8'h26: ascii_val = 8'h33; //3 8'h25: ascii_val = 8'h34; //4

8'h2E: ascii_val = 8'h35; //5 8'h36: ascii_val = 8'h36; //6 8'h3D: ascii_val = 8'h37; //7 8'h3E: ascii_val = 8'h38; //8 8'h46: ascii_val = 8'h39; //9 8'h0E: ascii_val = 8'h60; // ` 8'h4E: ascii_val = 8'h2D; // - 8'h55: ascii_val = 8'h3D; // = 8'h5C: ascii_val = 8'h5C; // \ 8'h29: ascii_val = 8'h20; // (space) 8'h54: ascii_val = 8'h5B; // [ 8'h5B: ascii_val = 8'h5D; // ] 8'h4C: ascii_val = 8'h3B; // ; 8'h52: ascii_val = 8'h27; // ' 8'h41: ascii_val = 8'h2C; // , 8'h49: ascii_val = 8'h2E; // . 8'h4A: ascii_val = 8'h2F; // / 8'h5A: ascii_val = 8'h0D; // enter (CR) 8'h66: ascii_val = 8'h08; // backspace // 8'hF0: ascii_val = 8'hF0; // BREAK CODE default: ascii_val = 8'h23; // # endcase end endmodule // ps2toascii ///////////////////////////////////////////////////////////////////////////// // new synchronous ps2 keyboard driver, with built-in fifo, from Chris Terman module ps2(reset, clock_27mhz, ps2c, ps2d, fifo_rd, fifo_data, fifo_empty,fifo_overflow); input clock_27mhz,reset; input ps2c; // ps2 clock input ps2d; // ps2 data input fifo_rd; // fifo read request (active high) output [7:0] fifo_data; // fifo data output output fifo_empty; // fifo empty (active high) output fifo_overflow; // fifo overflow - too much kbd input reg [3:0] count; // count incoming data bits reg [9:0] shift; // accumulate incoming data bits reg [7:0] fifo[7:0]; // 8 element data fifo reg fifo_overflow; reg [2:0] wptr,rptr; // fifo write and read pointers wire [2:0] wptr_inc = wptr + 1; assign fifo_empty = (wptr == rptr);

assign fifo_data = fifo[rptr]; // synchronize PS2 clock to local clock and look for falling edge reg [2:0] ps2c_sync; always @ (posedge clock_27mhz) ps2c_sync <= {ps2c_sync[1:0],ps2c}; wire sample = ps2c_sync[2] & ~ps2c_sync[1]; always @ (posedge clock_27mhz) begin if (reset) begin count <= 0; wptr <= 0; rptr <= 0; fifo_overflow <= 0; end else if (sample) begin // order of arrival: 0,8 bits of data (LSB first),odd parity,1 if (count==10) begin // just received what should be the stop bit if (shift[0]==0 && ps2d==1 && (^shift[9:1])==1) begin fifo[wptr] <= shift[8:1]; wptr <= wptr_inc; fifo_overflow <= fifo_overflow | (wptr_inc == rptr); end count <= 0; end else begin shift <= {ps2d,shift[9:1]}; count <= count + 1; end end // bump read pointer if we're done with current value. // Read also resets the overflow indicator if (fifo_rd && !fifo_empty) begin rptr <= rptr + 1; fifo_overflow <= 0; end end endmodule
Video.v /////////////////////////////////////////////////////////////////////////////// // // 6.111 FPGA Labkit -- Video (TV) Test Code // // For Labkit Revision 004 // // // Created: November 3, 2004 // Author: Nathan Ickes // /////////////////////////////////////////////////////////////////////////////// /* `include "i2c.v" `include "adv7194init.v" `include "adv7185init.v" //Don't include these -- Xilinx does it for us */ module video (reset, clock_27mhz, tv_out_reset_b, tv_out_clock, tv_out_i2c_clock, tv_out_i2c_data, tv_out_pal_ntsc, tv_out_hsync_b, tv_out_vsync_b, tv_out_blank_b, tv_out_subcar_reset, mode); input reset; input clock_27mhz; //output [9:0] tv_out_ycrcb; output tv_out_reset_b, tv_out_clock, tv_out_i2c_clock, tv_out_i2c_data, tv_out_pal_ntsc, tv_out_hsync_b, tv_out_vsync_b, tv_out_blank_b, tv_out_subcar_reset; input [1:0] mode; // Mode Decoding // // 0 = colorbars, 1 = MIT logo, 2 = composite passthrough, // 3 = s-video passthrough wire colorbars, logo, svideo; assign colorbars = (mode == 0); assign logo = (mode == 1); // // ADV7194 (Output) // assign tv_out_clock = clock_27mhz; assign tv_out_pal_ntsc = 1'b0; assign tv_out_vsync_b = 0;

assign tv_out_hsync_b = 0; assign tv_out_subcar_reset = 0; assign tv_out_blank_b = 0; adv7194init init7194 (reset, clock_27mhz, colorbars, tv_out_reset_b, tv_out_i2c_clock, tv_out_i2c_data); endmodule module videodraw (reset, clock_27mhz, y, cr, cb, h_position, v_position, row_done, frame_done, ycrcb); input reset, clock_27mhz; input [9:0] y, cr, cb; output [9:0] ycrcb; output [9:0] h_position, v_position; output row_done,frame_done; reg [10:0] sample_count; reg [9:0] line_count; reg f, v, h; reg [7:0] xy; reg [9:0] ycrcb; reg [9:0] h_position, v_position; //base these output signals on the position of the trace //since these quantities change at every clock tick, the signal is a pulse assign row_done = (sample_count == 1440); assign frame_done = (line_count == 524); always @(negedge clock_27mhz) if (reset) begin sample_count <= 0; line_count <= 0; end else begin if (sample_count < 1440) // Output active video // 720 pixels per line, two samples (Y and C) per sposition // Sample order is Cb0, Y0, Cr1, Y1, Cb2, Y2, . . . case (sample_count[1:0]) 2'b00: ycrcb <= cb; 2'b01: ycrcb <= y; 2'b10: ycrcb <= cr; 2'b11: ycrcb <= y; endcase else if (sample_count == 1440) // Start header for the EAV timecode ycrcb <= 10'h3FC; else if (sample_count == 1441) ycrcb <= 10'h000; else if (sample_count == 1442) ycrcb <= 10'h000; else if (sample_count == 1443)

// EAV timecode begin ycrcb <= {xy, 2'b00}; $display("EAV at line %d, sample %d is 0b%B", line_count, sample_count, xy); end else if (sample_count < 1712) ycrcb <= sample_count[0] ? 10'h200 : 10'h040; else if (sample_count == 1712) // Begin header for SAV timecode ycrcb <= 10'h3fC; else if (sample_count == 1713) ycrcb <= 10'h000; else if (sample_count == 1714) ycrcb <= 10'h000; else if (sample_count == 1715) // SAV timecode begin ycrcb <= {xy, 2'b00}; $display("SAV at line %d, sample %d is 0b%B", line_count, sample_count, xy); end if (sample_count == 1715) begin sample_count <= 0; if (line_count == 524) line_count <= 0; else line_count <= line_count+1; end else sample_count <= sample_count+1; end // Compute the F, V, H, X, and Y bits for the timecodes always @(sample_count or line_count) begin f <= (line_count < 9) || (line_count > 271); v <= (line_count < 19) || ((line_count > 262) && (line_count < 282)); h <= (sample_count > 1439) & (sample_count < 1715); xy <= {1'b1, f, v, h, v^h, f^h, f^v, f^v^h}; end always @(sample_count or line_count) if (line_count < 19) begin h_position <= 0; v_position <= 0; end else if (line_count < 262) begin h_position <= (sample_count[10:1] < 719) ? sample_count[10:1]+sample_count[0] : 0; v_position <= {line_count-19, 1'b1}; end

else if (line_count < 282) begin h_position <= 0; v_position <= 0; end else begin h_position <= (sample_count[10:1] < 719) ? sample_count[10:1]+sample_count[0] : 0; v_position <= {line_count-281, 1'b0}; end endmodule ///////////////////////// //Testing Pixel Generators ///////////////////////// module pixelgen1(reset, clock, hcount, vcount, y, cr, cb); input reset, clock; input [9:0] hcount, vcount; output [9:0] y, cr, cb; reg [7:0] r, g, b; //translate from rgb to ycrcb rgb2ycrcb trans(r,g,b,y,cr,cb); always @(negedge clock) begin if(hcount < 250) begin r <= 255; g <= 0; b <= 0; end else if(hcount < 500) begin r <= 0; g <= 255; b <= 0; end else begin r <= 0; g <= 0; b <= 255; end end endmodule module pixelgenalt(reset, clock, hcount, vcount, y, cr, cb); input reset, clock; input [9:0] hcount, vcount;

output [9:0] y, cr, cb; reg [7:0] r, g, b; wire[16:0] read_addr; wire[15:0] pixel_data; //translate from rgb to ycrcb rgb2ycrcb trans(r,g,b,y,cr,cb); always @(negedge clock) //decode the pixel data from the RAM into begin r <= 0; //top 5 g <= 0; //next 6 b <= {8{hcount[2]}}; //bottom 5 end endmodule module pixelgen(reset, clock, hcount, vcount, y, cr, cb); input reset, clock; input [9:0] hcount, vcount; output [9:0] y, cr, cb; reg [7:0] r, g, b; wire[16:0] read_addr; wire[15:0] pixel_data; //translate from rgb to ycrcb rgb2ycrcb trans(r,g,b,y,cr,cb); //translate from vcount and hcount to an address to the ram assign read_addr = vcount[9:1]*360+hcount[9:1]; //get a BRAM going here... video_mem mem(0,read_addr,0,clock,0,pixel_data,0); //no write ram always @(negedge clock) //decode the pixel data from the RAM into RGB begin /* r <= pixel_data[15:11] << 3; //top 5 g <= pixel_data[10:5] << 2; //next 6 b <= pixel_data[4:0] << 3; //bottom 5 */ r <= 0; g <= 0; b <= 0; end endmodule //////////////////////// // Position to Address Conversion ////////////////////////

module pos2addr(hcount,vcount, addr); input [9:0] hcount,vcount; output[16:0] addr; assign addr = vcount[9:1]*360+hcount[9:1]; endmodule /////////////////////////////// // Parsing of 16-bit color data /////////////////////////////// module rgb_data2ycrcb_data(pixel_data, y, cr ,cb); input [15:0] pixel_data; output [9:0] y, cr, cb; reg [7:0] r, g, b; //translate from rgb to ycrcb rgb2ycrcb trans(r,g,b,y,cr,cb); always @(pixel_data) //decode the pixel data from the RAM into RGB begin r <= pixel_data[15:11] << 3;//top 5 g <= pixel_data[10:5] << 2; //next 6 b <= pixel_data[4:0] << 3; //bottom 5 end endmodule //////////////////////////////////////////// //Conversion from 24-bit RGB to 10-bit YCrCb //////////////////////////////////////////// module rgb2ycrcb(r,g,b,y,cr,cb); input [7:0] r, g, b; output [9:0] y, cr, cb; reg [9:0] y; reg [9:0] cr, cb; reg [17:0] multr,multg,multb,bydiff,rydiff,multbyd,multryd; always @ (r, g, b) begin multr = 306*r >> 10; //306/1024 = .299 multg = 601*g >> 10; //601/1024 = .587 multb = 117*b >> 10; //117/1024 = .114 y = multr + multg + multb; //Y = .299R + .587G + .114B multryd = 128 + ((720*r - 720*y) >> 10); //720/1024 = .713 multbyd = 128 + ((579*b - 579*y) >> 10); //579/1024 = .565 cb = multbyd; //U = Cb = (B-Y)*.565 + 128, the offset is to keep these values >= 0 cr = multryd; //V = Cr = (R-Y)*.713 + 128

y = y << 2; //shift up these 8 bit values to 10 bits cb = cb << 2; cr = cr << 2; end endmodule

Visualizer.v module infodist(clock, bkt_avg, bkt_index, data_valid, b01data, b02data, b03data, b04data, b05data, b06data, b07data, b08data, frame_done); //Keeps track of the buckt values and smothens them out input clock; input [15:0] bkt_avg; input [2:0] bkt_index; input data_valid; input frame_done; output [15:0] b01data; //The output of the module output [15:0] b02data; output [15:0] b03data; output [15:0] b04data; output [15:0] b05data; output [15:0] b06data; output [15:0] b07data; output [15:0] b08data; reg [15:0] b01data = 0; //The registers storing the output reg [15:0] b02data = 0; reg [15:0] b03data = 0; reg [15:0] b04data = 0; reg [15:0] b05data = 0; reg [15:0] b06data = 0; reg [15:0] b07data = 0; reg [15:0] b08data = 0; reg [15:0] t01data = 0; //The registers storing the most reg [15:0] t02data = 0; //most recent value, which we will reg [15:0] t03data = 0; //average with the current value reg [15:0] t04data = 0; reg [15:0] t05data = 0; reg [15:0] t06data = 0; reg [15:0] t07data = 0; reg [15:0] t08data = 0; always @ (posedge clock) if (frame_done) //When we know we can change the value begin //of the output without the screen flickering b01data <= (t01data + b01data) >> 1; //Take the average b02data <= (t02data + b02data) >> 1; b03data <= (t03data + b03data) >> 1; b04data <= (t04data + b04data) >> 1; b05data <= (t05data + b05data) >> 1; b06data <= (t06data + b06data) >> 1; b07data <= (t07data + b07data) >> 1; b08data <= (t08data + b08data) >> 1; end always @ (posedge clock) begin case (bkt_index) 0 : t01data <= bkt_avg; //Store the current value

1 : t02data <= bkt_avg; //of the bucket 2 : t03data <= bkt_avg; //Note that it doesnt matter 3 : t04data <= bkt_avg; //visually if we do this multiple 4 : t05data <= bkt_avg; //times before a frame_done 5 : t06data <= bkt_avg; 6 : t07data <= bkt_avg; 7 : t08data <= bkt_avg; endcase end endmodule module b0regionrad(hcount,vcount, pixel,radius); //Outputs a circle secment for the "radial" visualization parameter X = 180; parameter Y = 121; parameter COLOR = 16'b0000000000011111; input [9:0] hcount; input [9:0] vcount, radius; output [15:0] pixel; reg [15:0] pixel; always @ (radius or hcount or vcount) begin if((hcount * hcount) + (vcount * vcount) + (X*X) + (Y*Y) <= ((radius) * (radius))+2*(hcount*X+vcount*Y) && hcount >= X && vcount <= Y && hcount + vcount >= X+Y) //Check to see if it is in the right segment //(hcount-X)^2+(vcountY)^2~=(RADIUS+-1)^2 (in the range?) pixel <= COLOR; else pixel <= 16'b1111111111111111; //White background end endmodule //ALL OTHERS ARE SIMILAR, WITH THE ONLY DIFFERENCE BEING THE SEGMENT IT CHECKS //---------------------------------------------------------------------------- module b1regionrad(hcount,vcount, pixel,radius); parameter X = 180; parameter Y = 121; parameter COLOR = 16'b0000000000011111; input [9:0] hcount; input [9:0] vcount, radius; output [15:0] pixel; reg [15:0] pixel; always @ (radius or hcount or vcount) begin if((hcount * hcount) + (vcount * vcount) + (X*X) + (Y*Y) <= ((radius) * (radius))+2*(hcount*X+vcount*Y) &&

hcount >= X && vcount <= Y && hcount + vcount <= X+Y) //(hcount-X)^2+(vcountY)^2<=(RADIUS)^2 and in the right segment pixel <= COLOR; else pixel <= 16'b1111111111111111; end endmodule module b2regionrad(hcount,vcount, pixel,radius); parameter X = 180; parameter Y = 121; parameter COLOR = 16'b0000000000011111; input [9:0] hcount; input [9:0] vcount, radius; output [15:0] pixel; reg [15:0] pixel; always @ (radius or hcount or vcount) begin if((hcount * hcount) + (vcount * vcount) + (X*X) + (Y*Y) <= ((radius) * (radius))+2*(hcount*X+vcount*Y) && hcount <= X && vcount <= Y && hcount + Y <= vcount+X) pixel <= COLOR; else pixel <= 16'b1111111111111111; end endmodule module b3regionrad(hcount,vcount, pixel,radius); parameter X = 180; parameter Y = 121; parameter COLOR = 16'b0000000000011111; input [9:0] hcount; input [9:0] vcount, radius; output [15:0] pixel; reg [15:0] pixel; always @ (radius or hcount or vcount) begin if((hcount * hcount) + (vcount * vcount) + (X*X) + (Y*Y) <= ((radius) * (radius))+2*(hcount*X+vcount*Y) && hcount <= X && vcount <= Y && hcount + Y >= vcount+X) pixel <= COLOR; else pixel <= 16'b1111111111111111; end endmodule module b4regionrad(hcount,vcount, pixel,radius); parameter X = 180; parameter Y = 121; parameter COLOR = 16'b0000000000011111; input [9:0] hcount; input [9:0] vcount, radius;

output [15:0] pixel; reg [15:0] pixel; always @ (radius or hcount or vcount) begin if((hcount * hcount) + (vcount * vcount) + (X*X) + (Y*Y) <= ((radius) * (radius))+2*(hcount*X+vcount*Y) && hcount <= X && vcount >= Y && hcount + vcount <= X+Y) pixel <= COLOR; else pixel <= 16'b1111111111111111; end endmodule module b5regionrad(hcount,vcount, pixel,radius); parameter X = 180; parameter Y = 121; parameter COLOR = 16'b0000000000011111; input [9:0] hcount; input [9:0] vcount, radius; output [15:0] pixel; reg [15:0] pixel; always @ (radius or hcount or vcount) begin if((hcount * hcount) + (vcount * vcount) + (X*X) + (Y*Y) <= ((radius) * (radius))+2*(hcount*X+vcount*Y) && hcount <= X && vcount >= Y && hcount + vcount >= X+Y) pixel <= COLOR; else pixel <= 16'b1111111111111111; end endmodule module b6regionrad(hcount,vcount, pixel,radius); parameter X = 180; parameter Y = 121; parameter COLOR = 16'b0000000000011111; input [9:0] hcount; input [9:0] vcount, radius; output [15:0] pixel; reg [15:0] pixel; always @ (radius or hcount or vcount) begin if((hcount * hcount) + (vcount * vcount) + (X*X) + (Y*Y) <= ((radius) * (radius))+2*(hcount*X+vcount*Y) && hcount >= X && vcount >= Y && hcount + Y <= vcount+X) pixel <= COLOR; else pixel <= 16'b1111111111111111; end endmodule module b7regionrad(hcount,vcount, pixel,radius);

parameter X = 180; parameter Y = 121; parameter COLOR = 16'b0000000000011111; input [9:0] hcount; input [9:0] vcount, radius; output [15:0] pixel; reg [15:0] pixel; always @ (radius or hcount or vcount) begin if((hcount * hcount) + (vcount * vcount) + (X*X) + (Y*Y) <= ((radius) * (radius))+2*(hcount*X+vcount*Y) && hcount >= X && vcount >= Y && hcount + Y >= vcount+X) pixel <= COLOR; else pixel <= 16'b1111111111111111; end endmodule //---------------------------------------------------------------------------- module circleoutline(hcount, vcount, pixel, radius); //Outputs a circle with a specified radius centered at X,Y which are parameters parameter X = 180; parameter Y = 121; parameter COLOR = 16'b0000000000011111; input [9:0] hcount; input [9:0] vcount, radius; output [15:0] pixel; reg [15:0] pixel; always @ (radius or hcount or vcount) begin if((hcount * hcount) + (vcount * vcount) + (X*X) + (Y*Y) <= ((radius+1) * (radius+1))+2*(hcount*X+vcount*Y) && (hcount * hcount) + (vcount * vcount) + (X*X) + (Y*Y) >= ((radius-1) * (radius-1))+2*(hcount*X+vcount*Y) ) //(hcount-X)^2+(vcountY)^2~=(RADIUS+-1)^2 (in the range?) pixel <= COLOR; //If we are on the border of the circle, output the real color else if((hcount * hcount) + (vcount * vcount) + (X*X) + (Y*Y) < ((radius-1) * (radius-1))+2*(hcount*X+vcount*Y)) pixel <= COLOR | 16'b0111101111101111; //If we are in the circle, output a ligher version of the color else pixel <= 16'b1111111111111111; //If we are outside of the circle, use the white background end endmodule module blob(vcount, hcount, pixel, height);
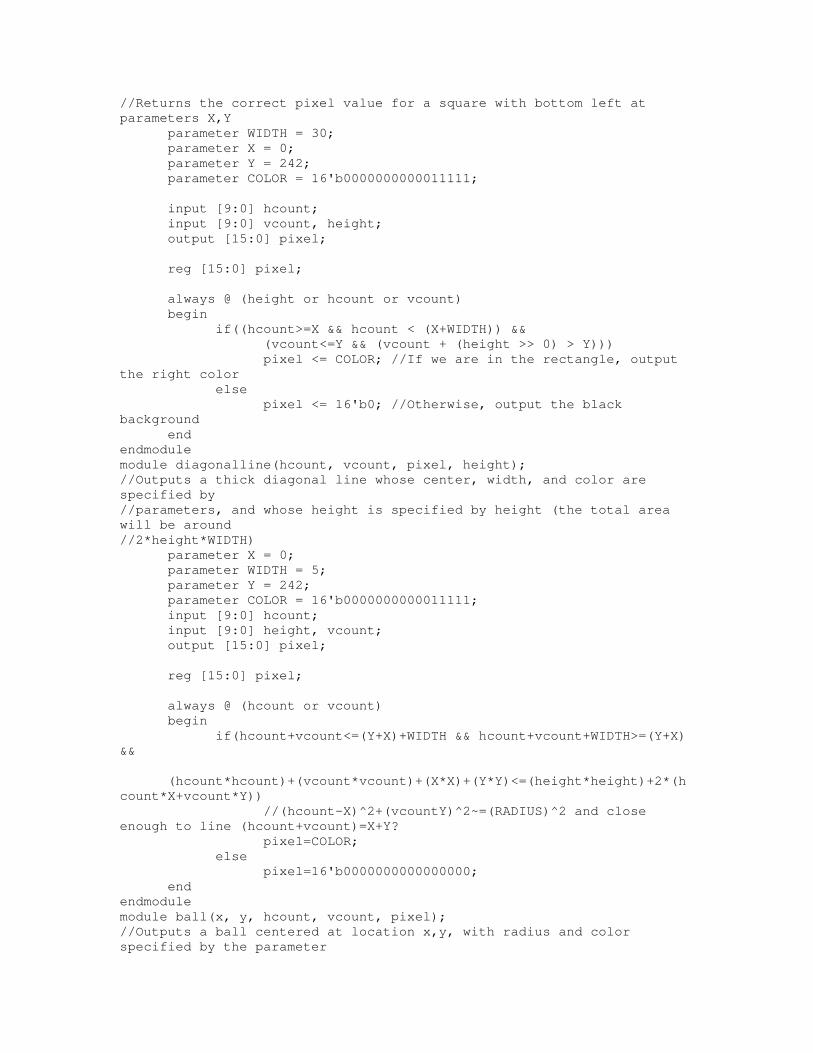
//Returns the correct pixel value for a square with bottom left at parameters X,Y parameter WIDTH = 30; parameter X = 0; parameter Y = 242; parameter COLOR = 16'b0000000000011111; input [9:0] hcount; input [9:0] vcount, height; output [15:0] pixel; reg [15:0] pixel; always @ (height or hcount or vcount) begin if((hcount>=X && hcount < (X+WIDTH)) && (vcount<=Y && (vcount + (height >> 0) > Y))) pixel <= COLOR; //If we are in the rectangle, output the right color else pixel <= 16'b0; //Otherwise, output the black background end endmodule module diagonalline(hcount, vcount, pixel, height); //Outputs a thick diagonal line whose center, width, and color are specified by //parameters, and whose height is specified by height (the total area will be around //2*height*WIDTH) parameter X = 0; parameter WIDTH = 5; parameter Y = 242; parameter COLOR = 16'b0000000000011111; input [9:0] hcount; input [9:0] height, vcount; output [15:0] pixel; reg [15:0] pixel; always @ (hcount or vcount) begin if(hcount+vcount<=(Y+X)+WIDTH && hcount+vcount+WIDTH>=(Y+X) && (hcount*hcount)+(vcount*vcount)+(X*X)+(Y*Y)<=(height*height)+2*(hcount*X+vcount*Y)) //(hcount-X)^2+(vcountY)^2~=(RADIUS)^2 and close enough to line (hcount+vcount)=X+Y? pixel=COLOR; else pixel=16'b0000000000000000; end endmodule module ball(x, y, hcount, vcount, pixel); //Outputs a ball centered at location x,y, with radius and color specified by the parameter
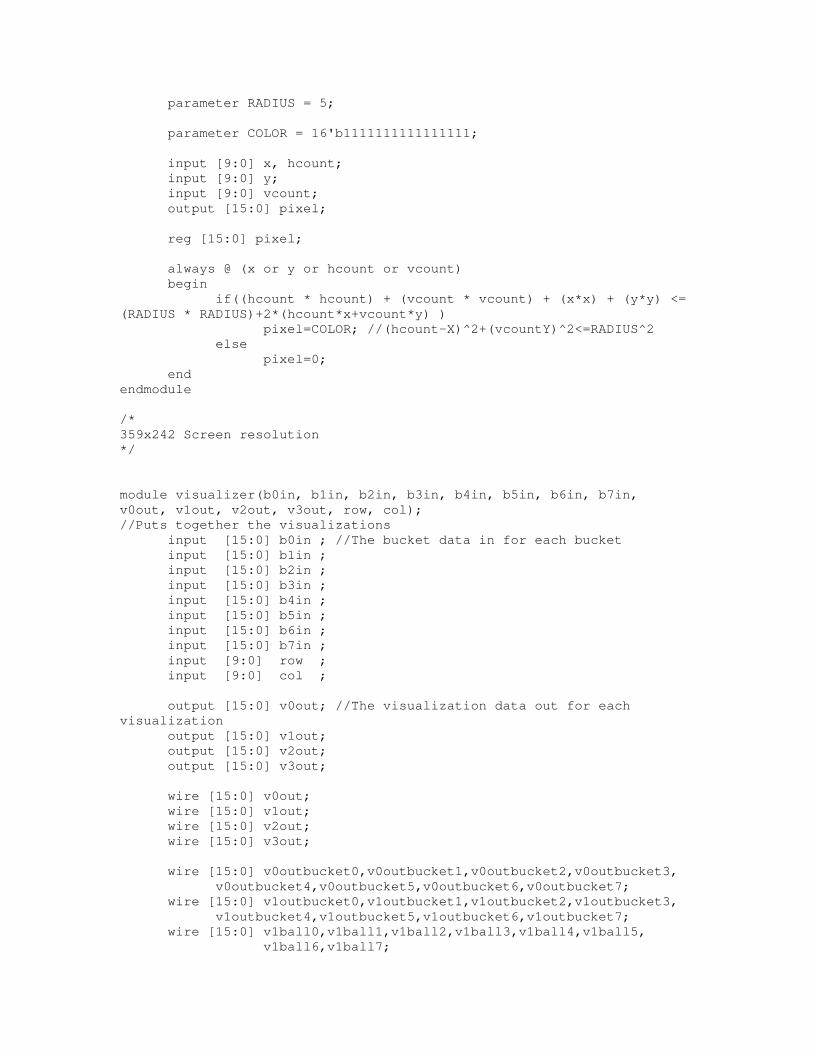
parameter RADIUS = 5; parameter COLOR = 16'b1111111111111111; input [9:0] x, hcount; input [9:0] y; input [9:0] vcount; output [15:0] pixel; reg [15:0] pixel; always @ (x or y or hcount or vcount) begin if((hcount * hcount) + (vcount * vcount) + (x*x) + (y*y) <= (RADIUS * RADIUS)+2*(hcount*x+vcount*y) ) pixel=COLOR; //(hcount-X)^2+(vcountY)^2<=RADIUS^2 else pixel=0; end endmodule /* 359x242 Screen resolution */ module visualizer(b0in, b1in, b2in, b3in, b4in, b5in, b6in, b7in, v0out, v1out, v2out, v3out, row, col); //Puts together the visualizations input [15:0] b0in ; //The bucket data in for each bucket input [15:0] b1in ; input [15:0] b2in ; input [15:0] b3in ; input [15:0] b4in ; input [15:0] b5in ; input [15:0] b6in ; input [15:0] b7in ; input [9:0] row ; input [9:0] col ; output [15:0] v0out; //The visualization data out for each visualization output [15:0] v1out; output [15:0] v2out; output [15:0] v3out; wire [15:0] v0out; wire [15:0] v1out; wire [15:0] v2out; wire [15:0] v3out; wire [15:0] v0outbucket0,v0outbucket1,v0outbucket2,v0outbucket3, v0outbucket4,v0outbucket5,v0outbucket6,v0outbucket7; wire [15:0] v1outbucket0,v1outbucket1,v1outbucket2,v1outbucket3, v1outbucket4,v1outbucket5,v1outbucket6,v1outbucket7; wire [15:0] v1ball0,v1ball1,v1ball2,v1ball3,v1ball4,v1ball5, v1ball6,v1ball7;
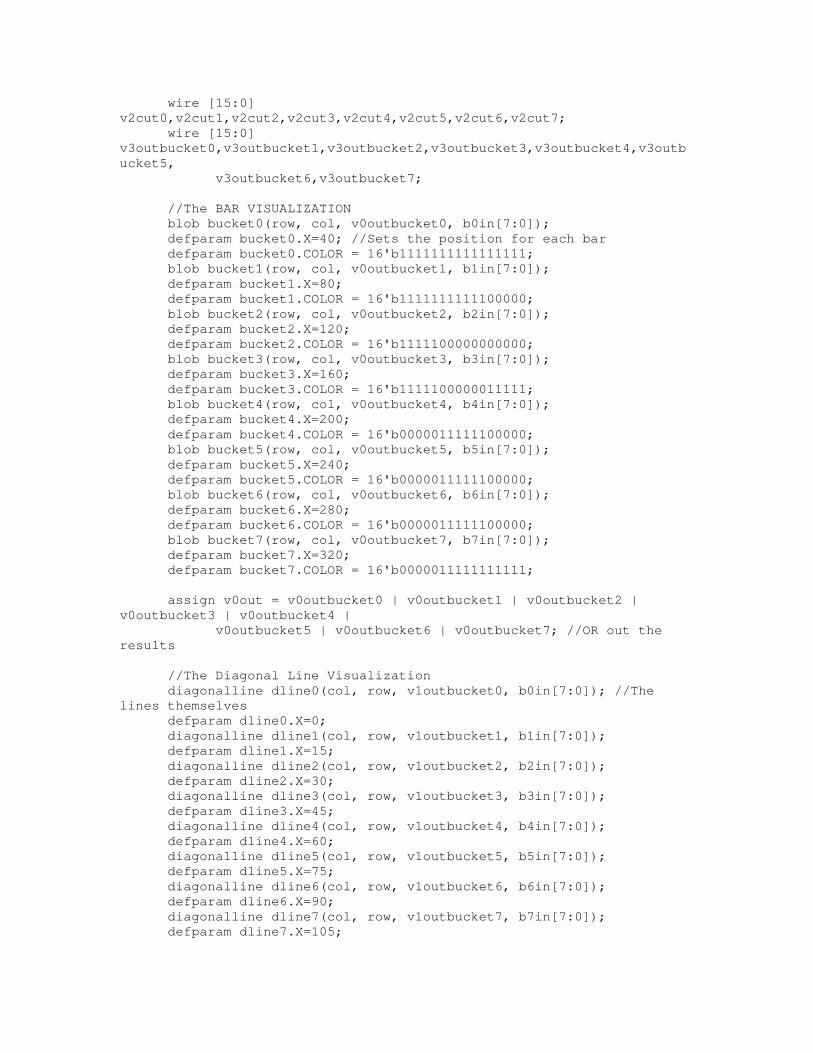
wire [15:0] v2cut0,v2cut1,v2cut2,v2cut3,v2cut4,v2cut5,v2cut6,v2cut7; wire [15:0] v3outbucket0,v3outbucket1,v3outbucket2,v3outbucket3,v3outbucket4,v3outbucket5, v3outbucket6,v3outbucket7; //The BAR VISUALIZATION blob bucket0(row, col, v0outbucket0, b0in[7:0]); defparam bucket0.X=40; //Sets the position for each bar defparam bucket0.COLOR = 16'b1111111111111111; blob bucket1(row, col, v0outbucket1, b1in[7:0]); defparam bucket1.X=80; defparam bucket1.COLOR = 16'b1111111111100000; blob bucket2(row, col, v0outbucket2, b2in[7:0]); defparam bucket2.X=120; defparam bucket2.COLOR = 16'b1111100000000000; blob bucket3(row, col, v0outbucket3, b3in[7:0]); defparam bucket3.X=160; defparam bucket3.COLOR = 16'b1111100000011111; blob bucket4(row, col, v0outbucket4, b4in[7:0]); defparam bucket4.X=200; defparam bucket4.COLOR = 16'b0000011111100000; blob bucket5(row, col, v0outbucket5, b5in[7:0]); defparam bucket5.X=240; defparam bucket5.COLOR = 16'b0000011111100000; blob bucket6(row, col, v0outbucket6, b6in[7:0]); defparam bucket6.X=280; defparam bucket6.COLOR = 16'b0000011111100000; blob bucket7(row, col, v0outbucket7, b7in[7:0]); defparam bucket7.X=320; defparam bucket7.COLOR = 16'b0000011111111111; assign v0out = v0outbucket0 | v0outbucket1 | v0outbucket2 | v0outbucket3 | v0outbucket4 | v0outbucket5 | v0outbucket6 | v0outbucket7; //OR out the results //The Diagonal Line Visualization diagonalline dline0(col, row, v1outbucket0, b0in[7:0]); //The lines themselves defparam dline0.X=0; diagonalline dline1(col, row, v1outbucket1, b1in[7:0]); defparam dline1.X=15; diagonalline dline2(col, row, v1outbucket2, b2in[7:0]); defparam dline2.X=30; diagonalline dline3(col, row, v1outbucket3, b3in[7:0]); defparam dline3.X=45; diagonalline dline4(col, row, v1outbucket4, b4in[7:0]); defparam dline4.X=60; diagonalline dline5(col, row, v1outbucket5, b5in[7:0]); defparam dline5.X=75; diagonalline dline6(col, row, v1outbucket6, b6in[7:0]); defparam dline6.X=90; diagonalline dline7(col, row, v1outbucket7, b7in[7:0]); defparam dline7.X=105;

wire [9:0] xball0loc,yball0loc,xball1loc,yball1loc,xball2loc,yball2loc, xball3loc,yball3loc,xball4loc,yball4loc,xball5loc,yball5loc, xball6loc,yball6loc,xball7loc,yball7loc; //The initial locations for the balls in the diagonal lines visualization assign xball0loc = 0+b0in[7:0]>>1+b0in[7:0]>>2; assign yball0loc = 242 - b0in[7:0]>>1 - b0in[7:0]>>2; ball b0(xball0loc, yball0loc, col, row, v1ball0); assign xball1loc = 15+b1in[7:0]>>1+b1in[7:0]>>2; assign yball1loc = 242 - b1in[7:0]>>1 - b1in[7:0]>>2; ball b1(xball1loc, yball1loc, col, row, v1ball1); assign xball2loc = 30+b2in[7:0]>>1+b2in[7:0]>>2; assign yball2loc = 242 - b2in[7:0]>>1 - b2in[7:0]>>2; ball b2(xball2loc, yball2loc, col, row, v1ball2); assign xball3loc = 45+b3in[7:0]>>1+b3in[7:0]>>2; assign yball3loc = 242 - b3in[7:0]>>1 - b3in[7:0]>>2; ball b3(xball3loc, yball3loc, col, row, v1ball3); assign xball4loc = 60+b4in[7:0]>>1+b4in[7:0]>>2; assign yball4loc = 242 - b4in[7:0]>>1 - b4in[7:0]>>2; ball b4(xball4loc, yball4loc, col, row, v1ball4); assign xball5loc = 75+b5in[7:0]>>1+b5in[7:0]>>2; assign yball5loc = 242 - b5in[7:0]>>1 - b5in[7:0]>>2; ball b5(xball5loc, yball5loc, col, row, v1ball5); assign xball6loc = 90+b6in[7:0]>>1+b6in[7:0]>>2; assign yball6loc = 242 - b6in[7:0]>>1 - b6in[7:0]>>2; ball b6(xball6loc, yball6loc, col, row, v1ball6); assign xball7loc = 105+b5in[7:0]>>1+b5in[7:0]>>2; assign yball7loc = 242 - b7in[7:0]>>1 - b7in[7:0]>>2; ball b7(xball7loc, yball7loc, col, row, v1ball7); //Now OR together everything to get the Diagonal Lines visualizatoin assign v1out = v1outbucket0 | v1outbucket1 | v1outbucket2 | v1outbucket3 | v1outbucket4 | v1outbucket5 | v1outbucket6 | v1outbucket7 | v1ball0 | v1ball1 | v1ball2 | v1ball3 | v1ball4 | v1ball5 | v1ball6 | v1ball7; //End Diagonal Line Visualization //"Radial" Visualization b0regionrad vreg0(col, row, v2cut0, b0in[7:0]); b1regionrad vreg1(col, row, v2cut1, b1in[7:0]); b2regionrad vreg2(col, row, v2cut2, b2in[7:0]); b3regionrad vreg3(col, row, v2cut3, b3in[7:0]); b4regionrad vreg4(col, row, v2cut4, b4in[7:0]); b5regionrad vreg5(col, row, v2cut5, b5in[7:0]); b6regionrad vreg6(col, row, v2cut6, b6in[7:0]); b7regionrad vreg7(col, row, v2cut7, b7in[7:0]); //AND togethter all of the components assign v2out = v2cut0 & v2cut1 & v2cut2 & v2cut3 & v2cut4 & v2cut5 & v2cut6 & v2cut7; //End Ratio Visualization

//Intersecting circle visualization //Arranged such that the colors align and the buckets form a diamond circleoutline coline0(col, row, v3outbucket0, b0in[7:0]); defparam coline0.X = 180; defparam coline0.Y = 60; defparam coline0.COLOR = 16'b1111100000000000; circleoutline coline1(col, row, v3outbucket1, b1in[7:0]); defparam coline1.X = 160; defparam coline1.Y = 120; defparam coline1.COLOR = 16'b0000000000011111; circleoutline coline2(col, row, v3outbucket2, b2in[7:0]); defparam coline2.X = 200; defparam coline2.Y = 120; defparam coline2.COLOR = 16'b0000000000011111; circleoutline coline3(col, row, v3outbucket3, b3in[7:0]); defparam coline3.X = 120; defparam coline3.Y = 140; defparam coline3.COLOR = 16'b0000011111100000; circleoutline coline4(col, row, v3outbucket4, b4in[7:0]); defparam coline4.X = 240; defparam coline4.Y = 140; defparam coline4.COLOR = 16'b0000011111100000; circleoutline coline5(col, row, v3outbucket5, b5in[7:0]); defparam coline5.X = 160; defparam coline5.Y = 160; defparam coline5.COLOR = 16'b0000000000011111; circleoutline coline6(col, row, v3outbucket6, b6in[7:0]); defparam coline6.X = 200; defparam coline6.Y = 160; defparam coline6.COLOR = 16'b0000000000011111; circleoutline coline7(col, row, v3outbucket7, b7in[7:0]); defparam coline7.X = 180; defparam coline7.Y = 200; defparam coline7.COLOR = 16'b1111100000000000; assign v3out = v3outbucket0 & v3outbucket1 & v3outbucket2 & v3outbucket3 & v3outbucket4 & v3outbucket5 & v3outbucket6 & v3outbucket7; //AND together the results //End Intersecting Circles Visualization endmodule module doer(clock, row_done, vcount, we, row, col); //This module outputs an appropirate location for us to write to the RAM //so that we don't interfere with the video out system input clock; input row_done; input [9:0] vcount; output we; output [9:0] row; output [9:0] col; reg [9:0] col=0; //Start off at the first column and increment reg we; reg [9:0] row;
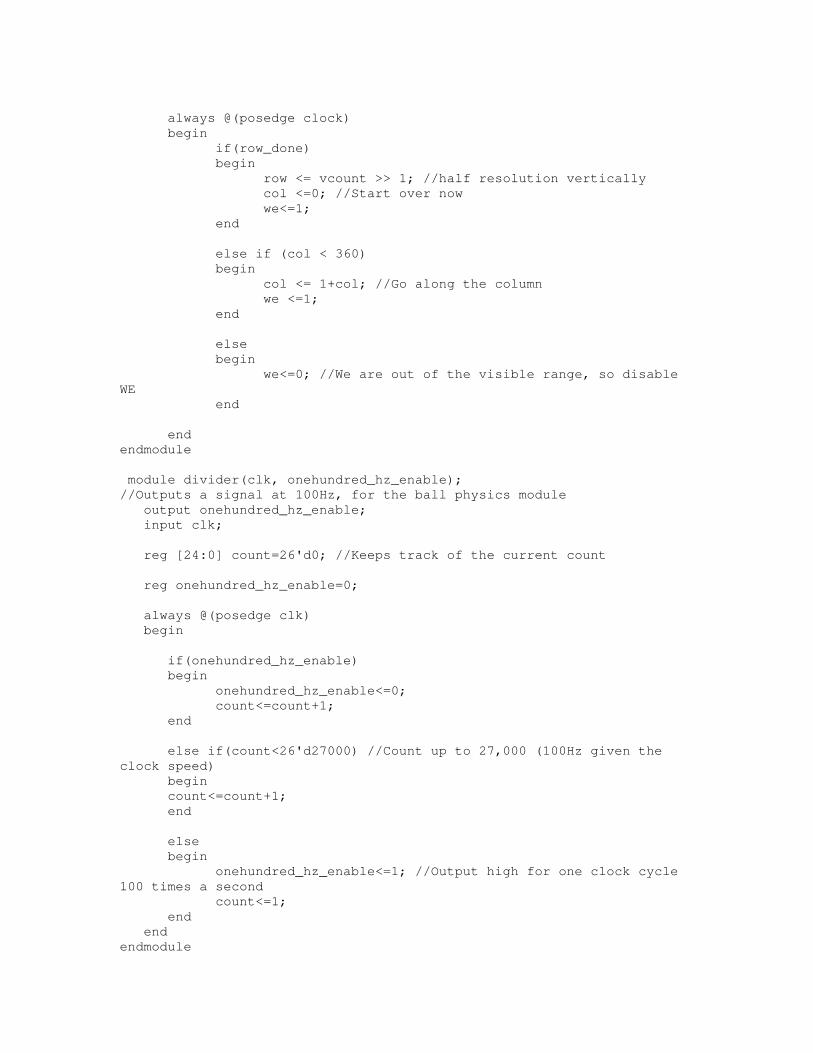
always @(posedge clock) begin if(row_done) begin row <= vcount >> 1; //half resolution vertically col <=0; //Start over now we<=1; end else if (col < 360) begin col <= 1+col; //Go along the column we <=1; end else begin we<=0; //We are out of the visible range, so disable WE end end endmodule module divider(clk, onehundred_hz_enable); //Outputs a signal at 100Hz, for the ball physics module output onehundred_hz_enable; input clk; reg [24:0] count=26'd0; //Keeps track of the current count reg onehundred_hz_enable=0; always @(posedge clk) begin if(onehundred_hz_enable) begin onehundred_hz_enable<=0; count<=count+1; end else if(count<26'd27000) //Count up to 27,000 (100Hz given the clock speed) begin count<=count+1; end else begin onehundred_hz_enable<=1; //Output high for one clock cycle 100 times a second count<=1; end end endmodule
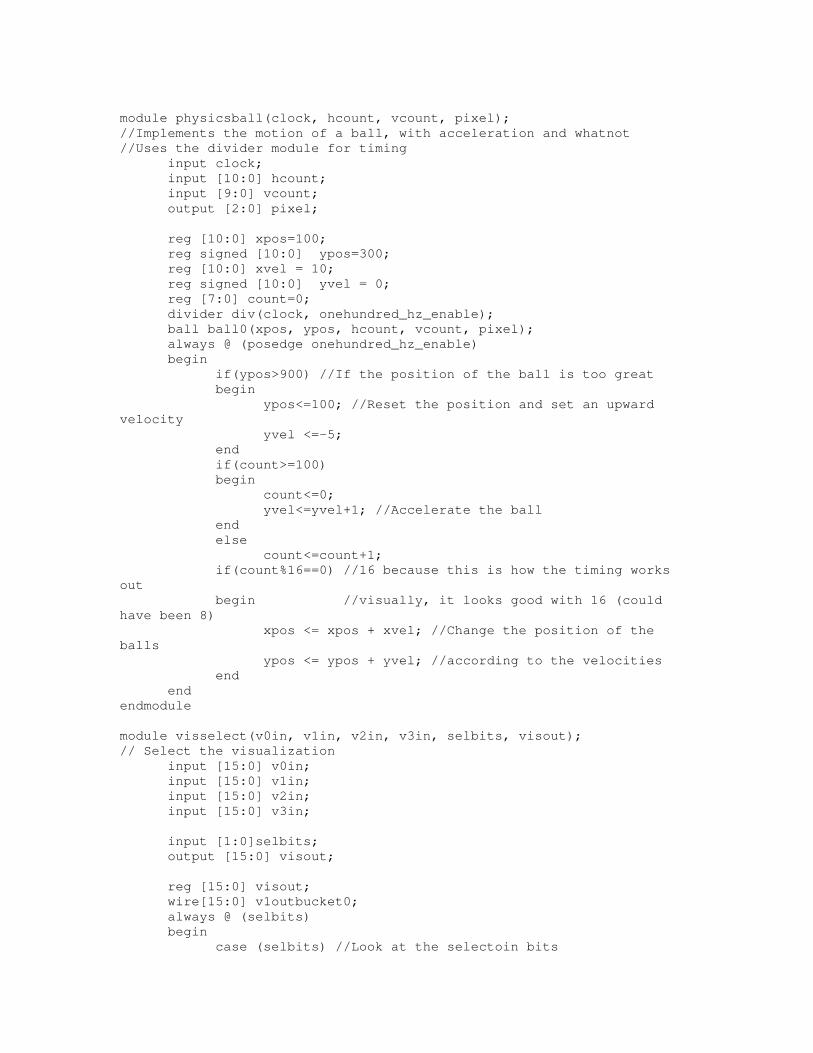
module physicsball(clock, hcount, vcount, pixel); //Implements the motion of a ball, with acceleration and whatnot //Uses the divider module for timing input clock; input [10:0] hcount; input [9:0] vcount; output [2:0] pixel; reg [10:0] xpos=100; reg signed [10:0] ypos=300; reg [10:0] xvel = 10; reg signed [10:0] yvel = 0; reg [7:0] count=0; divider div(clock, onehundred_hz_enable); ball ball0(xpos, ypos, hcount, vcount, pixel); always @ (posedge onehundred_hz_enable) begin if(ypos>900) //If the position of the ball is too great begin ypos<=100; //Reset the position and set an upward velocity yvel <=-5; end if(count>=100) begin count<=0; yvel<=yvel+1; //Accelerate the ball end else count<=count+1; if(count%16==0) //16 because this is how the timing works out begin //visually, it looks good with 16 (could have been 8) xpos <= xpos + xvel; //Change the position of the balls ypos <= ypos + yvel; //according to the velocities end end endmodule module visselect(v0in, v1in, v2in, v3in, selbits, visout); // Select the visualization input [15:0] v0in; input [15:0] v1in; input [15:0] v2in; input [15:0] v3in; input [1:0]selbits; output [15:0] visout; reg [15:0] visout; wire[15:0] v1outbucket0; always @ (selbits) begin case (selbits) //Look at the selectoin bits
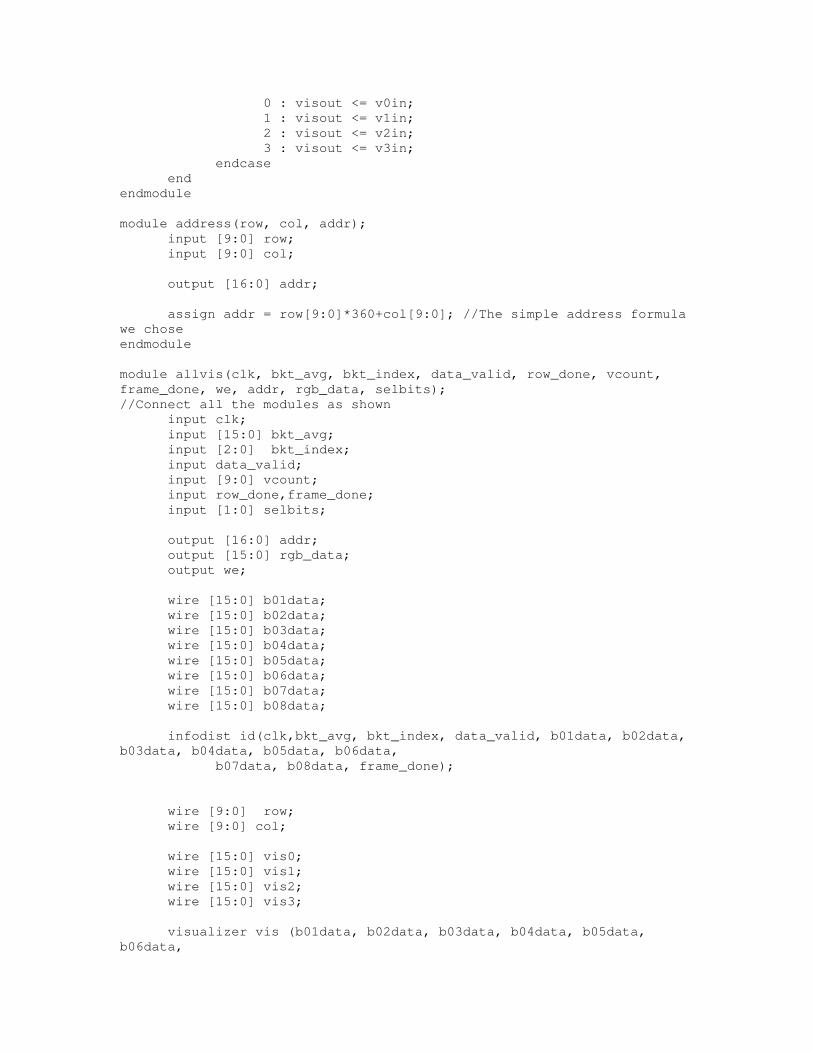
0 : visout <= v0in; 1 : visout <= v1in; 2 : visout <= v2in; 3 : visout <= v3in; endcase end endmodule module address(row, col, addr); input [9:0] row; input [9:0] col; output [16:0] addr; assign addr = row[9:0]*360+col[9:0]; //The simple address formula we chose endmodule module allvis(clk, bkt_avg, bkt_index, data_valid, row_done, vcount, frame_done, we, addr, rgb_data, selbits); //Connect all the modules as shown input clk; input [15:0] bkt_avg; input [2:0] bkt_index; input data_valid; input [9:0] vcount; input row_done,frame_done; input [1:0] selbits; output [16:0] addr; output [15:0] rgb_data; output we; wire [15:0] b01data; wire [15:0] b02data; wire [15:0] b03data; wire [15:0] b04data; wire [15:0] b05data; wire [15:0] b06data; wire [15:0] b07data; wire [15:0] b08data; infodist id(clk,bkt_avg, bkt_index, data_valid, b01data, b02data, b03data, b04data, b05data, b06data, b07data, b08data, frame_done); wire [9:0] row; wire [9:0] col; wire [15:0] vis0; wire [15:0] vis1; wire [15:0] vis2; wire [15:0] vis3; visualizer vis (b01data, b02data, b03data, b04data, b05data, b06data,

b07data, b08data, vis0, vis1, vis2, vis3, row, col); visselect vselect (vis0, vis1, vis2, vis3, selbits, rgb_data); doer visdoer (clk, row_done, vcount, we, row, col); address visaddr (row, col, addr); endmodule
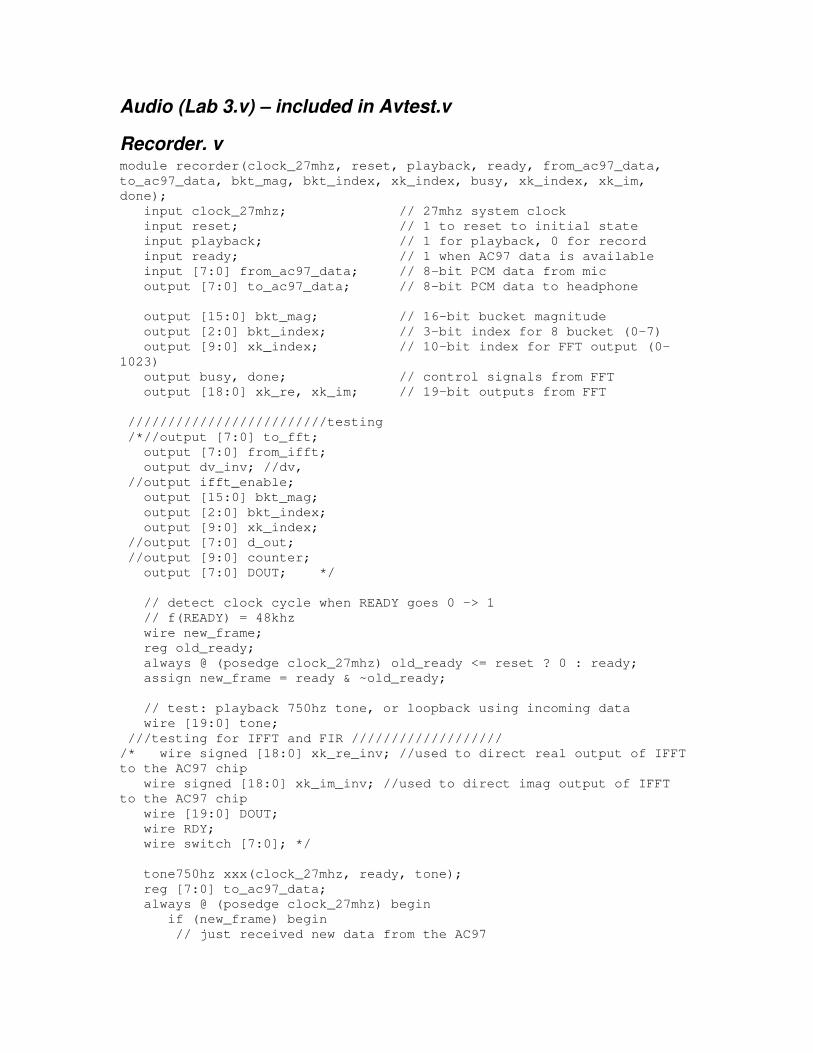
Audio (Lab 3.v) – included in Avtest.v
Recorder. v module recorder(clock_27mhz, reset, playback, ready, from_ac97_data, to_ac97_data, bkt_mag, bkt_index, xk_index, busy, xk_index, xk_im, done); input clock_27mhz; // 27mhz system clock input reset; // 1 to reset to initial state input playback; // 1 for playback, 0 for record input ready; // 1 when AC97 data is available input [7:0] from_ac97_data; // 8-bit PCM data from mic output [7:0] to_ac97_data; // 8-bit PCM data to headphone output [15:0] bkt_mag; // 16-bit bucket magnitude output [2:0] bkt_index; // 3-bit index for 8 bucket (0-7) output [9:0] xk_index; // 10-bit index for FFT output (0-1023) output busy, done; // control signals from FFT output [18:0] xk_re, xk_im; // 19-bit outputs from FFT /////////////////////////testing /*//output [7:0] to_fft; output [7:0] from_ifft; output dv_inv; //dv, //output ifft_enable; output [15:0] bkt_mag; output [2:0] bkt_index; output [9:0] xk_index; //output [7:0] d_out; //output [9:0] counter; output [7:0] DOUT; */ // detect clock cycle when READY goes 0 -> 1 // f(READY) = 48khz wire new_frame; reg old_ready; always @ (posedge clock_27mhz) old_ready <= reset ? 0 : ready; assign new_frame = ready & ~old_ready; // test: playback 750hz tone, or loopback using incoming data wire [19:0] tone; ///testing for IFFT and FIR /////////////////// /* wire signed [18:0] xk_re_inv; //used to direct real output of IFFT to the AC97 chip wire signed [18:0] xk_im_inv; //used to direct imag output of IFFT to the AC97 chip wire [19:0] DOUT; wire RDY; wire switch [7:0]; */ tone750hz xxx(clock_27mhz, ready, tone); reg [7:0] to_ac97_data; always @ (posedge clock_27mhz) begin if (new_frame) begin // just received new data from the AC97

to_ac97_data <= (playback)? tone[19:12] : from_ac97_data; // run the input out since IFFT isn't working end end ///////////////////testing IFFT /* //wire [7:0] to_fft; assign to_fft = tone[19:12]; assign from_ifft = xk_re_inv[18:11]; //reg ifft_enable; //*****continuous assign******** //assign ifft_enable = dv? ready : 0; //used to delay the ce of the IFFT, but clock with the ready and the FFT //////// //*****always block******* /*always @ (posedge clock_27mhz) begin if (dv) ifft_enable <= ready; end */ //connections for the FFT wire [9:0] xk_index; //enumerating which of the 1024 samples are outputing wire signed [18:0] xk_re; wire signed [18:0] xk_im; wire busy, done; //connections for the bucketizer wire [15:0] bkt_mag; wire [2:0] bkt_index; ////FFT///////////////////////////////////////// /* ports for FFT (forward) input [7 : 0] xn_re; //real input input [7 : 0] xn_im; //no imaginary input => set to 0; input start; //start, always working => set to 1; input [4 : 0] nfft; // set to 10 for 1024 point fft input nfft_we; // not resetting so set to 0; input fwd_inv; // forward FFT = 1, inverse = 0; input fwd_inv_we; // no need to change from particular instantiation, set to 0; input ce; // clock enable: ready signal, only count the clock once data is ready from ac97 input clk; // system clock = 27mhz output [18 : 0] xk_re; output [18 : 0] xk_im; output [9 : 0] xn_index; output [9 : 0] xk_index; output rfd; output busy; output dv; output edone; output done; */
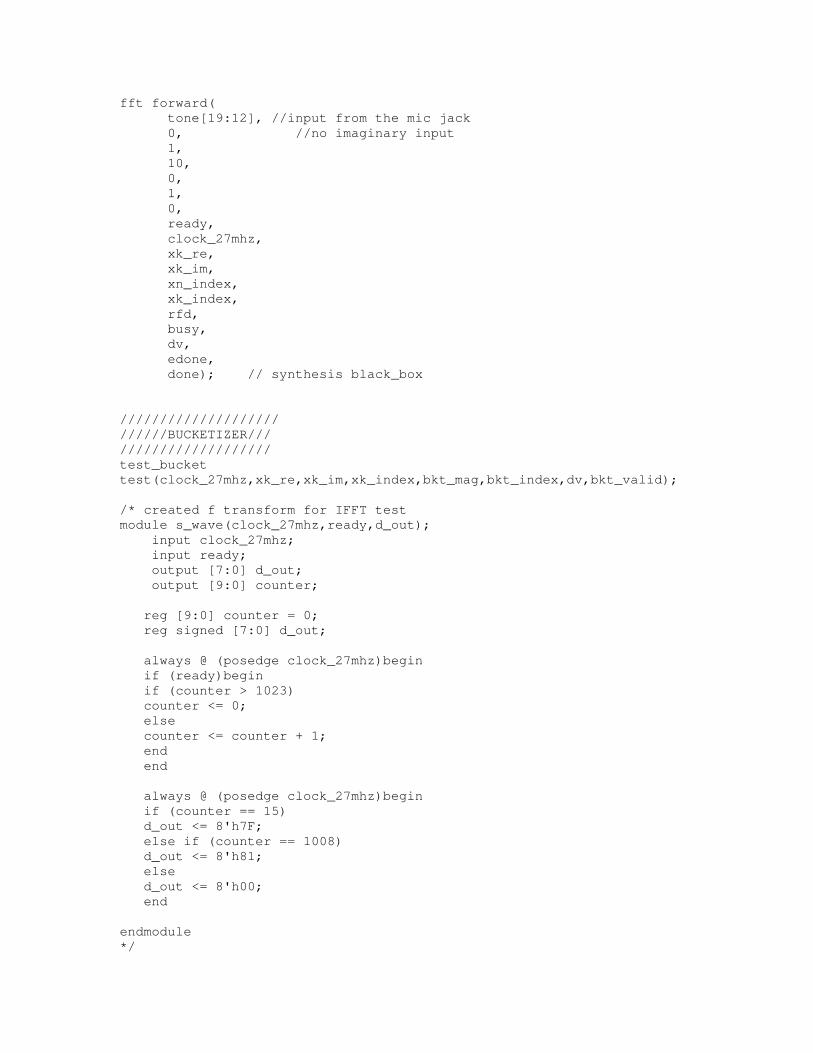
fft forward( tone[19:12], //input from the mic jack 0, //no imaginary input 1, 10, 0, 1, 0, ready, clock_27mhz, xk_re, xk_im, xn_index, xk_index, rfd, busy, dv, edone, done); // synthesis black_box //////////////////// //////BUCKETIZER/// /////////////////// test_bucket test(clock_27mhz,xk_re,xk_im,xk_index,bkt_mag,bkt_index,dv,bkt_valid); /* created f transform for IFFT test module s_wave(clock_27mhz,ready,d_out); input clock_27mhz; input ready; output [7:0] d_out; output [9:0] counter; reg [9:0] counter = 0; reg signed [7:0] d_out; always @ (posedge clock_27mhz)begin if (ready)begin if (counter > 1023) counter <= 0; else counter <= counter + 1; end end always @ (posedge clock_27mhz)begin if (counter == 15) d_out <= 8'h7F; else if (counter == 1008) d_out <= 8'h81; else d_out <= 8'h00; end endmodule */

//wire [7:0] d_out; //s_wave s(clock_27mhz, ready, d_out); //test for the IFFT /* fft inverse( DOUT, //xk_re [18:11], //mul_re - from the equal_mul before going into IFFT 0, //xk_im [18:11], //mul_im - from the equal_mul before going into IFFT 1, 10, 0, 0, 0, RDY, clock_27mhz, xk_re_inv, //real output of IFFT xk_im_inv, //imaginary output of IFFT xn_index_inv, //index of input xk_index_inv, //index of output rfd_inv, busy_inv, dv_inv, edone_inv, done_inv); // synthesis black_box /*ports for the LPF input ND; output RDY; input CLK; output RFD; input [7 : 0] DIN; output [19 : 0] DOUT; */ /*lpf filter( dv, //(dv_inv && RDY)? RDY, clock_27mhz, RFD, xk_re[18:11], DOUT); // synthesis black_box */ endmodule
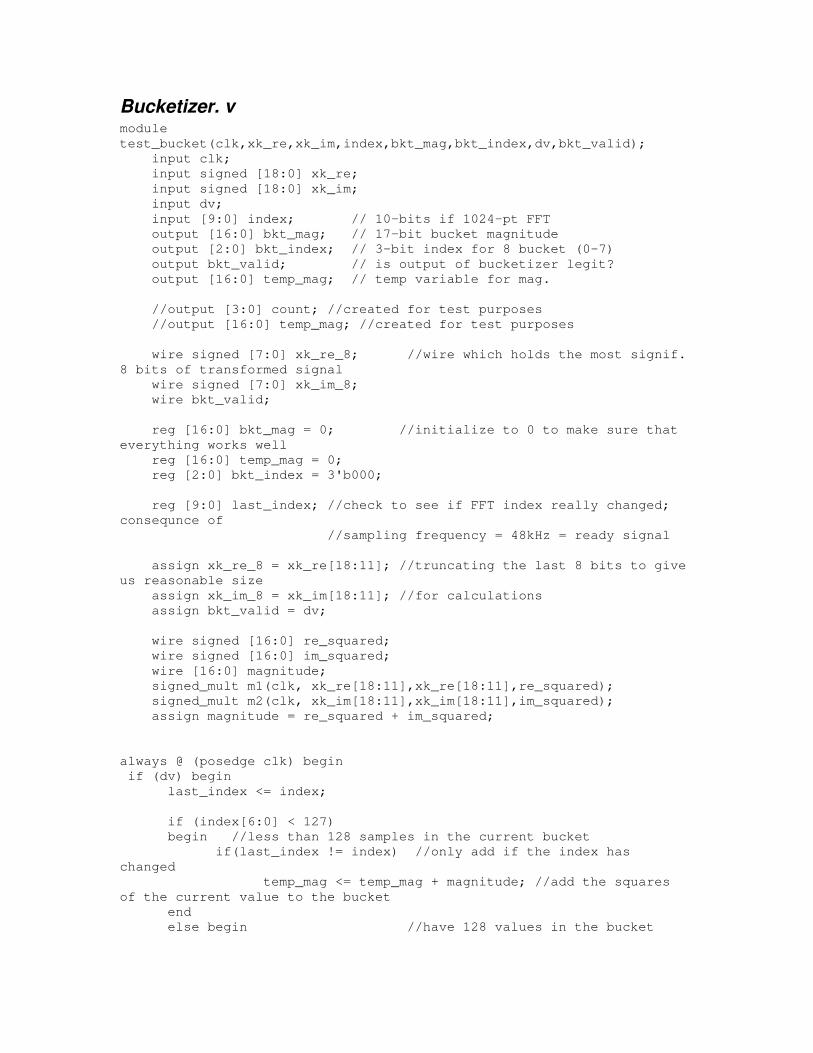
Bucketizer. v module test_bucket(clk,xk_re,xk_im,index,bkt_mag,bkt_index,dv,bkt_valid); input clk; input signed [18:0] xk_re; input signed [18:0] xk_im; input dv; input [9:0] index; // 10-bits if 1024-pt FFT output [16:0] bkt_mag; // 17-bit bucket magnitude output [2:0] bkt_index; // 3-bit index for 8 bucket (0-7) output bkt_valid; // is output of bucketizer legit? output [16:0] temp_mag; // temp variable for mag. //output [3:0] count; //created for test purposes //output [16:0] temp_mag; //created for test purposes wire signed [7:0] xk_re_8; //wire which holds the most signif. 8 bits of transformed signal wire signed [7:0] xk_im_8; wire bkt_valid; reg [16:0] bkt_mag = 0; //initialize to 0 to make sure that everything works well reg [16:0] temp_mag = 0; reg [2:0] bkt_index = 3'b000; reg [9:0] last_index; //check to see if FFT index really changed; consequnce of //sampling frequency = 48kHz = ready signal assign xk_re_8 = xk_re[18:11]; //truncating the last 8 bits to give us reasonable size assign xk_im_8 = xk_im[18:11]; //for calculations assign bkt_valid = dv; wire signed [16:0] re_squared; wire signed [16:0] im_squared; wire [16:0] magnitude; signed_mult m1(clk, xk_re[18:11],xk_re[18:11],re_squared); signed_mult m2(clk, xk_im[18:11],xk_im[18:11],im_squared); assign magnitude = re_squared + im_squared; always @ (posedge clk) begin if (dv) begin last_index <= index; if (index[6:0] < 127) begin //less than 128 samples in the current bucket if(last_index != index) //only add if the index has changed temp_mag <= temp_mag + magnitude; //add the squares of the current value to the bucket end else begin //have 128 values in the bucket

bkt_mag <= ((temp_mag + magnitude) >> 7); //take the avg of the bucket_mag by dividing by 128 (>>7) temp_mag <= 0; //reset the temp_mag if (bkt_index < 7) //bucket indices are between 0 and 7 (for 8 buckets) bkt_index <= bkt_index + 1; //increment else bkt_index <= 0; //if we've reached all buckets for this set of 1024 samples (8 buckets and 16 samples) end end end endmodule

Multiplier.v module multiplier(clk, dv, xk_re,xk_im,xk_index, coeff,mul_re,mul_im, mul_index, ifft_enable); input clk; input dv; input [18:0] xk_re; //input from FFT input [18:0] xk_im; //input from FFT input [9:0] xk_index; //index from FFT input [7:0] coeff; //coeffs from equalizer based on GUI output [17:0] mul_re; //multiplied real FT signal output [17:0] mul_im; //multiplied imag FT signal output [2:0] mul_index; //send index to equalizer for coeffs output ifft_enable; //setup wires from FFT for multiplication wire signed [18:0] xk_re; wire signed [18:0] xk_im; wire signed [7:0] xk_re_8; wire signed [7:0] xk_im_8; wire [2:0] mul_index; wire rdy_re, rdy_im; assign xk_re_8 = (dv)? xk_re [18:11]: 0; //is there valid data from FFT assign xk_im_8 = (dv)? xk_im [18:11]: 0; assign mul_index = xk_index[9:7]; //get appropriate data for coeffs signed_mult re(clk, xk_re_8, coeff, mul_re, rdy_re); //IP Core multipliers signed_mult im(clk, xk_im_8, coeff, mul_im, rdy_im); reg ifft_enable; always @ (posedge clk) begin ifft_enable <= (rdy_re && rdy_im); //enable the IFFT only when both multipliers are finished end endmodule

Timing Diagram for 1024-pt FFT
Related Documents