2 3 1 5 4 Pacheco Anderson Castaneda Calleros Schneider Baird Whittier HS Pioneer HS La Serna HS California HS Santa Fe HS Schneider Baird Industry La Habra Heigh Whittier Pico Rivera La Mirada Santa Fe Springs Norwalk Downey Mills Ave C o l e R d G r e e n l e a f A v e Broadway 605 605 5 72 42 60 Proposed Sequence: 2020 - Areas 1 & 3 2022- Areas 2, 4, & 5 Rationale: The C Perez Map 1 utilizes recognized redistricting best practices drawing districts that are as close to equal in population, contagious, preserving political jurisdictions, preserves communities of interest and lastly preserves incumbents. A compact map, it follows major roads or natural barriers. This map physically places 1 high school in each district while maintaining as much as possible incorporated cities, Census Designated Places and communities of interest. It is equitable in population, with a variance of 4.9 percent using 2017 population estimates and acceptable 7.7 percent using 2010 Census data. The intent for using the most current US Census population estimates is to ensure that minimal (if no) change to district boundaries will be required during the 2020 census data redistricting process. Map layers C_Perez1 Landmark Area Water Area Pipeline/Power Line Railroad Streets Cities and Towns Elementary School High School Attend Trustees Trustee Blocks ©2016 CALIPER

Welcome message from author
This document is posted to help you gain knowledge. Please leave a comment to let me know what you think about it! Share it to your friends and learn new things together.
Transcript
2
3
1
5
4
Pacheco
Anderson
Castaneda Calleros
Schneider
Baird
Whittier HS
Pioneer HS
La Serna HS
California HS
Santa Fe HS
Schneider
Baird
Industry
La Habra Heigh
Whittier
Pico Rivera
La Mirada
Santa Fe Springs
Norwalk
Downey
Mills Ave
Cole R
d
Gr e
enle
af A
ve
Broadway
605
605
5
72
42
60
Proposed Sequence:2020 - Areas 1 & 32022- Areas 2, 4, & 5
Rationale:The C Perez Map 1 utilizes recognized redistricting best practices drawingdistricts that are as close to equal in population, contagious, preserving politicaljurisdictions, preserves communities of interest and lastly preserves incumbents.A compact map, it follows major roads or natural barriers. This map physicallyplaces 1 high school in each district while maintaining as much as possibleincorporated cities, Census Designated Places and communities of interest.It is equitable in population, with a variance of 4.9 percent using 2017 populationestimates and acceptable 7.7 percent using 2010 Census data. The intent for usingthe most current US Census population estimates is to ensure that minimal (if no)change to district boundaries will be required during the 2020 census dataredistricting process.
Map layersC_Perez1Landmark AreaWater AreaPipeline/Power LineRailroadStreetsCities and TownsElementary SchoolHigh School AttendTrusteesTrustee Blocks
©2016 CALIPER
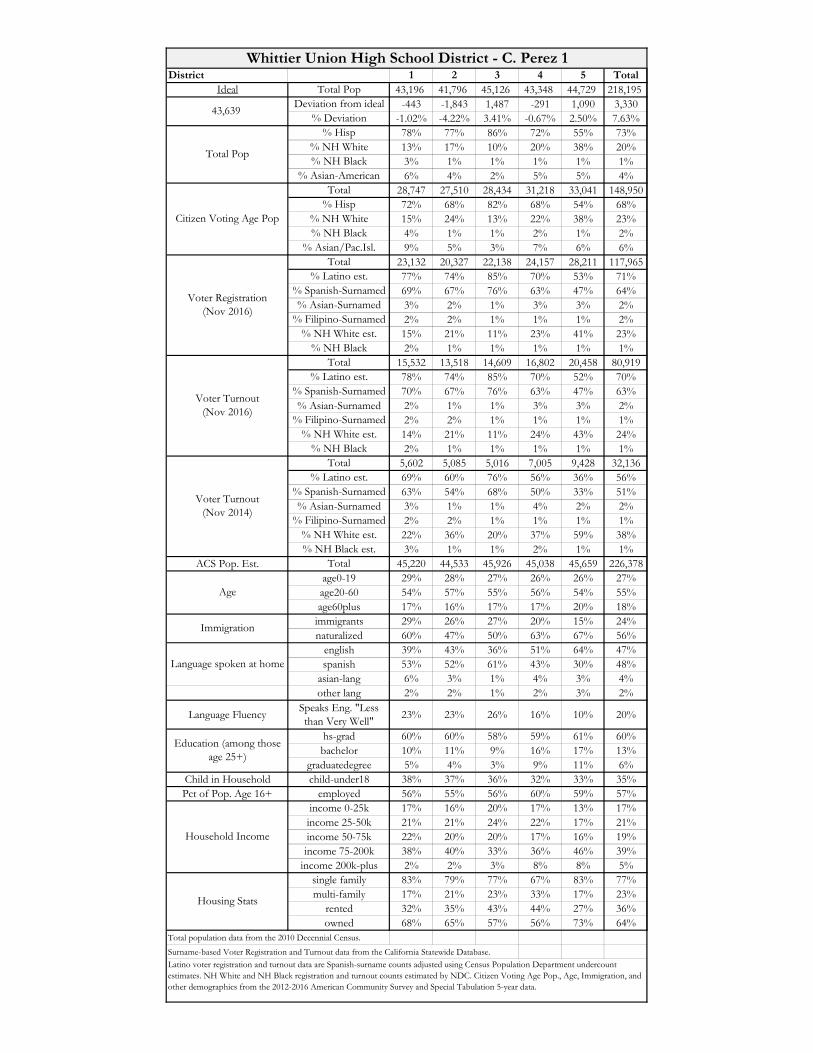
District 1 2 3 4 5 TotalIdeal Total Pop 43,196 41,796 45,126 43,348 44,729 218,195
Deviation from ideal -443 -1,843 1,487 -291 1,090 3,330% Deviation -1.02% -4.22% 3.41% -0.67% 2.50% 7.63%
% Hisp 78% 77% 86% 72% 55% 73%% NH White 13% 17% 10% 20% 38% 20%% NH Black 3% 1% 1% 1% 1% 1%
% Asian-American 6% 4% 2% 5% 5% 4%Total 28,747 27,510 28,434 31,218 33,041 148,950
% Hisp 72% 68% 82% 68% 54% 68%% NH White 15% 24% 13% 22% 38% 23%% NH Black 4% 1% 1% 2% 1% 2%
% Asian/Pac.Isl. 9% 5% 3% 7% 6% 6%Total 23,132 20,327 22,138 24,157 28,211 117,965
% Latino est. 77% 74% 85% 70% 53% 71%% Spanish-Surnamed 69% 67% 76% 63% 47% 64%% Asian-Surnamed 3% 2% 1% 3% 3% 2%
% Filipino-Surnamed 2% 2% 1% 1% 1% 2%% NH White est. 15% 21% 11% 23% 41% 23%
% NH Black 2% 1% 1% 1% 1% 1%Total 15,532 13,518 14,609 16,802 20,458 80,919
% Latino est. 78% 74% 85% 70% 52% 70%% Spanish-Surnamed 70% 67% 76% 63% 47% 63%% Asian-Surnamed 2% 1% 1% 3% 3% 2%
% Filipino-Surnamed 2% 2% 1% 1% 1% 1%% NH White est. 14% 21% 11% 24% 43% 24%
% NH Black 2% 1% 1% 1% 1% 1%Total 5,602 5,085 5,016 7,005 9,428 32,136
% Latino est. 69% 60% 76% 56% 36% 56%% Spanish-Surnamed 63% 54% 68% 50% 33% 51%% Asian-Surnamed 3% 1% 1% 4% 2% 2%
% Filipino-Surnamed 2% 2% 1% 1% 1% 1%% NH White est. 22% 36% 20% 37% 59% 38%% NH Black est. 3% 1% 1% 2% 1% 1%
ACS Pop. Est. Total 45,220 44,533 45,926 45,038 45,659 226,378age0-19 29% 28% 27% 26% 26% 27%age20-60 54% 57% 55% 56% 54% 55%age60plus 17% 16% 17% 17% 20% 18%
immigrants 29% 26% 27% 20% 15% 24%naturalized 60% 47% 50% 63% 67% 56%
english 39% 43% 36% 51% 64% 47%spanish 53% 52% 61% 43% 30% 48%
asian-lang 6% 3% 1% 4% 3% 4%other lang 2% 2% 1% 2% 3% 2%
Language FluencySpeaks Eng. "Less than Very Well"
23% 23% 26% 16% 10% 20%
hs-grad 60% 60% 58% 59% 61% 60%bachelor 10% 11% 9% 16% 17% 13%
graduatedegree 5% 4% 3% 9% 11% 6%Child in Household child-under18 38% 37% 36% 32% 33% 35%Pct of Pop. Age 16+ employed 56% 55% 56% 60% 59% 57%
income 0-25k 17% 16% 20% 17% 13% 17%income 25-50k 21% 21% 24% 22% 17% 21%income 50-75k 22% 20% 20% 17% 16% 19%income 75-200k 38% 40% 33% 36% 46% 39%
income 200k-plus 2% 2% 3% 8% 8% 5%single family 83% 79% 77% 67% 83% 77%multi-family 17% 21% 23% 33% 17% 23%
rented 32% 35% 43% 44% 27% 36%owned 68% 65% 57% 56% 73% 64%
Total population data from the 2010 Decennial Census.
Surname-based Voter Registration and Turnout data from the California Statewide Database.Latino voter registration and turnout data are Spanish-surname counts adjusted using Census Population Department undercount estimates. NH White and NH Black registration and turnout counts estimated by NDC. Citizen Voting Age Pop., Age, Immigration, and other demographics from the 2012-2016 American Community Survey and Special Tabulation 5-year data.
Housing Stats
Household Income
Education (among those age 25+)
Total Pop
Whittier Union High School District - C. Perez 1
Language spoken at home
43,639
Immigration
Citizen Voting Age Pop
Age
Voter Registration(Nov 2016)
Voter Turnout(Nov 2016)
Voter Turnout(Nov 2014)
Related Documents