Marginal Costing & Break Even Point Analysis

Welcome message from author
This document is posted to help you gain knowledge. Please leave a comment to let me know what you think about it! Share it to your friends and learn new things together.
Transcript
Marginal Costing & Break Even Point Analysis
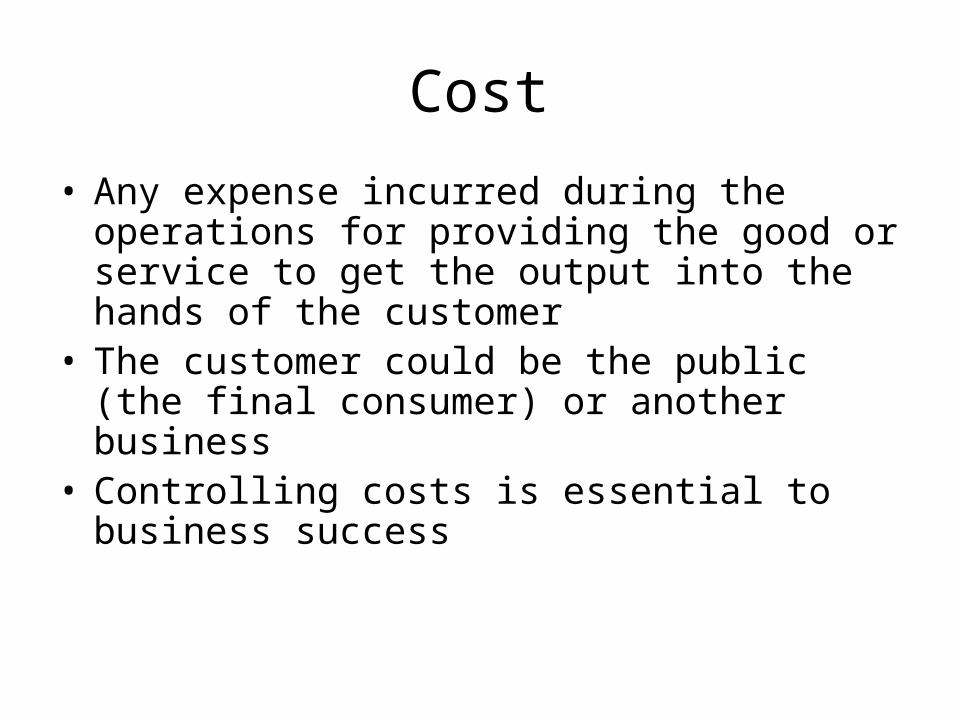
Cost• Any expense incurred during the operations for providing the good or service to get the output into the hands of the customer
• The customer could be the public (the final consumer) or another business
• Controlling costs is essential to business success
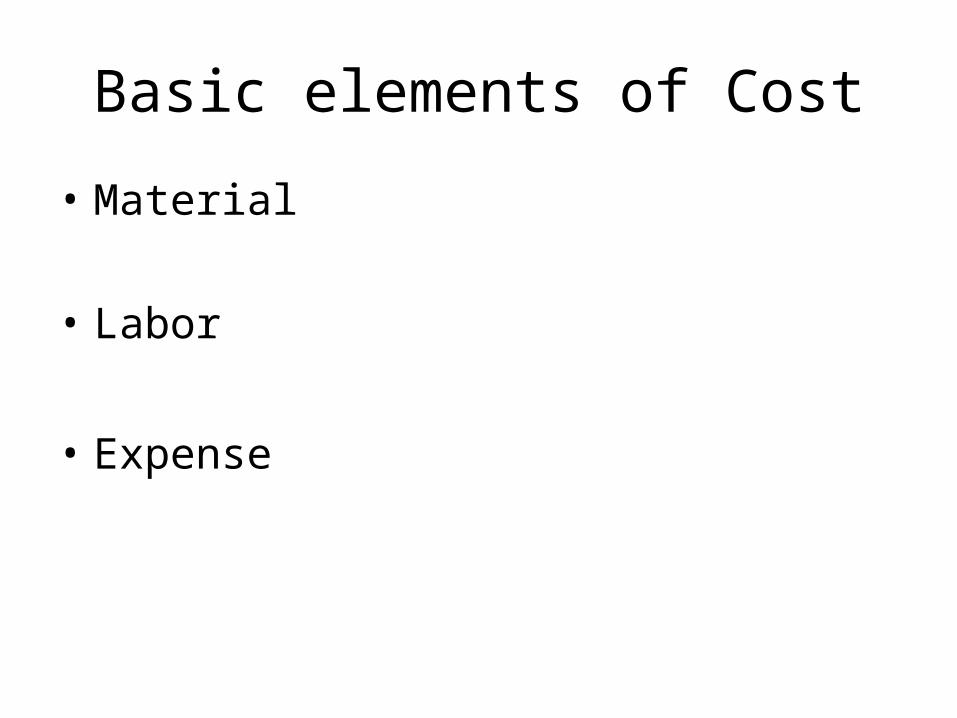
Basic elements of Cost• Material
• Labor
• Expense
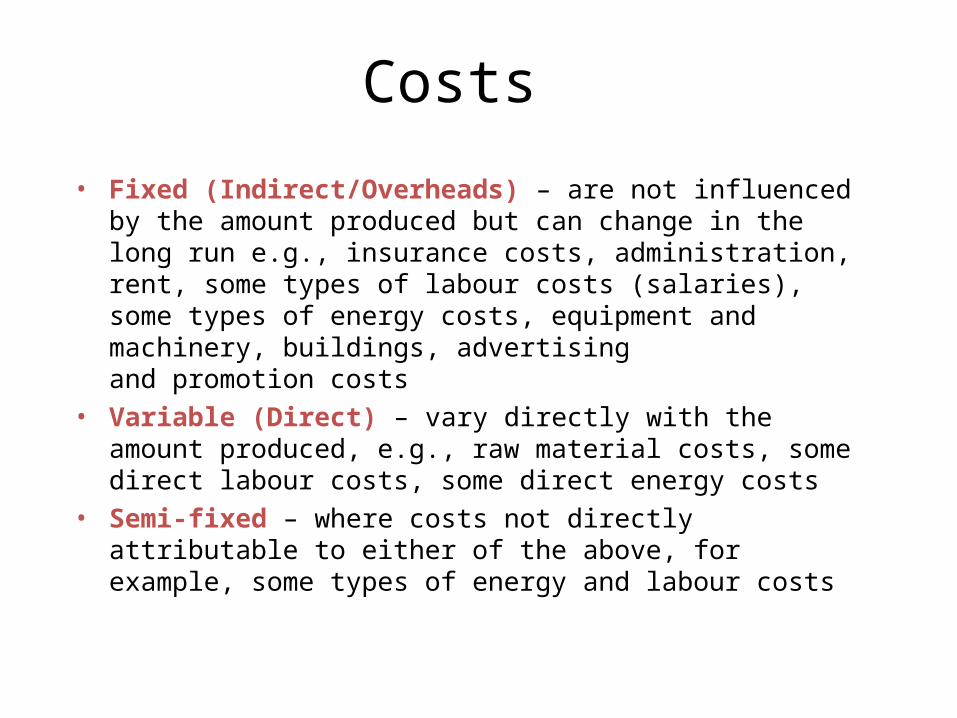
Costs• Fixed (Indirect/Overheads) – are not influenced
by the amount produced but can change in the long run e.g., insurance costs, administration, rent, some types of labour costs (salaries), some types of energy costs, equipment and machinery, buildings, advertising and promotion costs
• Variable (Direct) – vary directly with the amount produced, e.g., raw material costs, some direct labour costs, some direct energy costs
• Semi-fixed – where costs not directly attributable to either of the above, for example, some types of energy and labour costs
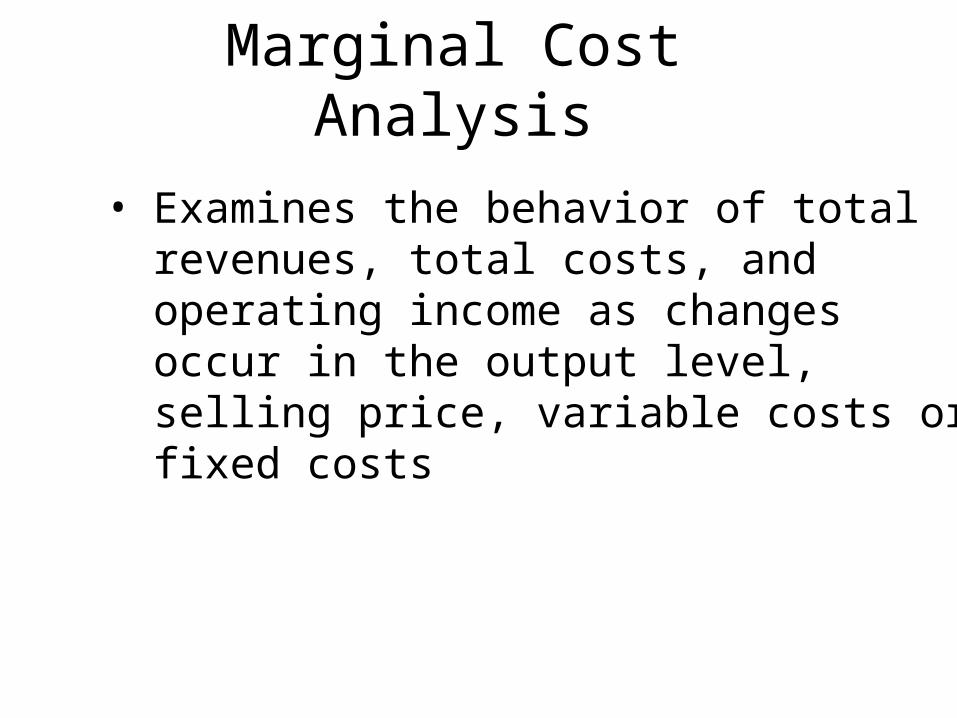
Marginal Cost Analysis
• Examines the behavior of total revenues, total costs, and operating income as changes occur in the output level, selling price, variable costs or fixed costs
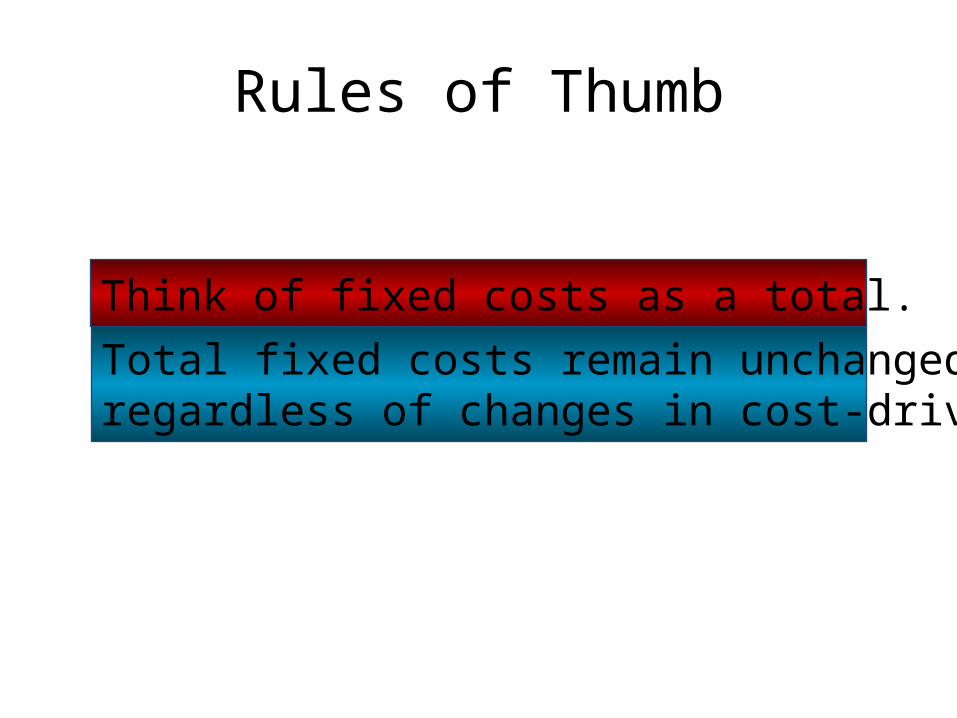
Rules of Thumb
Total fixed costs remain unchangedregardless of changes in cost-driver activity.
Think of fixed costs as a total.
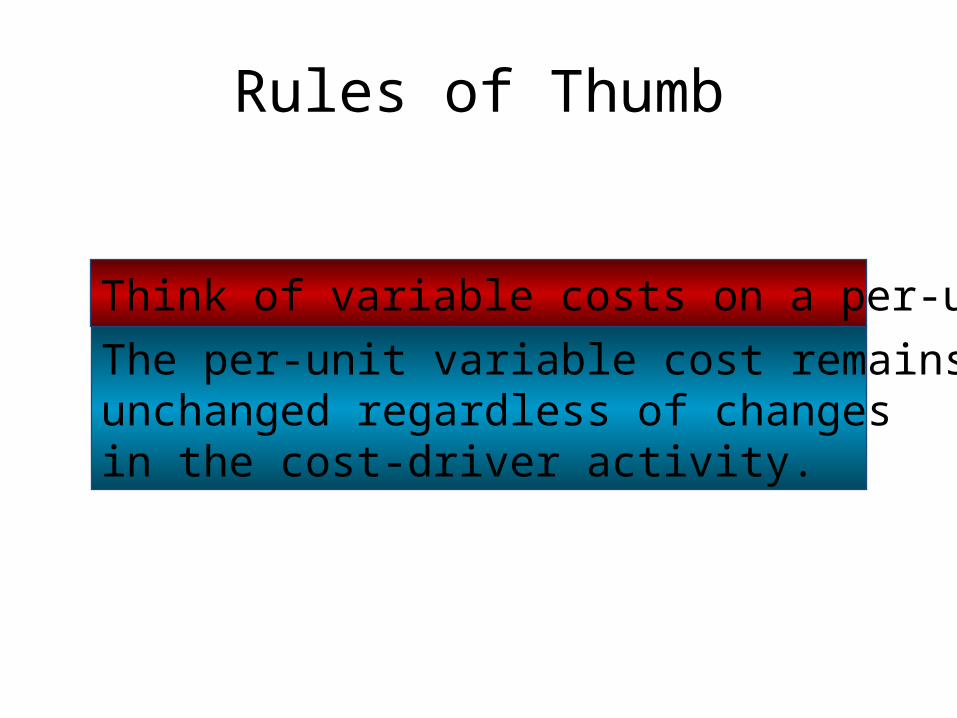
Rules of Thumb
The per-unit variable cost remainsunchanged regardless of changesin the cost-driver activity.
Think of variable costs on a per-unit basis.
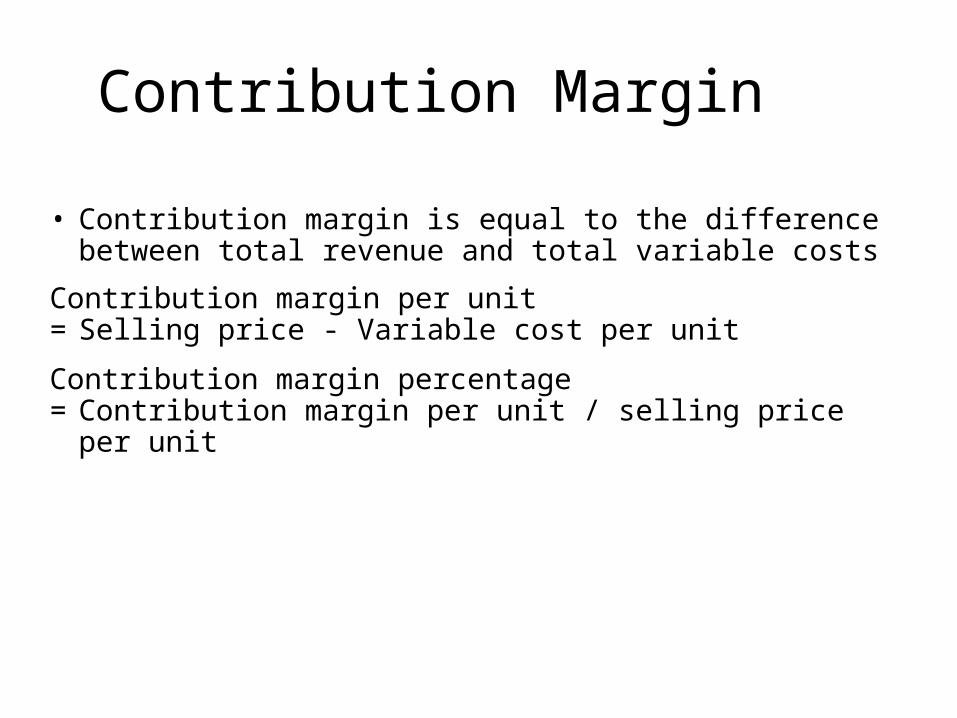
Contribution Margin• Contribution margin is equal to the difference between total revenue and total variable costs
Contribution margin per unit= Selling price - Variable cost per unit Contribution margin percentage= Contribution margin per unit / selling price per unit
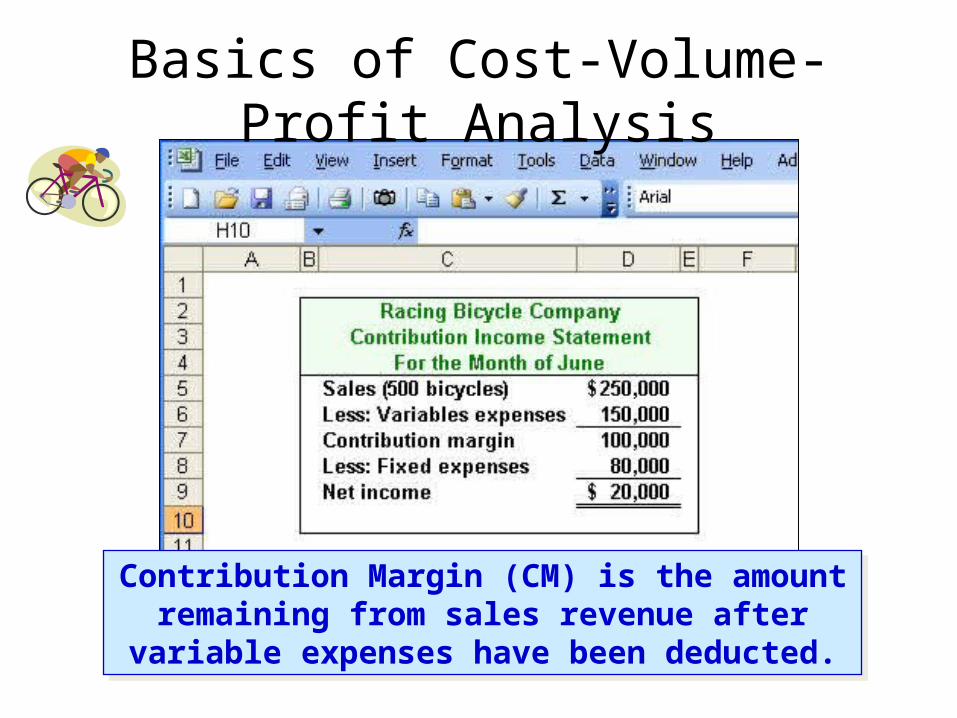
Basics of Cost-Volume-Profit Analysis
Contribution Margin (CM) is the amount remaining from sales revenue after
variable expenses have been deducted.
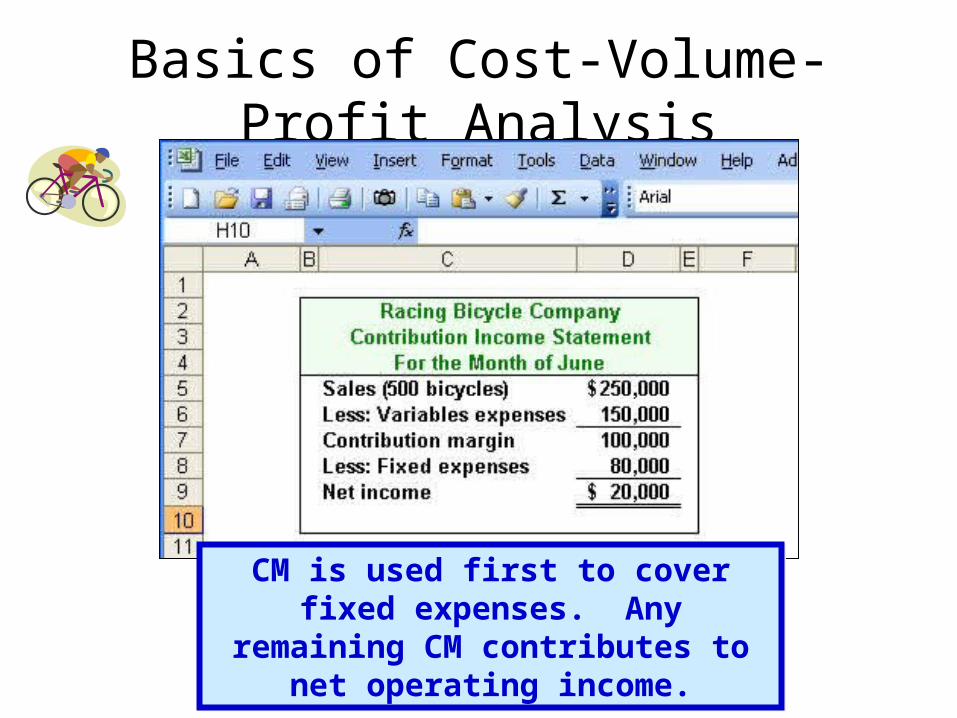
Basics of Cost-Volume-Profit Analysis
CM is used first to cover fixed expenses. Any
remaining CM contributes to net operating income.
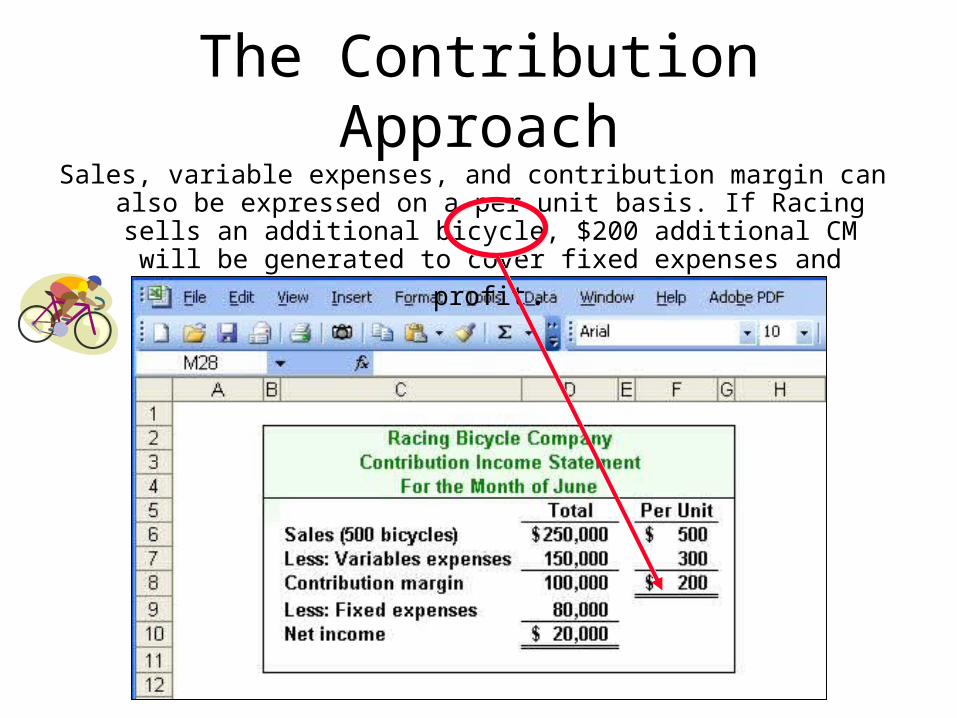
The Contribution Approach
Sales, variable expenses, and contribution margin can also be expressed on a per unit basis. If Racing sells an additional bicycle, $200 additional CM will be generated to cover fixed expenses and
profit.
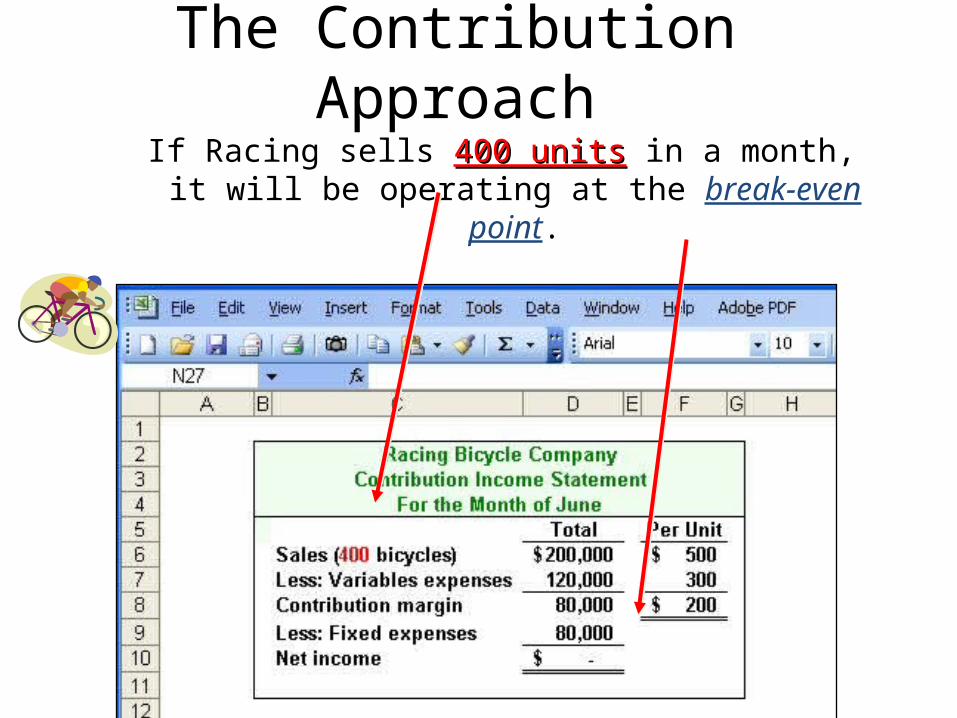
The Contribution Approach
If Racing sells 400 units400 units in a month, it will be operating at the break-even
point.
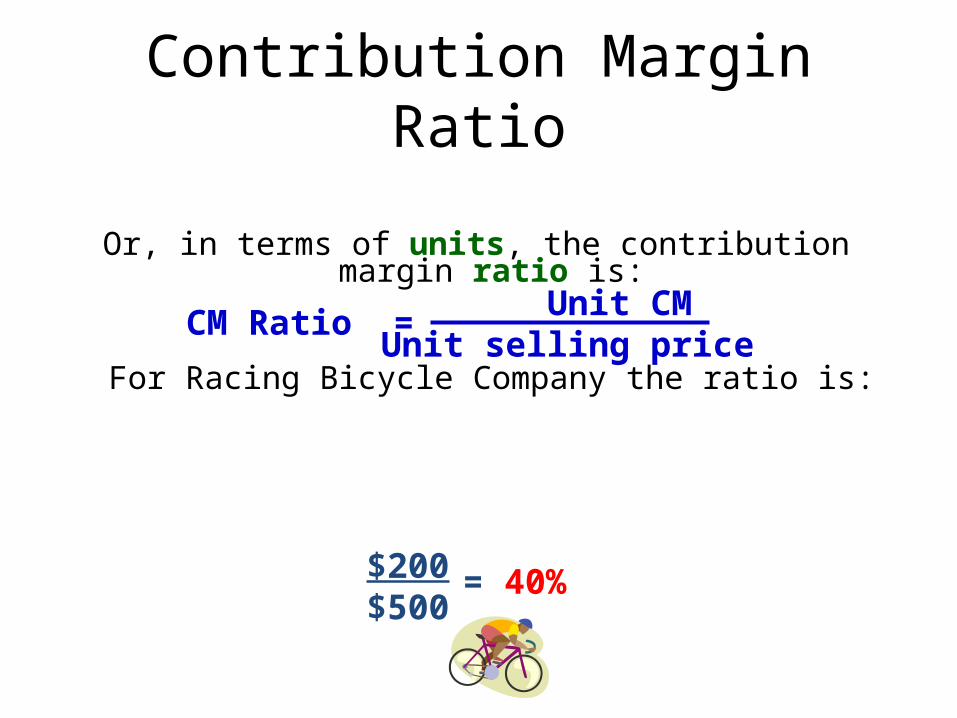
Contribution Margin Ratio
Or, in terms of units, the contribution margin ratio is:
For Racing Bicycle Company the ratio is:
$200$500 = 40%
Unit CMUnit selling priceCM Ratio =
Quick Check
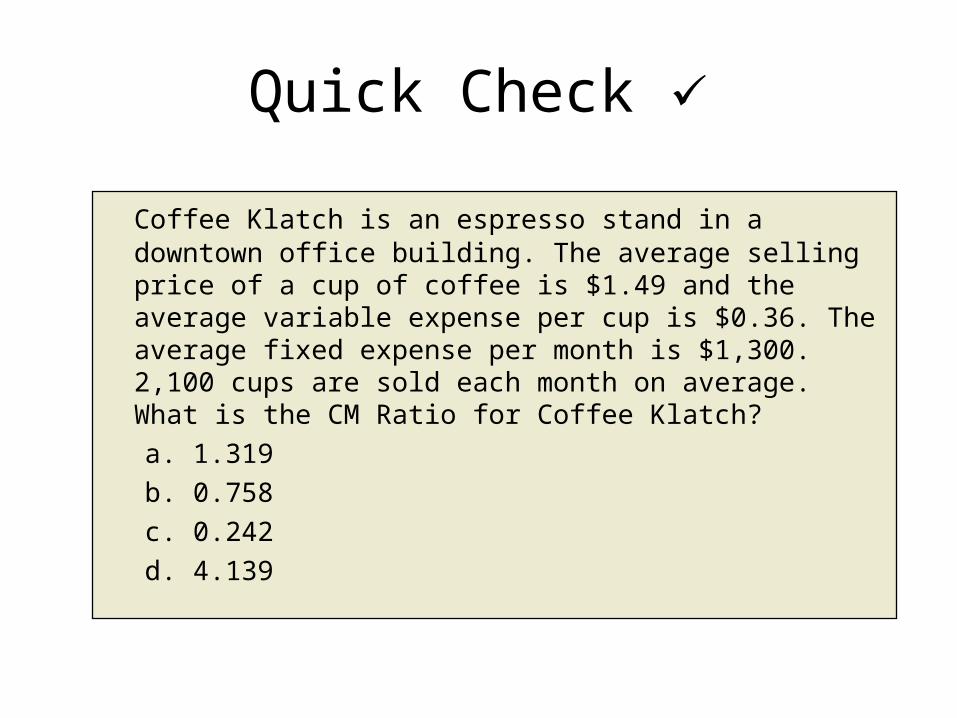
Coffee Klatch is an espresso stand in a downtown office building. The average selling price of a cup of coffee is $1.49 and the average variable expense per cup is $0.36. The average fixed expense per month is $1,300. 2,100 cups are sold each month on average. What is the CM Ratio for Coffee Klatch?a. 1.319b. 0.758c. 0.242d. 4.139
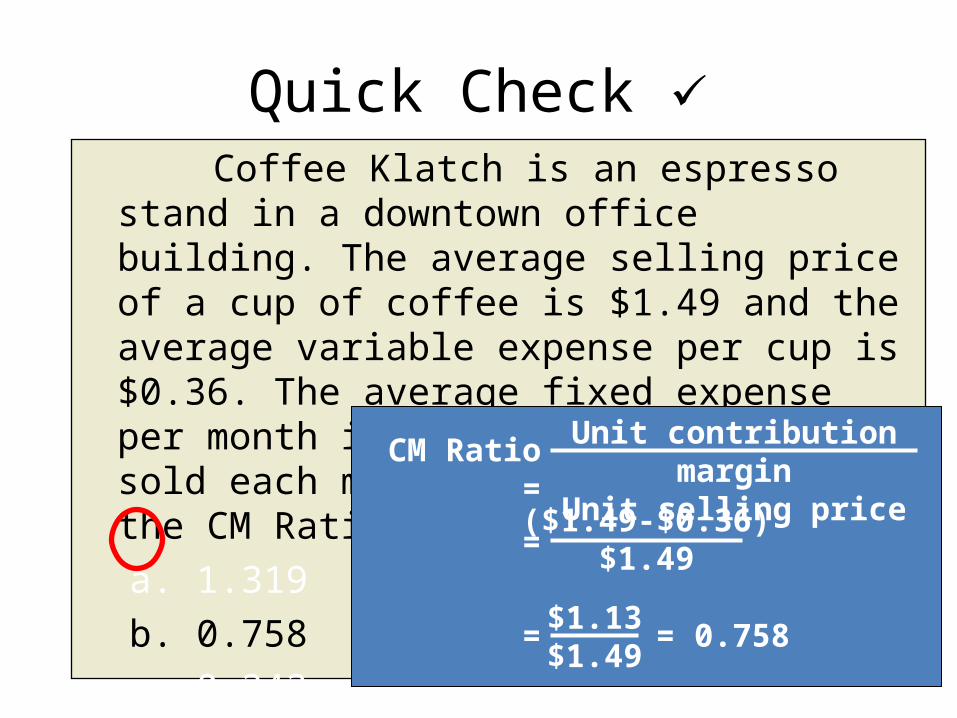
Coffee Klatch is an espresso stand in a downtown office building. The average selling price of a cup of coffee is $1.49 and the average variable expense per cup is $0.36. The average fixed expense per month is $1,300. 2,100 cups are sold each month on average. What is the CM Ratio for Coffee Klatch?a. 1.319b. 0.758c. 0.242d. 4.139
Quick Check
Unit contribution margin
Unit selling priceCM Ratio
==($1.49-$0.36)$1.49
=$1.13$1.49 = 0.758
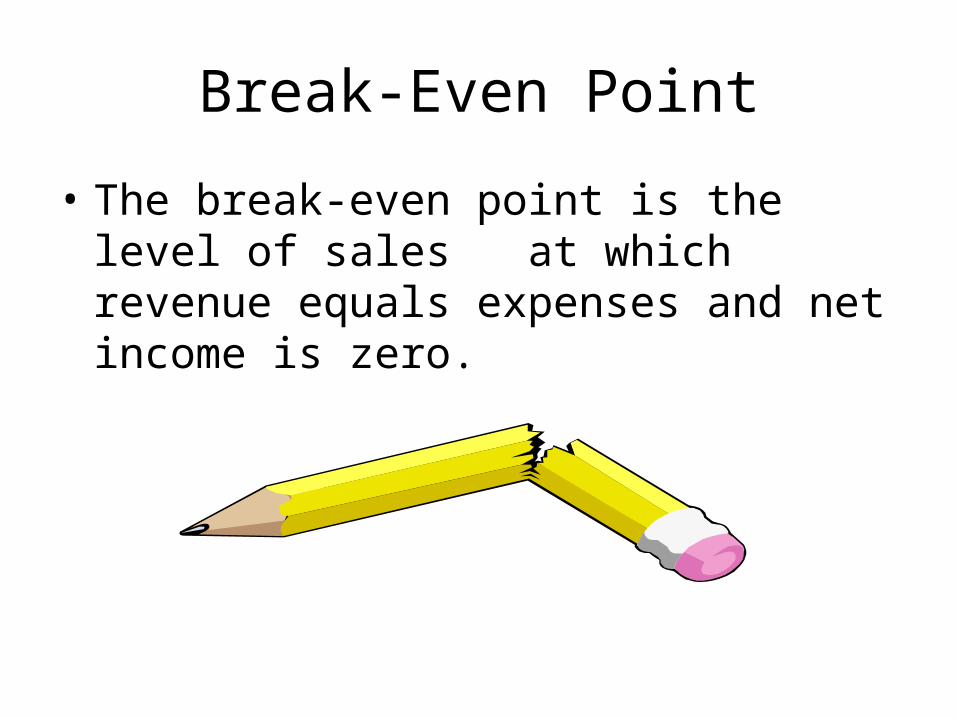
Break-Even Point• The break-even point is the level of sales at which revenue equals expenses and net income is zero.
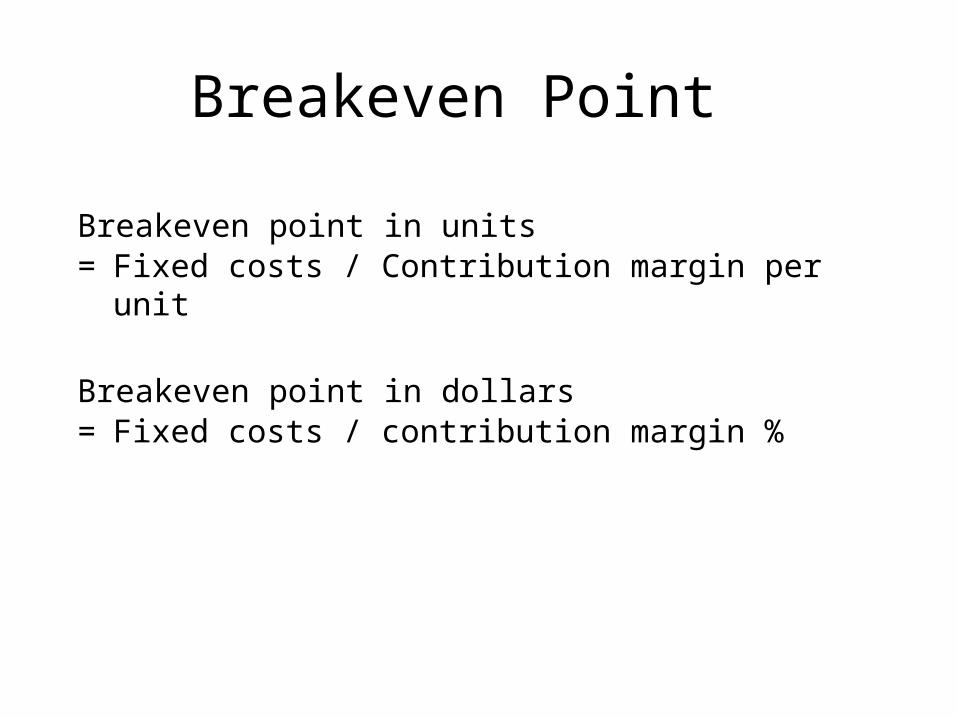
Breakeven Point
Breakeven point in units= Fixed costs / Contribution margin per unit
Breakeven point in dollars= Fixed costs / contribution margin %
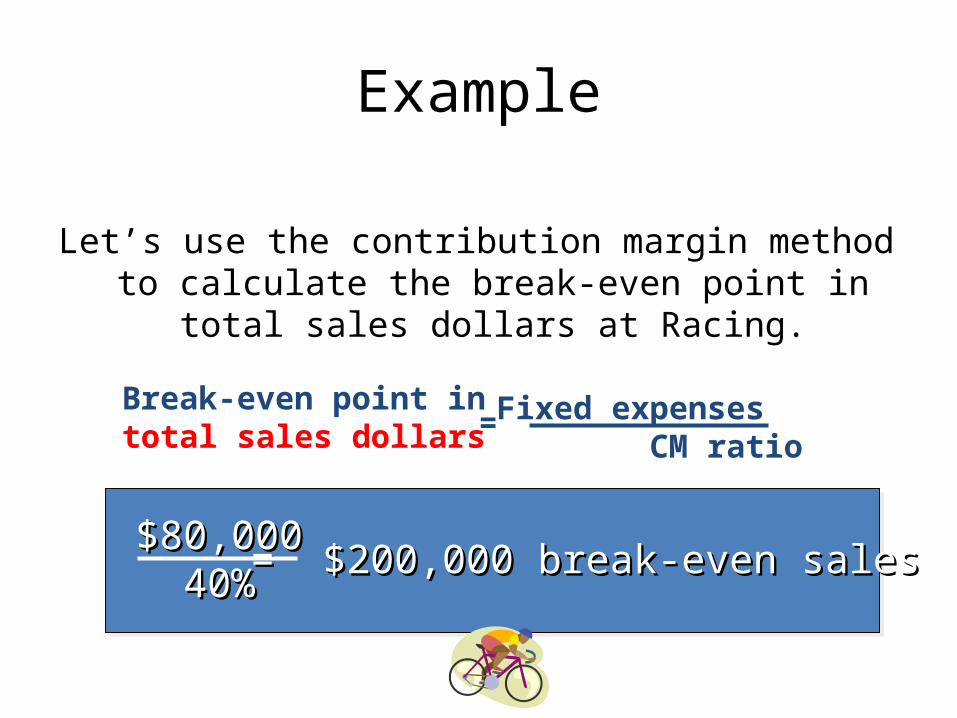
Example
Let’s use the contribution margin method to calculate the break-even point in
total sales dollars at Racing.
Fixed expenses CM ratio=Break-even point in
total sales dollars
$80,000$80,00040%40%= $200,000 break-even sales= $200,000 break-even sales
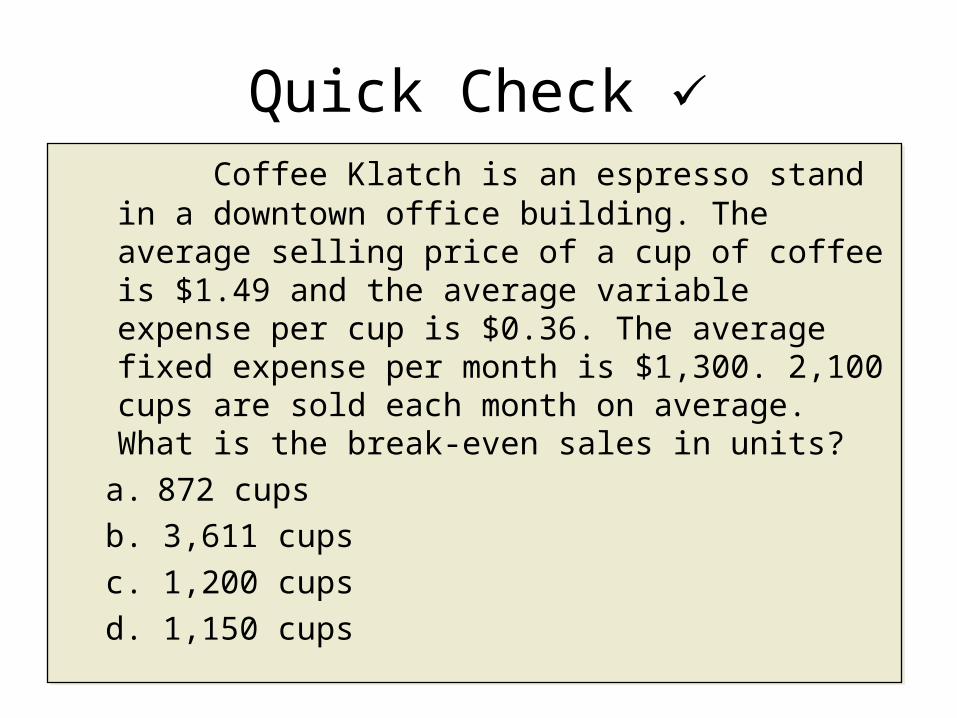
Quick Check Coffee Klatch is an espresso stand
in a downtown office building. The average selling price of a cup of coffee is $1.49 and the average variable expense per cup is $0.36. The average fixed expense per month is $1,300. 2,100 cups are sold each month on average. What is the break-even sales in units?a. 872 cupsb. 3,611 cupsc. 1,200 cupsd. 1,150 cups
Coffee Klatch is an espresso stand in a downtown office building. The average selling price of a cup of coffee is $1.49 and the average variable expense per cup is $0.36. The average fixed expense per month is $1,300. 2,100 cups are sold each month on average. What is the break-even sales in units?a. 872 cupsb. 3,611 cupsc. 1,200 cupsd. 1,150 cups
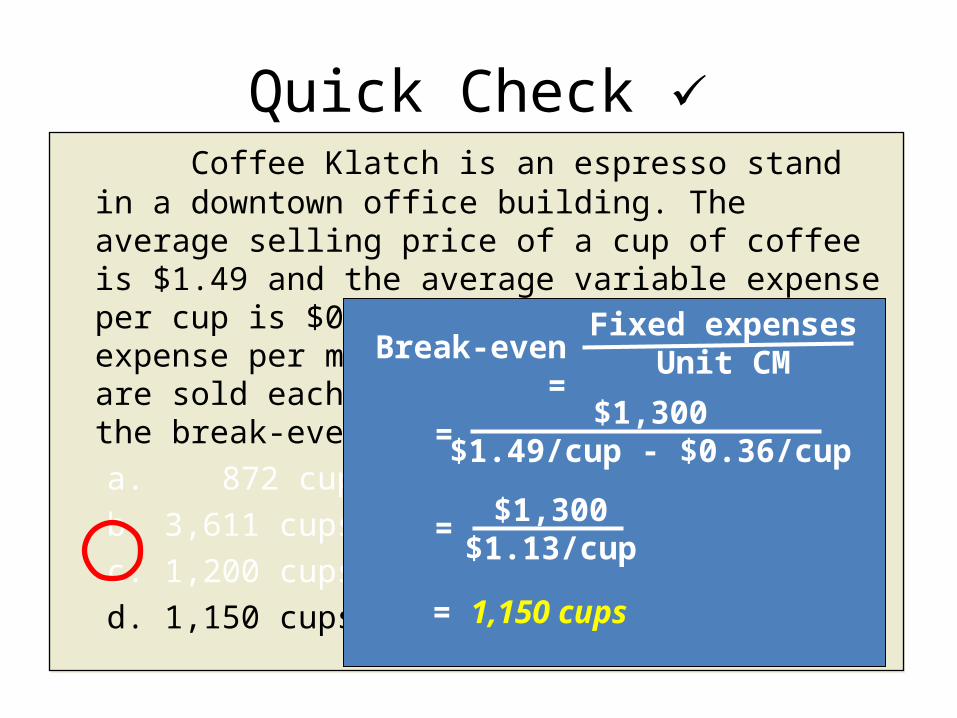
Quick Check
Fixed expensesUnit CMBreak-even
=$1,300
$1.49/cup - $0.36/cup
= $1,300$1.13/cup
= 1,150 cups
=
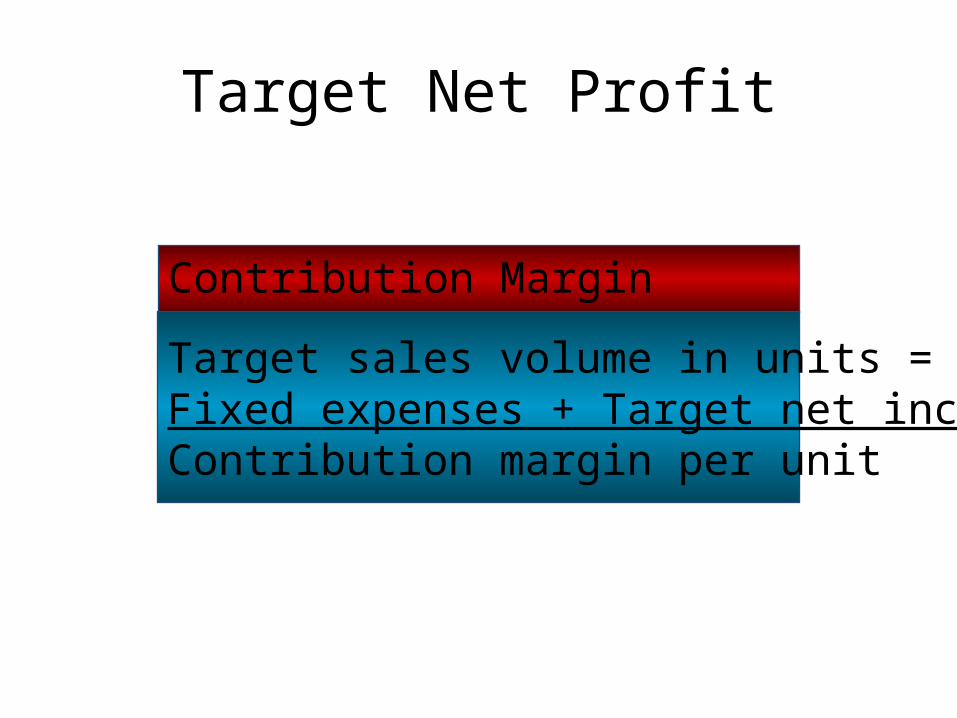
Target Net Profit
Contribution Margin TechniqueTarget sales volume in units =Fixed expenses + Target net incomeContribution margin per unit
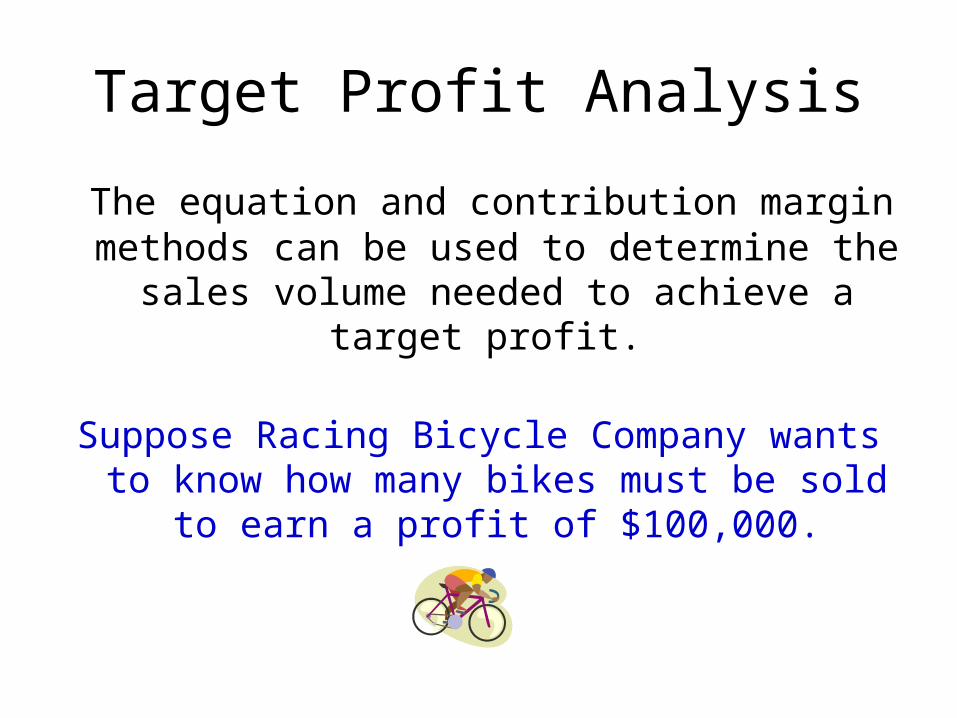
Target Profit Analysis The equation and contribution margin methods can be used to determine the
sales volume needed to achieve a target profit.
Suppose Racing Bicycle Company wants to know how many bikes must be sold
to earn a profit of $100,000.
The Contribution Margin Approach
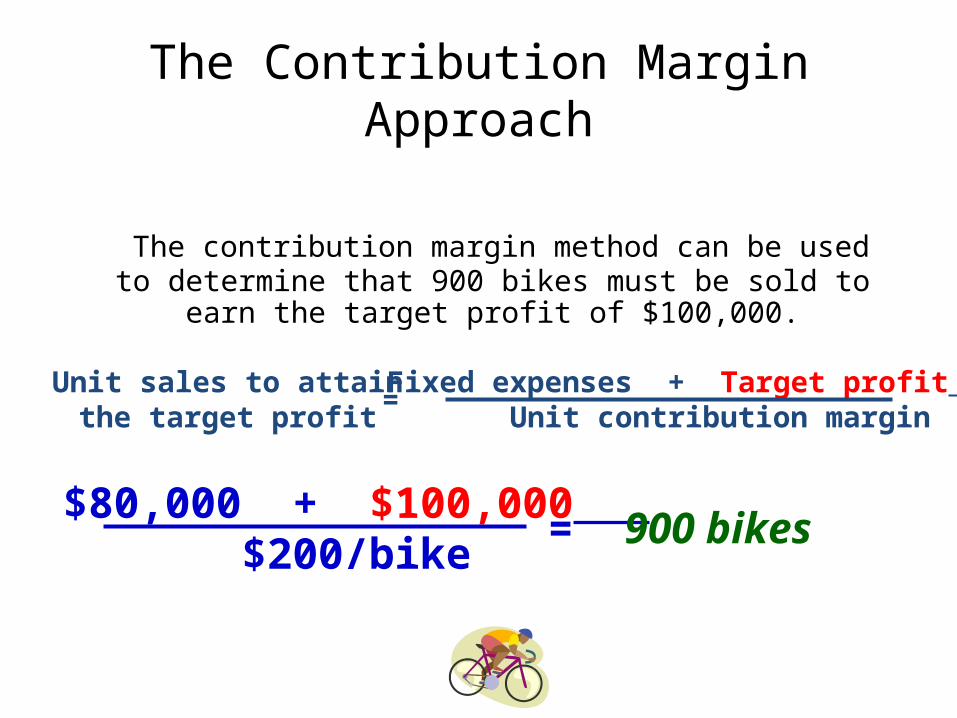
The contribution margin method can be used to determine that 900 bikes must be sold to
earn the target profit of $100,000.
Fixed expenses + Target profit Unit contribution margin=Unit sales to attain
the target profit
$80,000 + $100,000 $200/bike = 900 bikes
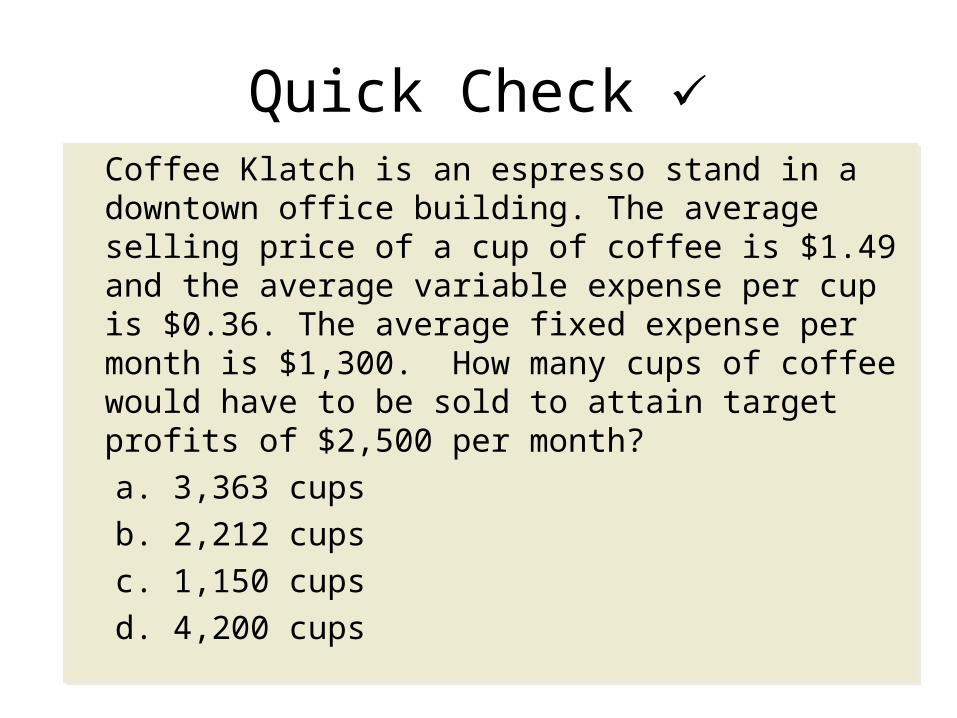
Quick Check Coffee Klatch is an espresso stand in a downtown office building. The average selling price of a cup of coffee is $1.49 and the average variable expense per cup is $0.36. The average fixed expense per month is $1,300. How many cups of coffee would have to be sold to attain target profits of $2,500 per month?a. 3,363 cupsb. 2,212 cupsc. 1,150 cupsd. 4,200 cups
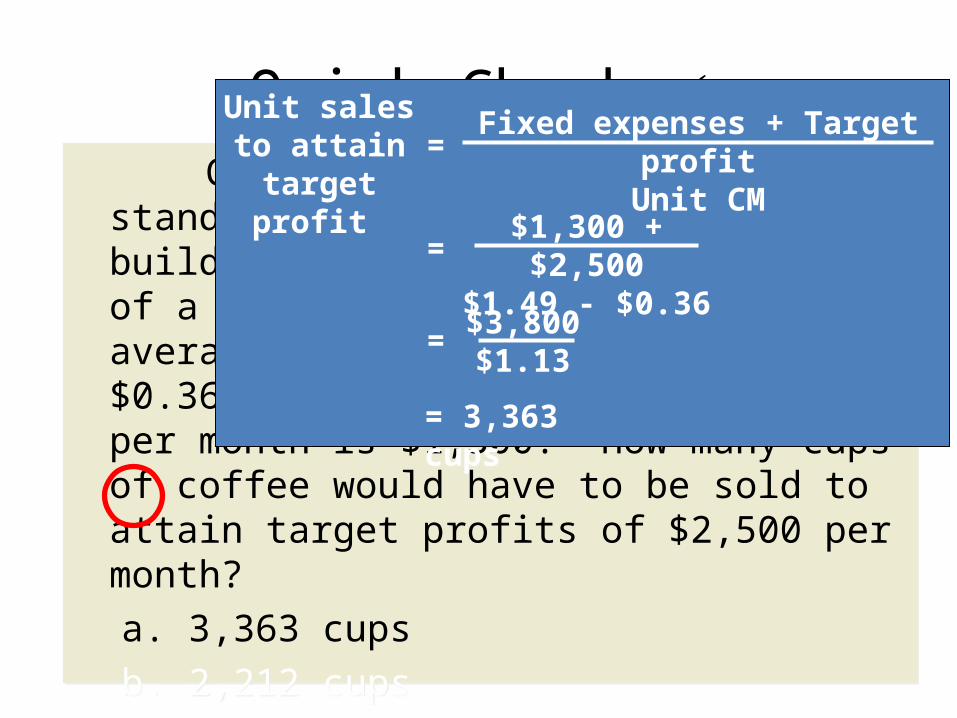
Coffee Klatch is an espresso stand in a downtown office building. The average selling price of a cup of coffee is $1.49 and the average variable expense per cup is $0.36. The average fixed expense per month is $1,300. How many cups of coffee would have to be sold to attain target profits of $2,500 per month?a. 3,363 cupsb. 2,212 cupsc. 1,150 cupsd. 4,200 cups
Quick Check Fixed expenses + Target profitUnit CM
Unit salesto attaintarget profit
= 3,363 cups
= $3,800$1.13
$1,300 + $2,500
$1.49 - $0.36 =
=
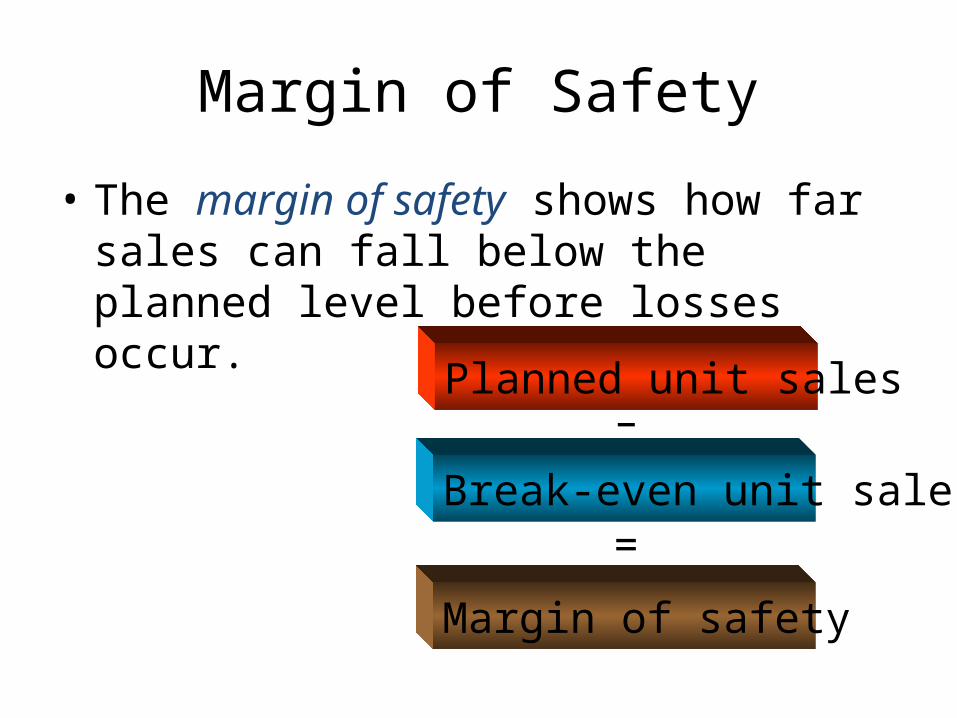
Margin of Safety• The margin of safety shows how far sales can fall below the planned level before losses occur. Planned unit sales
–Break-even unit sales
=Margin of safety
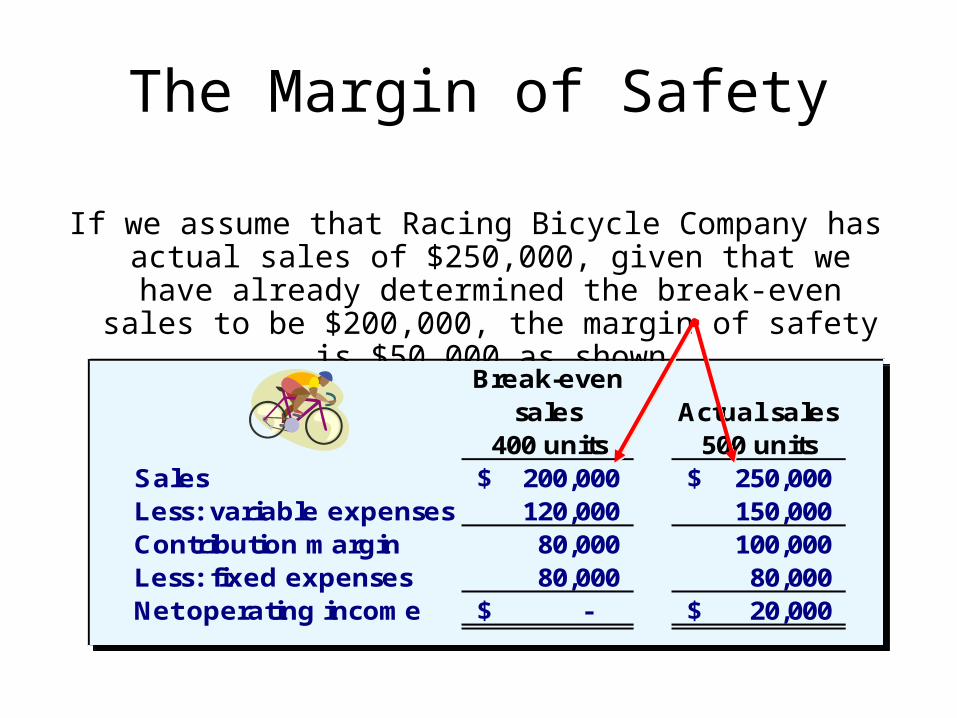
The Margin of Safety
If we assume that Racing Bicycle Company has actual sales of $250,000, given that we have already determined the break-even
sales to be $200,000, the margin of safety is $50,000 as shown
Break-even sales
400 unitsActual sales 500 units
Sales 200,000$ 250,000$ Less: variable expenses 120,000 150,000 Contribution m argin 80,000 100,000 Less: fixed expenses 80,000 80,000 Net operating incom e -$ 20,000$
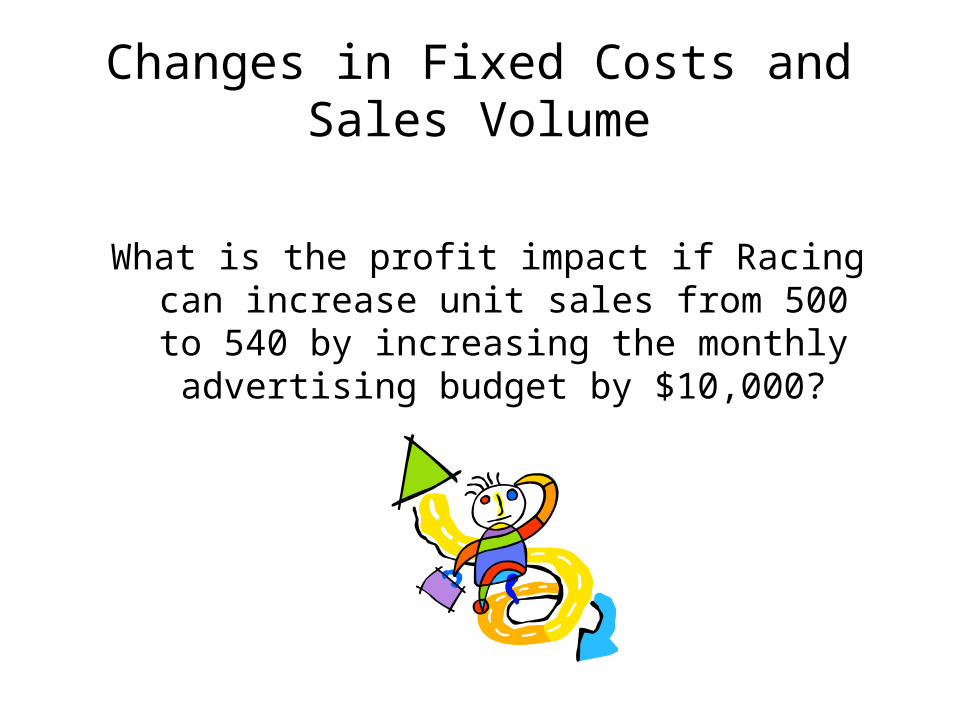
Changes in Fixed Costs and Sales Volume
What is the profit impact if Racing can increase unit sales from 500 to 540 by increasing the monthly advertising budget by $10,000?
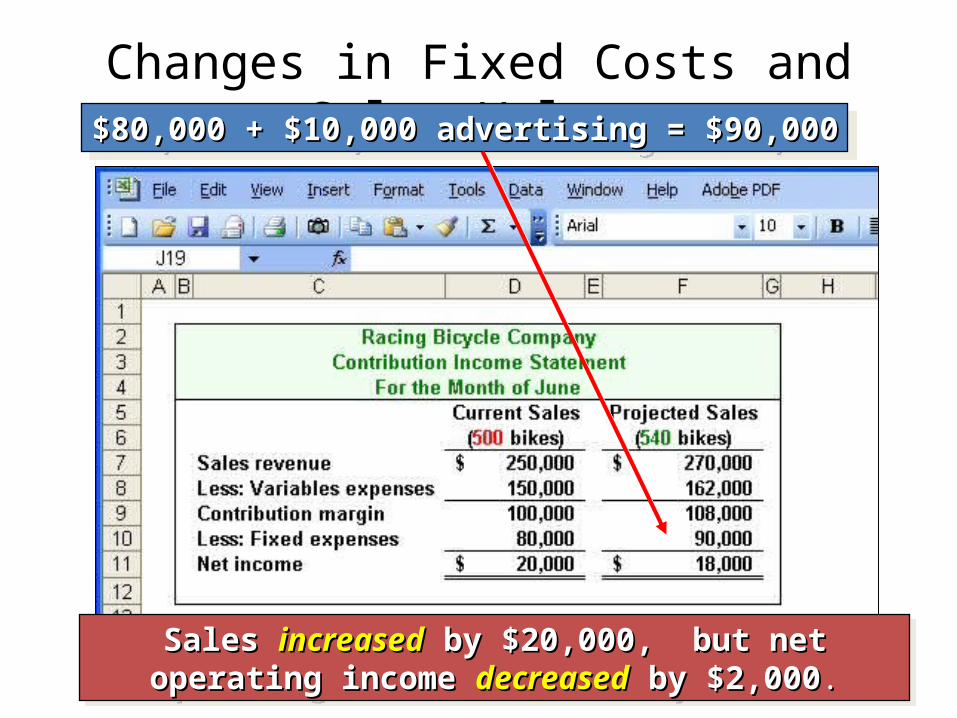
Changes in Fixed Costs and Sales Volume$80,000 + $10,000 advertising = $90,000$80,000 + $10,000 advertising = $90,000
Sales Sales increasedincreased by $20,000, but net by $20,000, but net operating income operating income decreaseddecreased by $2,000 by $2,000..
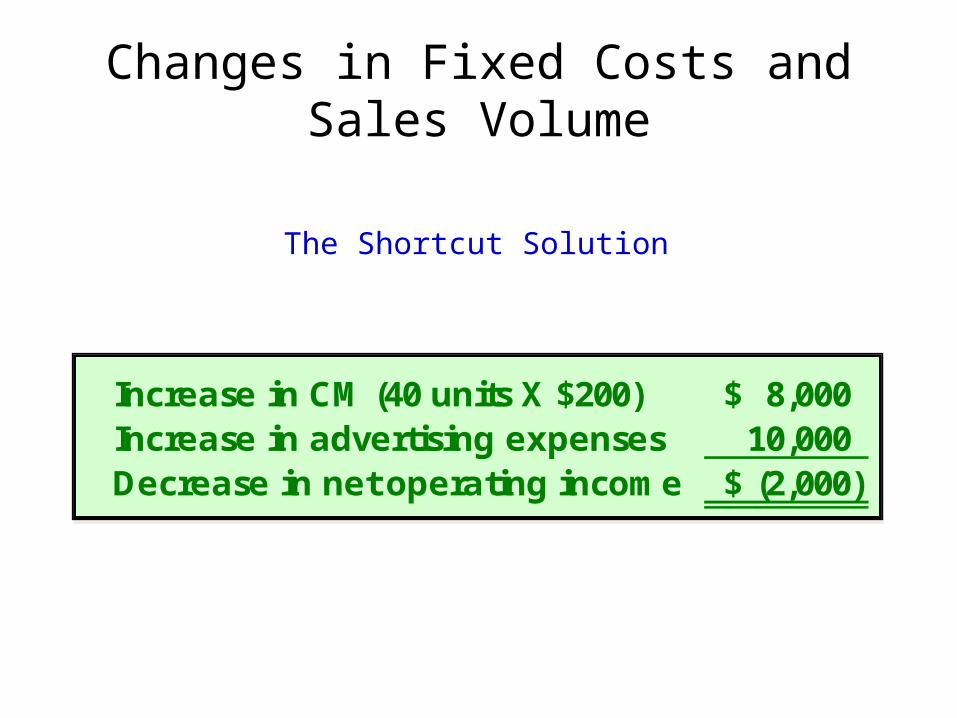
Changes in Fixed Costs and Sales Volume
The Shortcut Solution
Increase in CM (40 units X $200) 8,000$ Increase in advertising expenses 10,000 Decrease in net operating incom e (2,000)$
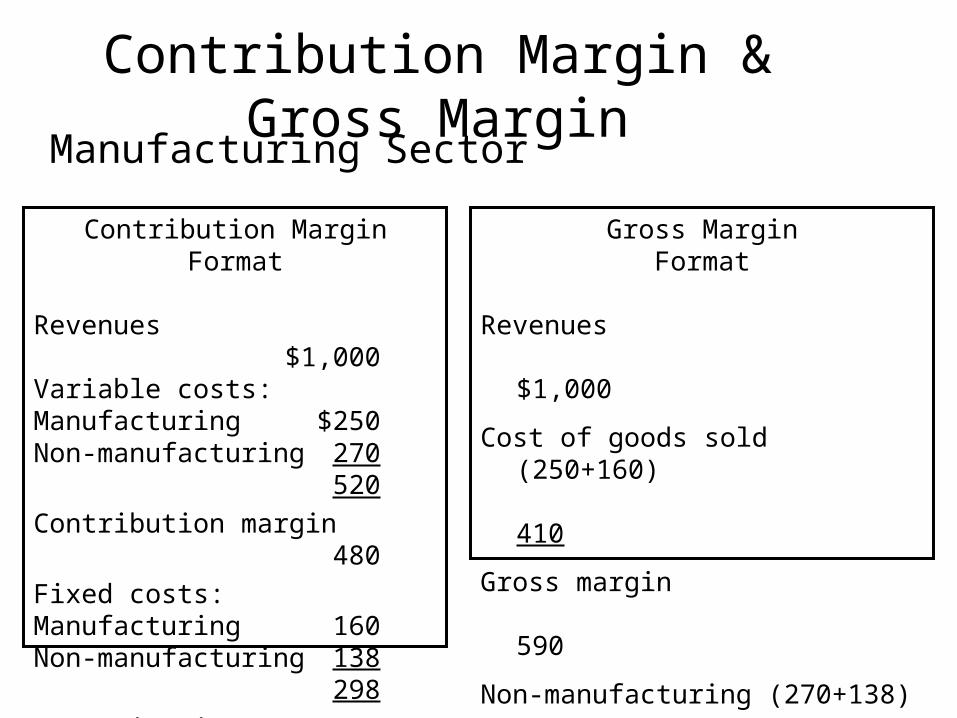
Contribution Margin & Gross MarginManufacturing Sector
Contribution MarginFormat
Revenues$1,000
Variable costs:Manufacturing $250Non-manufacturing 270
520Contribution margin
480Fixed costs:Manufacturing 160Non-manufacturing 138
298Operating income
$182
Gross MarginFormat
Revenues
$1,000Cost of goods sold
(250+160)
410Gross margin
590Non-manufacturing (270+138)
408Operating income
$182
Related Documents