Welcome message from author
This document is posted to help you gain knowledge. Please leave a comment to let me know what you think about it! Share it to your friends and learn new things together.
Transcript


6 Historical Eras
Birth of Local Transit
Consolidation & Evolution
Dawn of the Automobile
The Highway Era
Birth of Rapid Transit
Merger & Multimodalism
1873 – 1890
1890 – 1911
1911 – 1933
1933 – 1964
1964 –
1993
1993 ‐
Present

Birth of Local Transit 1873 ‐
1890
Horse‐drawn rail cars
Provided access to real estate projects
When areas fully developed ongoing patronage
insufficient to maintain transit
Most companies later failed

Consolidation & Evolution 1890 ‐
1911
Moses Sherman & Eli Clark merge routes into Consolidated Electric Railway
During 1890’s many lines electrified to save operating cost / attract riders
Restructured in 1895 as Los Angeles Rwy
Sold in 1898 to Henry Huntington

Consolidation & Evolution 1890 ‐
1911
Huntington reformed company as Pacific Electric Rwy in 1902
Sherman joined with Robert Gillis to form LA Pacific Rwy
under ownership of Santa Monica Land & Water Co.
Consolidation & Evolution 1890 ‐
1911
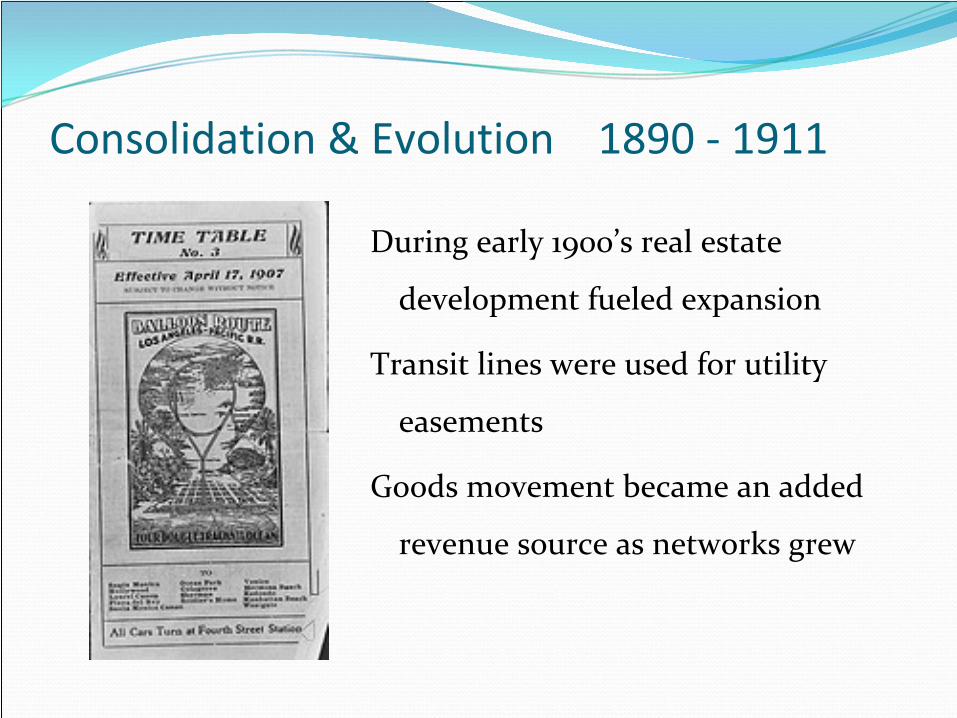
During early 1900’s real estate development fueled expansion
Transit lines were used for utility easements
Goods movement became an added revenue source as networks grew

The Dawn of the Automobile 1911 ‐
1933
Railroads felt competition for goods movement –
Southern Pacific acquired Pacific Electric in 1911
Huntington acquires remaining interest in LA
Railway Corp.

The Dawn of the Automobile 1911 ‐
1933
The automobile flourished1910 – fewer than 20,000 in LA1920 – more than 100,0001930 – nearly 800,000
Autos and transit competed for street space
1925 – first subway opened from Pershing Square to NW CBD

The Dawn of the Automobile 1911 ‐
1933
Municipal ownership of transit considered
Consolidation of operating franchisesFreedom from sales and land taxesExempt from highway improvement fees when owning abutting land
Henry Huntington dies in 1927 ending negotiations

The Highway Era 1933 ‐
1964
By 1933 bus service was being
provided by all rail operators
Buses more cost effective than railBy 1940’s materials shortages
impacted all forms of transit –
buses still profitable but not railIn 1945 National City Lines bought
out LA Railway becoming LA
Transit LinesIn 1953 Metropolitan Coach Lines is
organized to buy out Pacific
Electric and replace rail with bus

The Highway Era 1933 ‐
1964In 1951 the State legislature
creates the LA Metropolitan Transit Authority –
planned
to build a monorail along LA River
In 1958 LA MTA is funded by State to purchase LA
Transit Lines and Metropolitan Coach Lines
thereby creating first public transit operator in LA
County

The Birth of Rapid Transit 1964 ‐
1993
March 1963 – the last rail transit line is abandoned
August 1964 – the SCRTD is created by the State – for
the first time the public operator has powers of
eminent domain and bonding
By 1969 many bus routes are still covering costs though worker wages and service
quality lag

The Birth of Rapid Transit 1964 ‐
1993
1971 – Transit Development Act provides dedicated funding
through ¼
‐
cent sales tax\1974 – zoned fare system
replaced with flat fares1975 – begins federal funding
for capital & operating needs1976 – 1981 fares are increasing
annually from $0.25 to $0.85 over 6 years

The Birth of Rapid Transit 1964 ‐
1993
1976 – LACTC created to oversee transportation funding and
establish policy1980 –
Proposition A adopted by
voters providing ½‐cent sales tax for transit development
1982 – Three year $0.50 fare put into effect as Prop. A revenue is
validated by courts

The Birth of Rapid Transit 1964 ‐
1993
July 1990 – Metro Blue Line to Long Beach
July 1990 – Proposition C ½-cent sales tax begins
Feb. 1993 – Metro Red Line to Westlake

Merger & Multimodalism 1993 ‐
Present

Merger & Multimodalism 1993 ‐
Present
1996 Consent Decree10‐year agreement to settle civil rights actionAdded 1 million bus hours to reduce crowding and implement new service planFroze fares for two years and limited later increases to local inflationCourt supervision will end in Nov. 2010
Merger & Multimodalism 1993 ‐
Present
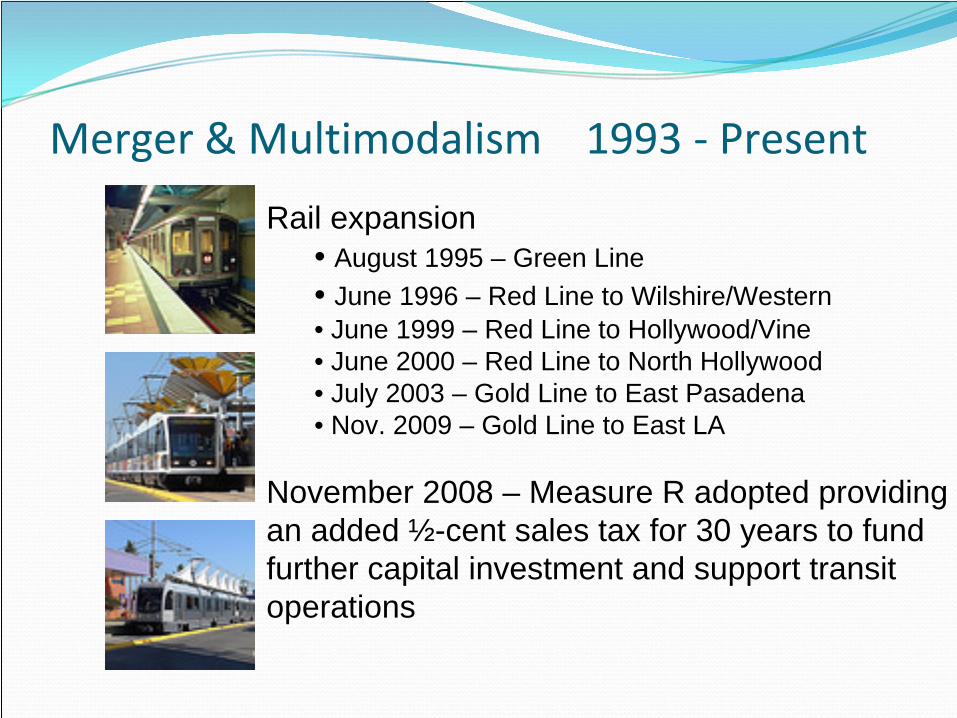
Rail expansion• August 1995 – Green Line• June 1996 – Red Line to Wilshire/Western• June 1999 – Red Line to Hollywood/Vine• June 2000 – Red Line to North Hollywood• July 2003 – Gold Line to East Pasadena• Nov. 2009 – Gold Line to East LA
November 2008 – Measure R adopted providing an added ½-cent sales tax for 30 years to fund further capital investment and support transit operations

CURRENT TRENDS IN SUPPLY AND DEMAND

REGIONAL TRENDS IN SUPPLY
Trend• Bus seat capacity in region increased 31% from 1985 to 2008 due to increase in Muni bus service
• Including Metro rail, seat capacity has increased 45%
Seat Capacity
-20,00040,00060,00080,000
100,000120,000140,000160,000180,000
1985 1990 1997 2000 2005 2008
System Total (System) LACMTA (Bus) Bus Subtotal (Bus)
Annual Revenue Service Hours (in 1,000's)
-
2,000
4,000
6,000
8,000
10,000
12,000
14,000
1985 1990 1997 2000 2005 2008
Total (System) LACMTA (Bus) Subtotal (Bus)
Trend• Bus service hours in regional increased 42% from 1985 to 2008 largely due to increase in Muni bus service
• Including Metro rail, service hours have increased 50% (based on car hours)

REGIONAL TRENDS IN DEMAND
Trend• Regional bus passengers decreased 5% from 1985 to 2008
• Including Metro rail, passengers increased 11%
Result• Due to the 42% increase in service hours and 5% decrease in passengers, productivity (passengers/hour) decreased on regional bus service by 33% from 1985 to 2008
• Results in a much greater increase in supply relative to demand
Annual Passengers (in 1,000's)
-
100,000
200,000
300,000
400,000
500,000
600,000
700,000
1985 1990 1997 2000 2005 2008
Total (System) LACMTA (Bus) Subtotal (Bus)
Bus Passsengers/Revenue Hour
-
10
20
30
40
50
60
70
80
1985 1990 1997 2000 2005 2008
LACMTA (Bus) Muni Operators Average

METRO BUS COST AND REVENUE TRENDS
$0.00
$0.10
$0.20
$0.30
$0.40
$0.50
$0.60
$0.70
1985 1990 1997 2000 2005 2008
Avg
Far
e
$0.00
$10.00
$20.00
$30.00
$40.00
$50.00
$60.00
$70.00
$80.00
Cost
/Hou
r
Avg Fare Cost/Hour
=
Trend• Operating costs have kept up with inflation
• Average fares (revenues/passenger) have declined
Adjusted for inflation
Result• Even if service levels and ridership remain unchanged, costs/million passenger hours would increase while revenue/million passenger hours would decrease
• Given the increase in service levels and decrease in passengers, the gap between cost and revenues increases from $0.09 to $0.12
Cost & Revenue per MM Rider Revenue Hours
$0.00
$0.02
$0.04
$0.06
$0.08
$0.10
$0.12
$0.14
$0.16
$0.18
$0.20
FY1986 FY1990 FY1995 FY2000 FY2005 FY2009
Oper Cost per MM Rider Rev Hours Fare Rev per MM Rider Rev HoursLinear (Oper Cost per MM Rider Rev Hours) Linear (Fare Rev per MM Rider Rev Hours)

METRO BUS FINANCIAL IMPACTS
Trend• Lower farebox recovery results in greater reliance on diminishing public subsidies
0%5%
10%15%20%25%30%35%40%45%50%
1985 1990 1997 2000 2005 2008
Fare
box R
ecov
ery
Metro Bus
=Fare Revenue
Operating Cost
Higher
LowerPast Present
Subsidies
recurring + planned revenues
unplanned revenues
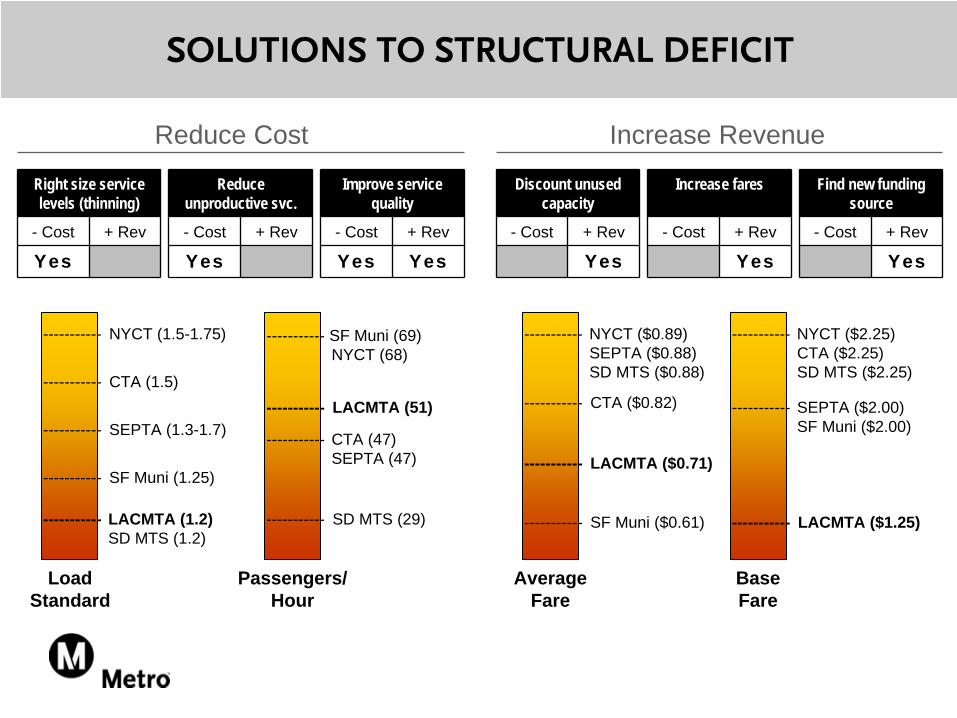
SOLUTIONS TO STRUCTURAL DEFICIT
Right size service levels (thinning)
- Cost + Rev
Yes
Load Standard
----------- NYCT (1.5-1.75)
----------- CTA (1.5)
----------- SEPTA (1.3-1.7)
----------- LACMTA (1.2)SD MTS (1.2)
----------- SF Muni (1.25)
Reduce unproductive svc.
- Cost + Rev
Yes
Passengers/Hour
----------- CTA (47)SEPTA (47)
----------- LACMTA (51)
----------- SF Muni (69)NYCT (68)
Improve service quality
- Cost + Rev
Yes Yes
Reduce Cost Increase Revenue
Average Fare
----------- NYCT ($0.89) SEPTA ($0.88)SD MTS ($0.88)
----------- CTA ($0.82)
Discount unused capacity
- Cost + Rev
Yes
----------- LACMTA ($0.71)
----------- SF Muni ($0.61)
BaseFare
----------- NYCT ($2.25)CTA ($2.25)SD MTS ($2.25)
----------- SEPTA ($2.00)SF Muni ($2.00)
----------- LACMTA ($1.25)
Increase fares
- Cost + Rev
Yes
Find new funding source
- Cost + Rev
Yes
----------- SD MTS (29)
Related Documents