CONCEPT REVIEW Demand is the willingness to buy a good or a service and the ability to pay for it. Supply is the willingness and ability to produce and sell a product. CHAPTER 6 KEY CONCEPT The equilibrium price is the price at which quantity demanded and quantity supplied are the same. WHY THE CONCEPT MATTERS You’ve been looking for a vintage concert T-shirt to buy. You see the shirt you want offered on an Internet site, but the price is too high. After exchanging several e-mails, you and the seller set a price. It’s higher than you wanted to pay and lower than the seller wanted to receive, but it’s acceptable to you both. In a market economy, the forces of demand and supply act in much the same way. They work together to set a price that buyers and sellers find acceptable. Why have some rock bands questioned the pricing practices of certain ticketing companies? See the Case Study on pages 186–187. CHAPTER 163 Demand, Supply, and Prices SECTION 1 Seeking Equilibrium: Demand and Supply SECTION 2 Prices as Signals and Incentives SECTION 3 Intervention in the Price System C ASE STUDY Prices for Concert Tickets Go to ECONOMICS UPDATE for chapter updates and current news on ticketing companies’ pricing practices. (See Case Study, pp. 186–187.) Go to ANIMATED ECONOMICS for interactive lessons on the graphs and tables in this chapter. Go to INTERACTIVE REVIEW for concept review and activities. 6 Demand, Supply, and Prices More at ClassZone.com

Welcome message from author
This document is posted to help you gain knowledge. Please leave a comment to let me know what you think about it! Share it to your friends and learn new things together.
Transcript

CONCEPT REVIEW
Demand is the willingness to buy a good or a service and the abilityto pay for it.Supply is the willingness and ability to produce and sell a product.
CHAPTER 6 KEY CONCEPT
The equilibrium price is the price at which quantity demanded andquantity supplied are the same.
WHY THE CONCEPT MATTERS
You’ve been looking for a vintage concert T-shirt to buy. You see theshirt you want offered on an Internet site, but the price is too high.After exchanging several e-mails, you and the seller set a price. It’shigher than you wanted to pay and lower than the seller wanted toreceive, but it’s acceptable to you both. In a market economy, theforces of demand and supply act in much the same way. They worktogether to set a price that buyers and sellers find acceptable.
Why have some rock bandsquestioned the pricing practices ofcertain ticketing companies? See theCase Study on pages 186–187.
CHAPTER
163Demand, Supply, and Prices
SECTION 1Seeking
Equilibrium:Demand and
Supply
SECTION 2Prices as Signalsand Incentives
SECTION 3Intervention in
the Price System
CASE STUDYPrices for
Concert Tickets
Go to ECONOMICS UPDATE for chapterupdates and current news on ticketingcompanies’ pricing practices. (SeeCase Study, pp. 186–187.)
Go to ANIMATED ECONOMICS forinteractive lessons on the graphs andtables in this chapter.
Go to INTERACTIVE REVIEW forconcept review and activities.
6 Demand, Supply,and Prices
More at ClassZone.com

1SECT ION
164 Chapter 6
OBJECT IVES KEY TERMS TAKING NOTES
As you read Section 1, completea cluster diagram like the oneshown using the key concepts andother helpful words and phrases.Use the Graphic Organizer atInteractive Review @ ClassZone.com
In Section 1, you will
• explore market equilibriumand see how it is reached
• explain how demand andsupply interact to determineequilibrium price
• analyze what causes surplus,shortage, and disequilibrium
• identify how changes todemand and supply affect theequilibrium price
market equilibrium, p. 164
equilibrium price, p. 164
surplus, p. 167
shortage, p. 167
disequilibrium, p. 169
The Interaction of Demand and Supply
KEY CONCEPTS
In Chapters 4 and 5, you learned about how demand and supply work in the market.Recall that a market is any place or situation in which people buy and sell goods andservices. Since the market is the place where buyers and sellers come together, it isalso the place where demand and supply interact.
As buyers and sellers interact, the market moves toward market equilibrium, asituation in which the quantity demanded of a good or service at a particular priceis equal to the quantity supplied at that price. Equilibrium price is the price at whichthe quantity of a product demanded by consumers and the quantity supplied byproducers are equal.
EXAMPLE Market Demand and Supply Schedule
Let’s look at an example of how thisconcept works in a particular mar-ket. Karen runs a sandwich shopnear an office park. Recently, shedecided to offer a new product atlunchtime—prepared salads. On thefirst day, she makes up 40 salads andoffers them at $10 each. She is disap-pointed when she sells only 10 andhas to throw the rest away. The nextday she is more cautious. She lowers
Seeking Equilibrium:Demand and Supply
Market equilibriumoccurs when the quantitydemanded and thequantity supplied at aparticular price are equal.
Equilibrium price isthe price at which thequantity demanded andthe quantity supplied areequal.
QUICK REFERENCE
Equilibrium
marketequilibrium
dis-equilibrium

FIGURE 6.1 KAREN’S MARKET DEMAND AND SUPPLY SCHEDULE
Price perSalad ($)
QuantityDemanded
QuantitySupplied
10 10 40
8 15 35
6 25 25
4 35 15
2 40 10
Find an update onmarket equilibrium atClassZone.com
165Demand, Supply, and Prices
the price to $4 each and makes only 15 salads. She discovers that 35 customers wantedher salads at the lower price. How can Karen find the right price?
Over the course of a week, Karen experiments with different combinations ofprice and quantity of salads supplied until she discovers market equilibrium at $6per salad. At that price, she is willing to offer 25 salads for sale, and she sells all ofthem. When she has either too many or too few salads, she is motivated to changeher price. Market equilibrium is the point at which quantity demanded and quantitysupplied are in balance.
Look at Figure 6.1 to see the information that Karen gathered from her firstweek selling prepared salads. This table is a combined market demand and sup-ply schedule that shows the quantities of salads supplied and demanded at variousprices. Notice that quantity demanded and quantity supplied are different at everyline of the schedule except one. That line represents market equilibrium and showsthe equilibrium price of $6. When Karen offers salads at prices above $6, she pro-duces more salads than she can sell and has to throw some away. When she offerssalads at prices below $6, there is unmet demand because people want more saladsthan Karen is willing to offer at those prices.
Karen’s experience shows how the laws of demand and supply interact in themarket. She wants to offer more salads at higher prices than at lower prices becauseshe wants to earn more profit. Her costs would make it impossible to earn much, ifany, profit if she were to sell the number of salads that the office workers would liketo buy at the lower prices. In a similar way, while the office workers may like the ideaof fresh salads for lunch, they are not willing to buy the quantity of salads that Karenwants to sell at higher prices.
Use an interactive market demandand supply schedule and curve atClassZone.com
b
a
c
a At prices above $6, quantity sup-plied exceeds quantity demanded.
b At the price of $6, the quantitydemanded and the quantity sup-plied are equal.
c At prices below $6, the quantitydemanded exceeds the quantitysupplied.
Only at the equilibrium price of $6are the quantity demanded and thequantity supplied equal.
ANALYZE TABLES1. What is the difference between quantity
supplied and quantity demanded when theprice is $10? What is the difference whenthe price is $2?
2. How does this market demand and supplyschedule illustrate the laws of demand andsupply?

0
2
4
6
8
10
10 20 30 40 50
Quantity of salads
Pric
e p
er s
alad
(in
do
llars
)
FIGURE 6.2 MARKET DEMAND AND SUPPLY CURVES
S
D
166 Chapter 6
EXAMPLE Market Demand and Supply Curve
Just as it is possible to convert a market demand schedule to a market demand curveor a market supply schedule to a market supply curve, it is possible to graph a com-bined market demand and supply schedule.
Figure 6.2 portrays Karen’s market demand and supply schedule on a com-bined graph. On the graph, the vertical axis shows the various prices at which saladsare offered for sale and bought. The horizontal axis shows the quantity of salads,whether it is the quantity demanded or the quantity supplied. The demand curve(D) is plotted using the prices and the quantities demanded (Figure 6.1, columns1 and 2). The supply curve (S) is plotted using the prices and the quantities sup-plied from the combined schedule (Figure 6.1, columns 1 and 3). You can read eachindividual curve the same way that you did in Chapters 4 and 5, when demand andsupply were shown on separate graphs. Each point on the demand curve shows theintersection of price and quantity demanded. Each point on the supply curve showsthe intersection of price and quantity supplied.
Look at Figure 6.2 again and notice that the two curves intersect at only onepoint; this is the point of market equilibrium. It occurs when quantity demanded andquantity supplied are the same—25 salads at $6. Showing the two curves togetherallows you to see the interaction of demand and supply graphically.
APPLICATION Applying Economic Concepts
A. Create a combined market demand and supply schedule for pizza at prices of $25,$20, $15, $10, and $5, where $10 is the price at which there is equilibrium.
b
Price perSalad ($)
QuantityDemanded
QuantitySupplied
10 10 408 15 356 25 254 35 152 40 10
ANALYZE GRAPHS1. What is the quantity supplied at $8? What is the quantity demanded at $8?
2. How do these market demand and supply curves illustrate the concept ofequilibrium price?
a The demand curve(D) shows quan-tity demanded atvarious prices andslopes down.
b The supply curve(S) shows quantitysupplied at variousprices and slopesup.
c This is the pointof market equi-librium, wherequantity suppliedand demandedare equal.
c
a
0
2
4
6
8
10
10 20 30 40 50
Quantity of salads
Pric
e p
er s
alad
(in
do
llars
)
FIGURE 6.3 SURPLUS, SHORTAGE, AND EQUILIBRIUM
D
S
167Demand, Supply, and Prices
Reaching the Equilibrium Price
KEY CONCEPTS
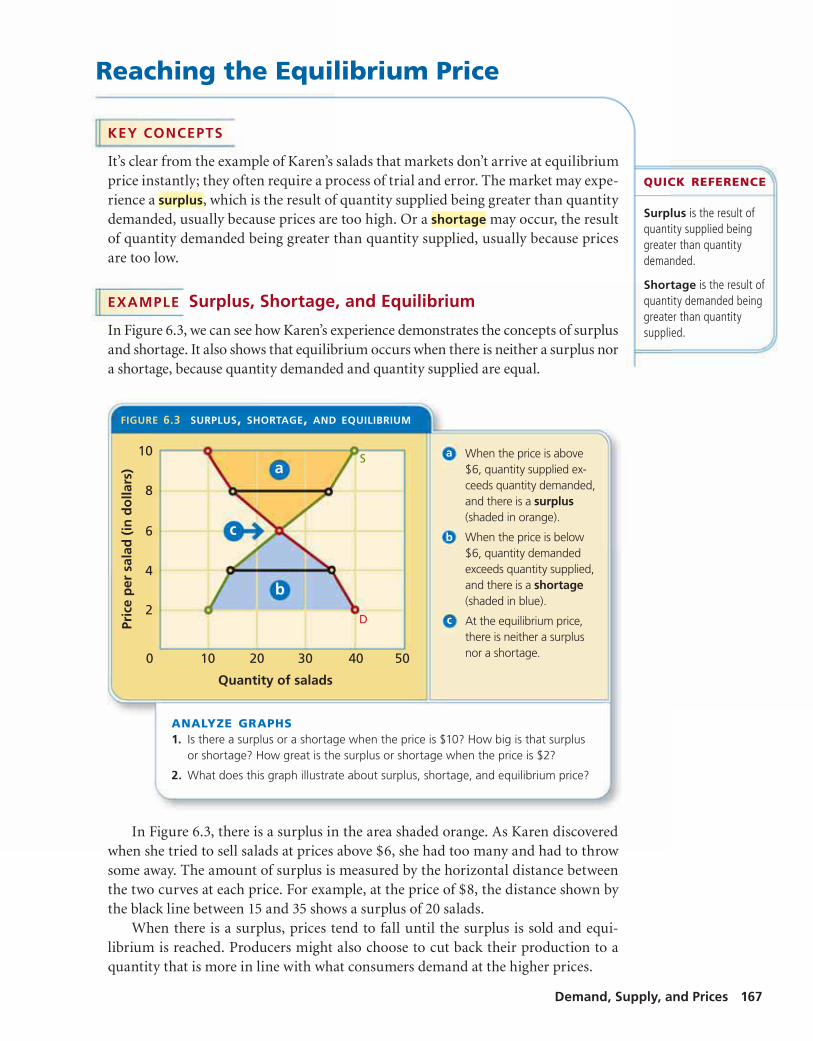
It’s clear from the example of Karen’s salads that markets don’t arrive at equilibriumprice instantly; they often require a process of trial and error. The market may expe-rience a surplus, which is the result of quantity supplied being greater than quantitydemanded, usually because prices are too high. Or a shortage may occur, the resultof quantity demanded being greater than quantity supplied, usually because pricesare too low.
EXAMPLE Surplus, Shortage, and Equilibrium
In Figure 6.3, we can see how Karen’s experience demonstrates the concepts of surplusand shortage. It also shows that equilibrium occurs when there is neither a surplus nora shortage, because quantity demanded and quantity supplied are equal.
In Figure 6.3, there is a surplus in the area shaded orange. As Karen discoveredwhen she tried to sell salads at prices above $6, she had too many and had to throwsome away. The amount of surplus is measured by the horizontal distance betweenthe two curves at each price. For example, at the price of $8, the distance shown bythe black line between 15 and 35 shows a surplus of 20 salads.
When there is a surplus, prices tend to fall until the surplus is sold and equi-librium is reached. Producers might also choose to cut back their production to aquantity that is more in line with what consumers demand at the higher prices.
Surplus is the result ofquantity supplied beinggreater than quantitydemanded.
Shortage is the result ofquantity demanded beinggreater than quantitysupplied.
QUICK REFERENCE
c
a
ANALYZE GRAPHS1. Is there a surplus or a shortage when the price is $10? How big is that surplus
or shortage? How great is the surplus or shortage when the price is $2?
2. What does this graph illustrate about surplus, shortage, and equilibrium price?
a When the price is above$6, quantity supplied ex-ceeds quantity demanded,and there is a surplus(shaded in orange).
b When the price is below$6, quantity demandedexceeds quantity supplied,and there is a shortage(shaded in blue).
c At the equilibrium price,there is neither a surplusnor a shortage.
b

168 Chapter 6
The blue area in Figure 6.3 represents where there is a shortage. When Karen decidedto charge less than $6, she had too few salads and lots of unhappy customers who weren’table to get the salads they wanted. As with the surplus, the amount of shortage ismeasured by the horizontal distance between the two curves at each price. For example,at the price of $4, the distance shown by the black line between 15 and 35 saladsshows a shortage of 20 salads.
When there is a shortage, producers raise prices in an attempt to balance quan-tity supplied and quantity demanded. Producers may also try to increase quantitysupplied to meet the quantities demanded at the lower prices.
EXAMPLE Holiday Toys
The concepts of surplus and shortage and the move to equilibrium areactive in many markets at different times. Perhaps they are most visiblein the market for toys during the holiday shopping season. Toys are oftenfads, and children’s tastes change rapidly. It is difficult for marketers toknow how much to supply and at what price to best meet the quantitiesdemanded by consumers. Sometimes they overestimate a toy’s popularityand end up with a surplus. If they underestimate popularity, they are facedwith a shortage.
In 1996, for example, Tyco Toys Inc. introduced Tickle Me Elmo. Thetoy included a microchip that made the toy laugh when it was touched. Tycoexpected the toy to be popular and ordered about 500,000 for the holidayseason. It was priced around $30.
Sales started slowly, and stores thought they might have a surplus. But afterseveral popular television personalities promoted it, Tickle Me Elmo becamethe hottest toy of that holiday season, and a shortage developed. Even whenprices increased markedly, buyers were undeterred. They continued to pur-chase the toys until they were all gone.
Tyco tried to increase its supply, but the factories that made Tickle MeElmo were located in Asia, and the shortage persisted throughout the holidayseason. By spring, the quantity supplied had doubled. By then, however, theheight of the fad was over. Initially, stores tried to sell the toys at the samehigh prices charged during the holiday season. But consumers were reluctant
to buy, and a surplus resulted. Eventually, the market reached equilibrium at a price ofabout $25.
When you see suppliers reducing prices, it is often because they have a surplus ofproducts to sell. Consider, for example, what happens to the prices of clothing itemsthat are out of season or no longer in fashion. On the other hand, if an item becomesparticularly popular or is in short supply for some other reason, suppliers will raiseprices. The market does not always reach equilibrium quickly, but it is always movingtoward equilibrium.
APPLICATION Applying Economic Concepts
B. Look back at the market demand and supply schedule you created for Application Aon p. 166. Use it to create a graph showing the interaction of demand and supply andmark it to show surplus, shortage, and equilibrium.
Holiday ShortagesConsumer tastes often causespikes in demand for certainitems during the holidays.
Create a demand and supplycurve at ClassZone.com

0
25
50
75
125
100
1 2 3 4 5 6 7
Pric
e p
er p
air
(in
do
llars
)
Quantity of shoes (in thousands)
0
25
50
75
125
100
1 2 3 4 5 6 7
Pric
e p
er p
air
(in
do
llars
)
Quantity of shoes (in thousands)
FIGURE 6.4 DECREASE IN DEMAND FIGURE 6.5 INCREASE IN DEMAND
FIGURES 6.4 AND 6.5 CHANGES IN DEMAND AND EQUILIBRIUM PRICE
S S
D1 D1D2 D3
169Demand, Supply, and Prices
Equilibrium Price in Real Life
KEY CONCEPTS
In theory, the relationship between demand and supply in the market seems straight-forward. The real world, however, is more complex. In earlier chapters, you learnedthat there are several factors that can cause demand and supply to change. Whenthere is an imbalance between quantity demanded and quantity supplied, a state ofdisequilibrium exists, and the process of finding equilibrium starts over again.
EXAMPLE Change in Demand and Equilibrium Price
Let’s take a look at how the market moves from disequilibrium by considering theeffect of changes in demand on the equilibrium price for athletic shoes. Recallthat a change in demand occurs when one of six factors—income, consumer taste,consumer expectations, market size, substitutes, and complements—promptsconsumers to change the quantity demanded at every price.
In Figures 6.4 and 6.5, the intersection of the demand curve (D1) and the supplycurves (S) shows an equilibrium price of $75, with quantity demanded and sup-plied of 3,000 pairs of shoes. When a change in consumer taste causes a decreasein demand for athletic shoes at every price, the demand curve shifts to the left, asshown in Figure 6.4. Notice that this new demand curve (D2) intersects the supplycurve at a lower price, around $65. This becomes the new equilibrium price. At this
Disequilibrium occurswhen quantity demandedand quantity supplied arenot in balance.
QUICK REFERENCE
a
b
ANALYZE GRAPHS1. What happens to quantity demanded at $100 when
demand decreases? What happens to quantitydemanded at $100 when demand increases?
2. Does change in demand have a direct or inverserelationship to equilibrium price? Explain your answer.
a In Figure 6.4, de-mand decreases; thedemand curve shiftsleft and intersectsthe supply curve at alower point.
b In Figure 6.5, de-mand increases; thedemand curve shiftsright and intersectsthe supply curve at ahigher point.
c When demand de-creases (Fig. 6.4),the equilibrium pricefalls to about $65.
d When demand in-creases (Fig. 6.5),the equilibrium pricerises to about $90.
Use an interactive market demandand supply curve to see changes indemand, supply, and equilibrium priceat ClassZone.com
d
c

0
25
50
75
125
100
1 2 3 4 5 6 7
Pric
e p
er p
air
(in
do
llars
)
Quantity of shoes (in thousands)
0
25
50
75
125
100
1 2 3 4 5 6 7
Pric
e p
er p
air
(in
do
llars
)
Quantity of shoes (in thousands)
FIGURE 6.6 DECREASE IN SUPPLY FIGURE 6.7 INCREASE IN SUPPLY
FIGURES 6.6 AND 6.7 CHANGES IN SUPPLY AND EQUILIBRIUM PRICE
S1S2 S1 S3
D D
170 Chapter 6
new, lower equilibrium price, the quantity demanded decreases to 2,500 pairs ofshoes. In other words, when consumers demand fewer goods and services at everyprice, the equilibrium price will fall and suppliers will sell fewer units—even thoughthe price is lower.
Suppose that an increase in the number of young adults causes demand for ath-letic shoes to increase. When there is an increase in demand, the demand curveshifts to the right, as shown in Figure 6.5. Notice that the new demand curve (D3)intersects the supply curve at a higher price, around $90. As the equilibrium priceincreases to this higher level, the quantity demanded also increases to 3,500 pairsof shoes. When consumers demand more goods and services at every price, equilib-rium price will rise and suppliers will sell more, even at higher prices.
EXAMPLE Change in Supply and Equilibrium Price
Now let’s consider how changes in supply might affect equilibrium price. Recall thata change in supply occurs when something in the market prompts producers to offerdifferent amounts for sale at every price. Remember from Chapter 5 that the six fac-tors that can change supply are input costs, productivity, technology, governmentaction, producer expectations, and number of producers.
In Figures 6.6 and 6.7, the intersection of the supply curve (S1) and the demandcurve (D) shows an equilibrium price of $75, with quantity supplied and demandedof 3,000 pairs of shoes. If the price of the raw materials needed to produce athleticshoes increases, the result is a decrease in supply of these shoes at every price.
ANALYZE GRAPHS1. What happens to quantity supplied at $100 when supply decreases? What happens to
quantity supplied at $100 when supply increases?
2. How do these graphs illustrate the relationship between change in supply and change inequilibrium price?
a In Figure 6.6, supplydecreases; the supplycurve shifts left andintersects the demandcurve at a higherpoint.
b In Figure 6.7, supplyincreases; the supplycurve shifts right andintersects the demandcurve at a lower point.
c When supplydecreases (Fig. 6.6)the equilibrium pricerises to about $90.
d When supplyincreases (Fig. 6.7)the equilibrium pricefalls to about $55.
ab
c
d

171Demand, Supply, and Prices
In this situation, the supply curveshifts to the left, as shown in Figure6.6. Notice that the new supply curve(S2) intersects the demand curve ata higher price, around $90. This isthe new equilibrium price. Becauseof this increase in price, the quantitydemanded at equilibrium decreasesto 2,500 pairs of shoes. In otherwords, when there are fewer goodsand services available at every price,equilibrium price will rise.
When new technology allows themanufacturer to produce shoes moreefficiently, supply increases, and thesupply curve shifts to the right, asshown in Figure 6.7. Notice that thenew supply curve (S3) intersects thedemand curve at a lower price, about$55. This is the new equilibrium price. Because of this decrease in price, the quantitydemanded at equilibrium increases to about 4,100 pairs of shoes. In other words,when there are more goods and services available at every price, equilibrium pricewill fall.
Look at Figures 6.4, 6.5, 6.6, and 6.7 once more and notice which situations causeequilibrium price to fall and which cause equilibrium price to rise. The relationshipsbetween changes in demand or supply and changes in equilibrium price are illus-trated in Figure 6.8. Equilibrium price falls when there is a decrease in demand or anincrease in supply. Equilibrium price rises when there is an increase in demand or adecrease in supply. In other words, when consumers want less or producers supplymore, prices will fall. When consumers want more or producers supply less, priceswill rise.
APPLICATION Analyzing Effects
C. If one of the three pizza parlors in your neighborhood closes, what will happen to thesupply of pizza? How will that affect the equilibrium price of pizza?
If demanddecreases
supplyincreases
supplydecreases
equilibriumpricerises.
equilibriumpricefalls.
If demandincreases
FIGURE 6.8 EQUILIBRIUM PRICE AND CHANGES IN DEMAND AND SUPPLY
OR THEN OR THEN
Technology Both supply and equilibrium price are affected when technologyimproves the manufacturing process.

ECONOMICSSKILLBUILDER
0
2
1
3
4
5
6
20 40 60 80 100 120
Quantity of sandwiches demandedand supplied
Pric
e (i
n d
olla
rs)
FIGURE 6.9 SHIFT IN SUPPLY OF SANDWICHES
S1 S2
D
c
a
b
For more on interpreting graphs, seethe Skillbuilder Handbook, page R29.
172 Chapter 6
Interpreting Graphs: Shifting CurvesGraphs show statistical information in a visual manner. A graph that shows a shiftingcurve should immediately alert the reader to one of the following: a change inquantity demanded at every price, or a change in quantity supplied at every price.In Figure 6.9, a change in the number of producers has caused an increase in supplyat every price. The sandwich shop across the street from Forest View High Schoolnow has a competitor.
TECHNIQUES FOR ANALYZING SHIFTING CURVES Use the following strategies,along with what you learned throughout Section 1, to analyze the graph.
THINKING ECONOMICALLY Analyzing
1. What are the pre-shift and post-shift equilibrium prices for a sandwich? Will anincrease in quantity supplied at every price always result in a lower equilibriumprice? Why?
2. Imagine that instead of an increase in supply, there is a decrease in demand.How will the equilibrium price change? Why?
3. On a separate sheet of paper, sketch intersecting quantity supplied and demandedcurves with an equilibrium price of $4 at 80 sandwiches. How have the curvesshifted from those that appear in Figure 6.9?
Read the axislabels carefully.When both quantitysupplied anddemanded arepresent, look for anintersection to findequilibrium price.
Use the titleto identify themain idea of thegraph. If supplyhas shifted,then we knowthat quantitysupplied atevery price haseither increasedor decreased.
Use the annotations to findkey elements of the graph.Annotation a shows theequilibrium price where curveS1 meets curve D.
a This is the initialequilibrium price.
b Curve shifts tothe right.
c This is the newequilibrium price.
Notice that b shows a shiftto the right. An increase in supplyalways shows a rightward shift; adecrease in supply always causes aleftward shift.
Notice the new equilibrium price,c . An increase in supply results in
a lower equilibrium price.
ClassZone.com
173Demand, Supply, and Prices
ECONOMICS IN PR ACTICE
SECTION 1 AssessmentREVIEWING KEY CONC EP TS
a. market equilibriumdisequilibrium
b. surplusshortage
2. How are surplus and shortage related to equilibrium price?
3. Why is equilibrium price represented by the intersection of the supplyand demand curves in a particular market?
4. Why do changes in demand or supply cause disequilibrium?
5. Why is the market always moving toward equilibrium?
6. Using Your Notes How is equilibriumprice related to market equilibrium?Refer to your completed cluster diagram.
Use the Graphic Organizer atInteractive Review @ ClassZone.com
7. Analyzing Data Look at Figures 6.4, 6.5, 6.6, and 6.7 again.What happens to surplus and shortage as equilibrium pricechanges in each graph? What general conclusions can you drawfrom this information?
8. Analyzing Causes Suppose that the federal government decidesto increase the excise tax on cellular phone services by 0.1 percent.Why will this action cause the equilibrium price of cellular phoneservices to rise?
9. Applying Economic Concepts Between 2003 and 2005, therewas huge growth in the market for premium blue jeans priced at$200 or more per pair. The growth was largely fueled by popularmagazines showing celebrities wearing certain brands. Then, inthe summer of 2005, major department stores started cuttingprices on the jeans; they were also found on Web sites that offerjeans at discount prices. Use the economic concepts that youlearned in this section to describe what is happening in this market.
10. Challenge Study Figures 6.4, 6.5, 6.6, and 6.7 again. Whatwould happen if a change in consumer taste caused an increasein demand for athletic shoes and more suppliers entered the mar-ket at the same time? Assume that the increases in demand andin supply are proportionately the same. How would this result bedifferent if each of these changes happened separately?
Equilibrium
marketequilibrium
dis-equilibrium
C RIT IC AL THINKING
Finding Equilibrium PriceSuppose that you are a manufacturerof a new mini refrigerator for col-lege dorm rooms. You expect yourproduct to be popular because of itscompact size and high tech design.After a few weeks in the market youare able to develop the followingmarket demand and supply schedule.
Create a Demand and SupplyCurve Use this market demand andsupply schedule to create a marketdemand and supply curve and deter-mine the equilibrium price.
Challenge Calculate surplus orshortage at every price and suggestways the manufacturer could try toeliminate the surplus and raise theequilibrium price.
Price perRefrigerator
($)
QuantityDemanded
QuantitySupplied
225 500 6,000
200 1,000 4,500
175 1,500 3,500
150 2,500 2,500
125 4,000 1,500
1. Explain the differences between the terms in each of these pairs:
2SECT ION
174 Chapter 6
OBJECT IVES KEY TERMS TAKING NOTES
As you read Section 2, complete achart like the one shown to keeptrack of how each key conceptaffects producers and consumers.Use the Graphic Organizer atInteractive Review @ClassZone.com
In Section 2, you will
• analyze how the price systemworks
• explain how prices provideinformation about markets
• describe how prices act asincentives to producers
competitive pricing, p. 174
incentive, p. 176
How the Price System Works
KEY CONCEPTS
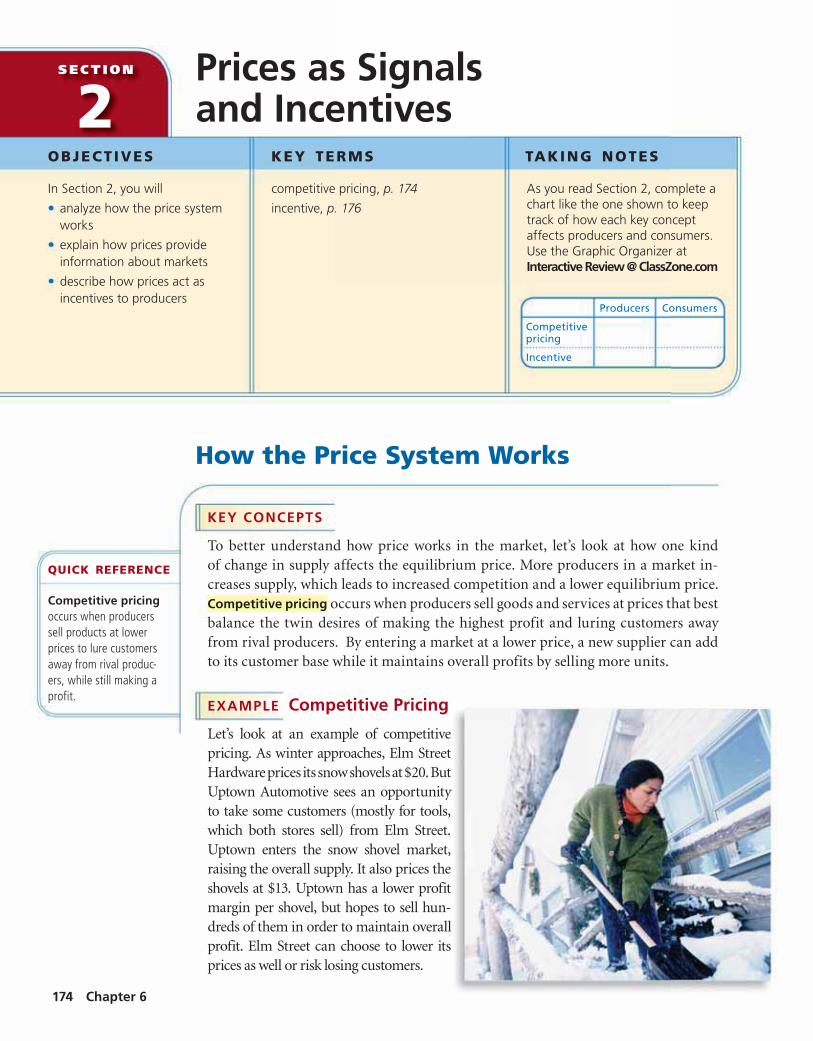
To better understand how price works in the market, let’s look at how one kindof change in supply affects the equilibrium price. More producers in a market in-creases supply, which leads to increased competition and a lower equilibrium price.Competitive pricing occurs when producers sell goods and services at prices that bestbalance the twin desires of making the highest profit and luring customers awayfrom rival producers. By entering a market at a lower price, a new supplier can addto its customer base while it maintains overall profits by selling more units.
EXAMPLE Competitive Pricing
Let’s look at an example of competitivepricing. As winter approaches, Elm StreetHardware prices its snow shovels at $20. ButUptown Automotive sees an opportunityto take some customers (mostly for tools,which both stores sell) from Elm Street.Uptown enters the snow shovel market,raising the overall supply. It also prices theshovels at $13. Uptown has a lower profitmargin per shovel, but hopes to sell hun-dreds of them in order to maintain overallprofit. Elm Street can choose to lower itsprices as well or risk losing customers.
Prices as Signalsand Incentives
Competitive pricingoccurs when producerssell products at lowerprices to lure customersaway from rival produc-ers, while still making aprofit.
QUICK REFERENCE
Producers Consumers
Competitivepricing
Incentive

175Demand, Supply, and Prices
EXAMPLE Characteristics of the Price System
In a market economy, the price system has four characteristics.
1. It is neutral. Prices do not favor either the producer or consumer because bothmake choices that help to determine the equilibrium price. The free interactionsof consumers (who favor lower prices) and producers (who favor higher prices)determines the equilibrium price in the market.
2. It is market driven. Market forces, not central planning, determine prices, so thesystem has no oversight or administration costs. In other words, the price systemruns itself.
3. It is flexible. When market conditions change, prices are able to change quicklyin response. Surpluses and shortages motivate producers to change prices to reachequilibrium.
4. It is efficient. Prices will adjust until the maximum number of goods and servicesare sold. Producers choose to use their resources to produce certain goods andservices based on the profit they can make by doing so.
APPLICATION Analyzing and Interpreting Data
A. If Karen sold 25 salads at $6 each, how many would she need to sell at $5.50 to makeat least the same amount of total revenue?
F I G U R E 6.10 Characteristics of the Price System in a Market Economy
ECONOMICS ESSENTIALS
ANALYZE CHARTSChoose two of the characteristics of the price system shown in the chart and explain how each isillustrated through the example of competitive pricing.
DECEMBER
26
WhatAre the
Characteristicsof the Price
System?Efficient Resources areallocated efficientlysince prices adjustuntil the maximumnumber of goods andservices are sold.
Neutral Both theproducer and theconsumer make choicesthat determine theequilibrium price.
Market DrivenMarket forces,not governmentpolicy, determineprices. In effect,the system runsitself.
Flexible Whenmarket conditionschange, so do prices.

176 Chapter 6
Prices Motivate Producersand Consumers
KEY CONCEPTS
The laws of demand and supply show that consumers and producers have differentattitudes toward price. Consumers want to buy at low prices; producers want tosell at high prices. Therefore, prices motivate consumers and producers in differentways. You learned in Chapter 1 that an incentive is a way to encourage people to takea certain action. Here, you’ll learn that in the price system, incentives encourageproducers and consumers to act in certain ways consistent with their best interests.
EXAMPLE Prices and Producers
For producers, the price system has two great advantages: it provides both informa-tion and motivation. Prices provide information by acting as signals to producersabout whether it is a good time to enter or leave a particular market. Rising pricesand the expectation of profits motivate producers to enter a market. Falling pricesand the possibility of losses motivate them to leave a market.
A shortage in a market is a signal that consumer demand is not being met byexisting suppliers. Recall that a shortage often occurs because prices are too lowrelative to the quantities demanded by consumers. Producers will view the shortageas a signal that there is an opportunity to raise prices. Higher prices act as an incen-tive for producers to enter a market. In other words, the prospect of selling goods athigher prices encourages producers to offer products for that market.
As more producers are motivated by high prices to enter a market, quantity sup-plied increases. When prices are too high relative to consumer demand, a surplusoccurs. Producers can respond to a surplus either by reducing prices, or by reducingproduction to bring it in line with the quantity demanded at a particular price.Either way, falling prices signal that it is a good time for producers to leave the market.Sometimes, less efficient producers leave a market completely, as increased competi-tion and lower prices drive them out of business. More often, producers shift theirbusiness to focus on opportunities in markets with higher potential profits.
An incentive encouragespeople to act in certainways.
QUICK REFERENCE
FIGURE 6.11 CD PRICES AND PRODUCERS
Competition from DVDs andvideo games causes a slump inCD sales–a surplus in CDs.
Discount chains begin to sell CDs,often below cost, to attract customers;competitive pricing of CDs.
Some CD makers switch productionto DVDs, video games; fewer CDsare produced–a shortage of CDs.
Many small record stores go out ofbusiness or devote less shelf space toCDs, more to DVDs and video games.
CD prices decrease
CD prices increase
CD prices decrease
1.
2.
3.
4.

177Demand, Supply, and Prices
Competitive pricing in the market often informs the choices made by producers.When a market is growing, and when there is unmet demand, a producer may decideto enter the market with a price that is lower than its competitor’s. The new producercan still, however, earn a profit by selling more units at the lower price. So, whileprices are the signals that are visible in the market, it is the expectation of profits orthe possibility of losses that motivates producers to enter or leave a market.
EXAMPLE Prices and Consumers
Prices also act as signals and incentives for consumers. Surpluses that lead to lowerprices tell consumers that it is a good time to buy a particular good or service. Pro-ducers often send this signal to consumers through advertising and store displaysthat draw consumers to certain products. Producers may also suggest that the lowprices won’t last, encouraging consumers to buy sooner rather than later.
High prices generally discourage consumers from buying a particular productand may signal that it is time for them to switch to a substitute that is available at alower price. A high price may signal that a particular product is in short supply orhas a higher status. Brand marketers rely on the consumer perception that a certainlogo is worth a higher price.
Recall what you learned about normal and inferior goods in Chapter 4. Mostconsumers prefer to buy normal goods at the best possible price. They will buy inferiorgoods only when they cannot afford something better. While price is a powerfulincentive to consumers, the other factors that affect demand also influence consumers’buying habits.
APPLICATION Making Inferences
B. A cup of gourmet coffee commands a higher price than a regular coffee. How will thisfact influence the take-out coffee market?
YOUR ECONOMIC CHOICES
▲ Buy now
PRICES AND CONSUMERS
How Does Price Affect Your Decision?A new digital video camera with state-of-the-art featurescosts $500, but you’ve saved only $250. You can eitherbuy a less expensive substitute with the money you havenow, or you can save up to buy the advanced camera later.If other consumers also choose to wait to buy the newcamera, a surplus may develop, and the price may decrease.
▲ Save for later
?

178 Chapter 6
ECONOMICS PACESET TER
Michael Dell: Using Price to Beat the Competition
When he began his company, high-tech entrepreneur Michael Dell used competitive pricing to take business away from larger, more established companies. Later, Dell man-aged to survive a downturn in sales that hobbled Compaq and drove IBM out of the per-sonal computer market. How did Dell’s company thrive as his competitors struggled?
Lowering Costs to Reduce Prices
Michael Dell began assembling and selling computers as a freshman in college. He became so successful that he quit college in 1984 to focus on his business. He had sales worth $6 million in his first full year.
Dell’s success was largely due to his approach to marketing and production. He bypassed computer retailers and sold over the telephone directly to knowl-edgeable computer users in business and government. Each computer was built to customer requirements and assembled after it was ordered. In this way, Dell low-ered his costs significantly and became the low-price leader in the market. The company’s sales grew to $69.5 million in 1986 and to almost $258 million in 1989.
Dell was also a pioneer in recognizing the potential for sales via the Internet. This strategy allowed the company to maintain close contact with its customers and to adjust its prices frequently, up and down, as market conditions dictated. Competitors who sold only in retail stores found it hard to compete on price because their costs were much higher. In 1999, Dell became the leading supplier of PCs in the United States. In 2005, worldwide sales reached almost $50 billion.
Dell has used his experience with computers to make waves in the market for consumer electronics (televisions, por-table electronics, and so forth). He sees a bright future for his company. “We are at the dawn of the connected era, and Dell has never been better positioned to meet the needs of the billions of people who will join us online in the coming years.”
APPLICATION Drawing Conclusions
C. What incentive did Michael Dell have to sell computers at prices lower than those of his competitors?
Michael S. Dell
Title: Chairman and CEO of Dell Inc.
Born: February 23, 1965, Houston, Texas
Major Accomplish-ment: Pioneered the direct sale of personal computers to consumers
Key Product Lines: Desktop PCs, notebook computers, workstation systems, servers, printers, flat-screen TVs, PDAs
Honors: Youngest CEO of a Fortune 500 com-pany (1992), America’s Most Admired Company (2005)
FAST FACTS
Find an update on Michael Dell at ClassZone.com
Michael Dell In Dell’s TechKnow program, students learn to identify and resolve common computer problems.

ClassZone.com
179Demand, Supply, and Prices
ECONOMICS IN PR ACTICE
SECTION 2 AssessmentREVIEWING KEY CONC EP TS
2. Explain the four characteristics of the price system.
3. Why is the price system an efficient way to allocate resources?
4. How do prices serve as signals and incentives to producers to enter aparticular market? to leave a certain market?
5. How does the story of Dell Inc. demonstrate the effects ofcompetitive pricing?
6. Using Your Notes How doescompetitive pricing affect consumers?Refer to your completed chart.Use the Graphic Organizer atInteractive Review @ ClassZone.com
7. Making Inferences A local supermarket decides to sell apremium brand of meats and cheeses in its deli department. Thisbrand is priced about $2 more per pound than the store brand.About 80 percent of the space in the deli display cases is devotedto the premium brand and 20 percent to the store brand.
a. How did price serve as an incentive to the supermarket?
b. What kind of signals is the supermarket sending to itscustomers with this pricing strategy?
8. Applying Economic Concepts A candy company whoseproducts sold in supermarkets for about $3 a bag decided toenter the growing gourmet chocolate market. It purchased twosmall companies that made premium chocolates that sold formuch higher prices. How does this story reveal the way the pricesystem works as an incentive for producers while allocatingresources efficiently?
9. Challenge A large discount store has built its reputation onoffering consumers low prices. However, its customers come frommany different income levels. Recently, the store began offeringhigher priced jewelry and consumer electronics products. Whatsignal might this send to producers of other premium productswho have never sold in discount stores before?
Using Prices as IncentivesAs you’ve learned in Section 2, pricesmotivate producers to act in certainways. What actions do producerstake in response to rising prices?How about falling prices?
Identify Price Incentives Considereach situation that follows. Decidewhether the scenario described isassociated with rising prices or withfalling prices.
• A farmer switches to organicmethods when a report saysorganic foods are healthier.
• To maintain market share, a carwash adjusts its prices to meet acompetitor’s.
• After a hot, dry spring, alandscaper decides to get out ofthe business.
• A retailer decides to begin sellingthis holiday season’s must-have toy.
Challenge Which of the abovesituations descibes a case ofcompetitive pricing? What mighthappen to the producer if it did nottake the action described?
1. Use each of the two terms below in a sentence that illustrates themeaning of the term:
a. competitive pricing b. incentive
Producers Consumers
Competitivepricing
Incentive
C RIT IC AL THINKING

3SECT ION
180 Chapter 6
OBJECT IVES KEY TERMS TAKING NOTES
As you read Section 3, complete ahierarchy diagram like this one totrack main ideas and supportingdetails. Use the Graphic Organizer atInteractive Review @ ClassZone.com
In Section 3, you will
• explain how government usesprice ceilings to keep pricesfrom rising too high
• describe how governmentuses price floors to keep pricesfrom going too low
• discuss how government usesrationing to allocate scarceresources and goods
price ceiling, p. 180
price floor, p. 182
minimum wage, p. 182
rationing, p. 183
black market, p. 183
Imposing Price Ceilings
KEY CONCEPTS
You’ve seen how prices adjust to changes in demand and supply as the market con-stantly strives for equilibrium. Sometimes, however, people think it is a good ideato interfere with the free market mechanism in order to keep the price of a good orservice from going too high. An established maximum price that sellers may chargefor a good or service is called a price ceiling. The price ceiling is set below the equi-librium price, so a shortage will result.
EXAMPLE Football Tickets and Price Ceilings
Let’s look at an example of a price ceiling in ticket prices for college football. TheTrenton University Tigers are a winning team with many loyal fans. The universityprints 30,000 tickets for every game and sells them for $15 each. At that price, 60,000fans want to buy the tickets, so there is a shortage of 30,000 tickets for every game.
The university could resolve the short-age by letting the price rise until quan-tity demanded and quantity supplied areequal. When this solution is proposed, theuniversity president says she would ratherkeep the tickets affordable for students.Indeed many students get tickets for $15.On game day, however, ticket scalpersstand outside the stadium and sell sometickets for $50 or more.
Intervention in thePrice System
A price ceiling is thelegal maximum price thatsellers may charge for aproduct.
QUICK REFERENCE
PriceControls
main idea
details
main idea
details
main idea
details

181Demand, Supply, and Prices
EXAMPLE Rent Control as a Price Ceiling
In the past, many cities passed rent control laws in an effort to keep housing afford-able for lower-income families. These laws control when rents can be raised and byhow much, no matter what is going on in the market. Of course, the people who livein rent-controlled housing appreciate the lower price in the short term.
But rent control can have unexpected consequences. Without the possibility ofraising rents to match the market, there is no incentive to increase the supply ofrental housing, and a shortage soon develops. In addition, landlords are reluctant toincrease their costs by investing money in property maintenance, so housing condi-tions often deteriorate. By 2005, rent control was becoming far less common as mostcities realized it made housing shortages worse in the long run.
Santa Monica, California, is an example of a city that had strict rent control laws.In the late 1990s, state legislators passed a law that changed the way local communitiescould regulate rental housing. As a result, property owners in Santa Monica could letthe market determine the initial rent when a new tenant moved in, although the city’srent control board still regulated yearly rent increases thereafter. Figure 6.12 illustrateswhat happened to rents when the new law fully took effect. Rents increased by 40 to 85percent, showing that the apartments had been priced artificially low. The increasesreflect the shortage that rent control had created.
APPLICATION Applying Economic Concepts
A. Create a demand and supply graph for Trenton University football tickets showinghow the price ceiling of $15 is below the equilibrium price.
Key:
Rent controlled
Decontrolled
Med
ian
Mo
nth
ly R
ent
( in
do
llars
)
Types of Apartments
400
0
600
800
1,000
1,200
1,400
1,600
1,800
2,000
Studio
553
775
1-bedroom
630
1000
2-bedroom
772
1397
3+-bedroom
991
1890
FIGURE 6.12 RENT CONTROL IN SANTA MONICA
Source: Santa Monica Rent Control Board, April 13, 1999
ANALYZE GRAPHS1. What happened to the rent for one-bedroom apartments when the new law ended
rent control?
2. Who would be more in favor of the changes that happened in the rental market inSanta Monica, landlords or tenants? Why?
a The red bars show themedian rent for each typeof apartment when rentcontrol was in effect.
b The blue bars show themedian rent for eachtype of apartment whenthe new law allowed themarket to set the rent fornew tenants.
The graph shows that rentcontrol had kept the ratelower than what the marketwould bear.
b
a
182 Chapter 6
Setting Price Floors
KEY CONCEPTS
Sometimes the government decides to intervene in the price system to increaseincome to certain producers. A price floor is an established minimum price thatbuyers must pay for a good or service. For example, the government has used variousprograms designed to provide price floors under corn, milk, and other agriculturalproducts. The goal of these price floors is to encourage farmers to produce an abun-dant supply of food.
EXAMPLE Minimum Wage as a Price Floor
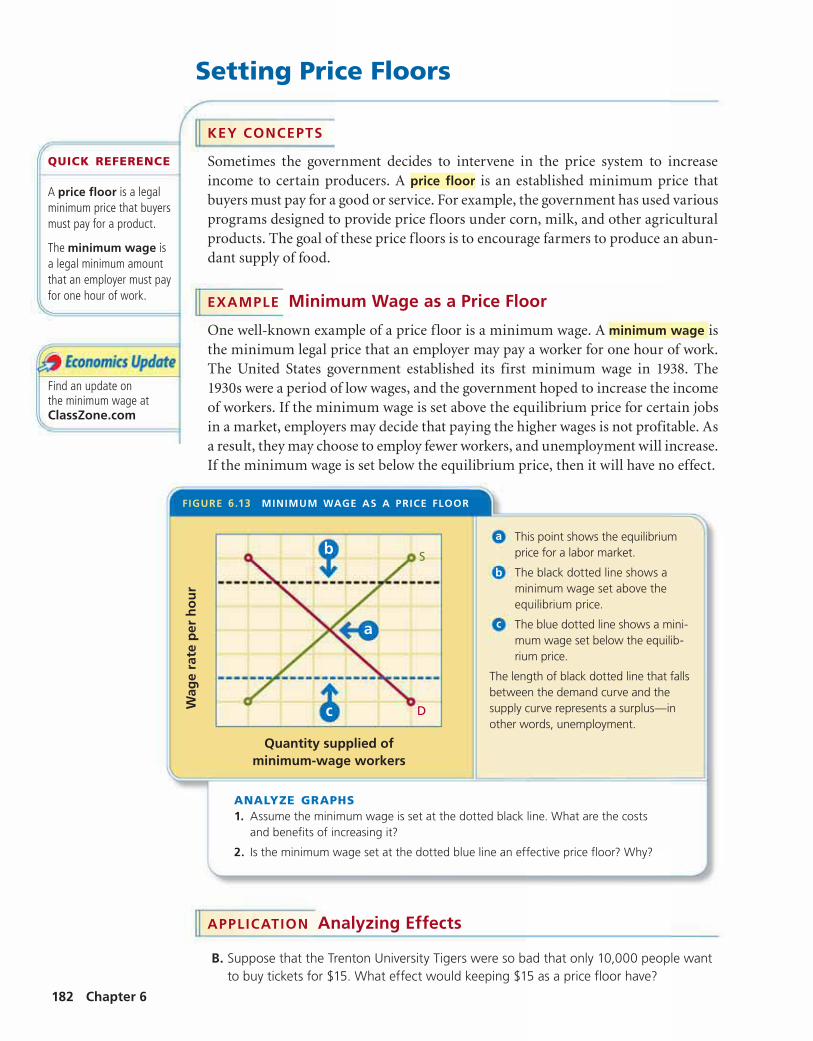
One well-known example of a price floor is a minimum wage. A minimum wage isthe minimum legal price that an employer may pay a worker for one hour of work.The United States government established its first minimum wage in 1938. The1930s were a period of low wages, and the government hoped to increase the incomeof workers. If the minimum wage is set above the equilibrium price for certain jobsin a market, employers may decide that paying the higher wages is not profitable. Asa result, they may choose to employ fewer workers, and unemployment will increase.If the minimum wage is set below the equilibrium price, then it will have no effect.
APPLICATION Analyzing Effects
B. Suppose that the Trenton University Tigers were so bad that only 10,000 people wantto buy tickets for $15. What effect would keeping $15 as a price floor have?
A price floor is a legalminimum price that buyersmust pay for a product.
The minimum wage isa legal minimum amountthat an employer must payfor one hour of work.
QUICK REFERENCE
Quantity supplied ofminimum-wage workers
Wag
e ra
te p
er h
ou
r
D
S
FIGURE 6.13 MINIMUM WAGE AS A PRICE FLOOR
a This point shows the equilibriumprice for a labor market.
b The black dotted line shows aminimum wage set above theequilibrium price.
c The blue dotted line shows a mini-mum wage set below the equilib-rium price.
The length of black dotted line that fallsbetween the demand curve and thesupply curve represents a surplus—inother words, unemployment.
ANALYZE GRAPHS1. Assume the minimum wage is set at the dotted black line. What are the costs
and benefits of increasing it?
2. Is the minimum wage set at the dotted blue line an effective price floor? Why?
Find an update onthe minimum wage atClassZone.com
b
a
c
183Demand, Supply, and Prices
Rationing Resources and Products
KEY CONCEPTS
The market uses prices to allocate goods and services. Sometimes in periods ofnational emergency, such as in wartime, the government decides to use another wayto distribute scarce products or resources. Rationing is a system in which the govern-ment allocates goods and services using factors other than price.
The goods might be rationed on a first-come, first-served basis or on the basisof a lottery. Generally, a system is set up that uses coupons allowing each person acertain amount of a particular item. Or the government may decree that certainresources be used to produce certain goods. When such a system is used, some peo-ple try to skirt the rules to get the goods and services they want, creating what isknown as a black market. In a black market, goods and services are illegally boughtand sold in violation of price controls or rationing.
EXAMPLE Rationing Resources
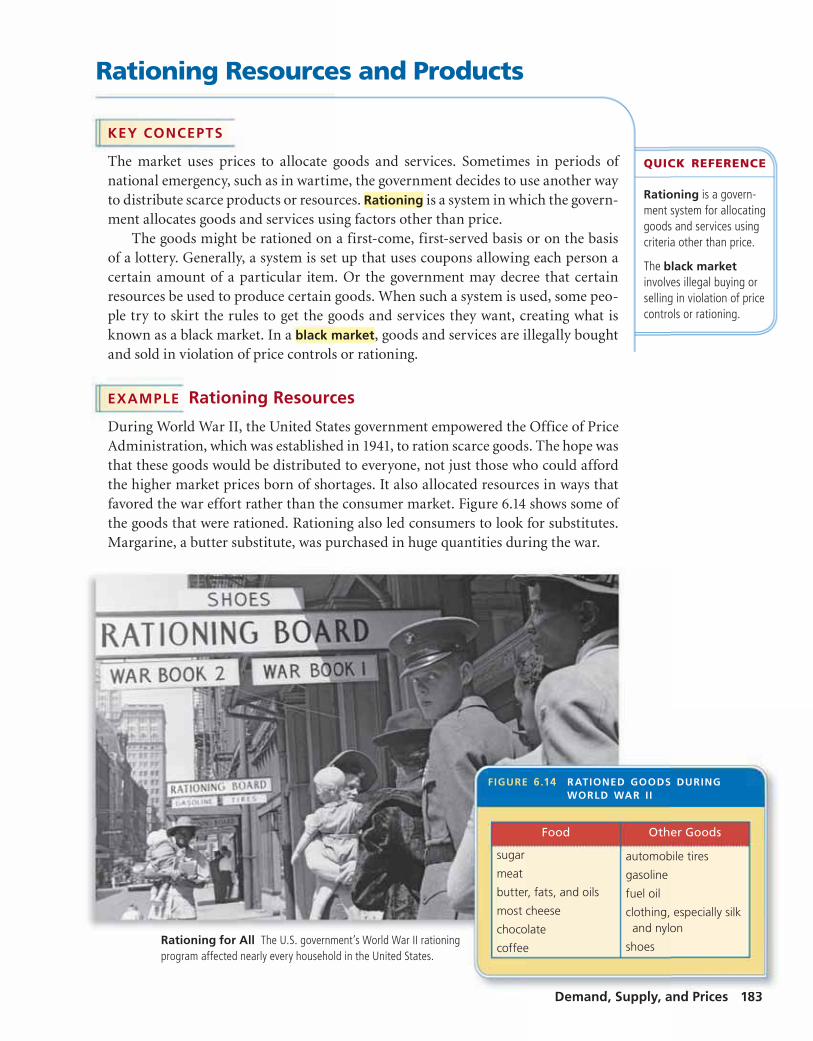
During World War II, the United States government empowered the Office of PriceAdministration, which was established in 1941, to ration scarce goods. The hope wasthat these goods would be distributed to everyone, not just those who could affordthe higher market prices born of shortages. It also allocated resources in ways thatfavored the war effort rather than the consumer market. Figure 6.14 shows some ofthe goods that were rationed. Rationing also led consumers to look for substitutes.Margarine, a butter substitute, was purchased in huge quantities during the war.
Rationing is a govern-ment system for allocatinggoods and services usingcriteria other than price.
The black marketinvolves illegal buying orselling in violation of pricecontrols or rationing.
QUICK REFERENCE
Rationing for All The U.S. government’s World War II rationingprogram affected nearly every household in the United States.
FIGURE 6.14 RATIONED GOODS DURINGWORLD WAR II
Food Other Goods
sugar
meat
butter, fats, and oils
most cheese
chocolate
coffee
automobile tires
gasoline
fuel oil
clothing, especially silk and nylon
shoes

184 Chapter 6
North Korea maintained a strict rationing system between 1946 and 2002.Most importantly, staple foods—meat, rice, and cabbage—were strictly rationed.However, the system was plagued by inefficiency and corruption. The amount ofyour ration was generally determined by who you knew, where you lived, and whatyour occupation was. Government officials in the largest cities often received morethan their allotment, while the majority of people got by with less (or received less-nutritious substitutes). Some families had meat or fish only a few times a year.
Between 1996 and 2000, widespread famine in North Korea made the situationdesperate. Ration coupons were still distributed, but in most cases, the rations werenot. As many as a million people died due to the famine. In response, people estab-lished unofficial markets where they traded handicrafts for food. In 2002, the gov-ernment officially legalized these market activities, and prices rose sharply. Wagesalso increased. Skeptical of markets, however, the leaders of North Korea were, in2005, considering a return to the rationing system that failed them in the past.
EXAMPLE Black Markets—An Unplanned Result of Rationing
When rationing is imposed, black markets often come into existence. During WorldWar II, black markets in meat, sugar, and gasoline developed in the United States.Some people found ways, including the use of stolen or counterfeit ration coupons,to secure more of these scarce goods.
During the height of North Korea’s rationing system, free trade in grain wasexpressly forbidden, and most other markets were severely restricted. Prices werevery high at the markets that did exist. In 1985, it cost half of the average monthlysalary of a typical North Korean to buy a chicken on the black market. Even after thegovernment began allowing some market activities in 2002, the black market flour-ished because many forms of private property, including homes and cars, were stillillegal. Some people started smuggling clothes, televisions, and other goods fromChina to sell in North Korea. (You’ll read more about the black market in the dis-cussion of the underground economy in Chapter 12.)
APPLICATION Making Inferences
C. How does the example of rationing during World War II show that the price system isa more efficient way to allocate resources?
Rationing in ChinaShortages of tofu, a stapleof the Chinese diet, led torationing in 1989.

ClassZone.com
185Demand, Supply, and Prices
ECONOMICS IN PRACTICE
SECTION 3 AssessmentREVIEWING KEY CONC EP TS
1. Explain the relationship between the terms in each of these pairs.
a. price floorminimum wage
b. rationingblack market
2. What is the difference between a price floor and a price ceiling?
3. What kind of surplus might be created by the minimum wage?
4. How does the existence of the black market work against the intended purpose of rationing?
5. Aside from turning to the black market, how do consumers make up for goods that are rationed?
6. Using Your Notes What is the usual result of a price ceiling? Refer to your completed diagram. Use the Graphic Organizer atInteractive Review @ ClassZone.com
7. Analyzing Causes Opponents of rent control cite comparisons of cities that regulate rents with cities that do not. Their evidence shows that there is more moderately priced housing available in cities that let the market set the rates for rent. What would account for the differences in availability?
8. Making Inferences The percentage of workers who were paid the minimum wage or less decreased from 6.5 percent in 1988 to 3 percent in 2002 to 2.7 percent in 2004. What does this trend tell you about the relationship of the minimum wage to the equilibrium wage for those kinds of work?
9. Applying Economic Concepts In the wake of sharply rising gasoline prices in the summer of 2005, several states considered putting a ceiling on the wholesale price of gasoline. What would be the likely result of such a price control? Would it be an effective strategy for lowering gas prices?
10. Challenge Many states have laws against so-called price gouging. These laws make it illegal to sell goods and services at levels significantly above established market prices following a natural disaster. What economic argument might be used against such laws?
Understanding Price FloorsIn agriculture, price floors are known as price supports. The government sets a target price for each crop, and if the market price is below that target, it will pay farmers the difference. Suppose that you are a farmer with 400 acres planted in corn. The following graph shows the supply and demand for your crop.
Calculate the Effect of the Price Support How many bushels of corn will you sell at the equilibrium price? How much revenue will you make? How many bushels do you want to sell at the target price? How many bushels are consumers willing to buy at that price? What is the difference? How much will the government have to pay you for that surplus?
Challenge What changes in supply or demand would move the market equilibrium price closer to the target price?
PriceControls
main idea
details
main idea
details
main idea
details
C RIT IC AL THINKING
Pric
e p
er b
ush
el (
in d
olla
rs)
0
0.75
1.50
2.25
3.00
3.75
4.50
10 30 20 50 40 60 Bushels of corn (in thousands)
Target price S
D

Find an update on this CaseStudy at ClassZone.com
186 Chapter 6
Case Study
Prices for Concert TicketsBackground Americans spend billions of dollars on concert tickets yearly—anestimated $3 billion in 2005. With ticket prices for the most popular acts averagingmore than $50, most younger or less affluent fans can no longer afford to attendmany live concerts. And yet, remarkably, forecasters believe that concert ticketprices have yet to peak.
Ticket prices reflect a number of costs. Performers must cover expenses such astravel, costumes, instruments, and equipment before they reap a profit. Venues, orplaces where concerts are held, also seek to make a profit, as do ticket distributors.However, in the United States, the sale of concert tickets, along with most othergoods and services, is driven by three basic elements of a market economy—demand, supply, and pricing.
What’s the issue? How do demand, supply, and pricing affect the concert ticketmarket? Study these sources to discover the factors that affect demand and supply,and their impact on the price of concert tickets.
Pearl Jam Tries to PlaceCeiling on Ticket PricesTo keep ticket prices affordable, Pearl Jamappeals to Congress.
Many of Pearl Jam’s most loyal fans are teenagerswho do not have the money to pay the $50 or morethat is often charged today for tickets to a popularconcert. Although, given our popularity, we couldundoubtedly continue to sell out our concerts withticket prices at that premium level, we have made aconscious decision that we do not want to put theprice of our concerts out of the reach of many of ourfans. . . .
For these reasons, we have attempted to keep theticket prices to our concerts to a maximum of $18. . . .Even where a service charge is imposed, our goal is. . . that no one will pay more than $20 to see a PearlJam concert.
Our efforts to try to keep prices . . . to this low level and to limit the possibility ofexcessive service charge mark-ups have put us at odds with TicketMaster . . . a nationwidecomputerized ticket distribution service that has a virtual monopoly on the distribution oftickets to concerts in this country.
Thinking Economically How would placing a ceiling on the price of Pearl Jam concerttickets have affected demand and supply? Explain your answer based on the informationin the document.
A. CongressionalTranscript
Pearl Jam believedthat TicketMasterCorporation, theirticket distribu-tor, was settingtoo high a priceon the band’s con-cert tickets. Thisstatement, submit-ted to Congressalong with oraltestimony on June30, 1994, explainsPearl Jam’s stance.

Thinking Economically In what three years was the high priceper ticket about the same as the low price in 2003?
FIGURE 6.15 CONCERT TICKET PRICES
1981
1982
1983
1984
1985
1986
1987
1988
1989
1990
1991
1992
1993
1994
1995
1996
1997
1998
1999
2000
2001
2002
2003
10
20
30
40
50
60
70
Source: Journal of Labor Economics, 2005.
High
Average
Low
Change in prices foreconomyin general
Pric
e p
er t
icke
t (i
n d
olla
rs)
Year
187Demand, Supply, and Prices
THINKING ECONOMICALLY Synthesizing
1. Do you think TicketMaster’s plan in document C would help or harm Pearl Jam’s wish “that noone will pay more than $20” to see them (document A)? Explain your answer.
2. What do you think happened to quantity supplied of tickets over the span of the graph indocument B? Why?
3. In what year in Figure 6.15 did the high price for concert tickets hit $50—the high price thatPearl Jam speaks of in document A? What year was it $20—the desired price they mention?
B. AcademicStudy
Marie Connollyand Alan Krueger,of PrincetonUniversity,compiled thesedata on concertticket pricesfor their study“Rockonomics:The Economics ofPopular Music.”
TicketMaster Plans to Launch Ticket AuctionThe sky’s the limit, as bidders compete for the best seats in the house.
Fed up with watching ticket scalpers and brokers rake in the huge bucks for prime seatsat their venues, TicketMaster plans to debut an online auction program for choice seats toselected concerts and sports events later this year.
The move may drive up the price of front row seats when they start going to the highestbidder, but some analysts say the impact would likely be minimal. . . .
Princeton University economics professor Alan B. Krueger . . . called the open auction a“positive development.”
“For the top artists, tickets are still sold below what the market would bear, even thoughprices have shot up over the last six years,” Krueger told POLLSTAR. “This is especially thecase for the best seats in the most expensive cities.
“If the auction is widely used, I suspect price variability will increase; we will see greaterdispersion in prices across artists, across cities and seats for the same artist.” . . .
Source: Pollstar.com
TicketMasterhoped to increaseprofits by auc-tioning ticketsonline. This ar-ticle discusses theprogram’s poten-tial effect on ticketprices.
Thinking Economically How might TicketMaster’s online auction program lead tomarket equilibrium for the best tickets?
C. OnlineNewspaperArticle

APPLYING ECONOMIC CONC EP TS
FIGURE 6.16 VCR SALES TO DEALERS
Complete the following activity either on yourown paper or online at ClassZone.com
188 Chapter 6
Choose the key concept that best completesthe sentence. Not all key concepts will be used.
CHAPTER 6 AssessmentREVIEWING KEY CONC EP TS
Review this chapter using interactiveactivities at ClassZone.com
• Online Summary• Quizzes• Vocabulary Flip Cards
• Graphic Organizers• Review and Study Notes
black marketcompetitive pricingdisequilibriumequilibrium priceincentivemarket equilibrium
minimum wageprice ceilingprice floorrationingshortagesurplus
1 is a situation that occurs when quantitydemanded and quantity supplied at a particularprice are equal. The price at which that situationoccurs is the 2 . If quantity supplied is greaterthan quantity demanded, a 3 occurs. If quan-tity demanded exceeds quantity supplied, thena 4 occurs.
When a producer enters a market at a lowerprice (hoping to increase its customer base whilemaintaining profits by selling more units), it isengaging in 5 . Rising prices are 6 that drawsproducers into markets.
Sometimes government intervenes in theprice system. A 7 is the legal maximum thatproducers may charge for certain goods orservices. A 8 is the legal minimum amount thatmay be paid for a particular good or service.
When certain goods or resources are scarce,the government may institute a system of 9 ,using some criteria besides price to allocateresources. An unplanned consequence of thisaction by the government is the development of a 10 , where goods are bought and sold illegally.
Seeking Equilibrium: Demand and Supply(pp. 164–173)
1. How does the concept of market equilibrium reflectthe interaction of producers and consumers in amarket?
2. Why are surpluses and shortages examples ofdisequilibrium?
Prices as Signals and Incentives (pp. 174–179)
3. How are producers and consumers equally involvedin the price system?
4. When do prices serve as signals and incentives forproducers to enter a market?
Intervention in the Price System (pp. 180–187)
5. What is the usual result of a price floor?
6. What motivates producers and consumers in theblack market?
Look at the table below showing prices and salesfigures for VCRs between 1998 and 2003.
7. Why did dollar sales increase between 1998 and1999?
8. What is the trend in the average unit price of VCRsbetween 1998 and 2003? What does this trendsignal?
Source: Consumer Electronics Association Market Research,January, 2003
Unit Sales (inthousands)
Sales (inmillions $)
AverageUnit Price ($)
1998 18,113 2,049 113
1999 22,809 2,333 102
2000 23,072 1,869 81
2001 14,910 1,058 71
2002 13,538 826 61
2003* 11,916 727 61
* projected
SIX- PERSON JEANS MARKET
Demand, Supply, and Prices 189
S I M U L AT I O NC RIT IC AL THINKING
9. Creating Graphs Suppose that you are the ownerof a toy store. Create demand and supply curvesfor three products that you expect will sell wellduring the upcoming holiday shopping season.Then consider the following scenarios: one productbecomes much more popular than you expected,one is much less popular than you expected, andthe third loses half of its production capacity whena factory is leveled by an earthquake. Draw anadditional curve on each of your graphs to showthe change in demand or supply represented bythese scenarios. Under each graph write a captionexplaining the change shown and the effect on theequilibrium price.
Use @ ClassZone.comto complete this activity.
10. Analyzing Effects Consumer concerns aboutnutrition and obesity contribute to a decreasein white bread sales and an increase in sales ofwhole wheat bread. This change in consumer tasteprompts a major manufacturer known for its whitebread to enter the market with a whole wheat breadproduct. What effect will this action have on thesupply and equilibrium price of whole wheat bread?
11. Using Economic Concepts In 2004, the priceof U.S. butter imports increased by more than 30percent compared to the previous year. In 2003,Canada and New Zealand together supplied morethan 80 percent of the butter imported into theUnited States. In 2004, their combined market sharedecreased to about 67 percent. What happenedin the market to cause this change? How did priceserve as a signal and incentive to producers?
12. Analyzing Effects How would U.S. governmentprice supports for U.S.-made tennis rackets affectproducers and consumers?
13. Challenge How would elasticity of demand helpproducers decide whether competitive pricing is agood strategy for their businesses?
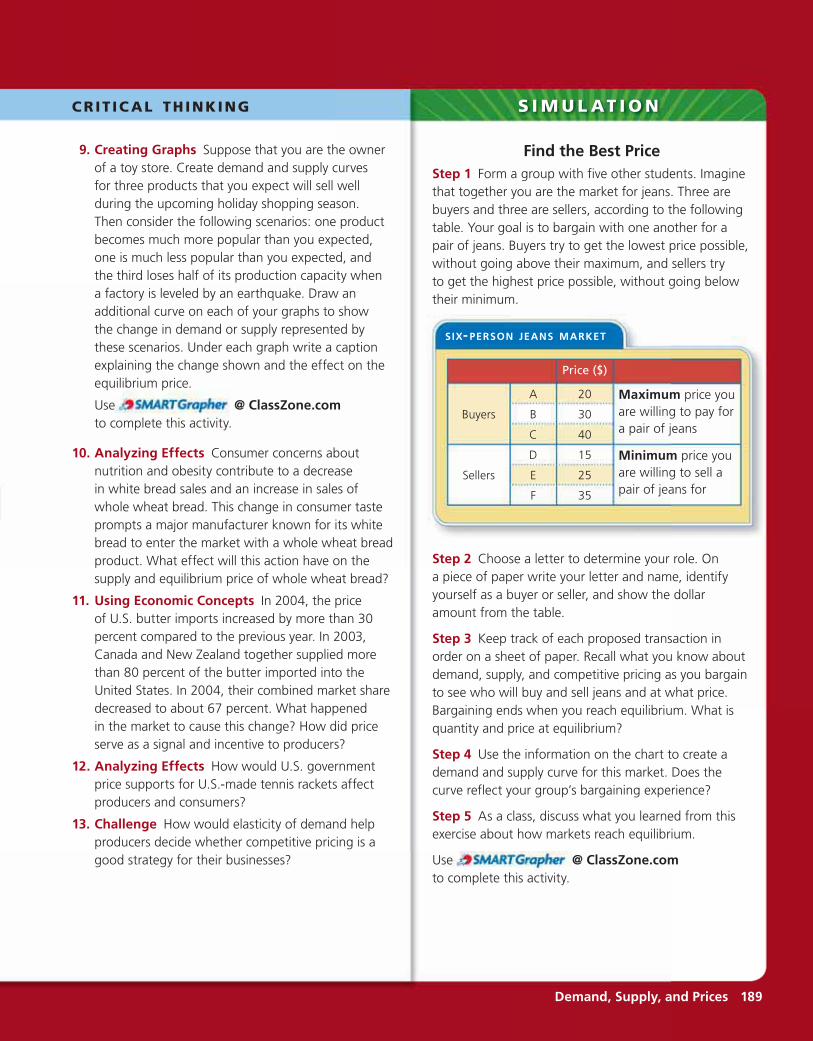
Find the Best PriceStep 1 Form a group with five other students. Imaginethat together you are the market for jeans. Three arebuyers and three are sellers, according to the followingtable. Your goal is to bargain with one another for apair of jeans. Buyers try to get the lowest price possible,without going above their maximum, and sellers tryto get the highest price possible, without going belowtheir minimum.
Step 2 Choose a letter to determine your role. Ona piece of paper write your letter and name, identifyyourself as a buyer or seller, and show the dollaramount from the table.
Step 3 Keep track of each proposed transaction inorder on a sheet of paper. Recall what you know aboutdemand, supply, and competitive pricing as you bargainto see who will buy and sell jeans and at what price.Bargaining ends when you reach equilibrium. What isquantity and price at equilibrium?
Step 4 Use the information on the chart to create ademand and supply curve for this market. Does thecurve reflect your group’s bargaining experience?
Step 5 As a class, discuss what you learned from thisexercise about how markets reach equilibrium.
Use @ ClassZone.comto complete this activity.
Price ($)
Buyers
A 20 Maximum price youare willing to pay fora pair of jeans
B 30
C 40
Sellers
D 15 Minimum price youare willing to sell apair of jeans for
E 25
F 35
Related Documents