Glenfield to Macarthur Corridor Integrated Transport Strategy 3 August 2015 Cardno 97 6 Data review Various data sources from the Australian Bureau of Statistics (ABS) Census Data and the Bureau of Transport Statistics (BTS) have been assessed to establish the transport network demand indicators and relationships to then assess the future function of the transport network. The data types assessed include: > Population; > Employment; > Dwellings and structure type; > Household income; > Vehicle ownership; > Journey to Work (JTW); > Household travel survey; > Rail demand; and > Bus demand. 6.1 Population and employment This section provides a summary of existing and projected population, workforce and jobs for each of the Precincts and for the study area. These have a direct relationship with trip generation. Residential population for the corridor is summarised in Table 6-1. The Ingleburn precinct has the highest residential population, followed by Campbelltown and Glenfield. Minto accounts for only 4% of the precinct corridor’s population. Table 6-1 Estimated population (ERP) Precinct 2011 % Glenfield 7,814 15% Macquarie Fields 6,891 13% Ingleburn 14,442 27% Minto 2,129 4% Leumeah 7,882 15% Campbelltown 9,607 18% Macarthur 4,790 9% Study Area Total 53,555 100% Note: ERP – estimated resident population Source: BTS 2014 series small-area population projections Table 6-2 summarises estimates of the residential workforce (workforce participants who live in the corridor) irrespective of where they work, in each of the precincts and within the overall corridor. The Ingleburn precinct has the most number of workforce participants, followed by Campbelltown, Glenfield and Leumeah. Minto has only 929 people participating in the workforce. Minto also has the smallest proportion the total population participating in the workforce at 44% and Glenfield has the highest at 54%.

Welcome message from author
This document is posted to help you gain knowledge. Please leave a comment to let me know what you think about it! Share it to your friends and learn new things together.
Transcript

Glenfield to Macarthur Corridor Integrated Transport Strategy
3 August 2015 Cardno 97
6 Data review
Various data sources from the Australian Bureau of Statistics (ABS) Census Data and the Bureau of Transport Statistics (BTS) have been assessed to establish the transport network demand indicators and relationships to then assess the future function of the transport network. The data types assessed include:
> Population;
> Employment;
> Dwellings and structure type;
> Household income;
> Vehicle ownership;
> Journey to Work (JTW);
> Household travel survey;
> Rail demand; and
> Bus demand.
6.1 Population and employment This section provides a summary of existing and projected population, workforce and jobs for each of the Precincts and for the study area. These have a direct relationship with trip generation.
Residential population for the corridor is summarised in Table 6-1. The Ingleburn precinct has the highest residential population, followed by Campbelltown and Glenfield. Minto accounts for only 4% of the precinct corridor’s population.
Table 6-1 Estimated population (ERP) Precinct 2011 %
Glenfield 7,814 15%
Macquarie Fields 6,891 13%
Ingleburn 14,442 27%
Minto 2,129 4%
Leumeah 7,882 15%
Campbelltown 9,607 18%
Macarthur 4,790 9%
Study Area Total 53,555 100% Note: ERP – estimated resident population Source: BTS 2014 series small-area population projections
Table 6-2 summarises estimates of the residential workforce (workforce participants who live in the corridor) irrespective of where they work, in each of the precincts and within the overall corridor. The Ingleburn precinct has the most number of workforce participants, followed by Campbelltown, Glenfield and Leumeah. Minto has only 929 people participating in the workforce. Minto also has the smallest proportion the total population participating in the workforce at 44% and Glenfield has the highest at 54%.

Glenfield to Macarthur Corridor Integrated Transport Strategy
3 August 2015 Cardno 98
Table 6-2 Estimated resident workforce Precinct 2011 Percentage of study
area Proportion of total resident population
Glenfield 4,195 16% 54%
Macquarie Fields 3,241 12% 47%
Ingleburn 7,315 27% 51%
Minto 929 3% 44%
Leumeah 4,153 15% 53%
Campbelltown 4,615 17% 48%
Macarthur 2,488 9% 52%
Total 26,936 100% Source: BTS 2014 series small-area workforce projections
Employment within the study area is summarised in Table 6-3. Across the precincts Ingleburn and Campbelltown provides the most employment opportunities, accounting for 27% and 26% of all jobs through the corridor. When Campbelltown and Macarthur employment is combined they account for 44% of all jobs.
Table 6-3 Estimated existing employment Precinct 2011 %
Glenfield 1,495 4%
Macquarie Fields 1,557 4%
Ingleburn 10,781 27%
Minto 3,536 9%
Leumeah 5,196 13%
Campbelltown 10,414 26%
Macarthur 7,010 18%
Study Area 39,989 100% Source: BTS 2014 series small-area employment projections
6.2 Dwellings and structure type Different dwelling structures tend to be associated with varying levels of vehicle ownership and trip generation. RMS trip generation data indicates that lower density residential developments tend to have higher vehicle trip generation rates than higher density residential developments. This also translates into lower rates of active and public transport usage for lower density residential. This relationship is also likely born located in proximity to other land uses and transport access. Transit stops and stations have finite catchments and many low density residential developments are located away from good public transport services.
The Australian Bureau of Statistics (ABS) Census records this information and categorises dwelling structure variables. For this analysis the ten Census structure types were coded to four:
> Separate dwelling - these are generally lower density;
> Semi – includes townhouses and row or terrace houses, these are generally medium density;
> Flats, units and apartments (FUA) – includes flats, units and apartments of various heights, these are generally medium to higher density; and
> Other – includes caravan cabin and houseboat, as well as improvised – tents and sleepers out.
Table 6-4 provides a summary of aggregate dwelling structure distribution in each of the precincts. The precincts are defined in terms of ABS’s statistical area 1 (SA1) geography.

Glenfield to Macarthur Corridor Integrated Transport Strategy
3 August 2015 Cardno 99
Table 6-4 Aggregate dwelling structure distribution by precinct (count) 2011 Precinct Separate Semi FUA Other NA NS Total
Glenfield 1,747 928 132 0 7 0 2,814
Macquarie Fields 1,357 885 0 0 0 0 2,242
Minto 398 158 82 0 0 0 638
Ingleburn 2,205 1,210 56 0 0 0 3,471
Leumeah 1,728 467 247 0 5 0 2,447
Campbelltown 1,864 426 408 5 5 0 2,708
Macarthur 141 287 356 0 14 0 798
Combined 9,440 4,361 1,281 5 31 0 15,118
Note: NA – not applicable; NS – not stated. Source: ABS Census of Population and Housing 2011, extracted using Tablebuilder
The above analysis indicates that the precincts vary considerably in the number of dwellings within their boundary. A summary of the distribution of dwelling types is provided in Table 6-5.
Table 6-5 Aggregate dwelling structure distribution by precinct (%) 2011 Precinct Separate Semi FUA Other
Glenfield 62% 33% 5% 0%
Macquarie Fields 61% 39% 0% 0%
Minto 62% 25% 13% 0%
Ingleburn 64% 35% 2% 0%
Leumeah 71% 19% 10% 0%
Campbelltown 69% 16% 15% 0%
Macarthur 18% 37% 45% 0%
Combined 63% 29% 8% 0%
Sydney Outer SW SA4 84% 12% 4% 0%
GMA 63% 12% 24% 0% Source: ABS Census of Population and Housing 2011, extracted using Tablebuilder, analysis by TMA
Apart from Macarthur, the precincts generally have low proportions of concentrated FUAs, with separate housing making up just under two-thirds of the dwelling stock. The combined precinct’s dwelling distribution is quite different when compared with the Sydney Outer South West area which has a substantially higher proportion of separate dwellings. The Sydney Outer South West area is dominated by new greenfield development. The Glenfield to Macarthur corridor has a more balanced mix of dwelling types. When compared with the GMA’s distribution, the combined precinct’s distribution has the same proportion of separated dwellings, but a higher proportion of semi dwellings and a lower proportion of FUAs. Higher density dwellings support public and active transport modes more than lower density dwellings.
6.3 Household income Household income is a key indicator for transport usage. On average transport costs account for over 15% of total income spend for households. As income rises or falls the transport portion of total income reduces or increases. Also, transport choices are made economically by people; people on lower incomes tend to be more reliant on public transport. Further, reduced expenditure on transport allows that saved amount to contribute to the economy in other ways. For lower income household, sensitivities to changes in the price of goods and services impacts the amount of any disposable income or financial stress, where lifestyle adjustments are required.
By providing a large variety of land uses together with high quality and accessible public transport, walking and bicycle networks allows people access to reduce the cost spent on transport. As a result it is important

Glenfield to Macarthur Corridor Integrated Transport Strategy
3 August 2015 Cardno 100
to understand context within the study area to ensure social equity and resilience in the transport network for financial stress.
The data is presented between families and overall averages. It should be noted that single parent households, in addition to single people are not included as families, hence this partially explains why the median weekly household income is notably less than family household incomes.
Each precinct has been assessed with ABS Census 2011 data as shown in Table 6-6.
Table 6-6 Household income comparison Median weekly
household income Families without children Families with children
Glenfield $1,394 $2,106 $2,253
Macquarie Fields $989 $1,845 $1,935
Ingleburn $1,210 $1,927 $2,214
Minto $1,152 $1,866 $1,968
Leumeah $1,144 $1,926 $2,188
Campbelltown – Macarthur $993 $1,904 $2,098
Unweighted Study area average
$1,133 $1,918 $2,100
Greater Sydney $1,490 $2,333 $2,586 Source: http://www.abs.gov.au/websitedbs/censushome.nsf/home/quickstats, viewed 25/05/2015
The median household income review indicates that overall people residing in the study area have lower incomes than the Sydney average. Overall, residents in Glenfield have higher incomes, while residents in Macquarie Fields have lower incomes. The study area median household weekly income is 31.5% less than the Greater Sydney average.
Factors contributing to lower median incomes in additional to people with lower paid employment include retirees and potentially student households in the Campbelltown/ Macarthur close to the major education precinct. Household income could be linked with vehicle ownership and lower income households may be more dependent on public transport.
6.4 Vehicle ownership Vehicle ownership is a key indicator for mode share. The portion of ownership or non-ownership indicates the feasibility of relying on other transport modes. Vehicle ownership is also linked with household income. Table 6-7 provides a summary of the vehicle ownership distribution and average vehicles per dwelling in each of the precincts. It also provides similar information for Sydney Outer South West SA4 and for the GMA.

Glenfield to Macarthur Corridor Integrated Transport Strategy
3 August 2015 Cardno 101
Table 6-7 Vehicle ownership distribution and average vehicles, all dwelling structures 2011 Precinct 0
veh 1
veh 2
veh 3
veh 4
veh+ Dwellings Total vehicles Average veh/
dwelling
Glenfield 9% 44% 33% 9% 4% 2,490 3,885 1.56
Macquarie Fields 12% 48% 29% 9% 3% 2,021 2,889 1.43
Minto 15% 48% 27% 7% 3% 545 732 1.34
Ingleburn 13% 47% 28% 8% 4% 3,104 4,403 1.42
Leumeah 10% 47% 32% 8% 3% 2,169 3,187 1.47
Campbelltown 16% 38% 31% 11% 4% 2,371 3,480 1.47
Macarthur 15% 56% 23% 4% 1% 693 843 1.22
Combined 12% 46% 30% 9% 3% 13,393 19,419 1.45
Sydney Outer SW SA4
7% 33% 39% 13% 7% 73,940 132,855 1.80
GMA Total 12% 39% 34% 10% 5% 1.9m 2.9m 1.56 Source: ABS Census of Population and Housing 2011, extracted using Tablebuilder, analysis by TMA
The average vehicles per dwelling varies across the precincts, with the two lowest, Macarthur and Minto, also having the highest proportion of FUAs (refer to Table 6-5). This association of lower rates of vehicle ownership with higher proportions of FUAs is a consistent attribute within the greater Sydney area. Of note is that 12% of dwellings in the combined precincts have zero vehicle ownership. Overall, the combined precincts have the same proportion of zero vehicle ownership as the GMA but higher than the Sydney Outer South West area at 7%. The Sydney Outer South West area has considerably higher vehicle ownership than the combined precincts. This corresponds with the high proportion of separate dwellings throughout the area.
Table 6-8 provides a similar analysis, but for separate dwellings only.
Table 6-8 Vehicle ownership distribution and average vehicles, separate dwelling structure 2011 Precinct 0
veh 1
veh 2
veh 3
veh 4
veh+ Dwellings Total vehicles Average veh/
dwelling
Glenfield 6% 34% 39% 13% 7% 1,605 2,885 1.80
Macquarie Fields 8% 41% 34% 12% 5% 1,229 2,017 1.64
Minto 11% 44% 30% 11% 4% 355 548 1.54
Ingleburn 9% 41% 33% 12% 5% 2,009 3,294 1.64
Leumeah 7% 41% 38% 10% 4% 1,570 2,577 1.64
Campbelltown 8% 35% 38% 14% 5% 1,671 2,865 1.71
Macarthur 11% 51% 33% 2% 2% 127 170 1.34
Combined 8% 39% 36% 12% 5% 8,566 14,356 1.68
Sydney Outer SW SA4
5% 30% 42% 15% 8% 63,066 120,744 1.91
GMA 6% 32% 42% 14% 6% ~1,200,000 ~2,200,000 1.82 Source: ABS Census of Population and Housing 2011, extracted using Tablebuilder, analysis by TMA
This analysis indicates that average vehicle ownership in each of the precincts for separate dwellings is higher than the average for all dwelling types (see Table 6-7). The combined precincts average vehicle ownership for separated dwellings is markedly lower than Sydney Outer South West SA4; and is lower than the GMA. The precincts have a higher percentage of single vehicle dwellings than the entire south west statistical area and GMA.
An analysis for vehicle ownership in semi dwellings is presented below in Table 6-9.

Glenfield to Macarthur Corridor Integrated Transport Strategy
3 August 2015 Cardno 102
Table 6-9 Vehicle ownership distribution and average vehicles, semi dwelling structure Precinct 0
veh 1
veh 2
veh 3
veh 4
veh+ Dwellings Total vehicles Average veh/
dwelling
Glenfield 13% 62% 23% 2% 0% 784 896 1.14
Macquarie Fields 17% 60% 19% 4% 0% 792 872 1.10
Minto 23% 53% 24% 0% 0% 132 134 1.02
Ingleburn 21% 58% 19% 1% 1% 1,050 1,068 1.02
Leumeah 21% 59% 17% 3% 1% 412 425 1.03
Campbelltown 29% 48% 19% 4% 0% 360 356 0.99
Macarthur 6% 47% 36% 9% 3% 264 410 1.55
Combined 18% 58% 21% 3% 0% 3, 794 4,161 1.10
Sydney Outer SW SA4
19% 54% 22% 4% 1% 8,382 9,569 1.14
GMA 15% 49% 29% 5% 2% 220,368 282,847 1.28 Source: ABS Census of Population and Housing 2011, extracted using Tablebuilder, analysis by TMA
Semis have lower average vehicle ownership than the all dwellings average in the Glenfield to Macarthur corridor, an average of 1.1 vehicles per dwelling compared with 1.45 vehicles per dwelling. They also have a higher proportion of zero vehicle dwellings than the all dwelling estimate.
Vehicle ownership distributions for FUAs are shown below in Table 6-10.
Table 6-10 Vehicle ownership distribution and average vehicles, FUA dwelling structure Precinct 0
veh 1
veh 2
veh 3
veh 4
veh+ Dwellings Total vehicles Average
veh/dwelling
Glenfield 20% 57% 23% 0% 0% 101 104 1.03
Macquarie Fields na na na na na na na na
Minto 28% 59% 14% 0% 0% 58 50 0.86
Ingleburn 18% 73% 9% 0% 0% 45 41 0.91
Leumeah 16% 70% 14% 0% 0% 187 185 0.99
Campbelltown 42% 46% 9% 1% 2% 340 259 0.76
Macarthur 24% 67% 8% 1% 0% 302 263 0.87
Combined 28% 59% 11% 1% 1% 1,033 902 0.87
Sydney Outer SW SA4
27% 53% 15% 4% 2% 2,289 2,308 1.01
GMA 26% 53% 18% 2% 1% 418,797 410,937 0.98
Note: na – not applicable. Source: ABS Census of Population and Housing 2011, extracted using Tablebuilder, analysis by TMA
FUAs have a lower average vehicle ownership than the all-dwelling type average, which is expected given the housing typology. Just under a third of FUAs are zero vehicle dwellings. FUAs in Sydney Outer South West have similar levels and distribution of vehicle ownership as the GMA.
Overall, the dwelling structure and vehicle ownership for the area indicate a direct relationship between higher density housing and vehicle ownership. In this regard, it is desirable to encourage higher density housing in locations close to town centres and transport hubs to encourage more walking, cycling and public transport use.

Glenfield to Macarthur Corridor Integrated Transport Strategy
3 August 2015 Cardno 103
6.5 Journey to work
6.5.1 Outline of approach
Journey to work (JTW) information is collected as part of ABS’s Census of Population and Housing. This dataset provides detailed information about inferred travel between home and work, including the modes of travel used as part of the journey. This section provides JTW information for several different geographies, based on BTS’s travel zones (TZ 2011) and includes:
> Seven individual precincts which are the subject of this study.
> Several comparison areas using aggregations of travel zones:
Campbelltown SA3 – which is a slightly larger than the study area Sydney Outer South West SA4 - which covers Campbelltown SA3, Wollondilly SA3 and Camden
SA3 GMA – the Greater Metropolitan Area.
The precincts and overall study area are defined in terms of BTS travel zones. It is noted that the precincts do not directly concord with travel zones.
The summary information presented in the following sections includes:
> JTW trip numbers by mode from (origins) the precincts and study area.
> JTW mode shares from (origins) the precincts, study area and comparison areas.
> JTW trip numbers by mode to (destinations) the precincts and study area.
> JTW mode shares to (destinations) the precincts, study area and comparison areas.
> Destinations of workers resident within the precincts and the study area.
> Origin of workers employed within the precincts and the study area.
> Live and work analysis examining the corridor’s degree of self-containment.
6.5.2 JTW trips from the corridor
Transport modes used by trips to and from the corridor were assessed with modifications to permit separate identification of bicycle trips. Mode shares for these commuter trips are summarised in Table 6-11. The study area’s rail mode share is above that of Sydney Outer South West (SA4) and above the Sydney-wide average. Vehicle use is similar in the study area to the overall GMA average. Bus use is well below the GMA average (1% versus 6%). Minto has the highest rail mode share of 34% which is well above both the Sydney Outer SW (13%) and GMA (14%) averages.

Glenfield to Macarthur Corridor Integrated Transport Strategy
3 August 2015 Cardno 104
Table 6-11 Journey to Work origin mode shares with comparison areas Mode split Train Bus Ferry/
Tram Vehicle driver
Vehicle pass
Bicycle Walked only
Other mode
Total
Glenfield 32% 1% 0% 60% 5% 0% 2% 0% 100%
Macquarie Fields 26% 1% 0% 64% 6% 0% 1% 1% 100%
Ingleburn 26% 1% 0% 65% 5% 0% 2% 1% 100%
Minto 34% 0% 0% 55% 5% 0% 4% 2% 100%
Leumeah 19% 1% 0% 71% 7% 0% 1% 0% 100%
Macarthur 25% 1% 0% 64% 6% 1% 3% 0% 100%
Campbelltown 17% 2% 0% 69% 7% 0% 4% 1% 100%
Corridor 25% 1% 0% 65% 6% 0% 2% 1% 100%
Comparison Areas
Campbelltown SA3 18% 1% 0% 72% 7% 0% 2% 1% 100%
Sydney Outer SW (SA4)
13% 1% 0% 77% 6% 0% 2% 0% 100%
GMA 14% 6% 0% 68% 6% 1% 4% 1% 100% Source: BTS 2011 JTW tables 13 v1.3 & 14 v1.4 (for bicycles)
Bus use within the precincts is low, which may indicate that rail and private vehicle travel times are much more competitive as well as other service level, time and cost factors. This is also likely to be a result of parking policy and expectation in the region.
Vehicle driver and passenger make up 71% of the mode share for the precincts, which is slightly lower than the GMA, Sydney Outer SW and Campbelltown SA3. Comparatively the precincts use of private vehicles is lower than the surrounding area, however generally in line the GMA average.
Bicycle use for the precincts is low, with less than 1% cycling to work. This is below the GMA of 1% and in line with Campbelltown SA3 and Sydney Outer SW. Walking to work represents 2% of journeys, which is in line with Sydney Outer SW and Campbelltown SA3, however half the GMA average of 4%.
Areas of interest include Minto, with a below average private vehicle usage of 70% and corresponding higher usage of rail at 34%. Similarly Glenfield has a below average use of private vehicle with 65% and corresponding higher use of rail and bus representing 33%.
6.5.3 JTW trips to the corridor
Table 6-12 outlines JTW for employment within the precincts i.e. for people who travel to the study area precincts to work.

Glenfield to Macarthur Corridor Integrated Transport Strategy
3 August 2015 Cardno 105
Table 6-12 Journey to work destination mode shares with comparison areas Mode split
Trai
n
Bus
Ferr
y/ T
ram
Vehi
cle
driv
er
Vehi
cle
pass
enge
r
Vehi
cle
(Tot
al)
Bic
ycle
Wal
ked
only
Oth
er m
ode
Tota
l
Glenfield 4% 1% 0% 82% 7% 89% 1% 5% 1% 100%
Macquarie Fields 2% 3% 0% 82% 8% 90% 1% 3% 1% 100%
Ingleburn 5% 1% 0% 84% 7% 91% 0% 2% 1% 100%
Minto 4% 1% 0% 85% 8% 93% 0% 2% 0% 100%
Leumeah 5% 1% 0% 84% 9% 93% 0% 1% 0% 100%
Campbelltown 4% 3% 0% 83% 8% 91% 0% 2% 0% 100%
Macarthur 5% 3% 0% 81% 8% 89% 0% 2% 0% 100%
Corridor 4% 2% 0% 83% 8% 91% 0% 2% 1% 100%
Campbelltown (SA3) 4% 2% 0% 83% 8% 91% 0% 2% 1% 100%
Sydney Outer SW (SA4) 3% 1% 0% 85% 8% 93% 0% 2% 1% 100%
GMA 14% 6% 0% 68% 6% 74% 1% 5% 1% 100% Source: BTS 2011 JTW Table5v1.3
Vehicle use to travel to work within the corridor is very high, with 91% of trips made by driving or being a passenger. This is significantly higher than the GMA with 74%, the same as Campbelltown SA3 with 91% and lower than Sydney Outer SW with 93%.
6.5.4 JTW destinations of the study area’s resident workers
Table 6-13 identifies the top twenty destinations for JTW travel originating in the study area. The entire study area has been assessed to determine the potential rail customer base for those travelling to areas served by rail.
Glenfield to Macarthur Corridor Integrated Transport Strategy
3 August 2015 Cardno 106
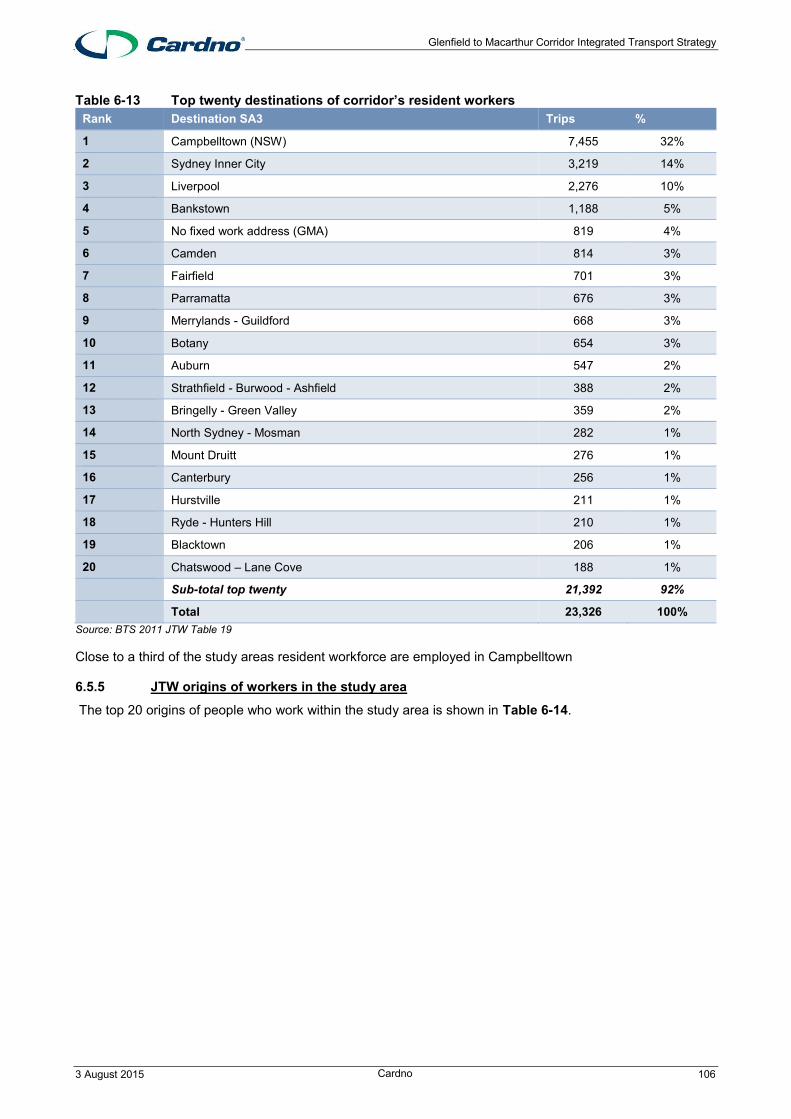
Table 6-13 Top twenty destinations of corridor’s resident workers Rank Destination SA3 Trips %
1 Campbelltown (NSW) 7,455 32%
2 Sydney Inner City 3,219 14%
3 Liverpool 2,276 10%
4 Bankstown 1,188 5%
5 No fixed work address (GMA) 819 4%
6 Camden 814 3%
7 Fairfield 701 3%
8 Parramatta 676 3%
9 Merrylands - Guildford 668 3%
10 Botany 654 3%
11 Auburn 547 2%
12 Strathfield - Burwood - Ashfield 388 2%
13 Bringelly - Green Valley 359 2%
14 North Sydney - Mosman 282 1%
15 Mount Druitt 276 1%
16 Canterbury 256 1%
17 Hurstville 211 1%
18 Ryde - Hunters Hill 210 1%
19 Blacktown 206 1%
20 Chatswood – Lane Cove 188 1%
Sub-total top twenty 21,392 92%
Total 23,326 100% Source: BTS 2011 JTW Table 19
Close to a third of the study areas resident workforce are employed in Campbelltown
6.5.5 JTW origins of workers in the study area
The top 20 origins of people who work within the study area is shown in Table 6-14.

Glenfield to Macarthur Corridor Integrated Transport Strategy
3 August 2015 Cardno 107
Table 6-14 Top twenty origins of workers within study area Rank Origin SA3 Trips %
1 Campbelltown (NSW) 17,244 49%
2 Camden 4,269 12%
3 Wollondilly 2,047 6%
4 Liverpool 1,793 5%
5 Bringelly - Green Valley 1,273 4%
6 Fairfield 1,266 4%
7 Wollongong 614 2%
8 Bankstown 597 2%
9 Penrith 419 1%
10 Southern Highlands 416 1%
11 Sutherland - Menai - Heathcote 414 1%
12 Merrylands - Guildford 395 1%
13 Hurstville 353 1%
14 Parramatta 259 1%
15 Canterbury 257 1%
16 Cronulla - Miranda - Caringbah 231 1%
17 Strathfield - Burwood - Ashfield 225 1%
18 Kogarah - Rockdale 219 1%
19 Mount Druitt 218 1%
20 Blacktown 216 1%
Sub-total top twenty 32,722 93%
Total 35,318 100% Source: BTS 2011 JTW Table 19
Of the all the people that work in the study area, close to half live in Campbelltown and the majority living in the south west ‘wedge’ of the broader Sydney area.
6.5.6 JTW employment self-containment
A detailed analysis of the people that live and work along the corridor has been undertaken to determine the influence of a transport corridor on this relationship as shown in Table 6-15.
Table 6-15 Proportion of corridor’s resident workers who also work in the corridor Precinct Total employed
population per precinct
Number of employed population who also work along the corridor
Proportion of employed people who live and work along corridor
Glenfield 3,492 708 20%
Macquarie Fields 2,983 776 26%
Ingleburn 6,419 1,907 30%
Minto 731 245 34%
Leumeah 3,532 1,273 36%
Campbelltown 3,948 1,451 37%
Macarthur 2,221 675 30%
Study area 23,326 7,035 30% Source: BTS 2011 JTW Table 19

Glenfield to Macarthur Corridor Integrated Transport Strategy
3 August 2015 Cardno 108
The study area has a reasonable level of self-containment, with 30% of workers also living in the study area. This represents an opportunity to increase sustainable modes of travel usage as the distance to work is likely to be relatively short, given the corridor length of approximately 16 kilometres.
Comparison of mode shares for all of the study area’s workers and those who live and work in the corridor is presented in below in Table 6-16.
Table 6-16 Corridor’s workers’ mode shares for JTW – all origins and origins of those who live and work in the corridor
Precinct Car mode share
Transit mode share
Total mechanised mode share
Other mode share
Walk mode share
All JTW Origins
Glenfield 66% 32% 97% 1% 2%
Macquarie Fields
71% 27% 97% 1% 2%
Ingleburn 70% 27% 97% 1% 2%
Minto 60% 33% 93% 2% 5%
Leumeah 78% 20% 98% 1% 1%
Campbelltown 76% 19% 95% 1% 4%
Macarthur 70% 26% 96% 0% 3%
Corridor 70% 25% 95% 1% 2%
JTW live & work
Glenfield 82% 8% 90% 3% 7%
Macquarie Fields
84% 8% 93% 2% 6%
Ingleburn 83% 7% 90% 2% 8%
Minto 76% 6% 82% 2% 16%
Leumeah 89% 7% 96% 1% 3%
Campbelltown 82% 9% 90% 2% 8%
Macarthur 86% 5% 91% 1% 9%
Corridor 84% 7% 91% 2% 7% Note: car mode share includes car driver and car passenger; transit is train, bus, tram, ferry; mechanised is car and transit; mode shares are compared with a base of those that travelled on census day and provide a mode (i.e. excludes worked at home, did not go to work and mode not stated)
Source: BTS 2011 JTW Table 19
Table 6-16 indicates that residents who work in the corridor have much lower transit mode share and higher walk share than all workers in the study area.
6.6 Household travel survey The BTS Household Travel Survey provides information on travel undertaken by residents of the Sydney Greater Metropolitan Area. The following tables provide background information for the study. This data is more general for the corridor, not just the station precincts.
Table 6-17 indicates the sample size of the HTS by direction of travel and purpose.
Glenfield to Macarthur Corridor Integrated Transport Strategy
3 August 2015 Cardno 109
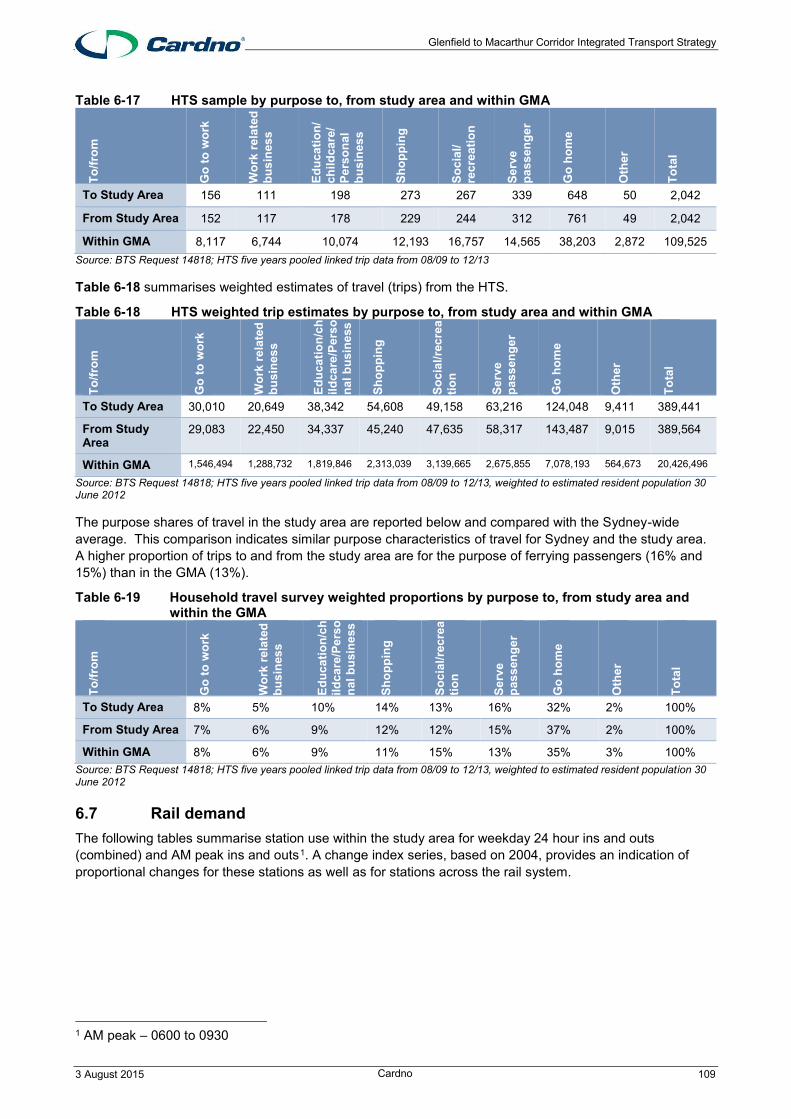
Table 6-17 HTS sample by purpose to, from study area and within GMA
Source: BTS Request 14818; HTS five years pooled linked trip data from 08/09 to 12/13
Table 6-18 summarises weighted estimates of travel (trips) from the HTS.
Table 6-18 HTS weighted trip estimates by purpose to, from study area and within GMA
To/fr
om
Go
to w
ork
Wor
k re
late
d bu
sine
ss
Educ
atio
n/ch
ildca
re/P
erso
nal b
usin
ess
Shop
ping
Soci
al/re
crea
tion
Serv
e pa
ssen
ger
Go
hom
e
Oth
er
Tota
l
To Study Area 30,010 20,649 38,342 54,608 49,158 63,216 124,048 9,411 389,441
From Study Area
29,083 22,450 34,337 45,240 47,635 58,317 143,487 9,015 389,564
Within GMA 1,546,494 1,288,732 1,819,846 2,313,039 3,139,665 2,675,855 7,078,193 564,673 20,426,496
Source: BTS Request 14818; HTS five years pooled linked trip data from 08/09 to 12/13, weighted to estimated resident population 30 June 2012
The purpose shares of travel in the study area are reported below and compared with the Sydney-wide average. This comparison indicates similar purpose characteristics of travel for Sydney and the study area. A higher proportion of trips to and from the study area are for the purpose of ferrying passengers (16% and 15%) than in the GMA (13%).
Table 6-19 Household travel survey weighted proportions by purpose to, from study area and within the GMA
To/fr
om
Go
to w
ork
Wor
k re
late
d bu
sine
ss
Educ
atio
n/ch
ildca
re/P
erso
nal b
usin
ess
Shop
ping
Soci
al/re
crea
tion
Serv
e pa
ssen
ger
Go
hom
e
Oth
er
Tota
l
To Study Area 8% 5% 10% 14% 13% 16% 32% 2% 100%
From Study Area 7% 6% 9% 12% 12% 15% 37% 2% 100%
Within GMA 8% 6% 9% 11% 15% 13% 35% 3% 100% Source: BTS Request 14818; HTS five years pooled linked trip data from 08/09 to 12/13, weighted to estimated resident population 30 June 2012
6.7 Rail demand The following tables summarise station use within the study area for weekday 24 hour ins and outs (combined) and AM peak ins and outs 0F
1. A change index series, based on 2004, provides an indication of proportional changes for these stations as well as for stations across the rail system.
1 AM peak – 0600 to 0930
To/fr
om
Go
to w
ork
Wor
k re
late
d bu
sine
ss
Educ
atio
n/
child
care
/ Pe
rson
al
busi
ness
Shop
ping
Soci
al/
recr
eatio
n
Serv
e pa
ssen
ger
Go
hom
e
Oth
er
Tota
l
To Study Area 156 111 198 273 267 339 648 50 2,042
From Study Area 152 117 178 229 244 312 761 49 2,042
Within GMA 8,117 6,744 10,074 12,193 16,757 14,565 38,203 2,872 109,525

Glenfield to Macarthur Corridor Integrated Transport Strategy
3 August 2015 Cardno 110
Table 6-20 Historic station barrier counts, 24 hours total ins and outs on weekdays Station 2004 2005 2006 2007 2008 2009 2010 2011 2012 2013
Glenfield 7,720 9,500 10,440 10,860 11,600 12,260 9,780 9,180 9,520 9,480
Macquarie Fields 2,720 2,680 2,580 2,180 2,260 2,240 2,080 2,140 2,280 2,580
Minto 7,280 7,280 7,020 7,860 7,700 7,540 7,260 7,340 7,360 5,700
Ingleburn 8,520 7,920 7,780 7,880 8,120 8,180 7,640 7,640 7,940 7,740
Leumeah 6,700 6,780 6,800 6,980 7,180 7,340 6,020 6,200 6,060 4,900
Campbelltown 13,940 13,980 13,700 12,560 12,520 12,060 11,260 11,440 12,740 12,120
Macarthur 3,420 2,140 2,400 3,800 4,600 5,240 5,240 6,140 4,540 4,600
Total 50,300 50,280 50,720 52,120 53,980 54,860 49,280 50,080 50,440 47,120
Index (2004 = 1.00) – total 1.00 1.00 1.01 1.04 1.07 1.09 0.98 1.00 1.00 0.94
Index (2004 = 1.00) – rail system-wide 1.00 0.98 1.00 1.04 1.09 1.10 1.11 1.15 1.16 1.18
Source: Analysis of BTS Rail station barrier counts 2004-13
Table 6-20 indicates an overall increase from 2004 to 2009, followed by a decline through to 2013, to a level about 4 to 5% lower than the 2004 levels. The data indicates rail usage volumes have been largely static over the previous 10 year period. Overall, Campbelltown is the busiest station by passenger volumes within the corridor and the 44th busiest station on the metropolitan network.
An analysis for the AM peak barrier counts of station entries (ins) is presented in Table 6-21.
Table 6-21 Station barrier counts, AM peaks ‘ins’ on weekdays Station 2004 2005 2006 2007 2008 2009 2010 2011 2012 2013
Glenfield 2,150 2,480 2,660 2,770 2,960 3,080 2,720 2,930 3,050 3,150
Macquarie Fields 810 800 780 710 730 720 670 680 730 770
Minto 2,270 2,270 2,190 2,520 2,470 2,420 2,330 2,250 2,260 1,680
Ingleburn 2,090 1,810 1,780 1,800 1,860 1,870 2,060 2,060 2,100 2,050
Leumeah 1,980 2,020 2,030 2,090 2,170 2,210 2,050 2,040 2,000 1,580
Campbelltown 3,620 3,630 3,560 3,260 3,240 3,120 2,920 2,970 3,660 3,180
Macarthur 670 400 460 730 890 980 980 1,150 1,010 1,030
Total 13,590 13,410 13,460 13,880 14,320 14,400 13,730 14,080 14,810 13,440
Index (2004 = 1.00) – total 1.00 0.99 0.99 1.02 1.05 1.06 1.01 1.04 1.09 0.99
Source: Analysis of BTS Rail station barrier counts 2004-13
Review of the AM peak ins in Table 6-21 indicates station volumes have been largely static over the last available 10 year period whereas the overall network AM peak volumes increased by 15%.
Glenfield to Macarthur Corridor Integrated Transport Strategy
3 August 2015 Cardno 111
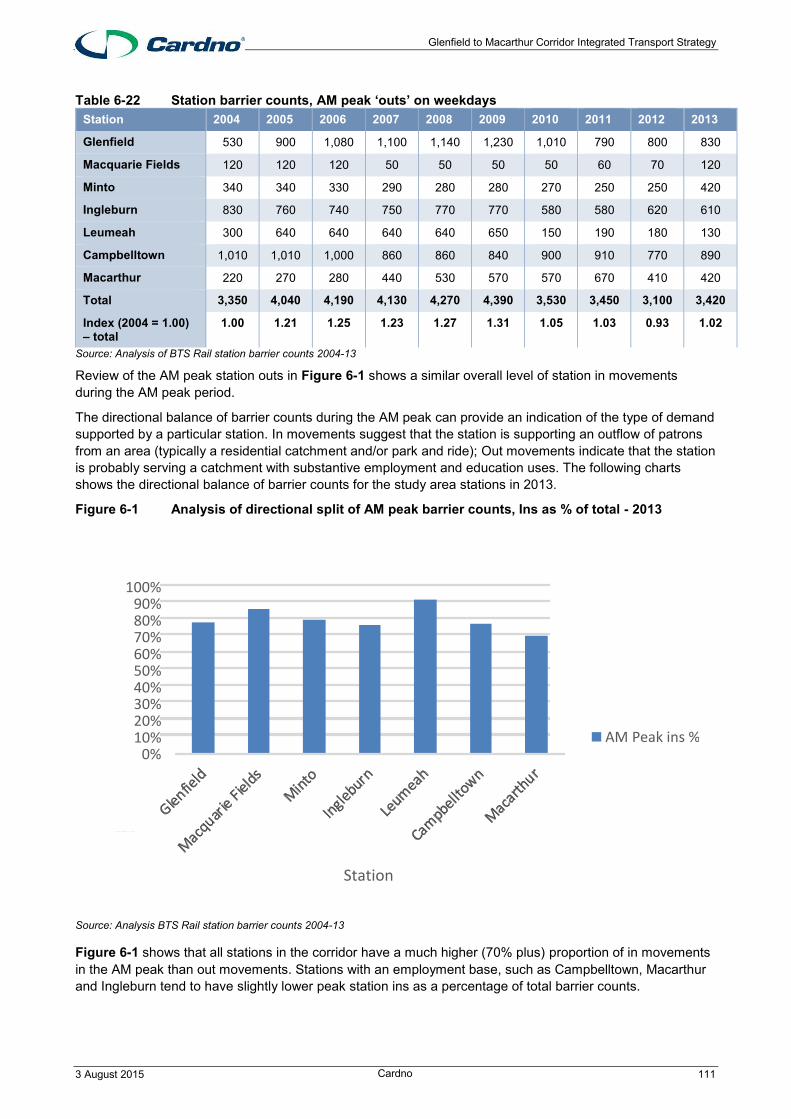
Table 6-22 Station barrier counts, AM peak ‘outs’ on weekdays Station 2004 2005 2006 2007 2008 2009 2010 2011 2012 2013
Glenfield 530 900 1,080 1,100 1,140 1,230 1,010 790 800 830
Macquarie Fields 120 120 120 50 50 50 50 60 70 120
Minto 340 340 330 290 280 280 270 250 250 420
Ingleburn 830 760 740 750 770 770 580 580 620 610
Leumeah 300 640 640 640 640 650 150 190 180 130
Campbelltown 1,010 1,010 1,000 860 860 840 900 910 770 890
Macarthur 220 270 280 440 530 570 570 670 410 420
Total 3,350 4,040 4,190 4,130 4,270 4,390 3,530 3,450 3,100 3,420
Index (2004 = 1.00) – total
1.00 1.21 1.25 1.23 1.27 1.31 1.05 1.03 0.93 1.02
Source: Analysis of BTS Rail station barrier counts 2004-13
Review of the AM peak station outs in Figure 6-1 shows a similar overall level of station in movements during the AM peak period.
The directional balance of barrier counts during the AM peak can provide an indication of the type of demand supported by a particular station. In movements suggest that the station is supporting an outflow of patrons from an area (typically a residential catchment and/or park and ride); Out movements indicate that the station is probably serving a catchment with substantive employment and education uses. The following charts shows the directional balance of barrier counts for the study area stations in 2013.
Figure 6-1 Analysis of directional split of AM peak barrier counts, Ins as % of total - 2013
Source: Analysis BTS Rail station barrier counts 2004-13
Figure 6-1 shows that all stations in the corridor have a much higher (70% plus) proportion of in movements in the AM peak than out movements. Stations with an employment base, such as Campbelltown, Macarthur and Ingleburn tend to have slightly lower peak station ins as a percentage of total barrier counts.
0% 10% 20% 30% 40% 50% 60% 70% 80% 90%
100%
Proportion of AM Barrier count IN
Station
AM Peak ins %

Glenfield to Macarthur Corridor Integrated Transport Strategy
3 August 2015 Cardno 112
6.7.1 Rail opal data
Rail Opal data was analysed for station alightings, train trip containment, time of day tap on/off and day of week tap on. The data was for the month of February 2015. It should be noted that this is outside of university semester periods which would result in slightly lower demand.
Rail destinations
Opal data for train journeys from the Glenfield to Macarthur Corridor to the rest of the Sydney Trains network was gathered for train trips in February 2015. The top five destinations for each of the stations within the Glenfield to Macarthur Corridor was analysed.
The top five origins to destinations from the Glenfield to Macarthur Corridor in February 2015 are provided in Figure 6-2. The highest proportion of Opal card trips occurred between Glenfield to Central with approximately 8000 trips, closely followed by Glenfield to Wynyard with just over 7,500 Opal card trips.
Figure 6-2 Top five rail origin to destination trips for the study area
The majority of train travel by Opal commuters is Sydney CBD bound, which include Central, Town Hall, Wynyard, St James and Museum Stations. The graphs for origin-destination from commuters within the study area are provided as follows.
0
1,000
2,000
3,000
4,000
5,000
6,000
7,000
8,000
9,000
Glenfield - Central Glenfield - Wynyard Campbelltown -Wynyard
Campbelltown - Central Minto - Central

Glenfield to Macarthur Corridor Integrated Transport Strategy
3 August 2015 Cardno 113
Figure 6-3 Top six most common rail destinations from stations in the corridor
Note: The six destinations for rail trips from the corridor in the above chart cover the top five destinations for each of the individual precincts. Although the trips are provided from each precinct origin to all six destinations, one of the destinations will not be in the precincts top five. For example, Parramatta is not in Glenfield’s top five destinations but it is in Leumeah’s, Macquarie Fields, Minto and Campbelltown’s top five.
Source: Opal data - February 2015
Inner Sydney and Parramatta are significant employment areas and generate rail patronage from the residents of the corridor. It is likely a number of factors influence the decision to use public transport to these areas, including availability and cost of parking, ease of access, travel time length, reliability and cost.
0
1,000
2,000
3,000
4,000
5,000
6,000
7,000
8,000
9,000
Campbelltown Glenfield Ingleburn Leumeah Macarthur MacquarieFields
Minto
Central Town Hall Wynyard St James Museum Parramatta

Glenfield to Macarthur Corridor Integrated Transport Strategy
3 August 2015 Cardno 114
Rail trip containment
Campbelltown Station was the key destination for Opal card passengers traveling from all stations in the corridor except Macarthur. Ingleburn and Macarthur are also popular intra-corridor destinations. There is a particularly high movement of passengers between Campbelltown and Ingleburn Stations. This shows that the rail network is used to make intra-corridor trips.
Figure 6-4 shows the intra-corridor trips for commuters within the corridor. Each station has a small percentage of intra-corridor trips that begin and end at the same station. This is due to reverse tap-ons and commuters arriving at the station of origin within 1 hour of departure, which is counted as a transfer under the Opal system.
Figure 6-4 Intra-corridor trips in February 2015
Station Opal card patronage Figure 6-5 shows the number of Opal card commuters that alighted from the train at the stations within the Glenfield to Macarthur Corridor in February 2015. Campbelltown and Glenfield Stations had the highest patronage across the corridor. This could be attributed to the significant commuter car parking at both stations, the provision of the Campbelltown bus interchange adjacent to Campbelltown Station and employment opportunities in Campbelltown. Ingleburn, Minto, Leumeah and Macarthur all had similar volumes of Opal card alighting’s over February 2015; between 30,000 and 40,000 each. Macquarie Fields Station was the least patronised station throughout February with only 12,500 Opal passengers alighting at this station.
0
200
400
600
800
1000
1200
1400
1600
1800
2000
Glenfield MacquarieFields
Ingleburn Minto Leumeah Campbelltown Macarthur
Op
al C
om
mu
ter
Trip
s in
Feb
ura
ry
From Station
Glenfield Macquarie Fields Ingleburn Minto Leumeah Campbelltown Macarthur

Glenfield to Macarthur Corridor Integrated Transport Strategy
3 August 2015 Cardno 115
Figure 6-5 Station alighting’s in February
Time of day tap ons
The times of day that Opal passengers tapped on at the stations through the corridor in February 2015 are shown on Figure 6-6. Overall, most stations have a big influx during the morning peak, usually between 7:00 – 8:00am. The peak morning time at Campbelltown starts earlier and continues for two hours from 6:00 – 8:00am, compared with a one hour peak for the other stations within the corridor.
Significantly fewer Opal passengers tapped on at train stations throughout the corridor in the afternoon peak than the morning peak. This is because there is predominantly more residential, than educational and employment land uses in the corridor; people leave in the morning and arrive back to the corridor in the afternoon. The Ingleburn, Glenfield and Minto Stations’ afternoon peak tap on for Opal users is earlier than that for Campbelltown and Macarthur. This could be due to the differing industries between the precincts; industrial employees and construction workers may finish work earlier than retail and office workers.
0
10,000
20,000
30,000
40,000
50,000
60,000
70,000
Glenfield MacquarieFields
Ingleburn Minto Leumeah Campbelltown Macarthur
Cus
tom
er a
light
ing
Station Destination

Glenfield to Macarthur Corridor Integrated Transport Strategy
3 August 2015 Cardno 116
Figure 6-6 Time of day tap ons in February
Day of tap on
The days in which Opal card users access the train network are all relatively similar. Wednesday is typically the busiest day for stations in the corridor and Sunday the quietest. Figure 6-7 presents the data for day of travel by Opal card users in February. Macarthur has the smallest percentage difference between weekday and weekend Opal passenger volumes.
Figure 6-7 Day of tap on in February 2015
0
3000
6000
9000
12000
15000
18000
21000
0 - 0
:59
1 - 1
:59
2 - 2
:59
3 - 3
:59
4 - 4
:59
5 - 5
:59
6 - 6
:59
7 - 7
:59
8 - 8
:59
9 - 9
:59
10
- 10
:59
11
- 11
:59
12
- 12
:59
13
- 13
:59
14
- 14
:59
15
- 15
:59
16
- 16
:59
17
- 17
:59
18
- 18
:59
19
- 19
:59
20
- 20
:59
21
- 21
:59
22
- 22
:59
23
- 23
:59
Glenfield Macquarie Fields Ingleburn Minto
Leumeah Campbelltown Macarthur
0
2000
4000
6000
8000
10000
12000
14000
Campbelltown Glenfield Ingleburn Leumeah Macarthur MacquarieFields
Minto
Monday Tuesday Wednesday Thursday Friday Saturday Sunday

Glenfield to Macarthur Corridor Integrated Transport Strategy
3 August 2015 Cardno 117
6.7.2 Rail capacity
No capacity constraints have been identified for train services when operating along the corridor. This is not unexpected given the location of the stops in relation to the rail network and its key attraction location, Sydney CBD. Capacity constraints on the rail network are evident when services are close to city stations and are busiest in the AM peak period. 2013 BTS rail passenger statistics indicate that at Green Square or Sydenham, during the AM peak hour 8:00am – 8:59am on average trains carried 114% of their seated capacity, however over the 3.5 hour morning peak 6:00am – 9:30am, on average 85% of seated capacity was observed to be utilised at these stations.
6.8 Bus demand Bus use and demand data has been assessed through Opal data as this was the only data source that could be made available.
The tap on data for buses at all bus stops within the corridor were provided for Opal card users for a week in February 2015. The main interchanges and trip generator locations such as shopping centres, educational precincts, and sports precincts are summarised in this section.
The top 10 stops is shown in Table 6-23.
Table 6-23 Top 5 busiest locations by passenger volume bus stops Rank Precinct Location Location Weekly Customers Average Weekday
1 Campbelltown Campbelltown Interchange 12,311 2,184
2 Ingleburn Ingleburn Station - 4,311 736
3 Glenfield Glenfield Station 3,343 602
4 Macarthur Macarthur Square (stops not at station, along Menangle Road)
2,960 463
5 Minto Minto Station 2,487 463
6 Leumeah Leumeah Station 1,762 302
7 Minto Minto Mall 1,652 263
8 Macquarie Fields Macquarie Fields TAFE 908 153
9 Macarthur Campbelltown Hospital 616 105
10 Macquarie Fields Macquarie Fields Station 263 53
The data review indicates that bus services are mostly used to connect with stations, however two shopping centres, health and educational uses also feature. It is noted that Macarthur station had relatively low patronage of bus services. Given the 34 bus services operating approximately 1,344 services per weekday within the study corridor, the service usage appears to be moderate.
Glenfield
There are two main bus stops at the Glenfield Station interchange that are both located on the eastern side of the station, along Railway Parade. Both of these bus stops cater for the services 864, 867, 870, 871, 872, with buses departing from the bus stop on the western side of Railway Parade (Stop ID 216711) travelling towards Liverpool, and services from the eastern side of Railway Parade (Stop ID 216712) proceeding towards Campbelltown.
Opal card tap on data for a week in February 2015 shows 1,968 passengers travelling towards Campbelltown, while services to Liverpool carried 1,375 passengers. Figure 6-8 shows the weekly and average weekday users of the main trip generating bus stops within the precinct.

Glenfield to Macarthur Corridor Integrated Transport Strategy
3 August 2015 Cardno 118
Figure 6-8 Glenfield precinct main bus stops
Glenfield to Macarthur Corridor Integrated Transport Strategy
3 August 2015 Cardno 119
Macquarie Fields
Macquarie Fields Station caters for only one bus route; Route 876 that runs in a loop to connect the eastern parts of the suburb to the train station. The weekly Opal bus customers at the bus stop adjacent to the station (Stop ID 256491) was approximately 263.
In addition to the station, the South Western Sydney TAFE in the north eastern side of the Macquarie Fields precinct caters for the 870 and 872 bus routes towards Liverpool and Campbelltown. This bus route (Stop ID 256485) was used by 908 weekly users in February 2015. Figure 6-9 shows the trip volumes for the Macquarie Fields Station bus stop and TAFE bus stops.

Glenfield to Macarthur Corridor Integrated Transport Strategy
3 August 2015 Cardno 120
Figure 6-9 Macquarie Fields Precinct main bus stops

Glenfield to Macarthur Corridor Integrated Transport Strategy
3 August 2015 Cardno 121
Ingleburn
Ingleburn Station has two bus stops, located on either side of Ingleburn Road, with services towards Liverpool and Campbelltown. The routes that service the station include 869, 870, 871, 872 and 873. Services departing from the eastern side (Stop ID 256518) travel towards Campbelltown. 1,698 Opal card passengers accessed this bus stop in one week during February 2015. For services to Liverpool (Stop ID 256564), 2,613 Opal card passengers accessed this bus stop during the one week period.
In addition to the train station, a bus stop is located at Ingleburn shops, another main trip generator within the precinct. This stop (Stop ID 256517) caters for bus services 870, 871 and 873 for services to Liverpool and Minto. 166 Opal card passengers used these services during the week in February. The station and Ingleburn shop bus stops are shown in Figure 6-10, along with their weekly and average weekday Opal passenger use.

Glenfield to Macarthur Corridor Integrated Transport Strategy
3 August 2015 Cardno 122
Figure 6-10 Ingleburn Precinct main bus stops
Glenfield to Macarthur Corridor Integrated Transport Strategy
3 August 2015 Cardno 123
Minto
Three bus stops are located at Minto Station, two on the eastern side and one on the western side. The western side bus stop (Stop ID 256628) service the areas towards Minto, Gregory Hill and Campbelltown and are services by routes 850,874,875 and 880. 763 Opal card passengers accessed the Minto Railway Station bus stop during a week in February 2015.
On the eastern side, bus stops located on Minto Road (Stop ID 2566233) and Redfern Road (256664). The Minto Road bus stop is located on the southern side of the road and caters for Route 873 towards Ingleburn. 460 Opal card customers used this bus stop during a week in February 2015. The Redfern Road bus stops services routes 873, 874 and 875 towards Minto and Raby. This bus stop had Opal card use of 1,264 during a week in February 2015.
In addition to the train station, Minto Marketplace presents a location where trip generation is expected to be high. Although just outside the precinct area, Minto Marketplace is likely to generate trips from customers within the precinct area. Altogether, 1,652 customers used the Minto Marketplace bus stops (Stop ID 256629/ 256666) in a week in February 2015. The bus routes that service the Marketplace are 850, 870, 871, 872, 873, 874 and 875, of which three also service Minto Station. The main Minto bus stops and weekly and average weekday use are shown in Figure 6-11.

Glenfield to Macarthur Corridor Integrated Transport Strategy
3 August 2015 Cardno 124
Figure 6-11 Minto Precinct main bus stops

Glenfield to Macarthur Corridor Integrated Transport Strategy
3 August 2015 Cardno 125
Leumeah
Three bus stops are located at Leumeah Station, two on the eastern side, and one on the western side. The western side bus stop (Stop ID 2560667) caters for Route 879 which travels to Campbelltown. Opal data from February 2015 shows a weekly use of this bus stop of 302 passengers. The service departs from the roundabout at the end of Plough Inn Road.
There were 1,460 Opal bus customers accessing the bus stop on the southern side of O’Sullivan Road (Stop ID 2560267) during the February 2015 week. The routes that service this bus stop are the 870, 871, 872 and 881. Opal data for bus stop 256085 was not available.
In addition to the station bus stop, the Sports Stadium is also a major trip generator during sports events. The Opal data that was received shows a weekly usage of 116 commuters over the week in February 2015. This number is likely to be higher during sporting events at the stadium. Figure 6-12 shows the location and the recorded weekly and average daily commuters at each stop.

Glenfield to Macarthur Corridor Integrated Transport Strategy
3 August 2015 Cardno 126
Figure 6-12 Leumeah Precinct main bus stops

Glenfield to Macarthur Corridor Integrated Transport Strategy
3 August 2015 Cardno 127
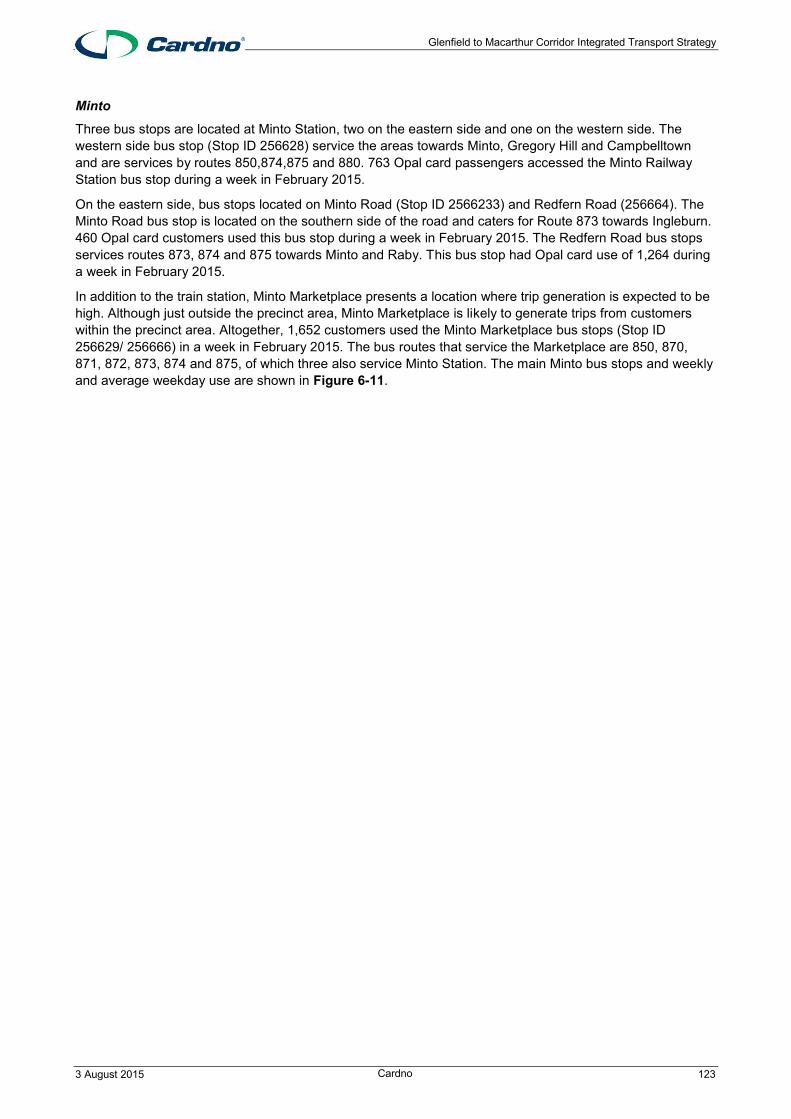
Campbelltown
Campbelltown Station includes a major bus interchange on the southern side of the station, and two bus stops on the northern side of the station. The bus interchange consists of bus stops A to F. These bus stops provide services within the Campbelltown LGA, Picton, Wollongong, Camden and Narellan. Over the course of a week, 11,341 Opal card passengers accessed bus services at this interchange.
On the northern side of the station, 970 Opal card passengers used services from both these bus stops. Only the 880 service to Minto runs from this side of the station. Opal card usage for the key bus stops in the Campbelltown precinct for the week in February 2015 is shown in Figure 6-13.
Glenfield to Macarthur Corridor Integrated Transport Strategy
3 August 2015 Cardno 128
Figure 6-13 Campbelltown Precinct main bus stops
Glenfield to Macarthur Corridor Integrated Transport Strategy
3 August 2015 Cardno 129
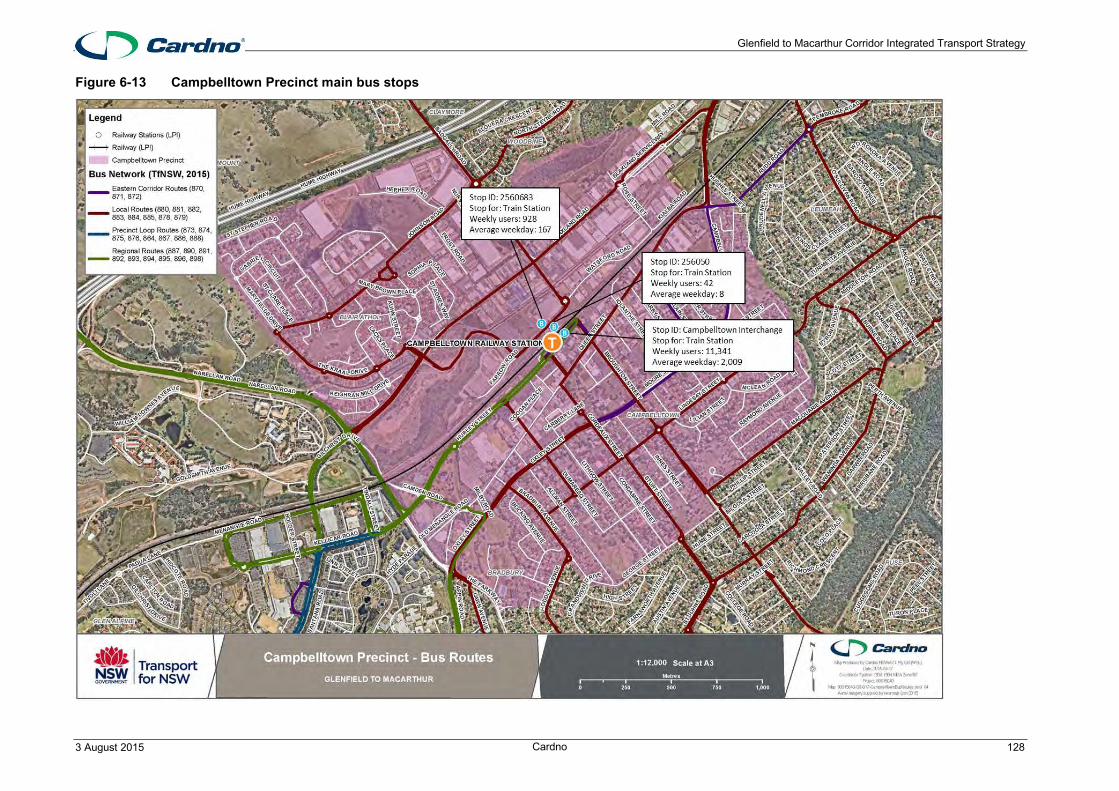
Macarthur
The Macarthur precinct has various major trip generators which include the train station, Campbelltown TAFE, University of Western Sydney (UWS), Macarthur Square and Campbelltown Hospital.
Macarthur Station includes three bus stops in close vicinity to the station entrance. Together these bus stops had a total bus tap on of 302 commuters over a week in February 2015. Bus services from Macarthur Station connect to other destinations within the study corridor including Leumeah and Minto and suburbs west of the Hume Motorway that are without rail access such as Narellan, Mount Annan, Oran Park and Currans Hill. Bus services are also provided to suburbs south of Macarthur including Bradbury, Ambarvale and Airds.
The Campbelltown TAFE and UWS are the main educational trip generators in the precinct. No Opal data was available for UWS customers, while the Campbelltown TAFE bus stops together had a combined usage of 156 users over the week.
Campbelltown Hospital has a main bus stop inside the hospital precinct, and two other bus stops along Therry Road. The main bus stop inside the hospital precinct (Stop ID 2560334) had a weekly patronage of 443 Opal card users in February 2015. The bus stops along Therry Road had a combined total of 26 Opal card users.
The final main trip generator in the Macarthur Precinct is Macarthur Square, which is the main shopping complex in the precinct. This shopping complex consists of four main bus stops. There was a combined weekly total of 2,885 Opal card tap ons at Macarthur Square in February 2015.
Figure 6-14 shows the weekly and average weekday Opal cards users at each of the main trip generators in the Macarthur Precinct.
Glenfield to Macarthur Corridor Integrated Transport Strategy
3 August 2015 Cardno 130
Figure 6-14 Macarthur Precinct main bus stops

Glenfield to Macarthur Corridor Integrated Transport Strategy
3 August 2015 Cardno 131
6.9 Key considerations The existing travel behaviour within the study area provides an insight into how the study area functions and consequently transport considerations. Key considerations for the study area are described below.
> Dwelling structure within a precinct indicates the density, likely travel patterns and vehicle ownership. The dwelling structure in the study area is predominately 63%, low-density separate housing. This type of dwelling structure in a precinct is likely to lead to higher vehicle use for all trips. Semis (townhouses/ terraces/ row houses) represent 29% of all dwellings, this type of dwelling structure supports higher use of walking, cycling and public transport. Flats, units and apartments (FUA) represent 8% of dwellings, this form of dwelling supports and encourages sustainable modes of transport. FUAs provide the density for public transport and all day activity promotes a feeling of safety to walk and cycle throughout the day.
> Vehicle ownership within the study area varies, with more single vehicle households compared to the GMA and less 2, 3 and 4+ vehicle households compared to the GMA which is presented in Table 6-24.
Table 6-24 Vehicle ownership comparison Precinct 0 veh 1 veh 2 veh 3 veh 4
veh+ Dwellings Total
vehicles Average veh/ dwelling
Glenfield to Macarthur corridor
12% 46% 30% 9% 3% 13,393 19,419 1.45
GMA Total 12% 39% 34% 10% 5% ~1.900,000 ~2.900,000 1.56
> There are opportunities to capitalise on the lower proportion of 2+ vehicle dwellings to encourage the use of more sustainable transport modes.
> Journey to work data for people who live in the study area indicates a high proportion of vehicle driver and passenger, 65% and 6% respectively with a total of 71% of all trips by vehicle. This is a little lower than the mode share splits for Greater Sydney, vehicle drivers and passengers at 68% and 6% respectively. This proportion of journey to work trips indicates a significant reliance on the private motor vehicle and is likely to result in short trips to work also being taken by private motor vehicle. This is an opportunity to increase walking, cycling and the use of public transport.
> The journey to work mode shares for people working in the study area represent an even higher reliance on private motor vehicles with the proportion of vehicle drivers and passengers at 83% and 8% respectively, a total of 91% of all work trips to jobs located in the corridor. There is a significant difference between the trips to jobs located in the corridor and work trips in Greater Sydney. This may indicate the study area’s workers live in parts of Sydney that have limited public transport regional coverage and frequency and so public transport travel times are not competitive with private vehicles. Key considerations are the facilities at the end destination, in this case parking is widely available throughout the corridor and is a key driver for the use of private vehicles. There are a number of opportunities to increase walking, cycling and public transport use within the study area. Parking supply and policy may also need to be addressed to decrease the attractiveness of driving.
> The proportion of people who live and work in the study area is 32% (the proportion of journey to work trips that are self-contained within the corridor). This is a significant opportunity to increase walking, cycling and public transport for these self-contained trips.
> The workplace location for residents who live in the Glenfield to Macarthur corridor demonstrates a relatively local economy; the five top employment destinations for residents are Campbelltown, Sydney Inner City, Liverpool, Bankstown and Camden. The employment for residents is located locally (approximately 45 minute public transport trip). These shorter trips may be feasible by walking, cycling or public transport.
> The top five locations where people who work in the study area live are Campbelltown, Camden, Wollondilly, Liverpool and Bringelly – Green Valley. This corresponds to the above data, where the majority of workers in the area live within the study area or close by.
> The Household Travel Survey shows a higher trend of shopping trips (14%) and serving a passenger trips (16%) for the study area when compared to Greater Sydney (11% and 13% respectively). This is likely to

Glenfield to Macarthur Corridor Integrated Transport Strategy
3 August 2015 Cardno 132
indicate the importance of the study area within the regional retail structure, the majority of large shopping centres in the South West are located within the corridor. The higher than average trip purpose of serving passengers is likely to indicate a higher proportion of people under the age of 17 (driving age) and the lack of public transport coverage, frequency, reliability and potentially personal security. This suggests there are opportunities to improve public transport connections to the study area to encourage people shopping and younger people to use more public transport.
These key considerations will be used to develop objectives and measures to encourage more walking, cycling and public transport use while seeking to support the study areas key employment uses and strategic role within Metropolitan Sydney.

Glenfield to Macarthur Corridor Integrated Transport Strategy
3 August 2015 Cardno 133
7 Forecast conditions
The Department of Planning and Environment (DP&E) and TfNSW have identified urban activation and intensification opportunities along the Glenfield to Macarthur corridor to support population and economic growth. Each of the seven precincts has been considered for their ability to support additional residents and employees.
Resident population growth is generally proposed to be focused around the railway station precincts in higher density land use than exists currently. This utilisation of the existing rail provision will reduce the required investment in new transport infrastructure and services.
The proposed precinct changes are provided with population growth figures (Section 7.1 ) and indicated on precinct structure plans (Section 7.2) which demonstrate the new land uses and road connections needed to accommodate the growth. Full details of the structure plan changes are available in Cox Richardson’s Structure Plan report.
To understand how the forecast populations targeted for each precinct differ from the growth that would have occurred through the corridor regardless of intensified land use, forecast population growth from BTS to 2036 has also been provided in Section 7.1.
7.1 Forecast population Forecast resident and employment populations to 2036 are presented in the following sections by both the current Bureau of Transport Statistics (BTS) forecasts and also by the proposed precinct structure plans. A summary of the differences between each of the forecasts is also provided.
7.1.1 Resident population growth
BTS forecast
This section provides a summary of projected population, workforce and jobs for each of the precincts and for the study area. Projections are drawn from the 2014 scenario of BTS’s small-area population and employment land use series. The precinct-level estimates should be considered approximate as the travel zone boundaries and precinct boundaries do not concord.
Projected population for the corridor is summarised in Table 7-1. The combined centre of Campbelltown-Macarthur is expected to have the highest population by 2036, with Campbelltown having the highest population for a single precinct. Overall the study area’s population is projected to increase by an additional 16% by 2036, with Macarthur having the highest growth rate within the precinct from 2011 onwards.
Table 7-1 Comparison of natural growth and structure plan growth of population for 2036 Precinct Background (BTS) Proposed Structure Plan Change % change
Glenfield 14,100 14,900 800 6%
Macquarie Fields 7,900 7,900 0 1%
Ingleburn 16,600 17,900 1,300 8%
Minto 2,600 3,100 500 20%
Leumeah 9,300 10,000 700 8%
Campbelltown 13,700 18,300 4,600 33%
Macarthur 10,900 15,200 4,300 39%
Total 75,100 87,300 12,200 16%
Summary
The Structure Plans forecast 16% more resident population that the current BTS forecasts. In Glenfield and Leumeah precincts the forecasts are similar at 6% and 8% respectively, however in Macarthur there is a difference of 39%.
Glenfield to Macarthur Corridor Integrated Transport Strategy
3 August 2015 Cardno 134
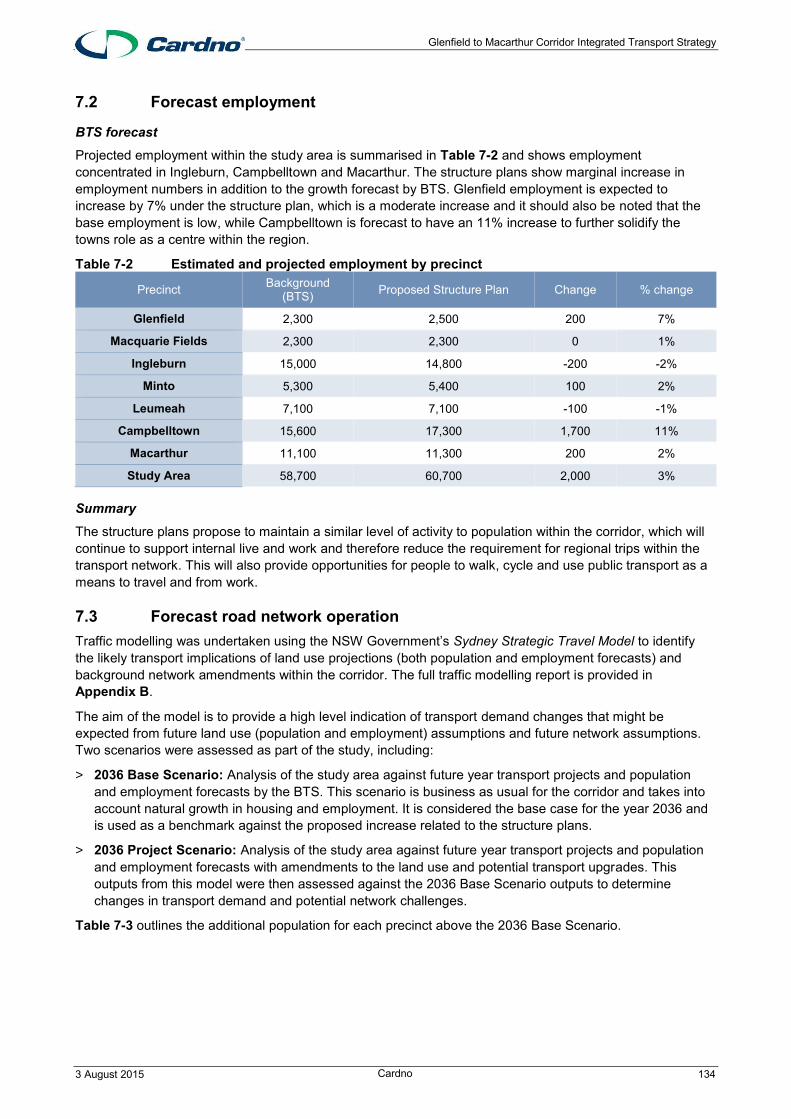
7.2 Forecast employment
BTS forecast Projected employment within the study area is summarised in Table 7-2 and shows employment concentrated in Ingleburn, Campbelltown and Macarthur. The structure plans show marginal increase in employment numbers in addition to the growth forecast by BTS. Glenfield employment is expected to increase by 7% under the structure plan, which is a moderate increase and it should also be noted that the base employment is low, while Campbelltown is forecast to have an 11% increase to further solidify the towns role as a centre within the region.
Table 7-2 Estimated and projected employment by precinct
Precinct Background (BTS) Proposed Structure Plan Change % change
Glenfield 2,300 2,500 200 7%
Macquarie Fields 2,300 2,300 0 1%
Ingleburn 15,000 14,800 -200 -2%
Minto 5,300 5,400 100 2%
Leumeah 7,100 7,100 -100 -1%
Campbelltown 15,600 17,300 1,700 11%
Macarthur 11,100 11,300 200 2%
Study Area 58,700 60,700 2,000 3%
Summary
The structure plans propose to maintain a similar level of activity to population within the corridor, which will continue to support internal live and work and therefore reduce the requirement for regional trips within the transport network. This will also provide opportunities for people to walk, cycle and use public transport as a means to travel and from work.
7.3 Forecast road network operation Traffic modelling was undertaken using the NSW Government’s Sydney Strategic Travel Model to identify the likely transport implications of land use projections (both population and employment forecasts) and background network amendments within the corridor. The full traffic modelling report is provided in Appendix B.
The aim of the model is to provide a high level indication of transport demand changes that might be expected from future land use (population and employment) assumptions and future network assumptions. Two scenarios were assessed as part of the study, including:
> 2036 Base Scenario: Analysis of the study area against future year transport projects and population and employment forecasts by the BTS. This scenario is business as usual for the corridor and takes into account natural growth in housing and employment. It is considered the base case for the year 2036 and is used as a benchmark against the proposed increase related to the structure plans.
> 2036 Project Scenario: Analysis of the study area against future year transport projects and population and employment forecasts with amendments to the land use and potential transport upgrades. This outputs from this model were then assessed against the 2036 Base Scenario outputs to determine changes in transport demand and potential network challenges.
Table 7-3 outlines the additional population for each precinct above the 2036 Base Scenario.

Glenfield to Macarthur Corridor Integrated Transport Strategy
3 August 2015 Cardno 135
Table 7-3 2036 Project Scenario additional population Precinct 2011 2016 2021 2026 2031 2036
Glenfield N/A 60 42 448 1,083 1,601
Macquarie Fields N/A -26 -27 -27 -120 -334
Ingleburn N/A 1 37 252 299 534
Minto N/A 20 80 145 192 278
Leumeah N/A -70 -201 -102 199 647
Campbelltown N/A 362 1,050 1,582 2,030 2,623
Macarthur N/A 525 2,137 3,618 4,529 5,609
Total N/A 872 3118 5,916 8,212 10,958
An important consideration when interpreting results from this model is that the public transport networks used in STM currently do not have capacity constraints. The outputs are strategic and indicative of demand and not specific to particular intersections.
A number of potential links over the railway line were investigated as part of the modelling task. These were:
> Glenfield: connection from Glenfield Road to Campbelltown Road;
> Macquarie Fields: connection from Victoria Road to Railway Parade;
> Ingleburn: connection from Oxford Road to Memorial Avenue and Chester Road to Devon Road;
> Minto: connection from Minto Road to Campbelltown Road; and
> Campbelltown: connection from Broughton Street to Badgally Road.
> Macarthur: transit link from Camden Road to Menangle Road.
The results from the modelling indicated that some of these links are likely to induce traffic and as a result may have negative impacts on town centres and the local economy. As a result, the following concept links are not recommended:
> Ingleburn: connection from Oxford Road to Memorial Avenue; and
> Minto: connection from Minto Road to Campbelltown Road.
Due to the limited nature of the STM, a more detailed analysis is required for local links that may have local benefit. This analysis should take into consideration strategic objectives within this strategy, induced traffic and local congestion as a result of the links. It is also recommended that alternate options are considered for these links, including walking, cycling and public transport only. The links recommended for further investigation are:
> Glenfield: connection from Glenfield Road to Campbelltown Road;
> Macquarie Fields: connection from Victoria Road to Railway Parade;
> Ingleburn: Chester Road to Devon Road; and
> Campbelltown: transit and active transport connection from Broughton Street to Badgally Road.
7.3.1 Glenfield
In the 2036 Base Scenario, the Glenfield precinct is to gain approximately 1,800 additional origin and destination trips per hour in the AM peak, and 1,900 additional trips in the PM peak period over 25 years. The 2036 Project Scenario indicates that approximately 2,500 additional origin and destination trips per hour are anticipated in the AM peak period, and 2,600 additional trips in the PM peak period over 25 years.
Small scale changes are anticipated to the assigned traffic volumes in the Base Scenario between 2011 and 2036 with modest increases in demand along Glenfield Road to the west of the rail line, connecting to Campbelltown Road.

Glenfield to Macarthur Corridor Integrated Transport Strategy
3 August 2015 Cardno 136
It was identified that an extension of Cambridge Avenue may alleviate issues identified in the wider transport study. The 2036 Project Scenario model was undertaken to determine the traffic and transport impacts with the extension of Cambridge Avenue.
The assessment indicated that despite no induced traffic demands above anticipated growth being generated into the Glenfield precinct as a result of construction of the extension. The Cambridge Avenue extension would likely redistribute some traffic from Glenfield Road (the parallel route being largely superseded by the extension of Cambridge Avenue). This would result in a minor re-orientation of trips to take advantage of the extension.
The 2036 structure plan scenario indicates that approximately 2,500 origin and destination trips per hour are anticipated in the AM peak, and 2,600 additional trips in the PM peak period over 25 years. This is an increase of 700 vehicles in each AM and PM peak hour above the BTS growth scenario.
7.3.2 Macquarie Fields
In the year 2036 Base Scenario Macquarie Fields precinct trips are expected to generally increase in the AM peak period over 25 years, and decrease slightly in the PM peak period. The 2036 Project Scenario indicates that trips in the AM and PM peak periods are anticipated to have small increase and decrease margins over 25 years in comparison to the 2036 Base Scenario.
Modest changes in vehicle demand are anticipated in the Base Scenario between 2011 and 2036, with the maximum change in vehicle demand reaching approximately 200 vehicles per hour along a number of roads.
No major road infrastructure upgrades were modelled for the 2036 Project Scenario. The analysis indicated that the changes in vehicle assignment in comparison to the 2036 Base Scenario within the precinct are minor with the assignments between the two scenarios (in particular on Atchison Road) generally comparable.
The 2036 project scenario indicates that volumes would be consistent with BTS’s existing forecast.
7.3.3 Ingleburn
In the year 2036 Base Scenario the Ingleburn precinct is to gain approximately 900 additional origin and destination trips per hour in the AM peak, and 350 additional trips in the PM peak periods over 25 years. The 2036 Project Scenario indicates that approximately 1,300 additional origin and destination trips per hour are anticipated in the AM peak, and 700 additional trips in the PM peak periods over 25 years.
The traffic volumes in both directions across the rail line are anticipated to increase by approximately 200 vehicles per hour in the Base Scenario between 2011 and 2036. The traffic modelling results indicate that further detailed investigation is required to determine the performance of key intersections along the route (including the intersections of Henderson Road/Williamson Road, Henderson Road/Lancaster Road and Henderson Road and Macquarie Road).
The study team identified that an extension of Brooks Road to the east side of the rail line may alleviate issues identified in the wider transport study. A 2036 Project Scenario model was undertaken to determine the traffic and transport impacts with the extension of Brooks Road.
The assessment indicated that extension of Brooks Road to the east (coupled with modified land use) would lead to diverting traffic from the current rail crossing at Henderson Road. As a result of the aforementioned upgrades, eastbound traffic along Henderson Road is projected to reduce by just under 400 vehicles in two hours, whilst eastbound traffic on the Brooks Road extension is anticipated to increase by approximately 350 vehicles per hour. In addition, westbound traffic is anticipated to reduce by approximately 600 vehicles in two hours on Henderson Road and by 1,200 vehicles on Brooks Road.
The traffic modelling results indicate that additional traffic is unlikely to be generated to the Ingleburn precinct, minor reassignment of traffic is expected (subject to additional modelling and costs faced by drivers analysis) as well as noting other key benefits in the extension of Brooks Road to the east, including:
> Providing additional capacity across the rail line and Bunbury Curan Creek,
> Providing more direct access to the area immediately around the station; and
> Reducing travel distances.
Glenfield to Macarthur Corridor Integrated Transport Strategy
3 August 2015 Cardno 137
It should be noted that the extension of Brooks Road to the east, providing a direct link into Ingleburn Town Centre, may result in funnelling traffic into the area around Ingleburn Station contributing to additional network delay, impacts to public transport and general traffic, higher separation levels for pedestrians and other non-car users and lower town centre amenity.
It is recommended that a southern alignment, a connection between Devon Road and Chester Road, is investigated in more detail. This would include detailed transport modelling, potential public transport and freight priority options and an assessment against the objectives within Section 9.
The 2036 structure plan scenario indicates that approximately 1,300 origin and destination trips per hour are anticipated in the AM peak, and 700 additional trips in the PM peak period over 25 years. This is an increase of 400 vehicles in each AM and PM peak hour above BTS base growth scenario.
7.3.4 Minto
The year 2036 Base Scenario indicates that the Minto precinct is to gain approximately 750 additional origin and destination trips per hour in the AM peak and 650 additional trips in the PM peak period over 25 years.
The east-west traffic in the Minto precinct is anticipated to increase by approximately 250 to 350 vehicles per hour in the Base Scenario between 2011 and 2036 bi-directional via Ben Lomond Road and Pembroke Road, with associated movement to the north along Minto Road.
A connection between St Andrews Road and Minto Road was modelled that would facilitate direct east-west access between Minto Road and Campbelltown Road to the north of the Minto station precinct. The analysis indicated that a connection between St Andrews Road and Minto Road will likely result in a significant increase in traffic demand with the link likely to result in an increase of approximately 200 and 300 vehicles per hour in each direction over the 2036 Base Scenario.
Westbound traffic along Ben Lomond Road was expected to marginally fall as a result of the connection between St Andrews Road and Minto Road, however it is anticipated that traffic volumes will generally increase, in particular traffic crossing the rail line. The model indicates that the increase in traffic demand is likely to originate or continue onto Minto Road in the east. The modelling further outlined that the connection has the risk of introducing long distance segments to run through the precinct.
The 2036 structure plan scenario indicates that approximately 1,050 origin and destination trips per hour are anticipated in the AM peak, and 950 additional trips in the PM peak period over 25 years. This is an increase of 300 vehicles in each AM and PM peak hour above the BTS base growth scenario.
7.3.5 Leumeah
The 2036 Base Scenario indicates that the Leumeah precinct is to gain approximately 900 additional origin and destination trips per hour in the AM peak and approximately 1,000 in the PM peak period.
The traffic modelling indicated there is likely to be modest increases in traffic demand in the town centre in the Base Scenario between 2011 and 2036 with further analysis recommended to the intersections of Rose Payton Drive and Pembroke Parade (subject to existing intersection performance) as two approaches of the intersection are likely to attract an additional 150 to 200 vehicles per hour.
The analysis of the 2036 Project Scenario indicates that there is a projected decrease in vehicle demand using Campbelltown Road and the northbound on-ramp to the Hume Highway with an overall increase in northbound demand between Campbelltown Road across to Catherine Field. The increase in north to south road capacity is likely as a result of ongoing development west of the Hume Highway corridor, as well as development of the South West Growth Centre.
The 2036 Project Scenario indicates that an approximate 950 origin and destination trips per hour are anticipated in the AM peak and 1,050 in the PM peak periods over 25 years. This is an increase of 50 vehicles in each AM and PM peak hour above the natural growth scenario.
7.3.6 Campbelltown
The 2036 Base Scenario indicates that the Campbelltown precinct is to increase by approximately 1,750 additional origin and destination trips per hour in the AM peak and by 1,850 additional trips in the PM peak periods over 25 years.

Glenfield to Macarthur Corridor Integrated Transport Strategy
3 August 2015 Cardno 138
The analysis indicates that traffic demand is likely to increase in both directions along Hurley Street and Lindesay Street by approximately 200 vehicles per hour one-way in the Base Scenario between 2011 and 2036. The modelling report indicates that further analysis would be required to determine if the increase in traffic demand would result in a vast increase in traffic delay at intersections. Further traffic demands are projected on eastbound traffic on Narellan Road (which currently experiences heavy use) and is subject to an upgrade project.
An extension of Badgally Road to Broughton Street was identified as a potential option to provide direct access from the west into Campbelltown town centre, creating an additional rail line crossing. A 2036 Project Scenario model was undertaken to determine the traffic and transport impacts of this option. The analysis indicates that the extension of Badgally Road to Broughton Street is projected to draw 2,000 vehicles per two hours east bound and 1,500 vehicles per two hours westbound in the AM peak period – reversed in the PM.
The addition of the link between Badgally Road and Broughton Street is anticipated to reduce eastbound demand on Narellan Road by around 300 vehicles in two hours and westbound traffic by around 500 vehicles in two hours. While the link would ease demand on Narellan Road, the vehicles using the link would travel directly to the Campbelltown town centre. This opposes many of the planning strategies summarised in Section 2, has the potential to create amenity issues and does not encourage sustainable transport use.
It is recommended that detailed investigations should be undertaken to develop integrated options to alleviate congestion on Narellan Road and the wider Campbelltown CBD. This could involve the construction of the Badgally Road to Broughton Street link at Campbelltown as a transit and active transport link only
The 2036 Project Scenario was tested with the Badgally Road and Broughton Street link available to private vehicles. The modelling indicated that approximately 3,300 additional origin and destination trips per hour are anticipated in the AM peak and 3,000 in the PM peak period over 25 years. This is an increase of 1,550 and 1,150 vehicles in each AM and PM peak hour respectively above the natural growth scenario. This is further evidence of the need and opportunity to implement more sustainable transport options.
7.3.7 Macarthur
The 2036 Base Scenario indicates that the Macarthur precinct is to gain approximately 1,500 and 1,250 additional origin and destination trips per hour in the AM and PM peak periods respectively over 25 years.
The modelling indicated that there is increased traffic demand eastbound on Narellan Road by approximately 200 vehicles per hour west of Kellicar Road and over 300 vehicles per hour east of Kellicar Road in the Base Scenario between 2011 and 2036. Northbound traffic demands on Menangle Road show substantial increase (of approximately 500 vehicles per hour) into Macarthur which is likely to be driven by a combination of higher delays along Narellan Road and the introduction of Spring Farm Parkway to the south-east of Macarthur.
The analysis of the 2036 Project Scenario indicated that traffic demand is likely to be increased on Narellan Road. The extension of Badgally Road is likely to draw a minor amount of traffic from Narellan Road and therefore slightly increase capacity for traffic heading into Macarthur via Narellan Road. Furthermore, the model indicates that increased traffic is anticipated into Macarthur with the additional trip generation likely to create issues for access capacity and likely knock-on effects on other road users, including pedestrians, cyclists and buses. It is recommended that additional investigation and analysis is undertaken for access strategies for Macarthur and Campbelltown town centres (particularly from the west).
The 2036 Project Scenario anticipates that the additional pressure would be placed on key access routes of Narellan Road and Menangle Road given the relatively large land use increases within the centre. It is recommended that as major land use in Macarthur increases, further detailed analysis of their implications on access and circulation be undertaken.
The 2036 Project Scenario indicates that an approximate 4,750 and 5,000 origin and destination trips per hour are anticipated in the AM and PM peak periods respectively over 25 years. This is an increase of 3,250 and 3,750 vehicles in each AM and PM peak hour respectively above the already forecast growth scenario.

Glenfield to Macarthur Corridor Integrated Transport Strategy
3 August 2015 Cardno 139
7.4 Draft precinct structure plans The proposed structure plans for the Glenfield to Macarthur corridor are presented in the following sections. They indicate the proposed land uses and densities, the existing street network and the proposed new connections.

Glenfield to Macarthur Corridor Integrated Transport Strategy
3 August 2015 Cardno 140
7.4.1 Draft Glenfield Structure Plan
The draft Glenfield Structure Plan, shown in Figure 7-1, includes:
> Increase of land use density around the station on the eastern side.
> Increased permeability of street network.
> Potential link from Glenfield Road to Campbelltown Road.
> Maximisation of green corridors.
Figure 7-1 Draft Glenfield Structure Plan

Glenfield to Macarthur Corridor Integrated Transport Strategy
3 August 2015 Cardno 141
7.4.2 Draft Macquarie Fields Structure Plan
The draft Macquarie Fields Structure Plan, shown in Figure 7-2, includes:
> Increasing land use density around the station on the eastern side.
> More fine grained network with smaller block sizes.
> Additional creek crossing and maximisation of green corridors.
> Introduction of small amount of mixed retail/residential close to the station.
Figure 7-2 Draft Macquarie Fields Structure Plan

Glenfield to Macarthur Corridor Integrated Transport Strategy
3 August 2015 Cardno 142
7.4.3 Draft Ingleburn Structure Plan
The draft Ingleburn Structure Plan, shown in Figure 7-3, includes:
> Increasing land use density around the station.
> Introduction of residential and business park land uses on the western side of the railway line.
> Potential link from Williamson Road to Chester Road via Devon Road.
> A finer grained road network, particularly in the far eastern part of the precinct and directly to the west of the station.
Figure 7-3 Draft Ingleburn Structure Plan

Glenfield to Macarthur Corridor Integrated Transport Strategy
3 August 2015 Cardno 143
7.4.4 Draft Minto Structure Plan
The draft Minto Structure Plan, shown in Figure 7-4, includes:
> Increased residential density in the north-east of the precinct.
> Finer grain road network in the north-east of the precinct.
> Maintain key industrial land uses and freight connections to the west and south.
Figure 7-4 Draft Minto Structure Plan
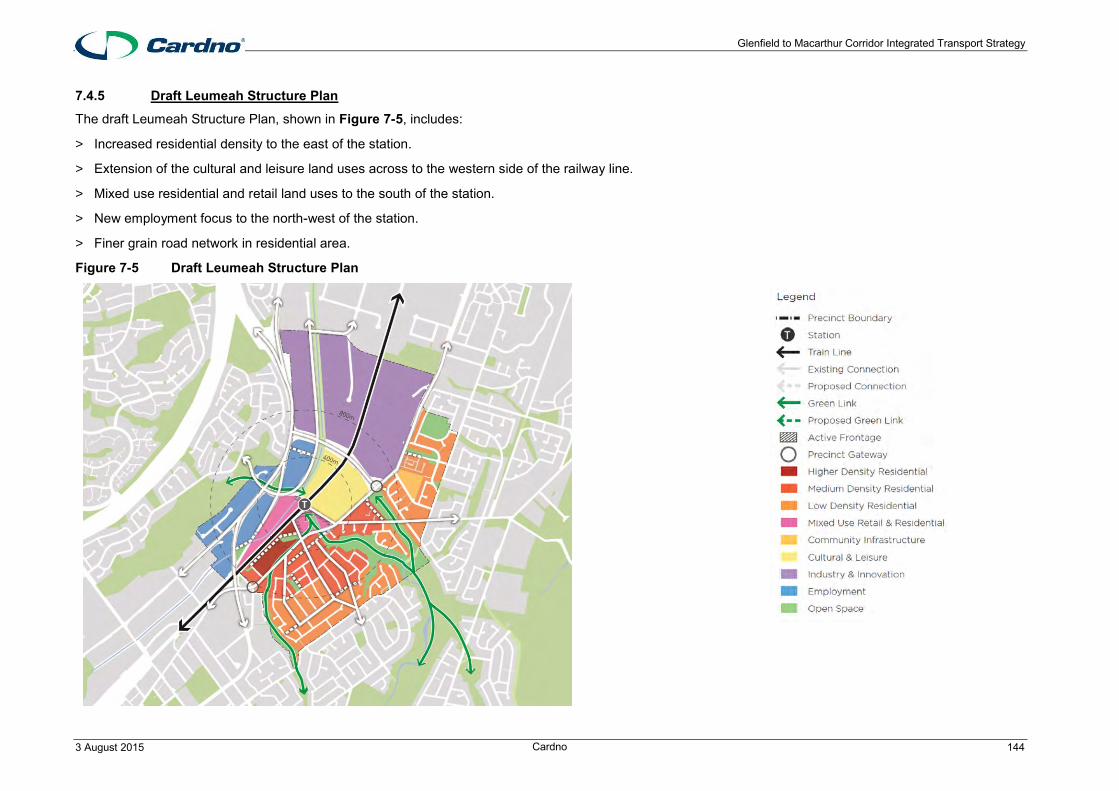
Glenfield to Macarthur Corridor Integrated Transport Strategy
3 August 2015 Cardno 144
7.4.5 Draft Leumeah Structure Plan
The draft Leumeah Structure Plan, shown in Figure 7-5, includes:
> Increased residential density to the east of the station.
> Extension of the cultural and leisure land uses across to the western side of the railway line.
> Mixed use residential and retail land uses to the south of the station.
> New employment focus to the north-west of the station.
> Finer grain road network in residential area.
Figure 7-5 Draft Leumeah Structure Plan
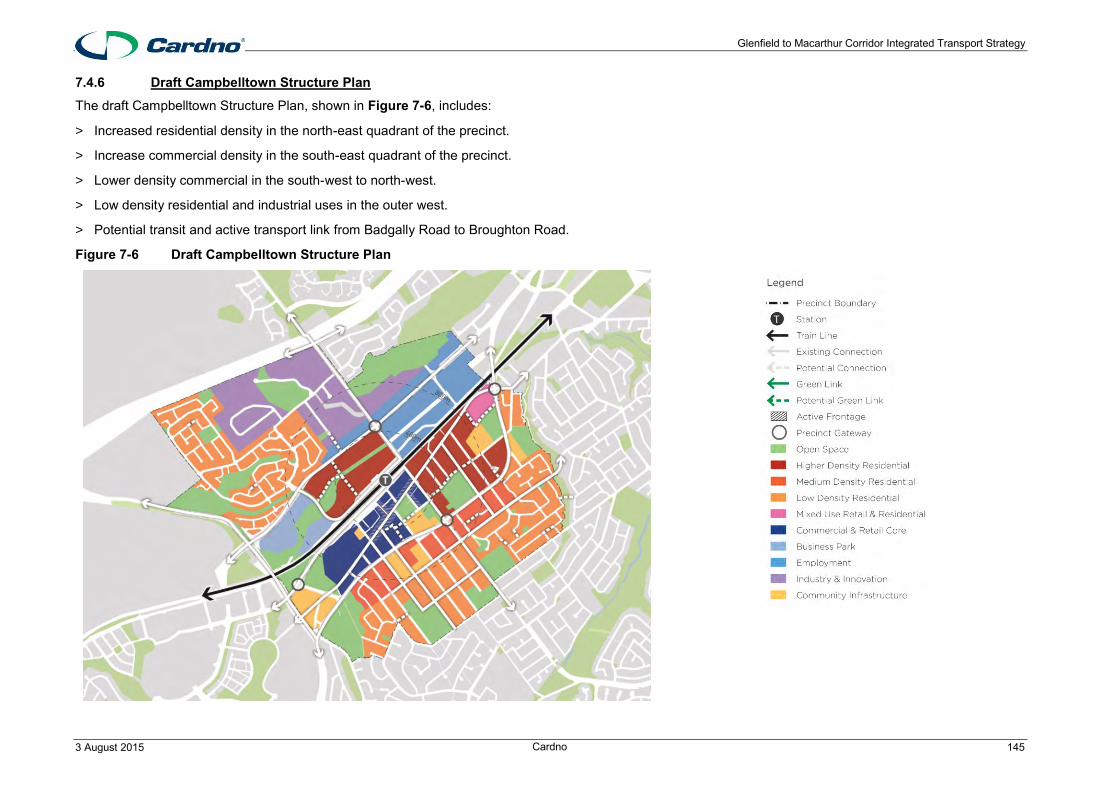
Glenfield to Macarthur Corridor Integrated Transport Strategy
3 August 2015 Cardno 145
7.4.6 Draft Campbelltown Structure Plan
The draft Campbelltown Structure Plan, shown in Figure 7-6, includes:
> Increased residential density in the north-east quadrant of the precinct.
> Increase commercial density in the south-east quadrant of the precinct.
> Lower density commercial in the south-west to north-west.
> Low density residential and industrial uses in the outer west.
> Potential transit and active transport link from Badgally Road to Broughton Road.
Figure 7-6 Draft Campbelltown Structure Plan

Glenfield to Macarthur Corridor Integrated Transport Strategy
3 August 2015 Cardno 146
7.4.7 Draft Macarthur Structure Plan
The draft Macarthur Structure Plan, shown in Figure 7-7, includes:
> Maintenance of most land uses in their current location.
> Addition of high density residential to the north of the station and low medium density residential to the west.
> New connections through large parcels of land, connecting the surrounding residential areas to the station and shopping centre.
> Potential transit link from Menangle Road to Camden Road.
> Maximisation of green corridors.
Figure 7-7 Draft Macarthur Structure Plan
Glenfield to Macarthur Corridor Integrated Transport Strategy
3 August 2015 Cardno 147
7.5 Key considerations The forecast population and employment growth in the Glenfield to Macarthur Corridor provides an insight into how the study area will growth over the next 25 years. Key considerations for the Integrated Transport Strategy include:
> The forecast population for the study area is estimated to increase between 2011 and 2036 by approximately 33,800 people, which represents an increase of 63% on 2011 population. Glenfield is expected to increase by 90% in population from 7,800 in 2011 to 14,900 in 2036 and Macarthur is expected to increase by more than two times the current population from 4,800 in 2011 to 12,200 in 2036. This forecast resident population growth will place a higher demand on transport networks and is likely to require a shift in transport mode choice to more efficient modes of transport such as walking, cycling and public transport.
> Using the same rate of resident workforce containment rates in 2011, the resident workforce (residents who live and work in the corridor) is forecast to grow from 26,900 in 2011 to 43,900 in 2036. The estimated increase in the available local workforce should be supported by employment self-containment; a key consideration is the provision of good local connections to centres and known employment areas to support this growth.
> Employment within the study area is expected to increase in the study area by 52% between 2011 and 2036. This rate of growth is below that of the forecast resident population, which suggests there will continue to be employment opportunities for people living in the area to gain employment closer to home. The development of new workplaces is an opportunity to form good transport habits early.
> The implications of the rezoning of industrial land to other uses needs to be analysed to determine the impact and displacement to the freight network.
> Proposed land use intensification needs to consider the future use of the rail corridor, particularly the amplification of railway lines and additional rail traffic and associated noise. Space to facilitate the amplification and an appropriate buffer must be maintained.
Glenfield to Macarthur Corridor Integrated Transport Strategy
3 August 2015 Cardno 148
8 Constraints and opportunities
Transport constraints and opportunities for the Glenfield to Macarthur Corridor were identified through the background review, travel demand and population analysis and assessment of the existing and future transport networks. There are many opportunities to improve the transport network which would support and be justified by the land use change concepts of the structure plans developed for the precincts in the corridor.
A summary of these constraints and opportunities is set out in Table 8-1 and Table 8-2. The constraints and opportunities are presented by mode, along with general and travel demand issues, and opportunities with land use changes.
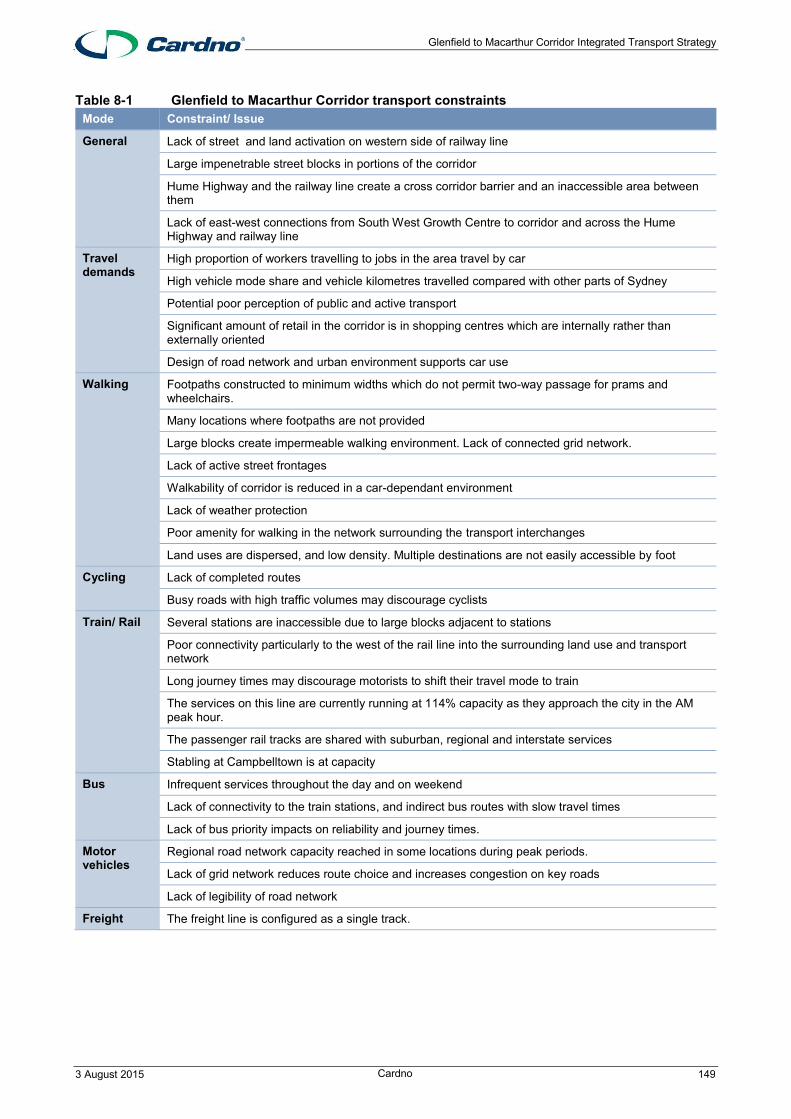
Glenfield to Macarthur Corridor Integrated Transport Strategy
3 August 2015 Cardno 149
Table 8-1 Glenfield to Macarthur Corridor transport constraints Mode Constraint/ Issue
General Lack of street and land activation on western side of railway line
Large impenetrable street blocks in portions of the corridor
Hume Highway and the railway line create a cross corridor barrier and an inaccessible area between them
Lack of east-west connections from South West Growth Centre to corridor and across the Hume Highway and railway line
Travel demands
High proportion of workers travelling to jobs in the area travel by car
High vehicle mode share and vehicle kilometres travelled compared with other parts of Sydney
Potential poor perception of public and active transport
Significant amount of retail in the corridor is in shopping centres which are internally rather than externally oriented
Design of road network and urban environment supports car use
Walking
Footpaths constructed to minimum widths which do not permit two-way passage for prams and wheelchairs.
Many locations where footpaths are not provided
Large blocks create impermeable walking environment. Lack of connected grid network.
Lack of active street frontages
Walkability of corridor is reduced in a car-dependant environment
Lack of weather protection
Poor amenity for walking in the network surrounding the transport interchanges
Land uses are dispersed, and low density. Multiple destinations are not easily accessible by foot
Cycling Lack of completed routes
Busy roads with high traffic volumes may discourage cyclists
Train/ Rail Several stations are inaccessible due to large blocks adjacent to stations
Poor connectivity particularly to the west of the rail line into the surrounding land use and transport network
Long journey times may discourage motorists to shift their travel mode to train
The services on this line are currently running at 114% capacity as they approach the city in the AM peak hour.
The passenger rail tracks are shared with suburban, regional and interstate services
Stabling at Campbelltown is at capacity
Bus
Infrequent services throughout the day and on weekend
Lack of connectivity to the train stations, and indirect bus routes with slow travel times
Lack of bus priority impacts on reliability and journey times.
Motor vehicles
Regional road network capacity reached in some locations during peak periods.
Lack of grid network reduces route choice and increases congestion on key roads
Lack of legibility of road network
Freight The freight line is configured as a single track.
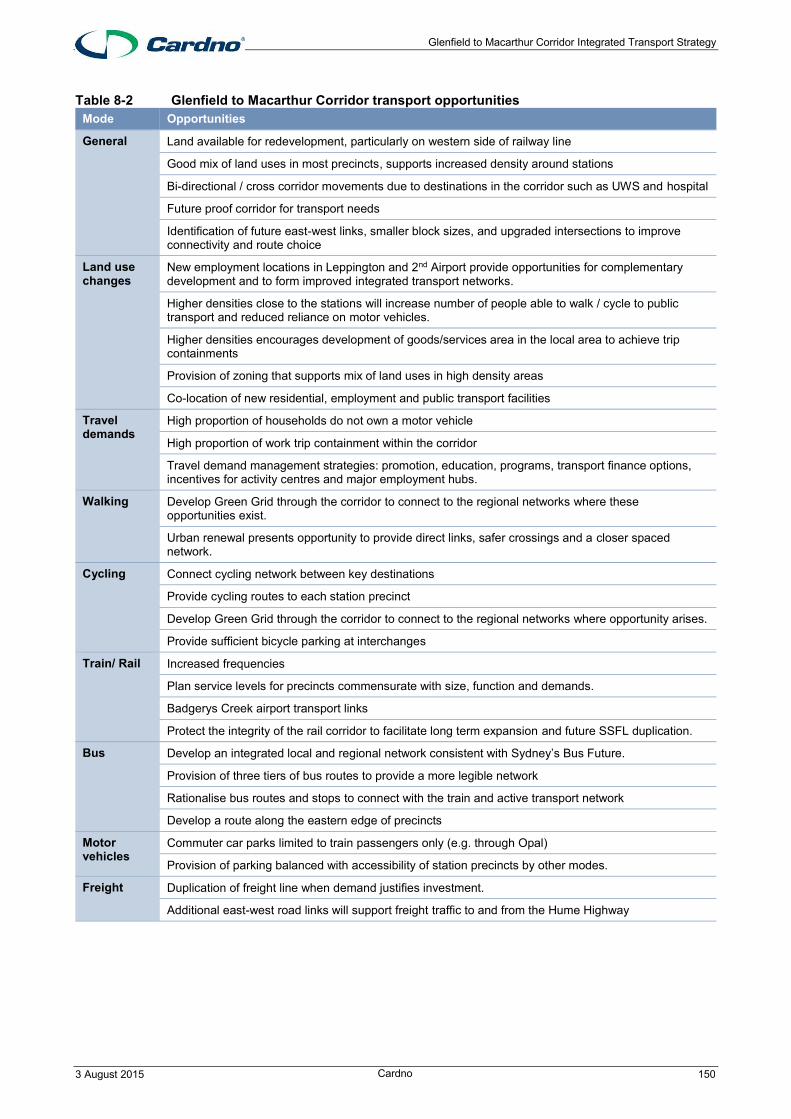
Glenfield to Macarthur Corridor Integrated Transport Strategy
3 August 2015 Cardno 150
Table 8-2 Glenfield to Macarthur Corridor transport opportunities Mode Opportunities
General Land available for redevelopment, particularly on western side of railway line
Good mix of land uses in most precincts, supports increased density around stations
Bi-directional / cross corridor movements due to destinations in the corridor such as UWS and hospital
Future proof corridor for transport needs
Identification of future east-west links, smaller block sizes, and upgraded intersections to improve connectivity and route choice
Land use changes
New employment locations in Leppington and 2nd Airport provide opportunities for complementary development and to form improved integrated transport networks.
Higher densities close to the stations will increase number of people able to walk / cycle to public transport and reduced reliance on motor vehicles.
Higher densities encourages development of goods/services area in the local area to achieve trip containments
Provision of zoning that supports mix of land uses in high density areas
Co-location of new residential, employment and public transport facilities
Travel demands
High proportion of households do not own a motor vehicle
High proportion of work trip containment within the corridor
Travel demand management strategies: promotion, education, programs, transport finance options, incentives for activity centres and major employment hubs.
Walking Develop Green Grid through the corridor to connect to the regional networks where these opportunities exist.
Urban renewal presents opportunity to provide direct links, safer crossings and a closer spaced network.
Cycling Connect cycling network between key destinations
Provide cycling routes to each station precinct
Develop Green Grid through the corridor to connect to the regional networks where opportunity arises.
Provide sufficient bicycle parking at interchanges
Train/ Rail Increased frequencies
Plan service levels for precincts commensurate with size, function and demands.
Badgerys Creek airport transport links
Protect the integrity of the rail corridor to facilitate long term expansion and future SSFL duplication.
Bus Develop an integrated local and regional network consistent with Sydney’s Bus Future.
Provision of three tiers of bus routes to provide a more legible network
Rationalise bus routes and stops to connect with the train and active transport network
Develop a route along the eastern edge of precincts
Motor vehicles
Commuter car parks limited to train passengers only (e.g. through Opal)
Provision of parking balanced with accessibility of station precincts by other modes.
Freight Duplication of freight line when demand justifies investment.
Additional east-west road links will support freight traffic to and from the Hume Highway

Glenfield to Macarthur Corridor Integrated Transport Strategy
3 August 2015 Cardno 151
9 Corridor objectives and recommendations
The purpose of this strategy is to develop a concept transport network and complementary initiatives that support a proposed increase in population and employment in the corridor. The corridor has diverse characteristics and as a result a diverse set of transport requirements for both people and freight.
The provision of high quality active and public transport combined with development intensification near the existing transport hubs will support an increase in population while reducing the reliance and impact of more private vehicles on the regions road network.
The industrial and employment land uses and their intensification will continue to rely on and place higher demands on the freight transport network. It is essential to provide the capacity to accommodate these demands to support economic and employment growth in the region.
To ensure that planning and investment for the transport network through the Glenfield to Macarthur Corridor is targeted, addresses the areas of highest priority and addresses the current and future transport demands, a set of strategic objectives is proposed. The objectives provide a framework for achieving an efficient and supportive transport system for the residents, workers, students, visitors and freight in the Glenfield to Macarthur Corridor.
9.1 Strategic transport objectives The strategic transport objectives for the Glenfield to Macarthur Corridor were developed to align with the NSW Government’s Long Term Transport Master Plan (LTTMP) objectives and the goals of A Plan for Growing Sydney.
The LTTMP’s broad objectives for delivery of an integrated transport network for NSW are presented in Table 9-1 and the four strategic goals from A Plan for Growing Sydney are presented in Table 9-2. The proposed strategic transport objectives for the Glenfield to Macarthur Corridor directly relate to the eight objective areas from the LTTMP and support the Goals 1 and 3 from A Plan for Growing Sydney. The strategic transport objectives for the corridor as a whole are presented in Table 9-3 and specific strategic precinct objectives are also detailed in Section 9.2.
Table 9-1 NSW Long Term Transport Master Plan objectives Objective Description
Improve quality of service By putting the customer at the centre of transport planning and service delivery, improving the quality of travel experiences, offering more travel choices and providing integrated services that directly meet travel requirements.
Improve liveability By improving connectivity, customer service and ease of movement in our major cities and activity centres.
Support economic growth and productivity
By providing a transport system that responds directly to customer needs, is more efficient, increases freight efficiency and improves the connectivity and accessibility of people to other people, opportunities, goods and services.
Support regional development
By improving accessibility to jobs, services and people, improving freight connections to markets and providing better links between clusters of business activity.
Improve safety and security By placing a high priority on addressing the causes and risks of transport accidents and security incidents.
Reduce social disadvantage By reducing transport disadvantage through improved access to goods, services and employment and education opportunities for people across all parts of the State.
Improve sustainability By optimising the use of the transport network, increasing mass transit capacity, growing the proportion of travel by sustainable modes such as public transport, walking and cycling, becoming more energy efficient and the use of higher capacity freight vehicles.
Strengthen transport planning processes
By making improvement to integrated transport planning processes and identifying areas where evidence should be collated for future decision making and continually improving governance and administration of the transport system.
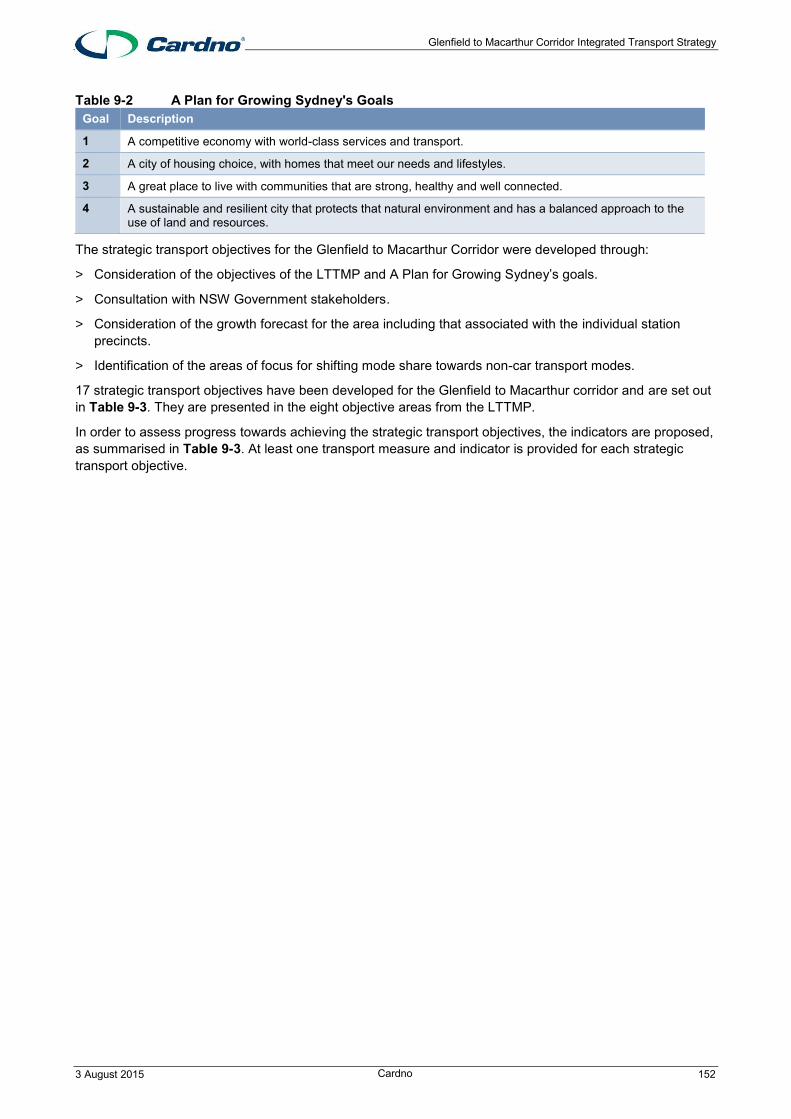
Glenfield to Macarthur Corridor Integrated Transport Strategy
3 August 2015 Cardno 152
Table 9-2 A Plan for Growing Sydney's Goals Goal Description
1 A competitive economy with world-class services and transport.
2 A city of housing choice, with homes that meet our needs and lifestyles.
3 A great place to live with communities that are strong, healthy and well connected.
4 A sustainable and resilient city that protects that natural environment and has a balanced approach to the use of land and resources.
The strategic transport objectives for the Glenfield to Macarthur Corridor were developed through:
> Consideration of the objectives of the LTTMP and A Plan for Growing Sydney’s goals.
> Consultation with NSW Government stakeholders.
> Consideration of the growth forecast for the area including that associated with the individual station precincts.
> Identification of the areas of focus for shifting mode share towards non-car transport modes.
17 strategic transport objectives have been developed for the Glenfield to Macarthur corridor and are set out in Table 9-3. They are presented in the eight objective areas from the LTTMP.
In order to assess progress towards achieving the strategic transport objectives, the indicators are proposed, as summarised in Table 9-3. At least one transport measure and indicator is provided for each strategic transport objective.

Glenfield to Macarthur Corridor Integrated Transport Strategy
3 August 2015 Cardno 153
Table 9-3 Strategic transport objectives, measures and indicators for the Glenfield to Macarthur Corridor Objective area # Objective # Measure/Action Indicator Relevant
mode
Improve quality of service
1 Improve competitiveness and attractiveness of public transport
1.1
Increase number of express train services that stop at key employment and residential precincts in the AM and PM peak and implement supporting public transport connections and commuter parking in strategic locations.
Peak period patronage Train
Journey to Work mode share Train
2 Improve reliability and reduce waiting times for public transport
2.1
Improve train service frequency to all stations through the corridor in off-peak periods to increase attractiveness of the train service all day.
Off-peak period patronage Train
Household Travel Survey mode share
Train
2.2 Improve bus services through provision of a suburban bus route along eastern corridor of precincts with increased frequencies and bus priority.
Travel times Bus
2.3 Increase reliability of bus services through provision of bus priority and route amendments through congested intersections.
Travel times Bus
3 Improve the customer experience for public transport journeys
3.1
Support precinct legibility through provision of wayfinding signage from, to and through each transport interchange to connect with other transport modes and key destinations.
Number of complaints received and addressed
Public transport
Time taken to interchange between transport modes
Public transport
Wayfinding audit of area Walking and cycling
Improve liveability
4 Encourage people to walk and cycle more
4.1
Encourage healthy and active lifestyles through provision of safe, direct and legible infrastructure for walking and cycling, including high quality paths linking to green spaces and cycle parking and other end-of-trip facilities at key destinations.
Demand for and number of cycle parking spaces
Cycling
Cycling and pedestrian counts Walking and cycling
4.2 Reduce the high reliance on motor vehicles for travel to jobs in the corridor by identifying walking routes and provide safe facilities from each train station to employment districts in the precincts.
Journey to Work mode share Walking

Glenfield to Macarthur Corridor Integrated Transport Strategy
3 August 2015 Cardno 154
Objective area # Objective # Measure/Action Indicator Relevant mode
4.3 Enhance pedestrian connectivity by providing additional pedestrian links from residential areas to station precincts.
Walking catchment sizes Walking
4.4 Increase cycling safety and attractiveness by providing a safe and direct off-road cycling route through the corridor that parallels the railway line and has good connections to destinations in the precincts.
Mode share, satisfaction surveys Off-road cycling catchment size
Cycling
4.5 Improve direct and convenient access for pedestrians and cyclists to each station by reducing the block sizes on the western side of the railway line.
Size of walking and cycling catchments to train stations
Walking and cycling
5 Increase density in key transport locations
5.1 Support higher density development (residential, commercial and mixed use) close to transport interchanges to encourage trip self-containment and higher active and public transport use.
Mix of land uses close to train stations
Land use
5.2 Consolidate commuter parking into single site multi-storey car parks to reduce the amount of at-grade parking and allow redevelopment of sites adjacent to the stations.
Proportion of at-grade parking versus multi-storey commuter parking
Private vehicles
6 Improve street legibility for all modes of transport
6.1 Establish a coherent street network throughout the corridor with defined function, hierarchy and modal priority that is appropriate for the mix of land uses. Active and public transport modes should be prioritised close to stations. This includes applying the Metropolitan Road Freight Hierarchy on applicable roads.
Transport network hierarchy All
Support regional development
7 Minimise through traffic in local and industrial areas.
7.1 For residential zones, minimise through traffic and road freight from local vehicle trips and public transport services by reducing the attractiveness of local roads to through traffic while recognising that some freight trips must access local areas.
Proportion of traffic on a road that is through traffic and that which is for access, measured with Origin-Destination surveys
Private vehicles, freight
8 Optimise use of station supporting facilities
8.1 Support shared use of transport facilities such as commuter parking with other uses to increase efficiency of infrastructure.
Parking occupancy during non-commuting periods
Private vehicles
9 9.1
Implement priority measures to improve reliability and dedicated facilities for freight movement, including rail
Travel times Freight
Volume of freight Freight
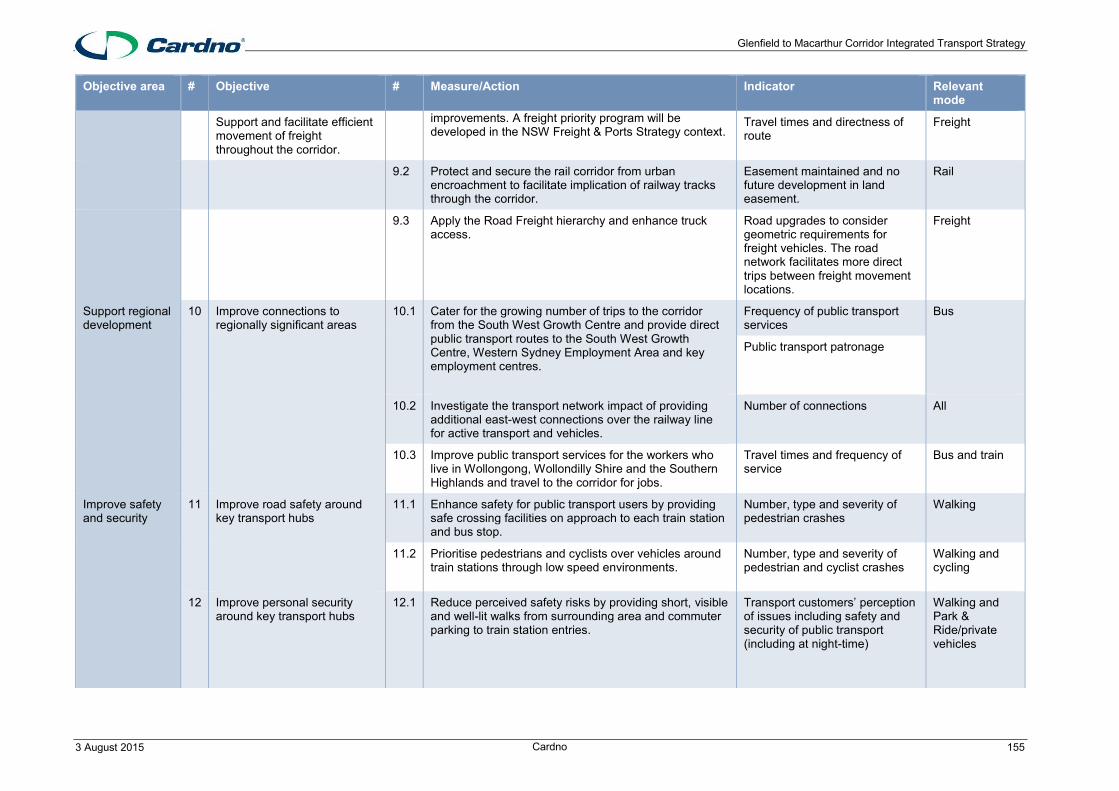
Glenfield to Macarthur Corridor Integrated Transport Strategy
3 August 2015 Cardno 155
Objective area # Objective # Measure/Action Indicator Relevant mode
Support and facilitate efficient movement of freight throughout the corridor.
improvements. A freight priority program will be developed in the NSW Freight & Ports Strategy context.
Travel times and directness of route
Freight
9.2 Protect and secure the rail corridor from urban encroachment to facilitate implication of railway tracks through the corridor.
Easement maintained and no future development in land easement.
Rail
9.3 Apply the Road Freight hierarchy and enhance truck access.
Road upgrades to consider geometric requirements for freight vehicles. The road network facilitates more direct trips between freight movement locations.
Freight
Support regional development
10 Improve connections to regionally significant areas
10.1
Cater for the growing number of trips to the corridor from the South West Growth Centre and provide direct public transport routes to the South West Growth Centre, Western Sydney Employment Area and key employment centres.
Frequency of public transport services
Bus
Public transport patronage
10.2 Investigate the transport network impact of providing additional east-west connections over the railway line for active transport and vehicles.
Number of connections All
10.3 Improve public transport services for the workers who live in Wollongong, Wollondilly Shire and the Southern Highlands and travel to the corridor for jobs.
Travel times and frequency of service
Bus and train
Improve safety and security
11 Improve road safety around key transport hubs
11.1 Enhance safety for public transport users by providing safe crossing facilities on approach to each train station and bus stop.
Number, type and severity of pedestrian crashes
Walking
11.2 Prioritise pedestrians and cyclists over vehicles around train stations through low speed environments.
Number, type and severity of pedestrian and cyclist crashes
Walking and cycling
12 Improve personal security around key transport hubs
12.1
Reduce perceived safety risks by providing short, visible and well-lit walks from surrounding area and commuter parking to train station entries.
Transport customers’ perception of issues including safety and security of public transport (including at night-time)
Walking and Park & Ride/private vehicles

Glenfield to Macarthur Corridor Integrated Transport Strategy
3 August 2015 Cardno 156
Objective area # Objective # Measure/Action Indicator Relevant mode
Number of theft or attacks Walking and Park & Ride/private vehicles
12.2
Reduce personal security concerns through making waiting areas associated with bus stops, taxi and Kiss & Ride safe environments, particularly at night time.
Transport customers’ perception of issues including safety and security of public transport (including at night-time)
All
Number of theft or attacks All
Reduce social disadvantage
13 Maximise integration with land use and other transport modes
13.1 Improve public transport coverage by ensuring most corridor residents and workplaces be within 400 metres of a convenient public transport service.
Percentages of dwellings and workplaces within 400 metres (5-minute walk) of a public transport service
Public transport, walking
13.2
Integrate public transport modes by providing bus services to connect outer eastern parts of precincts with the train network and to align with train services.
Time taken to interchange between transport modes
Public transport
Total travel time on public transport
Public transport
14 Support positive provision for accessibility and active transport
14.1
Provide equitable access by ensuring all transport infrastructure and new developments are fully accessible by mobility-impaired and sight-impaired people. Specifically, provide an accessibility upgrade at Macquarie Fields Station.
Compliance with the Disability Discrimination Act
Public transport
Satisfaction of mobility-impaired and vision-impaired people
Public transport
14.2 Enhance impact of road upgrade projects by incorporating bus priority and active transport infrastructure such as separated bike lanes.
Proportion of road upgrades which incorporate bus priority and active transport facilities
Bus, walking, cycling
Improve sustainability
15 Reduce reliance on private motor vehicle
15.1 Enhance the amenity of the university and TAFE areas and provide attractive active transport links between the
Pedestrian and cyclist counts Walking, cycling

Glenfield to Macarthur Corridor Integrated Transport Strategy
3 August 2015 Cardno 157
Objective area # Objective # Measure/Action Indicator Relevant mode
tertiary institutions in Macarthur and Campbelltown Hospital.
15.2 Support trip containment and reduce the need to travel by locating complementary land uses close to each other, e.g. new residential close to essential retail/other services, and to varied employment opportunities.
Vehicle kilometres travelled Private vehicle, walking, cycling
15.3 Reduce the vehicle kilometres travelled by implementing travel demand management strategies.
Vehicle kilometres travelled All
15.4 Reduce traffic congestion through provision of real and convenient transport alternatives to private vehicles for short trips within the corridor.
Household Travel Survey mode share
All
Strengthen transport planning processes
16 Support collaboration with the business community, Council and NSW Government to improve transport for all stakeholders
16.1 Work with businesses, Council and transport operators to achieve an integrated transport network that addresses all customer needs.
Feedback from stakeholders on planning process
All
16.2 Better integrate train stations with each precinct’s activity hub or economic centre.
Proportion of active street frontages associated with stations
All
17 Develop controls that support walking, cycling and public transport
17.1 Require non industrial new developments to contribute to attractive and safe street environment for pedestrians, cyclists and public transport customers with active street frontages, permeable blocks and human scale buildings.
Level of engagement with and contribution to new development plans
All
17.2
Establish appropriate parking supply rates and parking policy to align with transport objectives for the precinct.
Number of spaces for car share, carpooling, motorbikes
Private vehicles
Demand for and number of parking spaces
Private vehicles

Glenfield to Macarthur Corridor Integrated Transport Strategy
3 August 2015 Cardno 158
9.2 Recommended improvements The corridor is located in an area where natural growth is anticipated and significant regional development is planned in the surrounding areas. This proposed integrated transport network accounts for forecast growth within the area and supports major employment locations, and known travel patterns within the study area. These factors are used to identify strategic and precinct level opportunities for transport improvements to support proposed growth.
This section is structured into regional improvements and precinct level improvements. These enhancements have been developed to create and support liveable communities and to achieve the objectives of the study area set in Section 9.1. This section details improvements to cycling, rail, freight, bus and road networks to enhance the study area’s transport options and self-containment.
9.2.1 Policy and planning
Policy and planning interventions for transport and land use can enable positive change through developing a framework of principles and rationale for increasing walking, cycling and public transport use. Policy and planning enhancements may include subjective/ qualitative and objective/ quantitative principles to allow government and the private sector to better understand expectations.
The study area has seven of distinct precincts, all of which have different characteristics, land use mix and demographics. There are however commonalities for transport and land use improvements to sustain residential and employment growth. The list below outlines these objectives, measures/actions and recommendations for the study area as identified in Table 9-3.
Objective 4 Encourage people to walk and cycle more
Measure/ action 4.1
Encourage healthy and active lifestyles through provision of safe, direct and legible infrastructure for walking and cycling, including high quality paths linking to green spaces and cycle parking and other end-of-trip facilities at key destinations.
Recommendations 1. Complete a walking plan and cycling plan for the local government area (LGA). These plans should identify regional and local networks, infrastructure requirements, end of trip facilities and implementation priorities. It is likely these plans would be in the form of a Pedestrian Access and Mobility Plan(s) (PAMP) and a Bike Plan(s).
2. Investigate 40km/h High Pedestrian Activity Areas around railway stations and town centres to improve safety and amenity for people walking, cycling and using public transport.
Objective 5 Increase density in key transport locations
Measure/ action 5.1
Support higher density development (residential, commercial and mixed use) close to transport interchanges to encourage trip self-containment and higher active and public transport use
Recommendations 1. Identify areas within close proximity of key transport hubs that would encourage self-containment of trips, walking, cycling and public transport use. In general this would be areas within 800 metres of train stations.
2. Develop strategic land use, density and associated controls to encourage organic sustainable growth within the study area
3. Balance with the need to provide a buffer zone from freight precincts and the railway lines to maintain the option to amplify the railway tracks in the future and for noise and vibration considerations.
Measure/ action 5.2
To consolidate commuter parking into single site multi-storey car parks to reduce the amount of at-grade parking and allow redevelopment of sites adjacent to the stations.
Recommendations 1. Encourage the efficient use of parking and consolidation of parking into single lot parking structures within each precinct. This is particularly relevant for higher demand areas, such as Campbelltown and Ingleburn. It is also recommended an economic feasibility analysis is completed to inform the timing and measures to enable this to occur.
2. Maintain a balance of parking that encourages growth, however does not significantly reduce the viability of development in key locations.

Glenfield to Macarthur Corridor Integrated Transport Strategy
3 August 2015 Cardno 159
Objective 10 Improve connections to regionally significant areas
Measure/ action 10.1
Cater for the growing number of trips to the corridor from the South West Growth Centre and provide direct public transport routes to the South West Growth Centre, Western Sydney Employment Area and key employment centres.
Recommendation 1. The NSW Government and local governments work with residents and the business community to plan for regional transport connections to key employment areas within the surrounding region. This could include:
Update structure plans for the North West and South West Growth Centres to realise the full potential of investment in new infrastructure;
Continue rezoning land in the North West and South West Growth Centres to maintain a steady supply of greenfield sites for development; and
Co-ordinate and deliver enabling infrastructure at the local level to assist the conversion of zoned land into homes.
Objective 14 Support positive provision for accessibility and active transport
Measure/ action 14.1
Provide equitable access by ensuring all transport infrastructure and new developments are fully accessible by mobility-impaired and sight-impaired people
Recommendation All new and amended public infrastructure to provide accessibility for people with a disability. It is noted this is a current legislative requirement under the Disability Discrimination Act, however there are significant barriers within the community to accessing and using walking and cycling routes and public transport. Specifically, provide an accessibility upgrade at Macquarie Fields Station. This will continue to become a more significant issue as Sydney’s population ages and becomes more sensitive to infrastructure deficiencies.
Measure/ action 14.2
Enhance impact of road upgrade projects by incorporating bus priority and active transport infrastructure such as separated bike lanes
Recommendation 1. Ensure new roads and road upgrades plan, design and deliver: Public transport priority along key public transport routes; and Active transport facilities to minimum Austroads Guidelines and according to
preferences identified in Sydney’s Walking and Cycling Future. Set a minimum criteria for active transport, for example footpaths shall be provided on one side of a road for local roads and on both sides of the road for identified key connections.
Objective 15 Reduce reliance on private motor vehicle
Measure/ action 15.2
Support trip containment and reduce the need to travel by locating complementary land uses close to each other, e.g. new residential close to essential retail/other services, and to varied employment opportunities
Recommendations 1. Support the structure plans which propose to increase land use variety and density close to existing transport hubs.
2. Develop strategic land use, density and associated controls are developed to encourage sustainable growth within the study area
Measure/ action 15.3
Reduce the vehicle kilometres travelled by implementing travel demand management strategies
Recommendation 1. Improve public transport access, frequency, trip time and reliability to increase public transport patronage. These measures must be supported by promotional material, sustainable/green transport plans and formal planning controls. Ensure that rezonings and large employment regions are required to develop sustainable/green transport plans that accompany applications
Objective 16 Support collaboration with the business community, Council and NSW Government to improve transport for all stakeholders
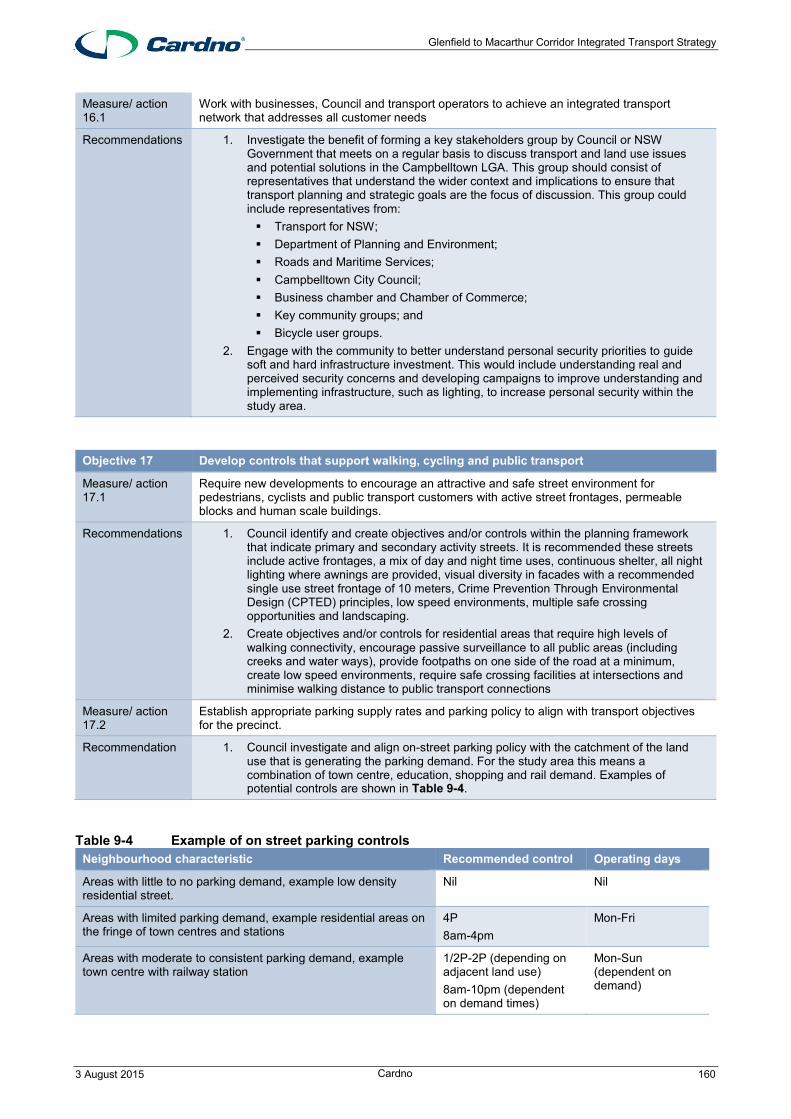
Glenfield to Macarthur Corridor Integrated Transport Strategy
3 August 2015 Cardno 160
Measure/ action 16.1
Work with businesses, Council and transport operators to achieve an integrated transport network that addresses all customer needs
Recommendations 1. Investigate the benefit of forming a key stakeholders group by Council or NSW Government that meets on a regular basis to discuss transport and land use issues and potential solutions in the Campbelltown LGA. This group should consist of representatives that understand the wider context and implications to ensure that transport planning and strategic goals are the focus of discussion. This group could include representatives from: Transport for NSW; Department of Planning and Environment; Roads and Maritime Services; Campbelltown City Council; Business chamber and Chamber of Commerce; Key community groups; and Bicycle user groups.
2. Engage with the community to better understand personal security priorities to guide soft and hard infrastructure investment. This would include understanding real and perceived security concerns and developing campaigns to improve understanding and implementing infrastructure, such as lighting, to increase personal security within the study area.
Objective 17 Develop controls that support walking, cycling and public transport
Measure/ action 17.1
Require new developments to encourage an attractive and safe street environment for pedestrians, cyclists and public transport customers with active street frontages, permeable blocks and human scale buildings.
Recommendations 1. Council identify and create objectives and/or controls within the planning framework that indicate primary and secondary activity streets. It is recommended these streets include active frontages, a mix of day and night time uses, continuous shelter, all night lighting where awnings are provided, visual diversity in facades with a recommended single use street frontage of 10 meters, Crime Prevention Through Environmental Design (CPTED) principles, low speed environments, multiple safe crossing opportunities and landscaping.
2. Create objectives and/or controls for residential areas that require high levels of walking connectivity, encourage passive surveillance to all public areas (including creeks and water ways), provide footpaths on one side of the road at a minimum, create low speed environments, require safe crossing facilities at intersections and minimise walking distance to public transport connections
Measure/ action 17.2
Establish appropriate parking supply rates and parking policy to align with transport objectives for the precinct.
Recommendation 1. Council investigate and align on-street parking policy with the catchment of the land use that is generating the parking demand. For the study area this means a combination of town centre, education, shopping and rail demand. Examples of potential controls are shown in Table 9-4.
Table 9-4 Example of on street parking controls Neighbourhood characteristic Recommended control Operating days
Areas with little to no parking demand, example low density residential street.
Nil Nil
Areas with limited parking demand, example residential areas on the fringe of town centres and stations
4P 8am-4pm
Mon-Fri
Areas with moderate to consistent parking demand, example town centre with railway station
1/2P-2P (depending on adjacent land use) 8am-10pm (dependent on demand times)
Mon-Sun (dependent on demand)

Glenfield to Macarthur Corridor Integrated Transport Strategy
3 August 2015 Cardno 161
A balanced approach must be taken for on-street parking to cater for differing needs, including residents, businesses, visitors and commuters. As a result it is recommended that some all-day parking is retained in residential areas to balance all needs. It is recommended a parking study be undertaken when considering area parking controls to ensure appropriate controls are implemented.
In areas of low density, parking for commuters can be used to encourage the use of rail, however this may also reduce the viability of bus usage within the local area.
2) Commuter car parking to be owned and operated by TfNSW as an important asset for Park & Ride. Often these facilities are located within close proximity to other high demand land uses, such as a shopping centre. In these locations it is crucial that the parking provided is used by commuters and not occupied by people driving to work in the local area or to complete a single shopping trip in peak commuter periods.
It is recommended that car parking areas with high demand are investigated for potential for increased management measures. These car parks could be integrated with the Opal card system and provide free parking for Park & Ride commuters who live beyond an 800m catchment of any station or have special needs. This would be detected when the person taps on at the station, providing free parking, and charge commercial rates for people who do not transition onto a public transport service.
3) Monitor parking requirements for development in the study area over the short, medium and long term to understand market trends and reduced parking rate feasibility. Parking associated within a development is a long term infrastructure facility, with most buildings remaining for decades prior to major building works or redevelopment. It is for this reason that parking separate from a buildings can create the short term flexibility to encourage growth and in the longer term provide the opportunity to reassess parking requirements at a precinct level. It is recommended that:
> Initiatives are investigated to decouple development parking provision from on-site and promote sharing of facilities;
> Car share within developments is investigated for feasibility and potential rates; and
> A reduction in parking rates near railways station and town centres is investigated.
The recommendations within this section seek to create medium and long term initiatives that will support the growth of the study area while encouraging a mode shift to walking, cycling and public transport. Some of the recommended actions require detailed investigation to understand the effects on potential development, economic performance and business feasibility. In particular, any area parking or development parking rate amendments will require analysis to clearly articulate short, medium and long term benefits.
9.2.2 Active Transport
Walking and cycling is an easy way to travel for short trips; it is healthy, quick, environmentally friendly and flexible in route choice. The following objectives and measures are related to active transport.
Objective 3 Improve the customer experience for public transport journeys
Measure/ action 3.1
Support precinct legibility through provision of wayfinding signage from, to and through each transport interchange to connect with other transport modes and key destinations.
Recommendation Complete a wayfinding audit for walking and cycling wayfinding signage at each precinct. Upon completion of the audit install wayfinding signage installed to guide people walking and cycling where key destinations are located.
Objective 4 Encourage people to walk and cycle more
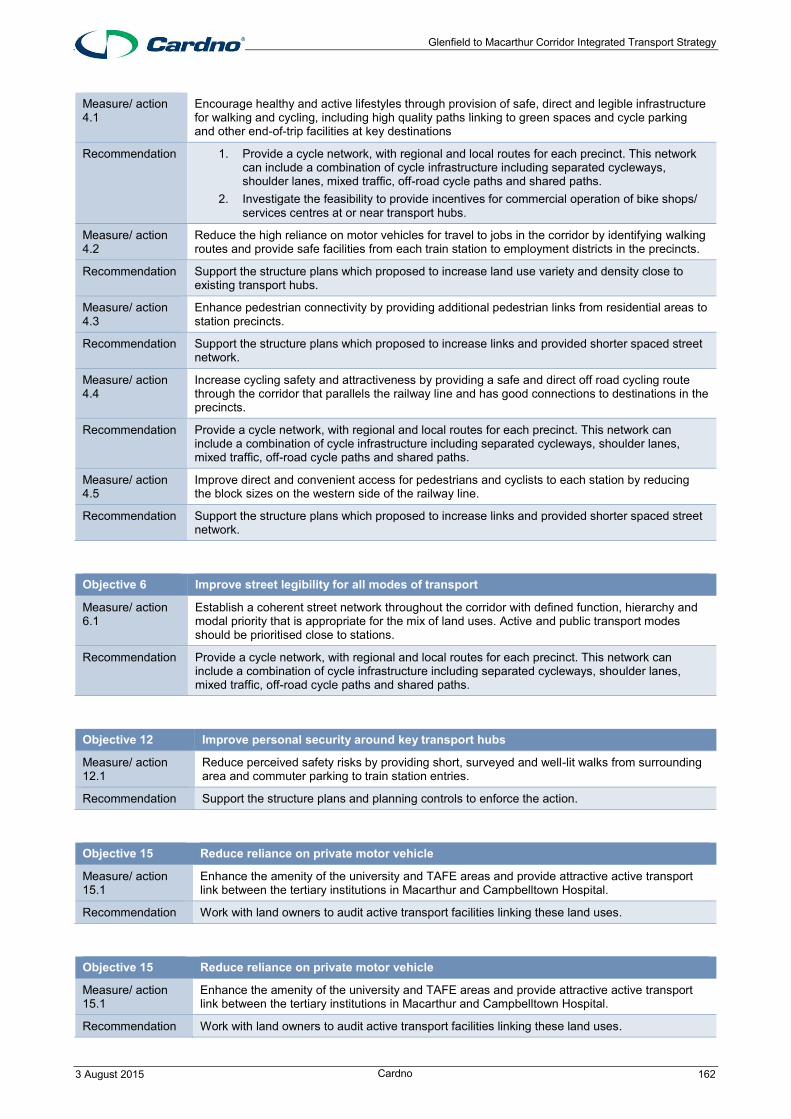
Glenfield to Macarthur Corridor Integrated Transport Strategy
3 August 2015 Cardno 162
Measure/ action 4.1
Encourage healthy and active lifestyles through provision of safe, direct and legible infrastructure for walking and cycling, including high quality paths linking to green spaces and cycle parking and other end-of-trip facilities at key destinations
Recommendation 1. Provide a cycle network, with regional and local routes for each precinct. This network can include a combination of cycle infrastructure including separated cycleways, shoulder lanes, mixed traffic, off-road cycle paths and shared paths.
2. Investigate the feasibility to provide incentives for commercial operation of bike shops/ services centres at or near transport hubs.
Measure/ action 4.2
Reduce the high reliance on motor vehicles for travel to jobs in the corridor by identifying walking routes and provide safe facilities from each train station to employment districts in the precincts.
Recommendation Support the structure plans which proposed to increase land use variety and density close to existing transport hubs.
Measure/ action 4.3
Enhance pedestrian connectivity by providing additional pedestrian links from residential areas to station precincts.
Recommendation Support the structure plans which proposed to increase links and provided shorter spaced street network.
Measure/ action 4.4
Increase cycling safety and attractiveness by providing a safe and direct off road cycling route through the corridor that parallels the railway line and has good connections to destinations in the precincts.
Recommendation Provide a cycle network, with regional and local routes for each precinct. This network can include a combination of cycle infrastructure including separated cycleways, shoulder lanes, mixed traffic, off-road cycle paths and shared paths.
Measure/ action 4.5
Improve direct and convenient access for pedestrians and cyclists to each station by reducing the block sizes on the western side of the railway line.
Recommendation Support the structure plans which proposed to increase links and provided shorter spaced street network.
Objective 6 Improve street legibility for all modes of transport
Measure/ action 6.1
Establish a coherent street network throughout the corridor with defined function, hierarchy and modal priority that is appropriate for the mix of land uses. Active and public transport modes should be prioritised close to stations.
Recommendation Provide a cycle network, with regional and local routes for each precinct. This network can include a combination of cycle infrastructure including separated cycleways, shoulder lanes, mixed traffic, off-road cycle paths and shared paths.
Objective 12 Improve personal security around key transport hubs
Measure/ action 12.1
Reduce perceived safety risks by providing short, surveyed and well-lit walks from surrounding area and commuter parking to train station entries.
Recommendation Support the structure plans and planning controls to enforce the action.
Objective 15 Reduce reliance on private motor vehicle
Measure/ action 15.1
Enhance the amenity of the university and TAFE areas and provide attractive active transport link between the tertiary institutions in Macarthur and Campbelltown Hospital.
Recommendation Work with land owners to audit active transport facilities linking these land uses.

Glenfield to Macarthur Corridor Integrated Transport Strategy
3 August 2015 Cardno 163
Cycling network
The purpose of a regional cycling network is to provide links to surrounding areas within five kilometres as identified within the NSW Government’s Sydney’s Cycling Future. For the study area, this requires a focus on the north-south corridor with supporting east-west connections for each precinct. Regional networks do not necessarily connect to the main centre or major transport hubs, however provide an option to cycle between centres/hubs with local connections that enable direct access to the centres/hubs.
Bicycle catchments are most attractive for short trips generally up to five kilometres to centres. A typical cycling catchment for interchanges is about two kilometres. A well-developed bicycle network has the potential to considerably increase a stations active transport catchment.
Successful bicycle networks use regional routes and branch local routes off this to allow cyclists to reach key destinations. Regional routes provide an arterial corridor for cyclists to use when travelling outside of the local area.
Local routes should be implemented to complement regional routes to maximise the value of the investment and ridership. Local routes radiate from each station and connect to the regional network across the rail corridor. Ideally these should aim to serve various land uses along their routes; i.e. educational, retail, residential, recreational to maximise ridership. Along busy streets local routes could be configured as kerbside shared paths and along quiet local streets only signage and stencils may be required.
The existing regional cycling infrastructure within the study area is considered to be inadequate to enable mode shift and to provide a viable alternative to motorised transport modes. Large lengths of the network are shoulder lanes with car parking adjacent. These place cyclists between moving traffic and the door opening zone of parked cars. This type of infrastructure presents high risk to cyclist safety.
Station end of trip facilities
Bicycle parking facilities have generally been upgraded with the Transport Access Program. As demand for bicycle parking increases, investigation should be focused on providing bike sheds at each station.
Secure bike sheds have been provided in other states in Australia and around the world. These offer an efficient use of space, particularly when compared against bicycle lockers.
Public Transport Victoria provide bicycle parking at stations under the “Parkiteer” program which is managed by Bicycle Network. This is continually being rolled out across the Victorian public transport network. The sheds feature access via a swipe card which is issued after the payment of a refundable security deposit. At some stations there is a waiting list due to the popularity of the scheme. TfNSW could integrate access to the sheds with the Opal card system to maximise mode integration.
9.2.3 Rail
Railway provides the highest capacity and generally highest average speed land based public transport mode. It is environmentally friendly and reduces end of trip parking demand. The following objectives and measures are related to railway use.
Objective 1 Improve competitiveness and attractiveness of public transport
Measure/ action 1.1
Increase number of express train services that stop at key employment and residential precincts in the AM and PM peak and implement supporting public transport connections and commuter parking in strategic locations.
Recommendation Investigate the feasibility of express rail services along the corridor.
Objective 2 Improve reliability and reduce waiting times for public transport
Measure/ action 2.1
Improve train service frequency to all stations through the corridor in off peak periods to increase attractiveness of the train service all day.
Recommendation Periodically review rail operations to ensure the level of services is appropriately matched with demand and growth in the corridor.

Glenfield to Macarthur Corridor Integrated Transport Strategy
3 August 2015 Cardno 164
Objective 3 Improve the customer experience for public transport journeys
Measure/ action 3.1
Support precinct legibility through provision of wayfinding signage from, to and through each transport interchange to connect with other transport modes and key destinations.
Recommendation Complete a wayfinding audit within the catchment of each station for walking and the precinct for walking and cycling. Key destinations should be highlighted in the walking and cycling networks.
Objective 12 Improve the customer experience for public transport journeys
Measure/ action 12.2
Reduce personal security concerns through making waiting areas associated with bus stops, taxi and Kiss & Ride safe environments, particularly at night time.
Recommendation Undertake a personal safety and security audit for each station taking into consideration Crime Prevention through Environmental Design principles when planning for upgrades and improvements. This task should seek to maximise passive and active surveillance and improve lighting.
Objective 14 Support positive provision for accessibility and active transport
Measure/ action 12.2
Provide equitable access by ensuring all transport infrastructure and new developments are fully accessible by mobility-impaired and sight-impaired people. Specifically, provide an accessibility upgrade at Macquarie Fields Station.
Recommendation TfNSW to continue to investigate, plan and implement the Transport Access Program.
Objective 16 Support collaboration with the business community, Council and NSW Government to improve transport for all stakeholders
Measure/ action 16.2
Better integrate train stations with each precinct’s activity hub or economic centre.
Recommendation Support the structure plans which proposed to increase land use variety and density close to existing transport hubs.
9.2.4 Freight
The South West Sydney area is a significant freight and logistics region. This area provides a hub for distribution of goods throughout NSW. The study area is a portion of this wider area that requires strategic and detailed planning to cater for Sydney’s population and employment growth needs for goods. The road and rail networks provide a network to move, deliver and receive goods from the study area.
The East Coast Rail Network provides the rail connections for freight in NSW. The SSFL line has recently been completed and as such it is anticipated that capacity, reliability and competitive requirements determined the configuration of the built infrastructure. As such it is expected that it will adequately serve the demand for the interim to medium term period.
The Hume Motorway is the primary road network connection for the study area. The Motorway provides access to intermodal connections from and to the rail network, access to various ports and to inland NSW regions. Within the study area the Motorway enables industrial uses to operate and conglomerate to create efficiencies for infrastructure investment in road and rail.
The proposed Western Sydney Employment Area and Badgerys Creek Airport will increase transport requirements on regional networks, however these additional movements are not expected to greatly affect cross corridor movements in the Glenfield to Macarthur corridor. It is expected there would be additional demands on the Hume Motorway and potentially the freight rail line.
Freight and logistics for the study area must be considered in a wider context for NSW strategies to cater for growth and determine priorities for improvement.
The following are relevant objectives for freight in the study area:
Objective 9 Support and facilitate efficient movement of freight throughout the corridor

Glenfield to Macarthur Corridor Integrated Transport Strategy
3 August 2015 Cardno 165
Measure/ action 9.1
Implement priority measures to improve reliability and dedicated facilities for freight movement, including rail improvements
Recommendation 1. Consider the land use and transport implications and noise attenuation requirements in detailed precinct planning and building design.
2. Monitor the road network and investigate the requirement for additional upgrades or management to facilitate efficient freight movement.
Objective 16 Support collaboration with the business community, Council and NSW Government to improve transport for all stakeholders
Measure/ action 16.1
Work with businesses, Council and transport operators to achieve an integrated transport network that addresses all customer needs.
Recommendation Engage and plan with businesses in the study area to understand freight growth and transport requirements and opportunities at a strategic level.
9.2.5 Bus
It is recommended that a wider bus network review is undertaken to integrate with the bus and road network changes as the South West Growth Centre and Western Sydney Employment Lands are developed. This will maximise employment opportunities and access to retail, entertainment and educational uses. The following are relevant objectives and recommendations for a bus network review to consider in the study area:
Objective 2 Improve reliability and reduce waiting times for public transport.
Measure/ action 2.2
Improve bus services along eastern corridor of precincts with increased frequencies and bus priority.
Recommendation Undertake wider network review to examine the feasibility of more regular services.
Measure/ action 2.3
Increase reliability of bus services through provision of bus priority and route amendments through congested intersections
Recommendation Investigate the potential for bus priority and route amendments.
Objective 3 Improve the customer experience for public transport journeys
Measure/ action 3.1
Support precinct legibility through provision of wayfinding signage from, to and through each transport interchange to connect with other transport modes and key destinations.
Recommendation Complete a wayfinding audit within each station for walking and the precinct for walking and cycling. Key destinations should be highlighted in the walking and cycling networks.
Objective 10 Improve connections to regionally significant areas
Measure/ action 10.1
Cater for the growing number of trips to the corridor from the South West Growth Centre and provide direct public transport routes to the South West Growth Centre, Western Sydney Employment Area and key employment centres.
Recommendation Investigate the potential for routes to the SWGC and WSEA as part of the wider area bus network review.
Measure/ action 10.2
Investigate opportunities to increase the number of east-west connections over the railway line for active transport and vehicles.
Recommendation Undertake a wider area bus network review.
Measure/ action 10.3
Improve public transport services for the workers who live in Wollongong, Wollondilly Shire and the Southern Highlands and travel to the corridor for jobs.
Recommendation Undertake a wider area bus network review.
Objective 13 Maximise integration with land use and other transport modes
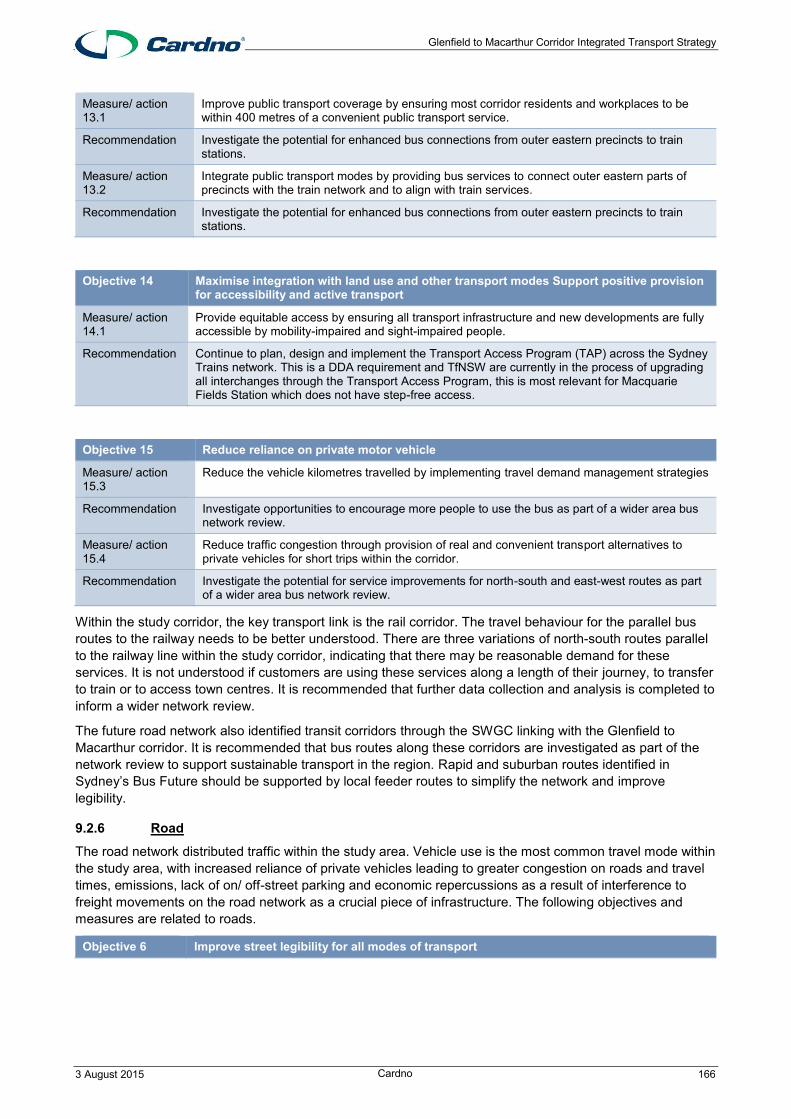
Glenfield to Macarthur Corridor Integrated Transport Strategy
3 August 2015 Cardno 166
Measure/ action 13.1
Improve public transport coverage by ensuring most corridor residents and workplaces to be within 400 metres of a convenient public transport service.
Recommendation Investigate the potential for enhanced bus connections from outer eastern precincts to train stations.
Measure/ action 13.2
Integrate public transport modes by providing bus services to connect outer eastern parts of precincts with the train network and to align with train services.
Recommendation Investigate the potential for enhanced bus connections from outer eastern precincts to train stations.
Objective 14 Maximise integration with land use and other transport modes Support positive provision for accessibility and active transport
Measure/ action 14.1
Provide equitable access by ensuring all transport infrastructure and new developments are fully accessible by mobility-impaired and sight-impaired people.
Recommendation Continue to plan, design and implement the Transport Access Program (TAP) across the Sydney Trains network. This is a DDA requirement and TfNSW are currently in the process of upgrading all interchanges through the Transport Access Program, this is most relevant for Macquarie Fields Station which does not have step-free access.
Objective 15 Reduce reliance on private motor vehicle
Measure/ action 15.3
Reduce the vehicle kilometres travelled by implementing travel demand management strategies
Recommendation Investigate opportunities to encourage more people to use the bus as part of a wider area bus network review.
Measure/ action 15.4
Reduce traffic congestion through provision of real and convenient transport alternatives to private vehicles for short trips within the corridor.
Recommendation Investigate the potential for service improvements for north-south and east-west routes as part of a wider area bus network review.
Within the study corridor, the key transport link is the rail corridor. The travel behaviour for the parallel bus routes to the railway needs to be better understood. There are three variations of north-south routes parallel to the railway line within the study corridor, indicating that there may be reasonable demand for these services. It is not understood if customers are using these services along a length of their journey, to transfer to train or to access town centres. It is recommended that further data collection and analysis is completed to inform a wider network review.
The future road network also identified transit corridors through the SWGC linking with the Glenfield to Macarthur corridor. It is recommended that bus routes along these corridors are investigated as part of the network review to support sustainable transport in the region. Rapid and suburban routes identified in Sydney’s Bus Future should be supported by local feeder routes to simplify the network and improve legibility.
9.2.6 Road
The road network distributed traffic within the study area. Vehicle use is the most common travel mode within the study area, with increased reliance of private vehicles leading to greater congestion on roads and travel times, emissions, lack of on/ off-street parking and economic repercussions as a result of interference to freight movements on the road network as a crucial piece of infrastructure. The following objectives and measures are related to roads.
Objective 6 Improve street legibility for all modes of transport

Glenfield to Macarthur Corridor Integrated Transport Strategy
3 August 2015 Cardno 167
Measure/ action 6.1
Establish a coherent street network throughout the corridor with defined function, hierarchy and modal priority that is appropriate for the mix of land uses. Active and public transport modes should be prioritised close to stations.
Recommendation Establish a road hierarchy and network that promotes active (walking and cycling) and public transport modes whilst facilitating freight and essential vehicle movements around the town centres and into larger road classifications. No proposed road hierarchy amendments are included within this strategy.
Objective 7 Minimise through traffic in local areas
Measure/ action 7.1
Separate through traffic and road freight from local vehicle trips and public transport services by reducing the attractiveness of local roads to through traffic by implementing LATMs.
Recommendation Apply the freight network performance indicators delivering NSW Freight & Ports Strategy Action 1A Undertake 40km/h High Pedestrian Activity Area/ LATMs for each precinct to determine suitable traffic calming measures including horizontal and vertical deflection devices to promote a low speed pedestrian friendly environments. Provide additional connections to roads multiple bigger functions to promote traffic diversion from local roads, pending detailed analysis/modelling.
Objective 8 Maximise investment in station supporting facilities
Measure/ action 8.1
Support shared use of transport facilities such as commuter parking with other uses to increase efficiency of infrastructure.
Recommendation Undertake precinct parking studies to determine parking demand and supply ratios for areas. Investigate areas of time-restricted parking surrounding stations to support local businesses and encourage public/ active forms of transport to and from stations.
Objective 9 Support and facilitate efficient movement of freight throughout the corridor.
Measure/ action 9.1
Implement priority measures to improve reliability and dedicated facilities for freight movement, including rail improvements
Recommendation Protect freight corridors through strategic transport and land use planning and local development controls to support regional freight movements.
Objective 10 Improve connections to regionally significant areas
Measure/ action 10.2
Increase the number of east-west connections over the railway line for active transport and vehicles.
Recommendation Investigate further planning of road links as identified within each precinct in subregional and planning context.
Objective 11 Improve road safety around key transport hubs
Measure/ action 11.1
Enhance safety for public transport users by providing safe crossing facilities on approach to each train station and bus stop.
Recommendation Incorporate safety improvements in 40km/h High Pedestrian Activity Area/ LATM studies.
Measure/ action 11.2
Prioritise pedestrians and cyclists over vehicles around train stations through low speed environments.
Recommendation 1. Undertake Road Safety Audits surrounding train stations to ensure the safety of pedestrians, cyclists and other commuters to ensure safe manoeuvrability around the station.
2. Promote pedestrian pathways as right of way, to improve and encourage pedestrian connections to station as well as act as traffic calming measures to reduce traffic speeds and desirability of vehicle travel around station.
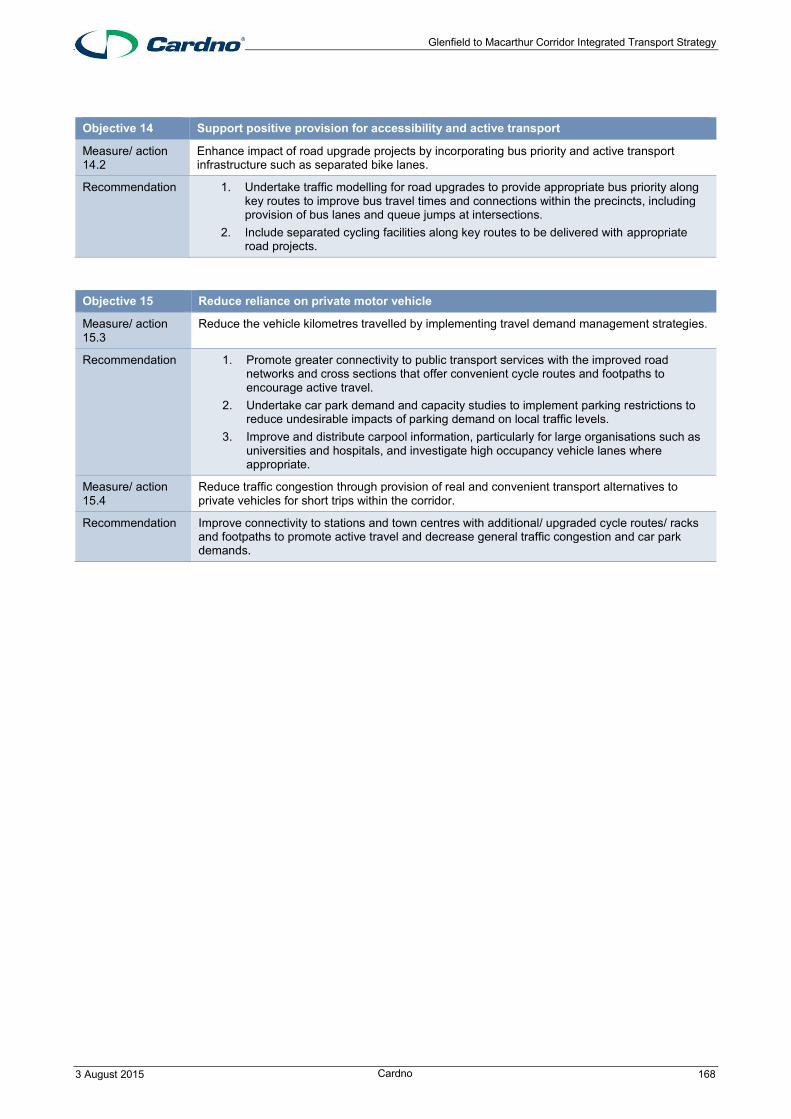
Glenfield to Macarthur Corridor Integrated Transport Strategy
3 August 2015 Cardno 168
Objective 14 Support positive provision for accessibility and active transport
Measure/ action 14.2
Enhance impact of road upgrade projects by incorporating bus priority and active transport infrastructure such as separated bike lanes.
Recommendation 1. Undertake traffic modelling for road upgrades to provide appropriate bus priority along key routes to improve bus travel times and connections within the precincts, including provision of bus lanes and queue jumps at intersections.
2. Include separated cycling facilities along key routes to be delivered with appropriate road projects.
Objective 15 Reduce reliance on private motor vehicle
Measure/ action 15.3
Reduce the vehicle kilometres travelled by implementing travel demand management strategies.
Recommendation 1. Promote greater connectivity to public transport services with the improved road networks and cross sections that offer convenient cycle routes and footpaths to encourage active travel.
2. Undertake car park demand and capacity studies to implement parking restrictions to reduce undesirable impacts of parking demand on local traffic levels.
3. Improve and distribute carpool information, particularly for large organisations such as universities and hospitals, and investigate high occupancy vehicle lanes where appropriate.
Measure/ action 15.4
Reduce traffic congestion through provision of real and convenient transport alternatives to private vehicles for short trips within the corridor.
Recommendation Improve connectivity to stations and town centres with additional/ upgraded cycle routes/ racks and footpaths to promote active travel and decrease general traffic congestion and car park demands.

Glenfield to Macarthur Corridor Integrated Transport Strategy
3 August 2015 Cardno 169
10 Concept transport network
This section discusses the regional and local transport networks. The concepts have been developed on a basis of providing direct regional routes for all modes throughout the corridor.
It is important to note that most of the concepts have not been subject to detailed analysis, feasibility study, have funding or are committed. These are presented to generate thought and discussion about how the transport network could be progressed in line with the objectives for the corridor.
The regional plans consider how the cycling, bus and road network will integrate with each precinct and provide a direct, legible regional network. Walking has been a lesser consideration at a regional level, however the proposed cycling network would support a shared or adjacent walking function.
The rail network in this area for short trips is acceptable, however as identified in Sydney’s Rail Future the East Hills and Airport Lines will experience a high level of demand. This is a significant challenge for TfNSW to analyse and develop options for improvement. With approximately 15% of employed residents within the study area working in Inner Sydney, the level of service is an important consideration for transport and planning in this area. It is recommended that additional services are implemented to alleviate this issue in the short-medium term and infrastructure solutions are developed for the medium-long term.
The bus network is currently comprehensive within the study area, it covers the majority of the precincts well. However, this comes with the cost of less frequent services and a variety of routes throughout the study area. It is recommended that a regional system is investigated and implemented as outlined in Section 9.2.5 to provide more frequent and direct services to stations and town centres.
The road network has some constraints near Campbelltown and Macarthur during peak periods. Transport modelling was undertaken for the study area using the NSW Government’s Sydney Strategic Travel Model. This model seeks to understand demand for all transport modes. The model provides an indication as to which regions are likely to have notable capacity constraints, however the outputs are too coarse to provide detailed intersection analysis.
10.1 Regional network The regional transport improvements are detailed in the following sections, which cover all modes of transport. Overall the transport networks for the precinct structure plans take into consideration strategic transport considerations for the region and seek to improve local connections for walking, cycling and the road network within each precinct.
10.1.1 Regional cycling network
The proposed regional cycling network for the corridor integrates with other proposed regional routes, including the Liverpool to Parramatta rail trail, the M7 cycle path and the proposed South West Growth Centre arterial road network.
It is anticipated the regional route would be constructed of kerbside shared paths as is current practice for many arterial road upgrades in metropolitan Sydney.
Figure 10-1 shows the concept regional cycle network for the study area.
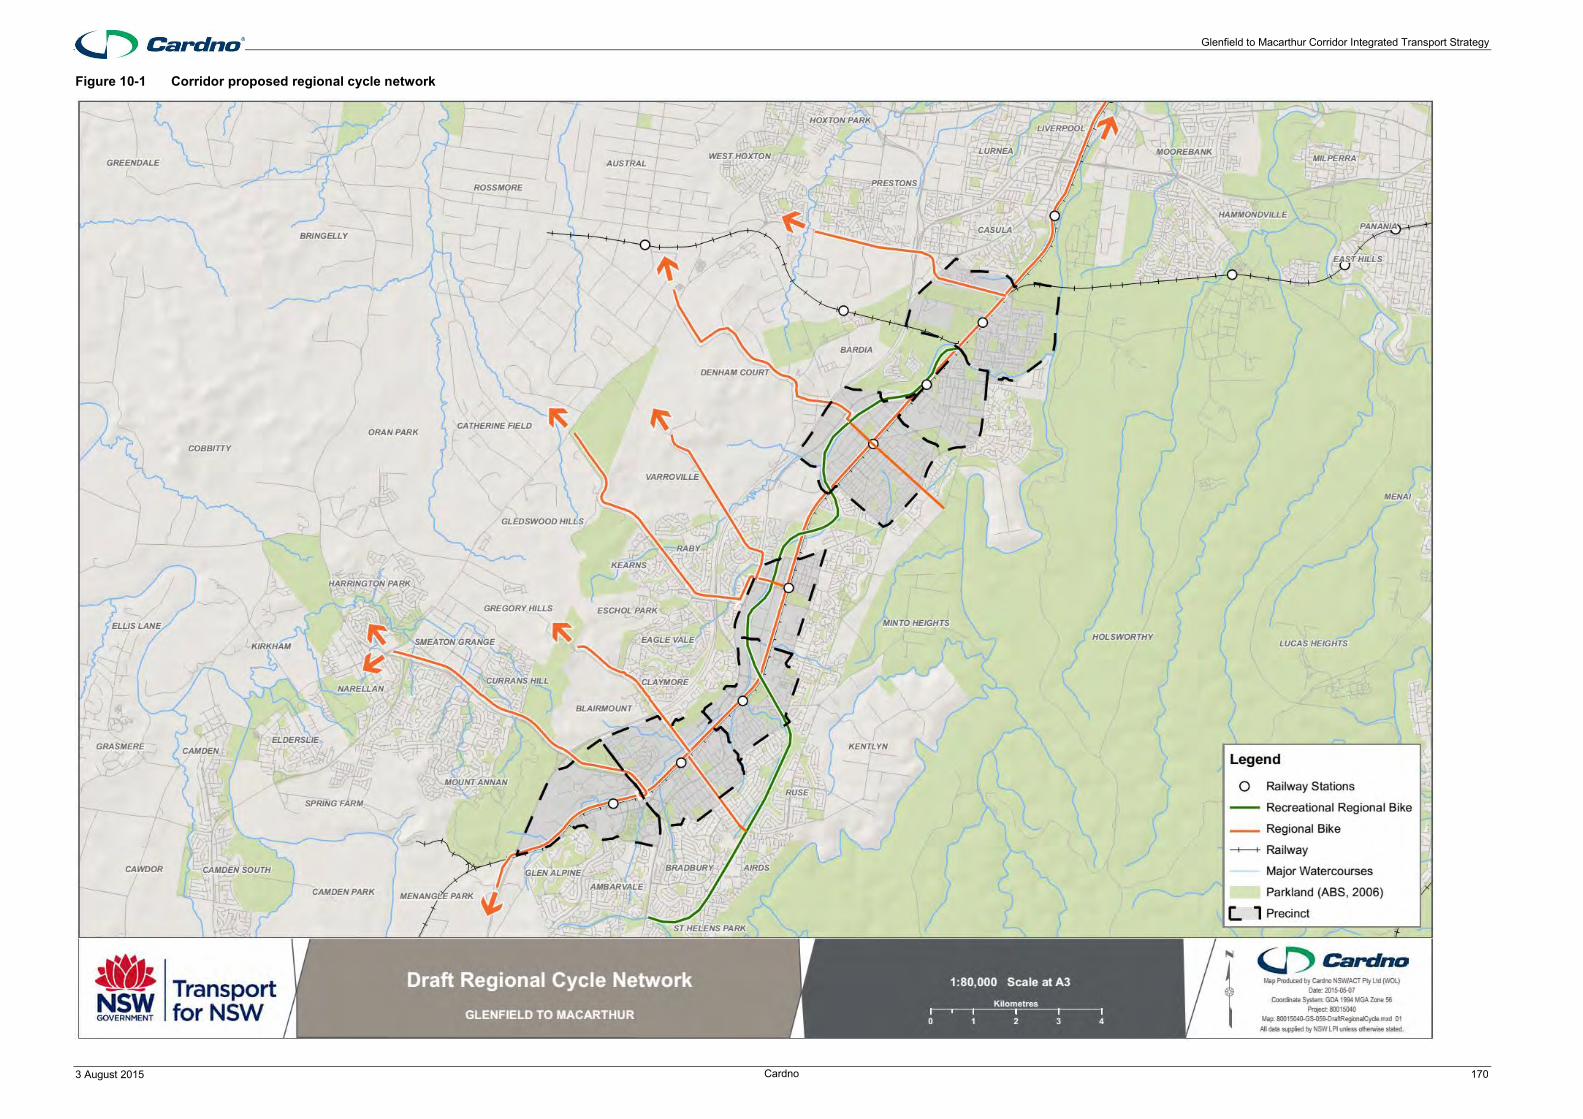
Glenfield to Macarthur Corridor Integrated Transport Strategy
3 August 2015 Cardno 170
Figure 10-1 Corridor proposed regional cycle network

Glenfield to Macarthur Corridor Integrated Transport Strategy
3 August 2015 Cardno 171
Parallel to corridor regional routes
A Campbelltown to Liverpool rail trail route was identified in the 2009 Liverpool City Council Bike Plan which was anticipated to be fully funded by the RMS.
It is recommended that this regional route is developed parallel to the railway line to create the spine of the bicycle network. The purpose of this route is to provide opportunities for more people to connect with stations and other land uses. The bicycle network would increase the station customer catchment along the rail corridor as stations are spaced in excess of typical walking catchments.
Recreational routes
The purpose of these routes are to take advantage of green open space and the proposed green grid, as a result these routes support recreational activity and seek to support regional and local routes where possible. The proposed network includes a regional route adjacent to the railway corridor on the eastern side. This may need to cross the railway corridor at various points due to land use and opportunities to use current north-south corridors. This would also provide a key corridor to link some local routes to their nearest station.
Additionally a regional network is proposed along the waterways which also run along the study corridor. These waterways from north to south include Bunbury Curan Creek, Bow Bowing Creek, Smiths Creek.
Cross corridor regional routes
Key regional routes should be provided perpendicular to the railway corridor adjacent to a proposed core road network as outlined in Table 10-1 and Figure 10-1.
Table 10-1 Proposed regional routes
Station Regional route
Glenfield Proposed Cambridge Avenue/ Glenfield Road extension with a link to Camden Valley Way
Ingleburn Macdonald Road corridor to Edmondson Park Proposed Denham Court Road upgrade
Minto St Andrews Road Raby Road
Leumeah Raby Road
Campbelltown Badgally Road/ Gregory Hills Drive Narellan Road
Macarthur Narellan Road
10.1.2 Regional bus network
Concept routes
Based on consultation with TfNSW, six key bus routes are presented for consideration in a wider network review.
The potential routes are designed to complement the railway corridor by serving areas not within the walking catchment. They are be designed to be direct and service Campbelltown and Glenfield stations, which are key interchanges within the study corridor. It is envisaged that a network review would consider new opportunities for existing bus services that service the same destinations.
New cross corridor routes are proposed to integrate with the proposed South West Growth Centre, thus providing opportunities for sustainable transport use between the two regions and to provide station feeder services.
The concept bus network in relation to the study corridor is shown in Figure 10-2 and the routes are discussed as follows:
Glenfield to Macarthur Corridor Integrated Transport Strategy
3 August 2015 Cardno 172
Route 1: Campbelltown to Liverpool via Leppington and Oran Park
This route has been identified in Sydney’s Bus Future as a “Rapid Route”. It is intended that this would have a high frequency with a relatively long service span. This service would link the SWGC with the rail corridor at Liverpool, Leppington and Campbelltown.
Route 2: Campbelltown to Liverpool
This route operates parallel to the rail corridor between Campbelltown and Liverpool. It would service the eastern precincts between Glenfield and Campbelltown and potentially serve Moorebank intermodal shipping terminal. This could be designed to operate outside of the typical railway station catchment of 800 metres, but potentially connections to key railway station interchanges such as Campbelltown, Glenfield and Liverpool. The route proposes to operate directly and provide a better balance on speed, directness and coverage, than current bus routes.
Route 3: Campbelltown to Wollongong
The wider network review should investigate the feasibility of a more direct service between Campbelltown and Wollongong. Given the relatively long distance of the route, the service takes approximately 1.25 hours to complete. Time savings could be achieved by operating with limited stops and more direct routing.
Route 4: Campbelltown to Narellan
A number of routes operate on Narellan Road. It is recommended to investigate a review of bus operations along this corridor. It is anticipated operations could be simplified with Narellan becoming a minor network hub.
Route 5: Campbelltown to South West Growth Corridor via Badgally Road.
It is expected that Badgally Road will be upgraded to a transit corridor and could eventually provide a direct connection to the proposed Badgerys Creek airport. This is reliant on both the upgrade and completion of Badgally Road and the development of the transport network in the South West Growth Centre. Given these factors, this route is a considered a long term consideration.
Route 6: Campbelltown to Leppington
As the development of the South West Growth Centre progresses the demand and viability of this service could be investigated to provide relatively directly link the two railway transport hubs. This route is also reliant on the completion of the road network. This route is considered a long term consideration.
Local Routes
The local routes have been developed and improved over many years serving their respective areas and feeding stations along the corridor. It is expected they have been refined to provide the most useful service to the communities these routes serve.
Any redesign of routes would require detailed analysis of the community needs to understand trip behaviour and destinations at a local level. This is expected to be undertaken as part of a wider bus network review.

Glenfield to Macarthur Corridor Integrated Transport Strategy
3 August 2015 Cardno 173
Figure 10-2 Indicative connections to bus network

Glenfield to Macarthur Corridor Integrated Transport Strategy
3 August 2015 Cardno 174
10.1.3 Regional road network
The strategy seeks to provide additional regional road links for the primary benefit of freight movement through the region. Two road links are suggested for further analysis, discussed as follows:
> Cambridge Avenue extension to Campbelltown Road as modelled and discussed in Section 7.3.1. This could potential provide benefits to the proposed Moorebank Intermodal Shipping Terminal.
> Devon Road and Chester Road link between Williamson Road and Cumberland Road as considered in Section 7.3.3.
10.1.4 Regional car parking
This transport strategy seeks to support and encourage sustainable transport modes. As such, no additional car parking is proposed for the region or precincts. It is sought to implement management measures to balance the existing supply and demand and ultimately relocate significant at grade facilities to multi-storey or basement facilities to create activated street frontages and more efficient use of land.
Detailed car parking studies are required to determine appropriate provision, policy and management.
10.2 Precinct network plans The concept precinct network plans were developed to enhance the existing networks, achieve the objectives of this integrated transport strategy while also supporting the structure plans and land use intensification. The networks focus around each precincts station and improved access to the stations.
This section outlines the concept pedestrian and cyclist networks for each precinct. These combine the existing network with additions/ links for consideration. Other modes require more detailed assessments at corridor level and are discussed at lesser detail within each precinct. It is anticipated that the active transport networks could be developed and refined in respective PAMP’s and Bike Plans.
10.2.1 Glenfield
The Glenfield precinct has significant potential for land use density and transport improvements. Opportunities for the area include improving walking and cycling mode shares and reducing the reliance on vehicles for day to day tasks.
The likely impacts of the Glenfield Structure Plan on the local transport network include:
> A greater demand on the transport network due to the increase of land use density around the station.
> More direct and convenient route options due to the finer grained road network.
> Enhanced walking and cycling networks due to maximisation of green corridors.
It is recommended to increase public transport services to support the increased activity. The following objective provides direction for the development of the Glenfield precinct future transport network:
To support and encourage local residential and employment growth through the provision of sustainable transport enhancements, including walking, cycling and public transport infrastructure and services.
The concept Glenfield precinct transport network seeks to:
> Improve walking and cycling connections to the Glenfield Railway Station;
> Reduce circuitous bus routes and increase route reliability; and
> Improve road/street legibility and permeability.
These improvements, and others as outlined in the following sections, will encourage more people to walk, cycle and use public transport more often for local and regional trips.
Walking
There is only one railway pedestrian crossing in Glenfield which is located at the station. It is proposed that this will remain the key pedestrian railway crossing point in the precinct.
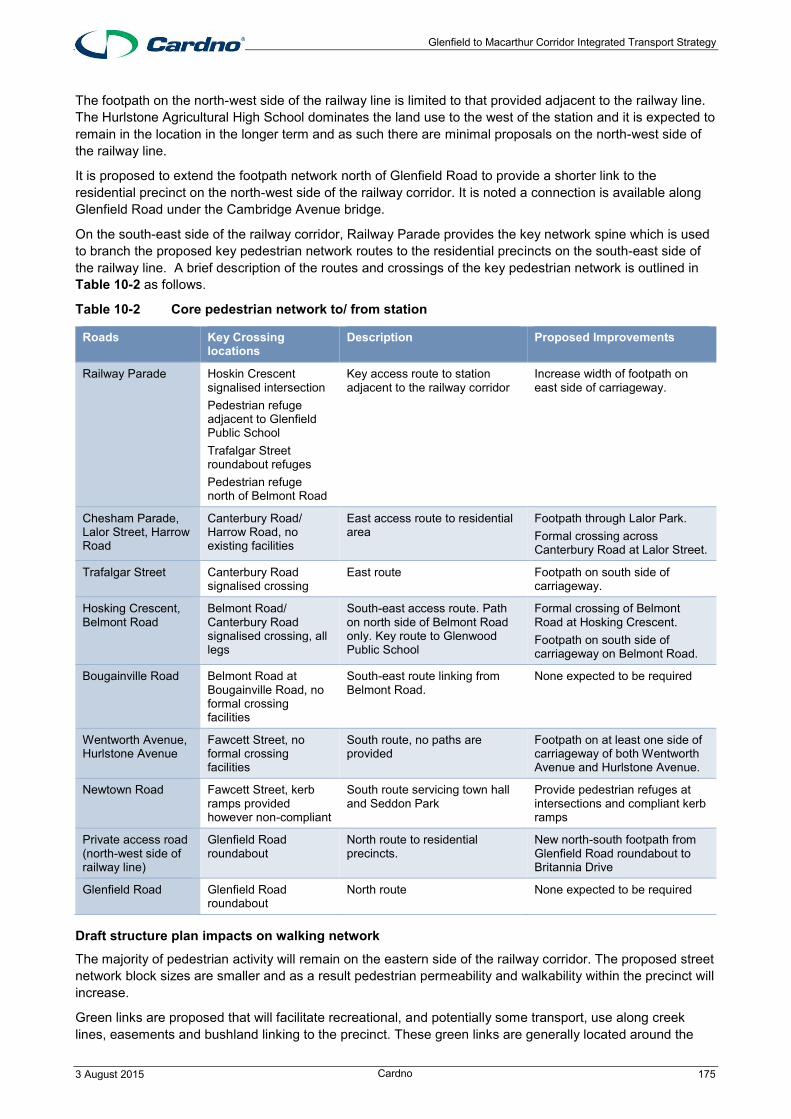
Glenfield to Macarthur Corridor Integrated Transport Strategy
3 August 2015 Cardno 175
The footpath on the north-west side of the railway line is limited to that provided adjacent to the railway line. The Hurlstone Agricultural High School dominates the land use to the west of the station and it is expected to remain in the location in the longer term and as such there are minimal proposals on the north-west side of the railway line.
It is proposed to extend the footpath network north of Glenfield Road to provide a shorter link to the residential precinct on the north-west side of the railway corridor. It is noted a connection is available along Glenfield Road under the Cambridge Avenue bridge.
On the south-east side of the railway corridor, Railway Parade provides the key network spine which is used to branch the proposed key pedestrian network routes to the residential precincts on the south-east side of the railway line. A brief description of the routes and crossings of the key pedestrian network is outlined in Table 10-2 as follows.
Table 10-2 Core pedestrian network to/ from station
Roads Key Crossing locations
Description Proposed Improvements
Railway Parade Hoskin Crescent signalised intersection Pedestrian refuge adjacent to Glenfield Public School Trafalgar Street roundabout refuges Pedestrian refuge north of Belmont Road
Key access route to station adjacent to the railway corridor
Increase width of footpath on east side of carriageway.
Chesham Parade, Lalor Street, Harrow Road
Canterbury Road/ Harrow Road, no existing facilities
East access route to residential area
Footpath through Lalor Park. Formal crossing across Canterbury Road at Lalor Street.
Trafalgar Street Canterbury Road signalised crossing
East route Footpath on south side of carriageway.
Hosking Crescent, Belmont Road
Belmont Road/ Canterbury Road signalised crossing, all legs
South-east access route. Path on north side of Belmont Road only. Key route to Glenwood Public School
Formal crossing of Belmont Road at Hosking Crescent. Footpath on south side of carriageway on Belmont Road.
Bougainville Road Belmont Road at Bougainville Road, no formal crossing facilities
South-east route linking from Belmont Road.
None expected to be required
Wentworth Avenue, Hurlstone Avenue
Fawcett Street, no formal crossing facilities
South route, no paths are provided
Footpath on at least one side of carriageway of both Wentworth Avenue and Hurlstone Avenue.
Newtown Road Fawcett Street, kerb ramps provided however non-compliant
South route servicing town hall and Seddon Park
Provide pedestrian refuges at intersections and compliant kerb ramps
Private access road (north-west side of railway line)
Glenfield Road roundabout
North route to residential precincts.
New north-south footpath from Glenfield Road roundabout to Britannia Drive
Glenfield Road Glenfield Road roundabout
North route None expected to be required
Draft structure plan impacts on walking network
The majority of pedestrian activity will remain on the eastern side of the railway corridor. The proposed street network block sizes are smaller and as a result pedestrian permeability and walkability within the precinct will increase.
Green links are proposed that will facilitate recreational, and potentially some transport, use along creek lines, easements and bushland linking to the precinct. These green links are generally located around the

Glenfield to Macarthur Corridor Integrated Transport Strategy
3 August 2015 Cardno 176
outer edges of the precinct effectively creating and outer orbital walking path. These integrate with the proposed walking network.

Glenfield to Macarthur Corridor Integrated Transport Strategy
3 August 2015 Cardno 177
Figure 10-3 Glenfield proposed walking network

Glenfield to Macarthur Corridor Integrated Transport Strategy
3 August 2015 Cardno 178
Cycling
All key local network routes will branch from the proposed regional railway route. The proposed streets for the local routes include:
> Chesham Parade linking Harrow Road to the north-east of the station.
> Hosking Crescent and Belmont Road providing a very direct link east from the station past Glenwood Public School.
> Newtown Road linking to the south.
These local routes provide greater convenient reach than the pedestrian network and link various residential areas within the precinct, as well as Glenwood Public School and Seddon and Kennett Parks.
On the north-west side of the rail corridor, the regional link provides convenient access to the station and Glenfield town centre via station facilities and it links to Camden Valley Way and the M7 bicycle path.
Figure 10-4 shows the concept regional and local cycle network for Glenfield.
Draft structure plan impact on cycling network
The cycling network integrates with the structure plan areas being located near to the key cycling network. The network will be supplemented by the addition of the new link roads which are to be low speed and low volume environments.

Glenfield to Macarthur Corridor Integrated Transport Strategy
3 August 2015 Cardno 179
Figure 10-4 Glenfield proposed local cycleway

Glenfield to Macarthur Corridor Integrated Transport Strategy
3 August 2015 Cardno 180
Bus
Consideration should be given to providing local services to route through areas to the east of the station and north of Belmont Road. This could be achieved by diverting the S9 service, which would require an analysis of potential customer demand and route directness to encourage trip containment and connections to and from the station.
Draft Structure plan impact on bus network
All major roads will remain and any bus network route changes will be restricted to higher order roads.
Road
The extension of Cambridge Avenue may produce broader benefits in terms of network connectivity for freight vehicles, especially with Cambridge Avenue linking to Moorebank Avenue and the proposed Moorebank Intermodal Terminal.
It is recommended that a detailed transport analysis is undertaken to better understand the benefits and impacts taking into consideration the study area objectives in Section 9.
Draft structure plan impact on road network
The proposed road network will provide smaller block sizes in the station precinct, opportunities for rear lane access and an overall finer grained network. These proposed road network changes could be designed to provide a low speed environment due urban design and smaller blocks. While additional conflict points will be created, this will be managed with LATM measures to provide a safer environment for all road users.
Summary draft structure plan impact on transport network
> Increasing land use density around the station inducing greater demand on the transport network, and public transport will become a more convenient mode to access land.
> More fine grained network with smaller block sizes to provide more direct and convenient route options;
> Maximising use of green corridors for walking and cycling networks;
> Increasing public transport services to support the increased activity.
> The development intensification in the station precinct will provide an optimal outcome in terms of increasing dwellings and business floor areas while reducing the impact on the road network.
Freight
The integrity of key arterial roads should be maintained to facilitate the freight movements expected on the local road network.
Draft structure plan impact on freight network
A finer grain street network is expected to improve freight/ delivery access within the station precinct. The potential Cambridge Avenue extension has the potential to improve the regional road freight network.
Glenfield to Macarthur Corridor Integrated Transport Strategy
3 August 2015 Cardno 181
10.2.2 Macquarie Fields
The transport catchment of Macquarie Fields Station is limited by Redfern Creek, Bunbury Curan Creek and Macquarie Links Golf Club. These natural and man-made features effectively place the station on an access restricted peninsula.
The Macquarie Fields Station is located over one kilometre away from the main shopping precinct and transport links are somewhat indirect. As such the station operates as a transport interchange point only and serves the local residential population within the station catchment.
The key opportunities for the Macquarie Fields precinct are to improve connectivity between the railway station, the retail centre and education land uses, increase walking and cycling catchments and increase key public transport services within the peak period. The concept improvements aim to support the primary precinct objective:
To support and encourage residential growth through the provision of sustainable transport enhancements, including new connections to the commercial centre, and walking, cycling and public transport infrastructure and services.
The Macquarie Fields precinct has a significant amount of potential for land use density, transport improvements and new connections. The current Macquarie Fields Station is non-DDA compliant.
The concept transport network seeks to:
> Improve walking and cycling connections between Macquarie Fields Station and the shopping centre;
> Improve directness of local bus routes and increase route reliability; and
> Improve road/street legibility and permeability.
These improvements, and others as outlined, will encourage more people to walk, cycle and use public transport more often for local and regional trips.
Walking
The network is structured to provide east-west links between the station and major trip generating land uses.
The key desire lines run east-west on the south east side of the station. It is proposed to create a new connection over Redfern Creek to the north-east of the station to service the north-east to station desire line.
The station walking network is based on creating a grid system to connect people from all areas east of the station. Demand from residential areas to the east of the precinct to access main trip generating locations such as the station, will require key pedestrian routes along Saywell, Parliament and Victoria Roads, which are aligned in the east-west direction. These routes connect to Railway Parade which runs in a north-south orientation, and follows from the rail corridor.
Additional trip generating areas, such as the retail centre at the intersection of Parliament and Saywell Roads and the Macarthur Adventist College, would create a desire line in a north-south direction. The route along Atchison Road would cater for these trips.
On the western side of the corridor a new connection is proposed to link the Macquarie Links residential estate to Macquarie Fields town centre via the station, subject to agreement with the Golf course land owners.
The locations of the recommended upgrades is listed in Table 10-3.

Glenfield to Macarthur Corridor Integrated Transport Strategy
3 August 2015 Cardno 182
Table 10-3 Core pedestrian network to/from station Roads Key Crossing locations Description Proposed
Improvements
Railway Parade Redfern Creek, no crossing provided
Key access along the rail corridor. Missing link at Redfern Creek reduces near travel distance catchment.
Provide Redfern Creek crossing between Railway Parade and Victoria Road
Victoria Road, Atchison Road, Fraser Street
Victoria Road/ Atchison Road roundabout
North-east route Provide footpath on at least one side of carriageway.
Victoria Road Victoria Road/ Atchison Road roundabout
East route. With the Redfern Creek crossing this would form a direct link to the east passing Macarthur Adventist College, South Western Sydney TAFE and Glenquarie Town Centre.
Provide pedestrian refuge crossings at intersections.
Alexander Crescent, Windsor Street, Atchison Road and First Avenue
Redfern Creek bridge links between Alexander Crescent and Windsor Street. Atchison Road between Windsor Street and First Avenue. No formal facilities are provided, however a painted median is located along this region of Atchison Road
East route which forms the most direct route between the station and Glenfield Library and Glenquarie Town Centre
Provide pedestrian refuge crossings at intersections.
Saywell Road Saywell Road at Church Street, no formal facility provided. Saywell Road/ Atchison Road/ Parliament Road signalised intersection, no crossing on north leg.
South-east route, access to Saywell Road/ Parliament Road retail precinct.
Provide footpath on south side of carriageway. Provide pedestrian refuge crossings at intersections. Provide crossing at Saywell Road/ Fields Road intersection.
Parliament Road East route Provide crossing on north leg of Saywell Road/ Atchison Road/ Parliament Road intersection.
Waratah Crescent Saywell Road at Waratah Crescent, no formal facility provided
South route which can be used to access Milton Park.
Footpath on at least one side of Waratah Crescent.
The existing and non-existing paths on the network are shown in Figure 10-5.
Structure plan impact on pedestrian network
Within the entire precinct additional road links are proposed, resulting in smaller street blocks which would benefit walkability.
To complement the pedestrian network, green links are proposed that will facilitate recreational use along creek lines, easements and through bushland. The green links are located predominantly around the outer edges of the precinct.
The land use intensity increase proposed in the structure plan would benefit most from pedestrian network improvements given the area is generally located between the station and existing shopping centre and educational facilities.

Glenfield to Macarthur Corridor Integrated Transport Strategy
3 August 2015 Cardno 183
Figure 10-5 Macquarie Fields concept walking network

Glenfield to Macarthur Corridor Integrated Transport Strategy
3 August 2015 Cardno 184
Cycling
To maximise the benefit of the regional network, local routes have been developed that link from the surrounding residential areas to Macquarie Fields Station. The Macquarie Fields network would focus on the south-east side of the railway corridor. The Redfern Creek crossing is a key component of the railway corridor regional route and increases the near travel distance catchment of the station to the north. The proposed streets for the local cycle routes include:
> Victoria Road to the east of the station passing Macarthur Adventist College, Glenquarie Shopping Centre and Macquarie Fields State College.
> Saywell Road is a key route to the south-east of Macquarie Fields. This passes through the small retail/ commercial precinct at the Parliament Road junction.
> Parliament Road links to Saywell Road. This route provides a link in an easterly direction and passes to the south of James Meehan High School.
Figure 10-6 shows the concept regional and local cycle network for Macquarie Fields.
Structure plan impact on cycling network
The cycling network integrates with the structure plan and the increase in activity would support the networks use of the network.

Glenfield to Macarthur Corridor Integrated Transport Strategy
3 August 2015 Cardno 185
Figure 10-6 Macquarie Fields concept local cycleway
Glenfield to Macarthur Corridor Integrated Transport Strategy
3 August 2015 Cardno 186
Bus
The existing 876 loop service does not cover the northern precincts of Macquarie Fields. The completion of the proposed Redfern Creek bridge would allow the service to operate on a larger loop, capturing a larger area along Victoria Road with minimal route distance increase. It would also allow the service to provide a better connection between Macquarie Fields Station and Glenquarie Town Centre.
Structure plan impact on bus network
Minimal if any impact is expected on the bus network. The structure plan places the increased land use intensity between the station, retail and educational land uses.
Road
A bridge is proposed over Redfern Creek between Railway Parade and Victoria Road which would significantly improve access to the station without providing a significant through traffic route.
Structure plan impact on road network
The proposed road network will provide smaller block sizes and an overall finer grained network. These proposed road network changes provide the opportunity to provide a road environment which encourages reduced vehicle speeds. This will provide a safer environment for all road users.
No significant arterial roads are proposed or considered necessary in this precinct, with the existing key arterial routes remaining.
Structure plan impact on transport network
The structure plan proposes to increase residential density around Macquarie Fields Station, improve connections to the nearby retail centre, and provide a walking and cycling link to improve the north-east catchment. This is likely to encourage more walking and cycling in the local area. Additional street links are proposed to create a finer grained network, improving walkability throughout the precinct. The cycling network uses intuitive routes that maximise the reach of the cycling catchment.
Key network improvements include:
> New walking and cycling network to support access to the station and between the station, retail and educational land uses;
> Maximising and integrating green corridors for walking and cycling networks; and
> Increasing in public transport services to support the increased activity.
Freight
The integrity of key arterial roads should be maintained to facilitate the freight movements expected through the precinct.
Structure plan impact on freight network
A finer grain street network is expected to improve freight/ delivery access to properties within the station precinct.

Glenfield to Macarthur Corridor Integrated Transport Strategy
3 August 2015 Cardno 187
10.2.3 Ingleburn
The precinct has a split function; with retail, commercial and residential on the southern side, and industrial on the northern side. The separation of vehicular networks between the north and south results in minimal mix of heavy vehicles accessing the residential, retail and commercial uses. The south-east side of the railway corridor has a relatively fine grained grid street network. The road network on the north-west side of the railway is a large block structure as a result of the land use in that precinct. There are large areas dedicated to at-grade car parking in the town centre evident of the dominance of private vehicle mode share.
The key transport challenges for Ingleburn precinct are lack of access across the railway line and low density housing close to the station and retail hubs. The concept improvements aim to support the primary precinct objective:
To support, reinforce and grow Ingleburn as a centre within the region through residential and employment growth with the provision of sustainable transport enhancements, including walking, cycling and public transport infrastructure and services.
The Ingleburn precinct has potential for land use density, transport improvements and new connections. The current Ingleburn Interchange is undergoing an upgrade as part of the Transport Access Program.
The proposed transport network seeks to:
> Improve walking and cycling connections to Ingleburn Station and the town centre;
> Improve directness of local bus routes and increase route reliability; and
> Improve direct street legibility and permeability.
These improvements, and others as outlined, will encourage more people to walk, cycle and use public transport more often for local and regional trips.
Walking
Ingleburn has a fine-grained street network to the south east of the station that permits a high level of permeability. Additional paths are proposed to encourage walking to both the station and town centre. Many of the proposed paths are located to the south of the station. These will support the extensive residential catchment further south and south-west. To a lesser extent, paths are proposed on the north-west side of the track to support links between employment land uses, the station and the town centre.
The key pedestrian network is built on a legible grid layout. Four routes are proposed in an east-west direction on each side of the station. The east-west routes are along Macquarie Road, Oxford Road, Chester Road, Aero Road, Memorial Avenue and Devon Road. These east-west routes are supported by three north-south routes distributed throughout the precinct. The north-south routes are along Stanley Road, Ingleburn Road and Cumberland Road.
Given the relatively finer-grained road network, there are a greater number of crossing locations and therefore a more extensive review of crossing facilities will be required.
The locations of the recommended upgrades is listed in Table 10-4.
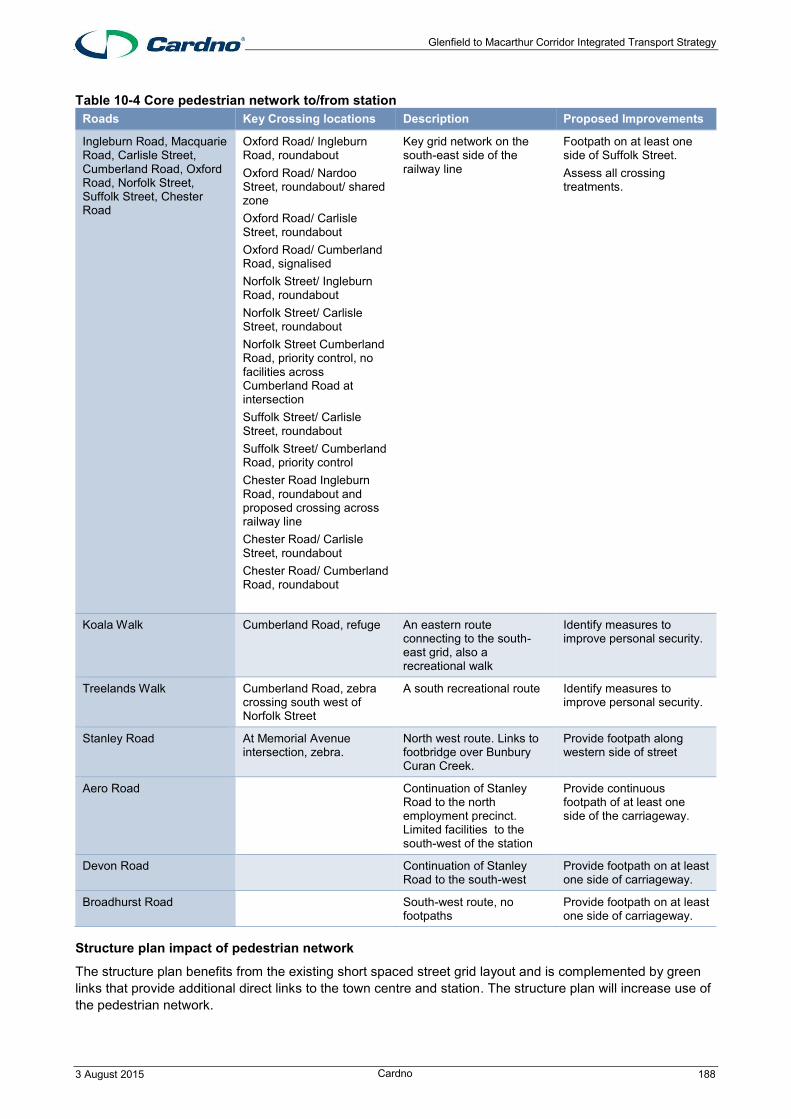
Glenfield to Macarthur Corridor Integrated Transport Strategy
3 August 2015 Cardno 188
Table 10-4 Core pedestrian network to/from station Roads Key Crossing locations Description Proposed Improvements
Ingleburn Road, Macquarie Road, Carlisle Street, Cumberland Road, Oxford Road, Norfolk Street, Suffolk Street, Chester Road
Oxford Road/ Ingleburn Road, roundabout Oxford Road/ Nardoo Street, roundabout/ shared zone Oxford Road/ Carlisle Street, roundabout Oxford Road/ Cumberland Road, signalised Norfolk Street/ Ingleburn Road, roundabout Norfolk Street/ Carlisle Street, roundabout Norfolk Street Cumberland Road, priority control, no facilities across Cumberland Road at intersection Suffolk Street/ Carlisle Street, roundabout Suffolk Street/ Cumberland Road, priority control Chester Road Ingleburn Road, roundabout and proposed crossing across railway line Chester Road/ Carlisle Street, roundabout Chester Road/ Cumberland Road, roundabout
Key grid network on the south-east side of the railway line
Footpath on at least one side of Suffolk Street. Assess all crossing treatments.
Koala Walk Cumberland Road, refuge An eastern route connecting to the south-east grid, also a recreational walk
Identify measures to improve personal security.
Treelands Walk Cumberland Road, zebra crossing south west of Norfolk Street
A south recreational route Identify measures to improve personal security.
Stanley Road At Memorial Avenue intersection, zebra.
North west route. Links to footbridge over Bunbury Curan Creek.
Provide footpath along western side of street
Aero Road Continuation of Stanley Road to the north employment precinct. Limited facilities to the south-west of the station
Provide continuous footpath of at least one side of the carriageway.
Devon Road Continuation of Stanley Road to the south-west
Provide footpath on at least one side of carriageway.
Broadhurst Road South-west route, no footpaths
Provide footpath on at least one side of carriageway.
Structure plan impact of pedestrian network
The structure plan benefits from the existing short spaced street grid layout and is complemented by green links that provide additional direct links to the town centre and station. The structure plan will increase use of the pedestrian network.

Glenfield to Macarthur Corridor Integrated Transport Strategy
3 August 2015 Cardno 189
Figure 10-7 Ingleburn concept walking network

Glenfield to Macarthur Corridor Integrated Transport Strategy
3 August 2015 Cardno 190
Cycling
The network runs in a north-east to south-west direction adjacent to the railway corridor and an additional route runs in a north-west to south-east direction. These two major routes create good access opportunities for cycling to the railway station and town centre.
The proposed north-west to south-east regional network would be located along Oxford Road through the main activity centre and past Ingleburn High School and along Memorial Avenue linking to the south west growth centre.
The proposed local cycle routes include:
> West of the railway lines would be via Stanley Road and Aero Road for the north-west and via Stanley Road and Broadhurst Road for the south-west employment area.
> East of the railway lines would be via Norfolk Street, Cumberland Road to the Treelands Walk (Redfern Creek) providing a large residential catchment to the south and via Chester Road providing links to many of the quieter residential streets.
> Links to the east of the station are proposed via Carlisle Street, Cambridge Street, Cumberland Road and onto Koala Walk. While this route has some initial zig zagging in the town centre, it is considered the most intuitive route to Koala Walk. This would provide access to much of the residential area to the east of the station.
Figure 10-8 shows the concept regional and local cycle network for Ingleburn.
Structure plan impact on bicycle network
No additional impacts from the concept bicycle network are anticipated from the structure plans.

Glenfield to Macarthur Corridor Integrated Transport Strategy
3 August 2015 Cardno 191
Figure 10-8 Ingleburn concept local cycle network

Glenfield to Macarthur Corridor Integrated Transport Strategy
3 August 2015 Cardno 192
Bus
The 873 provide good coverage to the south-east of the station, however the route configuration and looping means the service returns back on itself, using the same intersection (Collins Promenade/ Chester Road) twice. Further precincts to the south of Ingleburn are serviced by a very indirect service.
Ingleburn is extensive enough for two overlapping loop services or one large loop service, pending feasibility analysis.
Structure plan impact on bus network
Minimal, if any impact, is expected on the bus network. Additional demand may occur for regional bus routes.
Road
A concept second rail crossing road link between Williamson Road and Cumberland Road has been considered, potentially along Devon Road and Chester Road corridor. This link would provide an additional east west connection for the local area for all modes of transport. The link is south of the town centre and as such may also improve amenity by reducing through traffic in the town centre.
Structure plan impact on road network
The proposed road network will provide smaller grid sizes with the opportunity to create a road environment that encourages a slow speed environment, which will provide a safer environment for all road users.
The increase in density in both Ingleburn and the region may justify the provision of a second rail crossing to the south-west of Ingleburn Station. This will require more detailed analysis to determine its feasibility, impact and preferred alignment.
Structure plan impact on transport network summary
The proposed transport network at Ingleburn aims to enhance the existing network with the addition of some links and infrastructure improvements.
It is proposed to create a finer grained road network to the north-west of the railway corridor to support higher density residential and retail land uses near the station. It is not proposed to provide a road link in the town centre between the two sides, although a road link across the rail corridor is proposed to the south-west of the station. The pedestrian and bicycle network will maximise the use of the bridge at the station.
Key network improvements include:
> Enhanced walking and cycling network to support access to the station and the retail and commercial centre;
> Maximised use of green corridors and integrating with walking and cycling networks;
> Increase in rail and bus services in the peak periods to reflect land use role in region; and
> Investigate the feasibility of a road link across the rail corridor.
Freight
The integrity of key arterial roads should be maintained to facilitate the freight movements expected. Investigation to improve links including:
> Access to the precinct from the south along the Hume Motorway.
> The potential for a more direct link between Brooks Roads south-east across the Bunbury Curan Creek.
Structure plan impact on freight network
Some land uses on the west side of the railway line are proposed to be rezoned to business and residential land uses. The transport will need to consider the need to minimise freight movements through the rezoned area and private trips from the rezoned area through the industrial precinct.
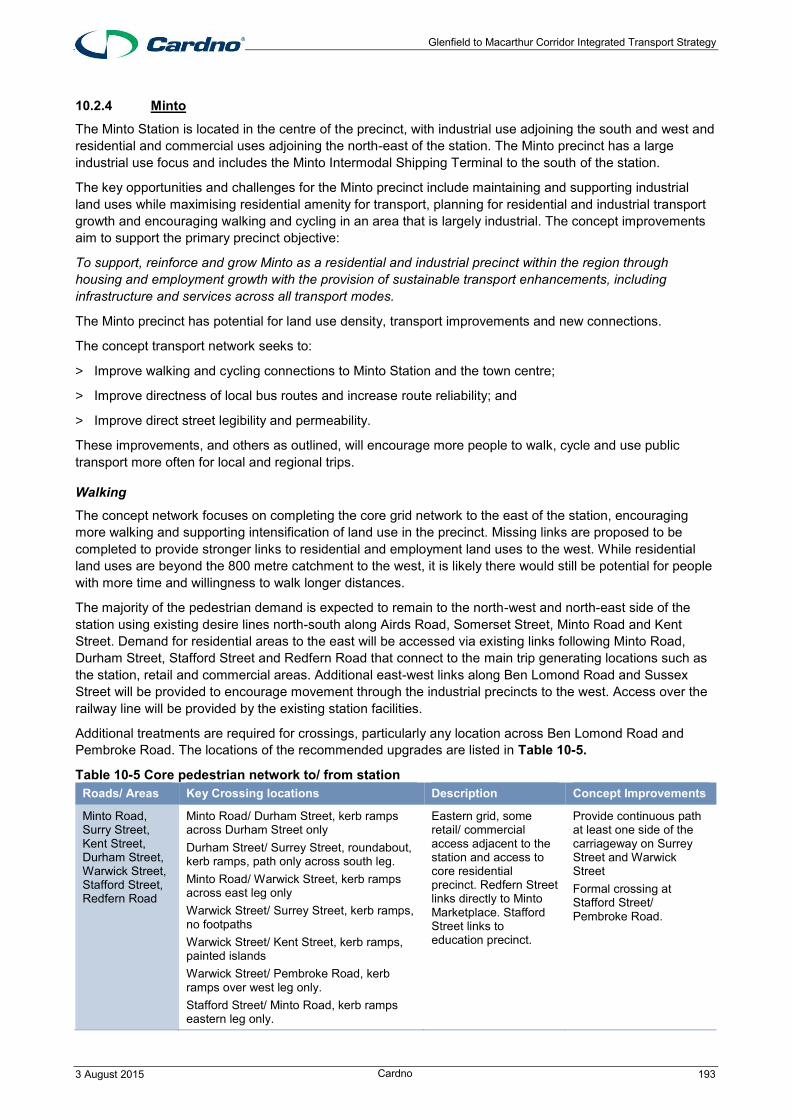
Glenfield to Macarthur Corridor Integrated Transport Strategy
3 August 2015 Cardno 193
10.2.4 Minto
The Minto Station is located in the centre of the precinct, with industrial use adjoining the south and west and residential and commercial uses adjoining the north-east of the station. The Minto precinct has a large industrial use focus and includes the Minto Intermodal Shipping Terminal to the south of the station.
The key opportunities and challenges for the Minto precinct include maintaining and supporting industrial land uses while maximising residential amenity for transport, planning for residential and industrial transport growth and encouraging walking and cycling in an area that is largely industrial. The concept improvements aim to support the primary precinct objective:
To support, reinforce and grow Minto as a residential and industrial precinct within the region through housing and employment growth with the provision of sustainable transport enhancements, including infrastructure and services across all transport modes.
The Minto precinct has potential for land use density, transport improvements and new connections.
The concept transport network seeks to:
> Improve walking and cycling connections to Minto Station and the town centre;
> Improve directness of local bus routes and increase route reliability; and
> Improve direct street legibility and permeability.
These improvements, and others as outlined, will encourage more people to walk, cycle and use public transport more often for local and regional trips.
Walking
The concept network focuses on completing the core grid network to the east of the station, encouraging more walking and supporting intensification of land use in the precinct. Missing links are proposed to be completed to provide stronger links to residential and employment land uses to the west. While residential land uses are beyond the 800 metre catchment to the west, it is likely there would still be potential for people with more time and willingness to walk longer distances.
The majority of the pedestrian demand is expected to remain to the north-west and north-east side of the station using existing desire lines north-south along Airds Road, Somerset Street, Minto Road and Kent Street. Demand for residential areas to the east will be accessed via existing links following Minto Road, Durham Street, Stafford Street and Redfern Road that connect to the main trip generating locations such as the station, retail and commercial areas. Additional east-west links along Ben Lomond Road and Sussex Street will be provided to encourage movement through the industrial precincts to the west. Access over the railway line will be provided by the existing station facilities.
Additional treatments are required for crossings, particularly any location across Ben Lomond Road and Pembroke Road. The locations of the recommended upgrades are listed in Table 10-5.
Table 10-5 Core pedestrian network to/ from station Roads/ Areas Key Crossing locations Description Concept Improvements
Minto Road, Surry Street, Kent Street, Durham Street, Warwick Street, Stafford Street, Redfern Road
Minto Road/ Durham Street, kerb ramps across Durham Street only Durham Street/ Surrey Street, roundabout, kerb ramps, path only across south leg. Minto Road/ Warwick Street, kerb ramps across east leg only Warwick Street/ Surrey Street, kerb ramps, no footpaths Warwick Street/ Kent Street, kerb ramps, painted islands Warwick Street/ Pembroke Road, kerb ramps over west leg only. Stafford Street/ Minto Road, kerb ramps eastern leg only.
Eastern grid, some retail/ commercial access adjacent to the station and access to core residential precinct. Redfern Street links directly to Minto Marketplace. Stafford Street links to education precinct.
Provide continuous path at least one side of the carriageway on Surrey Street and Warwick Street Formal crossing at Stafford Street/ Pembroke Road.

Glenfield to Macarthur Corridor Integrated Transport Strategy
3 August 2015 Cardno 194
Roads/ Areas Key Crossing locations Description Concept Improvements Stafford Street/ Surrey Street, kerb ramps. Stafford Street/ Kent Street, kerb ramps. Stafford Street/ Pembroke Road, no crossing. Redfern Road adjacent to station entry, pedestrian refuges. Redfern Road/ Surrey Street, roundabout with refuges. Redfern Road/ Surrey Street, roundabout with refuges. Redfern Road/ Kent Street, roundabout with refuges. Redfern Road/ Pembroke Road, signals and pedestrian crossings.
Coronation Park Ben Lomond Road/ Pembroke Road, roundabout
South-east routes, potential to provide path though Rose Reserve
Improve crossing facilities at Ben Lomond Road/ Pembroke Road.
Ben Lomond Road
Wiltshire Street/ Lincoln Street, kerb ramps Airds Road, roundabout Holmes Road. Cary Grove, roundabout Campbelltown Road, formal crossing on south leg only.
West route to access employment precinct and residential precinct west of Campbelltown Road.
Provide path on north side of carriageway. Improve crossing facilities at all crossings. Provide crossing on north leg of Campbelltown Road
Airds Road (south of Ben Lomond Road)
Access to south employment precinct, west of railway.
Complete missing link on east side of carriageway south of Ben Lomond Road
Somerset Street Station access, zebra crossing Key access along west side of station. A pedestrian path provides a link to Bow Bowing.
Lincoln Street, Sussex Street, Airds Road
Lincoln Street/ Sussex Street, roundabout Airds Road, no mid-block facilities
Proposed north-west shortcut route. A desire line is evident between Airds Road and Bouddi Street through Bow Bowing Creek reserve.
Provide footpath on at least one side of Lincoln Street, Sussex Street and Airds Road. Provide formal crossing of Airds Road. Footpath between Airds Road and Bouddi Street.
Structure plan impact on pedestrian network
The proposed key pedestrian network integrates with the proposed structure plan and provides justification of improved facilities in the residential grid.
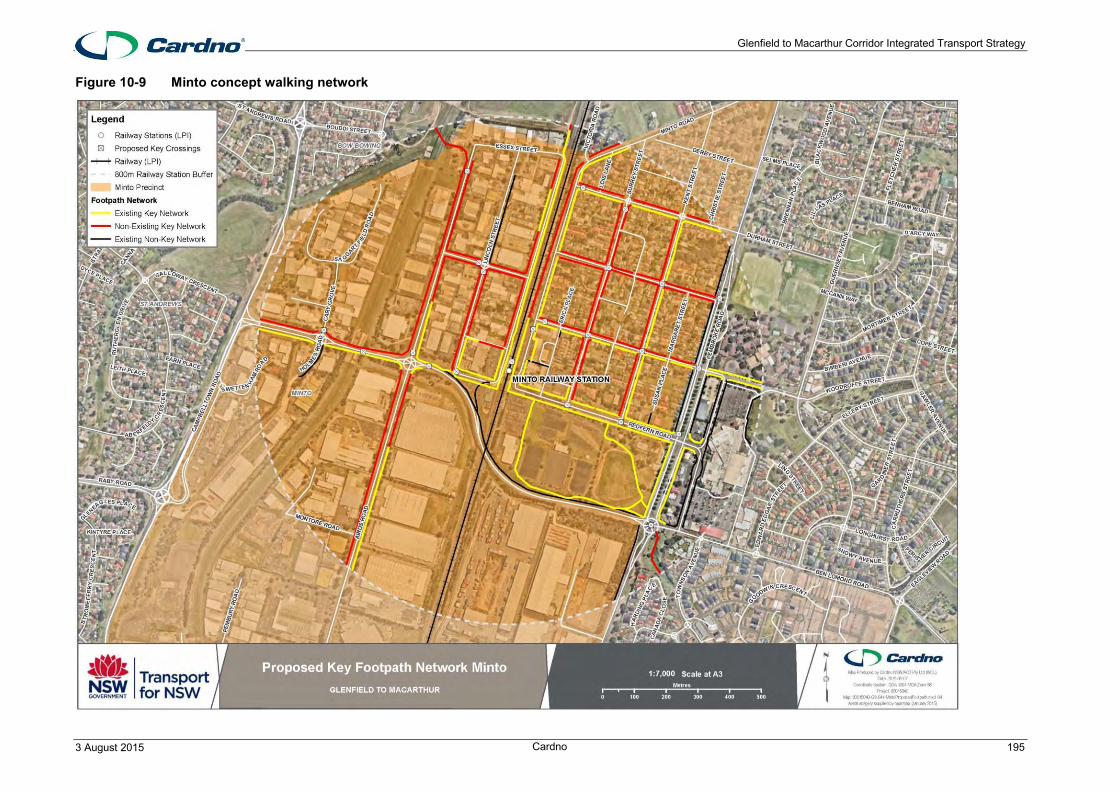
Glenfield to Macarthur Corridor Integrated Transport Strategy
3 August 2015 Cardno 195
Figure 10-9 Minto concept walking network

Glenfield to Macarthur Corridor Integrated Transport Strategy
3 August 2015 Cardno 196
Cycling
Three regional concept routes connect to the Minto Station:
> The main north-south regional railway corridor route which also links to local routes to the north east of the station.
> A regional route to link with the station is proposed along Ben Lomond Road to the west. This would provide the opportunity to connect with St Andrews Road and Raby Road via Campbelltown Road. The route would also form the key bicycle link to St Andrews where it is also possible to connect with Raby via a freeway overpass connecting Byrne Reserve in St Andrews to Blain Park in Raby.
> A third regional route is to the north of the station along Essex Street and Somerset Street. This would link to Bouddi Street and St Andrews Road to the west which is proposed to be a key link to the South West Growth Centre.
To maximise cycling, proposed key local routes have been developed that link from regional routes, the surrounding residential areas to the Minto Station and the main street. The proposed streets for the local routes include:
> A route along Surrey Street would run parallel two street blocks east of the railway corridor route assisting to capture the nearby residential precincts.
> Stafford Street/ Monaghan Street provides a relatively direct route to the east of the station passing between Minto Marketplace shopping centre and the education and recreation precinct to the north of Minto Marketplace.
> A route through Coronation Park and diagonally across Ben Lomond Road/ Pembroke Road to Rose Reserve would capture the relatively new residential precinct to the south and south-east. Paths through Coronation Park are already constructed.
> Redfern Road between the station and Minto Marketplace. This route already exists with both on-street and off-street facilities.
The concept cycling paths build on the north-south regional route which would most likely be located on the Minto Road side of the railway corridor. This provides the greatest benefit of access to the station for commuters to the east of the station. This regional route has the potential to cross to the western side of the railway corridor at Ben Lomond Road to bypass the Minto intermodal shipping terminal (MIST) which is connected to the rail network. Alternatively the route could be diverted to Pembroke Road around MIST.
An east west regional route along Ben Lomond Road links the industrial and commercial and shopping area in the precinct and has the potential to continue west to link the South West Growth Centre.
Local cycle routes will branch from the regional cycle routes on the western side along Somerset Street and Essex Street. On the eastern side, a local cycle route will be provided along Stafford Street, Surrey Street and through Coronation Park to Ben Lomond Road. These links provide connections between residential, retail and commercial land uses within the precinct and link across the railway at the train station.
Figure 10-10 shows the proposed regional and local cycle network for Minto.
Structure plan impact on proposed cycling network
The concept cycling network integrates with the proposed structure plan.

Glenfield to Macarthur Corridor Integrated Transport Strategy
3 August 2015 Cardno 197
Figure 10-10 Minto concept local cycle network

Glenfield to Macarthur Corridor Integrated Transport Strategy
3 August 2015 Cardno 198
Bus
The 873 operates as a local route through Minto servicing to some extent the north-east and eastern precincts from the station. The south-east precincts are reliant on the 870, 871 and 872 services which do not provide connections to Minto Station.
The precinct and station may be better be served by a Minto only loop service in conjunction with the proposed services.
Structure plan impact on bus network
The structure plan would not impact on any existing bus routes and maintains flexibility for potential route changes.
Road
An additional road link concept was considered to the north of the precinct, however it was found to induce traffic as outlined in Section 7.3.4, so it is not recommended.
Structure plan impact on road network
Within the retail, and residential areas in the north-east quadrant of the precinct, the proposed road network will provide smaller street block sizes which will also be advantageous to the pedestrian network. This proposed road network provides an opportunity to create a road environment that encourages low speeds through the use of urban design and traffic management techniques. This will provide a safer environment for all road users.
No significant new road links are considered necessary for the remaining areas of the precinct, with the existing higher order roads operating at satisfactory levels.
Summary of structure plan impact on transport network
The precinct has a primary industrial function and secondary residential and commercial function. The structure plan proposes to increase residential density in the north-east quadrant of Minto Station and improve local street connections. This allows the industrial lands to the west and south to continue to operate while also catering for residential growth. The residential area will also have a main street that would cater for local goods and services. This will reduce the demand for more regional travel to shopping centres.
Key network improvements include:
> New walking and cycling network to support access to the station and the retail and commercial centre;
> Increase in rail and bus services in the peak periods;
> Increase in housing density and residential land use around the station while maintaining key industrial land uses and freight connections.
Freight
The integrity of key arterial roads should be maintained to facilitate the increase in freight movements expected. Investigations should be undertaken to improve access between the industrial precinct and the Hume Motorway, particularly access to and from the south.
Structure plan impact on freight network
The proposed structure plan is maintain and enhance land uses in their existing location. Additional road links on the east side are expected to increase freight and delivery access to the residential precincts.

Glenfield to Macarthur Corridor Integrated Transport Strategy
3 August 2015 Cardno 199
10.2.5 Leumeah
The Leumeah Station is located in the centre of the precinct, with the entertainment uses to the east, residential use to the east and south-east, commercial use to the south-west and industrial to the north. The precinct has a large focus on entertainment with the Campbelltown Sports Stadium and supporting services, such as West Leagues Club. This use induces high demand for access in short periods of time, which requires the local walking network to be well defined and sufficient capacity provided.
The key opportunities and challenges for the precinct are establishing walking and cycling networks, connections into the surrounding area and accommodating high peak demand during events. The concept improvements aim to support the primary precinct objective:
To support, reinforce and grow Leumeah as a local residential, entertainment and light industrial area within the region through housing and employment growth with the provision of sustainable transport enhancements, including walking, cycling and public transport infrastructure and services.
The Leumeah precinct has potential for land use density and transport improvements. The current Leumeah Interchange consists of bus facilities, bike parking, Kiss & Ride, Park & Ride and taxi spaces.
The concept transport network seeks to:
> Improve walking and cycling connections from Leumeah Station to the town centre and entertainment centre;
> Improve directness of local bus routes and increase route reliability; and
> Improve road/ street legibility.
These improvements, and others as outlined, will encourage more people to walk, cycle and use public transport more often for local and regional trips.
Walking
The concept network includes a new link that enables a direct link from the station south-east to the residential precincts. This also forms a direct link to Smiths Creek reserve. Much of the southern residential precinct is not served by any footpaths.
The core network proposes to encourage more walking from Woodbine to Leumeah through additional footpaths, new links and crossings across Campbelltown Road.
The locations of the potential upgrades is listed in Table 10-6.
Table 10-6 Concept core pedestrian network to/ from station Roads/ Areas Key Crossing locations Description Concept Improvements
Old Leumeah Road/ Leumeah Road
Pembroke Road/ Old Leumeah Road, signalised crossing north-west and north-east leg only
East access, very direct Maintain crossing and investigate any need for path widening. New signalised crossing leg on south-west leg of Pembroke Road/ Old Leumeah Road
Pembroke Road (north-east of Old Leumeah Road)
Ross Payten Drive North-east access Maintain as is. Consider long term footpath offset and/or widening from kerb on south side of carriageway.
Cut through path between retail precinct linking to Smiths Creek reserve
Pembroke Road, pedestrian refuge provided off-set to path
Key south-east route, splitting at Smiths Creek Reserve
Provide segregated path and integrate with any proposed development in the precinct. Provide formal crossing at Pembroke Road

Glenfield to Macarthur Corridor Integrated Transport Strategy
3 August 2015 Cardno 200
Roads/ Areas Key Crossing locations Description Concept Improvements
Smiths Creek Reserve East recreational route, alternative route for nearby residential catchment.
Investigate opportunities to improve personal security.
Angle Road South route, no paths Provide footpath on at least one side of the carriageway.
O’Sullivan Road O’Sullivan Road/ Pembroke Road, roundabout
South route Investigate upgrade of intersection to signals.
Rudd Road Links from O’Sullivan Road to the south-west
Maintain as is. Investigate any need for path widening.
Kingsclare Street Rudd Road, no formal crossing facility
South access route. Provide footpath on east side of carriageway.
Plough Inn Road, Harbord Road
Plough Inn Road/ Airds Road, roundabout Plough Inn Road/ Hollylea Road, kerb ramps across Hollylea Road Plough Inn Road/ Campbelltown Road/ Harbord Road, signalised crossing on all legs. Harbord Road/ Rennie Road, roundabout. Harbord Road/ North Steyne Road, offset pedestrian refuges on all legs
North-west route to Woodbine residential precinct.
Provide continuous footpath on north and east side of carriageway. Complete missing link of footpath on Harbord Road between Rennie Road and Campbelltown Road on north side.
Campbelltown Road Campbelltown Road/ Rose Payton Drive, signals on south and east leg only. Campbelltown Road/ Collaroy Road, pedestrian refuge
North-west connection to residential area
Maintain as is.
Collaroy Road Collaroy Road Provide footpath for north side of road from Campbelltown Road to North Steyne Road
Airds Road North access to employment precinct
Complete missing link to Rose Payten Drive
Airds Road to Palm Court Proposed new link from Airds Road to Palm Court via Campbelltown Road (essentially an extension of Court Road)
North-west access to Woodbine.
Investigate feasibility of providing direct through route
Structure plan impact on pedestrian network
The majority of the walking demand will remain on the southern side of the railway corridor as a result of close proximity residential precincts and higher density land uses.
Green links will be integrated into the pedestrian network to facilitate both commuting and recreational use which will follow creek lines, easements and bushland. The majority of these green links are on the southern side of the rail corridor, which converge at the centre of the precinct.
The structure plan will support the use of the proposed network improvements with additional links to improve inter-precinct permeability.
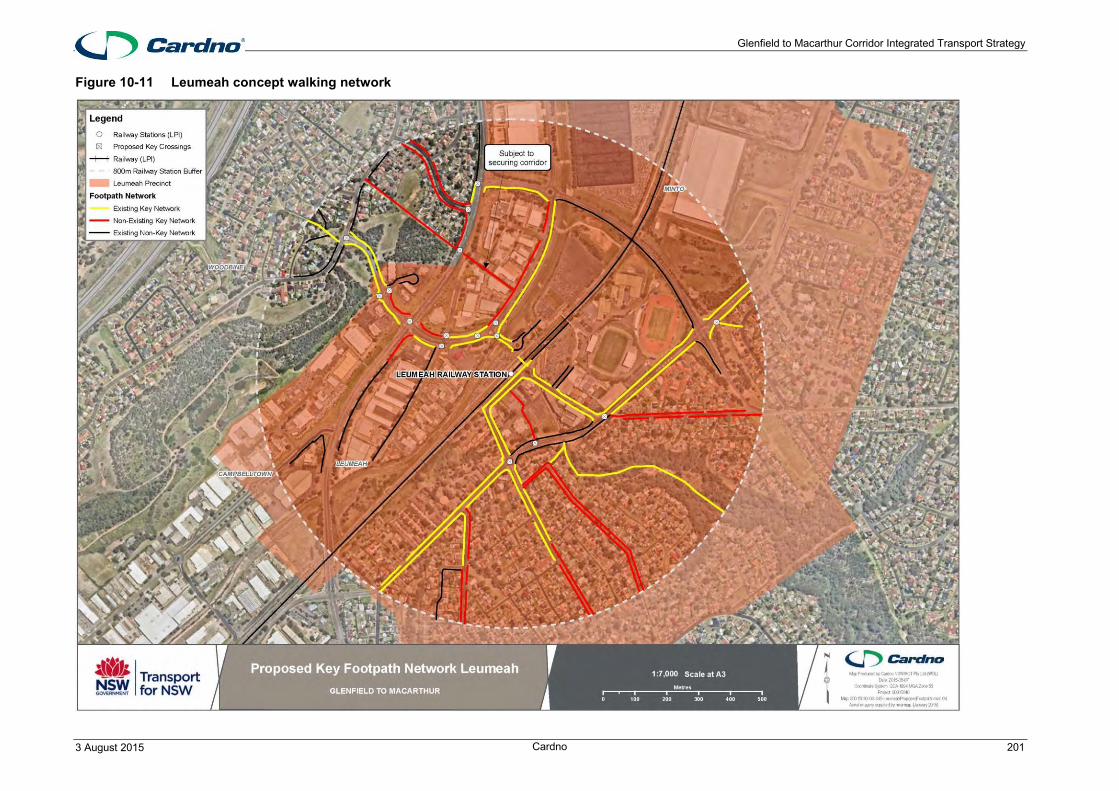
Glenfield to Macarthur Corridor Integrated Transport Strategy
3 August 2015 Cardno 201
Figure 10-11 Leumeah concept walking network

Glenfield to Macarthur Corridor Integrated Transport Strategy
3 August 2015 Cardno 202
Cycling
The regional cycling route continues to runs parallel to the rail corridor through the precinct.
The concept local routes will provide good coverage and access to the station and town centre.
There are five local routes that connect to Leumeah Station.
> A local route is proposed to closely follow Plough Inn Road and Harbord Road to the residential precinct to the north-west of the station. There is opportunity beyond the 800 metre station radius to provide a link to across the Hume Freeway on the pedestrian/ bike bridge linking Mary Wade Park in Woodbine with Fullwood Place in Claymore.
> The residential precincts closest to Leumeah Station are located on the south-east side of the railway line. A single local route could connect Leumeah Station through the centre of the existing retail/ commercial precinct bound by O’Sullivan Road/ Old Leumeah Road/ Pembroke Road to a key junction point at the intersection of Pembroke Road and Smiths Creek reserve. From this location, the local routes would diverge into four separate routes discussed as follows:
- Leumeah Road linking the eastern residential precinct;
- Smiths Creek Reserve linking both as a recreation and transport route alternative to the east;
- Angle Road/ Angle Road South providing the key south-east catchment link; and
- Illawong Road, O’Sullivan Road, Tallawarra Road and Kingsclare Street providing a link to the south residential catchment.
Figure 10-12 shows the concept regional and local cycle network for Leumeah.
Structure plan impact on cycling network
The concept key cycling network integrates with the proposed structure plan.
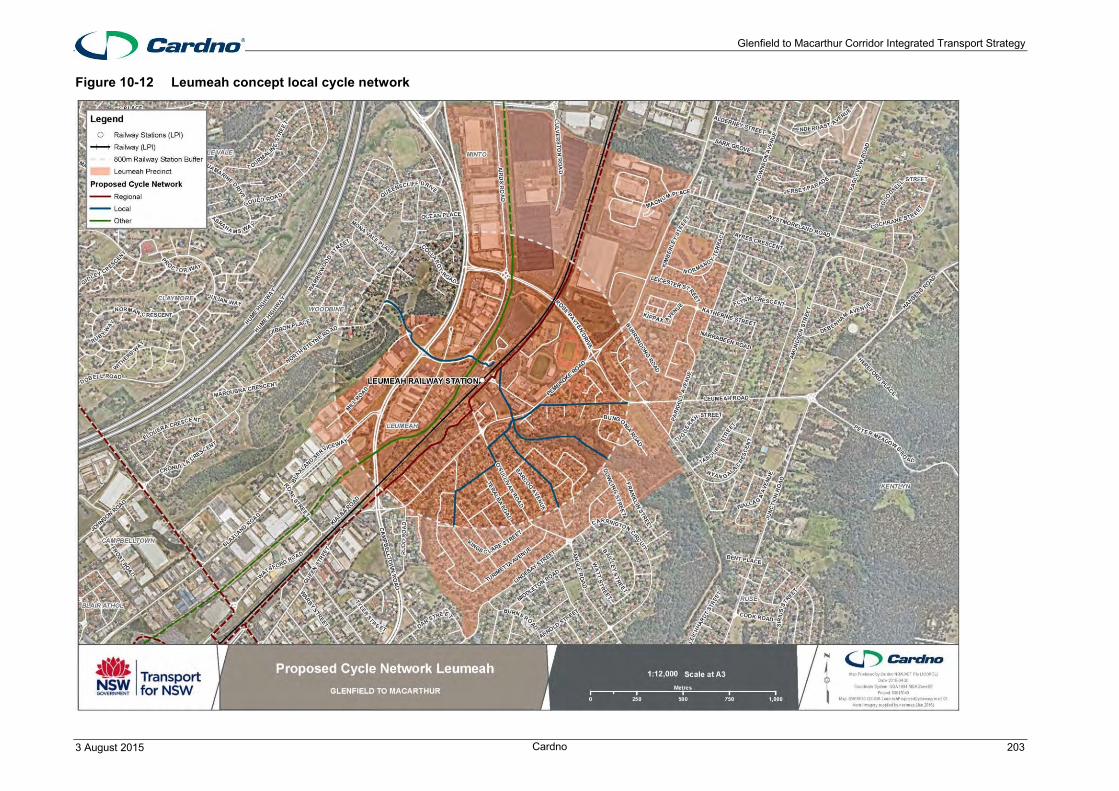
Glenfield to Macarthur Corridor Integrated Transport Strategy
3 August 2015 Cardno 203
Figure 10-12 Leumeah concept local cycle network

Glenfield to Macarthur Corridor Integrated Transport Strategy
3 August 2015 Cardno 204
Bus
Leumeah is serviced by two local routes, the 881 and 882, however only the 881 has a stop at the station. The 881 also provides the best coverage of Leumeah and also encompasses Minto Heights and a link to Campbelltown Station.
There is potential for route refinement to both straighten the route in some sections and minimise crossover to increase coverage and speed, however within the study area, service to and from the station is reasonably direct.
Structure plan impact on bus network
The structure plan would not impact on any existing bus routes and maintain flexibility for potential route changes.
Road
No new connections are proposed within the Leumeah precinct.
Structure plan impact on road network
The overall proposed road network will remain largely similar to existing conditions, with additional minor links on local roads to provide increased connectivity for residents.
Structure plan impact on transport network summary
The structure plan proposes to increase residential density in the south-east quadrant of Leumeah Railway Station and improve walking and cycling connections to the town centre and entertainment uses. This allows the town centre and entertainment uses to be accessed by local residents and entertainment patrons on event days.
Key network improvements include:
> New walking and cycling network to support access to the entertainment area, station and the retail and commercial centre; and
> Recommended increase in rail and bus services in the peak periods
Freight
The integrity of key arterial roads should be maintained to facilitate the increase in freight movements expected.
Structure plan impact on freight network
The proposed structure plan is maintain and enhance land uses in their existing location. Additional road links on the east side are expected to increase freight and delivery access to the residential precincts.

Glenfield to Macarthur Corridor Integrated Transport Strategy
3 August 2015 Cardno 205
10.2.6 Campbelltown
The precinct provides regional land uses and a high amount of employment, which means that demand for space in this area is at a premium.
The Campbelltown Station is located in the centre of the precinct, with residential use from the north-east to the south-east, commercial use from the south-east to the north-west adjoining the railway line and industrial use to the outer west of the precinct. Large areas of land surrounding the station contain at-grade car parking, particularly to the north-west of the station indicating the station as a key Park & Ride location in the study area.
The key opportunities for the precinct are providing regional connections to the town centre, improving walking and cycling networks and legibility and developing policies for development parking rates and on-street parking. The concept improvements aim to support the primary precinct objective:
To support, reinforce and grow Campbelltown as a residential, retail, commercial and industrial area within the region through housing and employment growth with the provision of sustainable transport enhancements, including walking, cycling and public transport infrastructure and services.
The Campbelltown precinct has potential for land use density and transport improvements. The current Campbelltown Interchange consists of large bus interchange, bike parking on both sides of the station, Kiss & Ride, Park & Ride and taxi spaces.
The concept transport network seeks to:
> Improve walking and cycling connections within Campbelltown CBD (including the station);
> Improve directness of local bus routes and increase route reliability; and
> Improve road/street legibility.
These improvements, and others as outlined, will encourage more people to walk, cycle and use public transport more often for local and regional trips.
Walking
Campbelltown has a well-established pedestrian network. The diversity of land uses within Campbelltown CBD results in the town centre requiring more key local routes. The railway line limits permeability across the corridor which has been used to separate industrial land uses with retail/ commercial land uses. The main pedestrian crossing location is through the station.
On the south side of the station, the key north-west to south-east routes provide access to residential areas along Chamberlain Street, Broughton Street, Cordeaux Street/ Condamine Street and Dumaresq Street. This route is very direct and extends for a considerable distance aiding legibility. The key north-east to south-west pedestrian routes include Hurley Street, Queen Street, Carberry lane/ Howe Street and Oxley Street/ Moore Street. The network on the southern side of the station is comprehensive and provides connections to the majority of the town centre.
On the north side of the station, routes are provided on Farrow Road, Badgally Road and a new connection to Blair Athol. These connections will provide direct access to the station and town centre.
The locations of the concept upgrades are listed in Table 10-7.
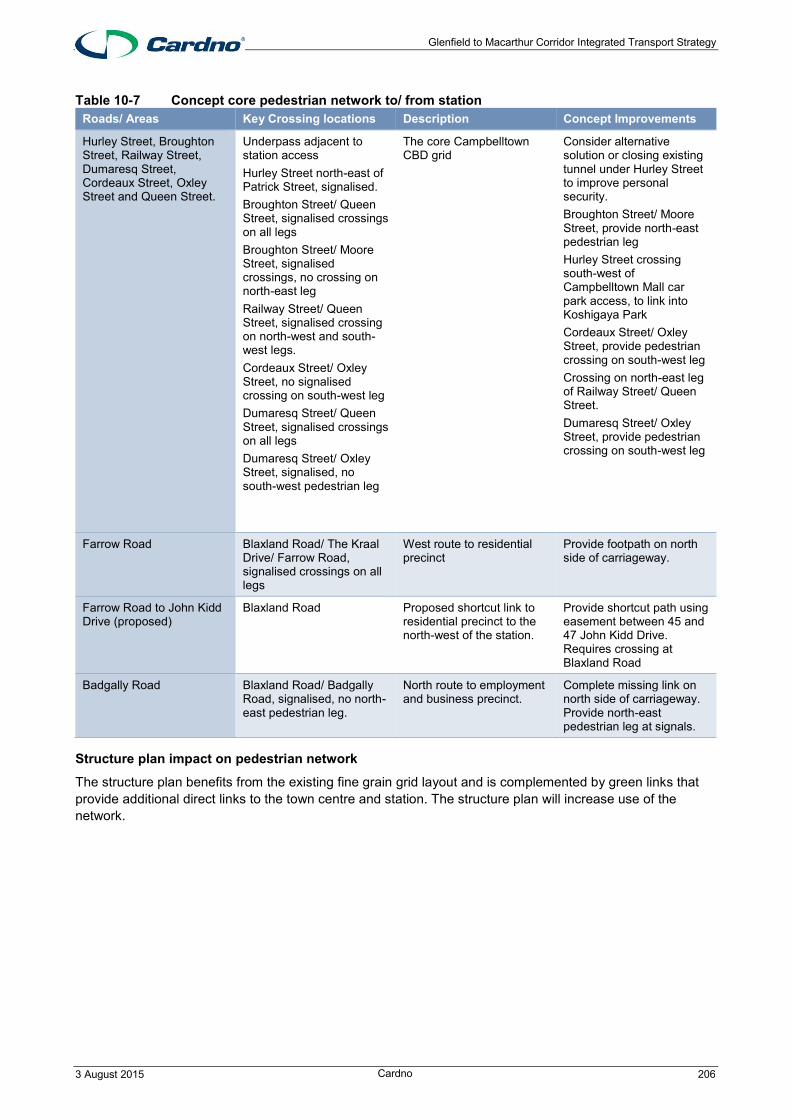
Glenfield to Macarthur Corridor Integrated Transport Strategy
3 August 2015 Cardno 206
Table 10-7 Concept core pedestrian network to/ from station Roads/ Areas Key Crossing locations Description Concept Improvements
Hurley Street, Broughton Street, Railway Street, Dumaresq Street, Cordeaux Street, Oxley Street and Queen Street.
Underpass adjacent to station access Hurley Street north-east of Patrick Street, signalised. Broughton Street/ Queen Street, signalised crossings on all legs Broughton Street/ Moore Street, signalised crossings, no crossing on north-east leg Railway Street/ Queen Street, signalised crossing on north-west and south-west legs. Cordeaux Street/ Oxley Street, no signalised crossing on south-west leg Dumaresq Street/ Queen Street, signalised crossings on all legs Dumaresq Street/ Oxley Street, signalised, no south-west pedestrian leg
The core Campbelltown CBD grid
Consider alternative solution or closing existing tunnel under Hurley Street to improve personal security. Broughton Street/ Moore Street, provide north-east pedestrian leg Hurley Street crossing south-west of Campbelltown Mall car park access, to link into Koshigaya Park Cordeaux Street/ Oxley Street, provide pedestrian crossing on south-west leg Crossing on north-east leg of Railway Street/ Queen Street. Dumaresq Street/ Oxley Street, provide pedestrian crossing on south-west leg
Farrow Road Blaxland Road/ The Kraal Drive/ Farrow Road, signalised crossings on all legs
West route to residential precinct
Provide footpath on north side of carriageway.
Farrow Road to John Kidd Drive (proposed)
Blaxland Road Proposed shortcut link to residential precinct to the north-west of the station.
Provide shortcut path using easement between 45 and 47 John Kidd Drive. Requires crossing at Blaxland Road
Badgally Road Blaxland Road/ Badgally Road, signalised, no north-east pedestrian leg.
North route to employment and business precinct.
Complete missing link on north side of carriageway. Provide north-east pedestrian leg at signals.
Structure plan impact on pedestrian network
The structure plan benefits from the existing fine grain grid layout and is complemented by green links that provide additional direct links to the town centre and station. The structure plan will increase use of the network.
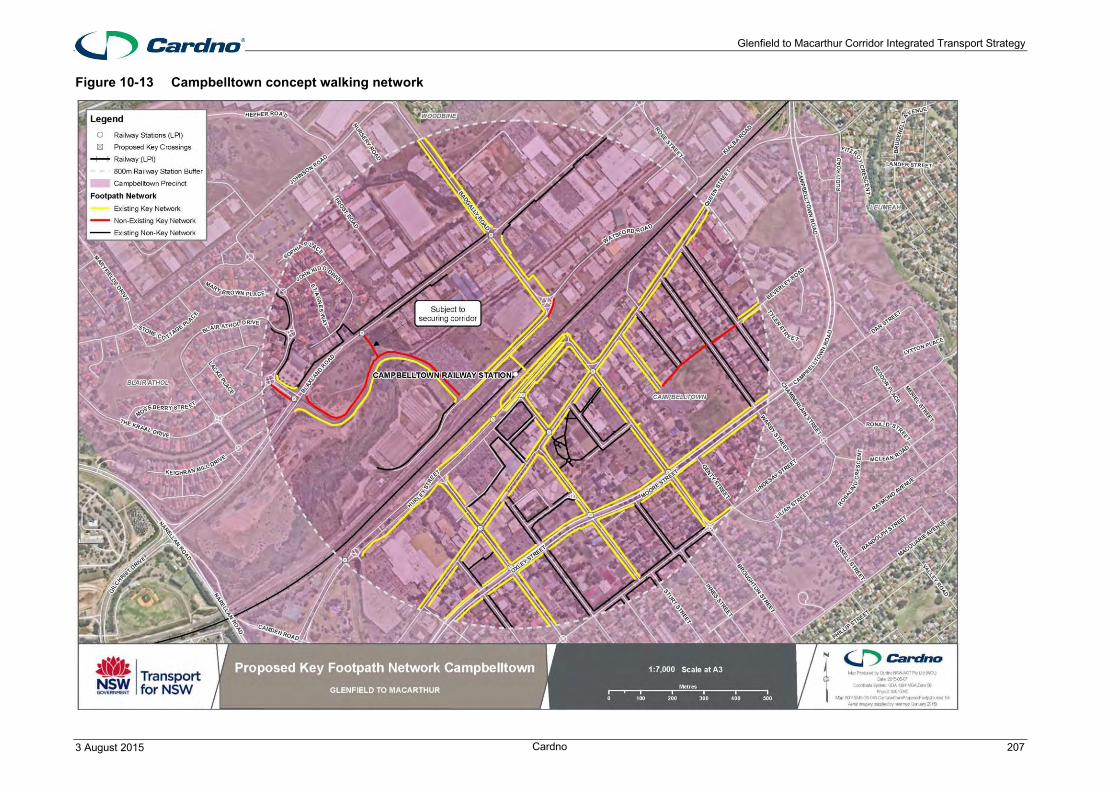
Glenfield to Macarthur Corridor Integrated Transport Strategy
3 August 2015 Cardno 207
Figure 10-13 Campbelltown concept walking network

Glenfield to Macarthur Corridor Integrated Transport Strategy
3 August 2015 Cardno 208
Cycling
Campbelltown would form a key junction in the concept regional bicycle network. In addition to the parallel railway corridor route, a path along the Badgally Road/ Broughton Street corridor would link with the South West Growth Centre and south-west to the proposed Smiths Creek Reserve recreational path. A link along Blaxland Road is provided to link the Narellan Road path to the existing Farrow Road shared path.
Only one local route links directly with the station, other local routes are proposed to link to the station via the regional railway corridor route cycle route. This route would comprise of Railway Street, potentially through Mawson Park, Cordeaux Street down to Lindesay Street and continuing down Condamine Street. This would service the southern catchment of the station.
Serving the eastern catchment would be the Landon Avenue, Iolanthe Street and Beverley Road, which includes an extension from Iolanthe Street to Beverley Road. This route would also pass Campbelltown Performing Arts High School, Lomandra School, Beverly Park School and Campbelltown North Public School via the Campbelltown Road bridge.
Routes to the south of the study area should be investigated further to connect into the Condamine Street proposed local route to provide accessibility from this area of Campbelltown.
Figure 10-14 shows the concept regional and local cycle network for Campbelltown.
Structure plan impact on cycling network
The concept key cycling network integrates with the proposed structure plan.
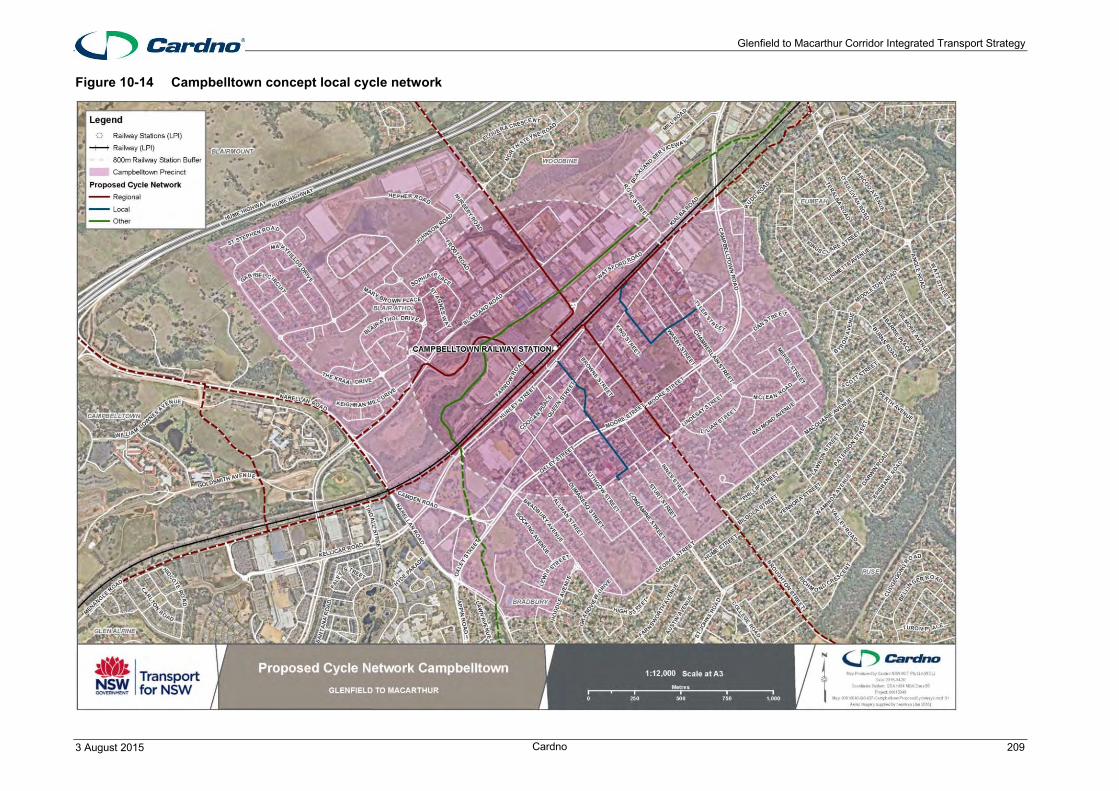
Glenfield to Macarthur Corridor Integrated Transport Strategy
3 August 2015 Cardno 209
Figure 10-14 Campbelltown concept local cycle network
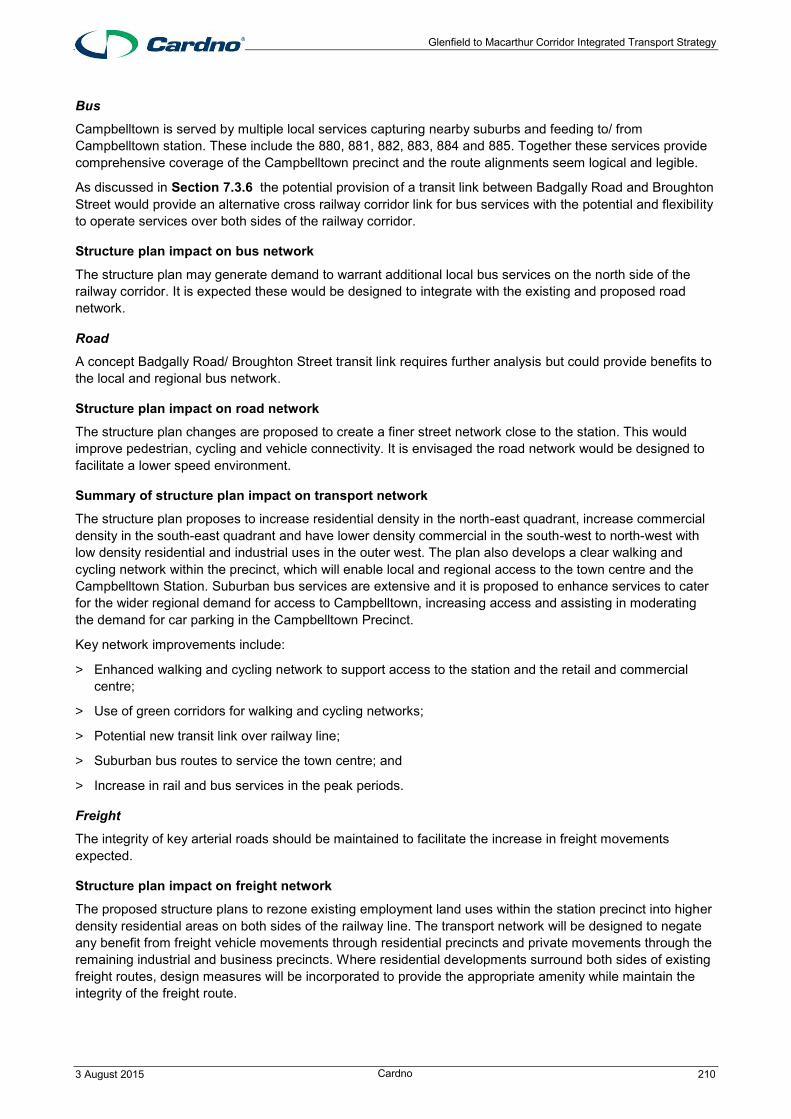
Glenfield to Macarthur Corridor Integrated Transport Strategy
3 August 2015 Cardno 210
Bus
Campbelltown is served by multiple local services capturing nearby suburbs and feeding to/ from Campbelltown station. These include the 880, 881, 882, 883, 884 and 885. Together these services provide comprehensive coverage of the Campbelltown precinct and the route alignments seem logical and legible.
As discussed in Section 7.3.6 the potential provision of a transit link between Badgally Road and Broughton Street would provide an alternative cross railway corridor link for bus services with the potential and flexibility to operate services over both sides of the railway corridor.
Structure plan impact on bus network
The structure plan may generate demand to warrant additional local bus services on the north side of the railway corridor. It is expected these would be designed to integrate with the existing and proposed road network.
Road
A concept Badgally Road/ Broughton Street transit link requires further analysis but could provide benefits to the local and regional bus network.
Structure plan impact on road network
The structure plan changes are proposed to create a finer street network close to the station. This would improve pedestrian, cycling and vehicle connectivity. It is envisaged the road network would be designed to facilitate a lower speed environment.
Summary of structure plan impact on transport network
The structure plan proposes to increase residential density in the north-east quadrant, increase commercial density in the south-east quadrant and have lower density commercial in the south-west to north-west with low density residential and industrial uses in the outer west. The plan also develops a clear walking and cycling network within the precinct, which will enable local and regional access to the town centre and the Campbelltown Station. Suburban bus services are extensive and it is proposed to enhance services to cater for the wider regional demand for access to Campbelltown, increasing access and assisting in moderating the demand for car parking in the Campbelltown Precinct.
Key network improvements include:
> Enhanced walking and cycling network to support access to the station and the retail and commercial centre;
> Use of green corridors for walking and cycling networks;
> Potential new transit link over railway line;
> Suburban bus routes to service the town centre; and
> Increase in rail and bus services in the peak periods.
Freight
The integrity of key arterial roads should be maintained to facilitate the increase in freight movements expected.
Structure plan impact on freight network
The proposed structure plans to rezone existing employment land uses within the station precinct into higher density residential areas on both sides of the railway line. The transport network will be designed to negate any benefit from freight vehicle movements through residential precincts and private movements through the remaining industrial and business precincts. Where residential developments surround both sides of existing freight routes, design measures will be incorporated to provide the appropriate amenity while maintain the integrity of the freight route.

Glenfield to Macarthur Corridor Integrated Transport Strategy
3 August 2015 Cardno 211
10.2.7 Macarthur
The Macarthur Station precinct, has residential use in the outer south, retail and bulky goods adjoining the railway line in the south, hospital in the south-east and educational uses in the north. The precinct provides a regional shopping centre, a university, TAFE and hospital. The land uses are diverse however the scale of each of the major uses and the transport network limit the walkability in the precinct.
The key opportunities for the precinct are providing walking and cycling connections through large blocks of land, providing additional opportunities to cross Menangle Road and reducing the reliance on private motor vehicle use for access to the key regional land uses. The concept improvements aim to support the primary precinct objective:
To support, reinforce and grow Macarthur as a residential, retail and education area within the region through housing and employment growth with the provision of sustainable transport enhancements, including walking, cycling and public transport infrastructure and services.
The Macarthur precinct has potential for increased land use density and transport improvements. The current Macarthur Interchange was upgraded in 2010 and includes a Park & Ride, Kiss & Ride, taxi stand, bus interchange and bike parking.
The concept transport network seeks to:
> Improve walking and cycling connections from Macarthur Station to the residential areas to the south;
> Improve directness of local bus routes and increase route reliability; and
> Improve road/street legibility.
These improvements, and others as outlined, will encourage more people to walk, cycle and use public transport more often for local and regional trips.
Walking
The footpath network is relatively modern in Macarthur and continues to be expanded with land use development in the precinct. The concept network completes some minor missing links and proposes improved crossing facilities at key locations. Development surrounding Macarthur Square shopping centre continues, however it would be ideal for a north-south footpath be provided on the west side of the shopping centre for a more direct link to residential precincts to the south.
On the north side of the station, the existing footpaths from the station to the education precinct and beyond will be maintained along with a new connection to western Blair Athol.
On the south side of the station, priority pedestrian routes are proposed along Bolger Street/ Parc Guell Drive and Hidcote Road.
The locations of the concept upgrades is listed in Table 10-8.

Glenfield to Macarthur Corridor Integrated Transport Strategy
3 August 2015 Cardno 212
Table 10-8 Concept core pedestrian network to/from station Roads/ Areas Key Crossing locations Description Concept Improvements
Menangle Road Menangle Road, pedestrian bridge.
Access adjacent to and along the south side of the railway corridor. West route to residential precinct.
Provide path on the north side of the carriageway to link to a proposed crossing at Bolger Street
Macarthur Square South route through shopping centre.
Bolger Street, Parc Guell Drive
Menangle Road/ Bolger Street, proposed crossing. Bolger Street/ Kellicar Road, signalised crossings on north, south and west legs.
East through to south access. Link to Campbelltown Hospitals.
Signalised crossing on east leg of Kellicar Road/ Bolger Street. Widen footpath between Kellicar Road and Gilchrist Drive.
Gilchrist Drive East of Englorie Park Drive, roundabouts and priority control Gilchrist Drive/ Narellan Road, signalised
South option from Bolger Street or Hidcote Road.
Improve crossing facilities at roundabouts at Gilchrist Drive/ Therry Road and Gilchrist Drive/ Englorie Drive
Talby Street, Barber Reserve, Hidcote Road
Menangle Road/ Talby Street, roundabout. Talby Street/ Stowe Avenue, proposed
South route option with some western residential catchment.
Provide formal crossing at Stowe Avenue and Talby Road/ Menangle
University Basin Reserve Goldsmith Avenue, assumed crossing will be completed with new road alignment.
North route to education precinct. Potential to connect north to Narellan Road but no real catchment.
None anticipated to be required
Goldsmith Avenue East west route along stations northern catchment. Educational land uses including University of Western Sydney and Campbelltown TAFE College.
It is expected that high quality paths will be provided on both sides of the carriageway when completed.
Structure plan impact on pedestrian network
The structure plan is based on enhancing the network with minor links. There are two pedestrian routes running parallel to the rail corridor, along Menangle Road and Gilchrist Drive/ Goldsmith Avenue.
Green links within and surrounding the precinct will be integrated with the pedestrian network.

Glenfield to Macarthur Corridor Integrated Transport Strategy
3 August 2015 Cardno 213
Figure 10-15 Macarthur concept walking network
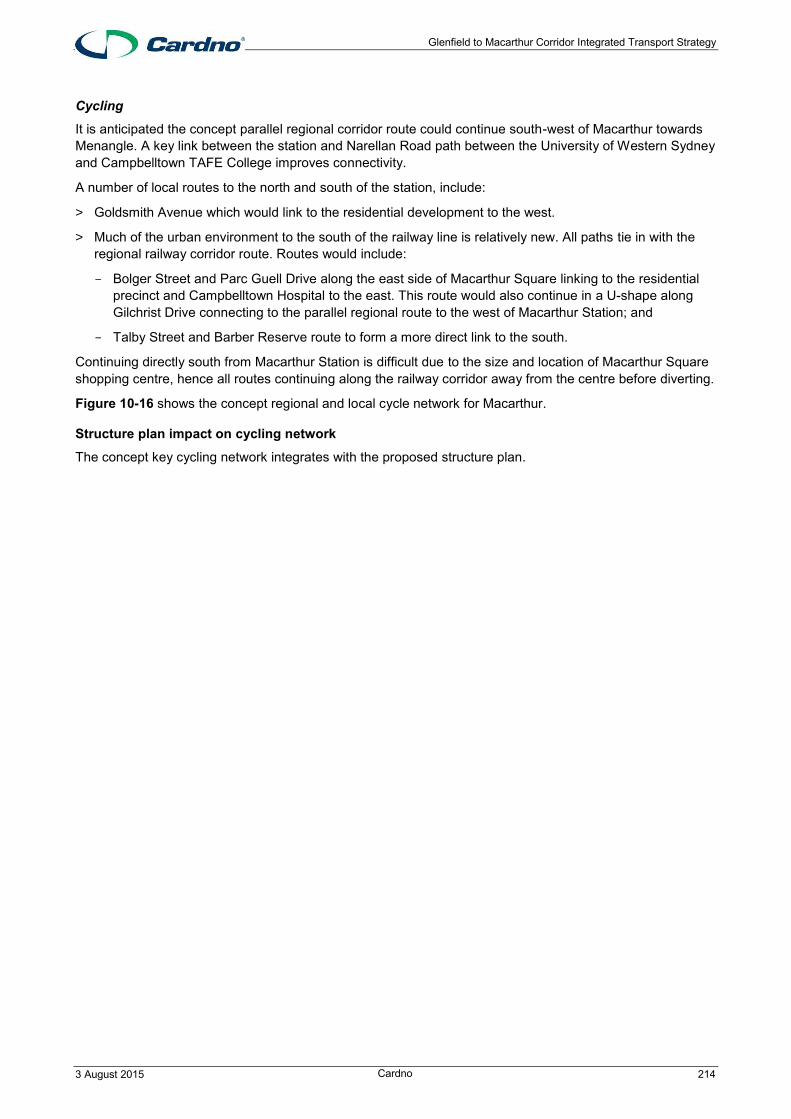
Glenfield to Macarthur Corridor Integrated Transport Strategy
3 August 2015 Cardno 214
Cycling
It is anticipated the concept parallel regional corridor route could continue south-west of Macarthur towards Menangle. A key link between the station and Narellan Road path between the University of Western Sydney and Campbelltown TAFE College improves connectivity.
A number of local routes to the north and south of the station, include:
> Goldsmith Avenue which would link to the residential development to the west.
> Much of the urban environment to the south of the railway line is relatively new. All paths tie in with the regional railway corridor route. Routes would include:
- Bolger Street and Parc Guell Drive along the east side of Macarthur Square linking to the residential precinct and Campbelltown Hospital to the east. This route would also continue in a U-shape along Gilchrist Drive connecting to the parallel regional route to the west of Macarthur Station; and
- Talby Street and Barber Reserve route to form a more direct link to the south.
Continuing directly south from Macarthur Station is difficult due to the size and location of Macarthur Square shopping centre, hence all routes continuing along the railway corridor away from the centre before diverting.
Figure 10-16 shows the concept regional and local cycle network for Macarthur.
Structure plan impact on cycling network
The concept key cycling network integrates with the proposed structure plan.
Glenfield to Macarthur Corridor Integrated Transport Strategy
3 August 2015 Cardno 215
Figure 10-16 Concept cycle network Macarthur

Glenfield to Macarthur Corridor Integrated Transport Strategy
3 August 2015 Cardno 216
Bus
It is proposed to undertake a wider network review of bus services given the low patronage at some key stops. Many existing services between Macarthur and Campbelltown simply replicate the railway service. Many buses to/ from Narellan Road heading towards Campbelltown deviate to Macarthur. The benefit and disadvantage of this operation requires further assessment.
The 887 is also a regional route and the local operation south of Macarthur reduces the effectiveness as a regional service. Overall, the precinct coverage is good.
The 887 could be separated into a local route and a regional route in line with the desired service characteristics to separate local and regional services south of Macarthur.
Road
Pending the outcome of the wider bus network review, the feasibility of the Menangle Road to Camden Road transit link under Narellan Road which could provide benefits to the local and regional bus networks.
Structure plan impact on road network
The proposed road network will be largely unchanged.
Summary of structure plan impact on transport network
The structure plan proposes to maintain the land uses in their current location and improve local transport connections. The plan creates new connections through large parcels of land, connects the surrounding residential areas to the station and shopping centre and utilises green corridors for active transport routes.
Key network improvements include:
> Enhanced walking and cycling network to support access to the station, the shopping centre and educational faculties;
> Maximise and integrates the use of green corridors for walking and cycling routes; and
> Increase public transport services.
Freight
The integrity of key arterial roads should be maintained to facilitate the increase in freight movements expected, particularly to the retail land uses.
Structure plan impact on freight network
No impact is expected as a result of changes to the minor changes proposed for the precinct.

Glenfield to Macarthur Corridor Integrated Transport Strategy
3 August 2015 Cardno 217
10.3 Multi-criteria assessment The objectives developed as part of the transport strategy were also used to qualitatively assess the package of works for each precinct, categorised into mode type to confirm an overall benefit and to rank each package of works against each other. In terms of infrastructure improvements of the 17 objectives developed for the corridor, only objectives 1 to 15 are relevant.
The scoring ranged from 1 to 5:
> 1: Major reduction;
> 2: Minor reduction;
> 3: Same;
> 4: Minor improvement; and
> 5: Major improvement.
Overall scores less than 45 indicate the package of works may reduce the state of transport compared to the existing scenario, scores of 45 – 50 would likely retain a similar level of service and scores greater than 50 would likely result in an improvement in conditions. The scoring results are provided in Table 10-9.
Table 10-9 MCA precinct and mode scores Precinct Walking Cycling Bus Road
Glenfield 67 64 66 59
Macquarie Fields 66 66 58 66
Ingleburn 67 64 53 64
Minto 55 60 51 53
Leumeah 63 66 57 47
Campbelltown 63 67 56 56
Macarthur 52 64 50 48
The scoring shown in Table 10-9 indicates that the proposals are generally beneficial, however the benefits to the road network in Leumeah and Macarthur are not as beneficial as the other precincts.
The detailed multi-criteria assessment (MCA) and scoring for each precinct is provided in Appendix C.

Glenfield to Macarthur Corridor Integrated Transport Strategy
3 August 2015 Cardno 218
11 Summary and conclusion
The Glenfield to Macarthur corridor is an area that NSW Government has identified as having potential for sustainable targeting of population, employment and economic growth. The NSW Government engaged Cardno to document, investigate, analyse and plan for future natural growth in this area, as well as assess the potential for the transport network to accommodate additional housing and employment in seven station precincts: Glenfield, Macquarie Fields, Ingleburn, Minto, Leumeah, Campbelltown and Macarthur. Projected population and employment growth have been determined for each precinct and a structure plan developed, which details the proposed changes to land uses and the street network.
The NSW Government are proposing an increase of 9,000 in population above previously that forecast over a 20 year period, which is 0.03% of the South West Growth Centre’s 300,000 population growth or 0.01% of Sydney’s 1,600,000 population growth. It is considered this is a minor growth in transport demand and this Integrated Transport Strategy identifies the improvements recommended to cater for this increase in population and employment.
Existing land use
The existing land use within the corridor is a mix of low density residential, light-medium industrial, commercial and educational land uses. A summary of each precinct is provided below:
Glenfield: low density residential housing and educational uses. These uses are supported through a local main street, with essential daily goods. Key statistics – 7,800 residents and 1,500 jobs.
Macquarie Fields: low density residential housing and recreational use (golf course). Glenquarie Town Centre is located approximately 2 kilometres west of Macquarie Fields Station, which creates a somewhat segmented town centre. Key statistics – 6,900 residents and 1,600 jobs.
Ingleburn: medium sized town centre that provides goods and services for the local area. Ingleburn is one of the larger precincts in the corridor. Ingleburn has industrial land uses adjacent to the Hume Motorway that provides good access to the arterial network and reduces through routing within retail and residential areas. Key statistics - 14,500 residents and 11,800 jobs.
Minto: large industrial land use element along the railway line, with MIST located in this precinct. Minor low density residential use for the remaining portion of the precinct. Key statistics - 2,100 residents and 3,500 jobs.
Leumeah: entertainment precinct with a sports stadium (Campbelltown Sports Stadium) and leagues club with some low density residential. Key statistics – 7,900 residents and 5,200 jobs.
Campbelltown: medium sized CBD with commercial and retail, this is identified as a strategic centre in A Plan to Grow Sydney. Some bulky goods, light industrial and low density residential. Key statistics – 9,600 residents 10,400 jobs.
Macarthur: large shopping centre (Macarthur Square) with bulky goods, university (University of Western Sydney) and TAFE Campbelltown and low density residential. Key statistics – 4,800 residents and 7,000 jobs.
The existing low density land uses within the corridor create a private vehicle reliant environment, where walking, cycling or using public transport are less convenient and time competitive than using a private vehicle.
Existing transport network
The walking and cycling networks in the study corridor are incomplete and not legible. There are missing links in the basic network and also barriers to crossing major features, such as creeks and main roads. The network also does not connect to key destinations which is likely to result in low usage generally.
The Glenfield to Macarthur Corridor is serviced by three lines on the Sydney Trains suburban network (the T2 South Line, the T5 Cumberland Line and the South West Rail Link) and one line on the intercity network (the Southern Highlands Line). City-bound services in the AM peak period run every 15 minutes. The corridor also facilitates regional and interstate rail services.

Glenfield to Macarthur Corridor Integrated Transport Strategy
3 August 2015 Cardno 219
The bus network servicing the Glenfield to Macarthur Corridor includes different types of routes. These routes include local shopping and residential loops, routes that traverse the length of the corridor providing connectivity to sections east of the railway line and routes that provide connections to centres in other regions such as Camden, Wollongong and Liverpool. The network is considered to be a coverage-based network that serves a large portion of the area, however results in less frequent or direct services.
The study corridor has an extensive road network with a clear hierarchy. There are ongoing programs to upgrade and support road performance through the corridor.
Existing travel patterns
The top three destinations for residents in the study corridor travelling to work are Sydney – Outer South West (38%), Sydney – City and Inner South (15%) and Sydney – South West (15%). Many people live and work within the region.
The study corridor is highly reliant on private vehicles as a means of transportation and access. 75% of residents drive or are driven to work and for those employed in the study corridor, 91% of people drive or are driven to work. This mode share is high for private vehicle use given over 30% of residents live and work in within the corridor, and many workplace destinations are within to the local area or region. The high private vehicle mode share contributes to local and regional road congestion in some areas of the corridor. In the Sydney Greater Metropolitan Area an average of 1% of people ride to work and 4% of people walk to work. The study corridor mode share is approximately 1% and 2% for riding and walking respectively. These low mode shares also add pressure to the road network.
An analysis of train patronage data for the ten year period 2004 – 2013 indicates that patronage has fallen slightly over the period. When compared to 2004 daily patronage, average daily trips within the corridor vary from a rise of up to 9% in 2009 to a reduction of 6% in 2013. As a comparison, on the Sydney metropolitan railway network patronage increased by 18% over the same period 2004-2013.
Along the study corridor, Campbelltown Station accounts for the highest patronage with typically 25% of the daily passengers and an average of approximately 12,600 daily passengers over the 10 year period. This is followed by Glenfield at 20% and an average 10,000 daily passengers. The least patronised station is Macquarie Fields accounting for only 5% of daily passenger volumes within the corridor.
Opal data, which represents a main payment method for bus use, was assessed for major bus stops in the study corridor for February 2015. The key findings of the analysis for tap on movements found that:
> Eight out of the top ten busiest stops are at train stations;
> The top ten stops accommodated 4,400 passenger trips on an average weekday;
> The top ten stops accounted for 80% of all trips; and
> The busiest bus stop location by passenger volume was Campbelltown Interchange with just over 2,150 trips on an average weekday.
Precinct structure plans and the future transport network
Each precinct structure plan outlines a method to cater for population and employment growth within the study area and to create a more liveable environment. This includes encouragement of walking, cycling and use of public transport through dwelling location, density and urban design. The structure plans propose to increase density around railway stations to maximise accessibility within the corridor and connectivity to wider Sydney for employment and other events. The proposed local street design is supportive of low speed environments and also presents opportunities for use of rear lane access for deliveries, reducing the amount of heavy vehicles on local roads and increasing amenity for people on the street.
To guide the development of the concept transport network, which supports the precinct structure plans, a number of objectives were developed to ensure the Integrated Transport Strategy’s recommended improvements were sustainable and aligned with NSW Government goals.
The concept transport network presented in this Integrated Transport Strategy for the Glenfield to Macarthur Corridor supports the structure plans with recommended improvements to walking, cycling, public transport and street networks to reduce the reliance on private motor vehicles. The proposed regional and local transport networks seek to provide increased accessibility and mobility for residents and employees.

Glenfield to Macarthur Corridor Integrated Transport Strategy
3 August 2015 Cardno 220
The concept transport network includes:
> A well-defined walking network and increased permeability;
> A well-defined cycling network and associated parking facilities;
> Improved reliability and reduced waiting times for public transport;
> Road safety reviews around key transport hubs;
> A review of bus routes to consider service-based network along key routes;
> Planning and facilitation of freight movements in the region through rail and motorway initiatives; and
> The potential for new concept road links across the railway line for improved connectivity between the eastern and western sides of the corridor for all transport modes.
Next steps and opportunities
This strategy also identifies actions to be undertaken to further analyse and plan for the study corridor in more detail, including:
> Local government development of:
- A walking plan and cycling plan for the area; and
- Local road and parking strategies, including analysis and management of parking at a precinct level, particularly for Campbelltown and Leumeah.
> Planning and development controls to support the concept transport network;
> Assessment of appropriate land uses and separation adjacent to the rail corridor;
> Potential reprioritisation of transport initiatives within existing programs;
> Further consideration within:
- Bus network reviews;
- South West Growth Centre planning; and
- Rail opportunities and strategic planning.
> Detailed precinct planning: including assessment and identification of transport infrastructure interventions;
> Strategic road network analysis: to determine the cumulative impacts within the South West area. This should include the South West Growth Centre, Badgerys’s Creek Airport, Macarthur South and Western Sydney Employment area.
> Local area road network analysis: to understand local road network performance and potential negative impacts as a result of the proposed concept links across the railway corridor.
> Local area transport network design: detailed planning and design of the street network to support a safe low-speed environment, including investigation of 40km/hr high pedestrian activity areas and local area traffic management facilities.
This Integrated Transport Strategy provides a framework to enable more walking cycling and public transport use through the corridor and recommends the integration of transport provisions with the precinct structure plans to accommodate future travel demand. The concept transport network and associated policy and planning initiatives could be implemented over a number of years to maximise benefit to the community and minimise local social and environment impacts.
Glenfield to Macarthur Corridor Integrated Transport Strategy
3 August 2015 Cardno 221
APPENDIX A LAND ZONINGNING
Station LEP 2002
Glenfield > Station is zoned 5(a) Special Uses A Railway
> Land to the east is 3(c) Neighbourhood Business 5(a) Special Uses A Car Park, with predominately 2(b) Residential B surrounding.
> Land to the west is zoned 5(a) Special Uses School.
Macquarie Fields
> Station is zoned 5(a) Special Uses A Railway.
> To the east is predominately 2(b) Residential, south east of the station is 5(a) Special Uses Parking.
> Land to the west is classified under Campbelltown LEP 112 Macquarie Field House.
Ingleburn > Station is zoned 5(a) Special Uses A Railway.
> Land to the east is zoned 10(b) District Comprehensive Centre.
> Land to the west is a mix of 4(b) Industry B and 4(c) Industry C.
Minto > Station is zoned 5(a) Special Uses A Railway.
> To the east is 3 (c) Neighbourhood Business and 6(a) Local Open Space.
> To the west is 4(b) Industry B.
Leumeah > Station is zoned 5(a) Special Uses A Railway.
> To the east is 10(c) Local Comprehensive Centre and 6(a) Local Open Space.
> To the west is 5(a) Special Uses A Car Parking which is surrounded by 4(b) Industry B.
Campbelltown > Station is zoned 5(a) Special Uses A Railway.
> To the east is 10(a) Regional Comprehensive Centre and 6(a) Local Open Space.
> To the west is 4(b) Industry B with some 5(a) Special Uses Car Parking.
Macarthur > Station is zoned 5(a) Special Uses A Railway.
> Land surrounding is 10(a) Regional Comprehensive Centre.
Glenfield to Macarthur Corridor Integrated Transport Strategy
3 August 2015 Cardno 222
APPENDIX B TRAFFIC MODELLING REPORT SUMMARY
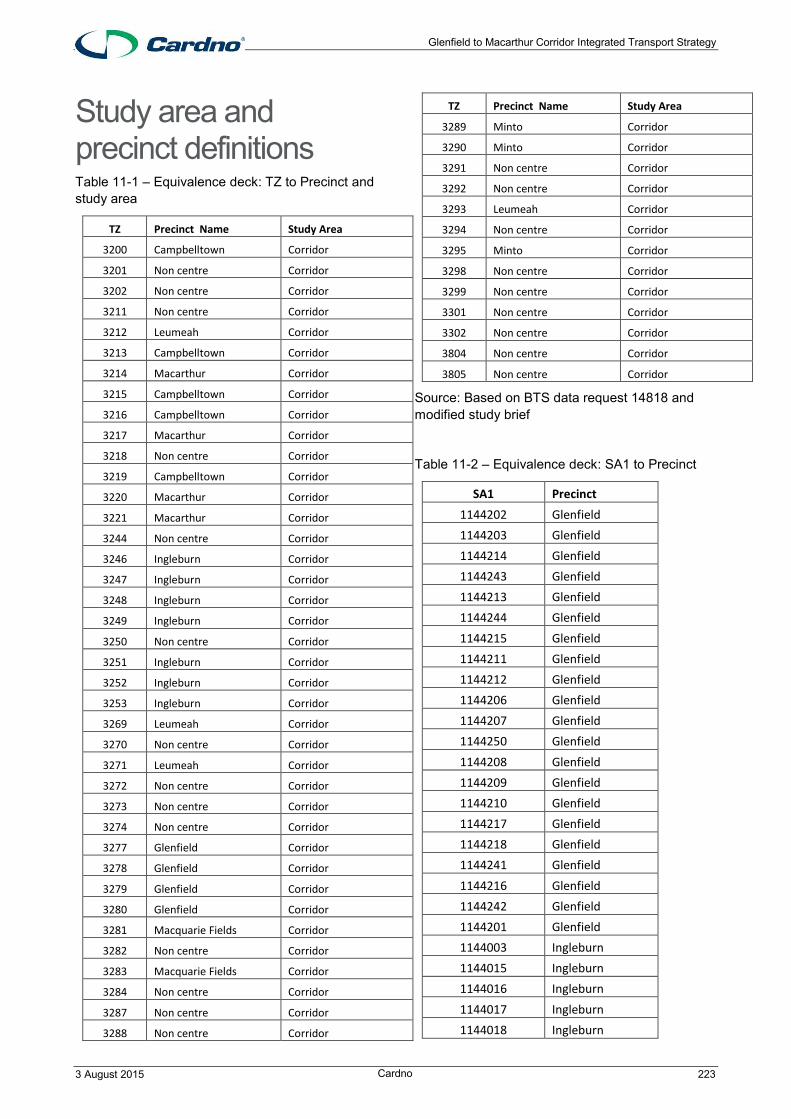
Glenfield to Macarthur Corridor Integrated Transport Strategy
3 August 2015 Cardno 223
Study area and precinct definitions Table 11-1 – Equivalence deck: TZ to Precinct and study area
TZ Precinct Name Study Area
3200 Campbelltown Corridor
3201 Non centre Corridor
3202 Non centre Corridor
3211 Non centre Corridor
3212 Leumeah Corridor
3213 Campbelltown Corridor
3214 Macarthur Corridor
3215 Campbelltown Corridor
3216 Campbelltown Corridor
3217 Macarthur Corridor
3218 Non centre Corridor
3219 Campbelltown Corridor
3220 Macarthur Corridor
3221 Macarthur Corridor
3244 Non centre Corridor
3246 Ingleburn Corridor
3247 Ingleburn Corridor
3248 Ingleburn Corridor
3249 Ingleburn Corridor
3250 Non centre Corridor
3251 Ingleburn Corridor
3252 Ingleburn Corridor
3253 Ingleburn Corridor
3269 Leumeah Corridor
3270 Non centre Corridor
3271 Leumeah Corridor
3272 Non centre Corridor
3273 Non centre Corridor
3274 Non centre Corridor
3277 Glenfield Corridor
3278 Glenfield Corridor
3279 Glenfield Corridor
3280 Glenfield Corridor
3281 Macquarie Fields Corridor
3282 Non centre Corridor
3283 Macquarie Fields Corridor
3284 Non centre Corridor
3287 Non centre Corridor
3288 Non centre Corridor
TZ Precinct Name Study Area
3289 Minto Corridor
3290 Minto Corridor
3291 Non centre Corridor
3292 Non centre Corridor
3293 Leumeah Corridor
3294 Non centre Corridor
3295 Minto Corridor
3298 Non centre Corridor
3299 Non centre Corridor
3301 Non centre Corridor
3302 Non centre Corridor
3804 Non centre Corridor
3805 Non centre Corridor
Source: Based on BTS data request 14818 and modified study brief
Table 11-2 – Equivalence deck: SA1 to Precinct
SA1 Precinct
1144202 Glenfield
1144203 Glenfield
1144214 Glenfield
1144243 Glenfield
1144213 Glenfield
1144244 Glenfield
1144215 Glenfield
1144211 Glenfield
1144212 Glenfield
1144206 Glenfield
1144207 Glenfield
1144250 Glenfield
1144208 Glenfield
1144209 Glenfield
1144210 Glenfield
1144217 Glenfield
1144218 Glenfield
1144241 Glenfield
1144216 Glenfield
1144242 Glenfield
1144201 Glenfield
1144003 Ingleburn
1144015 Ingleburn
1144016 Ingleburn
1144017 Ingleburn
1144018 Ingleburn

Glenfield to Macarthur Corridor Integrated Transport Strategy
3 August 2015 Cardno 224
SA1 Precinct
1144020 Ingleburn
1144021 Ingleburn
1144022 Ingleburn
1144023 Ingleburn
1144025 Ingleburn
1144029 Ingleburn
1144030 Ingleburn
1144028 Ingleburn
1144036 Ingleburn
1144007 Ingleburn
1144035 Ingleburn
1144034 Ingleburn
1144011 Ingleburn
1144012 Ingleburn
1144040 Ingleburn
1144039 Ingleburn
1144037 Ingleburn
1144038 Ingleburn
1144342 Leumeah
1144312 Leumeah
1144101 Leumeah
1144114 Leumeah
1144118 Leumeah
1144135 Leumeah
1144108 Leumeah
1143705 Leumeah
1143723 Leumeah
1144121 Leumeah
1144124 Leumeah
1144107 Leumeah
1144122 Leumeah
1144125 Leumeah
1144109 Leumeah
1144110 Leumeah
1143735 Macarthur
1143734 Macarthur
1143704 Macarthur
1144239 Macquarie Fields
1144240 Macquarie Fields
SA1 Precinct
1144224 Macquarie Fields
1144235 Macquarie Fields
1144223 Macquarie Fields
1144237 Macquarie Fields
1144238 Macquarie Fields
1144252 Macquarie Fields
1144219 Macquarie Fields
1144220 Macquarie Fields
1144221 Macquarie Fields
1144222 Macquarie Fields
1144236 Macquarie Fields
1144225 Macquarie Fields
1144328 Minto
1144337 Minto
1144338 Minto
1144339 Minto
1144343 Minto
1144342 Minto
1144312 Minto
1143723 Campbelltown
1143718 Campbelltown
1143728 Campbelltown
1143727 Campbelltown
1143722 Campbelltown
1143709 Campbelltown
1143604 Campbelltown
1143717 Campbelltown
1143716 Campbelltown
1143712 Campbelltown
1143715 Campbelltown
1143616 Campbelltown
1143725 Campbelltown
1143739 Campbelltown
1143732 Campbelltown
1143721 Campbelltown
1143737 Campbelltown
1143738 Campbelltown
1143733 Campbelltown
Source: TMA analysis

Glenfield to Macarthur Corridor Integrated Transport Strategy
3 August 2015 Cardno 225
Journey to work: mode of travel The Census requires the completion of a number of questions relating to the journey to work. Question 45 (in 2011), asked that each of the modes of travel used be marked in the list of alternatives. There were twelve travel alternatives and two non-travel alternatives (worked at home and did not go to work). No information is collected about the order of use of the modes.
Preparation of Journey to Work tables is described in ‘2011 Journey to Work User Guide’ May 2013 Release, BTS. Several different mode definitions are applied to the processing of Question 45 and this is based around the concept of ‘priority mode’. The following is extracted from page 14 of the JTW User Guide:
Mode Priority – where a journey to work is comprised of more than one mode, a priority mode is allocated to the following hierarchy, which is generally the mode with the largest likely (but necessarily actual) duration of the trip:
> Train HIGHEST
> Bus
> Ferry
> Tram/Light Rail
> Taxi
> Vehicle Driver
> Vehicle Passenger
> Truck
> Motorbike
> Bicycle
> Other mode (not specified)
> Walk only LOWEST
Various JTW tables produced by BTS apply different levels of modal aggregation, ranging from Mode 9 through to Mode 235 (which covers each of the combinations of the twelve modes indicated on the Census form). Generally, as the spatial detail of tables increase the modal resolution reduces (i.e., Table 10 of the 2011 JTW reports SLA to SLA movements using Mode 32, whereas Table 19 of the 2011 JTW reports travel zone to travel zone movements using Mode 9; and at higher levels of modal detail, there is no linking of origins and destinations, such as Table 14 with origin at travel zone and mode at Mode 235, but no information about the trip’s destination).
The following table identifies the different modal definitions used for reporting purposes in this report. The first two (Mode 15 and Mode 9) are standard codings applied to the data by BTS; the modes reported for the Live and Work analysis are aggregations of Mode 9, and are formulated to provide comparisons between modal characteristics of different precincts in the study area.
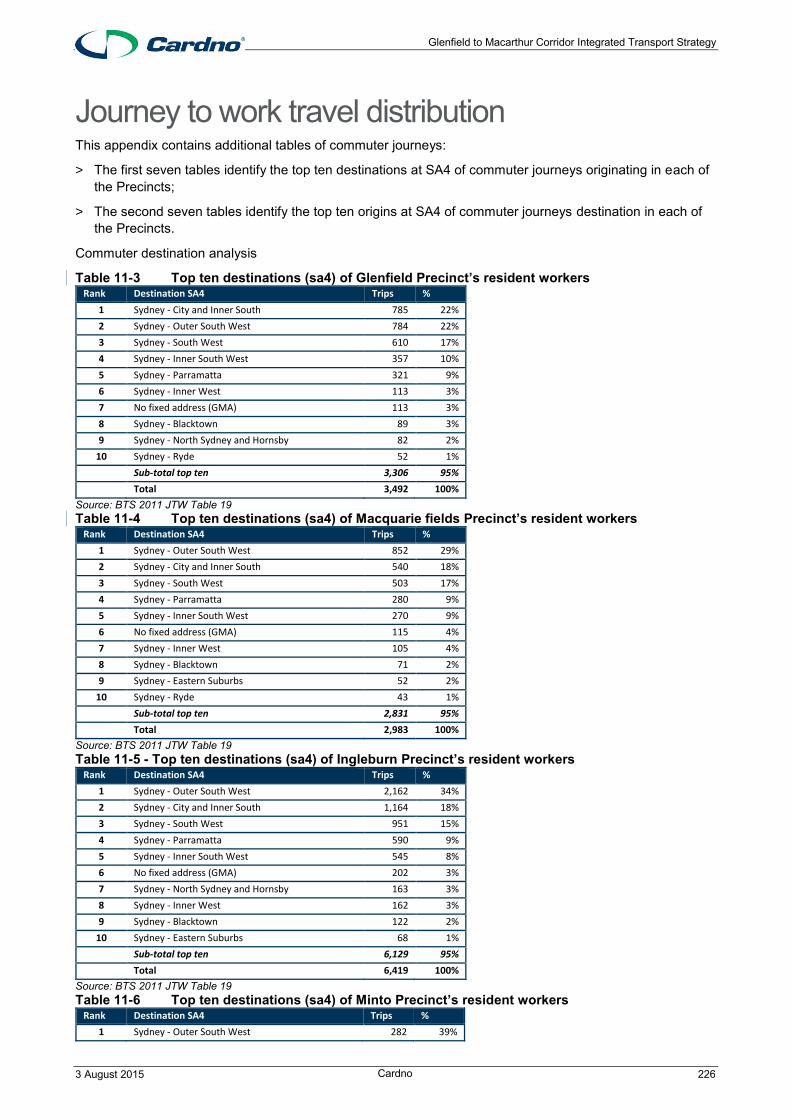
Glenfield to Macarthur Corridor Integrated Transport Strategy
3 August 2015 Cardno 226
Journey to work travel distribution This appendix contains additional tables of commuter journeys:
> The first seven tables identify the top ten destinations at SA4 of commuter journeys originating in each of the Precincts;
> The second seven tables identify the top ten origins at SA4 of commuter journeys destination in each of the Precincts.
Commuter destination analysis
Table 11-3 Top ten destinations (sa4) of Glenfield Precinct’s resident workers Rank Destination SA4 Trips %
1 Sydney - City and Inner South 785 22%
2 Sydney - Outer South West 784 22%
3 Sydney - South West 610 17%
4 Sydney - Inner South West 357 10%
5 Sydney - Parramatta 321 9%
6 Sydney - Inner West 113 3%
7 No fixed address (GMA) 113 3%
8 Sydney - Blacktown 89 3%
9 Sydney - North Sydney and Hornsby 82 2%
10 Sydney - Ryde 52 1%
Sub-total top ten 3,306 95%
Total 3,492 100%
Source: BTS 2011 JTW Table 19 Table 11-4 Top ten destinations (sa4) of Macquarie fields Precinct’s resident workers
Rank Destination SA4 Trips %
1 Sydney - Outer South West 852 29%
2 Sydney - City and Inner South 540 18%
3 Sydney - South West 503 17%
4 Sydney - Parramatta 280 9%
5 Sydney - Inner South West 270 9%
6 No fixed address (GMA) 115 4%
7 Sydney - Inner West 105 4%
8 Sydney - Blacktown 71 2%
9 Sydney - Eastern Suburbs 52 2%
10 Sydney - Ryde 43 1%
Sub-total top ten 2,831 95%
Total 2,983 100%
Source: BTS 2011 JTW Table 19 Table 11-5 - Top ten destinations (sa4) of Ingleburn Precinct’s resident workers
Rank Destination SA4 Trips %
1 Sydney - Outer South West 2,162 34%
2 Sydney - City and Inner South 1,164 18%
3 Sydney - South West 951 15%
4 Sydney - Parramatta 590 9%
5 Sydney - Inner South West 545 8%
6 No fixed address (GMA) 202 3%
7 Sydney - North Sydney and Hornsby 163 3%
8 Sydney - Inner West 162 3%
9 Sydney - Blacktown 122 2%
10 Sydney - Eastern Suburbs 68 1%
Sub-total top ten 6,129 95%
Total 6,419 100%
Source: BTS 2011 JTW Table 19 Table 11-6 Top ten destinations (sa4) of Minto Precinct’s resident workers
Rank Destination SA4 Trips %
1 Sydney - Outer South West 282 39%

Glenfield to Macarthur Corridor Integrated Transport Strategy
3 August 2015 Cardno 227
2 Sydney - City and Inner South 146 20%
3 Sydney - South West 90 12%
4 Sydney - Parramatta 64 9%
5 Sydney - Inner South West 44 6%
6 No fixed address (GMA) 26 4%
7 Sydney - North Sydney and Hornsby 19 3%
8 Sydney - Blacktown 15 2%
9 Sydney - Inner West 15 2%
10 Sydney - Sutherland 9 1%
Sub-total top ten 710 97%
Total 731 100%
Source: BTS 2011 JTW Table 19 Table 11-7 Top ten destinations (sa4) of Leumeah Precinct’s resident workers
Rank Destination SA4 Trips %
1 Sydney - Outer South West 1,560 44%
2 Sydney - City and Inner South 464 13%
3 Sydney - South West 462 13%
4 Sydney - Parramatta 262 7%
5 Sydney - Inner South West 243 7%
6 No fixed address (GMA) 147 4%
7 Sydney - Inner West 88 2%
8 Sydney - North Sydney and Hornsby 72 2%
9 Sydney - Blacktown 69 2%
10 Sydney - Outer West and Blue Mountains 31 1%
Sub-total top ten 3,399 96%
Total 3,532 100%
Source: BTS 2011 JTW Table 19 Table 11-8 Top ten destinations (sa4) of Campbelltown Precinct’s resident workers
Rank Destination SA4 Trips %
1 Sydney - Outer South West 1,911 48%
2 Sydney - City and Inner South 476 12%
3 Sydney - South West 467 12%
4 Sydney - Parramatta 270 7%
5 Sydney - Inner South West 231 6%
6 No fixed address (GMA) 152 4%
7 Sydney - Blacktown 107 3%
8 Sydney - North Sydney and Hornsby 65 2%
9 Sydney - Inner West 54 1%
10 Illawarra 50 1%
Sub-total top ten 3,783 96%
Total 3,948 100%
Source: BTS 2011 JTW Table 19 Table 11-9 Top ten destinations (sa4) of MacArthur Precinct’s resident workers
Rank Destination SA4 Trips %
1 Sydney - Outer South West 876 39%
2 Sydney - City and Inner South 432 19%
3 Sydney - South West 252 11%
4 Sydney - Parramatta 184 8%
5 Sydney - Inner South West 116 5%
6 No fixed address (GMA) 64 3%
7 Sydney - North Sydney and Hornsby 58 3%
8 Sydney - Ryde 55 2%
9 Sydney - Blacktown 51 2%
10 Sydney - Inner West 33 1%
Sub-total top ten 2,121 95%
Total 2,221 100%
Source: BTS 2011 JTW Table 19

Glenfield to Macarthur Corridor Integrated Transport Strategy
3 August 2015 Cardno 228
Table 11-10 Top ten origins (sa4) of workers within Glenfield Precinct Rank Origin SA4 Trips %
1 Sydney - Outer South West 792 59%
2 Sydney - South West 212 16%
3 Sydney - Outer West and Blue Mountains 47 4%
4 Sydney - Inner South West 43 3%
5 Sydney - Baulkham Hills and Hawkesbury 25 2%
6 Illawarra 24 2%
7 Sydney - Sutherland 24 2%
8 Sydney - North Sydney and Hornsby 22 2%
9 Sydney - Parramatta 20 2%
10 Sydney - City and Inner South 19 1%
Sub-total top ten 1,228 92%
Total 1,332 100%
Source: BTS 2011 JTW Table 19 Table 11-11 Top ten origins (sa4) of workers within Macquarie fields Precinct
Rank Origin SA4 Trips %
1 Sydney - Outer South West 998 71%
2 Sydney - South West 159 11%
3 Sydney - Inner South West 47 3%
4 Riverina 33 2%
5 Sydney - Sutherland 26 2%
6 Sydney - Outer West and Blue Mountains 22 2%
7 Illawarra 22 2%
8 Sydney - Inner West 20 1%
9 Sydney - Parramatta 19 1%
10 Sydney - City and Inner South 15 1%
Sub-total top ten 1,361 97%
Total 1,396 100%
Source: BTS 2011 JTW Table 19 Table 11-12 Top ten origins (sa4) of workers within Ingleburn Precinct
Rank Origin SA4 Trips %
1 Sydney - Outer South West 5,307 56%
2 Sydney - South West 1,657 17%
3 Sydney - Inner South West 554 6%
4 Sydney - Parramatta 301 3%
5 Sydney - Blacktown 274 3%
6 Sydney - Outer West and Blue Mountains 273 3%
7 Sydney - Sutherland 253 3%
8 Illawarra 204 2%
9 Sydney - Baulkham Hills and Hawkesbury 129 1%
10 Southern Highlands and Shoalhaven 100 1%
Sub-total top ten 9,052 95%
Total 9,483 100%
Source: BTS 2011 JTW Table 19 Table 11-13 Top ten origins (sa4) of workers within Minto Precinct
Rank Origin SA4 Trips %
1 Sydney - Outer South West 1,851 60%
2 Sydney - South West 491 16%
3 Sydney - Inner South West 156 5%
4 Sydney - Parramatta 99 3%
5 Illawarra 98 3%
6 Sydney - Sutherland 84 3%
7 Sydney - Outer West and Blue Mountains 56 2%
8 Sydney - Blacktown 55 2%
9 Southern Highlands and Shoalhaven 37 1%
10 Sydney - Baulkham Hills and Hawkesbury 35 1%
Sub-total top ten 2,962 95%

Glenfield to Macarthur Corridor Integrated Transport Strategy
3 August 2015 Cardno 229
Total 3,110 100%
Source: BTS 2011 JTW Table 19 Table 11-14 Top ten origins (sa4) of workers within Leumeah Precinct
Rank Origin SA4 Trips %
1 Sydney - Outer South West 3,098 68%
2 Sydney - South West 527 11%
3 Sydney - Inner South West 223 5%
4 Sydney - Parramatta 148 3%
5 Illawarra 103 2%
6 Sydney - Outer West and Blue Mountains 94 2%
7 Sydney - Blacktown 89 2%
8 Sydney - Sutherland 78 2%
9 Southern Highlands and Shoalhaven 52 1%
10 Sydney - Baulkham Hills and Hawkesbury 43 1%
Sub-total top ten 4,454 97%
Total 4,586 100%
Source: BTS 2011 JTW Table 19 Table 11-15 Top ten origins (sa4) of workers within Campbelltown Precinct
Rank Origin SA4 Trips %
1 Sydney - Outer South West 6,944 75%
2 Sydney - South West 736 8%
3 Illawarra 343 4%
4 Sydney - Inner South West 250 3%
5 Sydney - Parramatta 165 2%
6 Sydney - Outer West and Blue Mountains 135 1%
7 Southern Highlands and Shoalhaven 134 1%
8 Sydney - Sutherland 105 1%
9 Sydney - Inner West 91 1%
10 Sydney - Blacktown 79 1%
Sub-total top ten 8,982 98%
Total 9,198 100%
Source: BTS 2011 JTW Table 19 Table 11-16 Top ten origins (sa4) of workers within MacArthur Precinct
Rank Origin SA4 Trips %
1 Sydney - Outer South West 4,569 74%
2 Sydney - South West 549 9%
3 Illawarra 183 3%
4 Sydney - Inner South West 153 2%
5 Sydney - Parramatta 146 2%
6 Sydney - Outer West and Blue Mountains 126 2%
7 Southern Highlands and Shoalhaven 100 2%
8 Sydney - Inner West 87 1%
9 Sydney - Sutherland 75 1%
10 Sydney - City and Inner South 58 1%
Sub-total top ten 6,046 97%
Total 6,213 100%
Source: BTS 2011 JTW Table 19

Glenfield to Macarthur Corridor Integrated Transport Strategy
3 August 2015 Cardno 230
APPENDIX C MULTI- CRITERIA ASSESSMENT

Glenfield to Macarthur Corridor Integrated Transport Strategy
3 August 2015 Cardno 1
Glenfield infrastructure multi-criteria analysis
# Objective Walking Cycling Bus Road
Comment Score Comment Score Comment Score Comment Score 1 Improve competitiveness and
attractiveness of public transport Increased permeability in the precinct would reduce the walking distance for some customers, hence improving the attractiveness of PT.
5 New routes, improved network and bicycle parking provided closer to station access point increases convenience compared to park & ride.
5 Subject to investigation of feasibility and funding. Proposed suburban bus routes increase route directness and therefore speed of service. With increased frequency and service span these would increase competitiveness.
5 Provides people access to public transport by way of Kiss & Ride and Park & Ride.
3
2 Improve reliability and reduce waiting times for public transport
No impact on reliability and waiting times of PT 3 No impact on reliability and waiting times of PT
3 Increased frequency would reduce waiting times, particularly for interchange with other PT services.
5 Potential, dependent of public transport priority measures
4
3 Improve the customer experience for public transport journeys
Access and amenity improvement improves the overall experience.
4 Access and amenity improvement improves the overall experience.
4 The customer experience on buses is largely controlled by the service operator.
5 Finer grain street network provides a slight improvement
4
4 Encourage people to walk and cycle more
Improved finer grain network could encourage people to walk and cycle more. The network will also support an increase in density and therefore there will be more people to walk
5 Designated cycle routes provide attractive options to encourage more cycling and increase convenient catchment.
5 Higher frequency and more direct route bus services are expected have an effect of increasing the user catchment to each stop. This would encourage more walking by way of accessing stops.
4 Dependent of road network design, activated frontages, space and priority allocation.
4
5 Increase land use density in key transport locations
Land use density is proposed to be increased near to the station which would increase the viability of walking in the precinct by way of co-location of goods and services.
5 Land use density supports the investment in infrastructure
4 Glenfield to remain a key transport interchange in the study corridor.
4 Supports land use density increase 5
6 Improve legibility of transport Proposed network hierarchy will be evident in the infrastructure typology and through local wayfinding signage would improve legibility.
5 Proposed network infrastructure and wayfinding would improve legibility
5 Proposed regional bus network improves legibility.
5 Dependant on street infrastructure typology.
4
7 Minimise vehicular through traffic in local areas
Additional pedestrian priority/ crossings can be implemented to minimise through traffic
4 Subject to detailed network design, providing through access in some locations to bicycle only while restricting cars to main routes.
4 More people on buses would result in less private vehicle traffic.
4 No major through routes proposed. Dependant on through linkages or access only roads with through pedestrian, bicycle links and overall urban design.
3
8 Optimise use of station supporting facilities
Supports both the station and local community. Pedestrian network also relies on station facilities. Assists to reduce the investment in additional station car parking.
4 Supports proposed bicycle parking investment and reduces dependence and expense of commuter car parking.
4 Bus feeder services can increase the catchment of the station thereby maximising the use of the investment.
4 Supports access and movement to station
4
9 Support and facilitate efficient movement of freight throughout the corridor.
Any method to reduce the number of private vehicle trips assists the efficient movement of freight.
3 Any method to reduce the number of private vehicle trips assists the efficient movement of freight.
3 Any method to reduce the number of private vehicle trips assists the efficient movement of freight.
4 Proposed roads would support local freight/ delivery movements.
4
10 Improve connections to regionally significant areas
Some regionally significant areas within the walking catchment.
4 Proposed regional network provides access to regionally significant areas
5 Connections to regionally significant areas improved.
4 Proposed Cambridge Avenue extension improves regional connectivity.
4
11 Improve road safety around key transport hubs
Higher volumes of pedestrians can increase driver awareness and reduce the attractiveness and demand for driving thereby increasing safety. Finer grain street network conducive to lower vehicle speeds.
5 Assistive measure to reduce vehicle traffic, therefore improve road safety.
4 Reduced vehicle movements at transport hubs increases user safety.
4 Reliant of implementation of LATM/ 40km/h HPAA.
4
12 Improve personal security around key transport hubs
Higher volumes of pedestrians create collective improvement in personal security and increase the economic feasibility of businesses remaining open later into the night.
5 More people on the street means a higher level of passive surveillance and therefore perception of security
4 Personal security is improved by increased use of bus and presence of bus driver.
4 No change 3
13 Maximise integration with land use and other transport modes
Provides more options to access all parts of the precinct.
5 Proposed density improvements supported by cycle network improvements.
5 Bus services can use existing and proposed road network to continue the integral use of the land and transport network.
5 Road network supports land use, bus, walking and cycling networks
5
14 Support positive provision for accessibility and active transport
Very supportive 5 Very supportive 5 Increased transport catchment particularly those within an active transport distance of stops
5 Subject to detail design, potential to improve accessibility and support active transport.
5
15 Reduce reliance on private motor vehicle
Provides more amenable walking options, hence reduction in private vehicle reliance. Land use co-located with major public transport infrastructure reduces private vehicle reliance.
5 Assists to reduce private motor vehicle reliance over a greater catchment.
4 Bus services reduce the reliance on private vehicle.
4 Unlikely to reduce reliance on private vehicle use.
3
Total 67 64 66 59
Recommendation Proceed Proceed Proceed Proceed with exception of Cambridge Road extension.
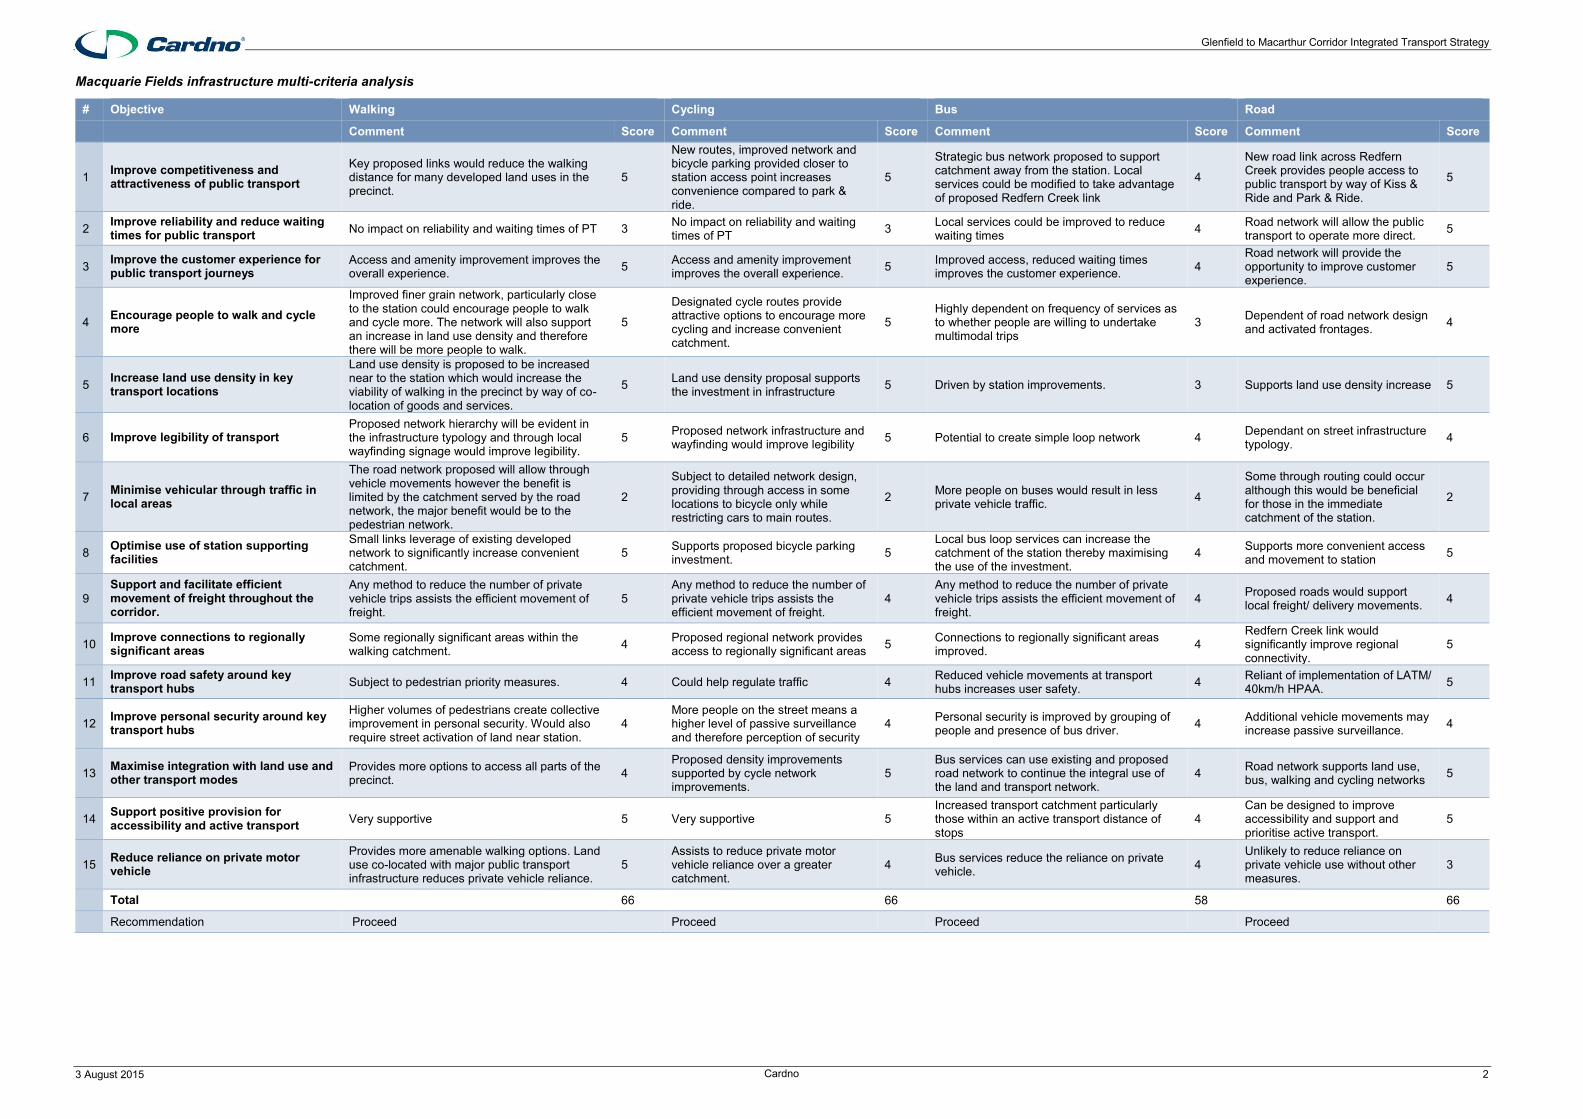
Glenfield to Macarthur Corridor Integrated Transport Strategy
3 August 2015 Cardno 2
Macquarie Fields infrastructure multi-criteria analysis
# Objective Walking Cycling Bus Road
Comment Score Comment Score Comment Score Comment Score
1 Improve competitiveness and attractiveness of public transport
Key proposed links would reduce the walking distance for many developed land uses in the precinct.
5
New routes, improved network and bicycle parking provided closer to station access point increases convenience compared to park & ride.
5
Strategic bus network proposed to support catchment away from the station. Local services could be modified to take advantage of proposed Redfern Creek link
4
New road link across Redfern Creek provides people access to public transport by way of Kiss & Ride and Park & Ride.
5
2 Improve reliability and reduce waiting times for public transport No impact on reliability and waiting times of PT 3 No impact on reliability and waiting
times of PT 3 Local services could be improved to reduce waiting times 4 Road network will allow the public
transport to operate more direct. 5
3 Improve the customer experience for public transport journeys
Access and amenity improvement improves the overall experience. 5 Access and amenity improvement
improves the overall experience. 5 Improved access, reduced waiting times improves the customer experience. 4
Road network will provide the opportunity to improve customer experience.
5
4 Encourage people to walk and cycle more
Improved finer grain network, particularly close to the station could encourage people to walk and cycle more. The network will also support an increase in land use density and therefore there will be more people to walk.
5
Designated cycle routes provide attractive options to encourage more cycling and increase convenient catchment.
5 Highly dependent on frequency of services as to whether people are willing to undertake multimodal trips
3 Dependent of road network design and activated frontages. 4
5 Increase land use density in key transport locations
Land use density is proposed to be increased near to the station which would increase the viability of walking in the precinct by way of co-location of goods and services.
5 Land use density proposal supports the investment in infrastructure 5 Driven by station improvements. 3 Supports land use density increase 5
6 Improve legibility of transport Proposed network hierarchy will be evident in the infrastructure typology and through local wayfinding signage would improve legibility.
5 Proposed network infrastructure and wayfinding would improve legibility 5 Potential to create simple loop network 4 Dependant on street infrastructure
typology. 4
7 Minimise vehicular through traffic in local areas
The road network proposed will allow through vehicle movements however the benefit is limited by the catchment served by the road network, the major benefit would be to the pedestrian network.
2
Subject to detailed network design, providing through access in some locations to bicycle only while restricting cars to main routes.
2 More people on buses would result in less private vehicle traffic. 4
Some through routing could occur although this would be beneficial for those in the immediate catchment of the station.
2
8 Optimise use of station supporting facilities
Small links leverage of existing developed network to significantly increase convenient catchment.
5 Supports proposed bicycle parking investment. 5
Local bus loop services can increase the catchment of the station thereby maximising the use of the investment.
4 Supports more convenient access and movement to station 5
9 Support and facilitate efficient movement of freight throughout the corridor.
Any method to reduce the number of private vehicle trips assists the efficient movement of freight.
5 Any method to reduce the number of private vehicle trips assists the efficient movement of freight.
4 Any method to reduce the number of private vehicle trips assists the efficient movement of freight.
4 Proposed roads would support local freight/ delivery movements. 4
10 Improve connections to regionally significant areas
Some regionally significant areas within the walking catchment. 4 Proposed regional network provides
access to regionally significant areas 5 Connections to regionally significant areas improved. 4
Redfern Creek link would significantly improve regional connectivity.
5
11 Improve road safety around key transport hubs Subject to pedestrian priority measures. 4 Could help regulate traffic 4 Reduced vehicle movements at transport
hubs increases user safety. 4 Reliant of implementation of LATM/ 40km/h HPAA. 5
12 Improve personal security around key transport hubs
Higher volumes of pedestrians create collective improvement in personal security. Would also require street activation of land near station.
4 More people on the street means a higher level of passive surveillance and therefore perception of security
4 Personal security is improved by grouping of people and presence of bus driver. 4 Additional vehicle movements may
increase passive surveillance. 4
13 Maximise integration with land use and other transport modes
Provides more options to access all parts of the precinct. 4
Proposed density improvements supported by cycle network improvements.
5 Bus services can use existing and proposed road network to continue the integral use of the land and transport network.
4 Road network supports land use, bus, walking and cycling networks 5
14 Support positive provision for accessibility and active transport Very supportive 5 Very supportive 5
Increased transport catchment particularly those within an active transport distance of stops
4 Can be designed to improve accessibility and support and prioritise active transport.
5
15 Reduce reliance on private motor vehicle
Provides more amenable walking options. Land use co-located with major public transport infrastructure reduces private vehicle reliance.
5 Assists to reduce private motor vehicle reliance over a greater catchment.
4 Bus services reduce the reliance on private vehicle. 4
Unlikely to reduce reliance on private vehicle use without other measures.
3
Total 66 66 58 66
Recommendation Proceed Proceed Proceed Proceed
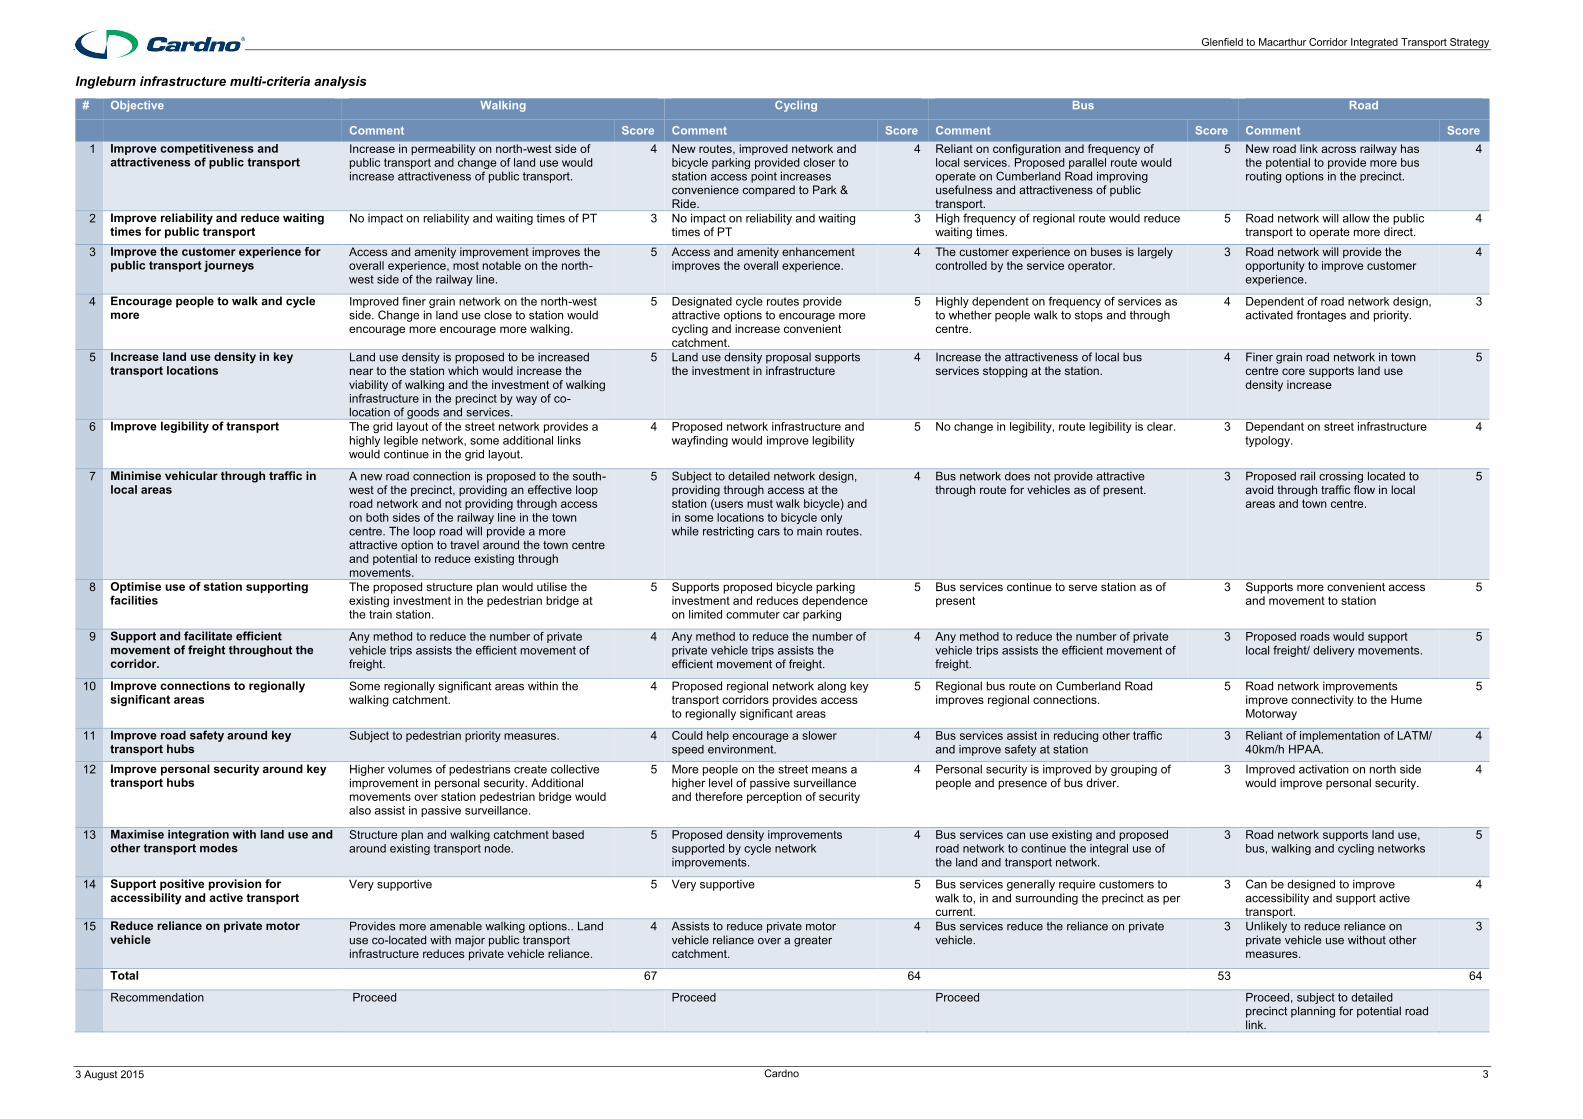
Glenfield to Macarthur Corridor Integrated Transport Strategy
3 August 2015 Cardno 3
Ingleburn infrastructure multi-criteria analysis
# Objective Walking Cycling Bus Road
Comment Score Comment Score Comment Score Comment Score 1 Improve competitiveness and
attractiveness of public transport Increase in permeability on north-west side of public transport and change of land use would increase attractiveness of public transport.
4 New routes, improved network and bicycle parking provided closer to station access point increases convenience compared to Park & Ride.
4 Reliant on configuration and frequency of local services. Proposed parallel route would operate on Cumberland Road improving usefulness and attractiveness of public transport.
5 New road link across railway has the potential to provide more bus routing options in the precinct.
4
2 Improve reliability and reduce waiting times for public transport
No impact on reliability and waiting times of PT 3 No impact on reliability and waiting times of PT
3 High frequency of regional route would reduce waiting times.
5 Road network will allow the public transport to operate more direct.
4
3 Improve the customer experience for public transport journeys
Access and amenity improvement improves the overall experience, most notable on the north-west side of the railway line.
5 Access and amenity enhancement improves the overall experience.
4 The customer experience on buses is largely controlled by the service operator.
3 Road network will provide the opportunity to improve customer experience.
4
4 Encourage people to walk and cycle more
Improved finer grain network on the north-west side. Change in land use close to station would encourage more encourage more walking.
5 Designated cycle routes provide attractive options to encourage more cycling and increase convenient catchment.
5 Highly dependent on frequency of services as to whether people walk to stops and through centre.
4 Dependent of road network design, activated frontages and priority.
3
5 Increase land use density in key transport locations
Land use density is proposed to be increased near to the station which would increase the viability of walking and the investment of walking infrastructure in the precinct by way of co-location of goods and services.
5 Land use density proposal supports the investment in infrastructure
4 Increase the attractiveness of local bus services stopping at the station.
4 Finer grain road network in town centre core supports land use density increase
5
6 Improve legibility of transport The grid layout of the street network provides a highly legible network, some additional links would continue in the grid layout.
4 Proposed network infrastructure and wayfinding would improve legibility
5 No change in legibility, route legibility is clear. 3 Dependant on street infrastructure typology.
4
7 Minimise vehicular through traffic in local areas
A new road connection is proposed to the south-west of the precinct, providing an effective loop road network and not providing through access on both sides of the railway line in the town centre. The loop road will provide a more attractive option to travel around the town centre and potential to reduce existing through movements.
5 Subject to detailed network design, providing through access at the station (users must walk bicycle) and in some locations to bicycle only while restricting cars to main routes.
4 Bus network does not provide attractive through route for vehicles as of present.
3 Proposed rail crossing located to avoid through traffic flow in local areas and town centre.
5
8 Optimise use of station supporting facilities
The proposed structure plan would utilise the existing investment in the pedestrian bridge at the train station.
5 Supports proposed bicycle parking investment and reduces dependence on limited commuter car parking
5 Bus services continue to serve station as of present
3 Supports more convenient access and movement to station
5
9 Support and facilitate efficient movement of freight throughout the corridor.
Any method to reduce the number of private vehicle trips assists the efficient movement of freight.
4 Any method to reduce the number of private vehicle trips assists the efficient movement of freight.
4 Any method to reduce the number of private vehicle trips assists the efficient movement of freight.
3 Proposed roads would support local freight/ delivery movements.
5
10 Improve connections to regionally significant areas
Some regionally significant areas within the walking catchment.
4 Proposed regional network along key transport corridors provides access to regionally significant areas
5 Regional bus route on Cumberland Road improves regional connections.
5 Road network improvements improve connectivity to the Hume Motorway
5
11 Improve road safety around key transport hubs
Subject to pedestrian priority measures. 4 Could help encourage a slower speed environment.
4 Bus services assist in reducing other traffic and improve safety at station
3 Reliant of implementation of LATM/ 40km/h HPAA.
4
12 Improve personal security around key transport hubs
Higher volumes of pedestrians create collective improvement in personal security. Additional movements over station pedestrian bridge would also assist in passive surveillance.
5 More people on the street means a higher level of passive surveillance and therefore perception of security
4 Personal security is improved by grouping of people and presence of bus driver.
3 Improved activation on north side would improve personal security.
4
13 Maximise integration with land use and other transport modes
Structure plan and walking catchment based around existing transport node.
5 Proposed density improvements supported by cycle network improvements.
4 Bus services can use existing and proposed road network to continue the integral use of the land and transport network.
3 Road network supports land use, bus, walking and cycling networks
5
14 Support positive provision for accessibility and active transport
Very supportive 5 Very supportive 5 Bus services generally require customers to walk to, in and surrounding the precinct as per current.
3 Can be designed to improve accessibility and support active transport.
4
15 Reduce reliance on private motor vehicle
Provides more amenable walking options.. Land use co-located with major public transport infrastructure reduces private vehicle reliance.
4 Assists to reduce private motor vehicle reliance over a greater catchment.
4 Bus services reduce the reliance on private vehicle.
3 Unlikely to reduce reliance on private vehicle use without other measures.
3
Total 67 64 53 64
Recommendation Proceed Proceed Proceed Proceed, subject to detailed precinct planning for potential road link.
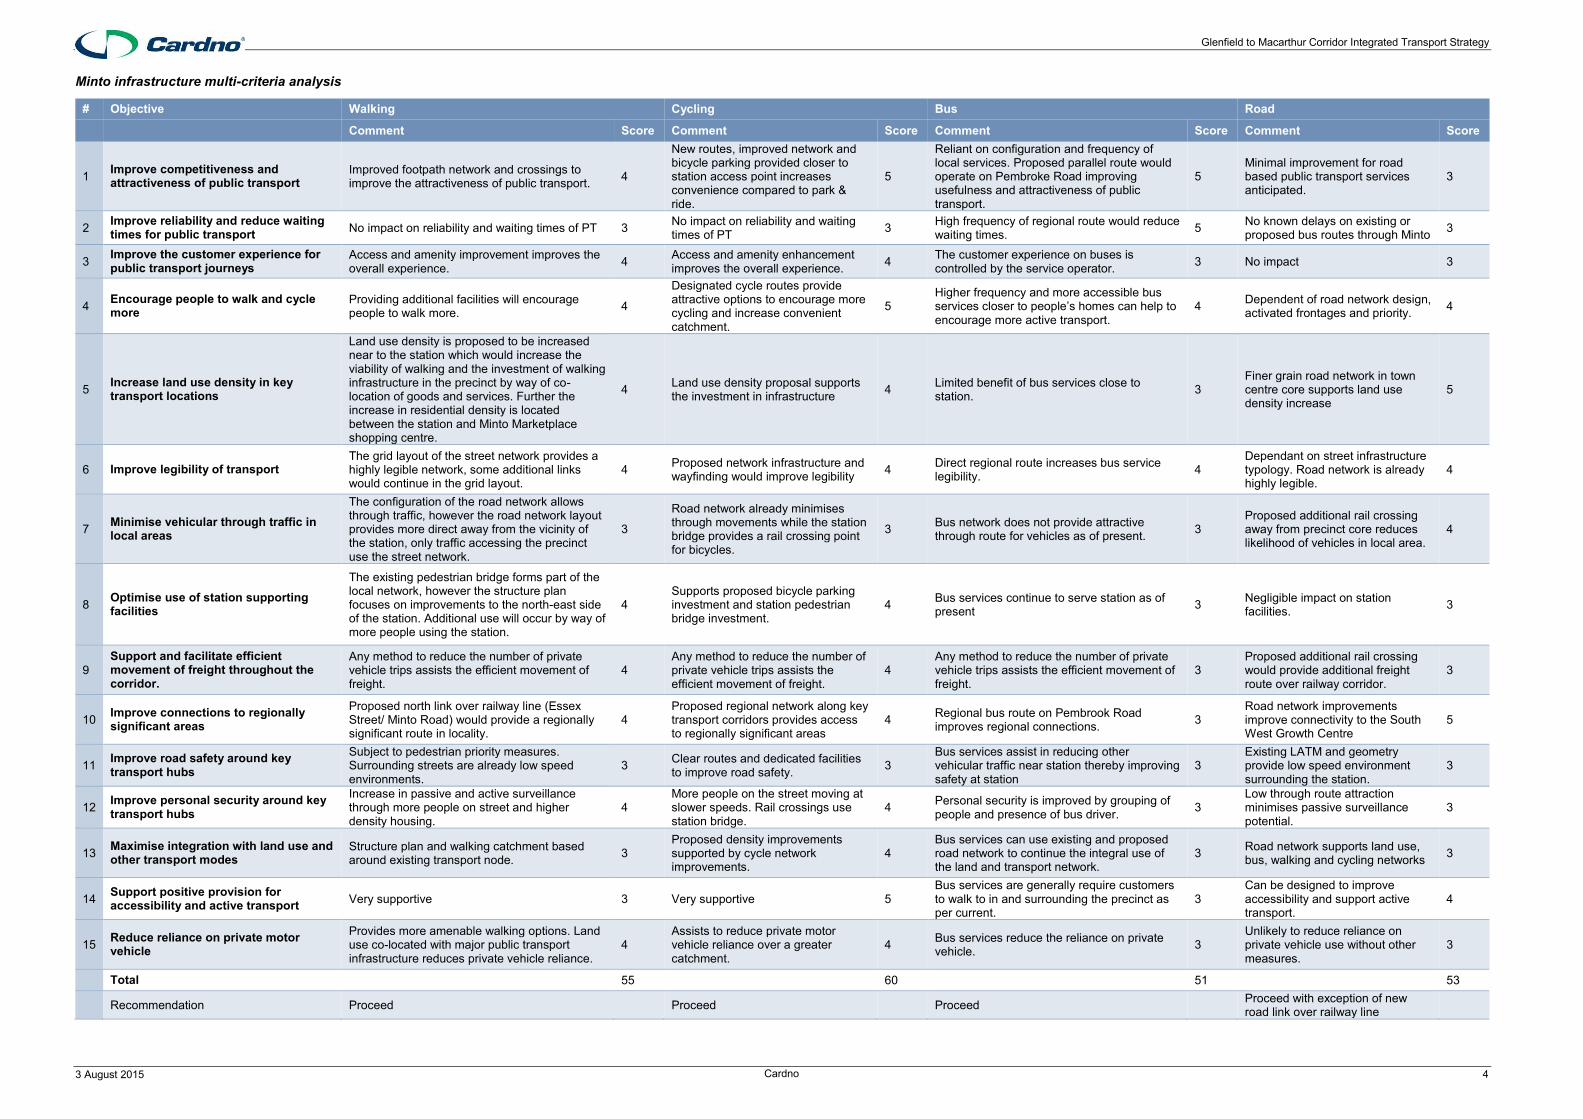
Glenfield to Macarthur Corridor Integrated Transport Strategy
3 August 2015 Cardno 4
Minto infrastructure multi-criteria analysis
# Objective Walking Cycling Bus Road
Comment Score Comment Score Comment Score Comment Score
1 Improve competitiveness and attractiveness of public transport
Improved footpath network and crossings to improve the attractiveness of public transport. 4
New routes, improved network and bicycle parking provided closer to station access point increases convenience compared to park & ride.
5
Reliant on configuration and frequency of local services. Proposed parallel route would operate on Pembroke Road improving usefulness and attractiveness of public transport.
5 Minimal improvement for road based public transport services anticipated.
3
2 Improve reliability and reduce waiting times for public transport No impact on reliability and waiting times of PT 3 No impact on reliability and waiting
times of PT 3 High frequency of regional route would reduce waiting times. 5 No known delays on existing or
proposed bus routes through Minto 3
3 Improve the customer experience for public transport journeys
Access and amenity improvement improves the overall experience. 4 Access and amenity enhancement
improves the overall experience. 4 The customer experience on buses is controlled by the service operator. 3 No impact 3
4 Encourage people to walk and cycle more
Providing additional facilities will encourage people to walk more. 4
Designated cycle routes provide attractive options to encourage more cycling and increase convenient catchment.
5 Higher frequency and more accessible bus services closer to people’s homes can help to encourage more active transport.
4 Dependent of road network design, activated frontages and priority. 4
5 Increase land use density in key transport locations
Land use density is proposed to be increased near to the station which would increase the viability of walking and the investment of walking infrastructure in the precinct by way of co-location of goods and services. Further the increase in residential density is located between the station and Minto Marketplace shopping centre.
4 Land use density proposal supports the investment in infrastructure 4 Limited benefit of bus services close to
station. 3 Finer grain road network in town centre core supports land use density increase
5
6 Improve legibility of transport The grid layout of the street network provides a highly legible network, some additional links would continue in the grid layout.
4 Proposed network infrastructure and wayfinding would improve legibility 4 Direct regional route increases bus service
legibility. 4 Dependant on street infrastructure typology. Road network is already highly legible.
4
7 Minimise vehicular through traffic in local areas
The configuration of the road network allows through traffic, however the road network layout provides more direct away from the vicinity of the station, only traffic accessing the precinct use the street network.
3
Road network already minimises through movements while the station bridge provides a rail crossing point for bicycles.
3 Bus network does not provide attractive through route for vehicles as of present. 3
Proposed additional rail crossing away from precinct core reduces likelihood of vehicles in local area.
4
8 Optimise use of station supporting facilities
The existing pedestrian bridge forms part of the local network, however the structure plan focuses on improvements to the north-east side of the station. Additional use will occur by way of more people using the station.
4 Supports proposed bicycle parking investment and station pedestrian bridge investment.
4 Bus services continue to serve station as of present 3 Negligible impact on station
facilities. 3
9 Support and facilitate efficient movement of freight throughout the corridor.
Any method to reduce the number of private vehicle trips assists the efficient movement of freight.
4 Any method to reduce the number of private vehicle trips assists the efficient movement of freight.
4 Any method to reduce the number of private vehicle trips assists the efficient movement of freight.
3 Proposed additional rail crossing would provide additional freight route over railway corridor.
3
10 Improve connections to regionally significant areas
Proposed north link over railway line (Essex Street/ Minto Road) would provide a regionally significant route in locality.
4 Proposed regional network along key transport corridors provides access to regionally significant areas
4 Regional bus route on Pembrook Road improves regional connections. 3
Road network improvements improve connectivity to the South West Growth Centre
5
11 Improve road safety around key transport hubs
Subject to pedestrian priority measures. Surrounding streets are already low speed environments.
3 Clear routes and dedicated facilities to improve road safety. 3
Bus services assist in reducing other vehicular traffic near station thereby improving safety at station
3 Existing LATM and geometry provide low speed environment surrounding the station.
3
12 Improve personal security around key transport hubs
Increase in passive and active surveillance through more people on street and higher density housing.
4 More people on the street moving at slower speeds. Rail crossings use station bridge.
4 Personal security is improved by grouping of people and presence of bus driver. 3
Low through route attraction minimises passive surveillance potential.
3
13 Maximise integration with land use and other transport modes
Structure plan and walking catchment based around existing transport node. 3
Proposed density improvements supported by cycle network improvements.
4 Bus services can use existing and proposed road network to continue the integral use of the land and transport network.
3 Road network supports land use, bus, walking and cycling networks 3
14 Support positive provision for accessibility and active transport Very supportive 3 Very supportive 5
Bus services are generally require customers to walk to in and surrounding the precinct as per current.
3 Can be designed to improve accessibility and support active transport.
4
15 Reduce reliance on private motor vehicle
Provides more amenable walking options. Land use co-located with major public transport infrastructure reduces private vehicle reliance.
4 Assists to reduce private motor vehicle reliance over a greater catchment.
4 Bus services reduce the reliance on private vehicle. 3
Unlikely to reduce reliance on private vehicle use without other measures.
3
Total 55 60 51 53
Recommendation Proceed Proceed Proceed Proceed with exception of new road link over railway line

Glenfield to Macarthur Corridor Integrated Transport Strategy
3 August 2015 Cardno 5
Leumeah infrastructure multi-criteria analysis
# Objective Walking Cycling Bus Road
Comment Score Comment Score Comment Score Comment Score
1 Improve competitiveness and attractiveness of public transport
Improved footpath network and crossings to improve the directness and therefore attractiveness of public transport.
5
New routes, improved network along green corridors and bicycle parking provided closer to station access point increases convenience compared to park & ride.
5
Reliant on configuration and frequency of local services. Proposed parallel route would operate on Pembroke Road improving usefulness and attractiveness of public transport.
5 Minimal improvement for road based public transport services anticipated.
3
2 Improve reliability and reduce waiting times for public transport No impact on reliability and waiting times of PT 3 No impact on reliability and waiting
times of PT 3 High frequency of regional route would reduce waiting times. 5
No known delays on existing or proposed bus routes through Leumeah
3
3 Improve the customer experience for public transport journeys
Access and amenity improvement improves the overall experience. 5 Access and amenity improvement
improves the overall experience. 5 The customer experience on buses is controlled by the service operator. 3 No impact 3
4 Encourage people to walk and cycle more
Providing direct routes encourages more walking. 4
Designated cycle routes provide attractive options to encourage more cycling and increase convenient catchment.
5 Higher frequency and more accessible bus services closer to people’s homes can help to encourage more active transport.
4 Dependent of road network design and activated frontages and priority.
4
5 Increase land use density in key transport locations
Residential land use density increase in the south east portion of the station. 5 Land use density proposal supports
the investment in cycle infrastructure. 5 Limited benefit of bus services within station walking catchment. 3
Road network should largely support increased land use density near station.
3
6 Improve legibility of transport Minor additional links to improve legibility of walking network. 4 Proposed network infrastructure and
wayfinding would improve legibility 5 Direct regional route increases bus service legibility. 4
Dependant on street infrastructure typology. Road network is already highly legible.
3
7 Minimise vehicular through traffic in local areas
It is expected the walking network will remain more permeable for pedestrians while maintaining minimal through routes for vehicles.
3
Road network already minimises through movements while the station bridge provides a rail crossing point for bicycles.
3 Improved bus service may help to reduce through traffic on Pembroke Road. 4 No additional through routes
proposed. 3
8 Optimise use of station supporting facilities
The existing pedestrian bridge forms part of the local network. Any increase in retail/ commercial land use intensity could trigger higher demand for the pedestrian bridge and potentially the car parking. It is expected the commuter car park would also be utilised by people accessing the sports precinct.
4 Supports proposed bicycle parking investment and station pedestrian bridge investment.
5 Local bus services continue to serve station as of present 3 Negligible impact on station
facilities. 3
9 Support and facilitate efficient movement of freight throughout the corridor.
Any method to reduce the number of private vehicle trips assists the efficient movement of freight.
4 Any method to reduce the number of private vehicle trips assists the efficient movement of freight.
4 Any method to reduce the number of private vehicle trips assists the efficient movement of freight.
4 Proposed new links in employment zone would assist freight movement through the corridor.
4
10 Improve connections to regionally significant areas No regionally significant routes proposed. 3
Proposed regional network along key transport corridors provides access to regionally significant areas
5 Regional bus route on Pembroke Road improves regional connections. 5 Maintains same connections to
regional areas 3
11 Improve road safety around key transport hubs
Subject to pedestrian priority measures and LATM. Surrounding streets are already low speed environments.
4 No significant road safety issue has been identified surrounding the station.
3 Bus services assist in reducing other vehicular traffic near station thereby improving safety at station
4 Existing LATM and geometry provide low speed environment surrounding the station.
3
12 Improve personal security around key transport hubs
Structure plan proposed additional retail land use near to station which would lead to an increase in passive and active surveillance.
4 More people on the street moving at slower speeds. 4
Local bus services effectively provide escorted trips closer to people’s destinations. No change anticipated.
3 Low through route attraction minimises passive surveillance potential.
3
13 Maximise integration with land use and other transport modes
Structure plan and walking catchment based around existing transport node. 5
Proposed density improvements supported by cycle network improvements.
4 Regional bus service not proposed to integrate but complement rail services. 2 Road network supports land use,
bus, walking and cycling networks 3
14 Support positive provision for accessibility and active transport Very supportive 5 Very supportive 5
Bus services are generally require customers to walk to in and surrounding the precinct as per current.
4 Can be designed to improve accessibility and support active transport.
3
15 Reduce reliance on private motor vehicle
Provides more amenable walking options. Land use co-located with major public transport infrastructure reduces private vehicle reliance.
5 Assists to reduce private motor vehicle reliance over a greater catchment.
5 Bus services reduce the reliance on private vehicle. 4
Unlikely to reduce reliance on private vehicle use without other measures.
3
Total 63 66 57 47
Recommendation Proceed Proceed Proceed Proceed
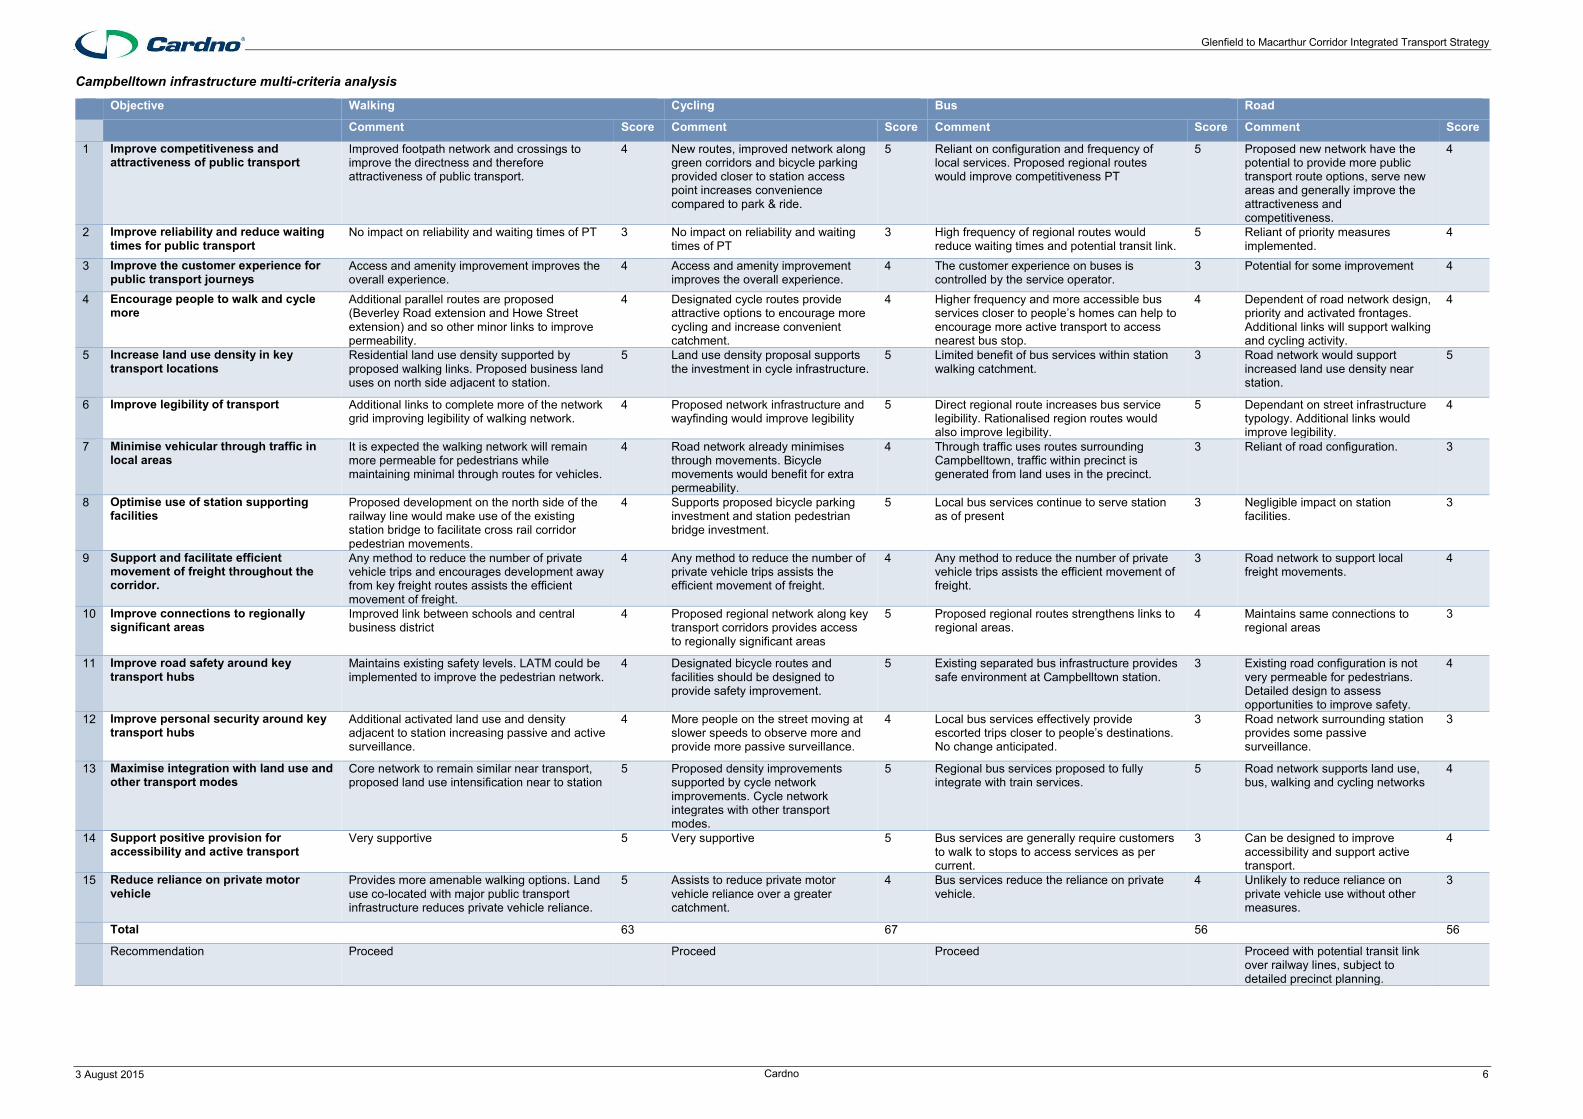
Glenfield to Macarthur Corridor Integrated Transport Strategy
3 August 2015 Cardno 6
Campbelltown infrastructure multi-criteria analysis
Objective Walking Cycling Bus Road
Comment Score Comment Score Comment Score Comment Score
1 Improve competitiveness and attractiveness of public transport
Improved footpath network and crossings to improve the directness and therefore attractiveness of public transport.
4 New routes, improved network along green corridors and bicycle parking provided closer to station access point increases convenience compared to park & ride.
5 Reliant on configuration and frequency of local services. Proposed regional routes would improve competitiveness PT
5 Proposed new network have the potential to provide more public transport route options, serve new areas and generally improve the attractiveness and competitiveness.
4
2 Improve reliability and reduce waiting times for public transport
No impact on reliability and waiting times of PT 3 No impact on reliability and waiting times of PT
3 High frequency of regional routes would reduce waiting times and potential transit link.
5 Reliant of priority measures implemented.
4
3 Improve the customer experience for public transport journeys
Access and amenity improvement improves the overall experience.
4 Access and amenity improvement improves the overall experience.
4 The customer experience on buses is controlled by the service operator.
3 Potential for some improvement 4
4 Encourage people to walk and cycle more
Additional parallel routes are proposed (Beverley Road extension and Howe Street extension) and so other minor links to improve permeability.
4 Designated cycle routes provide attractive options to encourage more cycling and increase convenient catchment.
4 Higher frequency and more accessible bus services closer to people’s homes can help to encourage more active transport to access nearest bus stop.
4 Dependent of road network design, priority and activated frontages. Additional links will support walking and cycling activity.
4
5 Increase land use density in key transport locations
Residential land use density supported by proposed walking links. Proposed business land uses on north side adjacent to station.
5 Land use density proposal supports the investment in cycle infrastructure.
5 Limited benefit of bus services within station walking catchment.
3 Road network would support increased land use density near station.
5
6 Improve legibility of transport Additional links to complete more of the network grid improving legibility of walking network.
4 Proposed network infrastructure and wayfinding would improve legibility
5 Direct regional route increases bus service legibility. Rationalised region routes would also improve legibility.
5 Dependant on street infrastructure typology. Additional links would improve legibility.
4
7 Minimise vehicular through traffic in local areas
It is expected the walking network will remain more permeable for pedestrians while maintaining minimal through routes for vehicles.
4 Road network already minimises through movements. Bicycle movements would benefit for extra permeability.
4 Through traffic uses routes surrounding Campbelltown, traffic within precinct is generated from land uses in the precinct.
3 Reliant of road configuration. 3
8 Optimise use of station supporting facilities
Proposed development on the north side of the railway line would make use of the existing station bridge to facilitate cross rail corridor pedestrian movements.
4 Supports proposed bicycle parking investment and station pedestrian bridge investment.
5 Local bus services continue to serve station as of present
3 Negligible impact on station facilities.
3
9 Support and facilitate efficient movement of freight throughout the corridor.
Any method to reduce the number of private vehicle trips and encourages development away from key freight routes assists the efficient movement of freight.
4 Any method to reduce the number of private vehicle trips assists the efficient movement of freight.
4 Any method to reduce the number of private vehicle trips assists the efficient movement of freight.
3 Road network to support local freight movements.
4
10 Improve connections to regionally significant areas
Improved link between schools and central business district
4 Proposed regional network along key transport corridors provides access to regionally significant areas
5 Proposed regional routes strengthens links to regional areas.
4 Maintains same connections to regional areas
3
11 Improve road safety around key transport hubs
Maintains existing safety levels. LATM could be implemented to improve the pedestrian network.
4 Designated bicycle routes and facilities should be designed to provide safety improvement.
5 Existing separated bus infrastructure provides safe environment at Campbelltown station.
3 Existing road configuration is not very permeable for pedestrians. Detailed design to assess opportunities to improve safety.
4
12 Improve personal security around key transport hubs
Additional activated land use and density adjacent to station increasing passive and active surveillance.
4 More people on the street moving at slower speeds to observe more and provide more passive surveillance.
4 Local bus services effectively provide escorted trips closer to people’s destinations. No change anticipated.
3 Road network surrounding station provides some passive surveillance.
3
13 Maximise integration with land use and other transport modes
Core network to remain similar near transport, proposed land use intensification near to station
5 Proposed density improvements supported by cycle network improvements. Cycle network integrates with other transport modes.
5 Regional bus services proposed to fully integrate with train services.
5 Road network supports land use, bus, walking and cycling networks
4
14 Support positive provision for accessibility and active transport
Very supportive 5 Very supportive 5 Bus services are generally require customers to walk to stops to access services as per current.
3 Can be designed to improve accessibility and support active transport.
4
15 Reduce reliance on private motor vehicle
Provides more amenable walking options. Land use co-located with major public transport infrastructure reduces private vehicle reliance.
5 Assists to reduce private motor vehicle reliance over a greater catchment.
4 Bus services reduce the reliance on private vehicle.
4 Unlikely to reduce reliance on private vehicle use without other measures.
3
Total 63 67 56 56
Recommendation Proceed Proceed Proceed Proceed with potential transit link over railway lines, subject to detailed precinct planning.

Glenfield to Macarthur Corridor Integrated Transport Strategy
3 August 2015 Cardno 7
Macarthur infrastructure multi-criteria analysis
# Objective Walking Cycling Bus Road
Comment Score Comment Score Comment Score Comment Score
1 Improve competitiveness and attractiveness of public transport
Precinct is relatively new with planned network of footpaths and through route linking with shopping centre and education precinct. Proposed crossing improvements would increase attractiveness of network.
4 New regional routes, improved network along green corridors and bicycle parking provided closer to station access point increases convenience compared to park & ride.
5 Bus network utilises existing routes. 3 Same amount of links for public transport services.
3
2 Improve reliability and reduce waiting times for public transport
No impact on reliability and waiting times of PT
3 No impact on reliability and waiting times of PT
3 High frequency of regional routes and transit link would reduce waiting times
5 No impact. 3
3 Improve the customer experience for public transport journeys
Minimal differences, reliant of improvement in road crossing facilities.
4 Access and amenity improvement improves the overall experience.
4 The customer experience on buses is controlled by the service operator.
3 No impact. 3
4 Encourage people to walk and cycle more
Proposed crossing links to encourage more walking.
4 Designated cycle routes provide attractive options to encourage more cycling and increase convenient catchment.
5 Maintain existing service coverage, same amount of encouragement to walk to bus stops
3 Dependent on crossing improvements
4
5 Increase land use density in key transport locations
Similar density proposed as present. Reliant on full development before full utilisation of facilities.
3 Existing land use density and locations support the implementation of an improved cycling network.
4 Proposed land use density to remain as proposed.
3 Road network and land use already planned
3
6 Improve legibility of transport Improved and proposed crossings in key locations to improve walking network legibility.
4 Proposed network infrastructure and wayfinding would improve legibility
5 Maintain existing legibility. 3 Maintains same level of connectivity
3
7 Minimise vehicular through traffic in local areas
Walking network will not impact existing level of vehicle through movement.
3 Bicycle network to provide advantage over vehicle routes.
4 Road network already designed to reduce through movements.
3 No additional through routes proposed.
3
8 Optimise use of station supporting facilities
Proposed development on the north side of the railway line would make use of the existing station bridge to facilitate cross rail corridor pedestrian movements.
4 Supports proposed bicycle parking investment and station pedestrian bridge investment.
4 Local bus services continue to serve station as of present
3 Negligible impact on station facilities.
3
9 Support and facilitate efficient movement of freight throughout the corridor.
Minimal impact if any. 3 Any method to reduce the number of private vehicle trips assists the efficient movement of freight.
4 Any method to reduce the number of private vehicle trips assists the efficient movement of freight.
4 Maintains existing support for freight movement
3
10 Improve connections to regionally significant areas
Maintains existing levels of connectivity. 3 Proposed regional network along key transport corridors provides access to regionally significant areas
5 Improves regional connectivity at Macarthur
5 Maintains same connections to regional areas
3
11 Improve road safety around key transport hubs
Crossing improvements would improve road safety.
4 Proposed to provide facilities other than bicycle lanes between traffic lanes and parking lanes.
5 Bus services assist in reducing other vehicular traffic near station thereby improving safety at station as per current levels
3 Proposed crossings to improve road safety in precinct.
4
12 Improve personal security around key transport hubs
Maintains same level of personal security. 3 More people on the street moving at slower speeds to observe more and provide more passive surveillance.
4 Local bus services effectively provide escorted trips closer to people’s destinations. No change anticipated.
3 Additional crossings and improvements at street level would provide more active street frontage
4
13 Maximise integration with land use and other transport modes
Existing level of integration 3 Integrates with existing land use and road and reserve layout utilising opportunistic links.
4 Maintains existing local connections from train station to town centre.
3 Road network supports land use, bus, walking and cycling networks
3
14 Support positive provision for accessibility and active transport
Crossing improvements are a positive provision.
4 Very supportive 4 Bus services are generally require customers to walk to in and surrounding the precinct as per current.
3 Maintains existing. 3
15 Reduce reliance on private motor vehicle
Maintains similar level of private vehicle reliance.
3 Assists to reduce private motor vehicle reliance over a greater catchment.
4 Bus services assist the reliance on private vehicle.
3 Unlikely to reduce reliance on private vehicle use without other measures.
3
Total 52 64 50 48
Recommendation Proceed Proceed Proceed Proceed
Related Documents


