151 TAP polymorphisms in leprosy 6. ASSOCIATION OF TAP1 AND TAP2 POLYMORPHISMS IN LEPROSY INTRODUCTION Leprosy caused by Mycobacterium leprae primarily affects peripheral nerves and skin. Disease presents as spectrum and is governed by the host immune response. In an endemic pocket, on exposure to M. leprae, majority of the population do not develop overt clinical disease indicating the involvement of host immunity in disease development (Martelli et al 2000, Siddiqui et al 2001, Kumar et al 2004, Ogunbiyi et al 2004, Meima et al 2004, WHO Weekly Epidemiological Report, 2007). Thus, outcome of leprosy is in part due to host genes that controls the initial infection and the host immune response (Scollard et al 2006). A substantial body of evidence suggests that multi factorial genetic factors control susceptibility of humans to infection by M. leprae (Jamieson et al 2004, Mira et al 2004, Alter et al 2008, Da Silva et al 2009). Evidence for the role of host genetics in leprosy or the type of disease manifestation was obtained from epidemiological segregation and twin studies (Ishii et al 1993). Candidate gene analysis and genome wide studies have implicated various genes and regions on chromosomes in susceptibility or resistance towards the infection (Miller et al 2004, Zhang et al 2009) One of the first candidate gene studied in leprosy was Transporter Associated with antigen presentation (TAP) (Rajalingam et al 1997). Two linkage

Welcome message from author
This document is posted to help you gain knowledge. Please leave a comment to let me know what you think about it! Share it to your friends and learn new things together.
Transcript

151 TAP polymorphisms in leprosy
6. ASSOCIATION OF TAP1 AND TAP2 POLYMORPHISMS
IN LEPROSY
INTRODUCTION
Leprosy caused by Mycobacterium leprae primarily affects peripheral
nerves and skin. Disease presents as spectrum and is governed by the
host immune response. In an endemic pocket, on exposure to M.
leprae, majority of the population do not develop overt clinical disease
indicating the involvement of host immunity in disease development
(Martelli et al 2000, Siddiqui et al 2001, Kumar et al 2004, Ogunbiyi
et al 2004, Meima et al 2004, WHO Weekly Epidemiological Report,
2007). Thus, outcome of leprosy is in part due to host genes that
controls the initial infection and the host immune response (Scollard
et al 2006). A substantial body of evidence suggests that multi
factorial genetic factors control susceptibility of humans to infection
by M. leprae (Jamieson et al 2004, Mira et al 2004, Alter et al 2008,
Da Silva et al 2009). Evidence for the role of host genetics in leprosy or
the type of disease manifestation was obtained from epidemiological
segregation and twin studies (Ishii et al 1993). Candidate gene
analysis and genome wide studies have implicated various genes and
regions on chromosomes in susceptibility or resistance towards the
infection (Miller et al 2004, Zhang et al 2009) One of the first
candidate gene studied in leprosy was Transporter Associated with
antigen presentation (TAP) (Rajalingam et al 1997). Two linkage
152 TAP polymorphisms in leprosy
studies have associated chromosome 6pq21 with leprosy susceptibility
(Abel et al 2008; Mira et al 2003).
TAP is a member of the family of ABC transporters that play a key role
in the processing and presentation of endogenous antigen to CD8+ T
cells by MHC class I pathway. In contrast, MHC class II restricted
antigens are generated by endosomal proteases and presented to
CD4+ T cells. Yet, exogenous antigens can be channeled via the
endogenous pathway where antigen presentation is mediated by MHC
class I molecules (Robinson et al 2002). Thus, the ER could be a site
for loading newly synthesized MHC class II molecules and it may play
a dual role in both endogenous and exogenous antigen processing
(Tewari et al 2005).
TAP is made up of TAP1 and TAP2 polypeptides which consist of 11
and 9 exons respectively. The significance of TAP proteins for antigen
presentation to CD8+ T cells has been demonstrated both in cell lines
and in knockout mice. Restoration of TAP1 and TAP2 in cell lines
deficient in these molecules completely restored the ability of these
cells to present antigen to T lymphocytes (Van Kaer et al 1992). It is
possible that polymorphisms in the TAP gene can influence the
antigen peptide selection, transport process and alter immune
response regulation.

153 TAP polymorphisms in leprosy
Over 13 polymorphic sites have been reported in the TAP1 gene
(Colona et al 1992, Powis et al 1993, Shi et al 1997, Tang et al 2001,
Lajoie et al 2003). The most commonly reported polymorphic residues
are at positions 333 and 637 (TAP1), 565 and 665 (TAP2). Because of
their endogenous antigen presentation and location on MHC, TAP
genes have been known to be important candidate genes in
autoimmune diseases and polymorphisms have been implicated in
multiple sclerosis, rheumatoid arthritis, allergic rhinitis and Insulin
dependent diabetes mellitus (Middleton et al 1994, Singal et al 1994,
Cailit- Zuchman et al 1995, Ishihara et al 1996, Foley et al 1999, Kim
et al 2007, Feng et al 2009).
Mycobacterial infectious disease like leprosy and tuberculosis are
known to associated with HLA-DR2 and its subtypes HLA DRB 1501
and 1502 ( Mehra et al 1992, Mehra et al 1995, Rajalingam et al
1996) . The TAP gene is located between HLA-DP and HLA-DQ of
chromosome 6 which has been implicated in susceptibility to leprosy
(Mira et al 2003, Zhang et al 2009). There is dearth in information of
TAP polymorphisms in South Indian population, hence we embarked
upon this study to elucidate the association of TAP1 and TAP2
polymorphisms in leprosy.
154 TAP polymorphisms in leprosy
6.1 Methodology
6.1.1 Study Subjects:
Leprosy patients (n=100) reporting to two LEPRA projects: BPHRC,
HYLEP, and Sivananda Rehabilitation home were enrolled in the study
after obtaining informed written consent. All patients had slit skin
smear examination and skin lesion was evaluated by histopathology.
Out of the total 100 patients, 71 were classified as lepromatous and
29 as tuberculoid. Control subjects were endemic healthy individuals
who belonged to the similar socio-economic status and ethnic
background. None of them had any family history of leprosy,
tuberculosis or other major diseases. The study was approved by the
Institutional Ethical Committee (IEC).
6.1.2 DNA Extraction:
DNA was extracted from the biopsies using Qiagen DNeasy kit
according to the manufacturer’s instructions as mentioned in
materials and methods (Cat No 69506). DNA thus obtained was
subjected to tetra primer Amplification Refractory Mutation System
(ARMS) PCR amplification using previously published primers (Powis
et al 1993) for the TAP1 and TAP2 gene as described in chapter
materials and methods (3.12)

155 TAP polymorphisms in leprosy
6.1.3 DNA amplification using ARMS-PCR:
TAP1 and TAP2 genes were amplified using a tetra primer
Amplification Refraction Mutation System-PCR (ARMS-PCR) as
described earlier (Newton et al 1989) as described in materials and
methods (3.15). The protocol was further standardized with
modifications in annealing temperatures. Polymorphic residues at
codon 333 and 637 for TAP1, 565 and 665 for TAP2 were analyzed. A
set of four primers were used for each polymorphic site. Sequencing
using ABI 3130 for a few representative samples for the detection of
polymorphic residues was outsourced from a local facility.
6.1.4 Statistical analysis:
All statistical analyses were performed with SPSS and Graph Pad
Prism ((version 5) IL, USA). A chi-square test was used to compare the
distribution of TAP1 and TAP2 genotypes between control and leprosy
groups. Odds ratios (OR) with a 95% confidence interval (CI) were
calculated using the Fisher’s exact chi-square test. Differences were
considered significant if p<0.05. Hardy-Weinberg law was used to
analyze all the possible genotype frequencies and according to the
classical method to assess if the system is in genetic equilibrium and
if there was a significant excess of homozygosity. Haplotype analysis
were performed using the Haploview v4.2 software (Barrett et al, 2005)

156 TAP polymorphisms in leprosy
6.2 Results
6.2.1 TAP1 333 Isoleucine to Valine polymorphism:
The heterozygous genotype (Isoleucine (A)/Valine (G)) was positively
associated with leprosy (71%) when compared with controls (46%)
(p<0.0005). The frequency of AA genotype was significantly low in
patients (27%) when compared to controls (50%) presenting negative
association of this genotype with the disease group (p<0.001).
Frequency of GG homozygous genotype was observed to be similar in
patients and controls with 2% and 4% respectively. G allele was
positively associated with the disease when compared A allele (Table
6.1). Significance was not observed across leprosy spectrum for TAP1
333 (Table 6.2). The genotype frequencies of controls were not found
to be in Hardy-Weinberg equilibrium.
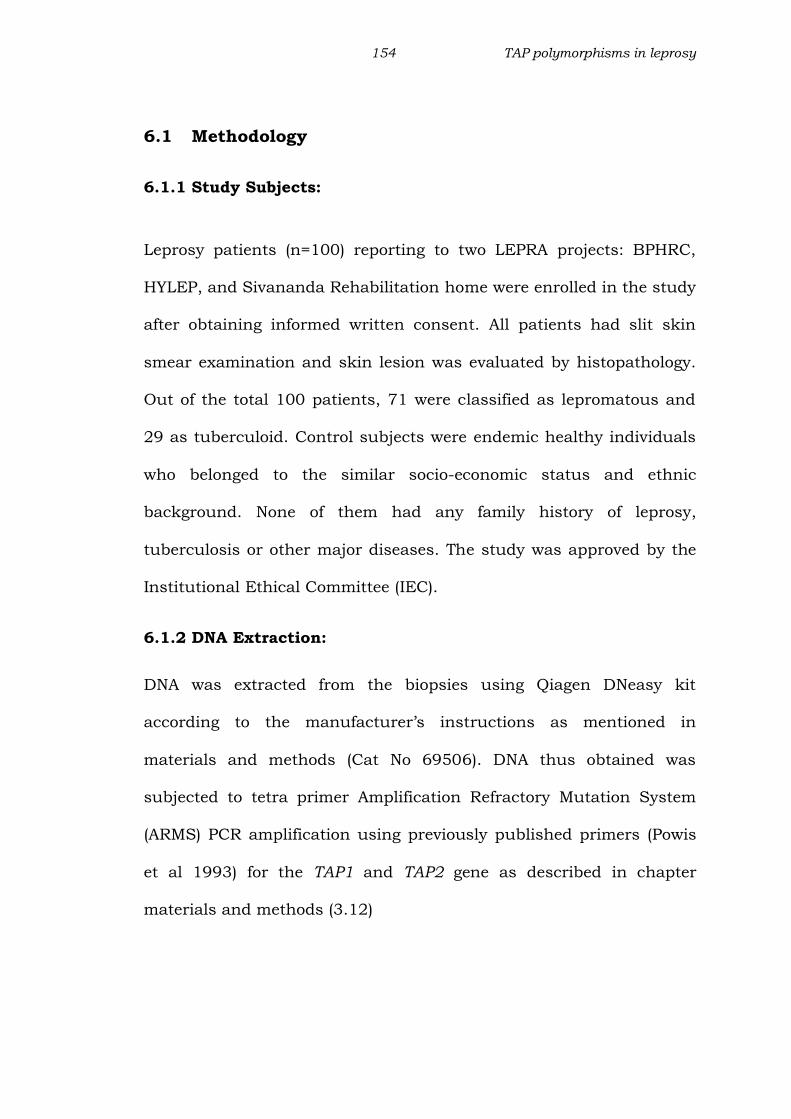
PCR products when resolved on 2% agarose gel electrophoresis
showed internal control band of 533bp, Valine specific band of 351bp
and Isoleucine specific band of 241bp. Hence the presence of two
bands of 351 and 241 basepairs in a single lane along with the 533 bp
control indicates Isoleucine/Valine heterozygote, while a 351 bp or
241 bp amplicon indicates homozygosity for Valine or Isoleucine
respectively (Figure 6.1).
157 TAP polymorphisms in leprosy
Figure 6.1: ARMS PCR for TAP1 gene position 333
A representative agarose gel (2%) picture showing amplification
products for TAP1 gene at position 333.
Lanes 1,3, 5,7 and 8 - heterozygous for Isoleucine/Valine (AG).
Lanes 2, 4 and 6 - homozygous for Isoleucine (AA).
Lane 5 - homozygous for Valine (GG).
Lane 9 - 100 bp molecular marker.
Internal control (533bp) is common for all PCR products.
158 TAP polymorphisms in leprosy
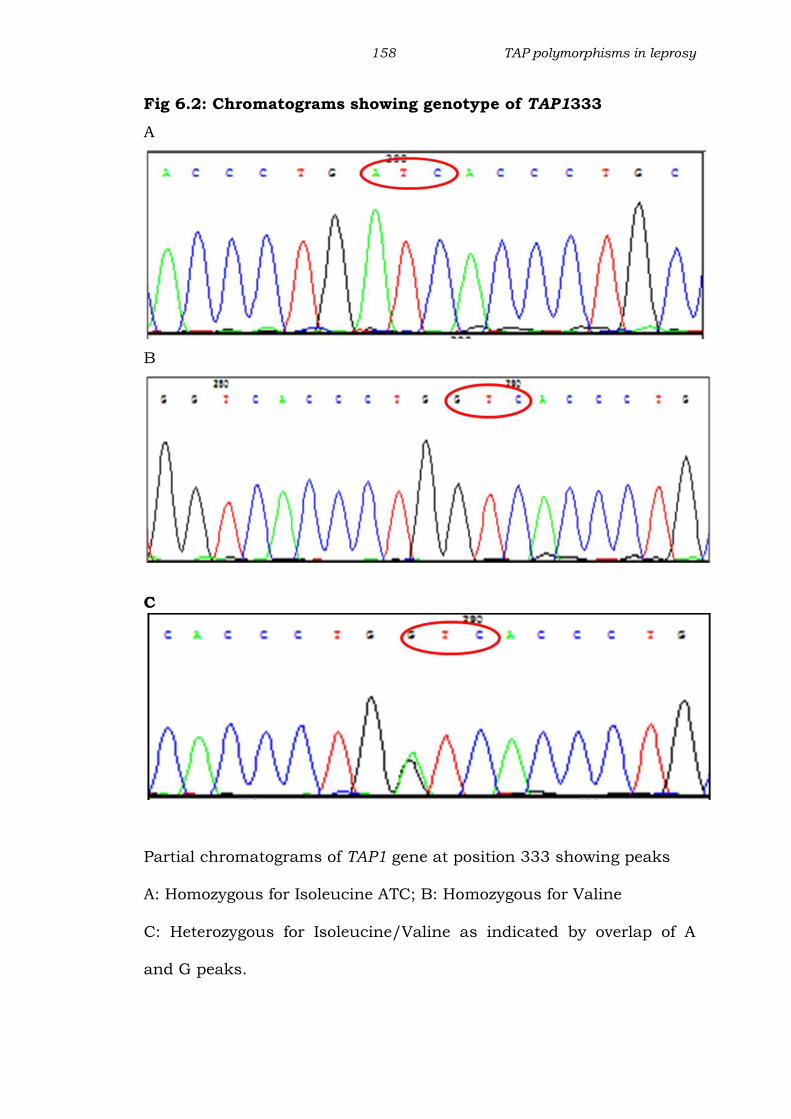
Fig 6.2: Chromatograms showing genotype of TAP1333
A
B
C
Partial chromatograms of TAP1 gene at position 333 showing peaks
A: Homozygous for Isoleucine ATC; B: Homozygous for Valine
C: Heterozygous for Isoleucine/Valine as indicated by overlap of A
and G peaks.
159 TAP polymorphisms in leprosy
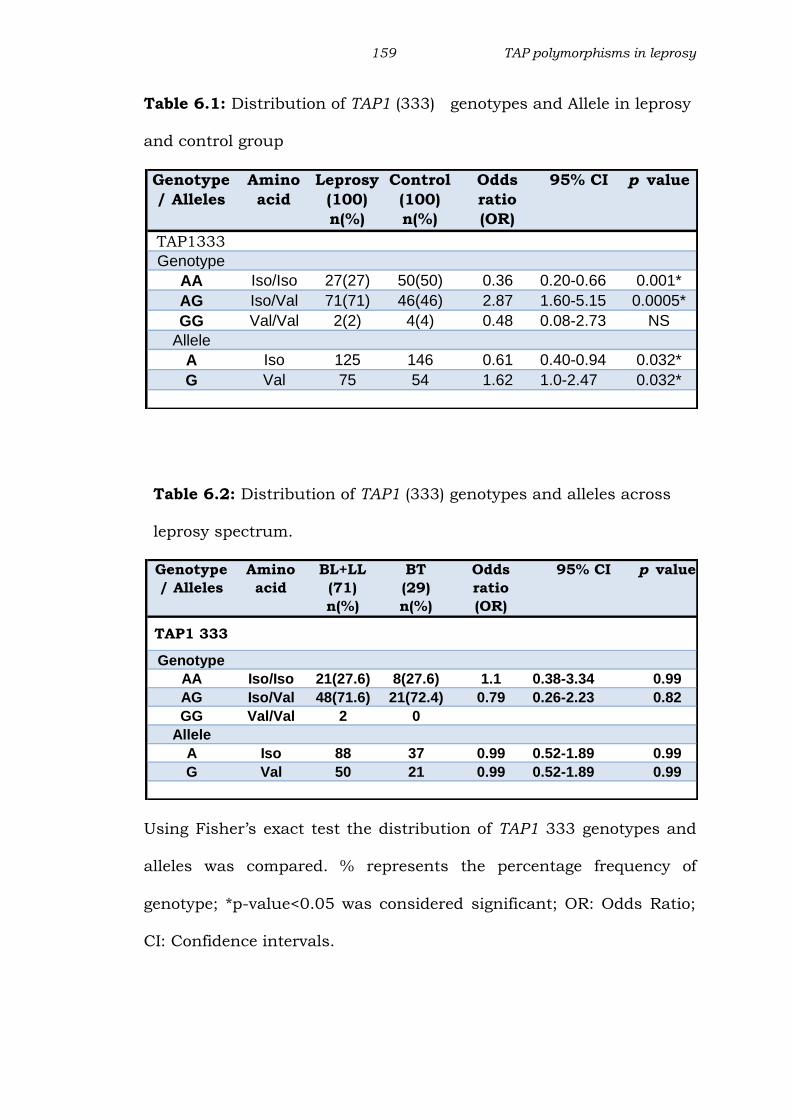
Table 6.1: Distribution of TAP1 (333) genotypes and Allele in leprosy
and control group
Table 6.2: Distribution of TAP1 (333) genotypes and alleles across
leprosy spectrum.
Using Fisher’s exact test the distribution of TAP1 333 genotypes and
alleles was compared. % represents the percentage frequency of
genotype; *p-value<0.05 was considered significant; OR: Odds Ratio;
CI: Confidence intervals.
Genotype
/ Alleles
Amino
acid
Leprosy
(100)
n(%)
Control
(100)
n(%)
Odds
ratio
(OR)
95% CI p value
TAP1333
Genotype
AA Iso/Iso 27(27) 50(50) 0.36 0.20-0.66 0.001*
AG Iso/Val 71(71) 46(46) 2.87 1.60-5.15 0.0005*
GG Val/Val 2(2) 4(4) 0.48 0.08-2.73 NS
Allele
A Iso 125 146 0.61 0.40-0.94 0.032*
G Val 75 54 1.62 1.0-2.47 0.032*
Genotype
/ Alleles
Amino
acid
BL+LL
(71)
n(%)
BT
(29)
n(%)
Odds
ratio
(OR)
95% CI p value
TAP1 333
Genotype
AA Iso/Iso 21(27.6) 8(27.6) 1.1 0.38-3.34 0.99
AG Iso/Val 48(71.6) 21(72.4) 0.79 0.26-2.23 0.82
GG Val/Val 2 0
Allele
A Iso 88 37 0.99 0.52-1.89 0.99
G Val 50 21 0.99 0.52-1.89 0.99
160 TAP polymorphisms in leprosy
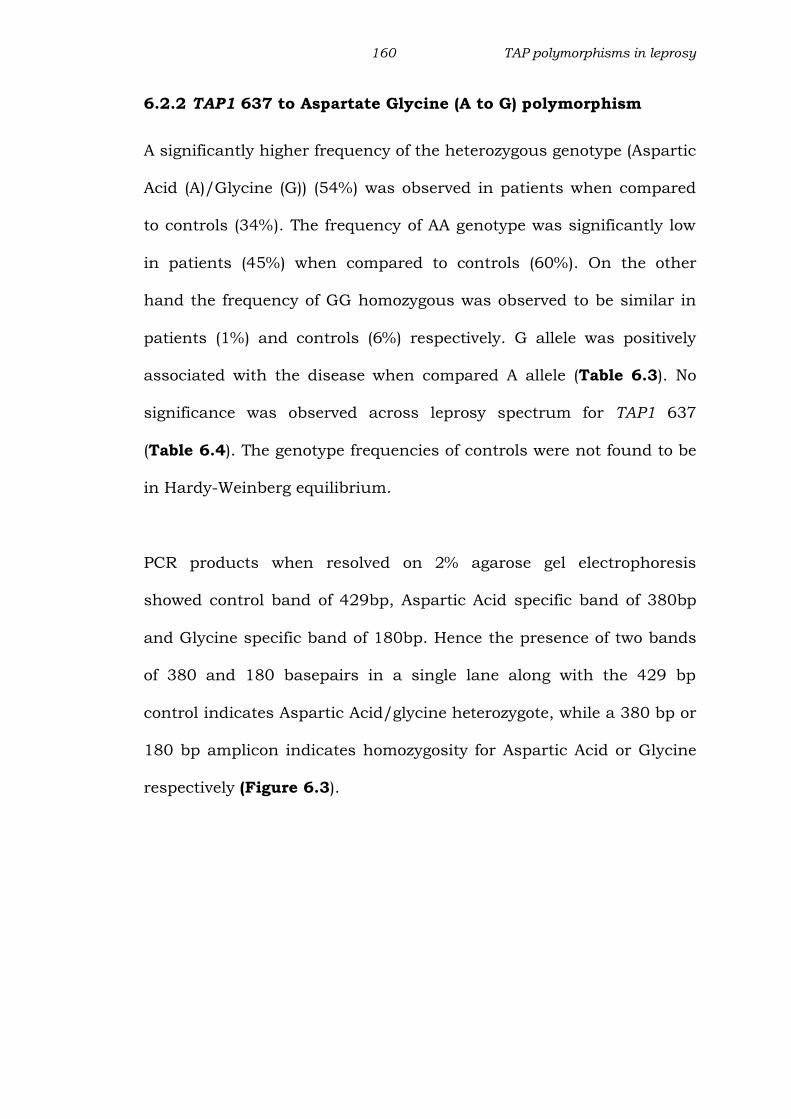
6.2.2 TAP1 637 to Aspartate Glycine (A to G) polymorphism
A significantly higher frequency of the heterozygous genotype (Aspartic
Acid (A)/Glycine (G)) (54%) was observed in patients when compared
to controls (34%). The frequency of AA genotype was significantly low
in patients (45%) when compared to controls (60%). On the other
hand the frequency of GG homozygous was observed to be similar in
patients (1%) and controls (6%) respectively. G allele was positively
associated with the disease when compared A allele (Table 6.3). No
significance was observed across leprosy spectrum for TAP1 637
(Table 6.4). The genotype frequencies of controls were not found to be
in Hardy-Weinberg equilibrium.
PCR products when resolved on 2% agarose gel electrophoresis
showed control band of 429bp, Aspartic Acid specific band of 380bp
and Glycine specific band of 180bp. Hence the presence of two bands
of 380 and 180 basepairs in a single lane along with the 429 bp
control indicates Aspartic Acid/glycine heterozygote, while a 380 bp or
180 bp amplicon indicates homozygosity for Aspartic Acid or Glycine
respectively (Figure 6.3).

161 TAP polymorphisms in leprosy
Figure 6.3: ARMS PCR for TAP1 gene position 637
A representative agarose gel (2%) picture showing amplification
products for TAP1 gene at position 637.
Lanes 3, 4 and 10 - heterozygous for Aspartic Acid/Glycine (AG)
Lanes 2,5,6,7,8,9 and 10 - homozygous for Aspartic Acid (AA)
Lane 9 is a 100 bp molecular marker
Internal control (429bp) is common for all PCR products.

162 TAP polymorphisms in leprosy
Fig 6.4: Chromatograms showing genotype of TAP1637
A
B
C
Partial chromatograms of TAP1 at position 637 showing peaks
A: Homozygous for Aspartic Acid ; B:Homozygous for Glycine
C: Heterozygous for Aspsartic Acid/Glycine as indicated by overlap of
A and G peaks
163 TAP polymorphisms in leprosy
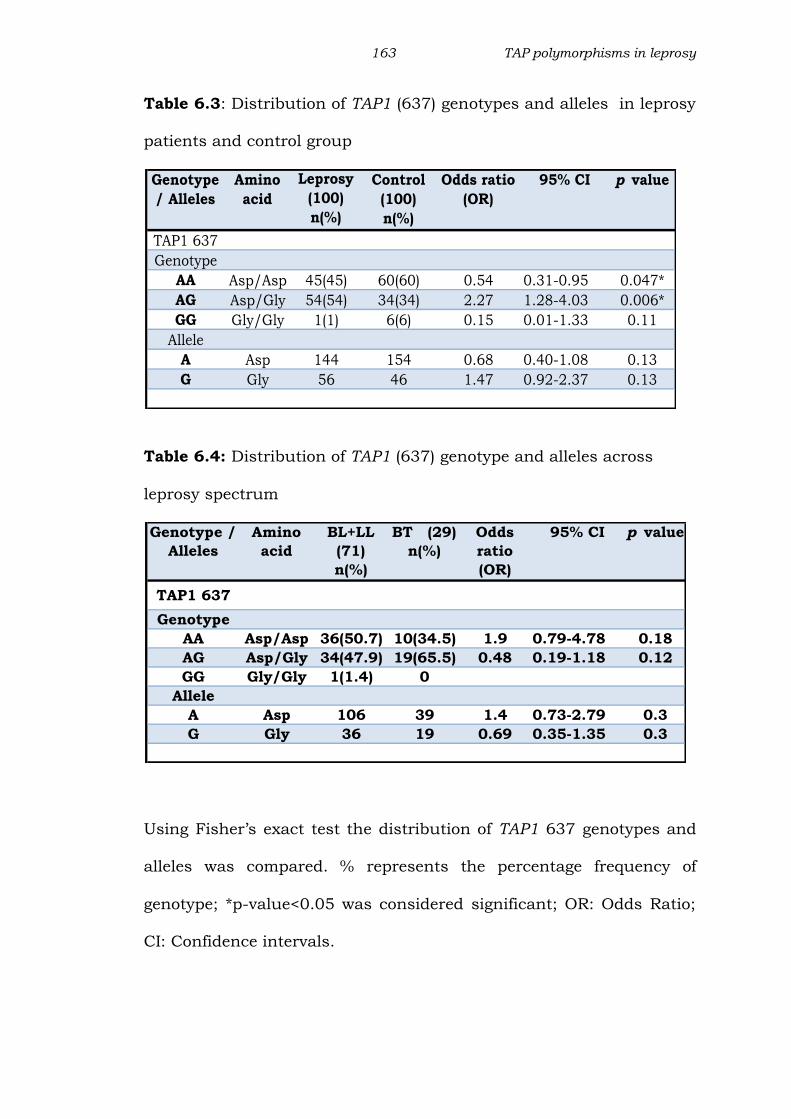
Table 6.3: Distribution of TAP1 (637) genotypes and alleles in leprosy
patients and control group
Table 6.4: Distribution of TAP1 (637) genotype and alleles across
leprosy spectrum
Using Fisher’s exact test the distribution of TAP1 637 genotypes and
alleles was compared. % represents the percentage frequency of
genotype; *p-value<0.05 was considered significant; OR: Odds Ratio;
CI: Confidence intervals.
Genotype
/ Alleles
Amino
acid
Leprosy
(100)
n(%)
Control
(100)
n(%)
Odds ratio
(OR)
95% CI p value
TAP1 637
Genotype
AA Asp/Asp 45(45) 60(60) 0.54 0.31-0.95 0.047*
AG Asp/Gly 54(54) 34(34) 2.27 1.28-4.03 0.006*
GG Gly/Gly 1(1) 6(6) 0.15 0.01-1.33 0.11
Allele
A Asp 144 154 0.68 0.40-1.08 0.13
G Gly 56 46 1.47 0.92-2.37 0.13
Genotype /
Alleles
Amino
acid
BL+LL
(71)
n(%)
BT (29)
n(%)
Odds
ratio
(OR)
95% CI p value
TAP1 637
Genotype
AA Asp/Asp 36(50.7) 10(34.5) 1.9 0.79-4.78 0.18
AG Asp/Gly 34(47.9) 19(65.5) 0.48 0.19-1.18 0.12
GG Gly/Gly 1(1.4) 0
Allele
A Asp 106 39 1.4 0.73-2.79 0.3
G Gly 36 19 0.69 0.35-1.35 0.3
164 TAP polymorphisms in leprosy
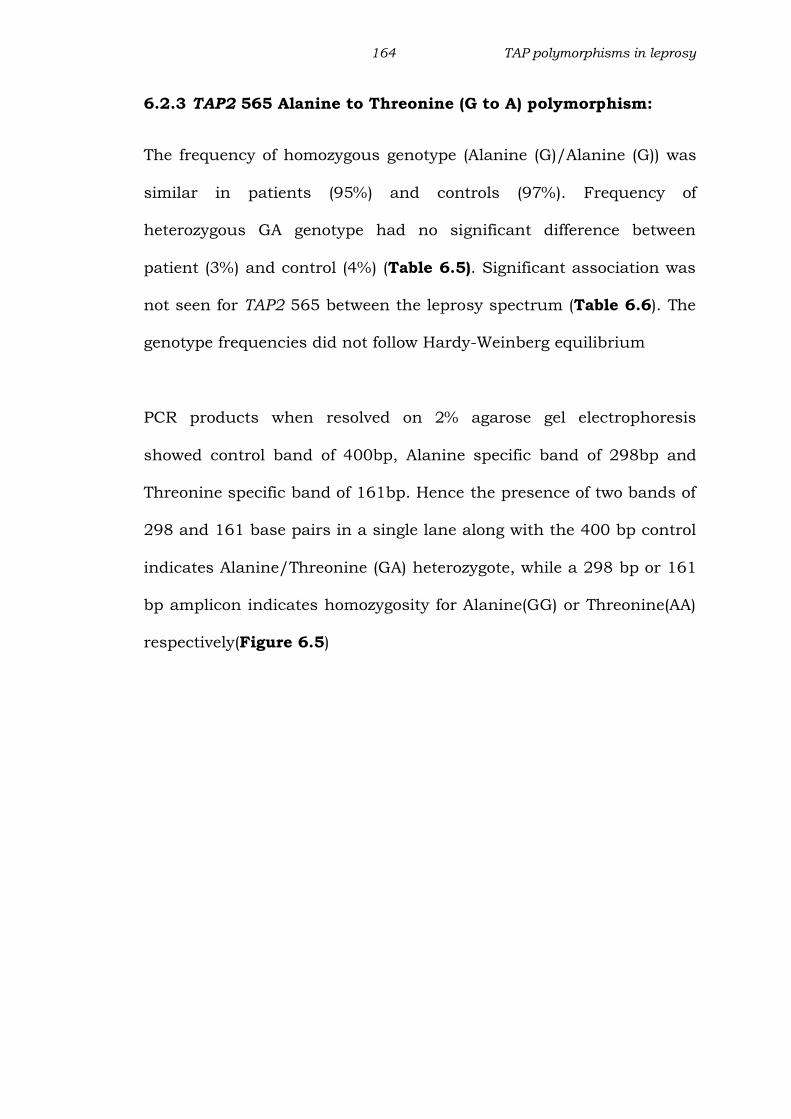
6.2.3 TAP2 565 Alanine to Threonine (G to A) polymorphism:
The frequency of homozygous genotype (Alanine (G)/Alanine (G)) was
similar in patients (95%) and controls (97%). Frequency of
heterozygous GA genotype had no significant difference between
patient (3%) and control (4%) (Table 6.5). Significant association was
not seen for TAP2 565 between the leprosy spectrum (Table 6.6). The
genotype frequencies did not follow Hardy-Weinberg equilibrium
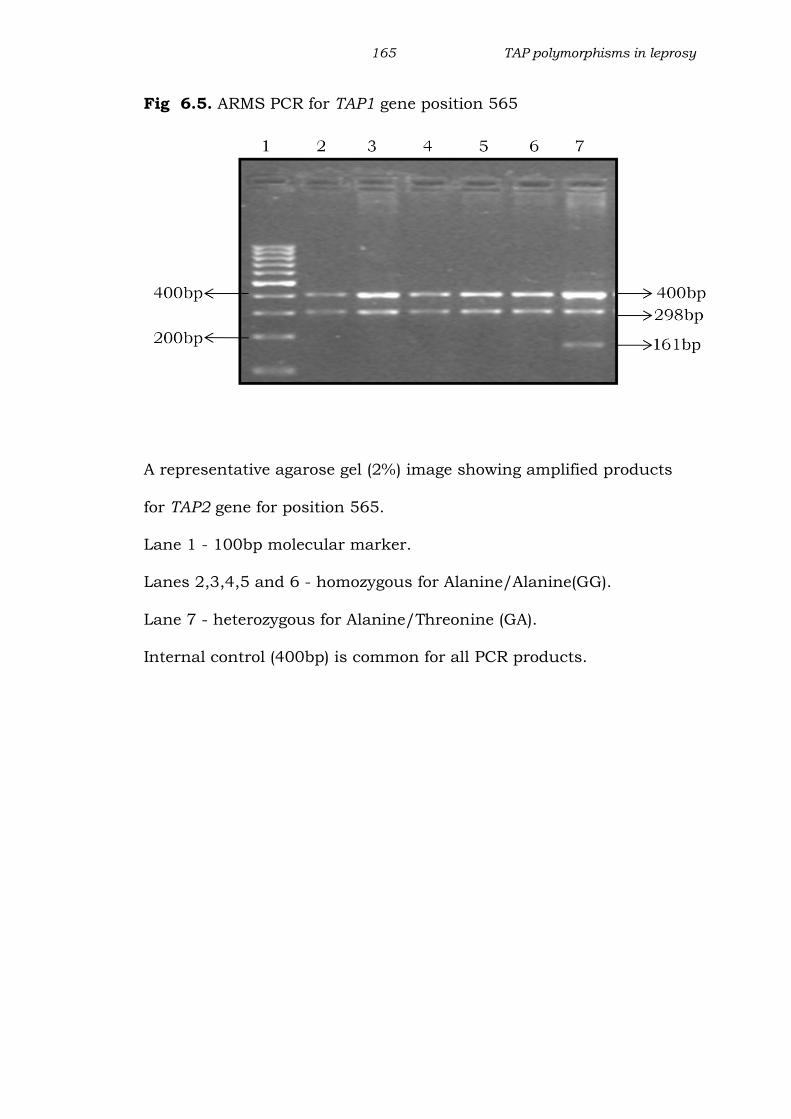
PCR products when resolved on 2% agarose gel electrophoresis
showed control band of 400bp, Alanine specific band of 298bp and
Threonine specific band of 161bp. Hence the presence of two bands of
298 and 161 base pairs in a single lane along with the 400 bp control
indicates Alanine/Threonine (GA) heterozygote, while a 298 bp or 161
bp amplicon indicates homozygosity for Alanine(GG) or Threonine(AA)
respectively(Figure 6.5)
165 TAP polymorphisms in leprosy
Fig 6.5. ARMS PCR for TAP1 gene position 565
A representative agarose gel (2%) image showing amplified products
for TAP2 gene for position 565.
Lane 1 - 100bp molecular marker.
Lanes 2,3,4,5 and 6 - homozygous for Alanine/Alanine(GG).
Lane 7 - heterozygous for Alanine/Threonine (GA).
Internal control (400bp) is common for all PCR products.

166 TAP polymorphisms in leprosy
Table 6.5 : Genotype and Allele distribution of TAP2 (565) gene
polymorphism.
Table 6.6: Genotype and Allele distribution of TAP2(565) gene across
leprosy spectrum
Using the Fisher’s exact test the distribution of TAP2 565 genotypes
and alleles were compared. % represents the percentage frequency of
genotype; *p-value<0.05 was considered significant; OR: Odds Ratio;
CI: Confidence intervals.
Genotype /
Alleles
Amino
acid
Leprosy
100
n(%)
Control
(100)
n(%)
Odds ratio
(OR)95% CI p value
TAP2 565
Genotype
GG Ala/Ala 97(97) 95(95) 1.7 0.39-7.32 0.72
GA Ala/Thr 3(3) 4(4) 0.58 0.13-2.52 0.72
AA Thr/Thr 0 1(1) 0.33 0.01-8.20 1
Allele
G Ala 197 195 1.68 0.39-7.14 0.72
A Thr 3 5 0.59 0.14-2.51 0.72
Genotype /
Alleles
Amino
acid
BL+LL
(71)
n(%)
BT (29)
n(%)
Odds
ratio
(OR)
95% CI p value
TAP2 565
Genotype
GG Ala/Ala 70(98.59) 27(93.10) 5.18 0.45-59.60 0.2
GA Ala/Thr 1(1.40) 2(6.89) 0.19 0.01-2.21 0.2
AA Thr/Thr 0 0 - - -
Allele
G Ala 142 56 5.07 0.45-57.08 0.2
A Thr 1 2 0.19 0.09-2.21 0.2

167 TAP polymorphisms in leprosy
6.2.4 TAP2 665 Threonine to Alanine (A to G) polymorphism:
There was no significant difference between leprosy patients and
control group for TAP2 665. Frequency of heterozygous AG genotype
in patients (58%) was similar to controls (66%) and homozygous AA in
patients (30%) and controls (40%). Alleles A and G were equally
distributed in the leprosy patient and control groups (Table 6.7 and
6.8) Significant association was not seen for TAP2 665 between the
leprosy spectrums or when lepromatous or tuberculoid patients were
compared with the control group. The genotype frequencies were
found to be in Hardy-Weinberg equilibrium.
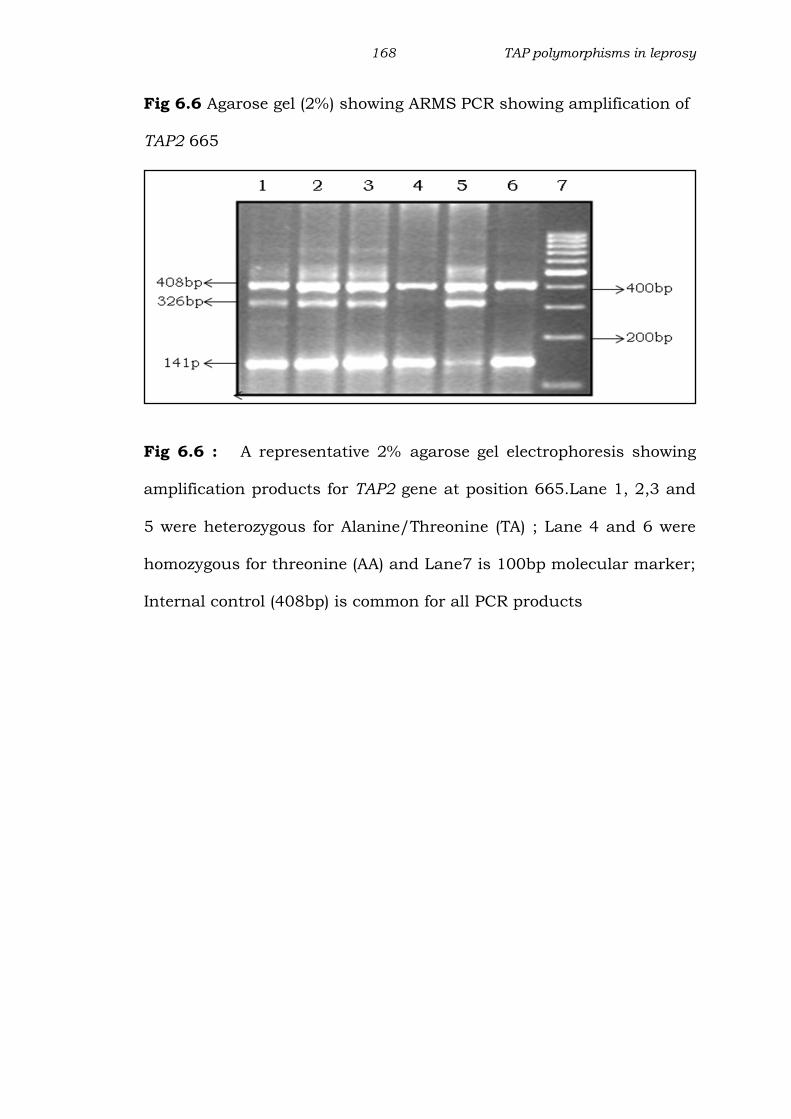
PCR products when resolved on 2% agarose gel electrophoresis
showed control band of 408bp, Threonine specific band of 326bp and
Alanine specific band of 141bp. Hence the presence of two bands of
326 and 141 base pairs in a single lane along with the 408 bp control
indicates Threonine /Alanine heterozygote, while a 326 bp or 141 bp
amplicon indicates homozygosity for Threonine or Alanine respectively
(Fig.6.6)
168 TAP polymorphisms in leprosy
Fig 6.6 Agarose gel (2%) showing ARMS PCR showing amplification of
TAP2 665
Fig 6.6 : A representative 2% agarose gel electrophoresis showing
amplification products for TAP2 gene at position 665.Lane 1, 2,3 and
5 were heterozygous for Alanine/Threonine (TA) ; Lane 4 and 6 were
homozygous for threonine (AA) and Lane7 is 100bp molecular marker;
Internal control (408bp) is common for all PCR products

169 TAP polymorphisms in leprosy
Table 6.7: Genotype and Allele distribution of TAP2 (665) gene
polymorphism.
Genotype / Alleles
Amino acid
Leprosy
(100) n(%)
Control (100) n(%)
Odds ratio (OR)
95% CI p value
TAP2 665
Genotype
AA Thr/Thr 40(40) 30(30) 1.56 0.86-2.79 0.18
AG Thr/Ala 58(58) 66(66) 0.71 0.40-1.26 0.3
GG Ala/Ala 2(2) 4(4) 0.48 0.08-2.73 0.68
Allele
A Thr 138 126 1.3 0.86-1.97 0.24
G Ala 62 74 0.76 0.50-1.15 0.24
Table 6.8: Percent distribution of genotype and allele for TAP2(665)
across leprosy spectrum
Using the Fisher’s exact test the distribution of TAP2 665 genotypes
and alleles were compared. % represents the percentage frequency of
genotype; *p-value<0.05 was considered significant; OR: Odds Ratio;
CI: Confidence intervals.
Genotype /
Alleles
Amino
acid
BL+LL
(71)
n(%)
BT
(29)
n(%)
Odds
ratio
(OR)
95% CI p value
TAP2 665
Genotype
AA Thr/Thr 28(39.43) 12(41.38) 0.92 0.38-2.22 1
AG Thr/Ala 41(57.74) 17(23.94) 0.96 0.40-2.32 1
GG Ala/Ala 2(2.81) 0 -
Allele
A Thr 97 41 0.89 0.45-1.74 0.86
G Ala 45 17 1.18 0.60-2.30 0.86

170 TAP polymorphisms in leprosy
Table 6.9: Association of TAP1 haplotype with infection outcome.
Table 6.10: Association of TAP2 haplotype with infection outcome
Figures in parenthesis represent the sample size in each cohort
Using the Fisher’s exact test the frequency of haplotypes in control
and patient groups for the TAP2 665 were compared. % represents the
percentage frequency of genotype; *p-value<0.05 was considered
significant; OR: Odds Ratio; CI: Confidence intervals.
TAP1 Control (100) Patients (100)
Haplotypes
(333/637) n % n % OR CI(95%) p value
AA
(Iso/Asp)126 63 126 63 1 0.66-1.5 1
GG
(Val/Gly)55 27 26 13 0.39 0.23-0.66 0.0004
GA
(Val/Asp)18 9 28 14 1.64 0.87-3.08 0.1576
AG
(Iso/Gly)1 1 20 10 20 2.65-150 0.0001
TAP2 Control (100) Patients (100)
Haplotypes
(565/665) n % n % OR CI(95%) p value
GA
(Ala/Thr)124 62 135 67 1.27 0.84-1.92 0.2953
GG
(Ala/Ala)71 35 62 31 0.81 0.53-1.23 0.3939
AA
(Thr/Thr)5 3 3 2 0.59 0.14-2.52 0.2462
171 TAP polymorphisms in leprosy
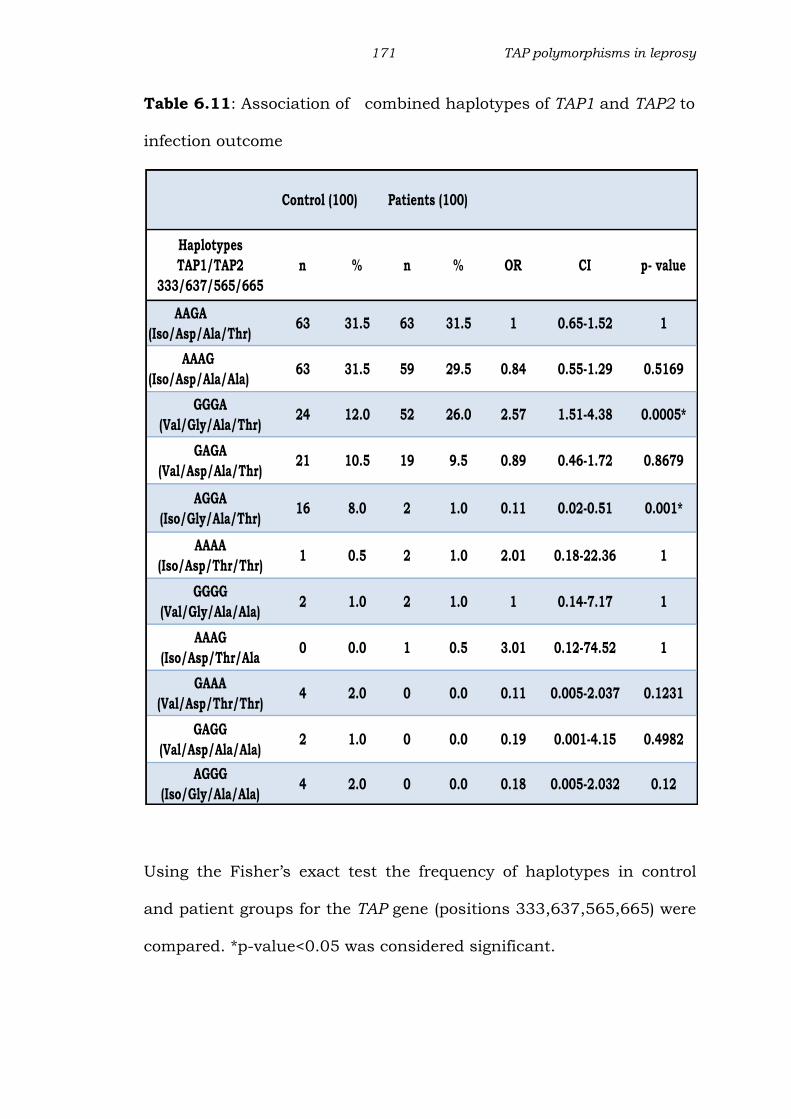
Table 6.11: Association of combined haplotypes of TAP1 and TAP2 to
infection outcome
Using the Fisher’s exact test the frequency of haplotypes in control
and patient groups for the TAP gene (positions 333,637,565,665) were
compared. *p-value<0.05 was considered significant.
Control (100) Patients (100)
Haplotypes
TAP1/TAP2
333/637/565/665
n % n % OR CI p- value
AAGA
(Iso/Asp/Ala/Thr)63 31.5 63 31.5 1 0.65-1.52 1
AAAG
(Iso/Asp/Ala/Ala)63 31.5 59 29.5 0.84 0.55-1.29 0.5169
GGGA
(Val/Gly/Ala/Thr) 24 12.0 52 26.0 2.57 1.51-4.38 0.0005*
GAGA
(Val/Asp/Ala/Thr)21 10.5 19 9.5 0.89 0.46-1.72 0.8679
AGGA
(Iso/Gly/Ala/Thr)16 8.0 2 1.0 0.11 0.02-0.51 0.001*
AAAA
(Iso/Asp/Thr/Thr)1 0.5 2 1.0 2.01 0.18-22.36 1
GGGG
(Val/Gly/Ala/Ala)2 1.0 2 1.0 1 0.14-7.17 1
AAAG
(Iso/Asp/Thr/Ala0 0.0 1 0.5 3.01 0.12-74.52 1
GAAA
(Val/Asp/Thr/Thr)4 2.0 0 0.0 0.11 0.005-2.037 0.1231
GAGG
(Val/Asp/Ala/Ala)2 1.0 0 0.0 0.19 0.001-4.15 0.4982
AGGG
(Iso/Gly/Ala/Ala)4 2.0 0 0.0 0.18 0.005-2.032 0.12

172 TAP polymorphisms in leprosy
6.2.5 Haplotyping:
Haplotype frequency of TAP1 gene (333 and 637 position):
Results from our study suggest a positive association of TAP1
haplotypes at 333 and 637 position with leprosy. For TAP1 gene we
observed four haplotypes in both the groups. Haplotype AA was the
most frequent (63%), followed by GG, GA and AG. The TAP1 SNP
haplotype GG had a significantly higher frequency in controls when
compared to patients (p<0.0005)(Table 6.9). TAP1 haplotype AG was
significantly high in patients when compared to controls indicating a
positive association with the disease (p<0.0001), the frequency of
haplotypes AG was very low in control group (1%).
Haplotype frequency of TAP2 gene (565 and 665 position):
For TAP2 SNP three haplotypes were observed (Table 6.10). The
frequency of GA was high in both patients (67%) and controls (62%).
TAP2 SNP haplotype GG occurred with almost equal frequency in
control (31%) and patient (35%) groups. The frequency of TAP2 SNP
haplotype AA was quite low in both patient (2%) and control (3%)
groups. TAP2 haplotype AG was not detected in either of the group.
When TAP2 gene was considered at position 565 and 665, none of the
observed haplotypes were significantly associated with leprosy.

173 TAP polymorphisms in leprosy
Haplotype frequency of TAP1 and TAP2 gene (333,637,565
and 665 position):
For TAP1-TAP2 SNP, 11 haplotypes were observed, the most
commonly observed was AAGA (Iso-Asp-Ala-Thr) (Table 6.11). This
haplotype was equally distributed in patient and control group
showing a high frequency (31.5%), followed by AAGG, GGAA and
GAGA. A significantly high frequency of haplotype GGGA (Val-Gly-Thr-
Ala)(p<0.0005) was seen in patients when compared to controls, thus
indicating a positive association of this haplotype with the disease. On
the other hand significantly high frequency of haplotype with
combination AGGA (p<0.001) was observed in controls when
compared to the patient group, indicating a negative association of
this haplotype with the disease.

174 TAP polymorphisms in leprosy
6.3 DISCUSSION:
HLA class I molecules plays a crucial role in mammalian adaptive
immune system by presenting antigen peptides on the cell surface.
These peptides are actively transported across the endoplasmic
reticulum by transporters associated with antigen presentation
(TAP).Hence polymorphism in these genes may affect the selection
process that recognizes the antigen. One of our studies reported the
influence of TAP polymorphism on HIV-TB co-infection. The HIV
positive individuals with GG (Val/Val) at TAP1 333 and GA (Gly/Asp)
at TAP1 637 positions were at higher risk of developing TB co-infection
(Sharada et al 2011). M.leprae the causative agent of leprosy and
M.tuberculosis both belong to the mycobacterial family and the only
study has reported the association of TAP polymorphism in North
Indian tuberculoid leprosy patients (Rajalingam et al 1997). Our study
investigated the importance of TAP gene polymorphism in
susceptibility towards leprosy.
Findings from our study revealed that the heterozygous genotype AG
of TAP1 333 and TAP1 637 may confer susceptibility to leprosy and
the homozygous genotype AA protection from the disease. Genotyping
analysis findings in our study were consistent with those reported on
allergic rhinitis, ankylosing spondylitis, and cancer, dengue
hemorrhagic fever (Kim et al 2007, Soundravally et al 2007, Feng et al
2009, Einstein et al 2009). A low frequency of homozygous genotype
175 TAP polymorphisms in leprosy
AA in patients was observed in this study indicating its protective role
in leprosy. The association of this genotype with protection has also
been reported in dengue (Soundravally et al 2007). However, another
study revealed a high frequency of homozygous AA genotype in on in
Polish and UK patients affected with sarcoidosis (Foley et al 1999).
The AG genotype indicating the presence of both Isoleucine and valine
at position 333 (codon) of TAP1 gene might affect peptide transport
thereby affecting the downstream processes of antigen presentation
and immune responses, which may contribute to the development of
leprosy. Thus in our population, the AG genotype at TAP1 333 seems
to be a risk factor for the disease. This is reiterated by the fact that
subjects with homozygous genotype AA seem to be resistant from
developing the disease.
Our data revealed that for TAP1 637, Aspartic acid/Glycine
heterozygote (AG genotype) was responsible for susceptibility to
leprosy making this genotype a risk factor for the disease. These
findings corroborate to those reported in cystic echinococcosis,
pneumonitis where AG genotype was reported to be a risk factor for
the disease (Galvez et al 2008, Kiper et al 2010). Interestingly in our
population the homozygous genotype (AA) Aspartic Acid was found to
be protective factor. These findings are similar to those reported in
dengue where AA homozygous genotype is protective (Soundarvally et
al 2007). This could be true for the infectious diseases, since this
genotype is reported to be associated with risk of developing atopic
176 TAP polymorphisms in leprosy
dermatitis, an allergic disorder in the Chinese population (Kuwata et
al 1995).
Our results suggest that there is no influence of TAP2 polymorphic
residues at positions 565 and 665 on leprosy. Majority of the patient
and control groups were expressing homozygous GG genotype coding
for Alanine/Alanine at position 565, which was in agreement with
other diseases such as sarcoidosis and ankylosing spondilytis (Foley
et al 1999, Kim et al 2007, Feng et al 2009). Genotype AA coding for
Threonine was not detected in either the patient or control groups and
this has been reported in dengue hemorrhagic fever in an Indian
population (Soundarvally et al 2007) This finding is similar to that
seen in ankylosing spondylitis where a very low frequency of AA
genotype is reported in patient group( Feng et al 2009). At TAP2
position 665 a very low frequency of AA genotype was observed in
both, patient and control group. However a positive association of
TAP2 665 genotype AA has been reported in inflammatory rheumatoid
arthritis in Finnish population (Tuokko et al 1998)
A high frequency of TAP1 SNP rare haplotype AG was observed in our
population. This finding parallels to that reported in autoimmune
disease Systemic lupus erythematous in Columbian patients (Correa
et al 2003). Another study reports the association of TAP1 SNP
haplotype AG with juvenile myoclonic epilepsy (Layouni et al 2010).
Interestingly the rare TAP1 SNP haplotype AG was found to influence

177 TAP polymorphisms in leprosy
the susceptibility to leprosy. Furthermore TAP1-TAP2 SNP haplotype
GGGA was observed to be positively associated with leprosy pointing
towards the association of this haplotype with susceptibility towards
leprosy. Conversely haplotype AGGA would possibly confer protection
from the disease.
TAP2 SNP haplotype GG was equally distributed in patient and control
group. However a study from North India reports a positive
association of TAP2B haplotype GGG at position 379/565/665 in
leprosy patients positive for HLA-DR15 (Rajalingam et al 1997). A
discrepancy in the haplotype distribution between the two studies can
be explained by a number of factors. Firstly ethnic variation might
influence the genetic regulation and related polymorphisms in
individual disease. Secondly relatively small number of patients
enrolled in that study (N=50) when compared to our study. Yet
another reason could be enrollment of only polar tuberculoid patients
in the previous study. Therefore it could be postulated that the
harboring TAP1 SNP Iso-333-Gly-637 and TAP1-TAP2 SNP and Val-
Gly-Ala-Thr haplotype combination for TAP could probably alter
antigen presentation making an exposed individual susceptible to
leprosy. Our findings also suggest that the haplotype GGGA may
cause susceptibility to leprosy and conversely haplotype AGGA was
observed to be protective.

178 TAP polymorphisms in leprosy
Our results provide genetic evidence that polymorphism in the TAP1
gene influences the susceptibility to leprosy in our population. One
explanation is that the microbial peptides may not be presented or
bound efficiently to MHC class I thereby leading to a detrimental or
minimal immune response leading to increased leprosy susceptibility.
Though the findings presented here are admittedly incomplete due to
lack of HLA-DR typing, further studies on HLA polymorphisms can
reveal whether or not TAP alleles are in linkage disequilibrium with
HLA in our population. More studies will be required to understand
contribution of these polymorphisms towards susceptibility to leprosy.
Future studies focusing on the functional aspect involving TAP
expression in transcription and protein level may shed light on the
association of these polymorphisms in leprosy.
In conclusion, in our population heterozygous genotype AG indicating
the presence of both Isoleucine and Valine at codon 333 of TAP1 and
Aspartic Acid and Glycine at position of codon 637 of TAP1 might
affect peptide transport and contribute to the development of leprosy.
The results from the study also indicate the association of haplotype
GGGA(Val-Gly-Ala-Thr) with susceptibility to and AGGA(Iso-Gly-Thr-
Ala) with protection from leprosy Therefore, TAP1 may be an
important factor in the pathogenesis of leprosy.

179 TAP polymorphisms in leprosy
Summary
TAP1 at position 333
Heterozygous genotype AG may be risk factor
Homozygous AA may be protective
TAP1 at position 637
Homozygous genotypes AG may be risk factor.
Homozygous genotype AA may be protective.
TAP1 SNP haplotype,
AG may confer susceptibility to leprosy
GG may protect from leprosy
TAP1-TAP2 SNP Haplotype ,
GGGA may confer susceptibility to leprosy
AGGA may protect from leprosy
TAP2 565 and TAP2 665 have no influence on leprosy
No influence of TAP1 and TAP2 polymorphic residues with
leprosy spectrum.
Related Documents


![[MATH-EDUCARE] Bai Tap Giai Tich Tap1 DAY SO CHUOI SO Tap1- KaczkorNowak-DoanChi-dich](https://static.cupdf.com/doc/110x72/577c84471a28abe054b841f3/math-educare-bai-tap-giai-tich-tap1-day-so-chuoi-so-tap1-kaczkornowak-doanchi-dich.jpg)