Learning Through Legacy Alabama’s Environmental Education Guide for Grades 6-8 Produced for Alabama Educators By Legacy, Partners in Environmental Education Revised 2013 Funding for this project is made possible by proceeds from the sale of Alabama's “Protect Our Environment” license tags.

Welcome message from author
This document is posted to help you gain knowledge. Please leave a comment to let me know what you think about it! Share it to your friends and learn new things together.
Transcript
Learning
Through Legacy
Alabama’s Environmental Education Guide
for Grades 6-8
Produced for
Alabama Educators
By
Legacy, Partners in Environmental Education
Revised 2013
Funding for this project is made possible
by proceeds from the sale of Alabama's
“Protect Our Environment” license tags.

Disclaimer
“Learning Through Legacy: An Environmental Education Guide” was prepared by Legacy, Inc.,
Partners in Environmental Education, and its collaborative partners, including teachers and
environmental professionals throughout Alabama. (For a complete listing, contact the Legacy office.)
Neither Legacy, Inc., nor any persons acting on its behalf:
a. Make any warranty or representation, expressed or implied, with respect to the accuracy of
any information contained in this document; or
b. Make any warranty or representation, expressed or implied, that the use of any information,
apparatus, methods, or process disclosed in this document may not infringe on
privately owned rights; or
c. Assume any liabilities with respect to the adoption, applicability or use of any information,
apparatus, methods, or process disclosed in this document or inferred therefrom;
d. Assume any liabilities for damages resulting from the adoption, applicability or use of any
information, apparatus, methods, or process disclosed in this document, or inferred therefrom.
This document does not reflect necessarily the views and policies of those involved in the
preparation or production of this publication. The use of or reference to, specific brand names or
products should not be construed as an endorsement by any of those involved in the preparation or
production of this publication.
Notice of Request for Duplication:
This document is provided for use by teachers and environmental educators in Alabama by Legacy,
Inc. Duplication of materials contained herein is prohibited without prior, expressed written
permission from Legacy. Permission for duplication and/or information related to the this
publication or information about obtaining a copy of “Learning Through Legacy: An Environmental
Education Guide” may be obtained by contacting:
Legacy, Inc., Partners in Environmental Education
P.O. Box 3813
Montgomery, AL 36109
Phone: 334-270-5921 or 800-240-5115 (In Alabama)
FAX: 334-270-5527
E-mail: [email protected]
Website: www.legacyenved.org
*** “Learning Through Legacy: An Environmental Education Guide” are available for the following
grade levels: K-2, 3-5, 6-8, and 9-12.
Legacy, Inc., is an equal opportunity employer. The programs of Legacy are available to all eligible
persons regardless of race, color, religion, sex, national origin, disability unrelated to program
performance, or age.
i

ii

iii
ACKNOWLEDGEMENTS (REVISED EDITION)
Project Staff
Legacy, Inc. Staff
Paige Moreland, Executive Director
Toni Bruner, Programs Coordinator
Stacey Little, Marketing Manager
and
Brenda Litchfield, Original Educational Concepts
Clint Orr, Original Graphic Designer
Chuck Higginbotham, Original Graphic Designer
Rick Van Eck, Original Layout and Design
A special acknowledgement to James Lowery for his content and technical data review for the
publication.
Thanks to all of the teachers and environmental professionals throughout Alabama that provided the
content and activities and technical review for the original publication published in 1993. (A
complete listing of individuals that participated is available from the Legacy office.)

iv
v
TABLE OF CONTENTS
Disclaimer ............................................................................................................................................................i
Acknowledgments ..............................................................................................................................................iii
Table Of Contents..................................................................................................................................................v
Correlations ........................................................................................................................................................vii
Chapter 1: Ecology
Introduction ..........................................................................................................................................................1
Recreational Fishing On An Artificial Reef ........................................................................................................3
Marvelous Manatee ..............................................................................................................................................7
Adaptations: Toothpicks In Hiding ....................................................................................................................11
Biome Bingo ......................................................................................................................................................15
Can You Dig Wetland Soil? ..............................................................................................................................19
Catchy Crustaceans! ..........................................................................................................................................25
Ecosystem Vocabulary Zipper Game ................................................................................................................35
Encapsulated Ecosystems ..................................................................................................................................39
Environmental Stewardship: Salt Marshes ........................................................................................................41
Environmental News Coverage ..........................................................................................................................43
Gotta Have Energy ............................................................................................................................................45
Hide And Seek ....................................................................................................................................................49
Mode Of Marine Life Mobile ............................................................................................................................51
Succession In A Clearcut Area ..........................................................................................................................55
Wasted Wetlands ................................................................................................................................................57
Chapter 2: Pollution Prevention
Introduction ........................................................................................................................................................59
Pumping Out Alabama ......................................................................................................................................61
Posters And People ............................................................................................................................................65
Aquatic Litter Puzzles ........................................................................................................................................67
Fun Lovers, Enviro-Lovers - What’s The Connection? ....................................................................................69
Effects Of Holding Tank Discharges ................................................................................................................73
Biodegradable Substances ..................................................................................................................................75
Breathing Air Pollution ......................................................................................................................................79
Who’s Dumping Chemicals On My Catfish? ....................................................................................................81
Cleaner Clothes - Cleaner Environment? ..........................................................................................................83
Cleaning An Oil Spill ........................................................................................................................................85
Decomposers/Water Pollution ............................................................................................................................87
Dilution To The Solution Of Pollution? ............................................................................................................91
Dry Land/Hot Land ............................................................................................................................................93
How Small Is Small? ..........................................................................................................................................97
Rivers Of Life...Or Death ................................................................................................................................101
Street Runoff ....................................................................................................................................................105
Thermal Pollution And Aquatic Ecosystems ..................................................................................................107
Vegetation Survey ............................................................................................................................................109
Chapter 3:Waste Management
Introduction ......................................................................................................................................................111
Effects Of Biodegradable Waste On Dissolved Oxygen ..................................................................................113
Glass Making (Recycling) ................................................................................................................................117
Hide & Seek: Hazardous Waste On The Move ................................................................................................121
Ins and Outs Of A Worm’s Life ......................................................................................................................125
Is It A Waste? What’s The Appeal? ..................................................................................................................131
Life Cycle Of A Taco ......................................................................................................................................133
Paper Recycling And By-Products ..................................................................................................................137
Plastics, Everywhere ........................................................................................................................................147
Precycling ........................................................................................................................................................149
Talking Trash: Biodegradable Landfills? ........................................................................................................151
Tin Can Incinerator ..........................................................................................................................................155
Demonstrating Hazardous Waste ....................................................................................................................159
Chapter 4: Natural Resources
Introduction ......................................................................................................................................................163
Wonder Water Jeopardy ....................................................................................................................................165
Alabama’s Water Environment ........................................................................................................................169
Endangered Animals Newspaper ....................................................................................................................171
Insulating Your Home ......................................................................................................................................173
Native Or Exotic? ............................................................................................................................................175
Nurture A Habitat ............................................................................................................................................177
Of Words And Woodpeckers ............................................................................................................................179
Savings Sleuth ..................................................................................................................................................183
Settling Down To Clean Drinking Water ........................................................................................................185
Tour The Trees ................................................................................................................................................187
What’s Growing Under My Feet? ....................................................................................................................193
What’s A Tree Worth? ......................................................................................................................................195
Why Do We Need Petroleum? ........................................................................................................................199
Glossary ..........................................................................................................................................................205
Resources
Internet Resources ............................................................................................................................................213
Directories ........................................................................................................................................................217
Discovering Alabama Program Guide ............................................................................................................241
vi
ACTIVITY PAGE # SCIENTIFIC SKILLS BY GRADE
vii
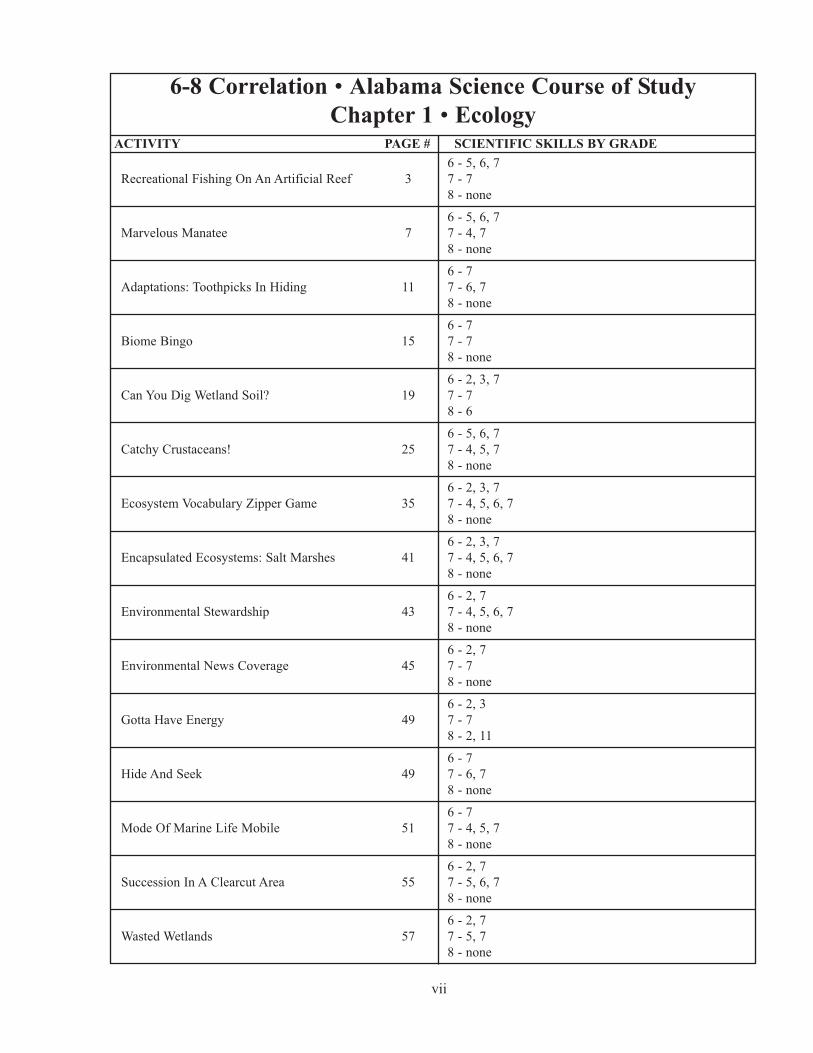
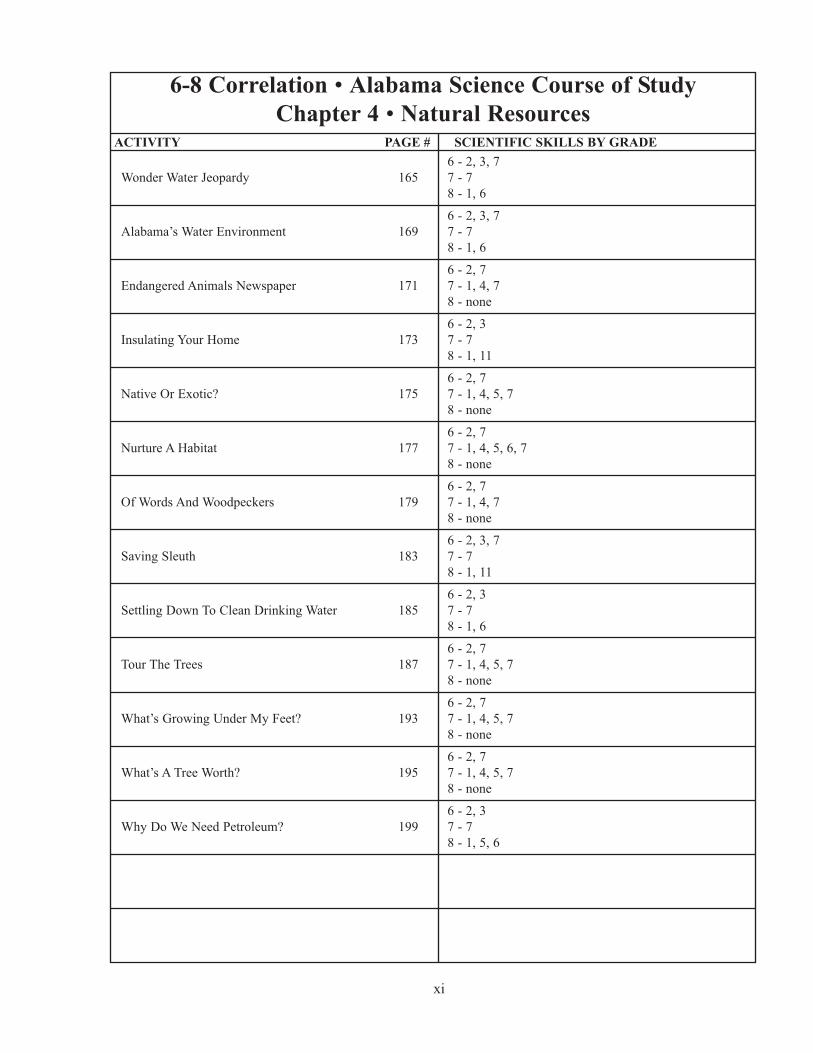
6-8 Correlation • Alabama Science Course of Study
Chapter 1 • Ecology
Recreational Fishing On An Artificial Reef 3
6 - 5, 6, 7
7 - 7
8 - none
Marvelous Manatee 7
6 - 5, 6, 7
7 - 4, 7
8 - none
Adaptations: Toothpicks In Hiding 11
6 - 7
7 - 6, 7
8 - none
Biome Bingo 15
6 - 7
7 - 7
8 - none
Can You Dig Wetland Soil? 19
6 - 2, 3, 7
7 - 7
8 - 6
Catchy Crustaceans! 25
6 - 5, 6, 7
7 - 4, 5, 7
8 - none
Ecosystem Vocabulary Zipper Game 35
6 - 2, 3, 7
7 - 4, 5, 6, 7
8 - none
Encapsulated Ecosystems: Salt Marshes 41
6 - 2, 3, 7
7 - 4, 5, 6, 7
8 - none
Environmental Stewardship 43
6 - 2, 7
7 - 4, 5, 6, 7
8 - none
Environmental News Coverage 45
6 - 2, 7
7 - 7
8 - none
Gotta Have Energy 49
6 - 2, 3
7 - 7
8 - 2, 11
Hide And Seek 49
6 - 7
7 - 6, 7
8 - none
Mode Of Marine Life Mobile 51
6 - 7
7 - 4, 5, 7
8 - none
Succession In A Clearcut Area 55
6 - 2, 7
7 - 5, 6, 7
8 - none
Wasted Wetlands 57
6 - 2, 7
7 - 5, 7
8 - none
viii
ACTIVITY PAGE # SCIENTIFIC SKILLS BY GRADE
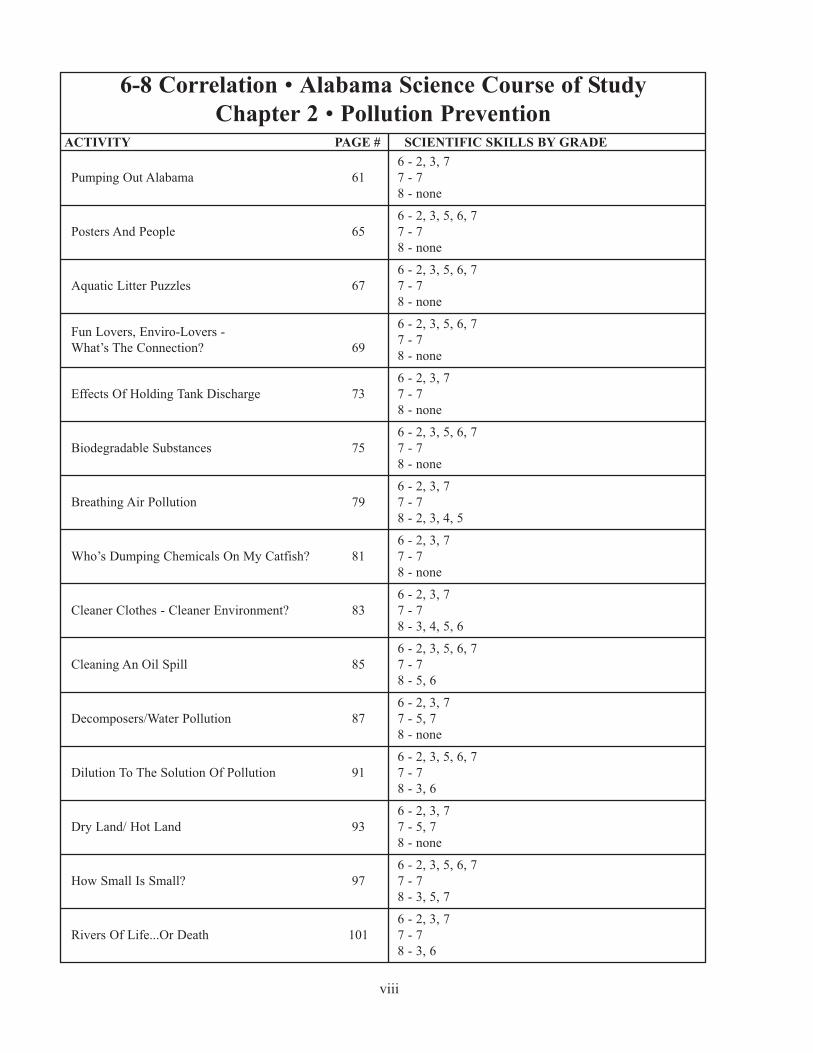
6-8 Correlation • Alabama Science Course of Study
Chapter 2 • Pollution Prevention
Pumping Out Alabama 61
6 - 2, 3, 7
7 - 7
8 - none
Posters And People 65
6 - 2, 3, 5, 6, 7
7 - 7
8 - none
Aquatic Litter Puzzles 67
6 - 2, 3, 5, 6, 7
7 - 7
8 - none
Fun Lovers, Enviro-Lovers -
What’s The Connection? 69
6 - 2, 3, 5, 6, 7
7 - 7
8 - none
Effects Of Holding Tank Discharge 73
6 - 2, 3, 7
7 - 7
8 - none
Biodegradable Substances 75
6 - 2, 3, 5, 6, 7
7 - 7
8 - none
Breathing Air Pollution 79
6 - 2, 3, 7
7 - 7
8 - 2, 3, 4, 5
Who’s Dumping Chemicals On My Catfish? 81
6 - 2, 3, 7
7 - 7
8 - none
Cleaner Clothes - Cleaner Environment? 83
6 - 2, 3, 7
7 - 7
8 - 3, 4, 5, 6
Cleaning An Oil Spill 85
6 - 2, 3, 5, 6, 7
7 - 7
8 - 5, 6
Decomposers/Water Pollution 87
6 - 2, 3, 7
7 - 5, 7
8 - none
Dilution To The Solution Of Pollution 91
6 - 2, 3, 5, 6, 7
7 - 7
8 - 3, 6
Dry Land/ Hot Land 93
6 - 2, 3, 7
7 - 5, 7
8 - none
How Small Is Small? 97
6 - 2, 3, 5, 6, 7
7 - 7
8 - 3, 5, 7
Rivers Of Life...Or Death 101
6 - 2, 3, 7
7 - 7
8 - 3, 6
ix
ACTIVITY PAGE # SCIENTIFIC SKILLS BY GRADE
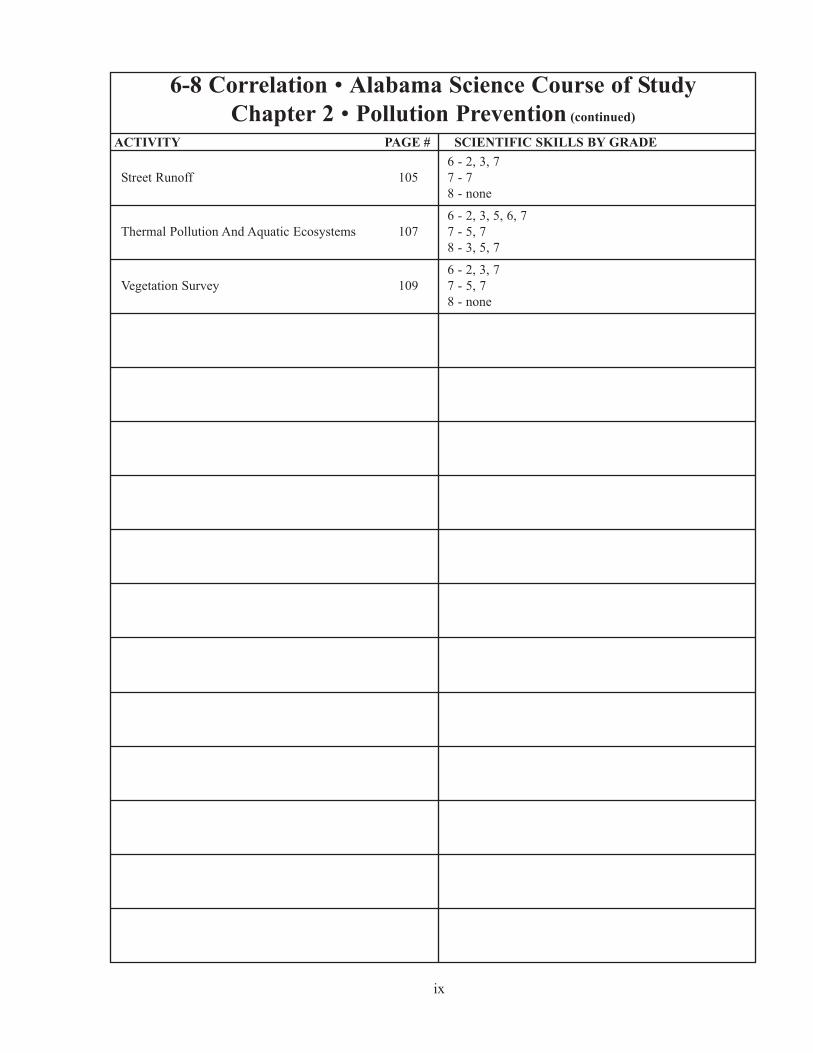
6-8 Correlation • Alabama Science Course of Study
Chapter 2 • Pollution Prevention (continued)
Street Runoff 105
6 - 2, 3, 7
7 - 7
8 - none
Thermal Pollution And Aquatic Ecosystems 107
6 - 2, 3, 5, 6, 7
7 - 5, 7
8 - 3, 5, 7
Vegetation Survey 109
6 - 2, 3, 7
7 - 5, 7
8 - none
x
ACTIVITY PAGE # SCIENTIFIC SKILLS BY GRADE
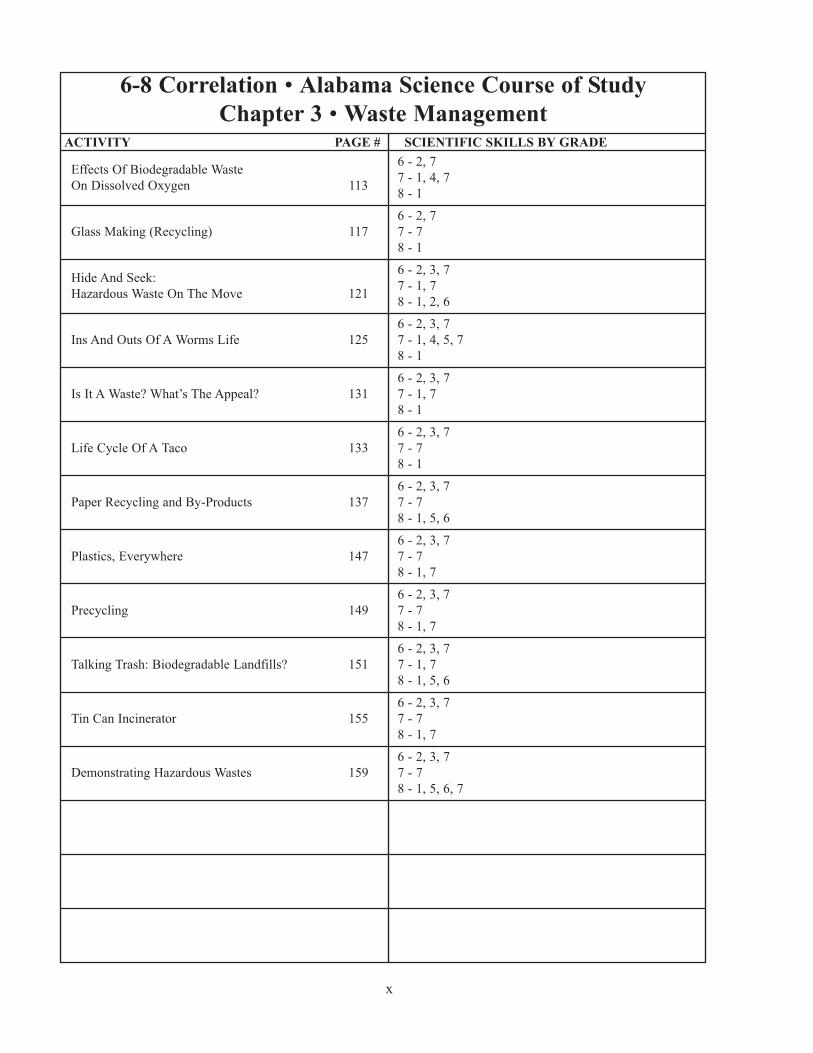
6-8 Correlation • Alabama Science Course of Study
Chapter 3 • Waste Management
Effects Of Biodegradable Waste
On Dissolved Oxygen 113
6 - 2, 7
7 - 1, 4, 7
8 - 1
Glass Making (Recycling) 117
6 - 2, 7
7 - 7
8 - 1
Hide And Seek:
Hazardous Waste On The Move 121
6 - 2, 3, 7
7 - 1, 7
8 - 1, 2, 6
Ins And Outs Of A Worms Life 125
6 - 2, 3, 7
7 - 1, 4, 5, 7
8 - 1
Is It A Waste? What’s The Appeal? 131
6 - 2, 3, 7
7 - 1, 7
8 - 1
Life Cycle Of A Taco 133
6 - 2, 3, 7
7 - 7
8 - 1
Paper Recycling and By-Products 137
6 - 2, 3, 7
7 - 7
8 - 1, 5, 6
Plastics, Everywhere 147
6 - 2, 3, 7
7 - 7
8 - 1, 7
Precycling 149
6 - 2, 3, 7
7 - 7
8 - 1, 7
Talking Trash: Biodegradable Landfills? 151
6 - 2, 3, 7
7 - 1, 7
8 - 1, 5, 6
Tin Can Incinerator 155
6 - 2, 3, 7
7 - 7
8 - 1, 7
Demonstrating Hazardous Wastes 159
6 - 2, 3, 7
7 - 7
8 - 1, 5, 6, 7
xi
ACTIVITY PAGE # SCIENTIFIC SKILLS BY GRADE
6-8 Correlation • Alabama Science Course of Study
Chapter 4 • Natural Resources
Wonder Water Jeopardy 165
6 - 2, 3, 7
7 - 7
8 - 1, 6
Alabama’s Water Environment 169
6 - 2, 3, 7
7 - 7
8 - 1, 6
Endangered Animals Newspaper 171
6 - 2, 7
7 - 1, 4, 7
8 - none
Insulating Your Home 173
6 - 2, 3
7 - 7
8 - 1, 11
Native Or Exotic? 175
6 - 2, 7
7 - 1, 4, 5, 7
8 - none
Nurture A Habitat 177
6 - 2, 7
7 - 1, 4, 5, 6, 7
8 - none
Of Words And Woodpeckers 179
6 - 2, 7
7 - 1, 4, 7
8 - none
Saving Sleuth 183
6 - 2, 3, 7
7 - 7
8 - 1, 11
Settling Down To Clean Drinking Water 185
6 - 2, 3
7 - 7
8 - 1, 6
Tour The Trees 187
6 - 2, 7
7 - 1, 4, 5, 7
8 - none
What’s Growing Under My Feet? 193
6 - 2, 7
7 - 1, 4, 5, 7
8 - none
What’s A Tree Worth? 195
6 - 2, 7
7 - 1, 4, 5, 7
8 - none
Why Do We Need Petroleum? 199
6 - 2, 3
7 - 7
8 - 1, 5, 6
xii
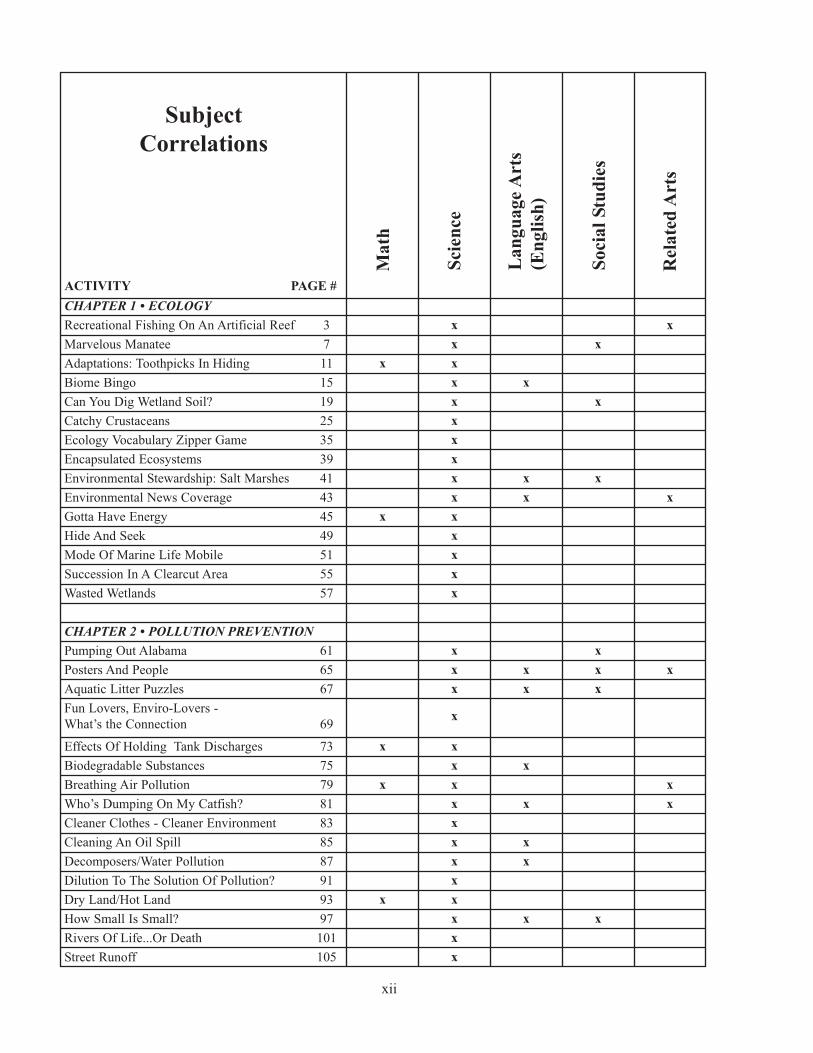
Subject
Correlations
CHAPTER 1 • ECOLOGY
Math
Recreational Fishing On An Artificial Reef 3 x x
Marvelous Manatee 7 x x
Adaptations: Toothpicks In Hiding 11 x x
Biome Bingo 15 x x
Can You Dig Wetland Soil? 19 x x
Catchy Crustaceans 25 x
Ecology Vocabulary Zipper Game 35 x
Encapsulated Ecosystems 39 x
Environmental Stewardship: Salt Marshes 41 x x x
Environmental News Coverage 43 x x x
Gotta Have Energy 45 x x
Hide And Seek 49 x
Mode Of Marine Life Mobile 51 x
Succession In A Clearcut Area 55 x
Wasted Wetlands 57 x
CHAPTER 2 • POLLUTION PREVENTIONPumping Out Alabama 61 x x
Posters And People 65 x x x x
Aquatic Litter Puzzles 67 x x x
Fun Lovers, Enviro-Lovers -
What’s the Connection 69x
Effects Of Holding Tank Discharges 73 x x
Biodegradable Substances 75 x x
Breathing Air Pollution 79 x x x
Who’s Dumping On My Catfish? 81 x x x
Cleaner Clothes - Cleaner Environment 83 x
Cleaning An Oil Spill 85 x x
Decomposers/Water Pollution 87 x x
Dilution To The Solution Of Pollution? 91 x
Dry Land/Hot Land 93 x x
How Small Is Small? 97 x x x
Rivers Of Life...Or Death 101 x
Street Runoff 105 x
Sci
ence
Lan
gu
age
Art
s
(En
gli
sh)
Soci
al
Stu
die
s
Rel
ate
d A
rts
ACTIVITY PAGE #
xiii
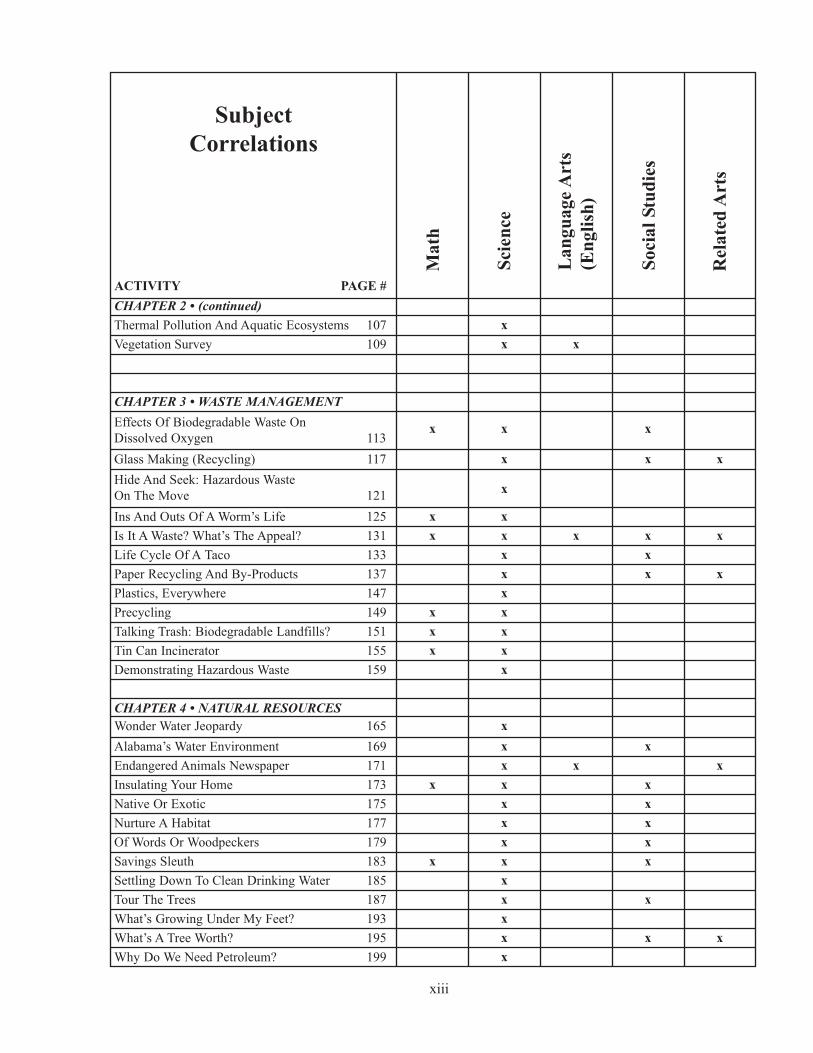
Subject
Correlations
CHAPTER 2 • (continued)
Math
Thermal Pollution And Aquatic Ecosystems 107 x
Vegetation Survey 109 x x
CHAPTER 3 • WASTE MANAGEMENTEffects Of Biodegradable Waste On
Dissolved Oxygen 113x x x
Wonder Water Jeopardy 165 x
Glass Making (Recycling) 117 x x x
Hide And Seek: Hazardous Waste
On The Move 121x
Ins And Outs Of A Worm’s Life 125 x x
Is It A Waste? What’s The Appeal? 131 x x x x x
Life Cycle Of A Taco 133 x x
Paper Recycling And By-Products 137 x x x
Plastics, Everywhere 147 x
Precycling 149 x x
Talking Trash: Biodegradable Landfills? 151 x x
Tin Can Incinerator 155 x x
Demonstrating Hazardous Waste 159 x
CHAPTER 4 • NATURAL RESOURCES
Alabama’s Water Environment 169 x x
Endangered Animals Newspaper 171 x x x
Insulating Your Home 173 x x x
Native Or Exotic 175 x x
Nurture A Habitat 177 x x
Of Words Or Woodpeckers 179 x x
Savings Sleuth 183 x x x
Settling Down To Clean Drinking Water 185 x
Tour The Trees 187 x x
What’s Growing Under My Feet? 193 x
What’s A Tree Worth? 195 x x x
Why Do We Need Petroleum? 199 x
Sci
ence
Lan
gu
age
Art
s
(En
gli
sh)
Soci
al
Stu
die
s
Rel
ate
d A
rts
ACTIVITY PAGE #

xiv
Notes
INTRODUCTION TO ECOLOGY
Ecology deals with the relationships living things have with each other and with their environments
(surroundings). Scientists who specialize in studying these relationships are called ecologists.
No living thing—plant or animal—lives alone. Every living thing depends in some way on certain other living
and nonliving things. Animals and plants that live in the same area, or community, depend on each other in some
way. For example, an elephant must have plants for food. If the plants in its environment were destroyed, the
elephant would have to move to another area that had plants, or it would starve to death. Plants depend on such
animals as the elephants for the nutrients (nourishing substances) they need to survive. Animal wastes and the
decaying bodies of dead animals and plants provide many of the nutrients that plants need.
The study of ecology increases people’s understanding of the world and all of its creatures. This is important
because humanity’s survival and well-being depend on relationships that exist on a worldwide basis. Change in
distant parts of the world—even outer space—affect us and our environments.
One goal of ecologists is to intelligently manage and control the living and nonliving things in the world. Many
ecologists study air and water pollution and how dirty air and water affect life. Ecologists try to foresee possible
environmental problems, such as crop losses or losses in animal life that building a dam or straightening a river
channel may cause. They study such things as insect pests, including the beetle that carried the Dutch elm
disease from Europe to the United States where it killed millions of trees.
Ecologists are concerned about the rate at which people are using up such natural resources as coal, gas, and oil.
Along with many other scientists, they are searching for ways to use sunlight and atomic energy for fuel and
power. Ecologists also are concerned about the world’s increasing population and its decreasing food supply. For
example, along with marine biologists, they are trying to find new ways of producing food from the sea.
Ecologists use knowledge from many different fields of study including physics, chemistry, mathematics, and
computer science. They also rely on other sciences, such as climatology, meteorology, geology, and
oceanography, to learn about air, land, and water environments.
Adapted from World Book Encyclopedia
1

2
3
OBJECTIVES:Students will be able to:
1. Compose captions to illustrate a fishing trip to an artificial reef.
2. Categorize the types of organisms that inhabit an artificial reef.
3. Describe the impact of recreational fishing on the habitats of an
artificial reef.
BACKGROUND:In the 1930s, the first successful oil wells were constructed in the
Gulf of Mexico. Over the years, hundreds of other platforms have
been constructed or have been dropped into the Gulf. Oil well
platforms, natural gas platforms, old tires, automobiles, concrete
barges, ships, and prefab structures have been used as artificial
reefs. The placement of any permanent structure immediately
becomes home to a myriad assortment of organisms.
Microscopic bacteria reproduce quickly on any new substrate and
begin to colonize. Protists, algae, barnacles, and larger marine
invertebrates also begin to grow there. Fishes arrive to feed upon
the smaller members of the food chain, and recreational fishing is
immediately possible. Game fishes in the Gulf of Mexico are very
diverse because both tropical and temperate species are available. During the summer months, tropical fish
move closer to the shore, while temperate species occur close to the shore all year long. Some migrating fish
move to deeper water during winter months, while others migrate south. Artificial reefs provide food and shelter
for many fish throughout the year.
VOCABULARY:artificial reef, habitat, substrate, game fish, invertebrates, colonization, migrate, bacteria, food chain, tropical,
temperate, barnacles, protists
ADVANCE PREPARATION:1. Prepare copies of the descriptions and activity pages for each student.
2. Collect photographs, posters, videos, and/or drawings of artificial reefs.
PROCEDURE:Setting the Stage1. Have students observe the collected pictures of artificial reefs and discuss what types of organisms can be
found inhabiting a reef.
2. Make a list of the types of organisms shown on the reefs.
3. Survey students to determine if any have experience with artificial reef fishing.
Activity1. Hand out student copies of the activity sheets and illustrate on the board or on an overhead projector the type
of sketch expected (or have a student sketch an example). The sketches should reflect each item in the
“Recreational Fishing on as Artificial Reef” description sheet.
2. Allow students to sketch their illustrations and write their captions. The sketches can be colored. Students
should write a title for the worksheet.
ECOLOGYRecreational Fishing On An Artificial Reef
Grade:6-8
Subjects:Science, Ecology, Art
Time Needed:90 minutes
Materials:description and sketch activity sheets
for each student
photographs, drawings, videos, and
posters of artificial reefs
large paper or blackboard for displaying
information
crayons or markers
www.legacyenved.org
3. Have students display the completed drawings for the class.
4. Use the completed drawings to make a list of all the types of organisms displayed in the drawings.
5. Discuss how recreational fishing impacts the organisms on an artificial reef, and write the list on the board
or poster paper for extended viewing and discussion.
6. Have each student complete the final item (number 6) in which Ryan has to make a decision about the illegal
fish. Discuss immediate and long-term consequences of each decision.
Follow-Up1. Research the penalties for possession of illegal fish caught in the Gulf of Mexico.
2. Collect newspaper and magazine articles about illegal fishing and its impact on fish populations.
EXTENSIONS:1. Have each student create another captioned and illustrated story or cartoon about fishing.
2. Have a commercial fisherman or shrimper speak to the class about size and quantity restrictions, penalties
for illegal catches, and the benefits of artificial reefs.
ORIGINAL DEVELOPMENT RESOURCES:Irby, B. N., McEwen, M., Brown, S., and Meek, E. M. (1984). Marine and estuarine ecology. Jackson, MS:
University Press of Mississippi.
Fotheringham, N. & Brunenmeister, S. (1989). Beachcombers guide to gulf coast marine life. Houston, TX:
Gulf Publishing Company.
www.dcnr.state.al.us: includes alabama Marine Resources Division and information on artificial reefs
www.reefball.org
Johnson, S. A. (1984). Coral reefs. Lerner Publications Company.
ADDITIONAL RESOURCES:Cerullo, M.M. (1996). Coral Reef: A City That Never Sleeps. Cobblehill Books.
4
Recreational Fishing on an Artificial ReefDescription Sheet
Directions: Read each description below. In the corresponding block on the activity sheet, sketch a
picture of what is happening in the description. Write a caption for each drawing.
1. Ryan and his family finished their lunch just as they reached their favorite fishing spot. The
artificial reef, located six miles out in the Gulf of Mexico, was created from old automobiles.
2. Anxious to begin fishing, Ryan dropped his fishing line overboard while his dad slowly
maneuvered the boat into position over the reef.
3. The hook and line drifted through a school of small minnows, barely missed a cluster of giant
barnacles, and finally settled beside a sponge shaped like a puffball.
4. As the hook and line moved with the current, Ryan watched a school of bonita swim by, while a
bright pink Portuguese man-of-war drifted with the current.
5. A yellowtail snapper feeding on the bottom spotted the baited hook and immediately swallowed
it, only to be reeled quickly to the surface.
6. Ryan pulled the snapper onto the boat and measured it for legal length. The fish was two inches
short of the legal length so Ryan decided to __________________.
5
Student Activity Sheet
Title:______________________________ Student’s Name:__________________________
Recreational Fishing on an Artificial Reef
6
1. 2.
3. 4.
5. 6.
OBJECTIVES: Students will be able to:
1. Make a bulletin board that depicts how boating can hurt
manatees and how awareness of this problem can protect
them.
2. Adopt a manatee.
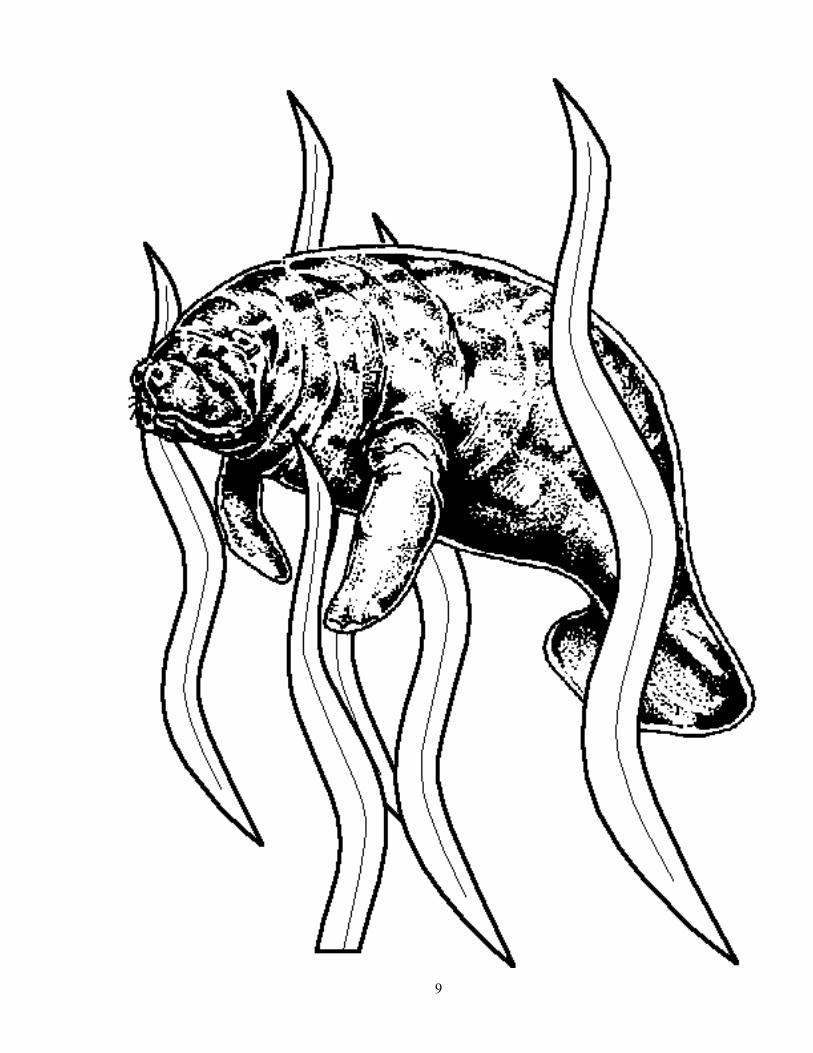
BACKGROUND:Manatees are large aquatic mammals with whom we share our
environment. They have seal-like bodies, have thick and stiff
whiskers on their upper lip, and can hear well even though there
are no external ear lobes. They can differentiate colors although
their depth perception is somewhat limited. These amazing
mammals even make sounds by squeaking or squealing when
frightened, playing, or communicating. These sounds are most
prominent between mother and baby. Reproduction is slow. Only
one calf is born every 2-5 years. This contributes a lot to their
becoming endangered. This playful “water-elephant” is non-
aggressive and completely harmless.
Sadly, humans are the manatee’s worst enemy. We are responsible
for their well-being. Recreational boating accidents pose the greatest threat. Discarding monofilament line,
hooks, or other litter into the water may cause the manatee to become injured or even die. Education is vital to
the survival of the manatee. There are about 5,000 remaining in the southeastern United States as of 2011,
concentrated in Florida year-round. During the warm summer months, a few manatees make their way into the
estuaries in Alabama along the Gulf of Mexico, but eventually they find their way back home in the cold
winter months. Debris in waterways, such as discarded fishing line and hooks, plastic 6-pack rings, and plastic
bags, are dangerous to manatees. Entanglement in, or digestion, of these items have caused many injuries and
deaths. Why not adopt a manatee? If you are interested, call 1-800-432-JOIN.
VOCABULARY: manatee, recreational boating, monofilament line, entangle
ADVANCE PREPARATION:1. Gather materials needed for the bulletin board. (This may be an assignment for students.)
2. Obtain a video or slides (if available) about manatees and their environment.
3. Collect information about adopting manatees.
4. Get permission to use several of the most visible bulletin boards located in your school.
PROCEDURE:Setting the Stage1. Show the video or slides (if obtained).
2. Use pictures of manatees in their natural environment if no video or slides are available.
3. Talk about the dangers of recreational boating to manatees.
Marvelous Manatee
Grades:6-8
Subjects: Science, Social Studies
Time Needed: Two 50-minute class periods
Materials: bulletin board materials (border,
pictures of manatees and their
environment, letters,
construction paper, scissors)
video or slides of manatees
references for student use
ECOLOGY
7 www.legacyenved.org
Activity1. Divide students into teams.
2. Have each team draw a design of a bulletin board illustrating manatees and their environment, dangers to
them, etc. Students should create the board.
3. Explain that each team member will have a specific responsibility in the development of the bulletin board.
This bulletin board will serve as an educational project to help other students and teachers understand how
the manatee lives and how it can be harmed by motor boats.
4. Teams of students will be responsible for giving an oral report on manatees as well as sharing their bulletin
board with the class.
Follow-Up1. Have students present their designs for the bulletin boards.
EXTENSIONS:1. Permission may be granted to put up a bulletin board in the public library or other similar public places.
2. Have students present their information at a PTO meeting when parents visit the classrooms.
ORIGINAL DEVELOPMENT RESOURCES:The society of plastics industries. (l990). Washington, DC: Center for Marine Conservation.
Marine pollution bulletin. (l987). Vol. 18, No. 6B, International Ocean Disposal Symposium.
www.plasticsindustry.org/outreach/school
www.savethemanatee.org
www.manateeworld.net
ADDITIONAL RESOURCES:www.manatees.net
8
9

Notes
10
OBJECTIVES: Students will be able to:
1. Explain how animals of one color may be better adapted for
survival in a particular habitat than animals of another color.
2. Explain the importance of camouflage in the survival of
animals in the wild.
BACKGROUND:What do a grasshopper, a snowshoe rabbit, and an army truck
have in common? They all use camouflage, the ability to blend
into their surroundings to hide from their enemies. The
grasshopper’s coloration allows it to hide among the grasses and
other plants; the snowshoe rabbit changes color from brown in
the summer to white in the winter to blend in with the snow; and
the army truck is painted with mottled greens and browns to
blend in with the trees and undergrowth of a forest.
Camouflage (protective coloration) is a type of adaptation, a
physical or behavioral characteristic that increases an organism’s
chances of survival in a particular habitat. By blending in with its surroundings, an animal can avoid being
discovered, can avoid being eaten by predators, or can sneak up on prey.
VOCABULARY:camouflage, adaptation
ADVANCE PREPARATION:1. Students should be divided into groups of 5 to 7 each. One member of the team should be assigned the job
of time keeper.
2. Chart information should be filled in with the names of the team members and the colors of the toothpicks
to be used.
3. Toothpicks may be bought already colored, or they may be dyed by soaking them in food coloring
overnight. Extra toothpicks should be provided in case some get lost. Each team will have 250 toothpicks,
50 of five different colors. (Instead of toothpicks, strips of colored plastic lacing found in craft stores may
be used.) This activity is more effective if one color closely matches the ground or grass color.
4. Mark the corners of a 10 meter by 10 meter grassy area with stakes. Do this for each team of students or
allow students to measure.
5. Mix the different colors of toothpicks together and randomly scatter them in the marked-off areas.
PROCEDURE:Setting the Stage1. In this activity, colored toothpicks are used to represent prey animals. Toothpicks are placed in the grass in
the marked-off area where they will be hunted by predators (students) in groups of 5-7 students.
Toothpicks are used to represent prey animals. Students will observe how animals of one color may be
better adapted for survival in a particular habitat than animals of another color. First, students will hunt for
the toothpicks of various colors in the grass and then will determine how the coloration affects the
toothpicks’ chances of being found.
Adaptations: Toothpicks In Hiding
Grades:6-8
Subjects: Science, Math
Time Needed: One hour
Materials:250 colored toothpicks for each team
(50 each of 5 different colors)
stopwatch or egg timer for each
timekeeper
4 stakes for each team’s grassy area
ECOLOGY
11 www.legacyenved.org
2. Each team should go to its staked area and should describe the terrain in the marked-off area. Note the
color and height of the grass and how much bare dirt shows through.
Activity1. Each team of students will be simulating a group of predators hunting for prey (the toothpicks) in the
grass. The time keeper of each team should signal the beginning of the hunt, and the rest of the team
members should start hunting. The goal of each hunter is to capture as many toothpicks as possible in a
one-minute time period. The time keeper should signal for the predators to stop hunting at the end of one
minute.
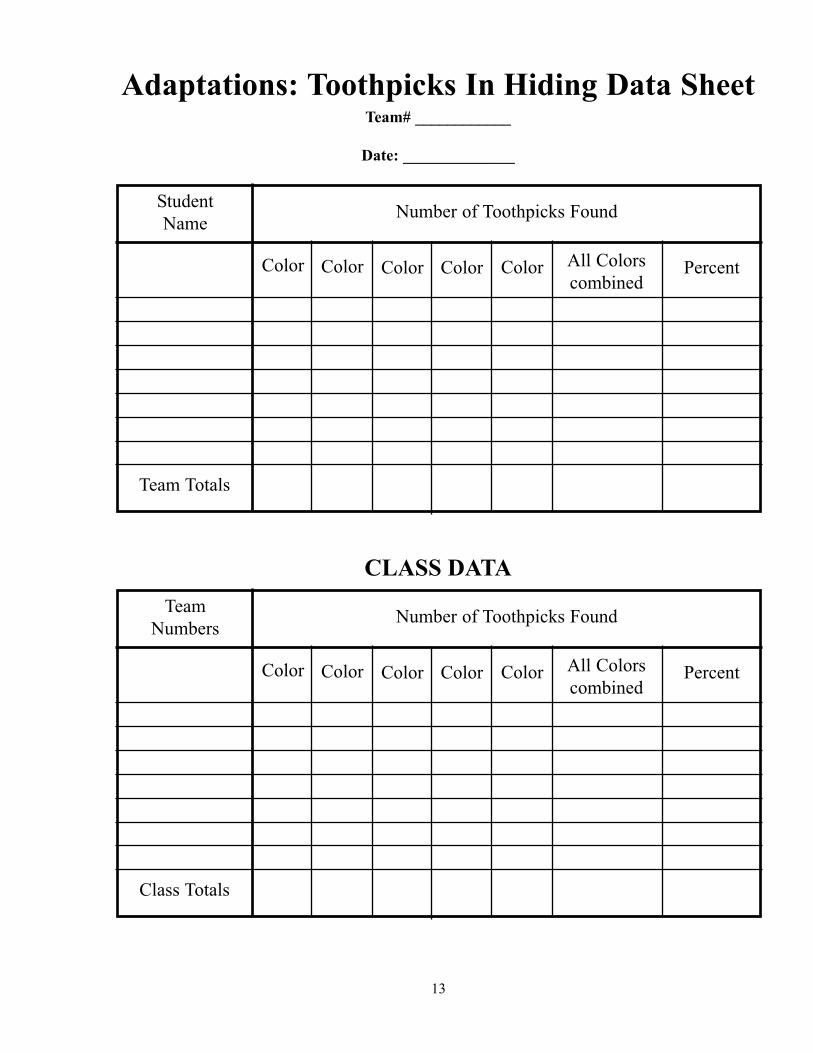
2. Each team should survey the catch by counting the number of toothpicks of each color captured by each
predator on the team. Next, the team should add up the total number of toothpicks captured by each team
member and should record all numbers on the chart.
3. Each team should determine the team total for each color and should record these numbers on the chart.
Calculate the percentages of each color recovered.
4. Compare the results of all teams. Make a class summary table on the board to compare the results of all
the different teams. Students can use the bottom portion of their data sheets to record the class data for
comparison.
EVALUATION:1. Have students answer the following questions:
• Was there much variation in the number of prey captured by the different predators? Why or why not?
• Based on experience, which color of toothpicks was best “adapted” (camouflaged) to its environment?
Which was the worst “adapted” (camouflaged)? Explain.
2. If the toothpicks were actually living organisms, predict how the population of each color of toothpicks
would change after being preyed upon for several generations.
3. Predict how the results of the experiment would differ if this activity were conducted in a different habitat
such as an asphalt parking lot. On a sandy beach. In a thick red carpet. Explain.
EXTENSION:1. Develop a new method of hunting for toothpicks in the same environment so that students will end up with
approximately equal numbers of the different colors. Explain this method.
2. In the real world, adaptations are not always as obvious as the different colors of toothpicks. Suppose that
butterflies were being studied in a area with butterfly-eating birds. Findings show that brightly colored
butterflies survive better than the dull-colored ones, even though the dull colored butterflies seem to blend
in better with the surroundings. What could account for these findings?
ORIGINAL DEVELOPMENT RESOURCES:Arms, K. (1996). Environmental science. Austin, TX: Holt, Rinehart, and Winston.
12
Adaptations: Toothpicks In Hiding Data SheetTeam# ____________
Date: ______________
13
Number of Toothpicks FoundStudent
Name
Color Color Color ColorColor PercentAll Colors
combined
Team Totals
Number of Toothpicks FoundTeam
Numbers
Color Color Color ColorColor PercentAll Colors
combined
Class Totals
CLASS DATA

Notes
14
OBJECTIVES:Students will be able to:
1. Identify characteristics of different biomes.
2. List factors that determine how a biome is named.
BACKGROUND:Biomes are areas that have distinctive climates, soils, and
organisms. The combination of climate, soils, and topography
determine the vegetation that will be supported in a given area.
These areas or biomes are often named for the dominant plants
that are found there.
Forest biomes include tropical and temperate rain forests,
temperate deciduous forests, and the boreal or taiga forests. The
tropical rain forest, which has the greatest biological diversity of
any biome, is characterized by a consistent warm, humid climate.
They are located in the tropical band nearer the equator.
Temperate rain forests have a humid, yet moderate climate.
Climatic characteristics of the temperate deciduous forests include
significant temperature changes from winter to summer months and a substantial amount of rainfall. Boreal
forests are coniferous; that is, they are composed of cone-bearing trees with needle leaves. As evergreens,
these trees drop their leaves throughout the year and are able to survive extremely cold temperatures. These
forests are located just south of the Arctic Circle and in lower latitudes at higher elevations. Forests change in
response not only to latitude but also to elevation. Therefore, a taiga forest may exist at the equator if the
elevation is sufficiently high.
Grasslands, deserts, and tundra are characterized as open areas with little precipitation. Grasslands generally
are found in the mid-latitudes in both northern and southern hemispheres. They support few, if any, trees and
are known as savannas and velds in Africa, steppes in Europe, prairies in North America, and pampas in South
America. Deserts may be hot or cold. These areas receive less than 25 cm or less than 10 inches of
precipitation annually. The tundra is a treeless biome with extremely cold temperatures and only a brief cool
summer that allows only the top few inches of soil to thaw. Lower soils remain permanently frozen.
VOCABULARY:biome, tropical rain forest, temperate rain forest, temperate deciduous forest, taiga, savanna, prairie, desert,
tundra, permafrost, equator, conifer, boreal, steppes, pampas, veld
ADVANCE PREPARATION:1. Discuss characteristics of different biomes. Be specific with temperature ranges and amounts of rainfall for
certain regions. Discuss different animals common to each biome.
2. Show pictures of animals and ask students to guess which biome they would occur in by the traits of the
animal. Examples would be giraffe: Africa, savanna, long neck, vegetation; white hare: taiga, protection.
3. Prepare blank Biome Bingo cards for each student.
4. Have students prepare small squares (notebook paper) to mark their cards.
Biome Bingo
Grades:6–8
Subjects:Science, Language Arts
Time Needed:50-minute class period
Materials:
copies of game boards
pieces for marking
supplement
ECOLOGY
15 www.legacyenved.org
PROCEDURE:Setting the Stage1. On the board, list at least seven characteristics of different biomes. Characteristics may include the
following: amount of rainfall (<10", >200", seasonal), average temperature (hot, cold, temperate, polar,
altitude-dependent), common animals, common vegetation, location (tropical, mid-latitude, high latitude,
polar).
2. After some discussion, have students come up with clues to be used in the Biome Bingo game.
3. Review rules of Biome Bingo (similar to Bingo).
Activity1. Each student should have a blank Biome Bingo card.
2. Across the top of their cards, have students choose a different biome for each column and write the biomes
at the top of the columns in random order. Have the students write in random order in the boxes under
each biome the plants, animals, temperatures, rainfall, and location for each biome listed at the top.
Students should fill in their own cards.
3. Draw a clue that the students wrote to begin the game. If, for example, the clue names a location, the
students should mark on their cards the biome most identified with this location. Some students may not
have chosen this biome and will not mark anything. Each student’s card should be different, so it may take
several clues for a student to have a Biome Bingo. Biome Bingo is five marked squares in a row, either
horizontally, vertically, or diagonally.
4. Continue the game until all the clues are read. Provide rewards for the winners.
EVALUATION:1. Review the biomes and their characteristics.
2. Require students to do a short essay on a biome. Have them include detailed information about vegetation
and wildlife common to that biome.
EXTENSIONS:1. After several games of Biome Bingo, have students exchange cards.
2. Visit an undisturbed habitat near the school and identify the vegetation there and its characteristics.
ORIGINAL DEVELOPMENT RESOURCES:Arms, K. (1996). Environmental science. Orlando, FL: Holt, Rinehart, and Winston.
16
17
B I
FREE
SPACE
OGN
Biome Bingo
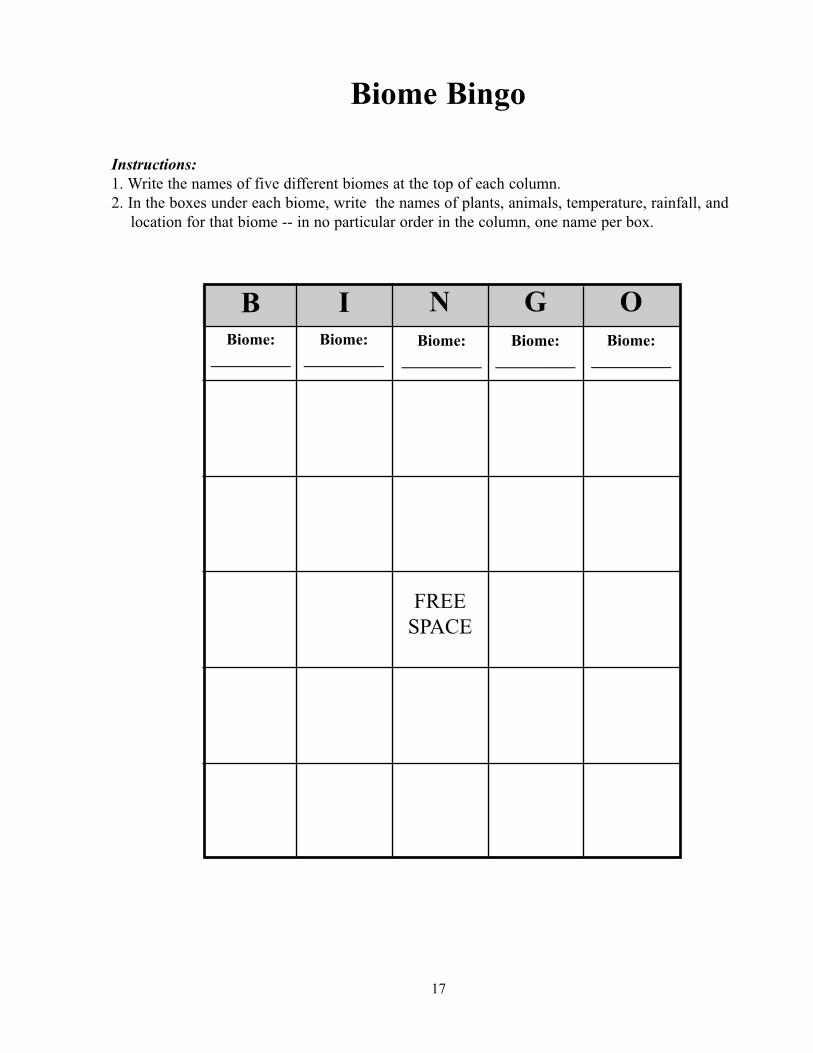
Instructions:1. Write the names of five different biomes at the top of each column.
2. In the boxes under each biome, write the names of plants, animals, temperature, rainfall, and
location for that biome -- in no particular order in the column, one name per box.
Biome:
__________
Biome:
__________
Biome:
__________
Biome:
__________
Biome:
__________

Notes
18
OBJECTIVES:Students will be able to:
1. Describe physical (especially color) differences between
wetland and upland soils.
2. Demonstrate the usage of keys to recognize wetland soils.
3. Explain why water affects both the biology and chemistry of
wetland soils.
BACKGROUND:Wetland soils, often called hydric soils, develop under low
oxygen or anaerobic conditions created by permanent or periodic
inundation or saturation. As water fills the air spaces between soil
particles, the rate at which oxygen can diffuse through the soil
decreases significantly. The lack of oxygen prevents plants and
soil microorganisms from carrying out normal aerobic respiration,
a process typical in most terrestrial plants. Anaerobic conditions
usually favor the growth of hydrophytic vegetation.
The shape of the landscape creates unique drainage conditions
that influence the formation and characteristics of soil. Soils can
be classified according to the rate at which they drain water.
Based on their composition, hydric soils are classified as either
organic or mineral soils. Organic wetland soils contain a large
amount of partially decayed plant and animal matter that creates a
thick black or dark brown layer at the soil surface.
Mineral wetland soils contain significantly less organic material and more sand, silt, and clay. Typically they
are lighter in color than organic soils. Mineral soils can be made from a variety of materials such as sand, silt,
clay, or loam (a mixture of sand, silt, and clay). Mineral wetland soils can be gleyed (pronounced glade) or
mottled. Gleyed soils are mostly gray but contain splotches of brown, orange, red, or yellow from being
alternately wet and drained. Mottles—orange, yellow, or reddish-brown splotches—appear in mineral soils
that are alternately wet and dry. For a number of reasons, not all hydric mineral soils will exhibit gleying and
mottling.
When a hole is dug to examine or study wetland soil, horizontal layers of different soils may be found. The
soil types will depend on the area. The makeup of the soil in an area may have been changed by human
activity such as tilling for agriculture or draining or filling for development. If one is searching for hydric soil
in a city, a housing community, or near farmland, one may have to dig deep to locate the soil, or the soil may
have been removed entirely during the building process.
Students should have a clear concept that soil type is one of three characteristics that distinguish wetlands
from non-wetland areas. Because wetlands are wet some or all of the year, the biological, chemical, and
physical character of the soil is altered; therefore, hydrology (flooding patterns) are a second indicator of
wetlands. Vegetation types (wetland plants) are the third indicator.
Can You Dig Wetland Soil?
Grades: 6-8
Subjects: Science, Ecology, Social Studies
Time Needed: Two-three class periods depending on
whether or not students take a field trip
to gather samples
Materials: shovel or trowel
buckets or roasting pans
soil samples (wetland)
soil samples (non-wetland)
soil color identification sheet
pictures of different types of soils
pictures of wetlands
crayons (96 pack required)
ECOLOGY
19 www.legacyenved.org
VOCABULARY:anaerobic, gleyed, hydric soil, mineral soil, organic soil, wetlands, hydrophytic
ADVANCE PREPARATION:1. Introduce the vocabulary terms.
2. Show the class magazine pictures, slides, and photographs of different wetland areas. (Search the Internet
for wetland-related sites.)
3. Show the class pictures, slides, and photographs of different soil types.
4. Have the students find an area in their neighborhood, town, or city that they suspect is a wetland area.
Have them collect (with permission - -see activity one below) a few soil samples and bring them to class.
Have the students describe in their own words how their soil samples look, feel, and smell.
5. Arrange a classroom display of the collected wetland soil samples. Have the students attempt to identify
the different types of soil. (See also activity section.)
6. Have the students prepare the Wetland Soils Color Chart as per the instruction sheet. Review the
instructions on the color sheet with students.
PROCEDURE:Setting the Stage1. Read the background information about wetland soil types.
2. Have the students brainstorm why wetlands have different soil types. List these reasons on the chalkboard.
Activity1. In this activity, the teacher needs to bring both wetland and upland soil samples to the classroom. If
possible, students may also be able to bring in soil samples; however, emphasize that they must get proper
approval before digging on private property. If the teacher is not familiar with wetland sites in the
community, he/she should contact the local conservation commission or planning board to assist in
locating wetlands. (This could also be a field trip activity.)
2. After a suitable location is found, dig a small pit or hole about two feet deep to find and study wetland
soils. Place soil samples from various levels in the hole in a bucket to bring back to the classroom. Do the
same thing in an adjacent upland area. Samples should be golf-ball size.
3. In the classroom, place the two soil types side by side. Ask the students to identify any differences or
similarities they see (color, smell, texture, roots, insects). Students should record the information on the
soil data sheet.
4. In the classroom, students should examine the soil, compare each sample to the Wetland Soils Color Chart,
determine the nearest match to the colors (or no match, if applicable), and create a list of their wetland and
non-wetland soils by wetter and dryer based on color differences.
EVALUATION:1. Have the students answer the following questions and record the answers on the chalkboard:
• What physical characteristics of the soil were observed?
• What evidence can you find in the sample that shows from where the soil was taken?
• What environmental conditions were observed that may have affected the condition of the soil?
• Did you find anything that was not natural in the soil? How do you think it got there?
• Compare wetland soil to soil observed at home and around school. How do the two differ or how are
they alike?
EXTENSIONS:1. Have the students perform a percolation test. Dig identical small soil pits in different locations sandy soils,
wetland soils, upland forest, school play grounds—and fill the pits with water. Time how long it takes
20
each pit to drain water.
2. Have the students participate in the Adopt-A-Wetland Program. Contact the regional office of the
Environmental Protection Agency for information, or search the Internet.
3. Identify certain students, or the entire class, as “wetland watchers” who keep an eye out for possible
impacts or encroachment on wetlands in the local community.
4. Have the students write articles about their wetland, the activities they have undertaken, and what they
have learned. Submit these to local or regional newspapers.
5. Have students conduct a survey to learn how their neighbors feel about wetlands and the need for
protecting them. They should report the results of their findings to the class.
6. Have the students create public information fact sheets about wetlands in general or about a specific
wetland they have studied. These information sheets may be distributed at a number of locations: city hall,
local library, supermarkets, or as part of an Earth Day celebration.
ORIGINAL DEVELOPMENT RESOURCES:Aquatic Project WILD. (1987). Western Regional Environmental Education Council.
Lynn, B. (1988). Discover wetlands: A curriculum guide. Washington State Department of Ecology.
Ranger Rick’s naturescope: Wading into wetlands. (1986). National Wildlife Federation, Washington,
D.C., Vol.2, No. 5.
Slatterly, B. (1991). WOW! The wonder of wetlands: An educator’s guide. St. Michaels, MD:
Environmental Concern, Inc.
www.epa.gov/owow/wetlands
http://aquat1.ifas.ufl.edu/
***Note: National Resource Conservation Service in each county can provide lists of sites of
hydric soils.
21
22
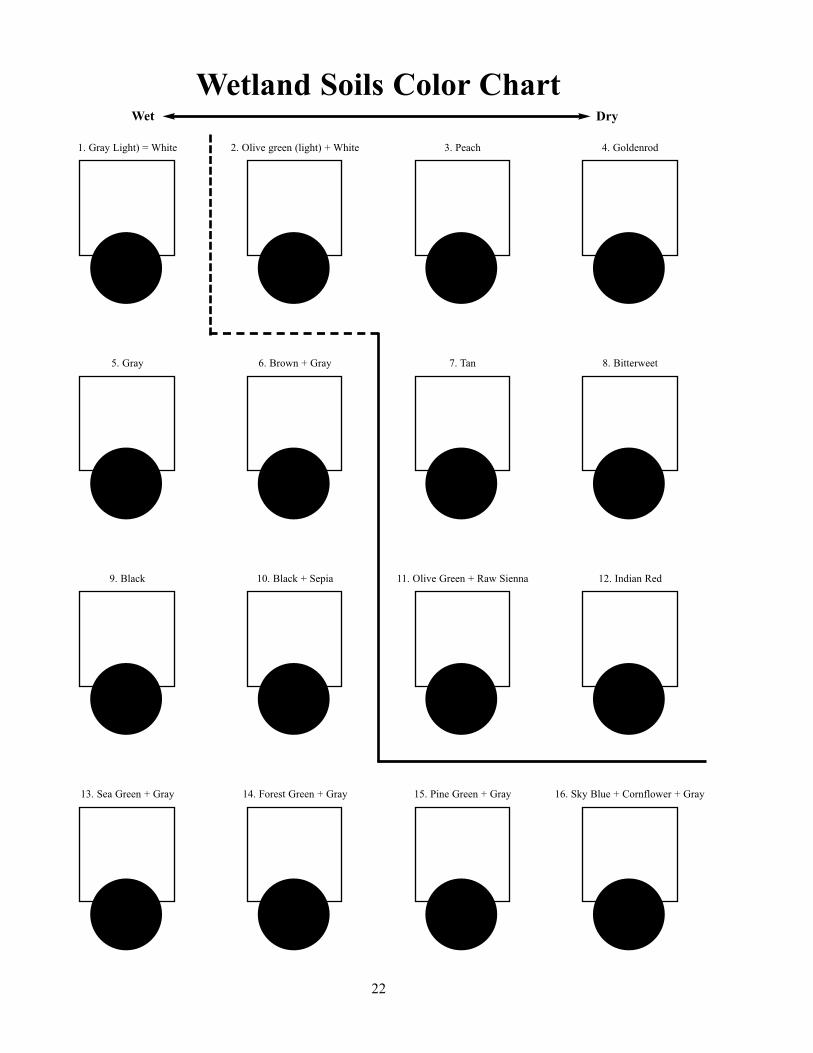
1. Gray Light) = White 2. Olive green (light) + White 3. Peach 4. Goldenrod
5. Gray 6. Brown + Gray 7. Tan 8. Bitterweet
9. Black 10. Black + Sepia 11. Olive Green + Raw Sienna 12. Indian Red
13. Sea Green + Gray 14. Forest Green + Gray 15. Pine Green + Gray 16. Sky Blue + Cornflower + Gray
Wetland Soils Color ChartWet Dry
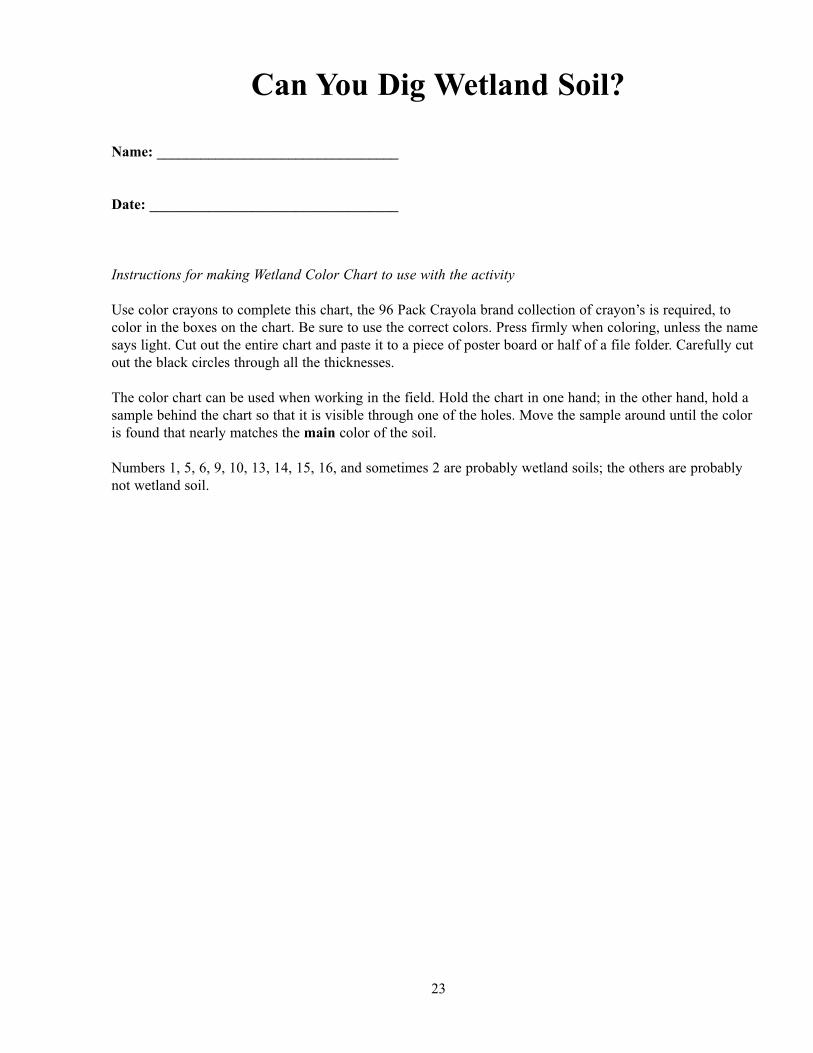
Can You Dig Wetland Soil?
Name: _________________________________
Date: __________________________________
Instructions for making Wetland Color Chart to use with the activity
Use color crayons to complete this chart, the 96 Pack Crayola brand collection of crayon’s is required, to
color in the boxes on the chart. Be sure to use the correct colors. Press firmly when coloring, unless the name
says light. Cut out the entire chart and paste it to a piece of poster board or half of a file folder. Carefully cut
out the black circles through all the thicknesses.
The color chart can be used when working in the field. Hold the chart in one hand; in the other hand, hold a
sample behind the chart so that it is visible through one of the holes. Move the sample around until the color
is found that nearly matches the main color of the soil.
Numbers 1, 5, 6, 9, 10, 13, 14, 15, 16, and sometimes 2 are probably wetland soils; the others are probably
not wetland soil.
23

Notes
24
OBJECTIVES: Students will be able to:
1. Explain the life cycle of a blue crab.
2. Identify larval forms of a blue crab.
3. Identify male and female blue crabs.
4. Locate and identify the appendages of the blue crab.
5. Explain the importance of blue crabs to coastal Alabama.
6. “Create” a crab.
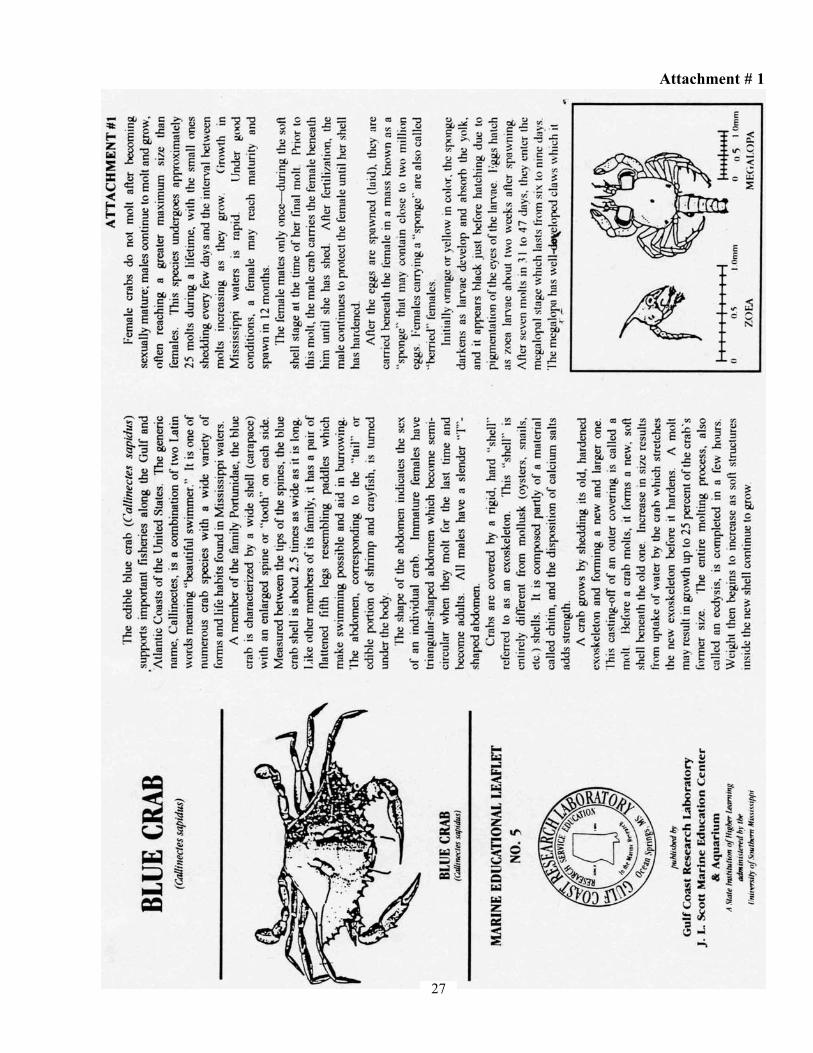
BACKGROUND: Callinectes sapidus (beautiful swimmer) is commonly known as
the edible blue crab and has been an Alabama delicacy for a long
time. Over 2,000,000 pounds are caught commercially every year
in the United States.
Crabbing is also a summer tradition for many Alabama families.
There are many ways to go “crabbing” along the shore. Many
children accidentally catch crabs with a rod and reel while
fishing. Dip nets are used to catch crabs along the shores of
beaches and marshes. Lift nets are used off piers and jetties, and
serious crabbers use crab traps to catch crabs.
The blue crab is a swimming crab. Its fifth pair of appendages is
flattened and acts as paddles. Like other arthropods, the blue crab
sheds its exoskeleton when molting so that it can grow. While it is waiting for its new shell to harden, it is
known as a “soft-shell crab.” After the female molts for the last time, she can mate with males. Spawning
occurs from March through November, and the female may store the sperm until the next spring. In Alabama,
female blue crabs spawn in the lower part of Mobile Bay where the water is saltier.
VOCABULARY:abdomen, arthropod, crustacean, dorsal, exoskeleton, jointed appendage, larva, megalopae, molt, plankton,
spawn, zoea, swimmeret, antennule, maxilliped, mandible, uropod, carapace, cheliped, maxillae,
ADVANCE PREPARATION:1. Make copies of the blue crab information handouts attachments and copies of the “What to Look For on
the Adult Blue Crab” (attachment 3).
2. Obtain prepared slides of crab larvae (zoea and megalopae); or, if you live near the coast, you may want to
use a plankton net and capture larval blue crabs.
3. Obtain fresh blue crabs from the local seafood house or grocery store. Make sure that you have male and
female crabs. Try to obtain at least one live specimen of each sex if you live near the coast.
4. Make copies of the “Crab Appendages” sheet, “Blue Crab Activity Sheet”, and “Create a Crab” sheet.
(Attachments 4, 5, and 6)
PROCEDURE:Setting the Stage1. Have the students observe a live blue crab, if available. Make sure they notice the appendages and
understand how those appendages help the crab swim and/or walk.
Catchy Crustaceans!
Grades:6-8
Subjects:Marine Science, Ecology, Biology
Time Needed:Two 55-minute class periods
Materials:compound light microscope
preserved or fresh blue crabs
prepared slides of crab zoea and
megalopae
dissecting scissors
dissecting pan
forceps
tape
visual showing life cycle of a blue crab
ECOLOGY
25 www.legacyenved.org
2. Review the characteristics of arthropods with the students.
3. Have the students read the information on the blue crab. (attachments 1 & 2)
4. Have the students discuss other similarities between the blue crab and other crustaceans in Alabama.
Activity1. Place the crab on the dorsal side across the width of a pan.
2. Observe the body form and appendages.
3. Remove the appendages from one side of the specimen. Hold the appendage with the forceps and cut at the
base with scissors to remove the entire structure.
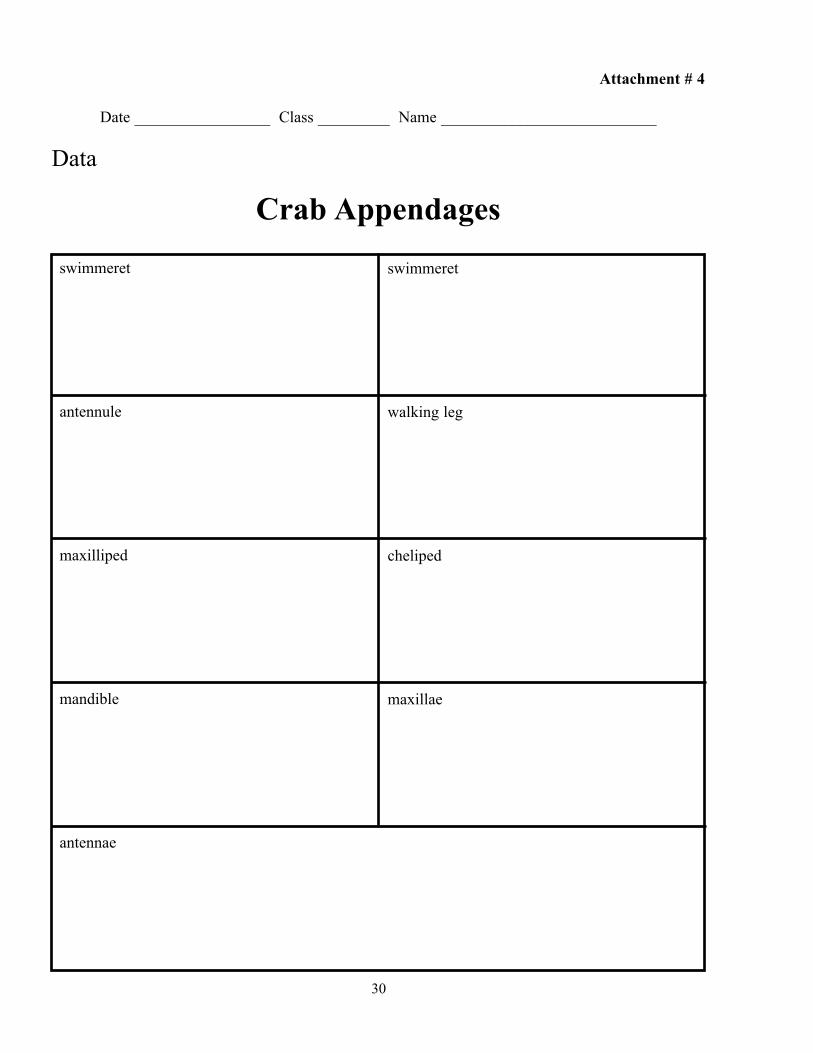
4. Tape each appendage into the appropriate box on the appendage sheet as soon as it is removed. This
worksheet is a generic crustacean appendage sheet; not all crustaceans will have every part.
5. Using the “What to Look For on the Adult Blue Crab” handout, identify the sex of the crab.
6. Using a microscope and the prepared crab zoea and megalopae slides, observe and draw the larval stages
of the blue crab.
7. Using the “Create a Crab” template (see attachment #6), identify the crab body parts and assemble as
directed.
EVALUATION:1. Have students complete the Blue Crab Activity Sheet (see attachment #5).
EXTENSIONS:1. Have students explain how water pollution affects the recreational and commercial value of blue crabs.
2. Have students discuss how crustaceans can be indicators of water quality.
3. Have a classroom crab boil (see attachment #7).
4. Go crabbing! This field trip would heighten the students’ awareness of some of Alabama’s invertebrate
resources.
5. Have students compare the blue crab to another crustacean found in Alabama coastal waters such as the
white or brown shrimp.
6. Have students invent their own original invertebrate by using the characteristics of invertebrates
(symmetry, locomotion, special structure, mouth parts, appendages).
7. Have the students create an art form that represents their invertebrate in its habitat.
8. Have the students name their invertebrates (common and scientific names).
9. Have the students write a short story describing a day in the life of their invertebrates.
ORIGINAL DEVELOPMENT RESOURCES:Auburn University, Marine Extension & Research Center, 4170 Commanders Drive, Mobile, AL 36615,
(334) 438-5690
Dauphin Island Sea Lab, P.O. Box 369, Dauphin Island, AL 36528, www.disl.org
Matthews, C. (1991). Marine biology and oceanography experiments and activities, Jacksonville,
FL: Water Press.
Tatum, W. M. (1986, May/June). Crab fishing for fun and food. Alabama Conservation.
www.vims.edu/adv/ed/crab/contents
www.blue-crab.org
www.encyclopedia.com
26
Attachment # 1
27
Attachment # 2
28
Attachment # 3
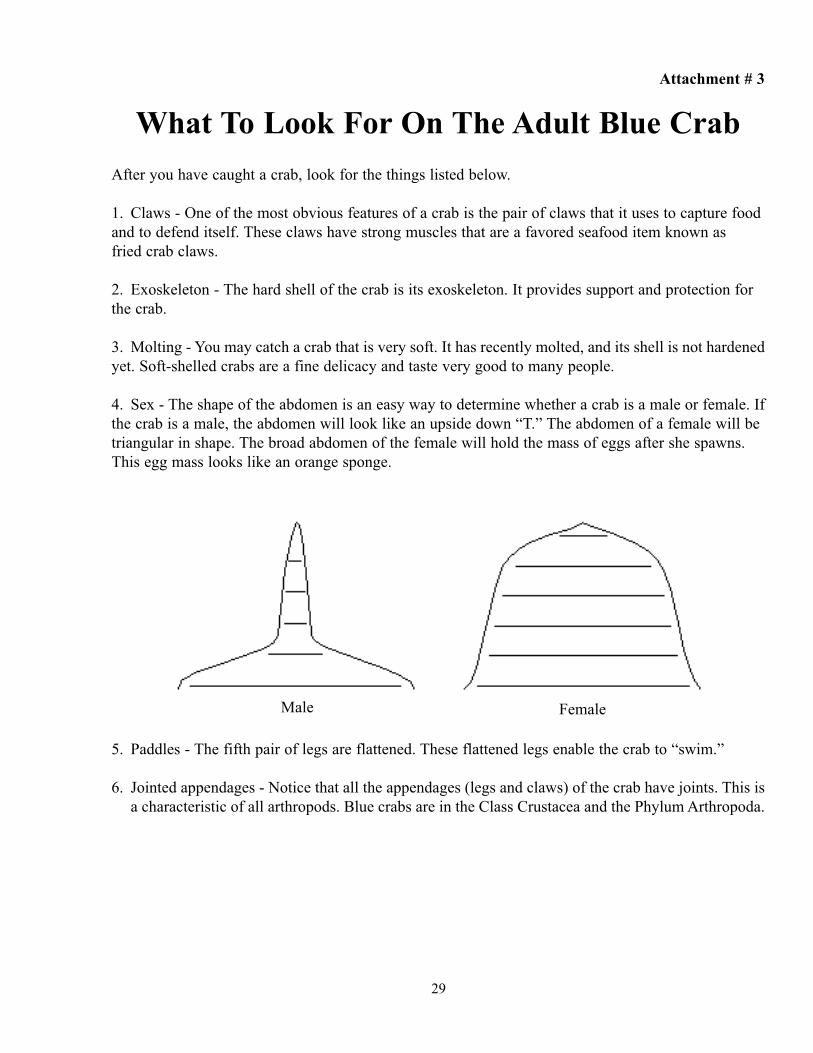
What To Look For On The Adult Blue Crab
After you have caught a crab, look for the things listed below.
1. Claws - One of the most obvious features of a crab is the pair of claws that it uses to capture food
and to defend itself. These claws have strong muscles that are a favored seafood item known as
fried crab claws.
2. Exoskeleton - The hard shell of the crab is its exoskeleton. It provides support and protection for
the crab.
3. Molting - You may catch a crab that is very soft. It has recently molted, and its shell is not hardened
yet. Soft-shelled crabs are a fine delicacy and taste very good to many people.
4. Sex - The shape of the abdomen is an easy way to determine whether a crab is a male or female. If
the crab is a male, the abdomen will look like an upside down “T.” The abdomen of a female will be
triangular in shape. The broad abdomen of the female will hold the mass of eggs after she spawns.
This egg mass looks like an orange sponge.
5. Paddles - The fifth pair of legs are flattened. These flattened legs enable the crab to “swim.”
6. Jointed appendages - Notice that all the appendages (legs and claws) of the crab have joints. This is
a characteristic of all arthropods. Blue crabs are in the Class Crustacea and the Phylum Arthropoda.
29
Male Female
Attachment # 4
Date _________________ Class _________ Name ___________________________
Data
Crab Appendages
30
swimmeret swimmeret
antennule walking leg
maxilliped cheliped
mandible maxillae
antennae
Attachment # 5
Name: ______________________________
Blue Crab Activity Sheet
1. What is the scientific name for the blue crab?
2. What does the scientific name mean?
3. What are some ways blue crabs are caught?
4. In what class is the blue crab?
5. In what family is the blue crab?
6. How can you tell a male blue crab from a female blue crab?
7. How many eggs can a female blue crab carry?
8. What is a “soft shell” crab?
9. What is the shell of a crab made of?
10. What is the minimum size limit for catching blue crabs in Alabama?
11.Why are blue crabs important in Alabama?
12.What would happen to the blue crab population if the coastal waters of Alabama were to become
contaminated with too much pollution?
13.Why are crab larvae considered plankton?
14.What is the name for the first larval stage of a blue crab?
15.What is the name for the second larval stage of a blue crab?
16. Draw the two larval stages of a blue crab.
31
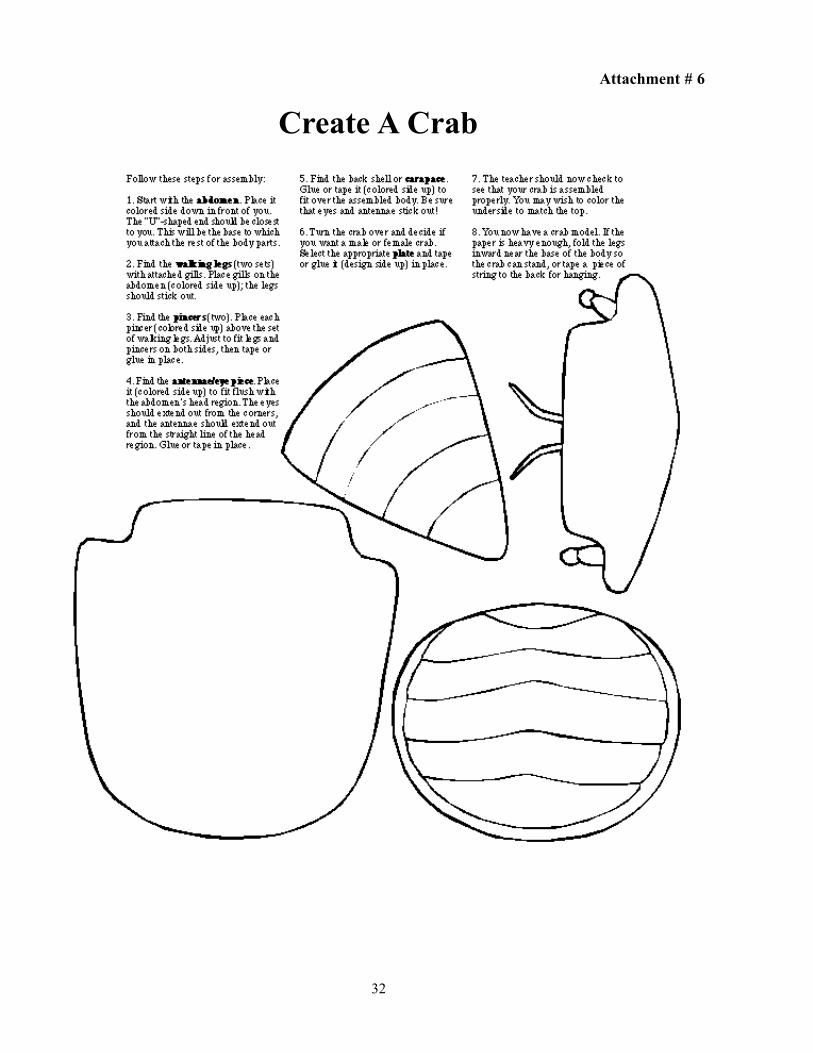
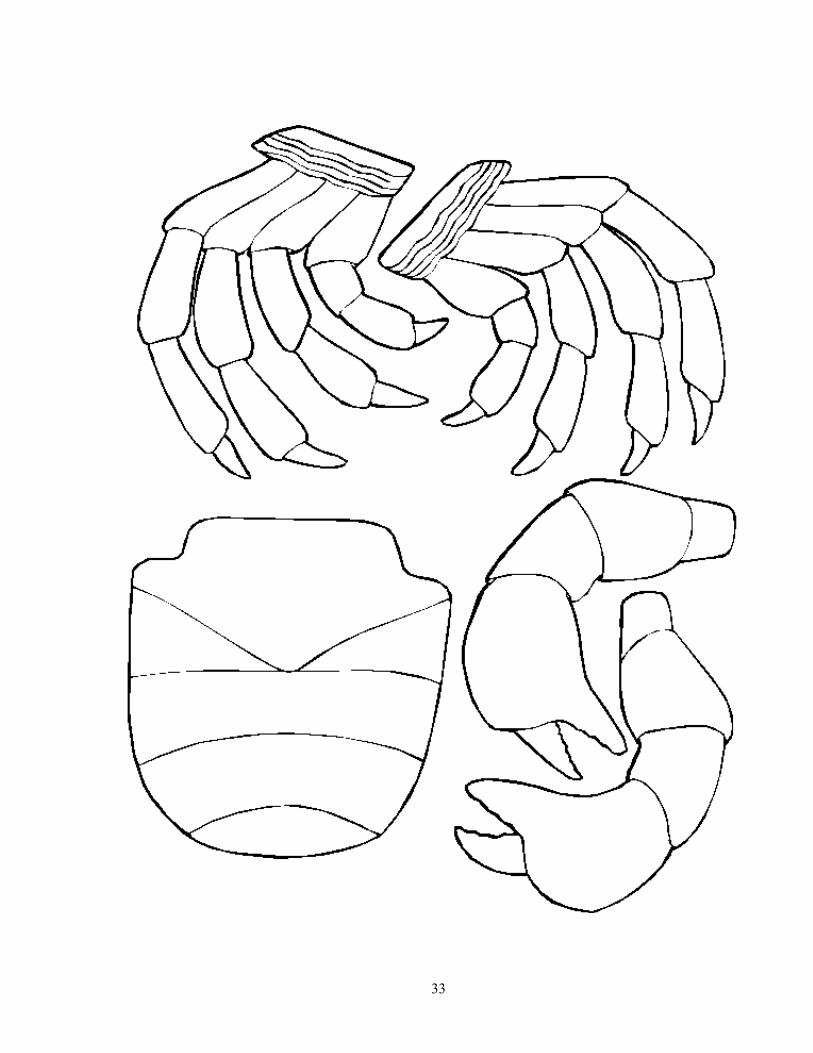
Attachment # 6
Create A Crab
32
33
Attachment # 7
Boiled Crab
3-4 quarts water
salt or seasoning
1 dozen crabs
large pot
Bring 3-4 quarts of water and a pinch of salt or seafood seasoning to a boil in a large pot. Drop a dozen live
crabs into the boiling water and cover. Reduce heat and simmer for 15 - 20 minutes. Drain and pick hot or
cold.
Break off crab claws and crack open to get the meat. Tear off the carapace and crack the crab body in two.
Remove all organs from the center of the body and the gills (sometimes called “Dead Man’s Fingers”). Pick
the crab meat from the sides of the shell.
Fried Soft Shell Crab
1/4 cup flour
salt and pepper
1 egg
3/4 cup fine bread crumbs or corn meal
6 soft-shell crabs
Crisco oil
Remove gills and other organs from the center of a newly molted blue crab. Rinse well. Mix flour with a little
salt and pepper and place in a bowl. In a second bowl, beat one egg well. In a third bowl, place the bread
crumbs (corn meal) mixed with salt and pepper.
Toss in one soft-shell crab at a time in the flour; dip into egg mixture; toss into bread crumbs to coat. Drop
into hot Crisco oil (360 degree F) and deep fry quickly until golden brown.
Serve alone, with breakfast, or on a sandwich. A true Alabama delicacy!
34
OBJECTIVES:Students will be able to:
1. Define vocabulary words related to ecosystems.
BACKGROUND: An ecosystem consists of groups of organisms interacting in
various ways with each other and with abiotic factors in the
environment. Organisms (biotic factors) in an ecosystem include
all members of the Monera, Protista, Fungi, Plantae, and
Animalia kingdoms. Abiotic factors include chemical and
physical characteristics of soil, water, and temperature. A specific
area, such as a grassland,, desert, tropical rain forest, coral reef,
or pond, can be called an ecosystem.
A group of organisms of the same species found within an
ecosystem is called a population, and populations of different
species interacting within the ecosystem make up a community.
Organisms within communities can be grouped into three major
categories: producers, consumers, and decomposers. Plants that
can make their own food are producers. Producers use light energy
from the sun to convert carbon dioxide and water into sugar, and they release oxygen as a by-product. This
chemical conversion is called photosynthesis and requires chlorophyll, a green pigment. These food producers
are called autotrophs.
A second category of organisms within an ecosystem is the consumers. Consumers cannot make their own
food and must depend on other food sources. they also are know as heterotrophs. Consumers are grouped into
primary consumers (herbivores), secondary consumers (carnivores), and omnivores (both herbivore and
carnivore). A carnivore that attacks, kills, and eats another animal (the prey) is called a predator. Botanical
carnicores, such as Venus Fly Traps, lure and trap their prey. Consumers that live in or on another organism
and cause it harm are called parasites. Often, parasites feed on the same organism for a long period of time,
typically injuring it.
The third group of organisms in an ecosystem is decomposers. Decomposers secrete enzymes that break
organic compounds into simpler compounds that can be absorbed for nourishment. Detritus feeders include
earthworms, millipedes, crayfish, ants, termites, and some beetles. These organisms often are grouped with
decomposers because they feed on dead and decaying plant and animal matter (detritus). Primary detritus
feeders (decomposers) feed directly on detritus, and secondary detritus feeders (protozoans, mites, insects,
worms) feed directly on the primary detritus feeders.
Consumers, producers, and decomposers create pathways of feeding relationships called food chains. Food
chains are interconnected to form food webs. The various feeding levels of consumers, producers, and
decomposers are called trophic levels. All the successive trophic levels form a food pyramid. The food
pyramid is a graphic representation of all the consumers (carnivores, herbivores, and omnivores) and
producers. The total combined mass of all carnivores is the third trophic level (the top of the pyramid); the
total combined mass of all herbivores is the second trophic level (the middle of the pyramid); the total
combined mass of all producers is the first trophic level (the bottom of the pyramid figure).
Ecosystem Vocabulary Zipper Game
Grades: 6-8
Subjects: Ecology,Environmental Science,
Biology I
Time Needed: 30 minutes
Materials: vocabulary list/definitions list
index cards
clock or timer
pictures illustrating ecosystem
vocabulary words
ECOLOGY
35 www.legacyenved.org
An ecosystem is a complex arrangement of biotic and abiotic factors that form interconnected relationships.
The environmental health of the ecosystem is dependent on each factor in the overall system. For an
ecosystem to maintain itself, a balance of all components is necessary.
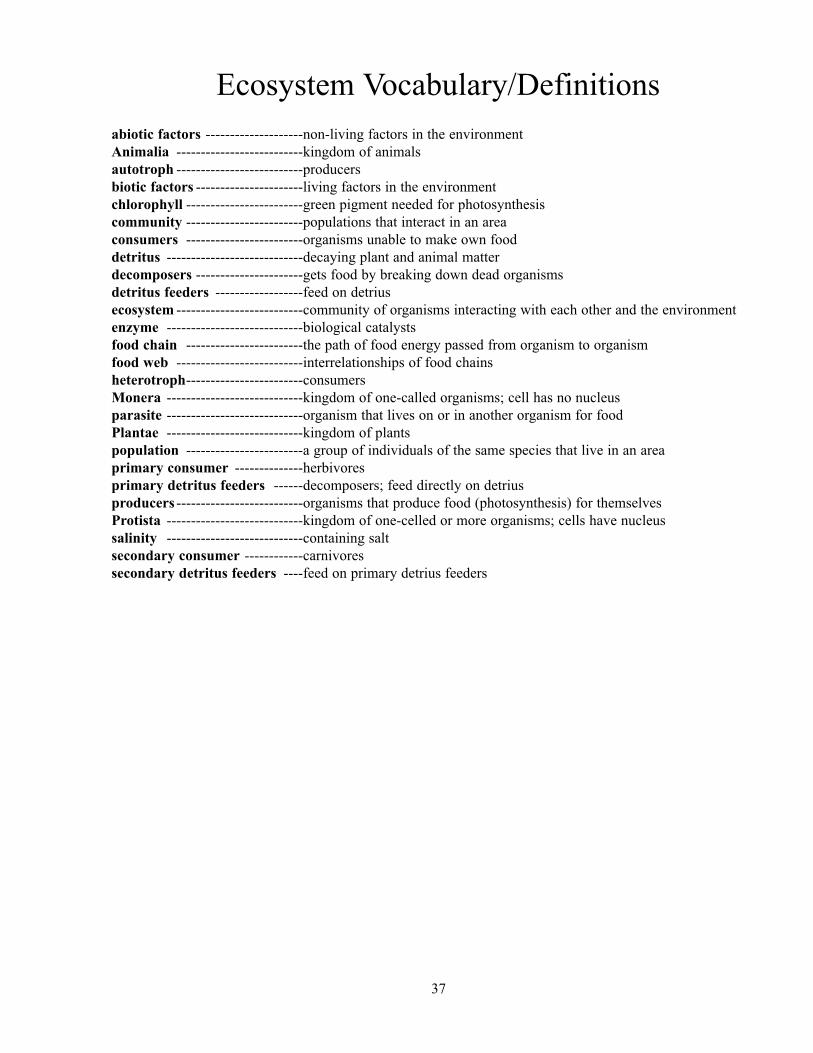
VOCABULARY: See game vocabulary list.
ADVANCE PREPARATION:1. Introduce the vocabulary terms listed on the Ecosystem Vocabulary/Definitions list.
2. Display magazine pictures or posters of different ecosystems.
3. Discuss the displayed pictures and have students relate the vocabulary terms to the objects shown in each
ecosystem picture.
4. Acquire blank index cards—two for each vocabulary word. Cards can be designated with different colors
or marked in some way to be separated easily into vocabulary words and vocabulary definitions.
5. Prepare a worksheet listing each word and its definition.
PROCEDURE:Setting the Stage1. Assign each student a vocabulary word and the definition for that word.
2. Have the students write the vocabulary word on one card and the definition on another card. Students
should become familiar with the word and definition on their cards.
Activity1. The teacher should collect and redistribute the vocabulary cards and definition cards so that each student
has one vocabulary word and one definition, but not the definition for that word.
2. Beginning the zipper: One student should read the vocabulary word from his/her card. The student who has
the definition for that word should then read the definition. If the definition is correct, that student should
read the vocabulary word from his/her other card. The student who has the definition for that word should
read the definition and then the next vocabulary word.
3. The game continues until everyone has responded by reading the definition to someone’s vocabulary word.
Sometimes the students’ vocabulary words and definitions stop within a certain group. If this happens, call
on a student who has not read his word or definition.
4. The teacher will time how long it takes for the entire list of words and definitions to be read. The amount
of time needed for the entire zip around will decrease as students learn the words.
EVALUATION:Students should construct a concept map using the words listed on the vocabulary list. A connecting phrase
must be used between words on the concept map that illustrates knowledge of the definition.
EXTENSIONS:1. A competition to decrease the time needed to have the class finish the zip around can be conducted and
decreasing time to completion can be rewarded.
2. Students can illustrate vocabulary words by drawing sketches of the definitions.
ORIGINAL DEVELOPMENT RESOURCES: Nebel, B. J. (1996). Environmental science, (5th ed.) Upper Saddle River, NJ: Prentice Hall.
Christensen, J. W. (1981). Global science, (3rd ed.) Dubuque, IA: Kendall Hunt Publishing Company.
36
Ecosystem Vocabulary/Definitions
abiotic factors --------------------non-living factors in the environment
Animalia --------------------------kingdom of animals
autotroph --------------------------producers
biotic factors ----------------------living factors in the environment
chlorophyll ------------------------green pigment needed for photosynthesis
community ------------------------populations that interact in an area
consumers ------------------------organisms unable to make own food
detritus ----------------------------decaying plant and animal matter
decomposers ----------------------gets food by breaking down dead organisms
detritus feeders ------------------feed on detrius
ecosystem --------------------------community of organisms interacting with each other and the environment
enzyme ----------------------------biological catalysts
food chain ------------------------the path of food energy passed from organism to organism
food web --------------------------interrelationships of food chains
heterotroph------------------------consumers
Monera ----------------------------kingdom of one-called organisms; cell has no nucleus
parasite ----------------------------organism that lives on or in another organism for food
Plantae ----------------------------kingdom of plants
population ------------------------a group of individuals of the same species that live in an area
primary consumer --------------herbivores
primary detritus feeders ------decomposers; feed directly on detrius
producers --------------------------organisms that produce food (photosynthesis) for themselves
Protista ----------------------------kingdom of one-celled or more organisms; cells have nucleus
salinity ----------------------------containing salt
secondary consumer ------------carnivores
secondary detritus feeders ----feed on primary detrius feeders
37

Notes
38
OBJECTIVES:Students will be able to:
1. Create a model of a fully functional ecosystem and biosphere.
BACKGROUND:This activity represents a long-term, student-constructed ecology
activity. The project consists of constructing and observing an
encapsulated ecosystem made primarily from household and
aquarium materials including a one-gallon glass pickle jar or two-
liter soda bottle, aquarium plants and animals, gravel, and
microorganisms. The ecosystem is a self- supporting, system of
producers, consumers, and decomposers requiring no
maintenance. These sometimes are referred to as biospheres.
The activity encourages students to develop an understanding of
freshwater food webs, nutrient cycles, food pyramids, and energy
pyramids. Students also will observe the establishment of a fresh
water ecosystem with the interactions of organisms such as
freshwater algae, snails, and aquatic plants.
VOCABULARY: ecosystem, biosphere, aerobic
PROCEDURE:1. Clean a large glass jar. It is very important that the jar be
completely rinsed after cleaning; any residual soap or
detergent may poison the organisms. Rinse with sodium
bicarbonate (baking soda) and flush with clean water.
2. Fill the jar with clean, fresh water. Spring or surface water (lake, stream) is preferred. If chlorinated water
must be used, check with a pet store for information about dechlorinating the water. If surface water is
used, beware of introducing undesirable organisms such as macro invertebrates. Fill approximately 80
percent of the jar with the water (the exact amount is not important). The air pocket at the top serves
several purposes, and it is better to err on the side of too much air if in doubt.
3. Using an air stone and an aquarium air pump, aerate the water for at least 15 minutes.
4. Fill the bottom of the jar with clean, washed sand/gravel. Avoid using clay, silt, or sand/gravel that contain
clay or silt.
5. Place the elodea in the jar by burying about one inch of the stem into the gravel. The water sprite may be
either “rooted” into the gravel or allowed to float. If the jar is large enough add 2-3 snails or snail egg
clusters that may be found on the aquarium plants. Add 20 mL of cultured algae or pond water to
inoculate the system and begin additional algae growth. A “pinch” of commercially prepared fertilizer
should be added to ensure the presence of the nutrients, which the plants will need.
6. Seal the jar and place it in bright light but not in direct sunlight or too near light bulbs, which will raise the
temperature.
7. A second ecosystem may be left open to provide additional observations.
EVALUATION: 1. Have students compare and contrast closed and open systems. The procedure should produce results
Encapsulated Ecosystems
Grades:6-8
Subjects:Science, Environmental Science,
Biology
Time Needed: Ongoing
Materials: freshwater snails
elodea
water sprite (optional plant)
pond or stream water
sand and gravel
fresh water
commercial plant fertilizer
large glass jar (1 gal. or larger)
airstone
aquarium air pump
baking soda
test for quantity of phosphates and
nitrates
ECOLOGY
39 www.legacyenved.org
similar to these:
Several jars were assembled in November 2001 as part of an ecology course. Two of these jars were opened
and tested on March 2, 2002. Both jars were started in the same manner and placed in the same classroom
windows.
Original Contents:
One snail egg mass, 10 mL of cultured algae, three sprigs of elodea, 10 mL of pond water, well water, washed
(using sodium bicarbonate) brook gravel, water aerated with an air stone for five minutes
Observations:The water appeared clear and colorless throughout the jar. The gravel bottom had small tufts of algae attached
and very small amounts of snail detritus. A few empty snail shells could be seen. Live snails were feeding
on the glass sides and occasionally were wandering above the water line. The elodea had vanished from
the jar. When the jar was opened, there was no immediate odor, which indicated that the system had
remained aerobic.
Results:water samples—pH=4.5-5.0, nitrates=0.03ppm, phosphates=0.16ppm, dissolved oxygen=9ppm biotics: algae
(Oedogonium, Chorella), paramecium, common pond snails
2. Have students relate their findings to closed-vase aquariums that have plants on top and fish living among
the roots.
EXTENSIONS:1. Modify the lid to allow water samples to be drawn without opening the jar.
2. Place the jar on its side to observe any changes resulting from the increased gravel substrate surface
area.
3. Modify the jar and lid to accept sensor probes for the remote measuring of temperature, pH, and
dissolved oxygen.
4. Take the measurements at regular intervals during the project, and have students record and interpret
the results.
ORIGINAL DEVELOPMENT RESOURCES:BSCS (1992). Biological science. Dubuque, IA: Kendall/Hunt.
40
OBJECTIVES:Students will be able to:
1. List several human activities that damage salt marsh habitat.
2. Apply information to predict how draining a salt marsh for
real estate development may have adverse effects.
3. Become actively involved in communicating the value of salt
marsh preservation to elected officials in the federal
government.
BACKGROUND:Salt marshes are among the most biologically productive
environments on Earth. At the base of many salt marsh food webs
is the grass Spartina alterniflora. Bacteria and fungi feed on
decaying plants. Many invertebrates and vertebrates, such as
clams, crabs, and birds, inhabit these areas for sources of food,
living space, and breeding sites. In addition, salt marshes act as
natural flood-control areas, and they filter pollutants from coastal
waters. Land adjoining water has attracted humans for centuries.
Access for shipping, housing, recreation, and industrial
development are a few of the reasons marshes are drained for
development. In order to meet the growing needs of the human
population, is habitat destruction justified?
VOCABULARY: policy, salt marsh
ADVANCE PREPARATION:1. Compile a list of threatened and endangered species that
inhabit a salt marsh.
2. Acquire local newspaper and magazine articles about salt
marsh development.
3. Prepare an address booklet of the following:
• Congressional representatives and senators.
• Local environmental groups such as the Sierra Club and the Audubon Society.
PROCEDURE:Setting the Stage1. Show a videotape, film, or pictures of a salt marsh to the students.
2. Have the students write a description of this ecosystem, and ask them to include ways in which humans are
destroying these areas.
3. Distribute copies of newspaper and magazine articles concerning salt marsh development, and discuss
factors involved in the issue. Allow the students to suggest solutions to the problems.
Activity1. Construct a classroom model of a salt marsh.
2. Spread modeling clay along the bottom and up the sides of half a roasting pan, shaping the clay so that it
creates a gentleslope toward the uncovered half. Contour a stream channel in the clay.
Environmental Stewardship: Salt Marshes
Grades: 6-8
Subjects: Biology, Environmental Science,
Language Arts, Social Studies,
Economics
Time Needed: Two to five class periods
Materials: threatened and endangered species list
of salt marsh inhabitants
addresses of government officials
addresses of local environmental
groups
salt marsh visuals (video, film,
photographs)
newspaper or magazine articles on salt
marsh development
roasting pan
modeling clay
water
muddy water
sponges
ECOLOGY
41 www.legacyenved.org
3. Place a small amount of water on the other side of the roasting pan to represent the ocean.
4. Allow some muddy water to flow down the clay landform.
5. Have the students note how fast and how much muddy water enters the clean ocean water.
6. Empty the water from the roasting pan, and cut a piece of indoor-outdoor carpet so that it will fit
completely along the edge of the clay. Explain that the carpet represents a salt marsh.
7. Again, add the muddy water, noting the speed and amount of particles entering the clear water.
8. Describe how a salt marsh affects flood control, water purification, and soil erosion.
9. Divide the students into two teams, assigning each team one of the following activities to encourage
participation in environmental stewardship.
Team A - Research all the facts and issues regarding salt marsh development, and record empirical data and
statistics.
Team B - Conduct an opinion poll with each group member asking ten people outside of the class their
position on the issue of whether or not salt marshes should be available for development. Record the
number “for,” “against,” and “undecided.”
EVALUATION: Students should:
1. state the results of the environmental poll.
2. include the facts about the issue compiled from the library research.
3. use a positive tone and offer practical suggestions for a solution.
EXTENSIONS:1. Encourage students to join an environmental interest group or donate money for the protection of the
environment. Emphasize that becoming personally active, when multiplied by many concerned citizens,
can influence decisions made by elected officials.
2. Have students organize a debate on the development of a salt marsh for the construction of an airport.
3. Students can represent individual interest groups such as business organizations, the construction industry,
politicians, environmentalists, industry.
4. Have the class decide which arguments are the most convincing and vote on the issue.
5. Have the students discuss how factors such as culture, tradition, and economics, may limit the ability of
any level of the government to intervene with certain issues.
6. As a class, write letters to the elected government officials in Washington, DC.
7. Have a classroom discussion summing up what was learned about communicating with government
officials.
ORIGINAL DEVELOPMENT RESOURCES:Bernstein, Winkler, Zierdt-Warshaw. (1996). Environmental science. New York, NY: Addison-Wesley
Publishing Company, Inc.
42
OBJECTIVES:Students will be able to:
1. Survey different media coverage for environmental issues.
2. Write and produce a video news show.
BACKGROUND: People are exposed to a wide range of media coverage of
environmental issues. Media coverage typically influences the
attitudes of society toward environmental practices and issues.
Media coverage no longer merely reports facts but often presents
them in such a way that viewers/readers/listeners must learn to
sift through coverage looking for the facts and to use those facts
to form opinions separate from those of the media.
VOCABULARY:environment, issue
PROCEDURE: 1. Ask of scientists, environmental agencies, teachers, or others
about possible fallacies in a media version of an event or
issue.
2. Have students watch the national and local news for a certain
period of time noting environmental issues in their notebooks.
3. Discuss the observed topics and issues highlighting the facts. Newspapers and magazines also can be
brought into class and examined.
4. Teacher should model writing a news report as an example for the students.
5. After looking at media sources, students should create an environmental news report. News reports may
even be generated from school happenings.
6. Peer editing should occur as the writing process takes place.
7. News anchors can be chosen and can write their news scripts with lead-ins and comments about the news
reports.
8. After practicing, the final show can be filmed with a video camera and played back for other classes to
view.
EVALUATION: 1. Students can be tested on their ability to distinguish between fact and opinion.
2. Students’ writing for accuracy, clarity, and thoroughness should be evaluated. Informational (scientific
reporting) writing skill development is important and can be fostered in grades 6 - 8 as expository or
persuasive modes in Language Arts.
EXTENSIONS:1. Invite a media representative into the classroom to discuss reporting procedures.
2. Have students continue to maintain the news log. At the end of the school year, have students report on the
number and types of environmental issues presented in the printed media and/or television and radio.
Environmental News Coverage
Grades:6-8
Subjects:Science, Language Arts, Drama
Time Needed: Several weeks to survey newspapers,
radio, and television environmental
coverage; two to eight 30-45 minute
class periods (time may vary
depending on the amount of spare time
used for writing and editing)
Materials: notebooks to use as news logs
newspapers
magazines
video camera for taping (optional)
ECOLOGY
43 www.legacyenved.org

44
OBJECTIVES: Students will be able to:
1. Discuss the types and uses of energy.
2. Research energy resources.
3. Create a benefit versus cost chart.
BACKGROUND:We use energy every day. If you have ever been in a blackout
during a storm, you know the ways we depend on electrical
energy. Lights, refrigerators, TVs, air conditioners, and computers
require electrical energy. Power plants convert energy from oil,
coal, sun, water, atoms, and wind to electrical energy for use in
our homes and factories. Energy comes from many sources:
natural gas, oil, fission, coal, the sun (solar energy), rushing water
(hydropower), and wind. Sun, water, wood, and wind are called
“renewable” energy sources. fossil fuels such as natural gas, oil,
and coal are called “nonrenewable” because, one they are used,
they are no longer an energy source. Most current modes of
motorized transportation also require fossil fuel for energy.
Most of the energy we use comes from fossil fuels—oil, coal, and natural gas. Plants and marine plankton
died and became buried in the Earth. Over millions of years, heat and pressure changed the marine organic
matter into pockets of oil and natural gas. The plant matter turned into coal.
If nonrenewable resources are used carelessly, some time in the future we will no longer have them to fuel
cars, homes, and factories. We need to make our fuel supply last over time by conserving it. Another reason to
conserve our nonrenewable resources is that most of the world’s oil is found outside the United States. We
depend largely on fuel brought from foreign countries, and this dependence can be very expensive and can
cause instability in availability.
VOCABULARY:nonrenewable resources, nuclear fission, hydropower, fossil fuels, renewable energy sources
PROCEDURE:1. Discuss these questions in class:
• How many different types of energy can you name?
• Which of these do you use in your own life? How often?
• What kinds of energy resources does your electric utility company rely on? (Most utility companies in
Alabama rely on fossil fuel and supplement that with hydroelectric power generation.)
2. Have students individually or in small groups research an assigned energy source. Sources include solar
(passive and active), wind, hydropower, geothermal, natural gas, coal, biomass, and nuclear. The students
first should find out basics about how their source works; whether it is used currently or is being
researched for future use; what kind of pollutants it emits (including a CO2 count); how cost-effective it is
(now and in the future); and whether it is renewable.
3. Have the students complete the Energy Worksheet for their assigned energy source.
4. Have the class create a “benefits versus potential environmental impacts” chart listing energy sources and
possible impacts for each source.
Gotta Have Energy
Grades:6-8
Subjects:Math, Environmental Science
Time Needed: Outside research and at least two 40-
minute class periods for sharing
information
Materials: Energy Worksheet
Alabama Map
ECOLOGY
45 www.legacyenved.org
5. Once the students have collected their information, the groups can debate the advantages and
disadvantages of each source. The teacher should mediate and present questions from the Energy
worksheet before the debate begins. If the students have done their own research and have it in hand for
reference, the debate will be more of an intelligent trading of information than a heated argument.
EVALUATION: Students should be able to explain at least one energy source and the advantages/disadvantages of this
resource in energy production.
EXTENSIONS:1. Ask a utility company representative to speak to students about the energy resources the utility uses and
what is being done in terms of alternative energy research and development. Encourage the students to ask
questions and remind them that different groups and individuals hold different opinions toward energy use.
2. On a map of Alabama, locate the coal, nuclear, and hydroelectric plants. Contact Alabama Power
Company, the local rural electric cooperatives, the Corps of Engineers, and the Tennessee Valley Authority
for an updated listing of those facilities.
3. Ask someone from a nearby university to talk with students about energy. If the university has a geology
department, that would be a good place to start. There also may be professors in the chemistry department
or the civil engineering department who can be guest speakers.
ORIGINAL DEVELOPMENT RECOURCES:Adapted with permission from Growing Greener Cities Education Guide.
Geological Survey of Alabama (for maps showing locations of coal, oil, etc., in Alabama), P.O. Box
869999, Tuscaloosa, AL 35486- 6999, www.gsa.state.al.us
46
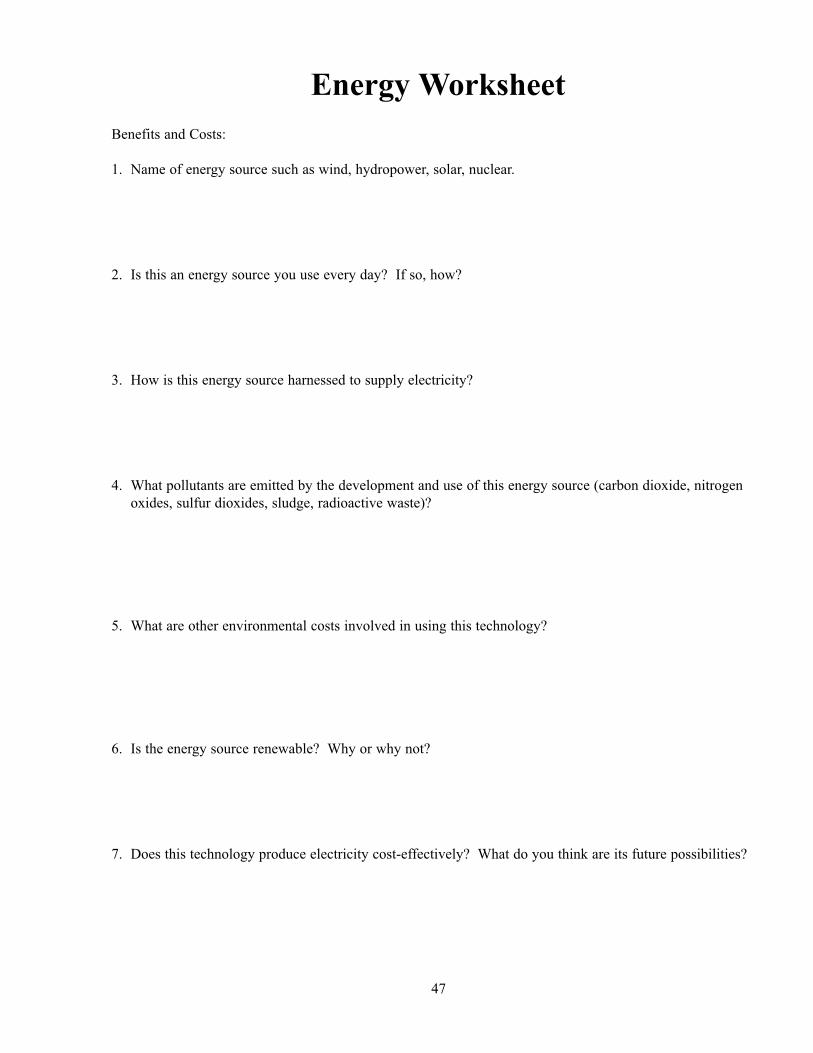
Energy Worksheet
Benefits and Costs:
1. Name of energy source such as wind, hydropower, solar, nuclear.
2. Is this an energy source you use every day? If so, how?
3. How is this energy source harnessed to supply electricity?
4. What pollutants are emitted by the development and use of this energy source (carbon dioxide, nitrogen
oxides, sulfur dioxides, sludge, radioactive waste)?
5. What are other environmental costs involved in using this technology?
6. Is the energy source renewable? Why or why not?
7. Does this technology produce electricity cost-effectively? What do you think are its future possibilities?
47

Notes
48
OBJECTIVES:Students will be able to:
1. Demonstrate the concept of natural selection.
2. Demonstrate the adaptive value of camouflage.
3. Construct bar graphs from data.
BACKGROUND: Any population has natural variation in the expression of traits
because of independent assortment of chromosomes, crossing
over of genes, and mutations. In the environment that the
population inhabits, some of this natural variation is going to
have adaptive value–that is, it’s going to help the organism
survive in a particular environment. Survivability may mean a
trait that helps the organism find food, such as keen night vision
or sense of smell, or perhaps an adaptation that would prevent the
organism from being eaten such as speed or an ability to hide.
Organisms that survive into sexual maturity are going to pass
those genetic traits to succeeding generations, eventually
increasing the incidence of those adaptive traits in the gene pool.
This process is called natural selection.
One adaptive advantage for both predator and prey animals is camouflage, which allows an animal to blend
into the background so that it cannot be seen. A prey animal, which is camouflaged, may not be seen by a
predator; a predator, which is camouflaged, may be able to sneak up on its prey.
VOCABULARY:natural variation, adaptation, natural selection, camouflage
ADVANCE PREPARATION:1. Using a hole punch, punch out holes in sheets of construction paper of every color. Mix the dots well, and
divide into small containers for each group.
2. Collect sheets of wrapping paper, cloth, wallpaper, or aquarium backgrounds that have busy patterns or
designs in different colors.
3. Find colored pictures of different environments—grasslands, jungle, forest, coral reef—and copy them.
Create dime-sized circles covered with various patterns, such as stripes, circles, dots, bars, blotches,
checkerboard, as well as black and white.
PROCEDURE:Setting the Stage1. Review natural variation, natural selection, and adaptation strategies with the students.
2. Discuss camouflage as an adaptive advantage. Be sure to include pattern, interrupted design, extra “eye,”
and other strategies besides color since all animals don’t see in color.
3. Help the students understand the concept that animals that are camouflaged in one environment may not be
protected in another environment.
4. Review data table concepts and the construction of bar graphs.
Hide And Seek
Grades:6-8
Subjects:Biology, Ecology
Time Needed:One-two class periods
Materials:squares of colored, patterned
backgrounds
black and white environments
colored construction paper
hole punch
graph paper
ECOLOGY
49 www.legacyenved.org
Activity1. Divide the students into small groups. Give each group a colored, patterned background (cloth, wrapping
paper, etc.) and a container of colored dots.
2. Spread 50 dots of the assorted colors randomly on the colored background.
3. The students should shut their eyes, open their eyes, and pick up the first dot they see. They should record
the color of the dot. They should repeat this sequence until 10 dots have been picked up and recorded.
Don’t forget to have them shut their eyes each time before picking up the dots.
4. The dots should be returned to the background in a random manner, and the next student in the group
should repeat the process until each student in that group has picked up 10 colored dots and has recorded
the colors.
5. Make a data table with the total number of dots of each color picked up, plus the first, second, and third
selection each student. Construct a bar graph of the data. What colors were most vulnerable to predation in
this environment? What will happen to the gene frequency for that color in succeeding generations?
6. Now place 100 dots, including the same number of dots of each color, randomly on the background. Allow
the group of students to repeat the shut eyes, open eyes, pick-up-a-dot sequence until 80 of the dots have
been removed. Shake off the remaining 20 dots onto the tabletop and, for each “survivor,” add 4
“offspring” dots of the same color. Repeat for 3 more generations.
7. Make another bar graph from the remaining 100 dots. Which colors were adaptive in this environment?
What would have happened to the gene frequencies for camouflaged colors and contrasting colors?
8. Either allow groups to switch backgrounds and repeat, or have each group display its background and
report to the rest of the class on the data.
9. Repeat the experiment (or just the first part) with black and white circles on black and white backgrounds.
Why use only black and white? How can the bright orange stripes of the tiger be an example of
camouflage?
EVALUATION:1. Using the data tables and bar graphs, have the students extrapolate the data to construct a line graph of
color frequencies over a period of time such as 10 years.
2. Create scenarios in which the colors selected would no longer be adaptive. What would happen then?
EXTENSIONS:1. Let the students choose a background and create an animal—predator or prey—that would be well
adapted to that environment. Have them draw that animal in the environment, and have them
describe the adaptations that would enable it to survive.
2. Show the students pictures of animals that may not be familiar to them. Ask them to guess the
animal’s habitat by observing its coloration.
ORIGINAL DEVELOPMENT RESOURCES:Biology: The dynamics of life. (1995). Lab manual. Glencoe Publishing.
50
OBJECTIVES: Students will be able to:
1. Compare and contrast the ocean’s life zones: planktonic
realm, benthonic realm, and nektonic realm.
2. Identify an organism’s mode of life as related to the marine
environment.
3. Construct a mobile illustrating an organism’s mode of life
in a specific life zone.
BACKGROUND: The Gulf of Mexico is an important source of educational,
commercial, and recreational activities. This marine environment
is an integral part of the state since part of Alabama lies along the
coast.
The marine environment consists of three major zones in which
organisms thrive. These zones are identified by location in the
ocean as related to the open water (pelagic) and the sea floor
(benthic). Each zone is occupied by marine organisms that are
limited by depth, sunlight penetration, and biotic factors. These
three zones are the planktonic realm, benthonic realm, and
nektonic realm.
The planktonic realm consists of plants and animals that “drift”
on the ocean surface. The bulk of this realm contains
phytoplankton consisting of diatoms, dinoflagellates, and
coccolithophores, which are dependent on sunlight. Both
microscopic and macroscopic forms of zooplankton also are present. Some common examples are arrow
worms, sandworms, crab larvae, spiny lobster larvae, foraminiferans, radiolarians, krill, jellyfish, pteropods,
and copepods.
The benthonic realm consists of plants to a depth of approximately 100 feet (30 m) and animals consisting of
creepers, crawlers, and burrowers. Representative animals that may occupy this realm are poriferans,
mollusks, annelids, echinoderms, and cnidarians. This zone begins at the shallow shoreline and ends at a depth
of approximately 20,000 feet (6000 m).
The nektonic realm includes not only fishes, which can manipulate their position in the water column, but also
marine birds, reptiles, and mammals. Here, large animals face many challenges. In the ocean, the region near
the surface may be brightly lit while deeper regions present a realm with little if any light. Because most
nekton are both hunters and hunted, they must carefully adapt to light intensity.
VOCABULARY:plankton, phytoplankton, zoo plankton, benthos, nekton, planktonic realm, benthonic realm, nektonic realm,
producer, consumer, food web
ADVANCE PREPARATION:1. Introduce the terms planktonic realm, benthonic realm, and nektonic realm.
Mode Of Marine Life Mobile
Grades: 6-8
Subjects: Science,Marine Science,
Environmental Science, Biology
Time Needed: 90 minutes
Materials:audiovisual about the marine
environment
list and pictures of marine organisms
3 x 5 cards
glue stick
construction paper
hanger (per student)
miscellaneous items to construct
individual marine organisms
visual showing marine life zones
ECOLOGY
51 www.legacyenved.org
2. Show prepared posters or diagrams from textbooks illustrating marine food webs.
3. Identify the roles of producers and consumers in the food web.
4. Discuss the types of organisms that may occupy different areas of the food web.
5. Pictures of marine organisms that will be illustrated should be available for students to view.
*Examples of marine organisms which can be assigned to students in the Activity section are as follows:
Planktonic Realm
diatom, dinoflagellate, coccolithophore, arrow worm, crab (zoea larva), Nauplius (shrimp larva), spiny
lobster larva, Foraminiferan, Radiolarian,krill (Euphasid), jellyfish, pteropod (sea butterfly), copepod
Benthonic Realm
sandworm (Nereis), feather duster worm, scallop, sponge, snail,clam, horseshoe crab, seastar, sea urchin,
sea anemone, nudibranch, sea cucumber
Nektonic Realm
squid, sea turtle, sea snake, whale, pelican, cormorant, shark, trigger fish
PROCEDURE:Setting the Stage1. Show the class an audiovisual relating to the marine environment highlighting the realms.
2. Ask the students to list the organisms common to these realms.
Activity1. Students, individually or in cooperative groups, should construct a hanging mobile of an organism,
identifying its mode of life in a marine environment.
2. This is to be a three-dimensional model of an assigned marine organism.
3. The following information should be put on 3 x 5 cards and hung neatly from the mobile along with a
picture of drawing of the marine organism: (print all words)
• Identify the organism’s mode of life (planktonic realm, benthonic realm, or nektonic realm). If
planktonic, identify whether it is phytoplankton or zooplankton.
• Identify the organism by name:
Phylum
Class
Genus
Species
Common Name
• Identify the organism’s role in a food web by giving a minimum of three facts.
4. Mobiles are to be presented by each student to the class and then are to be hung at random or grouped
according to the appropriate realm.
EVALUATION:1. Have students write a story about their organism entitled “A Day in the Life of . . .”
2. As a class, arrange the mobiles to display a large food web.
EXTENSIONS:1. Have students bring in pictures of marine organisms and discuss their roles in the marine environment.
2. Plan a field trip to collect marine organisms, identifying the mode of life and discussing their roles in the
food web.
ORIGINAL DEVELOPMENT RESOURCES:Lerman, M. (1986). Marine biology. The Benjamin/Cummings Publishing Company, Inc.
Vancleave, J. B. (1996) Oceans for every kid. New York, NY: John Wiley & Sons, Inc.
52

Center for Environmental Education. (1989) The ocean book: aquarium and seaside activities and ideasfor all ages.
Nye, B., Saunders, I. & Dykes, J.S. (1999). Bill Nye the science guy’s big blue ocean. Disney Press.
53

Notes
54
OBJECTIVES:Students will be able to:
1. Investigate an area of disturbance over a period of time.
2. Observe and enumerate the changes in plant diversity and
density. Predict long term effects of clearcutting versus
selective cutting.
BACKGROUND:Clearcutting is a method often chosen for harvesting trees as a
cash crop. It is used because it is economical and, some argue,
ecologically effective. Clearcut sites often are replanted for
continued or repeated harvesting. These wide-open areas provide
some cover and feeding resources while the forest regenerates.
Another method used for harvesting trees involves selective
cutting in which areas of trees are taken from within, and along
the margins of, forests. Research provides the forester with data
on how large these areas need to be to allow sufficient light for
succession to be successful.
The public as a whole should evaluate the need for biodiversity in
forests, the consumers’ demands for wood products, and the
economical importance of the forestry industry in Alabama.
Hardwoods are seldom, if ever a part of replanting programs.
Most clearcuts are planted in monotypic vegetation. That is, only
one species of tree replaces the diverse forest. The public and
forestry industry should plan for ensuring biodiversity.
VOCABULARY:clearcutting, succession, secondary succession, monotypic
vegetation, selective cutting
ADVANCE PREPARATION:1. Contact forestry or timber industry officials in the area to locate an area of recent clearcutting. Get written
permission to visit this area with your class. The owners may ask to have your students sign a waiver of
responsibility.
2. Set up the visit to the clearcut area as a regular field trip. You will want to visit this same area several
times.
3. Prepare one-meter square templates for each group.
PROCEDURE:Setting the Stage1. Show the students pictures of clearcut areas, and ask them to describe what they see.
2. Introduce the concept of secondary succession, and ask the students to predict what will happen in a
clearcut area and how long it will take.
Succession In A Clearcut Area
Grades:6-8
Subjects:Biology, Ecology
Time Needed:At least two field studies of 90-120
minutes each
Classroom time to compare data, make
graphs, write reports, make
presentations
Materials:several 1-meter square templates
(ideally one per group)
notebooks
pencils
graph paper
cameras
film
field books for identification
magnifying glasses
plastic bags (to bring back specimens)
ECOLOGY
55 www.legacyenved.org
Activity1. Take the students to an area that has recently been clearcut.
2. Take pictures and write general descriptions of the site.
3. Divide the students into groups and provide each group with a one-meter square template. Let them choose
an area to examine, stake it off, and flag it so that they can return to the same area on their next visit.
4. Lay the template on the ground. Count and identify the plant species within the template area.. If there are
problems of identification, collect one example of the organisms to take back to the classroom. Be aware
of threatened or endangered species and do not remove those.
5. Note any animal species that are observed.
6. Do at least one follow-up trip to the same site. Follow the same instructions as above.
7. Graph beginning, interim, and ending plant diversity and plant density numbers for each area of
observation. Compare pictures and descriptions from first to last observation as well as among groups.
8. Compare the data with the predictions that were made. Discuss the short- and long-term effects of the
harvesting procedure. Compare and contrast the long-term effects of clearcutting to selective cutting
methods.
EVALUATION:Make a notebook, scrapbook, or bulletin board including the descriptions, pictures, and data from the site
investigations.
EXTENSIONS:1. After several months have passed, visit the site again; or wait until the next year and visit with a new class
after showing them the pictures and accounts from the previous year.
2. If no clearcut area is available, clear a small area on or near the school campus. At the end of your
succession experiment, plant the area in wildflowers, shrubs, or trees to beautify the campus.
3. Compare clearcut areas that have been replanted to clearcut areas that have been allowed to fill in
naturally.
4. Make a video or slide show of the investigations for presentation to other classes.
5. Clear small (1 meter square) plots in various microhabitats and compare the diversity and density of plants
and animals. Compare the time required for different microhabitats to fill in.
56
OBJECTIVES:Students will be able to:
1. Design and produce a mural that illustrates marine and
estuarine pollution.
2. Demonstrate an understanding of how humans impact
wetlands.
BACKGROUND: Salt marshes and estuaries are coastal water ecosystems.
Estuaries are places where salt water mixes with fresh water. A
salt marsh is a tidal wetland that is covered at least part of the
time with salt water and is dominated by nonwoody vegetation
such as cord grass and black needle rush. Salt marshes often are
found adjacent to estuaries. Plants use the sun’s energy, carbon
dioxide, water, and nutrients to make their own food through
photosynthesis. This energy is then passed up the food chain.
Along the Gulf Coast, these marshes are flooded by rising tides.
When the tide recedes, it carries detritus with it and deposits it in
the shallow bay and coastal waters. The detritus, an important
part of the food web, is eaten by phytoplankton, zooplankton,
shrimp, and crabs.
Salt marshes and estuaries are important because they are the
nursery grounds of many young animals that spend much of their
lives there. They provide protection and an abundance of food for
those young animals. The marshes also act as filtering systems for
coastal waters because many pollutants are taken up by the marsh plants as nutrients. The vegetation in this
ecosystem traps sediments and acts as a storm buffer.
Wetlands are very delicate ecosystems, and humans are gradually destroying these areas by pollution and
physical destruction. The estuaries trap wastes that are emptied into rivers that feed them. Marshes receive
garbage dumped offshore and carried by the tides. Toxic chemicals become concentrated in the plants and
animals. Decomposition of dead plants and animals uses up oxygen thereby reducing the oxygen supply in
these waters. Thermal pollution occurs when industries empty warm water into these areas.
Marine debris is a serious problem that is multiplying. Compounding the problem, there are many different
types of debris or litter, inadequate disposal of solid wastes, and trash being deposited in low-lying coastal
landfills. Within a short period of time, this litter ends up on the shores of coastal areas. This debris poses a
life-threatening problem to wildlife. As human demands continue to increase with very little action from
different sources, more destruction will occur.
VOCABULARY: black needle rush, cord grass, debris, ecosystem, estuary, food chain, food web, phytoplankton, wetlands, zoo
plankton, salt marsh
ADVANCE PREPARATION:1. Introduce the vocabulary terms.
Wasted Wetlands
Grades: 6-8
Subjects: Science, Ecology
Time Needed: Two weeks–One month
Materials: samples of marine litter
large sheets of paper or poster board
paint
paint brushes
glue
seine net (optional)
photographs and pictures of wetlands
marine organisms
references on flora and fanna of
wetlands and salt marshes
ECOLOGY
57 www.legacyenved.org
2. Show pictures and slides of areas designated as wetlands.
3. Show a map of Alabama indicating areas with a lot of wetlands.
4. Show magazine pictures, photographs, and slides of various types of wetlands.
5. Have the students design a wetland display for the classroom showing the importance of wetlands to the
health of our planet.
6. Show pictures and slides of wetland destruction. Prepare a classroom chart showing the causes of this
destruction.
PROCEDURE:Setting the Stage1. Read the background information on the characteristics of wetlands and estuaries. Have the students
brainstorm flora and fauna found in wetlands (estuaries). List their identifications on the chalkboard.
2. Have students prepare a “wetland” journal recording each day’s activities relating to estuarine wetlands.
Have them speculate in their journals what would happen if these wetlands disappeared.
Activity1. Divide the students into cooperative groups, or this activity could be done by classes. The students will
design and make a mural, diorama, or structure that illustrates marine and estuarine pollution. These can be
displayed throughout the school campus. The students also can develop information to be announced at
school each day for a week, making other students aware of this problem and giving them the cause/effect
solutions. This could be extended into a month-long school activity to coincide with Wetland Awareness
Month (May). If school space allows, display a wetland awareness table that would contain pamphlets and
brochures the students have acquired.
EVALUATION:1. Students can develop a food web of a marine environment on index cards linking them together with yarn.
Have them remove a certain organism from this web. Discuss what may have caused it to disappear.
Discuss what effects this loss has on the food web. Continue until the food web is completely destroyed.
EXTENSIONS:1. Have students participate in a coastal beach clean-up or in the Adopt-A-Marine Environment Program.
2. Take a field trip to a local wetland or salt marsh. Pull a seine net through the marsh canals, lagoon, and
adjacent waters. Observe the collected organisms. Examine the beach area for signs of pollution.
3. Visit a local seafood packaging business. Discuss the effects of wetland pollution with workers.
58
INTRODUCTION TO POLLUTION
PREVENTION
Many satellites put in orbit by the United States and other countries have included geographic image surveys as
part of their missions. Not only have those images clearly illustrated the beauty and diversity of the planet’s
surface, but also those images have shown that it is isolated and self-contained. Although enormous in scale, the
Earth is not infinite nor are its resources. While the planet can support an abundance of life and even can absorb
some level of pollution, its carrying capacity (the amount of life supportable through resource allocation and
use) is fixed. Because of this, the combination of natural and human-made detrimental effects, including
pollution, must be considered to ensure that the carrying capacity is not exceeded.
The effect of natural or human-made change on Earth is often difficult to determine and is speculative on a
worldwide scale, although studies of individual ecosystems and smaller geographic areas prove less difficult to
measure. Instances of pollution can be investigated to determine effects and risks posed. Environmental studies
and analyses have received increasing attention in past decades. Only through education can we as citizens
become informed enough to make accurate and responsible decisions about our environment. The focus of this
chapter is environmental pollution, either occurring naturally or human-made. There are two fundamental
reasons for our concern with environmental pollution: (1) human health, welfare, and resource needs and (2)
concern about the rest of nature.
Human Health, Welfare, and Resource Needs
Our personal concern with environmental pollution mainly revolves around health problems from natural, as
well as human-made, pollutants. Human health and well-being can be impacted by environmental pollution in
two distinctly different ways: (1) on a personal level by detrimental health due to contamination or depletion of
water, air, and other needed resources or (2) by reduced social and economic benefits or degradation in a
geographic, ecosystem, or global context through slow deterioration of our habitat or decreasing availability of
resources.
The cost of control and remediation measures for pollutants sometimes is reflected in health-care costs to treat
afflictions caused by pollution. Reduced or eliminated mental well-being or recreational benefits often are
overlooked and are underestimated because of the difficulty in quantifying costs. The cost of the inability to fish
a stream segment because of aquatic pollution, to stay outdoors for extended periods because of elevated ozone
levels, or to play in areas contaminated by pollution is difficult to determine economically. Maintaining a
healthy and sustainable environment for these activities often runs contrary to human and economic needs for
population, urban, agricultural, and manufacturing growth and development.
Concern for Nature
Concern for nature other than that readily identified as healthful or economically beneficial has been a part of
human existence for centuries. For example, there are many things about the balance of nature that we don’t
know. The loss of some species may throw off that delicate balance in ways that we cannot foresee at the time.
This is a major theme of the modern environmental movement. Although many concerns mainly address human
enjoyment, nature has value simply in its existence. Consider, for example, the number of people who place
value in the protection of endangered species and the national park system, even though they have never seen
an Indiana Bat or visited Little River Canyon. This protection of nature does not come without a price to all of
us. Some resources have to be left unclaimed, some land has to be left undeveloped, and funds must be spent on
protection and preservation of the delicate balance of nature.
59
Cultural Change
One of the major factors in the creation of environmental pollution stems from the consumption of resources,
production and manufacture of goods, and disposal of wastes. Demand from citizens for a ready supply of goods
increases as the population increases. Technology offers more products to make our lives better and easier, and
our purchasing power increases.
The controversy over the creation of pollution traditionally has focused on finger pointing and on placing
economic matters above environmental concerns. Industry, government, and public groups have not always
realized that environmental protection and economic growth do not have to be mutually exclusive. Government
regulation, industry initiative, and public demand have caused great improvements to be made in the area of
environmental protection. Better process design, control measures, and pollution prevention activities to reduce
or eliminate pollutants at the source have reduced much pollution. Although great successes have been achieved,
much more must be done in order to protect human health and the environment from pollutants.
A cultural change continues in the way many Alabamians work and play. Businesses, industry, agriculture, and
other activities continue to make improvements in their operations. Collectively, they are trying to make a
difference, as are public environmental groups and government agencies who keep watch over the environment
and who encourage progress. These collective actions are important to success, but what can we do individually?
We must all consider our activities, taking into consideration the environmental impact they may have. The idea
of “throwing it away” is a myth. Wastes do not “disappear” when we “throw it away.” All waste must be
disposed of somewhere, and consumption of most materials creates at least one form of pollution from solid
waste or from discharges in water or emissions into the air.
When purchasing materials and services, we must consider questions such as “What will happen to it after I use
it? Can it be recycled? Can I purchase goods with less packaging? Is there a better alternative?” and finally, and
most importantly, “Do I really need it?” Unfortunately, we often must act and make decisions without complete
information. Educating ourselves, taking the time to get accurate information, and considering the consequences
of our actions collectively and as individuals are important first steps in solving the problems created by
environmental pollution.
From World Book Encyclopedia
60
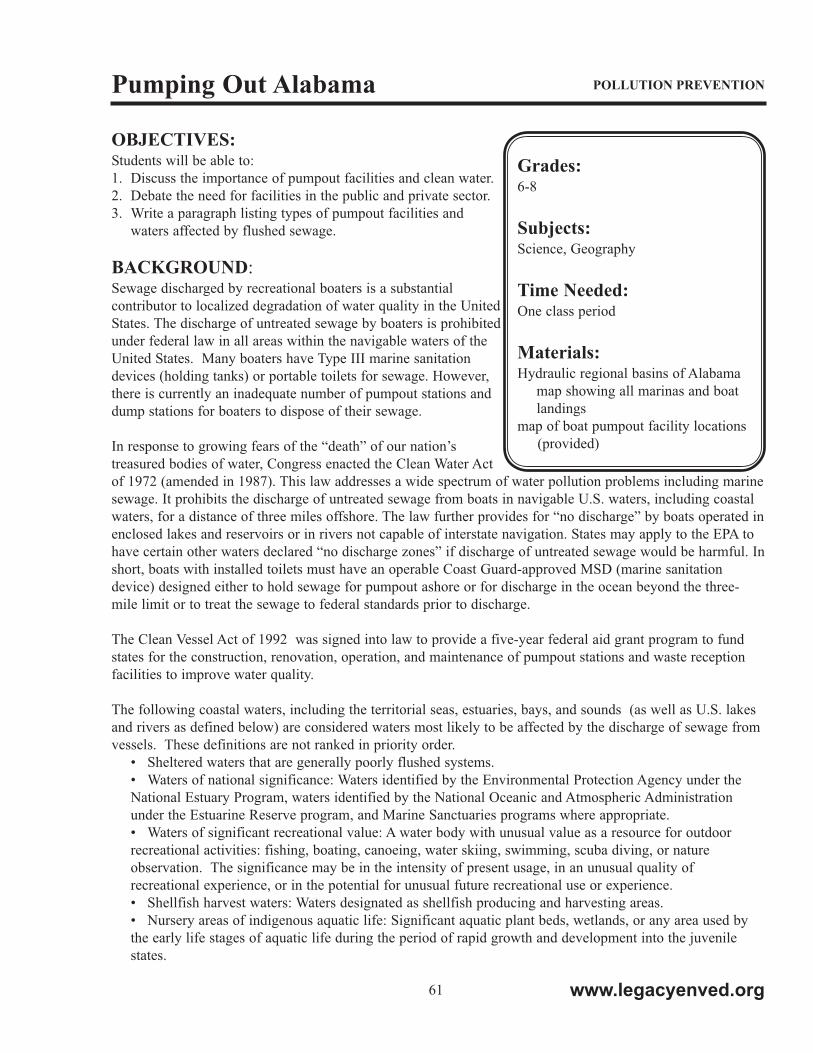
61
POLLUTION PREVENTION
OBJECTIVES:Students will be able to:
1. Discuss the importance of pumpout facilities and clean water.
2. Debate the need for facilities in the public and private sector.
3. Write a paragraph listing types of pumpout facilities and
waters affected by flushed sewage.
BACKGROUND: Sewage discharged by recreational boaters is a substantial
contributor to localized degradation of water quality in the United
States. The discharge of untreated sewage by boaters is prohibited
under federal law in all areas within the navigable waters of the
United States. Many boaters have Type III marine sanitation
devices (holding tanks) or portable toilets for sewage. However,
there is currently an inadequate number of pumpout stations and
dump stations for boaters to dispose of their sewage.
In response to growing fears of the “death” of our nation’s
treasured bodies of water, Congress enacted the Clean Water Act
of 1972 (amended in 1987). This law addresses a wide spectrum of water pollution problems including marine
sewage. It prohibits the discharge of untreated sewage from boats in navigable U.S. waters, including coastal
waters, for a distance of three miles offshore. The law further provides for “no discharge” by boats operated in
enclosed lakes and reservoirs or in rivers not capable of interstate navigation. States may apply to the EPA to
have certain other waters declared “no discharge zones” if discharge of untreated sewage would be harmful. In
short, boats with installed toilets must have an operable Coast Guard-approved MSD (marine sanitation
device) designed either to hold sewage for pumpout ashore or for discharge in the ocean beyond the three-
mile limit or to treat the sewage to federal standards prior to discharge.
The Clean Vessel Act of 1992 was signed into law to provide a five-year federal aid grant program to fund
states for the construction, renovation, operation, and maintenance of pumpout stations and waste reception
facilities to improve water quality.
The following coastal waters, including the territorial seas, estuaries, bays, and sounds (as well as U.S. lakes
and rivers as defined below) are considered waters most likely to be affected by the discharge of sewage from
vessels. These definitions are not ranked in priority order.
• Sheltered waters that are generally poorly flushed systems.
• Waters of national significance: Waters identified by the Environmental Protection Agency under the
National Estuary Program, waters identified by the National Oceanic and Atmospheric Administration
under the Estuarine Reserve program, and Marine Sanctuaries programs where appropriate.
• Waters of significant recreational value: A water body with unusual value as a resource for outdoor
recreational activities: fishing, boating, canoeing, water skiing, swimming, scuba diving, or nature
observation. The significance may be in the intensity of present usage, in an unusual quality of
recreational experience, or in the potential for unusual future recreational use or experience.
• Shellfish harvest waters: Waters designated as shellfish producing and harvesting areas.
• Nursery areas of indigenous aquatic life: Significant aquatic plant beds, wetlands, or any area used by
the early life stages of aquatic life during the period of rapid growth and development into the juvenile
states.
Pumping Out Alabama
Grades:6-8
Subjects:Science, Geography
Time Needed: One class period
Materials: Hydraulic regional basins of Alabama
map showing all marinas and boat
landings
map of boat pumpout facility locations
(provided)
www.legacyenved.org
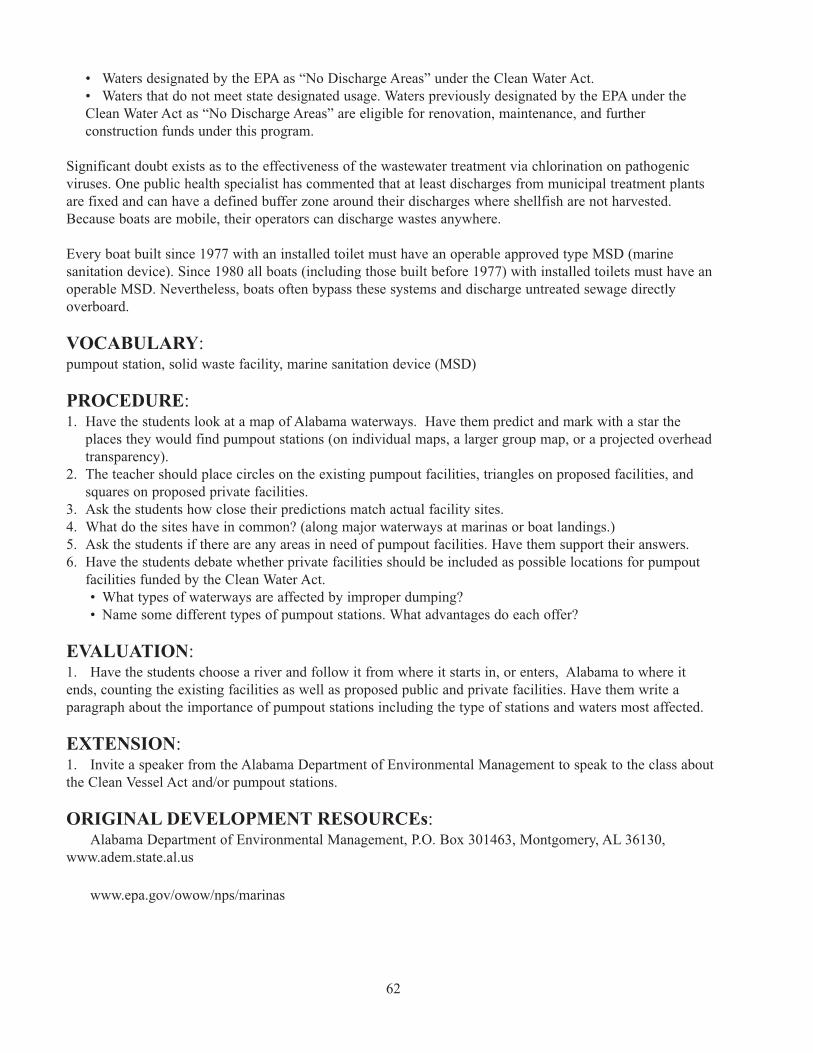
• Waters designated by the EPA as “No Discharge Areas” under the Clean Water Act.
• Waters that do not meet state designated usage. Waters previously designated by the EPA under the
Clean Water Act as “No Discharge Areas” are eligible for renovation, maintenance, and further
construction funds under this program.
Significant doubt exists as to the effectiveness of the wastewater treatment via chlorination on pathogenic
viruses. One public health specialist has commented that at least discharges from municipal treatment plants
are fixed and can have a defined buffer zone around their discharges where shellfish are not harvested.
Because boats are mobile, their operators can discharge wastes anywhere.
Every boat built since 1977 with an installed toilet must have an operable approved type MSD (marine
sanitation device). Since 1980 all boats (including those built before 1977) with installed toilets must have an
operable MSD. Nevertheless, boats often bypass these systems and discharge untreated sewage directly
overboard.
VOCABULARY: pumpout station, solid waste facility, marine sanitation device (MSD)
PROCEDURE:1. Have the students look at a map of Alabama waterways. Have them predict and mark with a star the
places they would find pumpout stations (on individual maps, a larger group map, or a projected overhead
transparency).
2. The teacher should place circles on the existing pumpout facilities, triangles on proposed facilities, and
squares on proposed private facilities.
3. Ask the students how close their predictions match actual facility sites.
4. What do the sites have in common? (along major waterways at marinas or boat landings.)
5. Ask the students if there are any areas in need of pumpout facilities. Have them support their answers.
6. Have the students debate whether private facilities should be included as possible locations for pumpout
facilities funded by the Clean Water Act.
• What types of waterways are affected by improper dumping?
• Name some different types of pumpout stations. What advantages do each offer?
EVALUATION: 1. Have the students choose a river and follow it from where it starts in, or enters, Alabama to where it
ends, counting the existing facilities as well as proposed public and private facilities. Have them write a
paragraph about the importance of pumpout stations including the type of stations and waters most affected.
EXTENSION: 1. Invite a speaker from the Alabama Department of Environmental Management to speak to the class about
the Clean Vessel Act and/or pumpout stations.
ORIGINAL DEVELOPMENT RESOURCEs: Alabama Department of Environmental Management, P.O. Box 301463, Montgomery, AL 36130,
www.adem.state.al.us
www.epa.gov/owow/nps/marinas
62
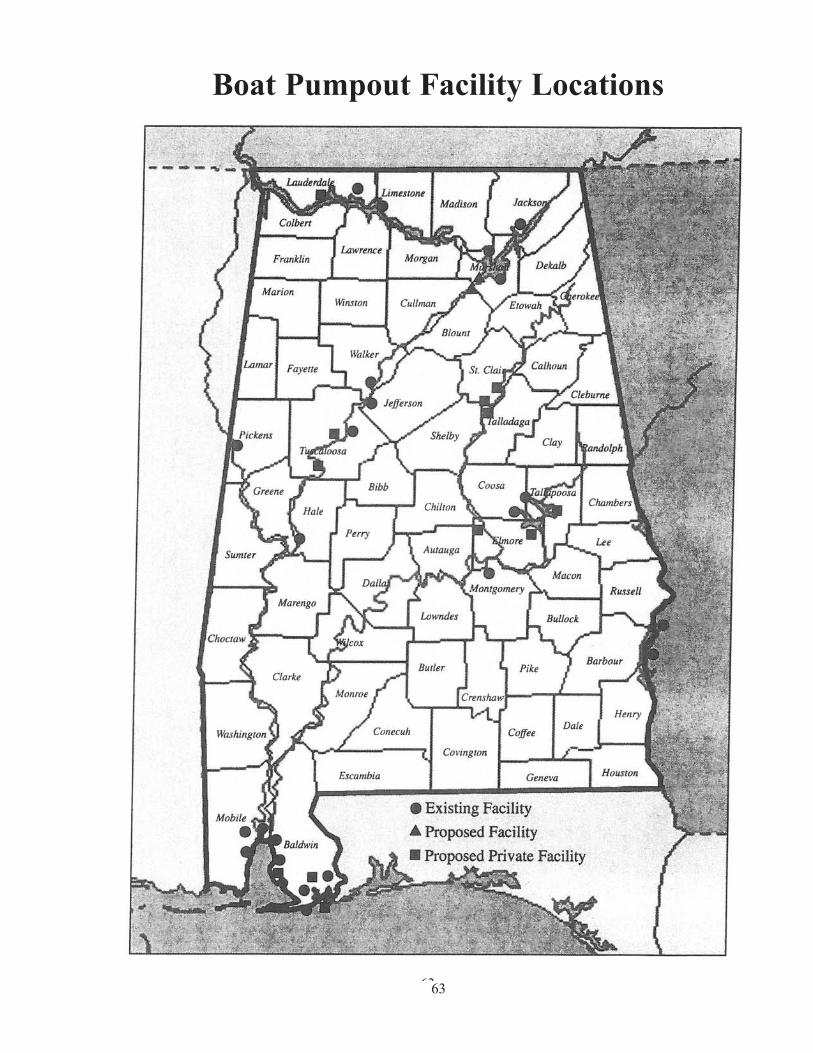
63
Boat Pumpout Facility Locations

Notes
64
OBJECTIVE: Students will be able to:
Design a poster that will identify types of litter harmful to
aquatic wildlife.
BACKGROUND:“Only recently have we become aware of how severely we are
plundering our planet. Some argue that pollution always existed,
that we should be no more upset by the extinction of the bald
eagle than that of the dinosaurs. This ignores the basic fact that
we are no longer in a slow evolution process but in a violent
explosive one. No comparison is possible. There are no
precedents. We have to face the danger as a new kind of human
peril that only human measures can remedy. The life cycle and
the water cycle are inseparable; we must save our oceans and
waterways if we are to save mankind.” This is a direct quote
written by Jacques Cousteau in a book in l968. Things have
changed and not necessarily for the best. The litter problem on
beaches and in rivers, lakes, streams, and ponds can be solved if
people take litter home instead of throwing it in the water and on
the shores. Public awareness and education can be persuasive
elements in cleaning up aquatic environments.
VOCABULARY: aquatic wildlife, litter, harmful, identify
ADVANCE PREPARATION:Gather materials needed such as fish net, fish line, balloons, plastic bags, poster board, construction paper,
markers, and drawing instruments.
PROCEDURE:Setting the Stage1. Have a student come forward. Tell the class to pretend that this student is a wading bird. Hold up a piece
of fishing line. Ask: “What would happen if this wading bird were to get caught in this fishing line?”
Carefully wrap the fishing line around the student’s feet and ask, “Could this wading bird walk like this?”
Explain the dangers of fishing line to aquatic wildlife.
2. Have another student come forward. Tell the class to pretend that this student is a dolphin. Hold up a
balloon or a plastic bag. Ask: “What would happen if this dolphin ingested this balloon or plastic bag?”
Explain that the dolphin could not digest the plastic bag or the balloon; therefore, it would lay in the
dolphin’s stomach making it feel full and eventually starving it to death.
3. Have another student come forward. Have the class pretend this student is a pelican. Hold up a piece of
fish net. Ask: “What would happen if this pelican got its wing caught in this net?” Put the net gently
around the student’s arm. Ask the student, “Could you fly like this?” Explain the dangers of fish net to
aquatic wildlife.
Posters And People
Grades:6-8
Subjects: Science, Social Studies, Language Arts,
Art
Time Needed: One-two class periods
Materials: cardboard pieces
poster board
construction paper
pictures of aquatic wildlife
pictures of litter
letters or stencils for lettering
drawing pencils
color markers
types of litter that could be harmful to
aquatic wildlife (such as plastic
rings, fishing line, plastic bags, etc.)
POLLUTION PREVENTION
65 www.legacyenved.org
Activity1. Explain that students are to design a poster that will educate the public to the dangers of litter to aquatic
wildlife.
2. Tell students they are to use the materials given to them but to be creative.
3. Tell students they should make a rough draft of their posters before beginning actual construction. Be sure
they keep this rough draft to submit as a part of their grade.
Follow-Up1. Have students share their posters with the class.
2. Have students place their posters around the school for viewing.
EXTENSION: Have students conduct a poster contest.
ORIGINAL DEVELOPMENT RESOURCES:Marine debris: Get a grip on it. (l990). Seattle, WA: Marine Advisory Service.
Trashing the oceans. (l988). Washington, DC: Center for Marine Conservation. Video available from: U.S.
Coast Guard, Attn: Sea Partners Supplies, 2100 Second St., S.W., Washington, DC 20593, fax: (202) 267-
In the ocean with Jacques Cousteau. (l986). Danbury Press.
ADDITIONAL RESOURCES:
The Educators Guide to Marine Debris: Southeast and Gulf of Mexico.
http://florida4h.org/projects/marine/files/Marine_debris_guide.pdf
Jacques Cousteau Lesson Plans
http://www.lessoncorner.com/Science/Biology/Marine_Biology/Marine_Biologists/Jacques_Cousteau
66
OBJECTIVE:Students will be able to:
Create a puzzle by gluing pictures of aquatic wildlife and the
types of trash that could be harmful to them to 4 x 6 index
cards that are cut into various shapes and sizes.
BACKGROUND:Responsibility, stewardship, consideration, and caretaker—these
are all words that are important for us to learn if we are to change
what’s happening on the shores and in the waters of our rivers,
lakes, and streams. These beautiful habitats and their wildlife are
being destroyed by the irresponsible and inconsiderate littering
that we do while there. We must remember that we are only
visitors and that the shorelines and waters of streams, rivers, and
oceans are crucial habitats to wildlife as well as being vitally
important to human health and recreation. Have you ever really
noticed the litter as you walk along the shore or wade into the
water of your favorite recreational area? Sometimes things
happen so slowly we don’t notice until it’s too late. Let’s wake
up, put on litter-hunting glasses, and make a change now! Even
alone, we can make a difference. But together WE CAN MAKE
A CHANGE!
VOCABULARY: stewardship, caretaker, habitat, crucial
ADVANCE PREPARATION:1. Gather pictures of litter that might be found near or in the water of a local river, lake, or bay.
2. Cut index cards into puzzle pieces (different sizes and shapes) and construct a small puzzle to use as a
sample.
3. Obtain a video of aquatic wildlife in its habitat.
PROCEDURE:Setting the Stage1. Show a small portion of the video, just enough for the students to get a good visual idea.
2. Have students discuss what type of litter could harm the wildlife seen in the video.
3. Ask two students to go to the board. Have one student write the animal and the other student write the
litter.
Activity1. Divide students into teams or pairs.
2. Explain that the teams are to use the materials you’ve given them to create a puzzle about aquatic wildlife
and the types of litter that can harm wildlife. Show them the sample you made. Instruct students to create
their own puzzles.
3. Allow one class period of about 50 minutes to make the puzzles.
4. Laminate the puzzle pieces before students use with them.
Aquatic Litter Puzzles
Grades:6-8
Subjects: Science, Social Studies, Language Arts
Time Needed: Two-three class periods
Materials: glue
scissors
4 x 6 cards
pictures of trash that could be
dangerous to aquatic wildlife
(Styrofoam, plastic)
video showing aquatic wildlife and
their environment
POLLUTION PREVENTION
67 www.legacyenved.org
Follow-Up1. Have students put their puzzles together.
2. Have students change teams and put each other’s puzzles together.
EXTENSIONS:1. Have students draw their own pictures to put on the puzzle pieces.
2. Have students cut pictures from newspapers and magazines for the puzzle pieces.
ORIGINAL DEVELOPMENT RESOURCES:Braus, J. Marine habitants. (l985). Man and the Gulf of Mexico Series, Jackson, MS: University Press of
Mississippi.
Caduto, M. (l995). Keeper of the earth. Columbus, OH: Prentice Hall.
Ecology. (l993). Columbus, OH: Prentice Hall.
Project WET: water education for teachers.
ADDITIONAL RESOURCES:Castro,P. & Huber,M. (2012). Marine Biology Edition 9
Ecology and the Environment. (2009). Prentice Hall
68
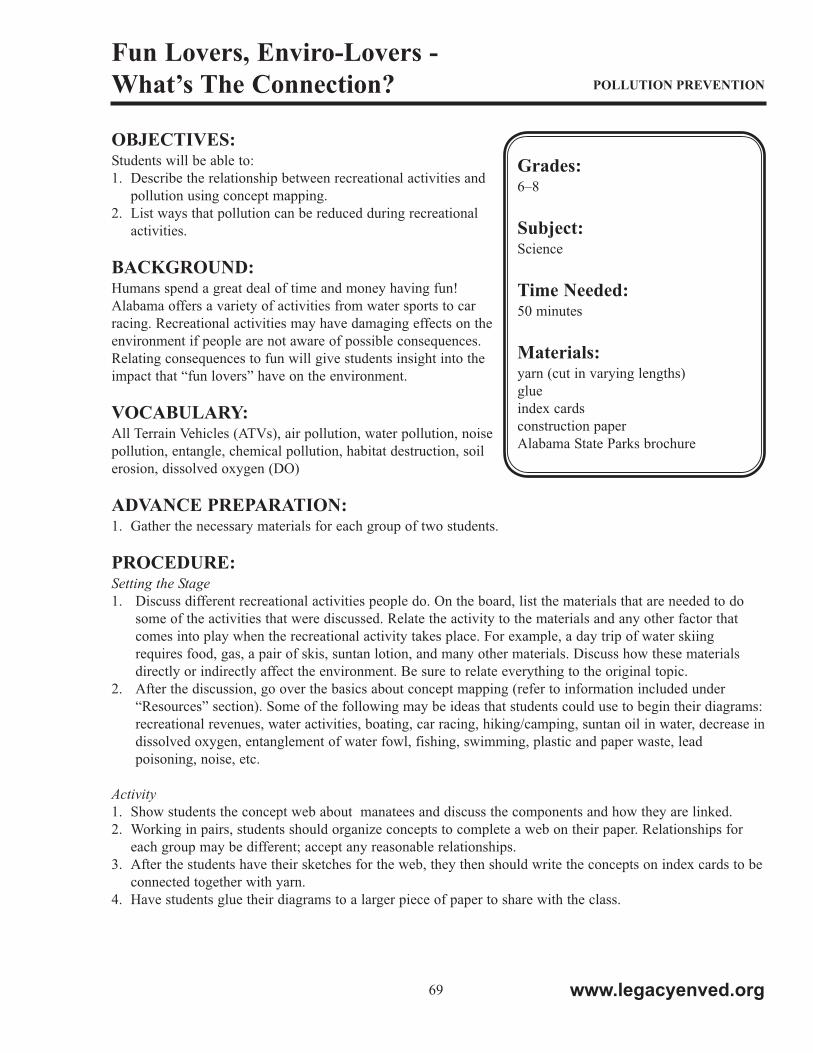
OBJECTIVES:Students will be able to:
1. Describe the relationship between recreational activities and
pollution using concept mapping.
2. List ways that pollution can be reduced during recreational
activities.
BACKGROUND:Humans spend a great deal of time and money having fun!
Alabama offers a variety of activities from water sports to car
racing. Recreational activities may have damaging effects on the
environment if people are not aware of possible consequences.
Relating consequences to fun will give students insight into the
impact that “fun lovers” have on the environment.
VOCABULARY: All Terrain Vehicles (ATVs), air pollution, water pollution, noise
pollution, entangle, chemical pollution, habitat destruction, soil
erosion, dissolved oxygen (DO)
ADVANCE PREPARATION:1. Gather the necessary materials for each group of two students.
PROCEDURE:Setting the Stage1. Discuss different recreational activities people do. On the board, list the materials that are needed to do
some of the activities that were discussed. Relate the activity to the materials and any other factor that
comes into play when the recreational activity takes place. For example, a day trip of water skiing
requires food, gas, a pair of skis, suntan lotion, and many other materials. Discuss how these materials
directly or indirectly affect the environment. Be sure to relate everything to the original topic.
2. After the discussion, go over the basics about concept mapping (refer to information included under
“Resources” section). Some of the following may be ideas that students could use to begin their diagrams:
recreational revenues, water activities, boating, car racing, hiking/camping, suntan oil in water, decrease in
dissolved oxygen, entanglement of water fowl, fishing, swimming, plastic and paper waste, lead
poisoning, noise, etc.
Activity1. Show students the concept web about manatees and discuss the components and how they are linked.
2. Working in pairs, students should organize concepts to complete a web on their paper. Relationships for
each group may be different; accept any reasonable relationships.
3. After the students have their sketches for the web, they then should write the concepts on index cards to be
connected together with yarn.
4. Have students glue their diagrams to a larger piece of paper to share with the class.
Fun Lovers, Enviro-Lovers -
What’s The Connection?
Grades:6–8
Subject:Science
Time Needed: 50 minutes
Materials: yarn (cut in varying lengths)
glue
index cards
construction paper
Alabama State Parks brochure
POLLUTION PREVENTION
69 www.legacyenved.org
EVALUATION:1. Based on concept map consequences for recreational activities, would you recommend that litter or other
environmental laws should be strengthened? Why?
2. List reasonable ways to eliminate some of the possible sources of pollution.
3. Which activity poses the most serious environmental threat? Explain.
4. Knowing that the environment suffers when used for recreation, compile a Do/Don’t guide for several
activities.
5. Recreational activities create litter and other problems that must be corrected. Do you think the economic
revenues made from activities are worth it? Give a rationale for the answer.
6. What about environmental damage prevention through education? How can this be done more effectively?
EXTENSIONS:1. Put concept maps on the bulletin board using pictures to illustrate activities.
2. Research careers related to recreational activities.
3. Locate Alabama State Parks and list each type of recreational activity that may be found there.
ORIGINAL DEVELOPMENT RESOURCES:A concept map is similar to an outline or a flowchart and is a way of representing or organizing knowledge.
Usually, a concept map is divided into nodes and links. Nodes (often circles) represent various concepts; and
links (lines) represent the relationships between concepts. It becomes a visual graphic that represents how the
individual thinks about a subject or topic.
Steps in making a concept map:
Write down major terms or concepts about a topic.
Identify the most general, intermediate, and specific concepts.
Begin drawing the concept map:
Concepts are circled
Place the most general concepts at the top
Place intermediate concepts below general concepts
Put specific concepts on bottom
Draw lines between related concepts
Label the lines with “linking words” to indicate how the concepts are related.
Alabama State Parks brochures and information pamphlets. available by calling 1-800-ALA-PARK or at
http://www.alapark.com/brochures
70
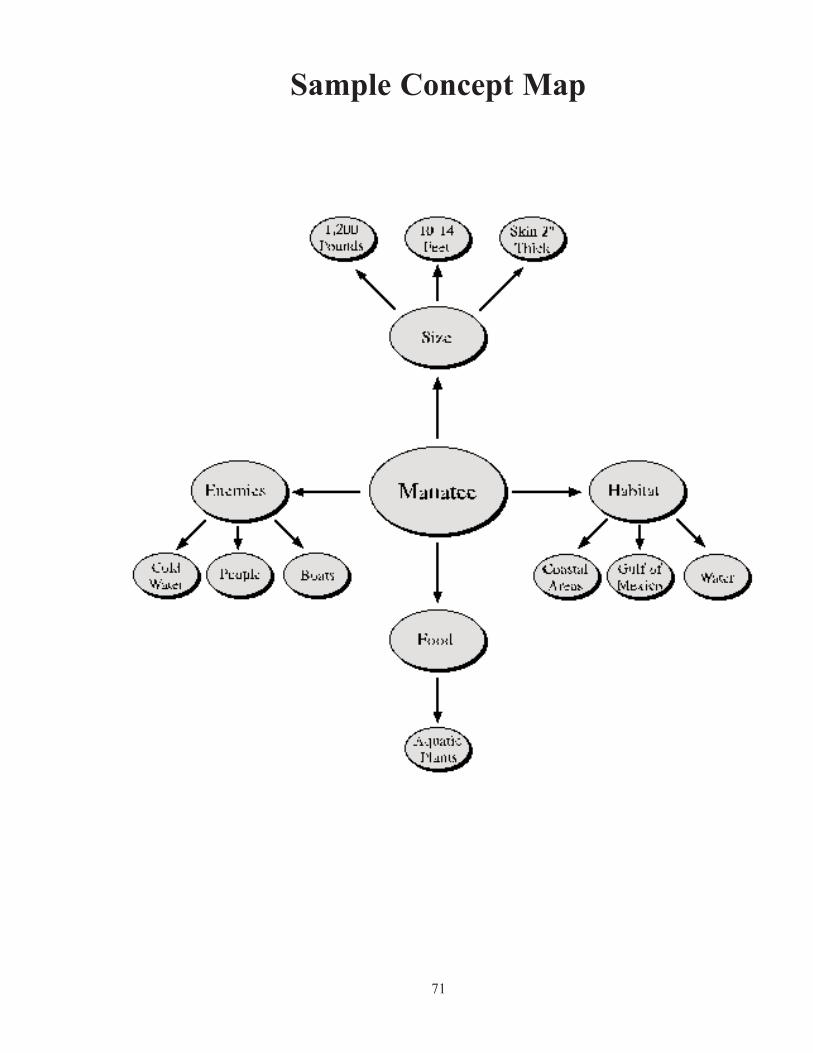
71
Sample Concept Map

Notes
72
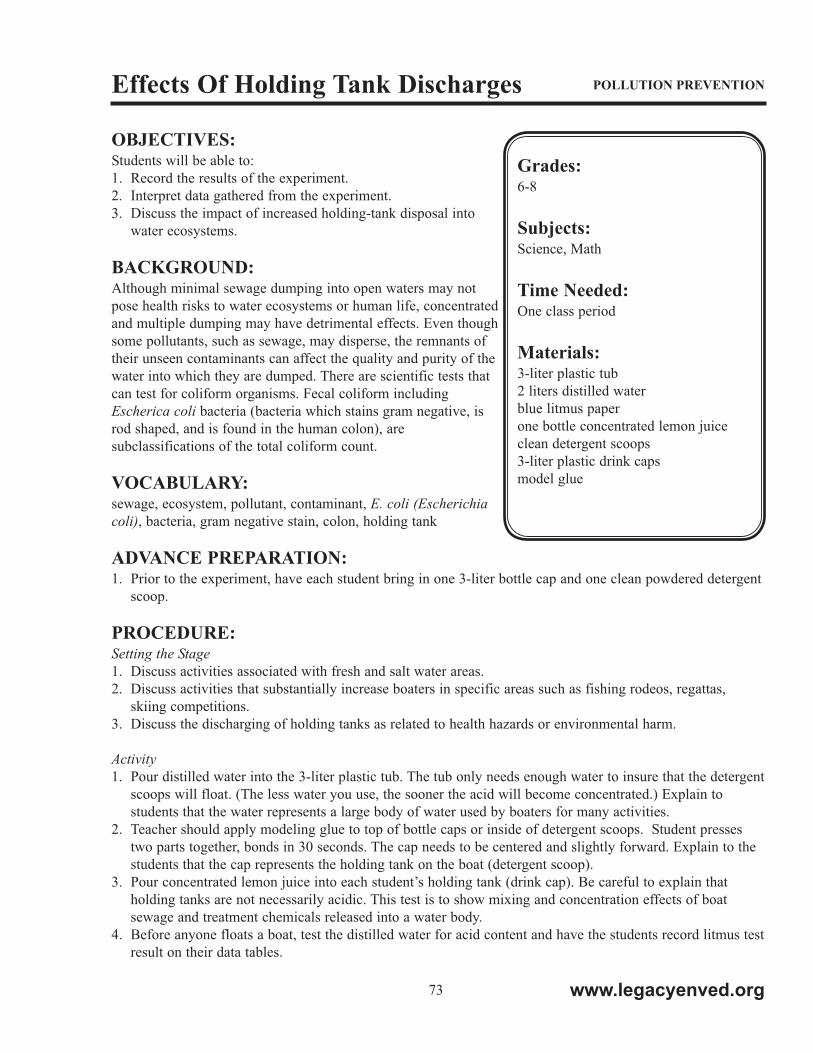
OBJECTIVES:Students will be able to:
1. Record the results of the experiment.
2. Interpret data gathered from the experiment.
3. Discuss the impact of increased holding-tank disposal into
water ecosystems.
BACKGROUND:Although minimal sewage dumping into open waters may not
pose health risks to water ecosystems or human life, concentrated
and multiple dumping may have detrimental effects. Even though
some pollutants, such as sewage, may disperse, the remnants of
their unseen contaminants can affect the quality and purity of the
water into which they are dumped. There are scientific tests that
can test for coliform organisms. Fecal coliform including
Escherica coli bacteria (bacteria which stains gram negative, is
rod shaped, and is found in the human colon), are
subclassifications of the total coliform count.
VOCABULARY:sewage, ecosystem, pollutant, contaminant, E. coli (Escherichiacoli), bacteria, gram negative stain, colon, holding tank
ADVANCE PREPARATION:1. Prior to the experiment, have each student bring in one 3-liter bottle cap and one clean powdered detergent
scoop.
PROCEDURE:Setting the Stage1. Discuss activities associated with fresh and salt water areas.
2. Discuss activities that substantially increase boaters in specific areas such as fishing rodeos, regattas,
skiing competitions.
3. Discuss the discharging of holding tanks as related to health hazards or environmental harm.
Activity1. Pour distilled water into the 3-liter plastic tub. The tub only needs enough water to insure that the detergent
scoops will float. (The less water you use, the sooner the acid will become concentrated.) Explain to
students that the water represents a large body of water used by boaters for many activities.
2. Teacher should apply modeling glue to top of bottle caps or inside of detergent scoops. Student presses
two parts together, bonds in 30 seconds. The cap needs to be centered and slightly forward. Explain to the
students that the cap represents the holding tank on the boat (detergent scoop).
3. Pour concentrated lemon juice into each student’s holding tank (drink cap). Be careful to explain that
holding tanks are not necessarily acidic. This test is to show mixing and concentration effects of boat
sewage and treatment chemicals released into a water body.
4. Before anyone floats a boat, test the distilled water for acid content and have the students record litmus test
result on their data tables.
Effects Of Holding Tank Discharges
Grades:6-8
Subjects:Science, Math
Time Needed:One class period
Materials:3-liter plastic tub
2 liters distilled water
blue litmus paper
one bottle concentrated lemon juice
clean detergent scoops
3-liter plastic drink caps
model glue
POLLUTION PREVENTION
73 www.legacyenved.org
5. Have the students come to the tub in groups of four. Have the group float its boats and then dump its
holding tanks. Test the water for the acid content after each group.
6. After each litmus test, have the students record the results. Be sure that when the students set up their data
tables, they include a column showing how many boats have dumped their holding tanks.
7. Continue the activity until the blue litmus paper indicates an acid content.
Follow-Up1. Students should discuss their observations.
2. Students should discuss the correlation between actual holding tank disposal and their lemon juice holding
tanks.
3. Students should answer the following questions:
• Should holding tank disposal into open waters be allowed?
• What alternatives could be developed or modified to combat this problem?
• As the population increases and waterways become more crowded, what type of impact will
this have on the environment?
EXTENSION:1. Call local marinas and ask how many dumping or pump-out stations are available in respect to the number
of boats moored at the marina. Discuss with the marina personnel whether there are periods of heavy
boating activity when the dumping or pumpout stations are filled to capacity or cannot accommodate all
the boats. When do such periods occur?
2. Invite a speaker from the Alabama Department of Environmental Management to speak to the class about
the Clean Vessel Act and/or pumpout stations.
ORIGINAL DEVELOPMENT RESOURCES:The Clean Vessel Act of 1992 (Pub. L. 102-587, subtitle F).
Alabama Department of Environmental Management, P.O. Box 301463, Montgomery, AL 36130,
www.adem.state.al.us
www.epa.gov/owow/nps/marinas
74
OBJECTIVES:Students will be able to:
1. Determine which substances are biodegradable.
2. Interpret data from an investigation.
BACKGROUND: Waste can pollute the air, water, or land. Waste is found on the
land on which we grow food and build our homes. You can taste,
smell, see, or hear pollutants. Other pollutants cannot be detected
by our senses. These usually can be detected by scientific
instruments. Many pollutants can be broken down by living
organisms. These pollutants are called biodegradable. Materials,
such as glass, metal, plastic, and certain chemicals, can remain in
the environment for hundreds of years; they are
nonbiodegradable.
VOCABULARY:biodegreadable, nonbiodegradable, organic, inorganic, pollution,
pollutants, environment, organism
ADVANCE PREPARATION:1. On the day before the investigation, have students bring in
fallen leaves, not fresh ones picked from a growing plant. Ask
the school cafeteria for organic waste material (fruit or vegetable peelings). Collect plastic milk cartons
and plastic foam packing materials that are used in shipping cartons.
PROCEDURE:Setting the Stage1. Discuss the difference between biodegradable and nonbiodegradable.
2. Discuss the terms “organic” and “inorganic” materials.
Activity1. Divide the students into teams and have each team do the following:
• Obtain two clay flowerpots. Put a layer of sand and then a layer of gravel in the two pots. Next fill the
pots with regular soi to within 1.5 cm of the top.
• In one of the clay pots, place a 2 cm square of newspaper, a leaf, a 2 cm square of fruit peel, and a 2 cm
of vegetable peel on top of the soil.
• In the other pot, place a 2 cm square of thick plastic, a 2cm square of plastic bag, a 2 cm square of
aluminum foil, and a 2 cm square of plastic foam on the soil.
• Cover the pots with the petri dishes or use plastic food wrap and rubber bands. Make sure the dish fits
tightly over the top of each flowerpot.
• Place each pot in an aluminum pie pan. Add a little water to the pan. The water will rise through the
hole in each pot to keep the inside moist.
2. Observe the two pots every other day for a month. Record the observations on the chart as relates to which
materials biodegraded and which did not.
Biodegradable Substances
Grades:6-8
Subjects: Science, Language Arts
Time Needed: One class period first day, 5 minutes
every other day for a month
Materials: 2 small clay flowerpots per team
2 petri dish lids to fit clay pots
sand, gravel
regular soil
2 aluminum pie pans
plastic food wrap, rubber bands,
organic waste material, plastic mild
cartions and packing foam
POLLUTION PREVENTION
75 www.legacyenved.org
EVALUATION:1. Students should discuss their findings.
2. Students should answer the following questions:
• Which substances were biodegradable? nonbiodegradable?
• Did any substances decompose? To what degree?
• Did you observe any organisms? If so, how did they cause a change?
EXTENSIONS:1. Using plastic gloves, examine the classroom trash can. Have students discuss the biodegradable and
nonbiodegradable materials and the way the class can reduce the amount of trash in the classroom.
2. Do research on biodegradability of substances in landfills, expecially ones which are capped to keep water
from entering the landfill.
ORIGINAL DEVELOPMENT RESOURCES:Focus on life science. (1989). Columbus, OH: Merrill.
76
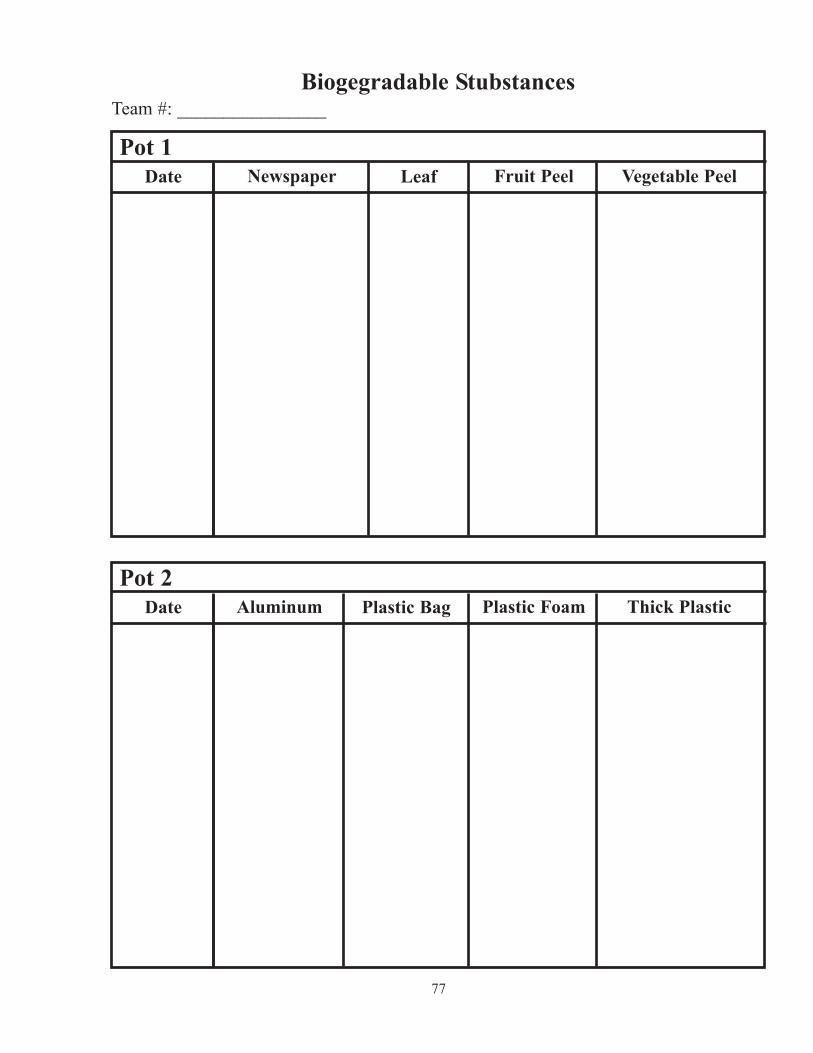
Pot 1
77
Date Newspaper Leaf Fruit Peel Vegetable Peel
Pot 2
Date Aluminum Plastic Bag Plastic Foam Thick Plastic
Biogegradable StubstancesTeam #: ________________

Notes
78
OBJECTIVES: Students will be able to:
1. Collect pollutants.
2. Compare samples of air pollutants.
3. Determine how air pollution can be controlled.
BACKGROUND: Machines that people use, such as cars, trucks, and factory
engines, produce smog that combines with the atmosphere. This
type of air pollution is caused by impurities in the air. Also,
materials, such as lint, soot, pollen, and dust, can be found in the
air we breathe. Over the last 20 years, city, county, state, and
federal agencies have begun to set standards to reduce air
pollution. New cars must be equipped with catalytic converters,
and factories have had to update their pollution control devices.
The process of air pollution control will continue to be an ever-
increasing factor in the years to come due to an ever-increasing
world population growth.
VOCABULARY:pollution, smog, pollutant, soot, impurities, toxic gas, acid rain
ADVANCE PREPARATION:1. Review the process of estimating (math).
2. Discuss the concept of air pollution by using pictures (see “Resources” section).
PROCEDURE:Setting the Stage1. Discuss air pollution as it relates to a city’s population. Example: Mobile, AL, versus Atlanta, GA, or Los
Angeles, CA, versus Dallas, TX. Relate these cities to your own city. Which has more air pollution? Why?
2. Set up the lab with all the materials necessary to carry out the investigation.
Activity1. Select four places (some inside, some outside) where you will sample the air for pollutants.
2. Label the slides with the masking tape, putting the location and one of the team member’s initials.
3. Use the tongue depressor to spread a thin coat of petroleum jelly on the slides (teacher should
demonstrate).
4. Place the slides at the selected areas. Leave there for at least 24 hours.
5. Observe the slides with a hand lens and a microscope. Look for particles such as soot, pollen, lint, dust.
6. Construct a table like the following one and record the team’s observations and data. Draw pictures of the
various particles as they look under the microscope.
7. Estimate the number of particles on each slide and record the results.
Breathing Air Pollution
Grades:6-8
Subjects: Science, Math, Art
Time Needed: Two days, 2 class periods
Materials: glass slides (4 per team)
petroleum jelly
tongue depressors or small spatulas
masking tape
hand lens
microscope
POLLUTION PREVENTION
79 www.legacyenved.org
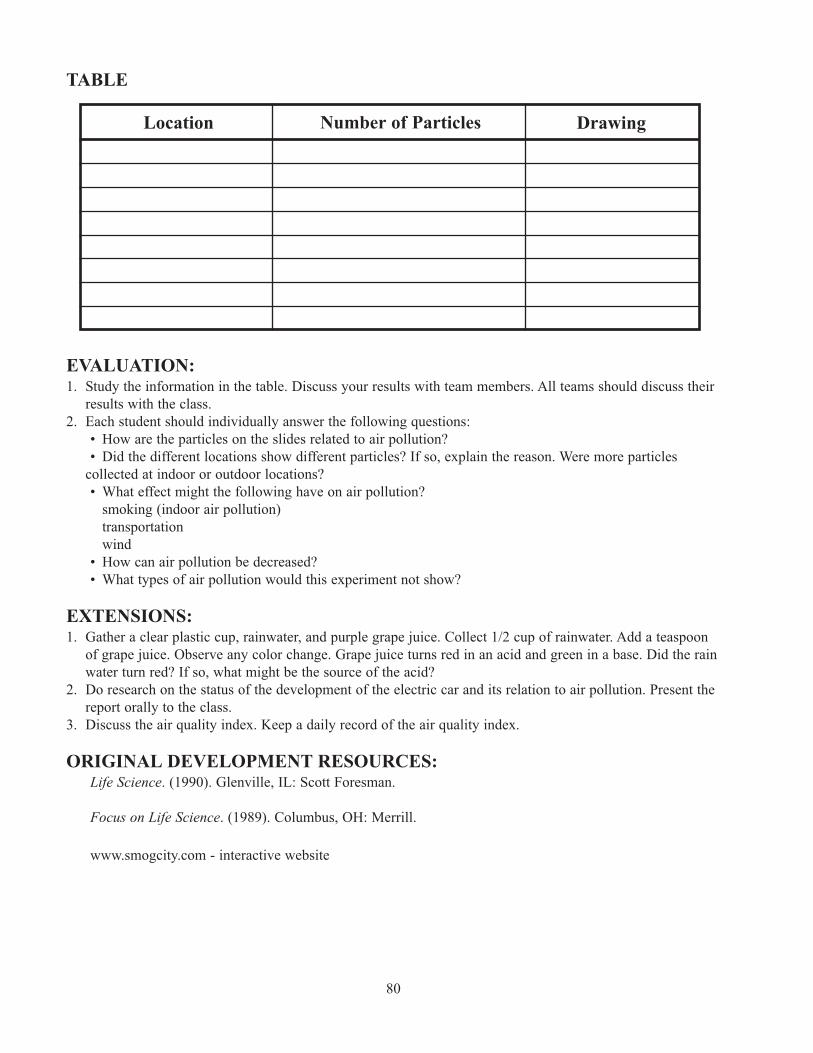
TABLE
EVALUATION:1. Study the information in the table. Discuss your results with team members. All teams should discuss their
results with the class.
2. Each student should individually answer the following questions:
• How are the particles on the slides related to air pollution?
• Did the different locations show different particles? If so, explain the reason. Were more particles
collected at indoor or outdoor locations?
• What effect might the following have on air pollution?
smoking (indoor air pollution)
transportation
wind
• How can air pollution be decreased?
• What types of air pollution would this experiment not show?
EXTENSIONS:1. Gather a clear plastic cup, rainwater, and purple grape juice. Collect 1/2 cup of rainwater. Add a teaspoon
of grape juice. Observe any color change. Grape juice turns red in an acid and green in a base. Did the rain
water turn red? If so, what might be the source of the acid?
2. Do research on the status of the development of the electric car and its relation to air pollution. Present the
report orally to the class.
3. Discuss the air quality index. Keep a daily record of the air quality index.
ORIGINAL DEVELOPMENT RESOURCES:Life Science. (1990). Glenville, IL: Scott Foresman.
Focus on Life Science. (1989). Columbus, OH: Merrill.
www.smogcity.com - interactive website
Location Number of Particles Drawing
80
OBJECTIVES: Students will be able to:
1. Write a well-organized play and perform it based on the
“Captain Planet” environmental cartoon on TBS.
2. Compose music for the play.
3. Design a set for the play.
4. Create a script for the play.
5. Analyze their performance and production.
BACKGROUND: “Captain Planet” is a popular cartoon on TBS. “Earth, Wind, Fire,
Water, and Heart” are the powers of the rings that call Captain
Planet to save our Earth when the planeteers find themselves
overwhelmed with environmental pollution. The planeteers are
led by Gyana, the spirit of Mother Earth. The planeteers fight evil
polluters such as “Sludge.” In a 1995 production of “Captain
Planet,” the planeteers take a trip down the Mississippi Delta in
search of the causes of pollution in the river. They find that
industries are dumping waste directly into the Mississippi River.
Sickness and contamination control the areas along the river bed.
The planeteers pretend to be Huck Finn on his raft going down
the mighty Mississippi. Fishing, boating, swimming, skiing,
shrimping, crabbing, or even crawdad catching are not permitted
because of the pollution in the river. Of course “Captain Planet”
is called from the power of the rings and saves the Mississippi.
His last statement to all is, “The power is yours!”
VOCABULARY:contaminant
ADVANCE PREPARATION:1. If the students have not seen “Captain Planet,” rent some tapes from the video store. Try to locate the
video about Huck Finn/Planeteers “Who’s Dumping Chemicals on My Catfish?”
2. It would be helpful to the writing of the play for students to read Huck Finn and The Adventures of TomSawyer.
3. Students also enjoy learning the “Captain Planet” song. What better way to learn how to present a message
to others about protecting our water than by having fun doing it?
PROCEDURE:Setting the Stage1. Watch “Captain Planet” videos.
2. Divide into groups of three to five students. Give each group an assignment:
Producers of the play, Art directors, Script writers, Editors, Camera persons, Set directors, Music directors
(vocal and instrumental), Stage hands/props, Schedule directors/agents.
Who’s Dumping Chemicals On
My Catfish?
Grades:6-8
Subjects: Science, Art, Music, Drama, Language
Arts
Time Needed: Three 50-minute classes during school
plus rehearsals after school
Materials: “CAPTAIN PLANET” videos
writing materials
video camera
blank videos
stage to perform
play props based on play script and
music
costumes
five rings
POLLUTION PREVENTION
81 www.legacyenved.org
Activity1. Begin to write the play script based on “Captain Planet” cartoons.
2. Edit and research environmental issues.
3. Once the theme of the script has been chosen and enough information has been collected, the music and
stage preparations should begin.
4. Rehearse, rehearse, rehearse.
Follow-Up1. A video should be made of the play.
2. Students in the class should critique the play after watching the video.
3. If the play is considered a success, plans for a live performance should be made.
EXTENSIONS:1. Contact the local actors guild and share your play.
2. If the drama and music classes will participate, new themes can be produced and added.
ORIGINAL DEVELOPMENT RESOURCES:Turner Broadcasting System (TBS) “CAPTAIN PLANET” cartoon. “Who’s Dumping Chemicals on My
Catfish?” (1995). www.captainplanetfdn.org
ADDITIONAL RESOURCES:Captain Planet Foundation - http://www.captainplanetfoundation.org
82
OBJECTIVES:Students will be able to:
1. Describe and analyze data.
2. Make decisions regarding phosphates in detergents.
BACKGROUND:In recent years, some detergent companies have made advertising
claims such as “Contains no phosphates” or “Low in
phosphates.” What are phosphates, and what is all the fuss about?
If they are so bad, then why have they been used in detergents? If
they are in detergents, then how can they lead to water pollution?
Compounds containing phosphate ions usually are associated
with the need for high-energy compounds such as detergents and
fertilizers. Phosphates have been used to improve the cleaning
ability of detergents as well as to enhance the sudsing ability. We
have associated “lots of suds” with the ability to clean. Now the
makers of detergents are trying to sell their products based on
their low or no phosphate content.
What do excess phosphates do to the environment? When the
water leaves your house, so do cleaning compounds, which then
enter the ecosystem. Excessive use of phosphates can contribute
to an environmental problem known as an “algal bloom.” When
this occurs, the algae undergo a population explosion until the
body of water is covered. Sunlight cannot penetrate deeply into the water. The oxygen supply can be depleted,
which could lead to the “death of the lake.” This activity will allow students to research the source of these
phosphates, survey consumer knowledge, and evaluate the impact of phosphates on water systems.
VOCABULARY:
phosphates, algal bloom
PROCEDURE:Setting the Stage1. Inform students how to collect data, how to devise a survey instrument, how to compile and interpret data
into graphs and tables, and how to present their findings to the class and compare the results from each
group.
Activity1. After discussing the background, assign students to work in groups to compile data about detergents and
phosphate amounts as well as the advertising claims of each product such as “free of phosphates.”
2. Students need to collect data from both laundry detergents and dishwasher detergents. Predetermine the
minimal number they must examine.
3. Students should then compile data in table and graph form. (A bar graph would work well.)
4. Have students design a survey form or questionnaire asking 25 people (different families) their choice of
laundry and dishwasher detergent, the reason they chose the product, if they are aware of the effect of
excessive use of phosphates, and whether they would change if their current choice were high in
phosphates.
Cleaner Clothes -
Cleaner Environment?
Grades:6-8
Subjects:Ecology, Chemistry, Biology
Time Needed: At least one 50-minute class period.
Class time will be needed to
introduce the background and set
the stage. Most of the work will be
done out of class as a project.
Materials: examples of various detergents (dish
and laundry)
survey form for consumers (student
developed)
water analysis kits (if water survey is
conducted)
POLLUTION PREVENTION
83 www.legacyenved.org
5. Students should then analyze their data and draw conclusions.
6. Have students compare the data from consumers to see if any relationships exist among choices and
phosphate content.
EVALUATION: 1. Each group should turn in a report of its conclusions.
EXTENSIONS:1. Students may want to analyze water from upstream or downstream of their town’s waste water treatment
plant(s).
2. Students may bring in samples of surface waters and add different detergents to each subsample to see if
there are differences in algal growth among samples with different detergents.
3. Students then (optional) can analyze water from local water systems for phosphate content and algal
growth. The data can be compared with choice of detergents and conclusions can be drawn.
ORIGINAL DEVELOPMENT RESOURCES:
www.phophatefacts.org
84
OBJECTIVES:Students will be able to:
1. Find out the best way to clean up an oil spill.
2. Analyze and interpret data obtained by doing an investigation.
BACKGROUND:In the last 20 years, more and more oil spills have occurred in the
world’s oceans. Each occurrence has a major impact on the
oceans’ ecosystems. Clumps of oil that have hardened are found
in all major bodies of water. Tankers and offshore oil wells
produce oil spills that cause major problems for water animals.
Many different types of fish and birds, such as loons, are killed
when oil spills occur. Some animals are killed by the chemicals
found in the oil; others are smothered by the oil. The process of
cleaning up an oil spill is very costly and usually is not very
effective. In some cases, bacteria are used to break down oil to
help with cleaning up an oil spill. Other methods are being tested,
and scientists are continuing research to combat this world-wide
problem.
VOCABULARY:pollution, ecosystem, biodegradable
ADVANCED PREPARATION:1. Collect enough sets of the materials so that the class can be
grouped into teams of 3 or 4 students.
PROCEDURE:Setting the Stage1. Discuss the ever-increasing problem of oil spills. Have students do research on the Alaskan oil spill. Have
a debate on the major issues.
Activity1. Divide the class into teams. Have each team complete the following:
• Label the 3 petri dishes “A,” “B,” and “C.”
• Put 10 mL of water into each petri dish.
• Add 10 drops of motor oil to each dish.
2. Attempt to remove the motor oil from each dish by doing the following:
• Try to remove the oil in dish “A” by using the flour, cotton, and ice as follows:
Flour - Sprinkle flour on surface of water. Use a paper towel to skim the surface of the water to collect the
oil.
Cotton - Skim the surface of the water with cotton to collect the oil.
Ice - Hold ice with tongs and skim the surface of the water to collect the oil.
• Try to remove the oil in dish “B” by using the plastic foam cups, baking soda, and grass as follows:
Foam cups - Skim the surface of the water with the cups to collect the oil.
Baking soda - Sprinkle the surface with baking soda. Use a paper towel and skim the surface of the water
to collect the oil.
Cleaning An Oil Spill
Grades:6-8
Subjects: Science, Language Arts
Time Needed: One class period
Materials: 3 petri dishes
graduated cylinder
water
motor oil
medicine dropper
plastic foam cups
baking soda
grass
paper towels
liquid detergent
flour
ice
cotton
POLLUTION PREVENTION
85 www.legacyenved.org
Grass - Sprinkle the surface with grass clippings. Use a paper towel and skim the surface of the water to
collect the oil.
• Try to remove the oil in the last dish by using the medicine dropper, paper towels, and the detergent.
Medicine dropper - Place the tip of the dropper just on the surface of the water and suck up the oil.
Paper towels. Place the paper towel on the surface of the water and let sit for a minute. Remove the paper
towel.
Detergent - Put two drops of a liquid detergent in the dish and wait one minute. Use a paper towel and
skim the surface of the water to collect the oil.
EVALUATION:1. Have each team discuss its findings. Then answer the following questions:
• Which materials did the best job in removing the oil?
• Which materials did the worst job in removing the oil?
• What materials would you use if you were put in charge of removing an oil spill in the ocean?
• What negative consequences could there be in the ocean from the materials used to clean up the oil
spill?
EXTENSIONS:1. Have students write a story from the point of view of an animal that has been caught in an oil spill.
2. Collect news articles about oil spills around the world. Rate each as to its effect on the environment.
ORIGINAL DEVELOPMENT RESOURCES:
Life Science. (1989). Menlo Park, CA: Addison-Wesley.
86
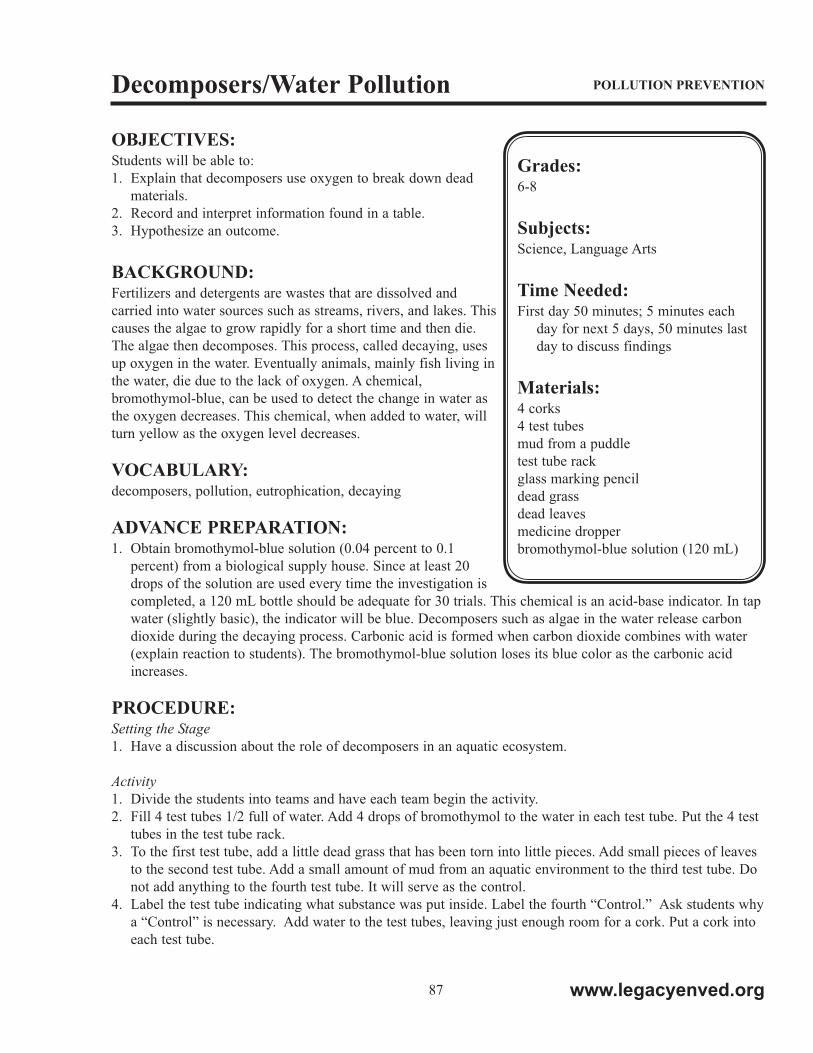
OBJECTIVES:Students will be able to:
1. Explain that decomposers use oxygen to break down dead
materials.
2. Record and interpret information found in a table.
3. Hypothesize an outcome.
BACKGROUND:Fertilizers and detergents are wastes that are dissolved and
carried into water sources such as streams, rivers, and lakes. This
causes the algae to grow rapidly for a short time and then die.
The algae then decomposes. This process, called decaying, uses
up oxygen in the water. Eventually animals, mainly fish living in
the water, die due to the lack of oxygen. A chemical,
bromothymol-blue, can be used to detect the change in water as
the oxygen decreases. This chemical, when added to water, will
turn yellow as the oxygen level decreases.
VOCABULARY: decomposers, pollution, eutrophication, decaying
ADVANCE PREPARATION:1. Obtain bromothymol-blue solution (0.04 percent to 0.1
percent) from a biological supply house. Since at least 20
drops of the solution are used every time the investigation is
completed, a 120 mL bottle should be adequate for 30 trials. This chemical is an acid-base indicator. In tap
water (slightly basic), the indicator will be blue. Decomposers such as algae in the water release carbon
dioxide during the decaying process. Carbonic acid is formed when carbon dioxide combines with water
(explain reaction to students). The bromothymol-blue solution loses its blue color as the carbonic acid
increases.
PROCEDURE:Setting the Stage1. Have a discussion about the role of decomposers in an aquatic ecosystem.
Activity1. Divide the students into teams and have each team begin the activity.
2. Fill 4 test tubes 1/2 full of water. Add 4 drops of bromothymol to the water in each test tube. Put the 4 test
tubes in the test tube rack.
3. To the first test tube, add a little dead grass that has been torn into little pieces. Add small pieces of leaves
to the second test tube. Add a small amount of mud from an aquatic environment to the third test tube. Do
not add anything to the fourth test tube. It will serve as the control.
4. Label the test tube indicating what substance was put inside. Label the fourth “Control.” Ask students why
a “Control” is necessary. Add water to the test tubes, leaving just enough room for a cork. Put a cork into
each test tube.
Decomposers/Water Pollution
Grades:6-8
Subjects: Science, Language Arts
Time Needed: First day 50 minutes; 5 minutes each
day for next 5 days, 50 minutes last
day to discuss findings
Materials: 4 corks
4 test tubes
mud from a puddle
test tube rack
glass marking pencil
dead grass
dead leaves
medicine dropper
bromothymol-blue solution (120 mL)
POLLUTION PREVENTION
87 www.legacyenved.org
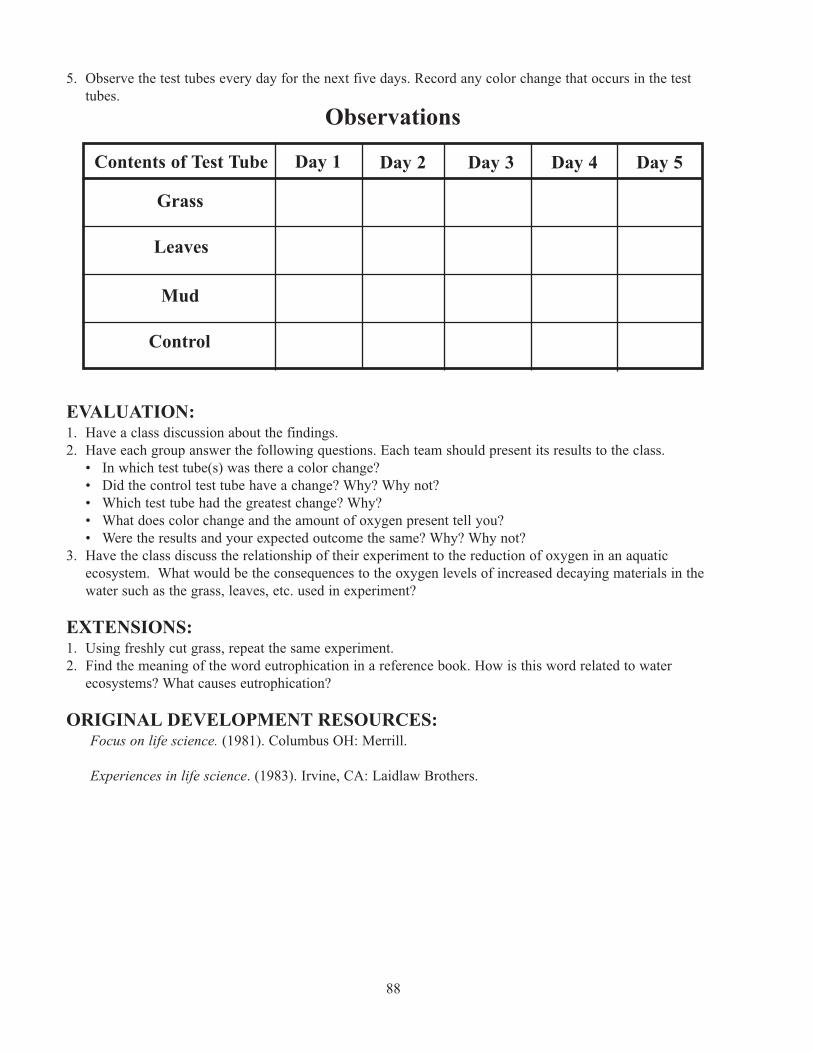
5. Observe the test tubes every day for the next five days. Record any color change that occurs in the test
tubes.
Observations
EVALUATION:1. Have a class discussion about the findings.
2. Have each group answer the following questions. Each team should present its results to the class.
• In which test tube(s) was there a color change?
• Did the control test tube have a change? Why? Why not?
• Which test tube had the greatest change? Why?
• What does color change and the amount of oxygen present tell you?
• Were the results and your expected outcome the same? Why? Why not?
3. Have the class discuss the relationship of their experiment to the reduction of oxygen in an aquatic
ecosystem. What would be the consequences to the oxygen levels of increased decaying materials in the
water such as the grass, leaves, etc. used in experiment?
EXTENSIONS:1. Using freshly cut grass, repeat the same experiment.
2. Find the meaning of the word eutrophication in a reference book. How is this word related to water
ecosystems? What causes eutrophication?
ORIGINAL DEVELOPMENT RESOURCES:Focus on life science. (1981). Columbus OH: Merrill.
Experiences in life science. (1983). Irvine, CA: Laidlaw Brothers.
88
Contents of Test Tube Day 1
Grass
Leaves
Mud
Control
Day 2 Day 5Day 4Day 3
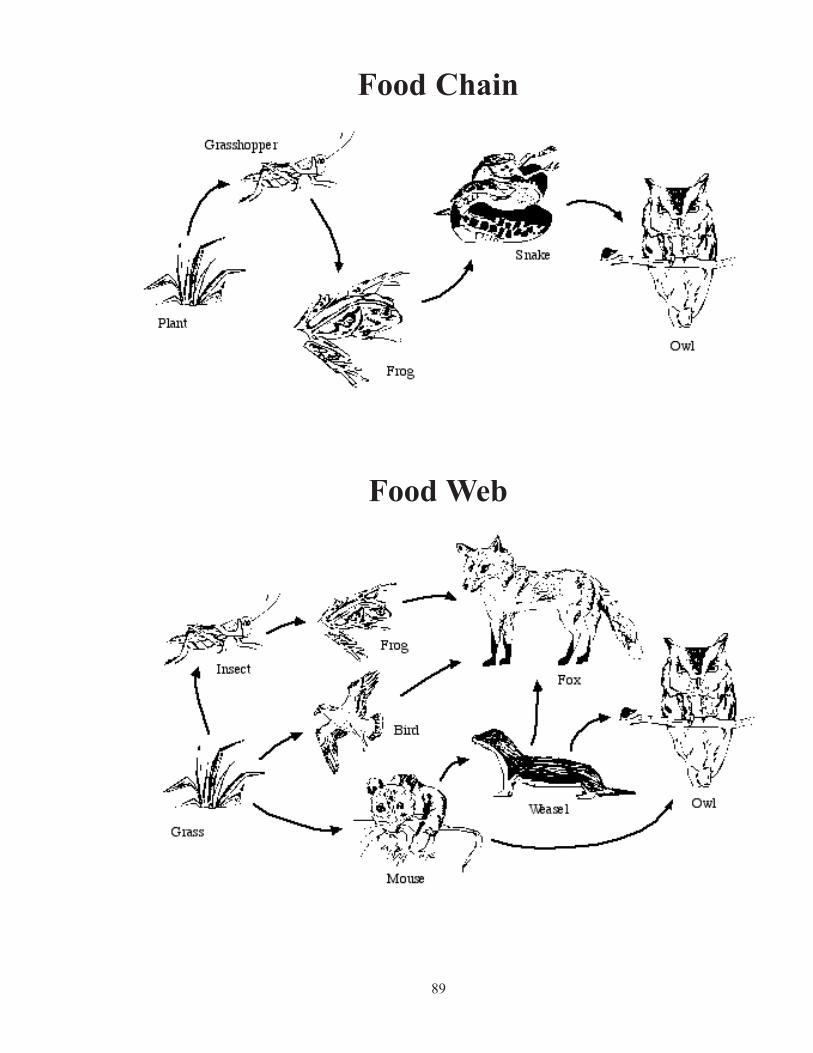
89
Food Chain
Food Web
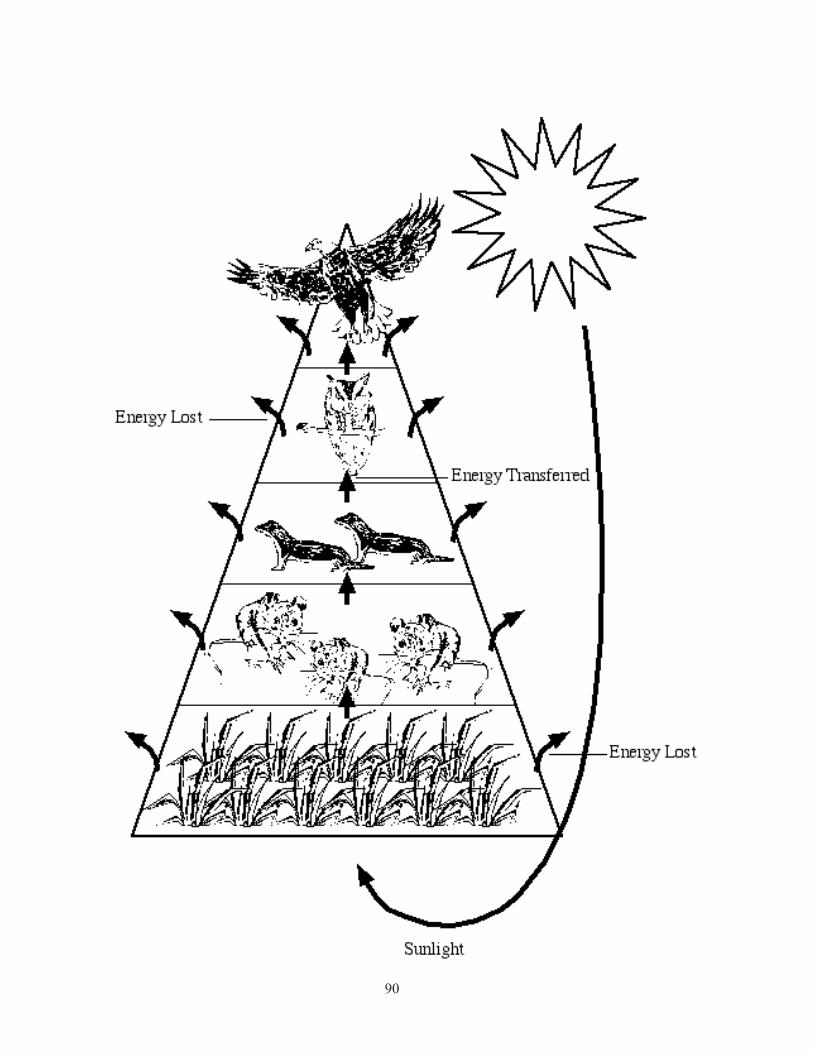
90
OBJECTIVES: Students will be able to:
1. Explain the process of dilution.
2. Explain that toxic materials do not disappear when diluted
in a large amount of water.
3. Describe the event demonstrated using these key words:
pollution, dilution, and concentration.
BACKGROUND:The environmental effects caused by the by-products of human
activity, principally industrial and agricultural processes (noise;
smoke; automobile emissions; chemical and radioactive materials
in the air, seas, and rivers; pesticides; radiation; sewage) and
household wastes, are called pollution. Pollutants may enter the
food chain and may be passed on from one organism to another.
They frequently are harmful and may cause additional damaging
developments. Many industries dump their chemical wastes into
nearby waterways. Soon this polluted water reaches the sea
where it becomes highly diluted. It has been suggested that
dilution on a large scale will destroy the highly toxic materials
and the dangers that are associated with them.
VOCABULARY: pollution, dilution, concentration
ADVANCE PREPARATION:1. Gather enough materials for groups of four.
2. Fill liter bottles with enough water for the activity. Three liters should be enough.
PROCEDURE:Setting the Stage1. Discuss the effects of pollution. Ask them to describe ways in which pollution can be controlled or
stopped.
Activity1. Give students (in groups of four) a beaker (jar).
2. Have students pour water into the jar until it is half full.
3. Using a medicine dropper, drop one drop of food coloring into the water.
4. Using a straw, stir until all the food coloring has been evenly distributed throughout the water.
5. Make observations.
6. Using a clean dropper, put a drop of the diluted food coloring on a clean white handkerchief, square piece
of white material, or white paper towel.
7. Put the square on a flat surface and leave overnight to allow the water to evaporate.
8. Once the cloth dries, make observations again.
Dilution To The Solution of Pollution?
Grades: 6-8
Subject: Physical Science
Time Needed: 35 minutes
Materials: beaker (jar)
water
food coloring
2 medicine droppers
white cloth or white paper towel
straw
POLLUTION PREVENTION
91 www.legacyenved.org
EVALUATION:1. The next day the students should observe the aspects of the activity closely for evidence of what happened
to the colored material. Have them report their observations and answer the following:
• What happened to the food coloring dropped in the water?
• Did the color fade? Why?
• What happened to the spot on the cloth?
• Describe what happened to the “pollution.”
• Predict what would happen if the food coloring were a chemical.
• Would the chemical (represented by the food coloring) have a harmful effect on fish?
EXTENSIONS:1. Have the students investigate how industries dumping their chemical wastes in the sea is harmful.
2. Try the same experiment with different amounts of food coloring compared to the amount of water.
ORIGINAL DEVELOPMENT RESOURCES:Allen, D. (1988). Science demonstrations. New York: Parker Publishing Company.
Morgan, S. (1995). Ecology and environment. New York: Oxford University Press.
92
OBJECTIVES: Students will be able to:
1. Explain the importance of soil moisture to the growth of
crops.
2. Show how an increase in temperature affects soil moisture.
3. Explain how an increase in yearly air temperature could affect
plant growth.
4. Graph the differing rates of soil moisture loss induced in the
experiment.
BACKGROUND:When carbon dioxide and other “greenhouse” gases are added to
the atmosphere, a major result may be the gradual rise in the
average temperature of the Earth. As the air temperature rises,
more water evaporates from the ground surface; and the amount
of water vapor in the atmosphere increases. When the amount of
water vapor in the atmosphere increases, the amount of
precipitation from the atmosphere also increases.
Higher evaporation rates and changing atmospheric circulation
patterns could mean a 7 to 11 percent increase in precipitation in
some areas of the world. However, the high evaporation rates resulting from warmer temperatures also
could mean other parts of the world might suffer from decreased soil moisture and, consequently, decreased
plant growth. Some computer models suggest that such drought conditions could be experienced by the rich
agricultural areas of the North American mid-section if the average temperature of the Earth increases.
VOCABULARY:carbon dioxide, greenhouse gases, evaporate
PROCEDURE:Setting the Stage1. Brainstorm with the students about what environmental conditions should be considered when deciding
what kinds of crops to grow. Note: Students should mention the amount of moisture, the available pattern
of moisture (spring and fall: rainy; summer: dry), the average high and low temperatures, and the
temperature patterns.
Activity1. Label the pans #1 and #2.
2. Fill the pans with equal amounts of potting soil. (You may want to weigh soil-filled pans to make sure they
are the same.)
3. Add equal amounts of water (approximately 350 mL) to each pan, and mix to make sure all the soil is wet.
Soil should be moist to the touch, but it should not be saturated with water to the point Of seeing water
glistening on the surface. If you need more water, add the same amount to each pan.
4. Make the following initial readings for each pan, and have the students record the information on the data
sheet.
• Soil temperature reading: insert thermometer in middle of pan about 1” deep, wait 3 minutes, and read.
• Soil moisture reading: weigh pan precisely.
Dry Land/Hot Land
Grades:6-8
Subjects:Science, Math
Time Needed: Two class periods
Materials: two identical pans (2” deep, 13” x 9”)
10 lb. bag of potting soil (well mixed)
adjustable lamp with 100-watt bulb
balance or scale
Celsius thermometer
student sheet (included)
POLLUTION PREVENTION
93 www.legacyenved.org
5. Place the pans in two different places. Place Pan #1 at a location in the room where it will remain at room
temperature and where there is no direct light.
6. Place a 100-watt light 8 to 12 inches directly above Pan #2. Maintain the soil temperature at 2 to 3
degrees Celsius above room temperature. Once you have determined how high to keep the light, do not
move it around.(Note: The temperature readings should remain relatively constant after the first reading or
two. However, students may note a slight increase in temperature in the warmer pan as it dries. They
should not move the pan. Less moisture means less evaporative cooling, and the temperature rises. This
demonstrates the interaction between temperature and moisture that must be considered in predicting the
climate.)
7. Take soil temperature readings, and weigh pans as directed in step 4 every hour or so during the school day
or until the soil is very dry to the touch. Remind the students to record the time at every reading. (You may
need to record the information on the chalkboard or chart and allow them to transfer it to their data sheets
later.)
EVALUATION:1. Ask the students to construct a chart showing the time of each reading (number of hours from first
reading), the weight of the soil, and the soil temperature at each time. (Note: Since weight is used as a
measure of soil moisture, they should understand that decreasing weight means less moisture.)
2. Have the students draw graphs of soil weight versus time at both room temperature (Pan #1) and 2 to 3
degrees Celsius higher than room temperature (Pan #2). The graphs should be drawn on the same axis so
students can compare easily.
3. Have the students write 1 to 3 paragraphs comparing the results in Pan #1 and Pan #2 using the graphs.
What conclusions can be drawn about the broader climate and Earth’s surface?
EXTENSIONS:1. Try elevating the temperature of Pan #2 to 8 to10 degrees Celsius above room temperature and repeat the
experiment. (Note: Two lamps can be used here. Moving one lamp much closer will then heat up only
one part of the soil in the pan rather than all the soil in the pan.)
2. Discuss the effects on soil moisture and agriculture if precipitation decreases and temperatures rise in some
areas and precipitation increases in other areas.
3. Have the students go to the library and look for models that predict areas that would be affected by loss of
soil moisture.
4. Have the students identify on a map of their area where agriculture is a major industry and discuss what
would be the consequences if the land in those agricultural areas were to become dryer and hotter.. You
may wish to contact your local agricultural extension agency or check with a school system agriculture
teacher.
5. Have students research the identity, sources, and effects of “greenhouse gases.”
ORIGINAL DEVELOPMENT RESOURCES:Brown, L. (1990). State of the world. Washington, DC: Worldwatch Institute.
Hayes, D. (1979). Pollution: The neglected dimension. Worldwatch Paper 27. Washington, DC:
Worldwatch Institute.
Merken, M. (1989). Physical science with modern application. 4th ed. Philadelphia, Saunders.
Montgomery, C. R. (1989). Environmental geology. 2nd. Dubuque, IA: William C. Brown.
94
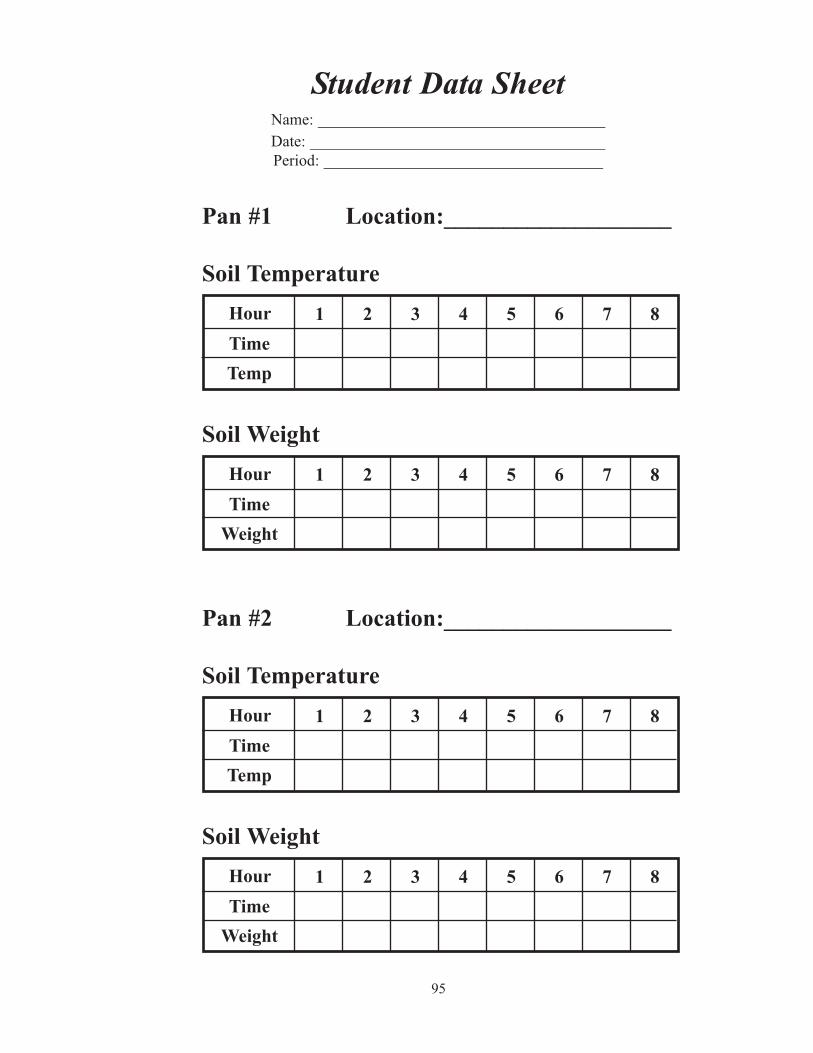
95
Student Data SheetName: ____________________________________
Date: _____________________________________
Period: ___________________________________
Hour
Time
Temp
1 2 3 4 5 6 7 8
Hour
Time
Weight
1 2 3 4 5 6 7 8
Pan #1 Location:___________________
Soil Temperature
Soil Weight
Hour
Time
Temp
1 2 3 4 5 6 7 8
Hour
Time
Weight
1 2 3 4 5 6 7 8
Pan #2 Location:___________________
Soil Temperature
Soil Weight

Notes
96
OBJECTIVES:Students will be able to:
1. Define parts-per-million.
2. Describe how the greenhouse effect affects our climate.
BACKGROUND:The Earth often is compared to a gigantic greenhouse. Energy in
the form of sunlight passes through the planet’s atmosphere.
Some of the energy that strikes the land and water is reflected
back into space. Most of the rest is absorbed by the land and
water, converted to heat, and radiated back into the atmosphere.
This radiated energy is mostly absorbed by carbon dioxide and
other atmospheric gases, which act much like the glass in a
greenhouse thereby warming the atmosphere.
Since the middle 1800s, scientists have wondered about the
importance of CO2 as a “greenhouse gas” in the regulation of the
Earth’s climate. According to the “greenhouse effect” theory,
increasing levels of CO2 in the atmosphere will trap more and
more heat thus raising the planet’s overall temperature and
affecting regional climates, sea levels, distribution of arable land,
animal and human habitats, and more.
The widespread burning of fossil fuels—coal, oil, and natural
gas—releases greenhouse gases, including CO2, into the
atmosphere. Concern about the possible climatic effects of
increasing atmospheric CO2 levels was voiced in 1957 by Roger
Revelle, then director of the Scripps Institute of Oceanography in
LaJolla, California. He wrote, “Human beings are now carrying
out a large-scaled geophysical experiment of a kind that could not
have happened in the past nor could be reproduced in the future. Over a period of a few centuries, we are
returning to the atmosphere and oceans the concentrated organic carbon stored in sedimentary rocks over
hundreds of million of years.” In the late 1950s, scientific information about the levels of CO2 in the
atmosphere was sketchy. So Revelle and others began an international effort to monitor CO2 concentrations in
the atmosphere from stations in Alaska, Antarctica, and Hawaii where measurements would not be affected as
much by factories and other sources of greenhouse gases.
The Mauna Loa, Hawaii, station has been operating since November 1958. The record compiled there over
more than 40 years reveals some interesting insights into the global carbon cycle. There is a sawtooth pattern
of seasonal variations of CO2 of about five parts per million (ppm) long-term increase of about 1.3 ppm per
year.
This long-term increase in CO2 levels raises new questions. What are the sources of this “new” CO2? How
much comes from burning fossil fuels? How much may be caused by the clearing and burning of forests?
What are the “sinks,” or storage places, for the “excess” CO2; and how big are they? Is the increase in
atmospheric CO2 changing the global climate?
New tools such as computer simulation models and satellite images are used to estimate better the sources and
How Small Is Small?
Grades:6-8
Subjects:Chemistry, Biology, Ecology,
Microbiology
Time Needed: One 50-minute class period
Materials: for each group of students:
one eyedropper
a supply of water
a cylinder with 10-milliliter
graduations
three 12-ounce clear plastic cups
masking tape
marking pen
one bottle of food coloring (dark colors
work best)
a calculator
a box of crayons
pastels or colored chalk
student work sheet
POLLUTION PREVENTION
97 www.legacyenved.org
sinks of the carbon cycle. CO2 dissolves readily in sea water where it is absorbed by microscopic plants
known collectively as phytoplankton. When phytoplankton organisms die, some are incorporated into the
ocean bottom sediments, trapping their carbon for millions of years. Sensors borne on satellites can measure
electromagnetic energy reflected from the Earth, providing images of the extent and vigor of plant growth.
These satellite images are being used to map phytoplankton activity at the oceans’ surfaces, including the Gulf
of Mexico, and to estimate the role of the oceans as a sink for atmospheric carbon.
On land, plants absorb and store CO2 and give off oxygen. A large part of the carbon that is fixed in the
leaves of plants as they grow is released into the atmosphere when the plants die and decay. In the dormant
winter months, less CO2 is taken in. This causes a seasonal oscillation of CO2 levels in the atmosphere with
maximum concentration in early spring and minimum levels in the fall. In the longer term, carbon is stored
either as wood, as humus in soil, or in certain rocks such as limestone. Satellite sensors can be used to
delineate better the world’s forests and grasslands as both sources and sinks for CO2.
All of this information is being integrated into computer models to help scientists model how the oceans, the
biosphere, and the atmosphere interact in the global carbon cycle. The idea is to learn more about the effects
of human activity on carbon levels and thus on our climate.
VOCABULARY:greenhouse effect, parts-per-million, parts-per-billion, dilution, concentration, phytoplankton, arable
PROCEDURE:Setting the Stage1. Before beginning the activity, put a piece of masking tape on each cup and label “Sample 1,” “Sample 2,”
and “Sample 3.”
ActivitySample 11. Have each group of students put 99 drops of water into the graduated cylinder. Record the volume of this
amount of water. (They will need this measurement later to avoid having to measure another 99 drops.)
They should pour the water From the 99 drops into the cup marked “Sample 1.”
2. Students should add one drop of food coloring to Sample 1. Stir the water. Record the color using crayons,
pastels, or chalk.
3. Students should answer questions 1 and 2 on the worksheet. They should use a calculator and should write
the answers on the worksheet.
Sample 21. Have the students pour an amount of water equal to 99 drops into the graduated cylinder pour this into the
cup marked “Sample 2.”
2. Have students add one drop of Sample 1 to Sample 2, stir, and record the resulting color.
3. Answer questions 3 and 4 on the worksheet.
Sample 31. Have students pour an amount of water equal to 99 drops into the graduated cylinder and pour this into the
cup marked “Sample 3.”
2. Add one drop of Sample 2 to Sample 3, stir, and record the color of the solution.
3. Answer questions 5, 6, 7, and 8 on the worksheet.
FOR THE TEACHER: (Answers to questions)
Sample 1: Because you have added one drop of food coloring to 99 drops of water, the concentration is one
part per hundred, which can also be expressed as 1/100 or 1 percent. A calculator should be used to visualize
98
the answer. Divide one by 100. The answer is 0.01. The color should be visible.
Question 7:
Students might answer that filtering the water through a substance like sand or through paper might “clean” it,
but filtering will not remove a chemical solution. The teacher might use this question as an opportunity to
discuss the removal of CO2 from the atmosphere. Just as no simple process, such as filtering the water, will
remove food coloring, no simple process will remove excess CO2 from the atmosphere. Reducing the amount
of CO2 emitted by human activity is the only known way to prevent CO2 in the atmosphere from increasing.
Sample 2: To 99 drops of new water, add a drop of the solution from Sample 1, which consists of 0.99 parts
water and 0.01 part food coloring. Because you have not diluted the 0.01 drop of food coloring in a total of
100 drops of solution, divide 0.01 by 100 on the calculator. Your answer is 0.0001. This means you now have
one part food coloring in ten thousand or 1/10,000. The food coloring may or may not be visible in the
resulting selection.
Sample 3: Again you have 99 drops of new water and one drop from the solution in Sample 2. The one drop
is 0.9999 parts water and 0.0001 parts food coloring. To calculate the concentration of food coloring in
Sample 3, divide 0.0001 by 100 (the total number of drops in the solution). The answer is 0.000001 or one
part food coloring in one million (1/1,000,000). The food coloring will not be visible at this concentration.
Question 8:
Making a parts-per-billion sample: Continue the procedures described above. Begin with 99 new drops of
water. Use one drop of the parts-per-million solution. You will get 0.00000001 parts food coloring or one part
food coloring in 100 million (1/100,000,000). For the final step, take nine new drops of water and add to them
one drop of the previous solution. This yields 0.000000001 or one part per billion.
EVALUATION:1. Students will be able to do the following:
• Define parts-per-million.
• Calculate parts-per-million.
• Demonstrate successful completion of laboratory procedures.
EXTENSION:1. Once the students are familiar with the procedure required to create a parts-per-million solution of a
pollutant, have a variety of substances available for them to dilute and observe. Encourage the students to
create experimental tests for determining if other substances are observable in the parts-per-million
concentration. Some suggested substances to experiment with are detergent and acid (vinegar). You can
ask:
• Are the new substances observable in any way? (Do they form a film or foam or is there
discoloration?)
• Has there been a change in a pH test for the acid or base? (Use litmus paper to test the solutions.)
Answers will vary.
• Discussion note: Is a diluted substance “gone” just because it is no longer visible? How can these ideas
be transferred from a liquid to a gas like CO2?
ORIGINAL DEVELOPMENT SOURCES:“Global Change,” published by U.S. Department of the Interior, U.S. Geological Survey - Teachers’
packet found at http://mac.usgs.gov.
99
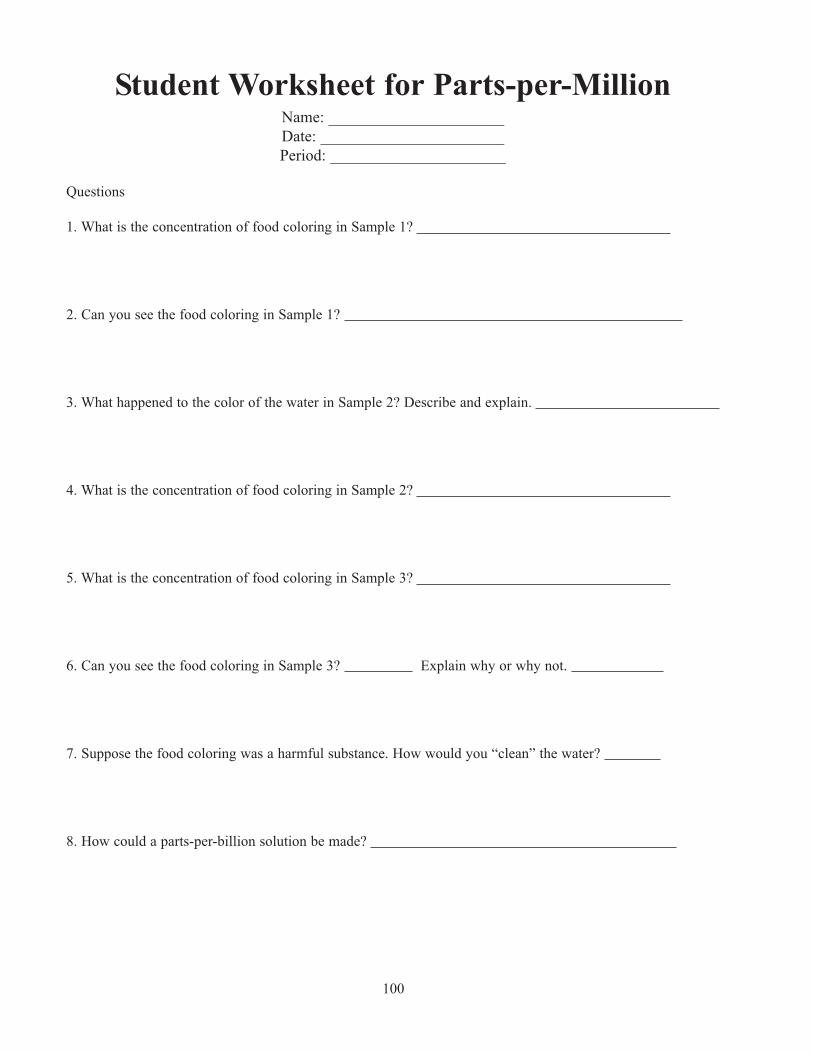
Student Worksheet for Parts-per-MillionName: ______________________
Date: _______________________
Period: ______________________
Questions
1. What is the concentration of food coloring in Sample 1?
2. Can you see the food coloring in Sample 1?
3. What happened to the color of the water in Sample 2? Describe and explain.
4. What is the concentration of food coloring in Sample 2?
5. What is the concentration of food coloring in Sample 3?
6. Can you see the food coloring in Sample 3? Explain why or why not.
7. Suppose the food coloring was a harmful substance. How would you “clean” the water?
8. How could a parts-per-billion solution be made?
100
OBJECTIVES:Students will be able to:
1. Identify point and non-point sources of pollution.
2. Create a map that demonstrates how a source of pollution that
gets into states bordering the Mississippi can eventually reach
many states.
BACKGROUND: Streams and rivers are more than flowing waters that carry
dissolved gases, minerals, and bits of sand and silt on a headlong
course to the sea. Few people have the opportunity to follow a
river through its entire course to the sea. If you did, however, you
would quickly discover that whatever goes into the river
upstream eventually finds its way downstream. Few streams flow
directly into the sea. Instead, they rise from sources that lie
hundreds of miles inland following a beautiful, intricate pattern
of small streams flowing into larger ones, and then the larger
streams unite to form rivers. As these rivers travel to the sea,
many pollutants can be picked up and carried downstream. Take
the Mississippi River, for instance. Whatever finds its way into
this mighty river can eventually work its way to the Gulf of
Mexico. Water pollution is a major problem today. There are as
many sources as there are types of pollution—poisonous
chemicals, untreated wastes, oil spills, and even litter from people
and industry.
VOCABULARY:point source pollution, non-point source pollution
ADVANCE PREPARATION:1. Introduce the terms point source pollution and non-point source pollution.
2. Prepare a copy of a U.S. map for each student as well as a map showing how the Mississippi River flows
through the states in the U.S.
PROCEDURE:Setting the Stage1. Discuss sources of river pollution by using slides, video, or pictures.
2. Give the students the following problem to solve: You own a lodge that offers public housing on the
beautiful Mississippi River near a quaint little town in Wisconsin. This lodge is known all over for its
sparkling, clear fishing waters. This has become a “booming” business for you. One day, however, you
make an alarming discovery while walking out on your profitable fishing pier. You see a strange “brownish
orange” goop floating in the water. You realize you must find its source as quickly as possible in order to
save the pristine waters surrounding your lodge.
Activity1. Divide the students into teams to investigate and trace the source or sources from which the pollution
might have come. Compare and contrast the difficulties of tracing point and non-point sources of
Rivers Of Life...Or Death
Grades:6-8
Subject:Science
Time Needed: One 50- minute class period
Materials: two large dish pans
two sheets of Plexiglas or acrylic large
enough to fit over the pans
cooking oil
soy sauce or some dark liquid
litter collected on the street (bits of
plastic, paper, and other litter)
spray water bottle
field notebook or journal
sanitary gloves
pencils
POLLUTION PREVENTION
101 www.legacyenved.org
pollution.
2. Have each team choose a spokesperson who will present the findings.
Follow-UpHave each team present its findings.
EXTENSION:Have each team create a similar scenario using other states that border the Mississippi River, another large
river like the Missouri, or a river in the area.
ORIGNAL DEVELOPMENT RESOURCES:
Earth science. (l991). Columbus, OH: Prentice Hall Publishing Company.
102
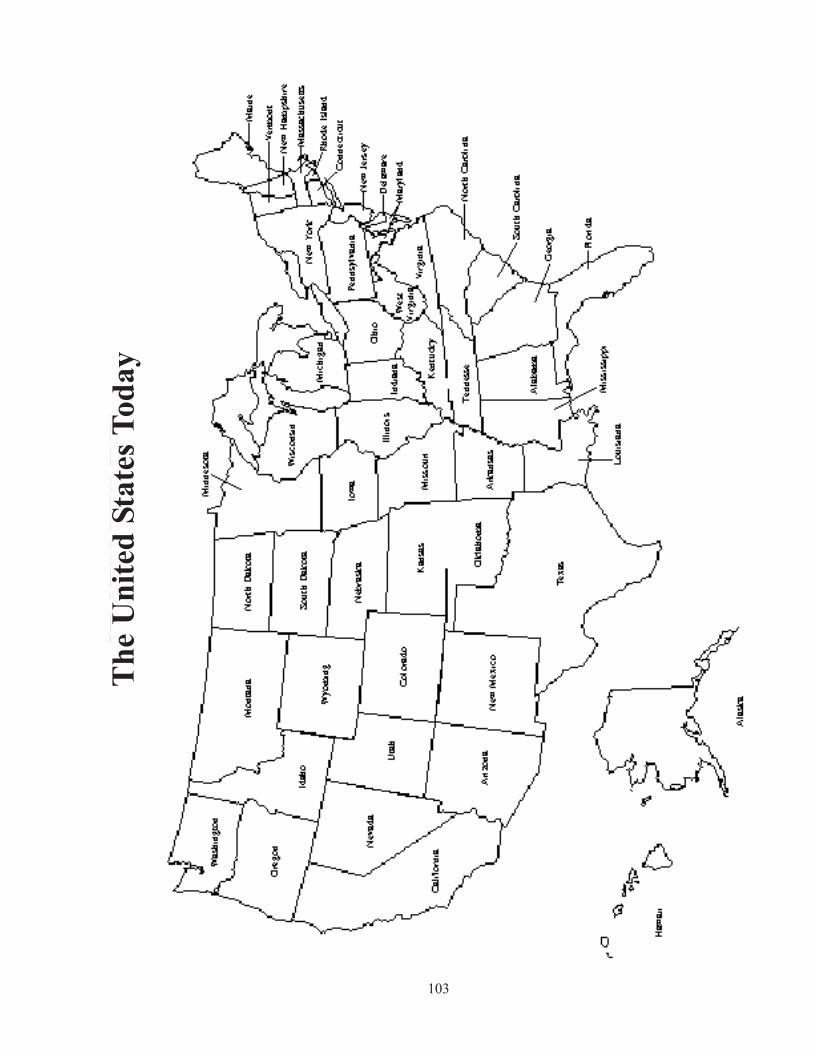
103
Th
e U
nit
ed S
tate
s T
od
ay
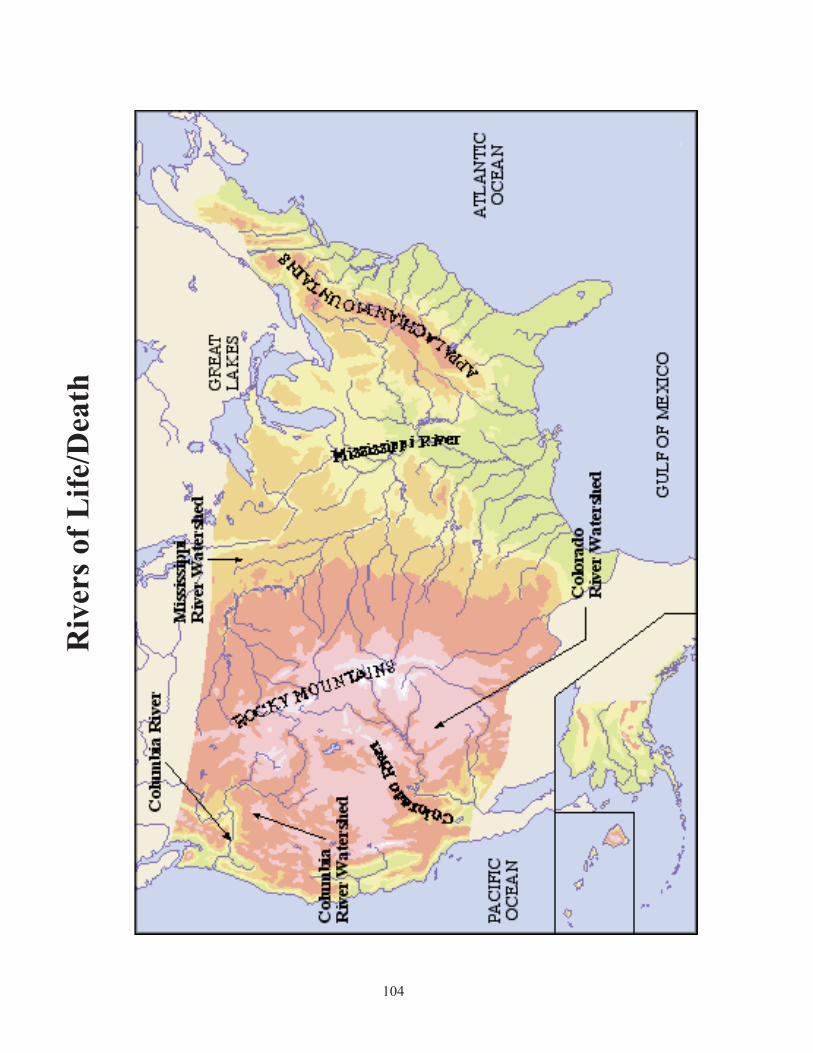
104
Riv
ers
of
Lif
e/D
eath
OBJECTIVE:Students will be able to:
1. List forms of non-point source pollution.
BACKGROUND: Pollution originates not just from one source but from many
different sources. Point source pollution is also defined very
broadly in the Clean Water Act because it has been through 25
years of litigation. It means any discernible, confined and
discrete conveyance, such as a pipe, ditch, channel, tunnel,
conduit, discrete fissure, or container. It also includes
concentrated animal feeding operations, which are places where
animals are confined and fed. Non-point source pollution is
responsible for more than half the nation’s water pollution.
There are several sources of non-point source pollution. The
Environmental Protection Agency states that NPS pollution is
caused by rainfall or snowmelt moving over and through the
ground. As the runoff moves, it picks up and carries away
natural and human-made pollutants, finally depositing them into
lakes, rivers, wetlands, coastal waters, and even our underground
sources of drinking water. These pollutants include: excess
fertilizers, herbicides, and insecticides from agricultural lands and
residential areas; oil, grease, and toxic chemicals from urban
runoff; sediment from improperly managed construction sites,
crop and forest lands, and eroding streambanks; and bacteria and
nutrients from livestock, pet wastes, and faulty septic systems. Golf
courses use two and a half times more chemicals per acre than are used on farmland. Landfills, leaky septic
systems, and improperly disposed household hazardous wastes contribute pollution and chemicals into
waterways each day. When too much water enters the system, such as during a rainstorm, the water may be
diverted around a treatment plant and may be discharged raw into the nearest waterway. A relatively small
amount of rain may overload a combined sewer system. Over-development of areas will generate large
quantities of phosphorus and nitrogen, which cause nitrification, leading to algal blooms and fish kills.
VOCABULARY: biodegradable, litter, pollution, runoff, sewage, solid waste, household hazardous waste, treatment plant, non-
point source pollution, point source pollution
PROCEDURE:Setting the Stage1. Define, or have the students define, terms such as pollution, runoff water, sewage, solid waste, household
hazardous waste, biodegradable, and treatment plant.
2. The students or the teacher should collect roadside trash from around town. Students should work in teams
and wear sanitary gloves.
Activity1. Have students keep a record in a journal of the types of pollution they can identify but cannot collect in the
areas of collection.
Street Runoff
Grades:6-8
Subject:Science
Time Needed: One 50- minute class period
Materials: two large dish pans
two sheets of Plexiglas or acrylic large
enough to fit over the pans
cooking oil
soy sauce or some dark liquid
litter collected on the street (bits of
plastic, paper, and other litter)
spray water bottle
field notebook or journal
sanitary gloves
pencils
POLLUTION PREVENTION
105 www.legacyenved.org
2. Students should use their own categories for dividing the litter. One category must include biodegradable
items, and one category must include solid waste materials. Other types of pollutants that were not able to
be collected should be listed in a column called “Other.”
3. Students should fill both pans with water, covering them with sheets of Plexiglas or acrylic and leaving
about half an inch open.
4. They should then put oil, soy sauce, and litter on top of one of the pieces of plexiglass. Students should
spray the top of the plexiglass with water to simulate rain. Keep spraying until most of the runoff and litter
have fallen into the basin.
5. Students should spray the top of the clean plexiglass for an equal amount of time.
6. Students should remove the pieces of plexiglass from the pans and observe the differences. Compare the
pan with dirty water to the pan with clean water.
Follow-Up1. Brainstorm with students how litter and chemicals in runoff can be reduced.
Discuss these questions:
• Why are treatment plants necessary?
• What happens to litter left on the street if it is not picked up?
• What happens to pollutants such as chemicals in the water that cannot be picked up or that will not
biodegrade?
• Would stricter littering laws help this problem in any way? What parts of the problem would it NOT
have an effect on?
EXTENSIONS:1. Collect garbage from a selected area of a known size to display on a bulletin board at school.
2. Design a monument to “litter” made out of the litter found on the school grounds.
3. Paint trash cans bright colors with catchy slogans to inspire people to use them.
4. Adopt a stream crossing or road-side mile.
ORIGINAL DEVELOPMENT RESOURCES: “PALS,” a newsletter by People Against A Littered State, Fall 1992.
www.epa.gov/owow/nps
ADDITIONAL RESOURCES: http://www.alpals.org
http://water.epa.gov
106
OBJECTIVE:Students will be able to:
Discuss the immediate and long-range effects of thermal
pollution with an awareness of the interrelationship that
exists between people and nature.
BACKGROUND:Much of the water we drink today has been around since the
beginning of time. Whether it has been part of a rainstorm, a fish,
or a plant, water is ancient. Agriculture and industry account for
most of the water usage in the United States. An entire ecosystem
may suffer the effects of water pollution. In the past few years,
there have been several spills of toxic chemicals directly into
rivers or streams, killing every living thing for miles downstream
from the spills. In fish, toxic chemicals can cause cancers and
scale or fin rot; and these chemicals can accumulate in their
tissues, making many fish too dangerous for humans to eat. When
excessive amounts of heat are added to a body of water, thermal
pollution can result. Thermal pollution occurs when power plants
and other industries located along lakes or rivers use the water in
their cooling systems. (Thermal pollution can cause massive fish
kills when the discharged water is too hot for the fish to tolerate.) Cool water from rivers or lakes is circulated
around engines to absorb waste heat. The hot water from this is returned to the lake or river, creating an
unnaturally warm or even hot area. Because hot water does not hold as much oxygen as cool water, aquatic
organisms are deprived of oxygen and may suffocate. A constant influx of hot water into an aquatic ecosystem
may totally disrupt it if the organisms are not able to adapt to the higher temperatures. This is the reason
citizens often oppose the construction of the power plants on lakes and rivers or insist on cooling systems that
reduce the temperatures of the water before it is returned to the waterways.
VOCABULARY:pollution, thermal pollution, ecosystem, aquatic ecosystem, heat
ADVANCE PREPARATION:1. Design and construct an aquatic ecosystem.
2. Have the ecosystem in the class for about a week. (This is for student observation.)
3. Purchase inexpensive life for the ecosystem. (fish, plants)
4. Discuss the importance of the water temperature and how life adapts.
5. Make arrangements to have access to hot water.
PROCEDURE:Setting the Stage1. Enlist the aid of student volunteers to perform the experiment.
2. Place an aquarium tank or other container that provides a large surface area for contact with the
atmosphere in an area that provides sunlight and allows for clear viewing by students.
3. On the bottom of the tank, place washed sand to prepare a base land.
4. Fill the tank with clear water. (Do not disturb the sand.)
5. Allow the temperature of the aquarium to adjust to that of the room.
Thermal Pollution And
Aquatic Ecosystems
Grades:6-8
Subject:Science
Time Needed:One class period for teacher
demonstration; aquarium on-going
Materials:aquarium
sand
fish
plants
heavy paper cup
POLLUTION PREVENTION
107 www.legacyenved.org
6. Place a small number of freshwater fish, selected for transfer to the aquarium, in a plastic bag containing
water from the original habitat.
7. Float the bag and its contents on the surface of the water in the aquarium.
8. After a couple of hours when the temperature of the water in the plastic bag is the same as that of the
aquarium water, release the fish into the water in the aquarium.
Activity1. Show the students the cold water and the hot water.
2. Ask questions as to what would happen if this water were added to the ecosystem.
3. Remind students that for a week the temperature has been constant.
4. Tell students that a power plant has been constructed, and the new sight is next to the aquatic ecosystem.
5. Put holes around the bottom of the heavy paper cup.
6. Place the cup with the holes in the aquarium. Pour hot water into the cup in the aquarium. Make
observations.
7. Repeat Step Six one time only. Taking care not to injure the lifeforms in the aquarium, choose the
placement of the cup of hot water carefully.
Follow-Up1. Have the students write about the lab activity, utilizing the steps of the scientific method (problem,
information, hypothesis, experiment, data, and conclusion).
2. Investigate and report on what Congress and the Environmental Protection Agency are doing about thermal
pollution.
EXTENSIONS:1. Have a debate on what Congress and the EPA are doing about water pollution. Ask questions: Do you feel
that it is enough? Do environmental groups? Are you willing to pay higher prices for goods in order to
have a better system? Are your friends and relatives? Conduct a survey to find out.
2. Attend a public hearing about water pollution problems. Write a letter to your local official and express
your opinion on the topic. Share the letters and replies with the class.
ORIGINAL DEVELOPMENT RESOURCES:Arms, K. (1996). Environmental science. Orlando, FL: Holt, Rinehart, and Winston.
Allen, D. Hands-on science. The Center for Applied Research in Education, West Nyack, NY.
108
OBJECTIVE: Students will be able to:
Apply information from various sources (literature,
documents, topographical and aerial maps, pictures) to
enhance their knowledge of biodiversity and conservation.
BACKGROUND: Humans are making increasing demands on natural ecosystems.
One recent study has concluded that our species is consuming or
diverting over 40 percent of the net photosynthetic productivity
of our planet. Many habitats are being converted to simpler
systems that provide more harvestable goods for people. As a
result, genetic diversity, species, and entire ecosystems are
disappearing. Some scientists suggest that as many as 25 percent
of the world’s species could be lost in the next several decades.
Jeffrey A. McNeely’s The Sinking Ark is usually characterized in
terms of pollution, habitat loss, poaching, introduced species, and
illegal trade in wildlife products, but these are symptoms rather
than causes. At a more fundamental level, many of the same
factors that have caused pollution to become such a problem also
have been responsible for the loss in biodiversity. The effects of
pollutants on biodiversity have been considered an external,
unintended side effect of industrial activity that brought
measurable benefits to people; development of activities that have
decreased biodiversity have proven profitable only because the
real costs have been unknown, hidden, or ignored.
Some scientists feel that the root of the problem is over-population. The real costs have been ignored rather
than hidden by those mainly responsible for production, though many of the costs have been concealed from
consumers. This problem is a product of greed and selfishness.
“Keeping the ark afloat” will require this approach: Investigation (learning how natural systems function),
Information (ensuring that the facts are available to make informed decisions), Incentives (using economic
tools to help conserve biodiversity), Integration (promoting a cross-sectional approach to conserving
biodiversity), and International Support (building productive collaboration for conserving biodiversity).
In order to comprehend these concepts, one must be familiar with biodiversity in the local area. Photographs
and “earth truthing” (physically examining) are possible in a local area and are meaningful. An understanding
of local demands on biodiversity will help in the understanding of global demands.
VOCABULARY: biodiversity, conservation, pollution, species loss, habitat loss, introduced species, poaching
PROCEDURE:1. Cut out swaths of an aerial photograph for a site with which you are familiar.
2. Label the vegetation type on the back of each swath to be used as reference data.
Vegetation Survey
Grades:6-8
Subjects:Science, Literature, Ecology
Time Needed:Two 50-minute class periods, and a trip
to the area under investigation
(optional)
Materials: two aerial photographs
clear sheet of plastic large enough to
cover the photographs
thin black markers to draw zones on
plastic overlay
identification cards (cut out swatches
from one of the photographs that
represent each vegetation type
written on the back of each swatch)
field guides for plant identification
POLLUTION PREVENTION
109 www.legacyenved.org
3. Spread the aerial photograph on a table and secure.
4. Have students place a plastic sheet over the photo and begin tracing different vegetation zones. Using the
cut-out swatch as a reference, students should label these zones on the plastic.
5. Go to the site and “ground truth” (walk the area) to make sure it is the same vegetation. An alternative to
this would be for the teacher to make photographs to verify the class map.
6. Identify any changes made since the photographs were taken.
EVALUATION: Observe students to record the completion of the activity.
EXTENSIONS: 1. Use the map to locate industrial and residential areas. Have students form hypotheses about the growth of
population and industry.
2. Identify wildlife and describe the impact on the vegetation.
3. Write a proposal to a legislator telling of your findings and your wishes for this area.
ORIGINAL DEVELOPMENT RESOURCES: McNeely, J. A. (1992). The sinking ark: pollution and the worldwide loss of diversity. Chapman and Hall.
Geological Survey Of Alabama, Tuscaloosa, AL
110
INTRODUCTION TO WASTE
MANAGEMENT
Municipal Solid Waste Management
Waste Management in Alabama is as diverse as the state’s natural resources. Municipal solid wastes are
generated in homes, commercial establishments, institutions, and industries. Municipal solid waste varies from
yard waste to food scraps and from construction and demolition debris to office and classroom paper. In the
United States, each individual produces 2,555 pounds of garbage each year. In Alabama, each individual
produces approximately 4.5 pounds of municipal solid waste a day. Local governments, waste management
companies, and consumers have established methods of disposing of waste in an environmentally friendly
manner.
Recycling is the process by which used items are reconditioned and are adapted to a new use or function.
Recycling is a waste management method that can be a responsible, cost-effective way to help solve some of
Alabama’s waste disposal problems. Recycling helps preserve natural resources, reduce pollution, and save
energy.
Composting is a low-cost disposal method whereby organic material is accumulated in mounds or containers
to bring about decomposition by microorganisms such as bacteria or fungi. Composted items can be used as a
soil conditioner in landscaping and gardening.
Incineration is a disposal method involving the burning of solid waste to reduce volume, with or without the
recovery of energy.
Landfilling is the major disposal method of solid waste in Alabama. A landfill is a system of trash and garbage
disposal in which waste is buried between layers of earth in such a manner that minimizes environmental
hazards. New EPA regulations called subtitle D make landfilling more environmentally friendly than before,
but much more expensive.
Hazardous Waste Management
In addition to municipal waste management, Alabama also must manage hazardous wastes produced in the
state. Hazardous waste is any solid, liquid, or gaseous material that is no longer of use in its present form and
would cause injury or death to living organisms and would pollute land, air, or water if improperly disposed.
Some examples of hazardous wastes include oil, batteries, pesticides, and oil paints. Hazardous wastes may be
managed through minimization, resource recovery such as recycling or reuse, treatment, or disposal.
The Resource Conservation and Recovery Act (RCRA) classifies hazardous waste into two categories:
characteristic hazardous waste and listed hazardous waste. Characteristic hazardous wastes exhibit one or
more of the following traits: ignitability, corrosivity, reactivity, or toxicity. Listed hazardous wastes are
incorporated into lists from the RCRA rules. They exhibit one of the previously listed characteristics or
contain any number of toxic constituents that have been shown to be harmful to health and the environment.
Household hazardous waste, unlike hazardous waste generated by industry, is not regulated in Alabama by the
Alabama Department of Environmental Management or the U.S. Environmental Protection Agency. The best
way to manage household hazardous waste is to avoid generating hazardous products.
Disposal may be reduced or eliminated by giving leftover products away, recycling materials when possible,
using less hazardous alternatives when possible, and buying only the amounts of products needed.
111

112
113
WASTE MANAGEMENT
OBJECTIVES:Students will be able to:
1. Explain the effects of biodegradable waste on oxygen levels in
aquatic ecosystems.
2. Perform an experiment to demonstrate the effect of
biodegradable wastes on oxygen levels in an aquatic
ecosystem.
3. List a few of the sources of biodegradable pollutants entering
aquatic systems.
BACKGROUND:Oxygen is a vital component of most ecosystems. Most living
things need oxygen to sustain life, whether they live on land or in
the water. Although oxygen usually is abundant on land, the
amount of dissolved oxygen in water can become low or even
disappear.
In nature, dissolved oxygen levels in aquatic ecosystems
occasionally are lowered by naturally occurring causes. Many
types of pollution, however, are commonly the cause of oxygen
depletion that results in major fish kills. Biodegradable wastes are
a common type of pollution responsible for these kills.
Biodegradable wastes are substances that decay or can be broken
down naturally. When these wastes are put into a body of water,
microorganisms (bacteria and fungi) which consume oxygen begin
to decompose them. Because of an abundant “food supply” (the biodegradable wastes), the microorganisms
begin to multiply, consuming large amounts of oxygen sometimes resulting in fish kills. Thus, a large amount
of biodegradable waste results in very little oxygen left for fish and other aquatic animals.
Examples of biodegradable waste include effluent from sewage treatment plants, chemical plants, textile
plants, paper mills, and food processing plants. Laws regulate the quality and amount of biodegradable
wastes that these industries can discharge into waters. If nonpoint sources cause a problem and can be traced
to a source, enforcement action can take place.
This activity investigates the effects of biodegradable wastes on the amount of oxygen present in an aquatic
ecosystem. Milk will represent the biodegradable waste, yeast will represent the microorganism, and
methylene blue (a dye) will indicate the oxygen supply. The methylene blue will change from blue to white
when no more oxygen is present in the test tubes. (The color change is actually from blue to colorless, but the
white color observed is due to the color of the milk.)
VOCABULARY:aquatic, ecosystem, biodegradable, dissolved oxygen (DO), efficiently
PROCEDURE:1. Fill a small beaker or a baby food jar about half full of milk.
2. Clean three test tubes. Place them in a rack and label them 1, 2, and 3.
Effects Of Biodegradable
Waste On Dissolved Oxygen
Grades:6-8
Subjects:Science, Math, Social Studies
Time Needed:Two 45-minute periods
Materials: milk
two small beakers or baby food jars
2 mL (about half a teaspoon) of dry
yeast
one 10 mL graduated cylinder
3 test tubes in a rack
stirring stick
one 5 mL pipette or an eye dropper
methylene blue solution
test tube labeling
www.legacyenved.org
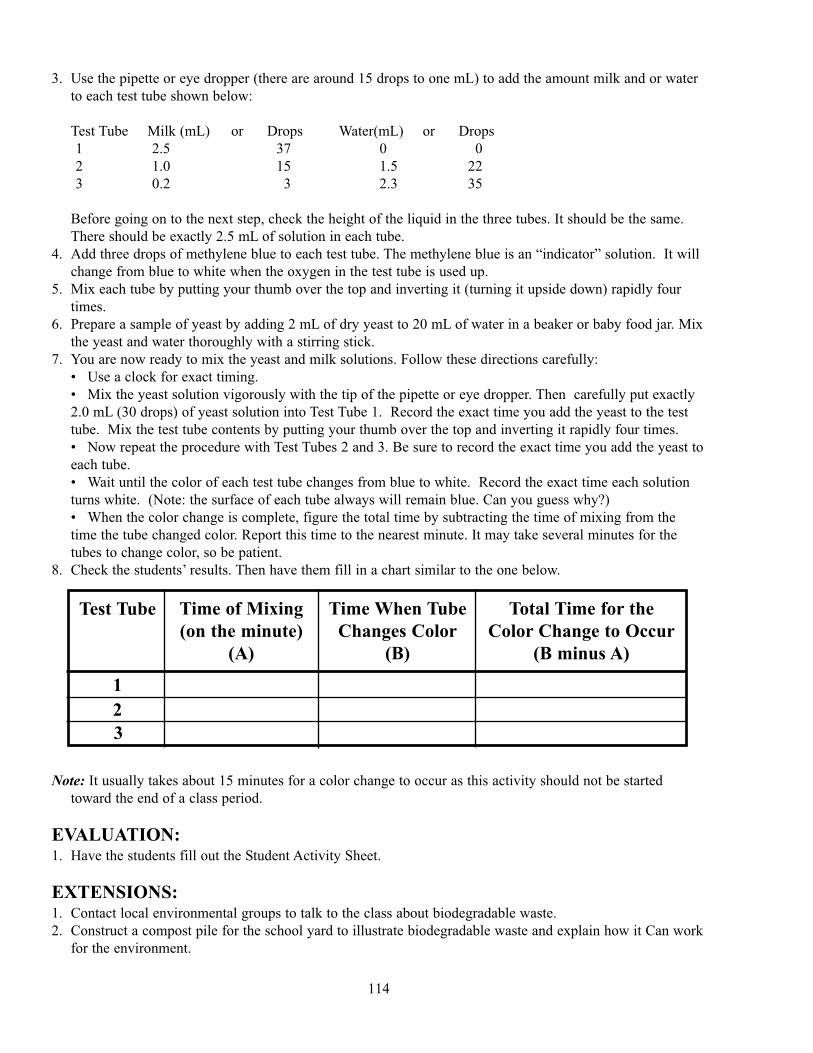
3. Use the pipette or eye dropper (there are around 15 drops to one mL) to add the amount milk and or water
to each test tube shown below:
Test Tube Milk (mL) or Drops Water(mL) or Drops
1 2.5 37 0 0
2 1.0 15 1.5 22
3 0.2 3 2.3 35
Before going on to the next step, check the height of the liquid in the three tubes. It should be the same.
There should be exactly 2.5 mL of solution in each tube.
4. Add three drops of methylene blue to each test tube. The methylene blue is an “indicator” solution. It will
change from blue to white when the oxygen in the test tube is used up.
5. Mix each tube by putting your thumb over the top and inverting it (turning it upside down) rapidly four
times.
6. Prepare a sample of yeast by adding 2 mL of dry yeast to 20 mL of water in a beaker or baby food jar. Mix
the yeast and water thoroughly with a stirring stick.
7. You are now ready to mix the yeast and milk solutions. Follow these directions carefully:
• Use a clock for exact timing.
• Mix the yeast solution vigorously with the tip of the pipette or eye dropper. Then carefully put exactly
2.0 mL (30 drops) of yeast solution into Test Tube 1. Record the exact time you add the yeast to the test
tube. Mix the test tube contents by putting your thumb over the top and inverting it rapidly four times.
• Now repeat the procedure with Test Tubes 2 and 3. Be sure to record the exact time you add the yeast to
each tube.
• Wait until the color of each test tube changes from blue to white. Record the exact time each solution
turns white. (Note: the surface of each tube always will remain blue. Can you guess why?)
• When the color change is complete, figure the total time by subtracting the time of mixing from the
time the tube changed color. Report this time to the nearest minute. It may take several minutes for the
tubes to change color, so be patient.
8. Check the students’ results. Then have them fill in a chart similar to the one below.
Note: It usually takes about 15 minutes for a color change to occur as this activity should not be started
toward the end of a class period.
EVALUATION:1. Have the students fill out the Student Activity Sheet.
EXTENSIONS:1. Contact local environmental groups to talk to the class about biodegradable waste.
2. Construct a compost pile for the school yard to illustrate biodegradable waste and explain how it Can work
for the environment.
114
Test Tube Time of Mixing
(on the minute)
(A)
Time When Tube
Changes Color
(B)
Total Time for the
Color Change to Occur
(B minus A)
1
2
3

ORIGNAL DEVELOPMENT RESOURCES:Welcome to the World of Water, Dauphin Island Sea Lab, P.O. Box 369, Dauphin Island, AL 36528
ADDITIONAL RESOURCES:The Environmental Literacy Council: Dissolved Oxygen. http://www.enviroliteracy.org/
115
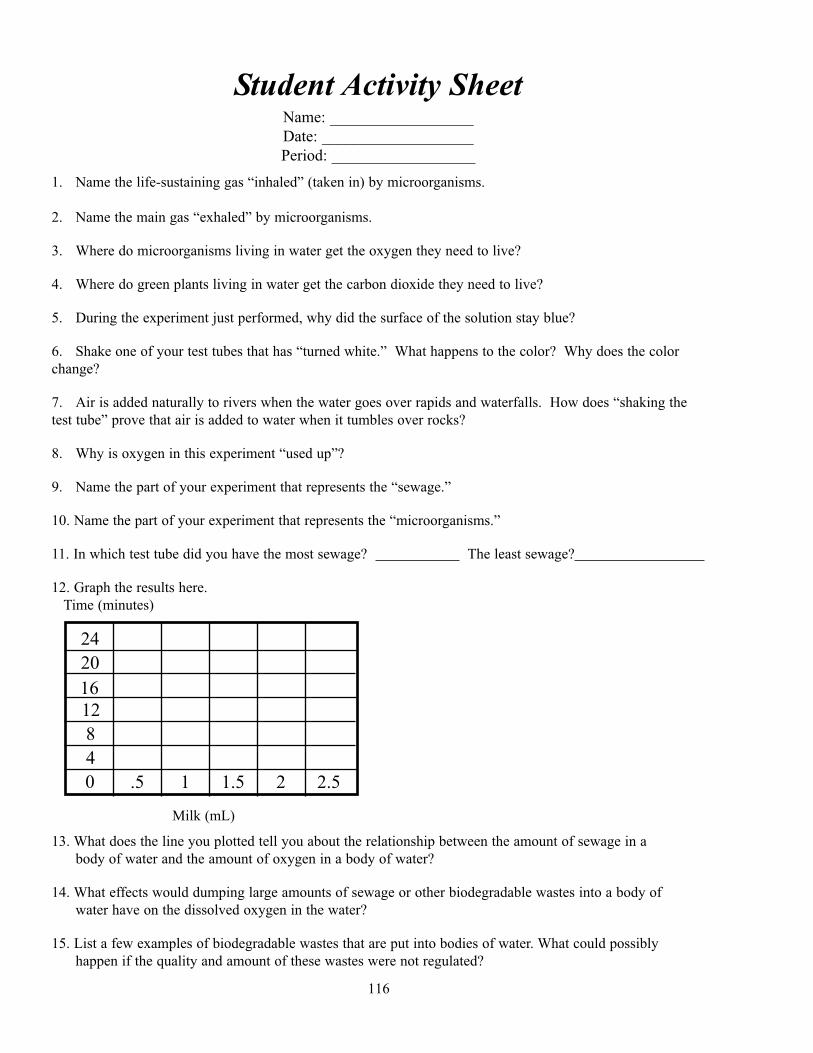
Student Activity SheetName: __________________
Date: ___________________
Period: __________________
1. Name the life-sustaining gas “inhaled” (taken in) by microorganisms.
2. Name the main gas “exhaled” by microorganisms.
3. Where do microorganisms living in water get the oxygen they need to live?
4. Where do green plants living in water get the carbon dioxide they need to live?
5. During the experiment just performed, why did the surface of the solution stay blue?
6. Shake one of your test tubes that has “turned white.” What happens to the color? Why does the color
change?
7. Air is added naturally to rivers when the water goes over rapids and waterfalls. How does “shaking the
test tube” prove that air is added to water when it tumbles over rocks?
8. Why is oxygen in this experiment “used up”?
9. Name the part of your experiment that represents the “sewage.”
10. Name the part of your experiment that represents the “microorganisms.”
11. In which test tube did you have the most sewage? The least sewage?
12. Graph the results here.
Time (minutes)
Milk (mL)
13. What does the line you plotted tell you about the relationship between the amount of sewage in a
body of water and the amount of oxygen in a body of water?
14. What effects would dumping large amounts of sewage or other biodegradable wastes into a body of
water have on the dissolved oxygen in the water?
15. List a few examples of biodegradable wastes that are put into bodies of water. What could possibly
happen if the quality and amount of these wastes were not regulated?
116
16
20
24
0
4
8
12
.5 1 1.5 2 2.5
OBJECTIVES: Students will be able to:
1. Describe some of the processes and resources in the
manufacture of glass products.
2. Describe how recycling glass is beneficial to the environment.
BACKGROUND: Glass accounts for five to six percent of the solid waste stream
generated in Alabama. Glass is 100 percent recyclable, meaning
that every pound of glass bottles and jars brought to a recycling
center can be used to make new glass containers. (Mirrors and
tempered or tinted glass for windows cannot be recycled.)
Glass is made by heating sand, lime, soda, ash, and cullet
(crushed glass that has been collected for recycling) to a very
high temperature until the mixture melts. As it cools, it is poured
into molds and injected with air.
All bottles and jars were once made by glass blowers who blew
bubbles with the molten glass mixture and formed them into
shapes that hardened as they cooled. Today’s manufactured
bottles and jars are formed by injecting air into the molten glass
mixture within molds.
The following activity simulates the making of glass, substituting
sugar for sand, lime, and ash. This activity also simulates the
common process of making plastic products called
“blowmolding.” The students may also be interested to know that
“sugar glass” is used in movie-making for “breakaway” windows
and bottles.
VOCABULARY: heat, energy, natural resources, refuse, recycle, cullet, minerals
PROCEDURE:Setting the Stage1. Make an overhead transparency of “Glass Manufacturing.”
2. Hold up a glass object. Ask: Is this glass a solid or a liquid? Tell them glass is a liquid that has been cooled
to form what appears to be a solid. Although it seems solid, glass remains a liquid. Have the students touch
the glass objects and describe the colors, shapes, and textures. Ask them what uses the many kinds of glass
objects have. Hold the objects to the light and show how some reflect light, some are clear, and others are
opaque.
3. Display the “Glass Manufacturing” illustration and explain to students how glass is made, emphasizing the
heat and energy required during the process. Explain that the minerals are taken from the ground and
heated to very high temperatures to make them melt. This process requires enormous amounts of energy.
The supply of minerals and energy used to make glass is limited, so we should not throw away glass.
Glass Making (Recycling)
Grades:6-8
Subjects:Science, Art, Social Studies
Time Needed: Two 45-minute periods
Materials: transparency of “Glass Manufacturing”
illustration
an overhead projector
variety of glass objects (different
shapes, colors, and function)
1 cup (50 g) sugar
hot plate
metal pan
8 x10 (20 cm x 25 cm) piece of glass
from a picture frame
cup of water(12 mL)
newspaper
safety glasses
tongs or hot pad
For each group:
one wide-mouth glass jar
one stiff straw or glass tubing
balloon
rubber band
WASTE MANAGEMENT
117 www.legacyenved.org
4. Explain that glass jars can be remelted to make new glass, so these natural resources can be recycled. Ask
students why recycling glass is good for the environment. (Recycling glass reuses the natural resources
that are in limited supply, and it saves energy.)
5. Tell the students that Alabamians throw away most of the glass used in packaging. Ask where the glass
goes when it is thrown away. Explain that there is no such place as “away” and that all trash has to go
some place. Tell the students that place is called a landfill. Explain that space in landfills is growing
scarce because of how much we throw away. We should try not to throw away so much trash. Ask if
anyone knows how to teach people not to throw away their glass.
ActivityNote:Remind the students to practice good safety habits during this procedure.
1. Start heating the water. Tell the students you are going to make “pretend” glass using sugar in place of the
real materials. Let students examine the sugar and describe it terms of color, texture, shape, and taste. Point
out that the minerals used to make real glass are similar, but they come from the ground.
2. Ask a student to describe sand. Have the student describe the water and the changes in it as the heat begins
to make it boil. Pour the sugar into the boiling water. Tell the students to pretend the sugar is the minerals
from the ground (sand, limestone, feldspar). Stir the mixture vigorously over the heat until the sugar is
dissolved (about 5 minutes).
3. Ask students to describe the changes in the sugar and water. Tell them this is how glass looks before it
cools. Put several layers of newspaper under the sheet of glass. Carefully pour the mixture onto the sheet
of glass and allow to cool (about 15 minutes). Proceed to the molding glass experiment.
4. Hold up the two sheets of “glass” so students can see through them. By allowing it to set overnight, the
“glass” will become frosted. On the next day, ask the students to describe the changes that occurred
overnight.
5. (Optional) To illustrate the recycling of glass, scrape the dried “glass” back into the pan (call it “cullet,”
small pieces of crushed, recycled glass); add water and reboil. More sugar will have to be added to repeat
the procedure. Ask the students which resources were replaced when the cullet was used to make the new
glass (minerals, energy).
Molding Glass:
1. Divide the class into small groups of 4-6 students. Give each group a wide-mouth jar.
2. Give each student a straw or glass tubing, balloon, and rubber band.
3. Attach the balloon to the straw with the rubber band.
4. Have the students take turns putting their balloon into the jar and blowing it up until it takes the shape of
the jar.
5. Explain that this process illustrates how glass is molded into being a jar or other shape.
EVALUATION: 1. Ask the students to name some of the processes and natural resources used to manufacture glass. Students
may illustrate the process, labeling the “natural resources” used to make glass and showing which ones are
replaced when recycled glass (cullet) is used as a raw material.
EXTENSIONS:1. Bring samples of handmade glass to class and show students the bubbles in the glass formed by a person
blowing air into the hot glass mixture. Point out the irregularities that show the glass was handmade.
2. Have students research innovative uses for recycled glass such as “glassphalt” and insulation.
3. Invite a glass blower to class to explain the techniques and to demonstrate the art.
ORIGINAL DEVELOPMENT RESOURCES:
Glass Packaging Institute, 1627 K Street, NW, Suite 800, Washington, DC 20006 www.gpi.org
118
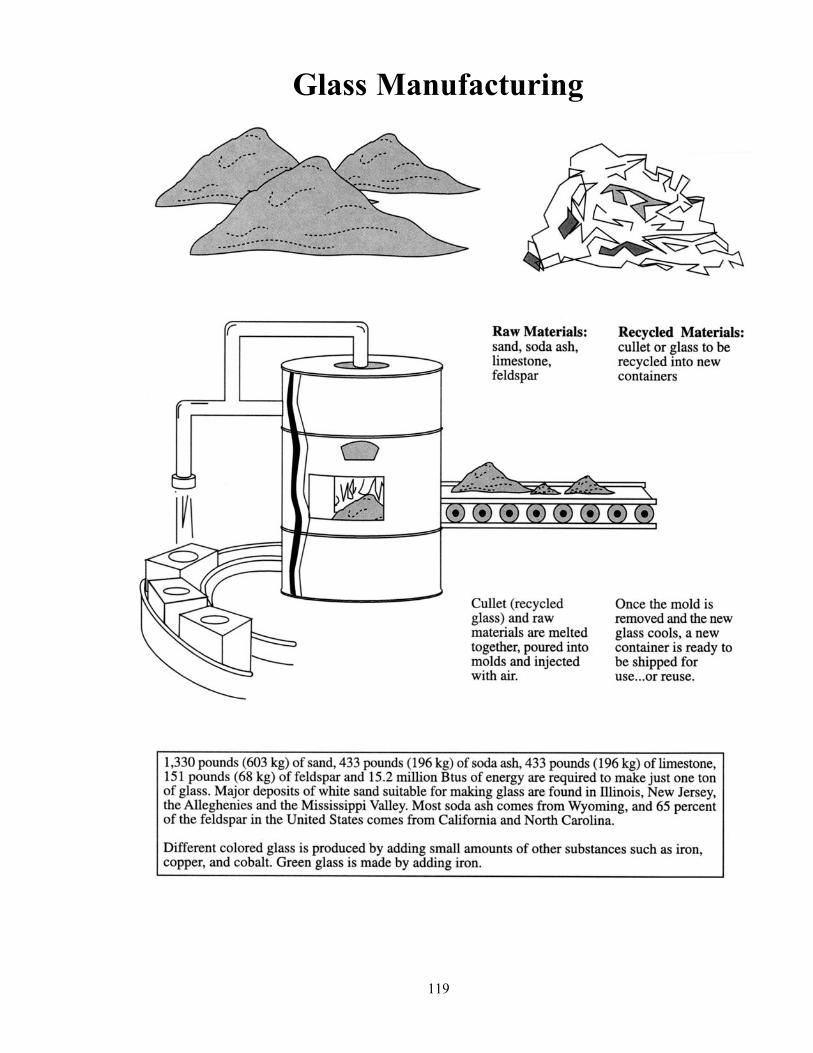
119
Glass Manufacturing

Notes
120
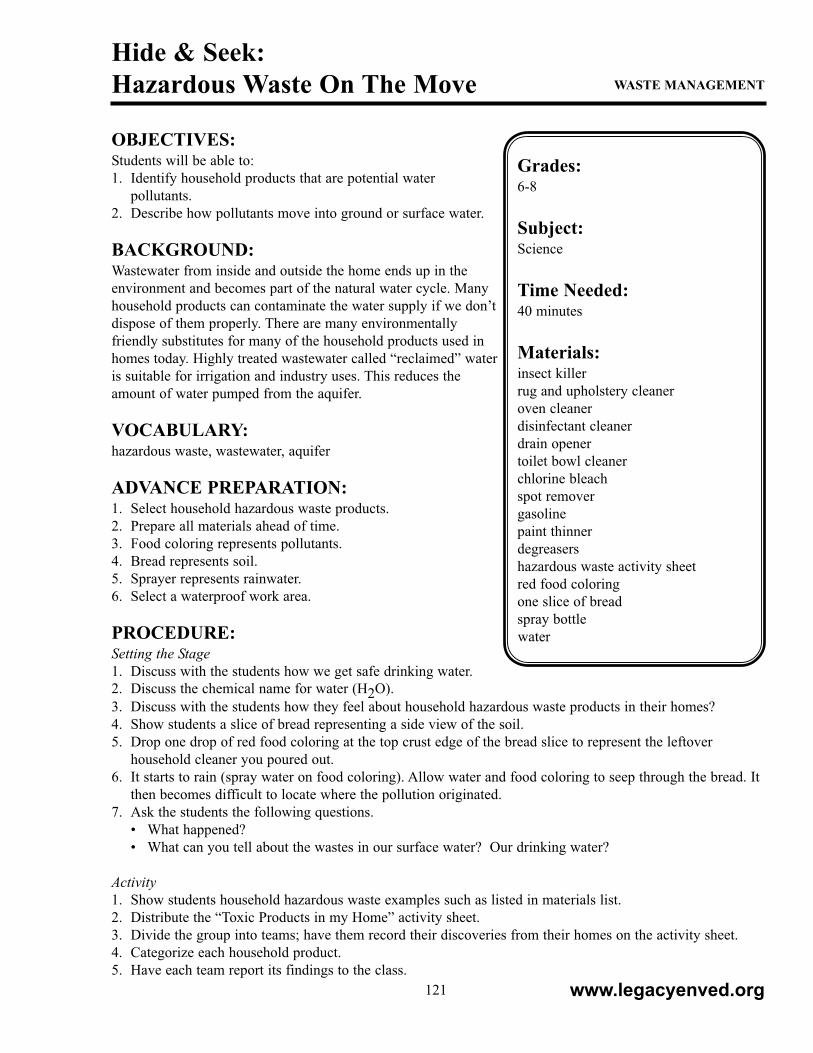
OBJECTIVES:Students will be able to:
1. Identify household products that are potential water
pollutants.
2. Describe how pollutants move into ground or surface water.
BACKGROUND:Wastewater from inside and outside the home ends up in the
environment and becomes part of the natural water cycle. Many
household products can contaminate the water supply if we don’t
dispose of them properly. There are many environmentally
friendly substitutes for many of the household products used in
homes today. Highly treated wastewater called “reclaimed” water
is suitable for irrigation and industry uses. This reduces the
amount of water pumped from the aquifer.
VOCABULARY:hazardous waste, wastewater, aquifer
ADVANCE PREPARATION:1. Select household hazardous waste products.
2. Prepare all materials ahead of time.
3. Food coloring represents pollutants.
4. Bread represents soil.
5. Sprayer represents rainwater.
6. Select a waterproof work area.
PROCEDURE:Setting the Stage1. Discuss with the students how we get safe drinking water.
2. Discuss the chemical name for water (H2O).
3. Discuss with the students how they feel about household hazardous waste products in their homes?
4. Show students a slice of bread representing a side view of the soil.
5. Drop one drop of red food coloring at the top crust edge of the bread slice to represent the leftover
household cleaner you poured out.
6. It starts to rain (spray water on food coloring). Allow water and food coloring to seep through the bread. It
then becomes difficult to locate where the pollution originated.
7. Ask the students the following questions.
• What happened?
• What can you tell about the wastes in our surface water? Our drinking water?
Activity1. Show students household hazardous waste examples such as listed in materials list.
2. Distribute the “Toxic Products in my Home” activity sheet.
3. Divide the group into teams; have them record their discoveries from their homes on the activity sheet.
4. Categorize each household product.
5. Have each team report its findings to the class.
Hide & Seek:
Hazardous Waste On The Move
Grades:6-8
Subject:Science
Time Needed:40 minutes
Materials:insect killer
rug and upholstery cleaner
oven cleaner
disinfectant cleaner
drain opener
toilet bowl cleaner
chlorine bleach
spot remover
gasoline
paint thinner
degreasers
hazardous waste activity sheet
red food coloring
one slice of bread
spray bottle
water
WASTE MANAGEMENT
121 www.legacyenved.org
Follow-Up1. Ask students to discuss their findings.
2. What did they learn from this experience?
EXTENSIONS:1. Make a poster of hazardous waste product labels found in the home.
2. Interview parents or adults on how they feel about these products.
3. Many product labels state “Dispose properly” but they don’t say how. Have students call the toll-free
number on the label if oine is listed. Have the students request information about proper disposal of the
product.
ORIGINAL DEVELOPMENT RESOURCES:4-H Water Wise Guys. (1992). Gainesville, FL: University of Florida Press.
ADDITIONAL RESOURCES: United States Environmental Protection Agency: Superfund. Found at: http://www.epa.gov
122

Toxic Products In My HomeName: ____________________
Date: _____________________
Period: ____________________
Product Toxic Location Proper Disposal
1.
2.
3.
4.
5.
6.
7.
8.
9.
10.
123

Notes
124
OBJECTIVES:Students will be able to:
1. Discover a beneficial, low-technology way to reduce
household waste.
2. Explain the natural process of biodegradation and soil
production.
3. See how to improve soil through worm composting.
4. Describe the benefits of composting.
BACKGROUND:When we throw food scraps into the garbage, we turn a resource
into a liability. At significant financial and environmental cost,
waste has to be picked up, transported, and landfilled or
incinerated. Composting kitchen waste provides an alternate use
for kitchen waste and creates rich soil.
Redworms, Eisenia foetida, can be used to process kitchen waste
in backyard worm bins into high-quality garden compost. Note:Properly constructed and maintained, worm bins do not give off
an offensive odor. For more information on earthworms, see the
article “Getting Earnest About Earthworms,” by Richard Conniff,
Smithsonian Magazine, July 1993.
Worm bins provide the following benefits:
Reduce household waste
Save garbage disposal costs
Produce an excellent soil amendment
Provide worms for fishing
Demonstrate one of the most important natural processes:
biodegradation and soil production.
VOCABULARY: anaerobic, worm castings, biodegration, composting
PROCEDURE:Setting the Stage1. Make copies of the 3 bin construction worksheets included
in the lesson.
Activity1. Ask the school’s shop class or parent volunteer to build the wooden box to specifications included with the
instruction sheet. OPTION: Select a similar sized alternative box such as an apple crate or heavy shipping
carton. You can use wood, metal, or other containers if they are not filled deeper than 12 inches. A piece of
heavy-duty black plastic may be used as a cover. Half-size bins are also effective; they require half the
amount of food and materials. (Since worms do not react to red light, a red Plexiglas side panel or lid
would allow direct observation of worm activity.)
Ins And Outs Of A Worm’s Life
Grades:6-8
Subjects:Science, Math
Time Needed: Extensive ongoing project
Materials: wooden box (24” x 42” x 16”)
(61 cm x 106.5 cm x 40.5 cm)
paper
water
dirt
redworms (Eisenia foetida) calcium
carbonate (egg shells)
food waste (no meat or meat by-
products)
Although construction plans for thebox are included with this lesson,alternatives include using apolystyrene ice chest or an apple cratewith a screen covering the inside of thebox or any container in which you candrill holes.
WASTE MANAGEMENT
125 www.legacyenved.org
2. Discuss with the class the impact of food wastes on the solid waste stream. Discuss alternative methods of
handling food wastes. Introduce the idea of using redworms (Eisenia foetida).
3. You will need one pound (454 g) of redworms for the bin. Ask the students to look for and collect
redworms (not nightcrawlers). Hints for where to look: in barnyards, under mulch, in compost piles, under
decomposing lumber. You may need to supplement the redworms found by obtaining some from a
commercial grower. Look in the Yellow Pages under Agricultural Suppliers or Bait Shops.
4. Set up your worm bin. For a 4-cubic-foot (1-cubic-meter) bin, bury four pounds of food waste in the bin
each week, making sure to rotate the location of the burial (mentally dividing the bin into nine squares
would probably be helpful).
5. Generally, for each cubic foot (cubic meter) of worm bin, you need 1.5 pounds (680 g) of paper as
bedding, 1 gallon (3.5 liters) of water, 1 pound (454 g) of garbage per week, 4.5 ounces (128 g) of
redworms, a bit of soil, and calcium carbonate. For a 4-cubic-foot (1 cubic meter) worm bin, you will
need:
• 1 box filled no deeper than 12 inches (to prevent anaerobic conditions from developing)
• 1 room or space with a temperature between 55 degrees F and 77 degrees F (13 degrees C and 25
degrees C)
• 6 pounds (2.7 kg) of paper for bedding
• 1-2 handfuls of soil (optional)
• Several eggshells
• 1 pound (454 g) of Eisenia foetida (redworms)
• 4 pounds (1.8 kg) of food waste per week
6. Shred the paper by tearing it into strips about 2 inches (5 cm) wide. Put the paper in a bucket, and slowly
pour in water while fluffing the paper occasionally. Let the paper segments drip until the dripping subsides.
Put wet strips of paper into the worm box, and sprinkle in several eggshells (for worm reproduction).
7. Gently place the worms in the box, leaving the top open until the worms burrow down. Close the lid or
cover with a black plastic sheet. Bury food in the box each week, rotating the burial location. Some of the
foods that will work well in the worm bin are bread, corn stalks, egg shells (a good source of calcium
carbonate), grass clippings, leaves, saw dust, spoiled fruit and vegetables, vegetable peelings, clothes dryer
lint, citrus rinds, evergreen needles, hay or straw, twigs, weeds, coffee grounds, discarded houseplants and
flowers, manure, garden waste, hedge clippings, used potting soil, and wood chips. Avoid putting plastic,
bottle caps, rubber bands, sponges, aluminum foil, or glass in the box. Fruit flies can be avoided by
burying the food waste completely.
8. The worm bin needs little routine maintenance. Depending upon the desired outcome, the bedding should
be changed every three to six months. After three months, the number of redworms is high; after four
months, the number of redworms will still be high, and the quality of compost will be fairly good; after six
months, many redworms will have died, but the quality of the compost will be very good. The resulting
compost will be primarily worm castings (worm manure).
9. To change worm bedding, either dump the contents of the bin under a bright light and brush away the
layers of compost (the worms will move away from the light and gather at the bottom of the pile); or pull
the compost plus worms to one side of the bin and add new bedding to the vacant side.
10.A simple alternative is to use only one-half of the box at a time; put your bedding and worms in one side
of the worm bin. Continue to bury food into the bedding until it is composted. Then add new bedding to
the empty half of the bin. Begin burying food on the new side.
11.Allow one month for the worms to migrate to the new side. Remove the worm castings. Repeat the
process. To be certain you have all the worms from the first side, expose the worms to bright light and wait
20 to 30 minutes. Remove the top layer until worms are exposed. Repeat until the worms are in a mass in
the center of the old bedding. Use the soil formed by the castings on potted plants or in the garden.
EVALUATION:Students should answer the following questions:
1. What are worm castings?
126
2. How many ounces or pounds of worms, bedding, water, and food waste do you need for each cubic foot of
a worm bin?
3. How are the food wastes being reduced (recycled) by the worms?
EXTENSIONS:1. Study the reactions of worms to different colors of light.
2. Study the food preferences of young versus mature worms.
3. Using four worm bins, study the reactions of the worms to the four food groups.
4. Study the other organisms present in the worm bin. What are the interrelationships of these organisms?
5. Study the effects of various mixtures of vermi-compost, peat moss, soil, and perlite on potted plants.
6. Calculate how much food the households of class members throw away in a day. Base the calculation on
the fact that each Alabama resident produces about 4.5 pounds (2 kg) of garbage in the home per day.
ORIGINAL DEVELOPMENT RESOURCES:South Carolina Health and Environmental Control, used with permission.
127
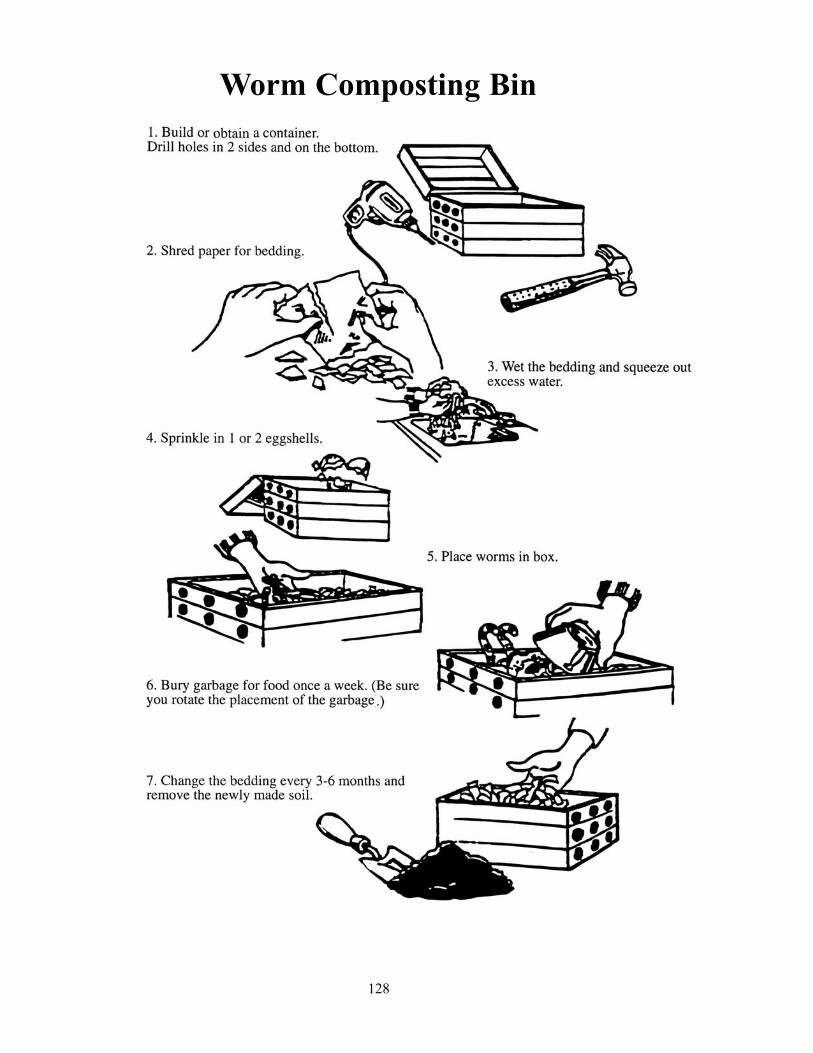
128
Worm Composting Bin
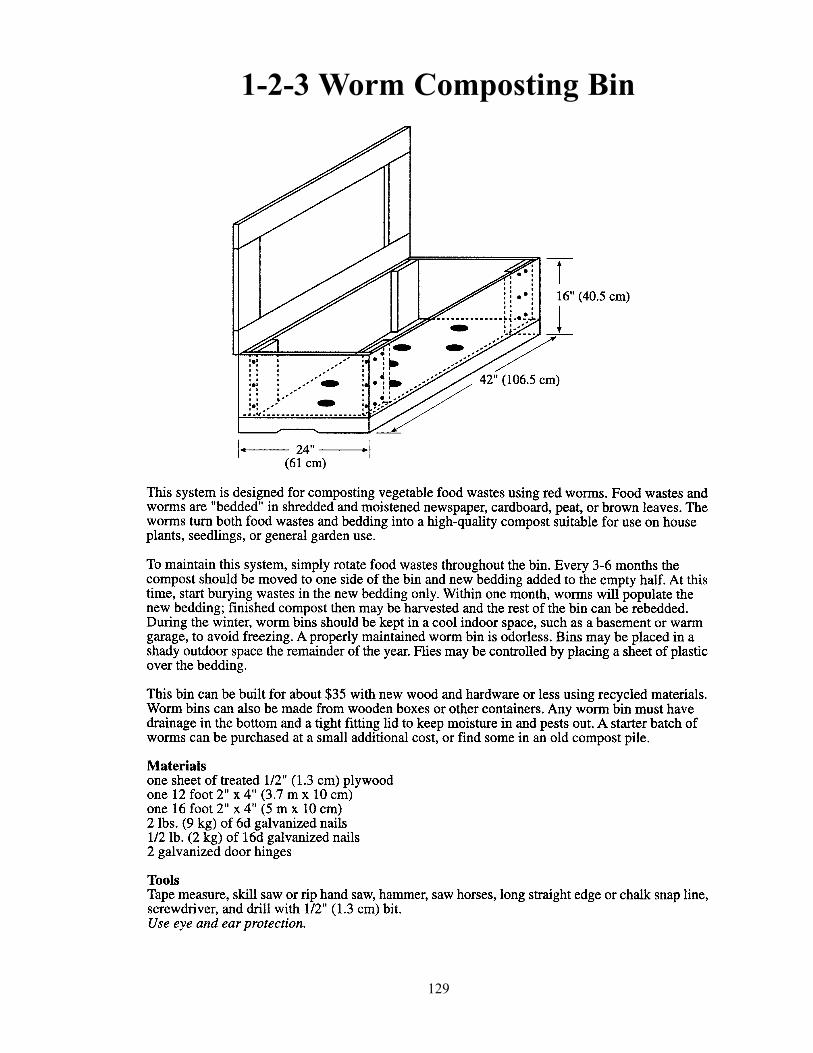
129
1-2-3 Worm Composting Bin
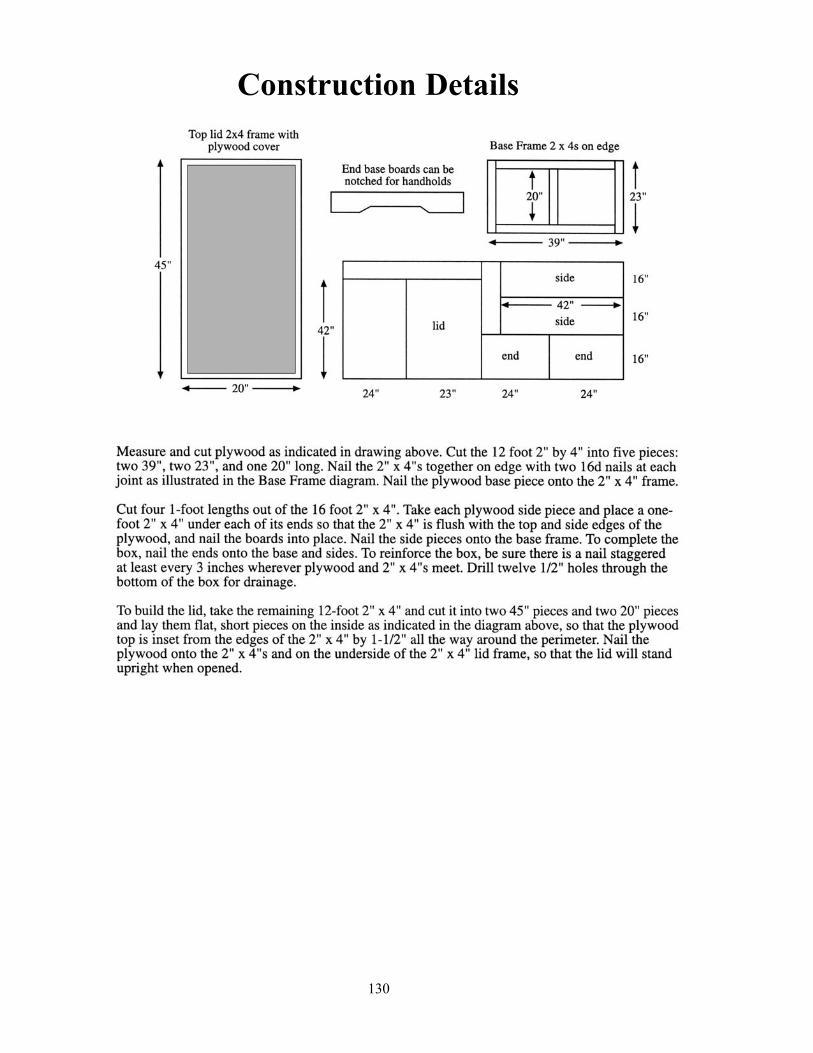
130
Construction Details
OBJECTIVES:Students will be able to:
1. Identify ways that advertisements are used to sell products.
BACKGROUND:In 1974 the Environmental Action Foundation published research
showing that the energy used to produce the packaging used
annually by a major fast food restaurant chain was equal to the
amount of energy required to supply the people of Boston,
Washington, San Francisco, and Pittsburgh with energy for a
year. This major chain and other chains have changed their
packaging strategies to use less Styrofoam and to use more
recycled content paper. Ask students if they think the changes in
packaging will use less energy and will reduce waste.
VOCABULARY:advertising, marketing, band wagon
PROCEDURE: 1. Display various advertisements. Have the students discuss:
• Which product would you buy? Why?
• What is advertising? What is the purpose of advertising?
• Does advertising influence what you buy? How?
• Which advertisement do you like best? Why?
• Do your reasons have anything to do with the quality or function of the product?
• Do you purchase name-brand items instead of generic items? Why?
2. Discuss ways in which products are promoted on television, on radio, and in print. Analyze at least 25 ads.
Note the following:
• What strategy does the advertiser use to sell the product?
• What is the advertisement really selling: convenience, health, sex appeal, status, fun, quality?
• Does the advertisement mention the packaging?
• Is the packaging reusable or recyclable?
• Does the ad suggest what you should do with the packaging?
3. Design a chart to help analyze characteristics of these ads. A sample follows. Feel free to add other
categories.
4. Make a composite chart that shows the results of all the surveys done by students. Discuss:
• What usually happens to the packaging?
• Do you think the manufacturer of the product should be responsible for what happens to the packaging
once the product is used? Why or why not?
Is It A Waste? What’s The Appeal?
Grades:6-8
Subjects:Science, Social Studies, Mathematics,
Language Arts, Marketing,
Environmental Education
Time Needed: One class period
Materials:samples of advertising from
newspapers and magazines
coupons for the same product but with
different name brands and types of
packaging.
WASTE MANAGEMENT
131 www.legacyenved.org
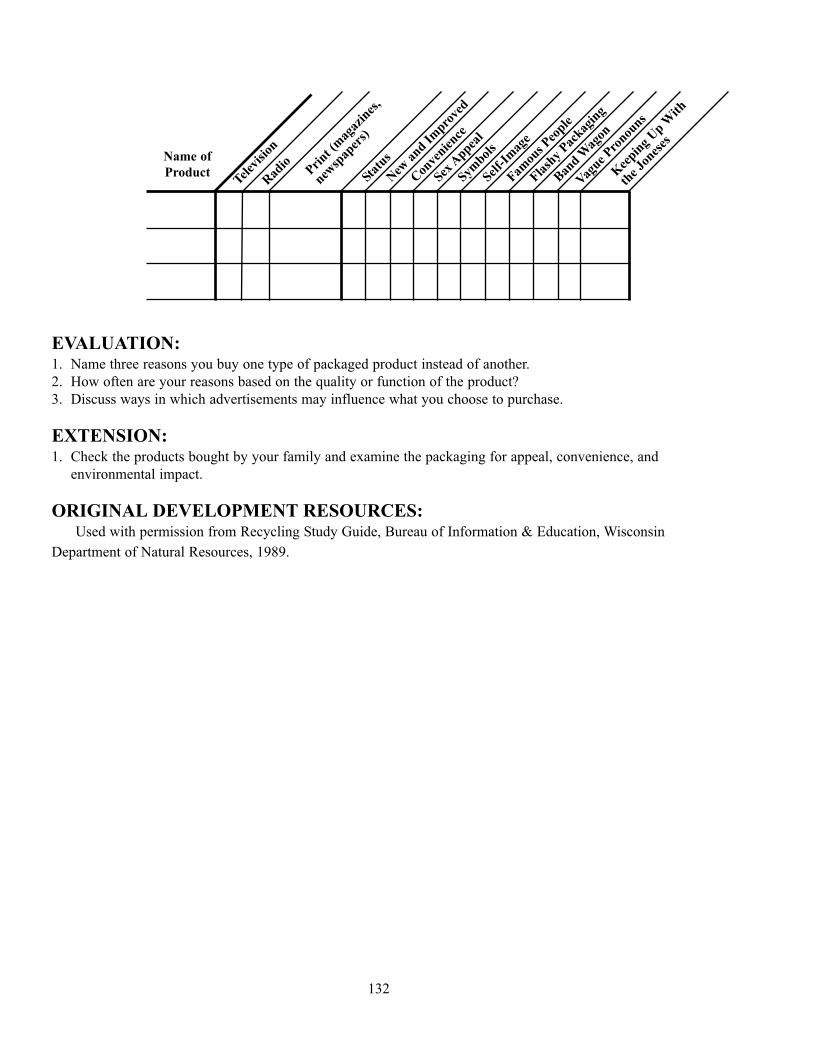
EVALUATION:1. Name three reasons you buy one type of packaged product instead of another.
2. How often are your reasons based on the quality or function of the product?
3. Discuss ways in which advertisements may influence what you choose to purchase.
EXTENSION: 1. Check the products bought by your family and examine the packaging for appeal, convenience, and
environmental impact.
ORIGINAL DEVELOPMENT RESOURCES:Used with permission from Recycling Study Guide, Bureau of Information & Education, Wisconsin
Department of Natural Resources, 1989.
132
Name of
ProductTel
evisio
n
Rad
ioPri
nt (m
agaz
ines
,
newsp
aper
s)
Stat
us
New
and I
mpro
ved
Con
venie
nce
Sex A
ppeal
Symbol
s
Self-Im
age
Famou
s Peo
ple
Flash
y Pac
kagin
g
Ban
d Wag
on
Vague
Pronou
ns
Kee
ping
Up W
ith
the
Jones
es
OBJECTIVES:Students will be able to:
1. Break down the components of producing a product.
2. Create a life cycle analysis of a taco.
3. Trace a product through its life cycle by starting with the
finished product.
BACKGROUND: Buying and using products that result in less garbage is one
aspect of source reduction or waste prevention. Life cycle
analysis gives a more complete picture of the waste and energy
associated with a product. Rather than just looking at the amount
of waste that ends up in a landfill or an incinerator, the analysis
measures energy use, material inputs, and waste generated from
the time raw materials are obtained to the final disposal of the
product. The product is evaluated through each of the following
six stages of the life cycle.
acquiring the raw materials
manufacturing and processing
distribution and transportation
use/reuse
recycling
disposal (waste management)
Each stage receives inputs of materials and energy and creates
outputs of wastes. Overall, these stages may have a significant
environmental impact. This activity uses a game to introduce
students to life cycle analysis.
VOCABULARY:life cycle analysis/assessment, waste, raw material
ADVANCE PREPARATION:1. The teacher should have a large room with the desks placed in a circle.
2. Obtain a varied assortment of consumer products and/or containers manufactured from a wide range of raw
materials. Place these materials in the center of the circle.
3. Discuss the Life Cycle Inventory handout.
PROCEDURE:Setting the Stage1. Introduce the concept of life cycle analysis. Lead students through the life cycle of a product, beginning
with raw material acquisition and ending with disposing of the product. Along the way, give various
examples of how energy is consumed and how waste products (air emissions and solid waste) are
produced.
2. Inform students they will be retracing the life cycle of a product from its disposal to its raw materials’
source.
3. Instruct students to sit in a circle. Place the objects you have brought to class in the center, designated as
Life Cycle Of A Taco
Grades: 6-8
Subjects: Science, Geography
Time Needed: Two 50-minute periods
Materials: handout of the Life Cycle inventory
large index cards
Provide a varied assortment of
consumer products and/or
containers manufactured from a
wide range of raw materials:
aluminum soda can
newspaper
food products with packaging
disposable diaper
clothing made from natural and
synthetic materials
WASTE MANAGEMENT
133 www.legacyenved.org
the “waste stream,” where the product is finally disposed.
Activity1. General Product Life Cycle Analysis: One student will select an object from the waste stream. Beginning
with the student who selected the object and moving clockwise around the circle, have students tell a life
cycle story about the product with each student building on the previous student’s statement. The first
student starts with raw materials. The rest work through transportation, manufacturing and processing,
packaging, consumer purchase, use, and disposal. (It may be helpful to write the steps on the chalkboard.)
2. Taco Life Cycle Analysis: The teacher should display the six product life cycle stages. Hand the students
numbered index cards, from which they can read the following descriptions in order to trace the product
life cycle stages. The teacher should start by saying, “Let’s take a look at all of the preparation that goes
into serving a taco.”
• Grain is grown, using a variety of fertilizers, herbicides, pesticides, and significant quantities of water.
Threshers, combines, and tractors are used to sow, grow, and reap the grain. All of these large pieces of
equipment burn fuel and emit pollutants and greenhouse gases.
• The grain is shipped to cattle ranches or feedlots where it is fed to cattle together with water. Waste
products include manure, methane, and uneaten grain.
• Cattle are shipped by truck or train to market, where they are fed and sold. They are shipped again to
processors. At the processing plants, the cattle are slaughtered and cut into large sections called primal
cuts. These must be quickly refrigerated and aged. Waste products include unusable animal parts, waste
water, and manure.
• The beef is shipped in refrigerated trucks and rail cars to food service warehouses where it is ground,
formed into ground beef, and boxed and wrapped for use. It is stored and frozen until needed. The beef is
shipped by freezer truck to stores and restaurants and is kept in cold storage until needed. Then it is
prepared by cooking the meat in a pan or grill.
• Grain is grown for use in baking. Vegetables are grown: producing tomatoes, onions, and lettuce. All
use fertilizer, pesticides, and herbicides plus large quantities of water. Farm machinery that uses fuel and
some chemicals is used.
• Grain is shipped to mills where equipment converts it into flour. The flour is packaged in bulk bags.
Vegetables are shipped to refrigerated warehouses and held in storage until needed. Then they are sent by
refrigerated trucks to stores and restaurants where they are cut up, cooked, and served. Some tomatoes and
onions are shipped to processing companies.
• The flour is shipped to bakeries where it is mixed with water and other ingredients. The dough is then
baked in ovens, which require heat energy in the form of gas, oil, electricity, or wood. Once cooled, the
tortillas are packaged and warehoused. Condiments also are packaged and shipped to warehouses. Then
they are shipped to local stores. Waste includes leftovers, which are thrown away. The tortillas are trucked
to local stores where they are used to make tacos.
• Trees are cut and oil or gas is drilled. The lumber and petroleum are shipped or piped to mills and
refineries. At the mill, lumber is pulped, using very large quantities of water and corrosive chemicals
including chlorine. Large machines then turn the pulp into paper, which is wound on rolls and stored.
• The paper and plastic are shipped to manufacturing plants, which make a variety of products:
polycoated paper for use in wraps and boxes; paper for use in bags; plastic wrap for use in bread, meat,
and vegetable packaging; and cardboard for use in pallets and boxes. Finished packaging is shipped to
points where it is needed. Wastes include most, if not all, of the used packaging including wrap used to
provide a freshly cooked, sanitary taco. The beef is then placed on a flour tortilla topped with condiments,
wrapped, and put under hot lights until served. Uneaten portions are thrown away.
Follow-Up1. Have the students discuss and summarize the life cycle analysis. Questions might include:
• What inputs and outputs resulted from manufacturing this product?
• Are all the outputs equal in terms of environmental effects?
134
• What were the environmental effects and could any be minimized?
• What other resources were consumed as a result of this product’s manufacture and distribution?
• Do you see how using less has a huge impact throughout a product’s life?
• Will you look at products differently now?
• What considerations do you now have as consumers that you did not have before?
• Where does the real waste occur in the production of tacos?
EXTENSIONS:1. Ask students to select a favorite item, research it, and then write or illustrate a life-cycle analysis about it.
If possible, have them contact manufacturers for information.
2. Have the students draw their own life cycle posters.
3. Have the students work in small groups to research a business to learn its operation philosophy,
manufacturing approach, environmental position, research and development activities, and special
problems relating to its industry including waste management.
ORIGINAL DEVELOPMENT RESOURCES:An ounce of prevention. Midland, MI: Dow Chemical Company.
ADDITIONAL RESOURCES:The Environmental Literacy Council: Life Cycle Analysis
135
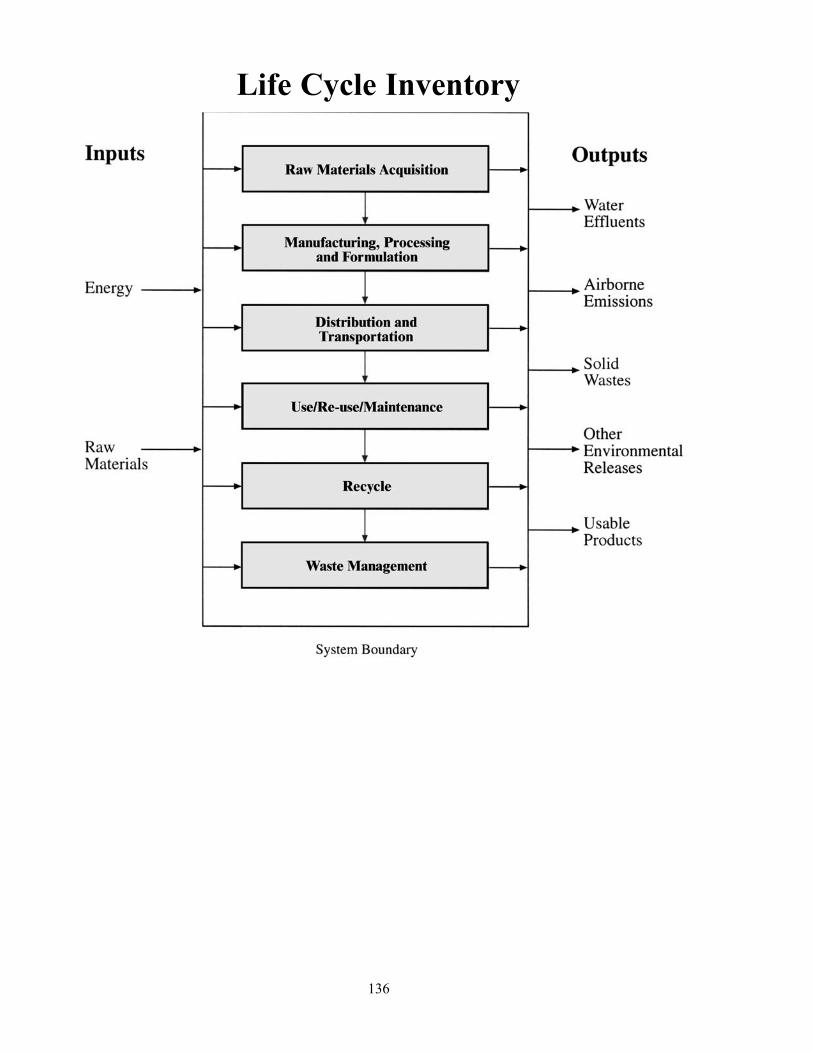
136
Life Cycle Inventory
OBJECTIVES:Students will be able to:
1. Make recycled paper to see and understand the by-products of
the process.
2. List ways that by-products of the paper manufacturing process
typically pose potential environmental concerns.
BACKGROUND:Paper cannot be recycled indefinitely because the fibers
eventually break down. However, many grades of paper can be
de-inked, cleaned, and bleached. These are processes that allow
paper to be reused as game boards, tissue paper, ticket stubs,
packaging, covers for books, insulation, and animal bedding. In
Alabama there are three mills that recycle the newspaper fibers
for uses other than newsprint. They are Gulf States, Paper
Corporation in Demopolis, Weyerhauser in Pine Hill and Cell-
Pak, Inc. in Decatur.
Although recycling paper saves natural resources and energy,
pollution problems still exist in the production of recycled paper.
To be recycled into many grades of paper, waste paper must have
contaminants removed.
Black printing inks used in newspapers are composed of about 30
percent pigment (usually carbon black) and about 70 percent
refined oil. Colored pigments in magazines—and increasingly in
newspapers—contain heavy metals.
New low-rub inks and laser printing cause additional problems
because they are difficult to remove from paper.
The paper-making process requires large amounts of water, which
must be cleaned of contaminants. The remaining paper sludge
also must be disposed of properly because petroleum distillates and
heavy metals can remain present in this material. Both the contaminated water and sludge must be treated in a
wastewater treatment plant before being released into the environment.
VOCABULARY:pH, contaminant, by-product, heavy metals, distillates, wastewater treatment, .de-inking, pulp, slurry
PROCEDURE:1. Divide the class into small groups and have each group make recycled paper out of a different type of
waste paper using the “making Recycled Paper” instructions.
2. While making paper, students should collect the water that drains through the screen while the paper is
bring pressed to check it for pollutants. Have each group strain the collected water and sludge through a
filter and examine what contaminants remain.
3. Have the students test the collected water after straining and note the pH, color, and sediment present. Set
Paper Recycling And By-Products
Grades:6-8
Subjects:Science, Social Studies, Art
Time Needed: Several class periods
Materials: several sheets of different types
of used paper (newsprint, white
office paper, construction paper,
envelopes)
nylon stocking,cheesecloth or millipore
filter
blender or egg beater and wide-
mouthed container
pans
large mixing spoons
cups to scoop with
blotters
screen made from window screen and
wood frame
sponges or towels to soak up water
warm water
a place to dry paper overnight
iron (to help dry paper)
litmus paper or pH test kit
WASTE MANAGEMENT
137 www.legacyenved.org
the samples aside (do not disturb) and note pH, color, and sediment after 24 hours.
4. Have each group complete the “Questions about Recycled Paper and Its By-Products” and discuss the
results as a class.
EVALUATION:Ask the students to write the answers to these questions:
1. What natural resources are conserved when paper is recycled?
2. What kinds of paper can be recycled?
3. Does recycling solve all paper solid waste problems?
EXTENSIONS:1. Visit or write an Alabama paper mill. Find out if the mill uses only virgin timber, a mixture of virgin
timber and recycled paper, or only recycled paper. Research the pollution control methods used in paper-
making plants.
2. Research the new soy-based inks and their effect on paper recycling.
3. As an art project, make recycled paper from various types of used paper such as colored construction
paper, white office paper, or brown paper bags. Students may also add bits of leaves, grass, flowers,
pinestraw, and other natural elements.
ORIGINAL DEVELOPMENT RESOURCES:www.papercoalition.org/PaperFactSheet.pdf
www.prwg.com/papermaking
Grummer, A. Complete guide to easy papermaking. ISBN 0-87341-710-0
Grummer. A. Let’s make paper- classroom kit. Available for ordering through www.prwg.com.
ADDITIONAL RESOURCES:Paper Recyling Coalition: http://www.paperrecyclingcoalition.com
http://arnoldgrummer.org
Conservatree. Found at: http://www.conservatree.org
138
Questions About Recycled Paper
and Its By-Products
1. What materials are in the sediment and sludge?
2. What is causing the discoloration of the water?
3. Is the strained water less polluted than the unstrained water? Why?
4. Should the remaining paper sludge be treated as solid waste or hazardous waste?
5. How can we reduce pollution problems from the making of recycled paper?
139
The Emerging World of Deinkingexcerpts from the article that appeared in Waste Age. June 1992
Whether by floating, washing, or exploding, the technology to remove ink from waste paper is flourishing in
the U.S.
As more and more waste paper is collected by U.S. recycling programs, paper mills are having a hard time
keeping pace. Despite many commitments across the country to recycle paper with new deinking facilities, the
demand for waste paper has been unable to keep up with supply. That’s one of the main reasons prices for
waste paper are dismal.
Mills do have the technology to handle the waste paper. Complete deinking technologies have developed at a
rapid pace in recent years, and the paper industry promised 9.3 million tons of (annual) deinking capacity in
North America by 1995. Processing that capacity will require some form of the two most common deinking
technologies at the heart of it all: flotation and washing. Steam explosion technology and other methods for
deinking are gaining momentum - with many pilot programs proving successful - but they have yet to be used
in large-scale commercial production of deinked pulp.
Flotation deinking is self-describing. Ink is literally floated off paper and out of a pulp slurry.
An extensive series of steps
Bowater, a major newsprint producer in the southern U.S., brought a flotation deinking machine on-line in
Calhoun, TN, in 1991. The $67 million facility uses about eight broad steps to deink 380 tons per day of old
newspapers (ONP) and old magazines (OMG) to produce 300 tons per day of clean secondary fiber.
Mills recently began mixing in OMG because they found the clay content helps in the flotation stage.
Magazine paper uses clay to help smooth the paper surface and create an optimum surface to which glossy
inks can adhere. Mills that use flotation but include no OMG add clay or other fillers directly. The most
common mixture of ONP and OMG is a 70/30 percent mix, although some mills vary the percentages based
on what they want to accomplish.
Clean ONP and OMG ride a conveyor to a drum pulper or a hydropulper. Bowater’s pulper throws a slushball
on ONP, OMG, and water around for about 20 minutes. This action serves to break apart the paper by slowly
deteriorating all the bonds holding the paper together.
The unique rotating ability of the drum not only ensures a good tossing but, after time, works the paper to one
end where tiny slots wait to begin the first of many filtration steps. Pulp and water drain through these one-
millimeter holes, leaving behind large undesirables such as plastics, wire, labels, and “stickies.” Stickies are
any adhesive-type substance found on waste paper, and they can be a big contaminant in any recycled paper-
making process.
Smaller undesirables face more screens as the pulp mass moves toward the flotation cells. These holes, six-
one-thousandths of an inch in width, stop plastics and other debris that made it out of the drum pulper as well
as capture some larger ink particles. As the pulp moves on toward the flotation cells, only ink remains as the
last major undesirable targeted for elimination.
Capturing ink in the cell
The barrage on the ink starts 10 feet before the flotation cell where a section of wide pipe called a static
mixer injects air bubbles into the pulp slurry as it moves toward the cell. Full of air and water, the pulp is
ready to be dumped into a long flotation cell. Bowater’s cell is 10 feet wide by 40 feet long. There, the
forward movement is stopped, and the mass of pulp nearly comes to rest. As it sits there, the bubbles of air
140
slowly rise to the surface, capturing particles of ink along the way and dragging them to the surface of the
mush.
Ink particles hitch rides with the air bubbles because of chemistry. “Air bubbles are hydrophobic, which
means they don’t like water,” explains Tom Woodward, marketing manager of Betz PaperChem (Jacksonville,
FL). “Hydrophobic things attract other hydrophobic things. Most ink particles are naturally hydrophobic.”
Clay particles coming off the OMG fibers also help to absorb more ink.
Once on the surface of the slurry, the ink and ink-soaked clay are skimmed off the top, and the slurry moves
to another stage. At Bowater the slurry is put through five flotation cells where ink is continually removed in
this manner. In the last cell, the pH level of the water is changed from alkaline to acidic. “This final pH shock
helps loosen even more ink,” says Sam Bittes, assistant project manager of engineering for the Calhoun mill.
After flotation cells have thoroughly worked the paper, centrifugal cleaners spin the pulp mass. Denser
particles, including larger ink particles, are flung to the outside of the vessel and removed.
Finally, the pulp is cleaned across fabric washers. These are actually fine sheets of 60-mesh fabric, meaning
they have 60 holes per square inch. This washing stage is somewhat similar to systems that use strictly
washing to deink their pulp. The principle is the same in that water is drained from the pulp and more ink is
cleaned off, leaving almost 100 percent pulp.
The deinked pulp at Bowater is then dried and used as feedstock for the production of newsprint at the
Calhoun mill. Bowater removes 98-99 percent of the ink or “all visible ink,” according to Bittes. The mill
adds virgin fiber to produce 2,250 tons per day of newsprint containing up to 40 percent recycled content: on
the average, sheets have 15-20 percent recycled content.
Approximately 800 newspapers use Bowater’s recycled newsprint, including USA Today and the Washington
Post.
Like laundry in a blender
Strictly washing systems use essentially the same types of initial screens and cleaners as the flotation system
described, but the core of the line is large washing vessels or “giant kitchen blenders,” according to Southeast
Paper Manufacturing (Dublin, GA). Southeast Paper’s washing system deinks about 560,000 tons per year of
ONP to produce 100 percent recycled-content newsprint.
Southeast’s process starts by mixing ONP with 20,000 gallons of water and special chemicals that help pull
the ink off the paper. This recipe is mixed inside continuous pulpers, which are 20 feet in diameter and churn
the mass with six-foot rotors. “The process lifts ink from paper just like detergents lift grease and dirt from
clothes in a washing machine,” the company explains.
What happens next is actually the opposite of what happens in the flotation process. Many of the chemicals in
the pulpers change ink particles, which naturally don’t like water, into hydrophilic particles that do like water.
“As a result, these particles drain off with the water and the pulp is left behind,” says Betz PaperChem’s
Woodward.
“It’s just like doing a load of laundry over and over again—a series of dilutions and thickenings. You rinse it
off and hope it doesn’t get back on the clothes—or the pulp,” Woodward notes. Much of the chemicals used in
the process are called antiredeposition agents, just like laundry detergents. In fact, Woodward says when he
first entered the field of deinking, much of the background information he perused came from the laundry
detergent industry. Once completely cleaned, the pulp is bleached with peroxide; this adds brightness to the
recycled paper. Using this process, Southeast produces 460,000 tons per day of recycled content newsprint for
a number of customers including the New York Times.
141
Which is best?
Flotation deinking came to the U.S. about five years ago from European and Asian sources. Japan, Germany,
Finland, and Sweden had been using flotation deinking for years because they needed to conserve as much
water as possible given their limited resources. Since flotation requires less water than washing, it was the
system of choice for those countries. In the U.S., meanwhile, washing systems were traditionally the only way
paper was deinked. In the past five years, things have changed dramatically. “Washing is relatively expensive
compared to flotation,” Bowater’s Bittes says. “It (washing) was the way it was done since whenever deinking
began years ago until about five years ago. It’s the older, conventional way of doing it...(and) it uses huge
amounts of water.” Bowater saves water by primarily using the flotation process.
According to Betz PaperChem’s Woodward, the answer to which process deinks better may be both
technologies. “If there is a trend in newsprint deinking,” Woodward says, “it’s a combination approach of
washing and flotation deinking, although flotation is often referred to as the workhorse of the two.”
Justification for a combination of the two systems makes sense based on newsprint or office paper deinking
because mills want to lift as much ink as possible in the quest for brighter recycled sheets. Ink particles come
in a wide range of sizes from one to 350 microns or more in diameters. Each system has its limitations in
catching different sizes; but working in tandem, the process can remove more ink.
“Washing works best for the smallest sizes in the one-to-20-micron range, while flotation is most efficient in
the 20-to-150-micron range,” Woodward says. Although the smallest dot of ink visible to the human eye falls
around the 60 micron diameter, particles below that can still dull brightness by absorbing rather than reflecting
light. Such dullness can be picked up by the human eye. At this point, the choice of which system to use—or
which system to use the most of in combination—depends on what a mill wants to produce and what a mill is
using as feedstock.
New technologies, tougher inks
With more new types of waste paper being collected for recycling, a need for alternate methods of deinking
has arisen in the paper industry. Steam explosion deinking, for example, is slowly gaining speed and
acceptance in the paper industry as a viable alternative to flotation or washing. Developed by Stake
Technologies Ltd. (Stake Tech, Norval, Ont.), the process literally explodes waste paper into pieces.
In explosion technology, waste paper is fed into a high pressure chamber. Pressure is then dropped suddenly
to atmospheric pressure; and, as a result, the paper is torn asunder. While this technology breaks down the
waste paper and ink, the process still requires other, more common methods of deinking to remove all the ink,
especially if the end product desired is a higher grade sheet such as newsprint or writing paper.
“Steam explosion replaces the hydropulper and the disperser, and in most cases eliminates the need for
flotation cells. It’s still in the pilot program phase, though,” says Brecc Avellar, technical director for DeNovo,
StakeTech’s development company.
Other new deinking technologies and challenges come with the rise in office paper recycling. Office paper
deinking requires a little more work because much of the material has been printed with laser ink. Five years
ago, laser inks made up about 30 percent of all collected office paper. Today 80 percent of the ink on office
paper is laser. Just about any high-speed copier or printing machine applies laser inks.
The growing prevalence of laser ink, coupled with the increase in office paper recycling programs, raises the
stakes because flotation and washing systems have difficulties removing all the laser ink from the paper.
While together, flotation and washing successfully remove ink particles from one to 150 microns. In size
some laser particles are bigger than that. This often requires a way to break down further the size of the
142
particles such as with a dispersion unit. Dispersion units heat and soften laser inks and then mechanically tear
the paper apart.
Dispersion breaks down the ink and the paper to more manageable sizes, but the actual units can cost extra. In
fact, since paper cannot go directly into a dispersion unit, a series of screens and a flotation cell must come
before and after the dispersion unit. “To do office waste paper successfully, you have to have a whole second
deinking plant,” Woodward says.
Another alternative technology to handle laser inks actually makes the ink particles bigger before removing
them. The process that uses centrifugal force involves chemically altering the ink particles to make them
denser and larger—in the 350-micron and higher range. Once at that size, particles can be thrown to the
outside by a centrifugal cleaner. This process separates the ink and the pulp just as other deinking processes
do.
Not all inks lend themselves to any of these processes. The goal of removing ink from paper is still out of
reach for some printed items such as ultraviolet (UV) cured inks. These inks decorate luxury packaging, such
as perfume boxes, with highly colorful designs. UV-cured inks were designed in response to environmental
objections to the amount of solvents that were originally being used to make such packaging.
The solution to these environmental outcries was ink that is designed to polymerize in the presence of UV
light. Although non-deinkable, packaging blazoned with these inks can be recycled into items, such as
boxboard or corrugated medium, which don’t require ink removal prior to recycling. Perhaps, however, if UV-
cured inks become more widespread, deinking technology for those inks will follow.
143
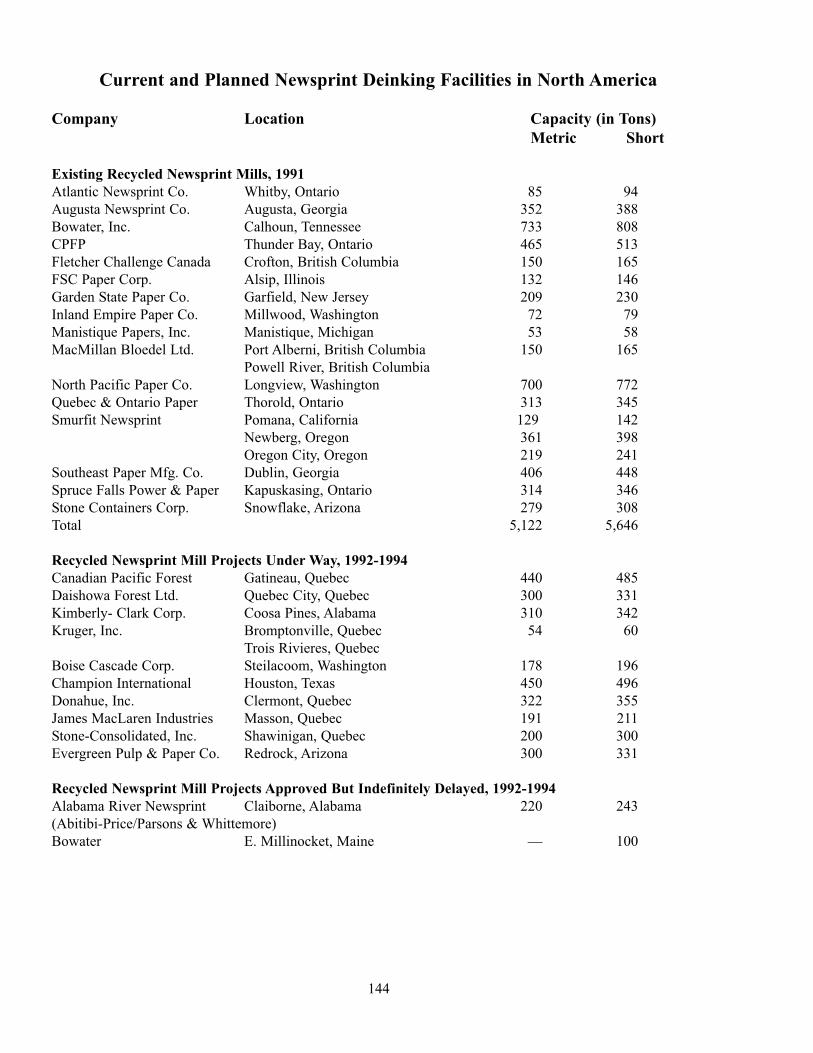
144
Current and Planned Newsprint Deinking Facilities in North America
Company Location Capacity (in Tons)
Metric Short
Existing Recycled Newsprint Mills, 1991
Atlantic Newsprint Co. Whitby, Ontario 85 94
Augusta Newsprint Co. Augusta, Georgia 352 388
Bowater, Inc. Calhoun, Tennessee 733 808
CPFP Thunder Bay, Ontario 465 513
Fletcher Challenge Canada Crofton, British Columbia 150 165
FSC Paper Corp. Alsip, Illinois 132 146
Garden State Paper Co. Garfield, New Jersey 209 230
Inland Empire Paper Co. Millwood, Washington 72 79
Manistique Papers, Inc. Manistique, Michigan 53 58
MacMillan Bloedel Ltd. Port Alberni, British Columbia 150 165
Powell River, British Columbia
North Pacific Paper Co. Longview, Washington 700 772
Quebec & Ontario Paper Thorold, Ontario 313 345
Smurfit Newsprint Pomana, California 129 142
Newberg, Oregon 361 398
Oregon City, Oregon 219 241
Southeast Paper Mfg. Co. Dublin, Georgia 406 448
Spruce Falls Power & Paper Kapuskasing, Ontario 314 346
Stone Containers Corp. Snowflake, Arizona 279 308
Total 5,122 5,646
Recycled Newsprint Mill Projects Under Way, 1992-1994
Canadian Pacific Forest Gatineau, Quebec 440 485
Daishowa Forest Ltd. Quebec City, Quebec 300 331
Kimberly- Clark Corp. Coosa Pines, Alabama 310 342
Kruger, Inc. Bromptonville, Quebec 54 60
Trois Rivieres, Quebec
Boise Cascade Corp. Steilacoom, Washington 178 196
Champion International Houston, Texas 450 496
Donahue, Inc. Clermont, Quebec 322 355
James MacLaren Industries Masson, Quebec 191 211
Stone-Consolidated, Inc. Shawinigan, Quebec 200 300
Evergreen Pulp & Paper Co. Redrock, Arizona 300 331
Recycled Newsprint Mill Projects Approved But Indefinitely Delayed, 1992-1994
Alabama River Newsprint Claiborne, Alabama 220 243
(Abitibi-Price/Parsons & Whittemore)
Bowater E. Millinocket, Maine — 100
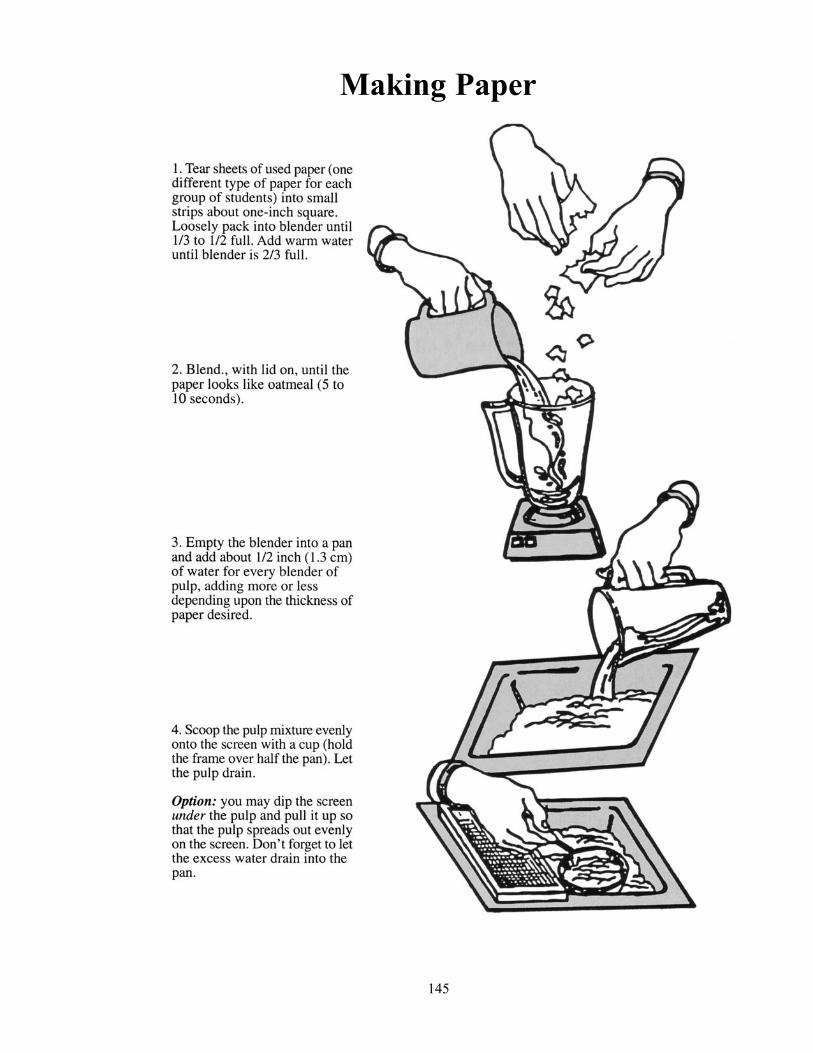
145
Making Paper
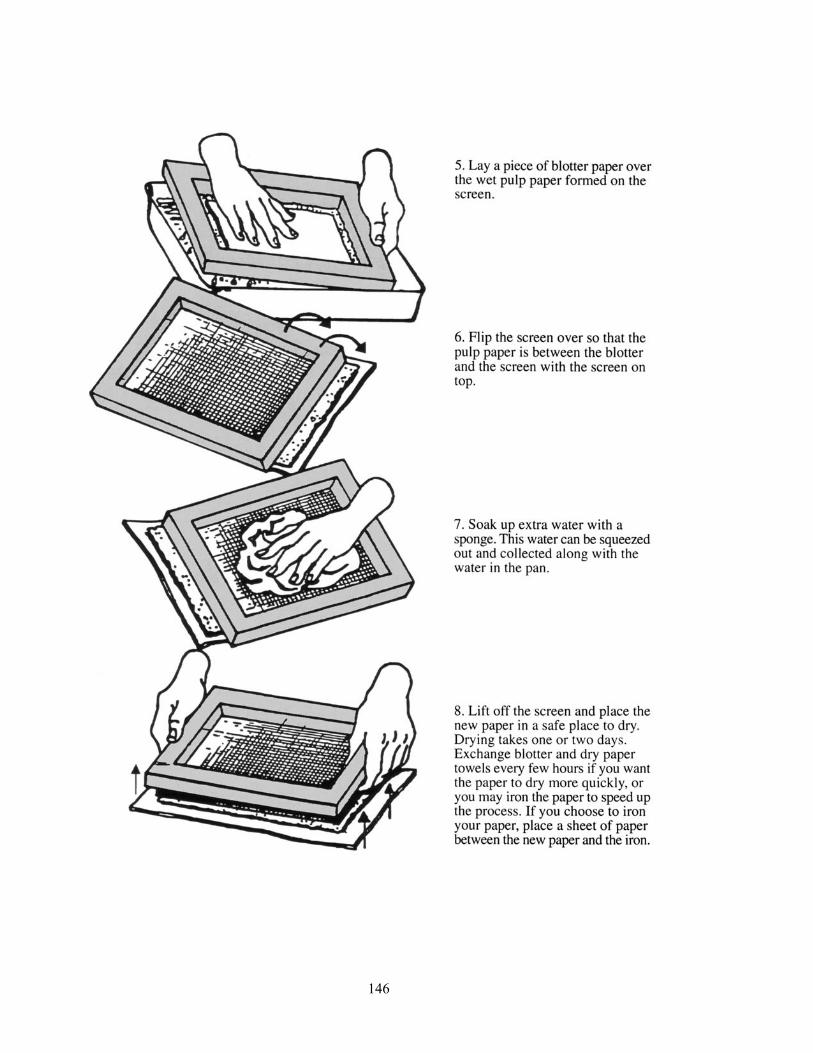
146
OBJECTIVE:Students will be able to:
1. Explain how recycling and using biodegradable products
conserve resources and protect the environment.
BACKGROUND:Plastics are wonderful materials. Some are soft and pliable;
others are hard and durable. Some plastics are nearly unbreakable
and can last as long as a human life time. However plastics have
some serious drawbacks. They add to garbage and add to a
growing problem of trash disposal. Many plastics are recyclable.
Most plastics are nonbiodegradable, which means they do not
break down through natural processes. Plastics are made from
petroleum that is a nonrenewable resource. We use plastic goods
in our daily lives so much that we are not aware that often we are
responsible for polluting the environment. We can limit the usage of
nonrecyclable plastic materials and can use substitutes for the protection of the environment. Plastics make up
10.5% of the municipal solid waste stream.
VOCABULARY:biodegradable, nonrenewable resources, recyclable plastics
PROCEDURE: 1. Give each student a copy of the “Plastics, Everywhere” chart. Ask them to make a list of things they often
use that are made of plastic.
2. Then have them list objects or materials to replace plastic that are either recyclable or biodegradable.
3. Have the students indicate whether or not they are willing to use the substitutes for the things they listed
made of plastics.
EVALUATION:1. Was it easy to think of substitutes for the nonrecyclable plastics?
2. Were most of your substitutes biodegradable or recyclable?
3. Which way is better: to find biodegradable items or to find recyclable items?
EXTENSION:1. Research the recycling program in your area. Are plastics recycled?
2. Compare energy costs of recycling versus biodegradation.
ORIGINAL DEVELOPMENT RESOURCES:www.epa.gov
Plastics, Everywhere
Grades:6-8
Subject:Science
Time Needed: 45 minutes
Materials: plastics use chart
WASTE MANAGEMENT
147 www.legacyenved.org
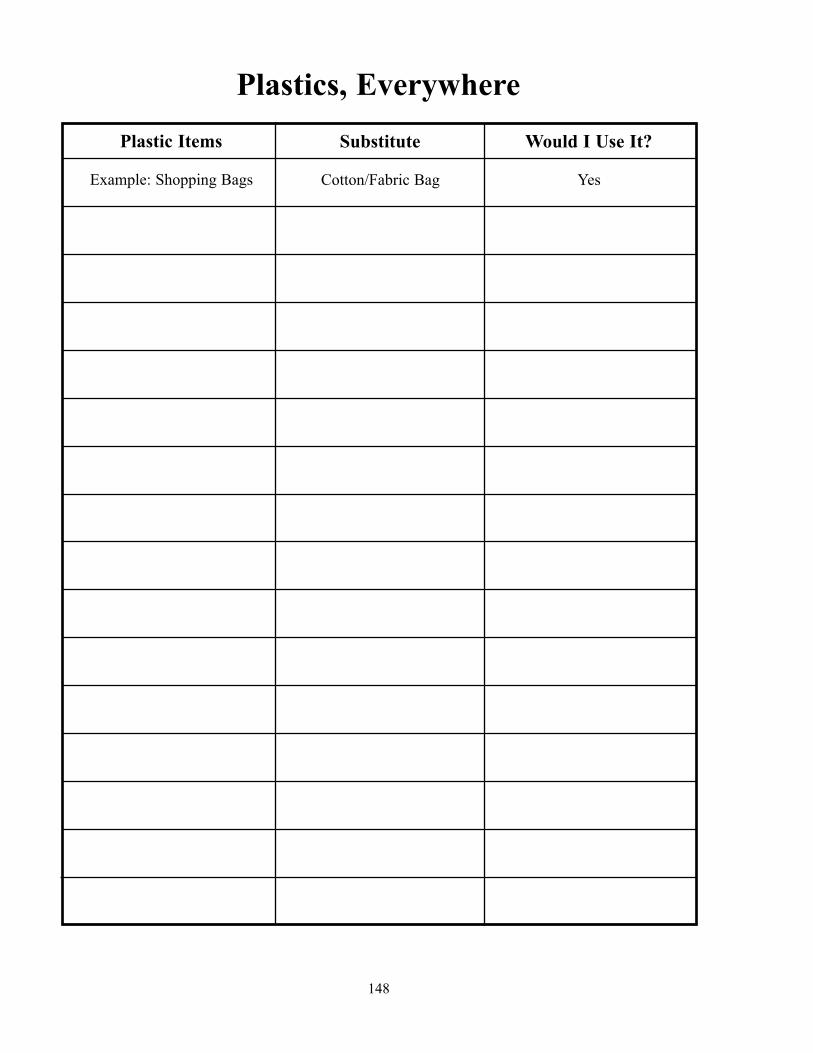
148
Plastics, Everywhere
Plastic Items Substitute Would I Use It?
Example: Shopping Bags Cotton/Fabric Bag Yes
OBJECTIVES:
Students will be able to:
1. Understand and publiciae precycling concepts.
2. Describe the properties of plastic that make it recyclable.
2. Determine the monetary savings gained when plastic is
recycled.
BACKGROUND:In 1989 the city government of Berkeley, California, initiated a
campaign to encourage consumers to buy food packaged in
biodegradable or recyclable materials. They called it
“precycling.” “Precycling” is the term used for something we can
all practice just by following this familiar slogan, “Reduce waste
before you buy!” Simply by making the correct buying choices,
by precycling, we can prevent excessive and nonrecyclable
materials from getting into our waste stream. Each American uses
about 190 pounds of plastic per year, and about 60 pounds of it is
packaging we discard as soon as the package is opened?
Americans also go through 2.5 million plastic bottles every hour.
This means that roughly 5 million tons—more than half of all plastics we throw away each year—are from
packaging. Precycling may be the easiest way to help save the Earth. People can learn to precycle while they
shop.
VOCABULARY:recycling, pollution, waste, precycle, plastic
ADVANCE PREPARATION:1. Explain to the students what precycling means.
2. Have paper, pencils, poster boards, and an assortment of plastic containers available for the students to use.
You may also want to bring in markers so the students can be more creative when drawing on the poster
boards.
3. Research various types of plastics, especially the cost of materials, energy to produce, and waste
management.
PROCEDURE:Setting the Stage1. Have various plastic containers in view for all students to observe.
2. Discuss with the students the similarities and differences of the various plastic containers, and hypothesize
how much plastic we throw away each day and year.
3. Explain to the students that they will be starting a plastic recycling program.
4. Discuss with the students the various recycling code numbers on plastics.
Activity1. Begin the activity by displaying an assortment of plastic containers and discussing with the students the
“real” costs of producing plastics and how much plastic is sold.
2. Locate and contact the nearest plastic collection center for the current market price.
3. Determine how much plastic the students will have to collect to make a purchase for the school.
Precycling
Grades: 6-8
Subjects: Science, Math
Time Needed: One to two class periods
Materials: assortment of plastic containers
pencils
markers
poster boards
papers
WASTE MANAGEMENT
149 www.legacyenved.org
4. Find out how long it will take to collect the money needed. Plan the amount of plastic they will need to
collect each week.
5. Determine the kind of incentives that will be offered to encourage student participation.
6. Share this example of a successful class venture:
School—Phillips Preparatory
Enrollment—800 students
Goal—$800 for a computer
Weekly collection at school (amount)
Average price of plastic
Value of weekly collection—between $23 and $24
Time needed—33 to 35 weeks or approximately 1 school year
7. Have the students make posters and announcements explaining the plastic recycling program. Also have
them make posters about what precycling is and the fact that everyone should be more aware of buying
precycled containers in the grocery stores.
Follow-Up1. Have students list examples of simple “precycling” tips. For example:
• Buy eggs in cardboard, not Styrofoam, cartons.
• Most cereal boxes are made of recycled cardboard. It’s easy to tell—the boxes are gray on the inside.
The packaging for many varieties of cookies, crackers, or dry goods often is recycled. So it helps to buy
cereals in recycled boxes.
• Look for the “recycled” logo on food packages.
• Buy fresh fruit and vegetables loose rather than in plastic bags.
• Avoid plastic containers, especially “squeezable” ones, which are made up of different types of plastic
in several layers and are non-biodegradable and non-recyclable.
EXTENSIONS:1. Try this exercise with containers made of other materials like aluminum.
2. Interview people who are involved in waste management (elected officials, sanitary landfill operators,
recycling center personnel) and write an article about your findings.
3. Take photographs of your collection process and write an article for publication in a local or regional
newspaper.
4. Find out what your community pays for plastic litter. How much money would the taxpayers save if plastic
were not discarded as litter?
5. List some ways the recycling of plastic benefits you as a citizen.
ORIGINAL DEVELOPMENT RESOURCES:The Earth Works Group. (1989). 50 simple things you can do to save the earth. Berkeley, CA:
Earthworks Press.
Holmes, N. J. (1985). Gateways to science (Grade 5). New York, NY: McGraw-Hill.
ADDITIONAL RESOURCES:Javna, J. Javna, S. &Javna, J. (2008) 50 Simple Things You Can do to Save the Earth.
150
OBJECTIVES:Students will be able to:
1. Identify the degradable rate of certain products.
2. Identify specific ways to limit amounts of trash created by
people.
BACKGROUND:Each American produces in excess of 4 1/2 lbs of garbage a day.
Americans produce in excess of 220 million tons of garbage
(solid waste) a year. Fifty-five percent of the waste in the United
States is buried in municipal landfills. The number of municipal
landfills has declined by over 50 percent since 1979, which has
caused a definite solid waste crisis. According to the
Environmental Protection Agency, the U.S. has 3,091 active
landfils and more than 10,000old municipal landfills.
It is estimated that more than half the nation’s cities will run out
of landfill capacity in less than five years. According to 2010
data, the following are the percentages of wastes found in a
typical landfill:
paper products 28.5%
glass 4.6%
plastic products 12.4%
yard waste 13.4%
food items 13.9%
rubber, leather, & textiles 8.4%
metal 9%
wood 6.4%
other 3.4%
Landfills contain pollutants like pesticides, solvents, and heavy metals that are harmful to people and wildlife.
Every three months, the United States throws away enough iron or steel to supply the auto makers of the
United States and Japan. Enough aluminum is thrown away to rebuild the entire U.S. air fleet every three
months. Not only does household waste end up in landfills; but also industrial and municipal wastes are
dumped in landfills, which could contain sewage, hospital, and military wastes. If leachate from landfills is
not controlled, it can contaminate groundwater. Another problem that landfills may create involves the
production of dangerous levels of methane gas. As layers of garbage compact and decompose, methane gas is
produced and is released into the air causing air pollution.
“Garbologists” are discovering that things they thought would decompose, don’t. They have found 50-year-
old carrots, steaks, newspapers, and other so-called “biodegradable” materials still intact.
Consider these facts:
• The U.S. throws away enough paper products in one year to build a 12-foot wall from Los Angeles to New
York City.
• Every two weeks the U. S. throws away enough glass and bottles that, if stacked, would reach 1,350 feet—
nearly as tall as the Empire State Building.
• Every 20 minutes there are enough cars dumped in landfills that, if stacked on top of each other, would
Talking Trash: Biodegradable Landfills?
Grades:6-8
Subjects:Science, Math
Time Needed: Two to three class periods over a
period of five to six months
Materials: disposable paper and plastic materials
from various fast-food restaurants
0.75 mil plastic bag
shovels
WASTE MANAGEMENT
151 www.legacyenved.org
reach the top of the Empire State Building.
• It takes 2-3 years for a plastic garbage bag to decompose.
• It takes 1-5 years for a winter sock to decompose.
• It takes less than 1 year for a newspaper to decompose (usually).
• It takes 350 years for a diaper to decompose.
• It takes 50 years for a leather purse to decompose.
• It takes 1 million years for glass to decompose.
Many landfills leak, causing contamination of the groundwater supply. New landfills created since October 1,
1993, control leachate—the leaking of landfills—by using a plastic lining and layers of sand, clay, and gravel
at the bottom. However, some older landfills that were not lined by these methods continue to contaminate
water supplies.
There are many things that the public can do to reduce the amount of garbage that ends up in landfills:
Reduce: Create less waste by thinking before you buy items. Don’t buy disposable things such as spray cans,
plastic pens, Styrofoam items, juice boxes, and items using excess packaging. Use “customer power” and
avoid wasteful packaging like disposables and excess packaging. (See also “Precycling” activity.)
Reuse: Buy items that can be reused rather than thrown away such as plastic containers instead of Styrofoam
throwaways, rags instead of paper towels, and rechargeable batteries. Batteries are a major problem for
landfills! Every year foam packaging thrown in landfills could cover Washington, DC, in one foot of trash.
Repair things instead of replacing things. Borrow or rent tools. Donate clothes instead of just throwing them
away. Compost as much as you can. Remember, toss means loss.
Recycle: Recycle as much as possible. Besides the typical newspapers, plastics, and glass, there are many
other things that can be recycled that you might not have thought of. Many scrap metal companies will take
old wire, pipes, and metal materials. Purchase paper and other products that contain recycled materials
content.
VOCABULARY:biodegradable, landfill, leachate, groundwater, garbologist, decompose, methane gas
PROCEDURE:1. Have the students collect disposable paper and plastic materials from various fast-food restaurants.
2. Separate the materials collected into two groups.
3. Place one group of materials into a 0.75t mil thick garbage bag.
4. Bury both groups of materials (bagged and non-bagged) 1-2 feet into the ground.
5. Have the students make hypotheses about the two groups as to their biodegradability.
6. After about 5-6 months, dig up material. Wear gloves.
Follow-Up:1. After about 5-6 months, dig up material. Wear gloves.
2. Analyze the material for an approximate percentage of decomposition.
3. Have the students record their conclusions.
4. Discuss the fact that water and air are needed for decomposition and that, if those cannot reach the
material in a landfill, it will not decompose very fast.
EXTENSIONS:1. Take a field trip to a local landfill.
2. Have the students research landfills and trash/garbage. Then write a script for a video. Have the students
produce a video that will teach others about the importance of trash reduction. Place the video in the
school library or have the students present the video to classes.
152

3. Make an appointment to meet the Public Service Director or Community Affairs Director of a local TV
station or radio station. Then create a Public Service Announcement (PSA) about the importance of
reducing trash and the ways homeowners can reduce, reuse, and recycle.
ORIGINAL DEVELOPMENT RESOURCES:www.epa.gov (gives list of Alabama permitted landfills)
153

Notes
154
OBJECTIVE:Students will be able to:
1. Calculate the reduction in weight and volume of solid waste
from burning.
BACKGROUND:This activity illustrates the volume and weight reduction possible
through burning waste. It also illustrates that burning produces air
emissions, but it does not simulate the operation of a state-of-the-
art incinerator. While open-air burning allows pollutants to escape
into the atmosphere, today’s incinerators capture about 99 percent
of those emissions. Therefore, weight and volume reductions will
be more dramatic in this experiment than in an incinerator.
Caution: Do as a Teacher Demonstration1. Do not burn any types of plastics. It is impossible to tell what
types of resins and/or additives are used in the hundreds of
different plastic packaging types. Many plastics, such as PVC,
polypropylene, or polystyrene, produce toxins when burned.
2. Perform this experiment outside if your school does not have
laboratory facilities for burning. Also, it is necessary to have
a fire extinguisher or fire blanket handy.
VOCABULARY:volume, ash, incinerate, toxins, precipitator
ADVANCE PREPARATION:1. Using a punch-type can opener, punch several ventilation
holes about one inch from the bottom of the one-gallon metal
can.
2. Gather ignitable materials for the activity.
PROCEDURE:Setting the Stage1. Distribute student worksheets and explain that in this lesson waste items will be burned to observe the
effects on incineration. Tape cardboard pieces together to form a box with four sides and a bottom or use a
pre-made box such as a shoe box. Fill the box with the waste and have the students calculate the volume.
Volume of waste = length x width x height(depth). This can be expressed in inches or cubic cm.
Activity1. Transfer the waste from the cardboard box to the gallon can. DO NOT BURN THE CARDBOARD BOX.
Light the materials and immediately cover the top of the can with the screen. Observe what comes out of
the can while the materials are burning. Have the students record their observations in the appropriate area
on the worksheet for future discussion.
2. When burning is complete and the ashes have cooled, return the ashes to the cardboard box.
Spread them evenly on the bottom of the box and measure the height (depth) of the ash layer.
Tin Can Incinerator
Grades:6-8
Subjects:Science, Math
Time Needed: One to two class periods
Materials: one-gallon metal can
a piece of metal screen large enough to
cover the top of the can
five pieces of cardboard six inches
square
masking tape or use a pre-made box
(like a shoe box)
enough solid waste to fill a box
6“ x 6” x 6” (15 cm x 15 cm x 15
cm)
materials that are easy to ignite such as
paper, popsicle sticks, kindling
matches
ruler and balance
marker
safety goggles
WASTE MANAGEMENT
155 www.legacyenved.org
Using the same formula above, calculate the volume of the ash. Now calculate the difference in the volume
occupied by the waste before and after burning.
3. Weigh box of waste before burning and afterwards with ashes. Record results on student worksheet.
EVALUATION:1. Give correct computation of the formulas.
2. Draw correct conclusions as indicated at bottom or worksheet.
EXTENSIONS:1. Try incinerating an equal volume of food scraps (orange or banana peels, egg shells, apple cores, etc). You
may want to dry these out so they will burn more easily. Which is easier to burn, the food scraps or the
paper and wood products from the original experiment? Which would take longer to incinerate? Are the
final by-products from both experiments the same?
2. The classroom experiment allowed some ash, heat, and other by-products of burning to escape into the
atmosphere. However, incinerators are required by law to have precipitators to remove ash and toxins from
air emissions. Research different methods of pollution control in incinerators.
3. What happens to the ash that is collected after incineration is complete?
156
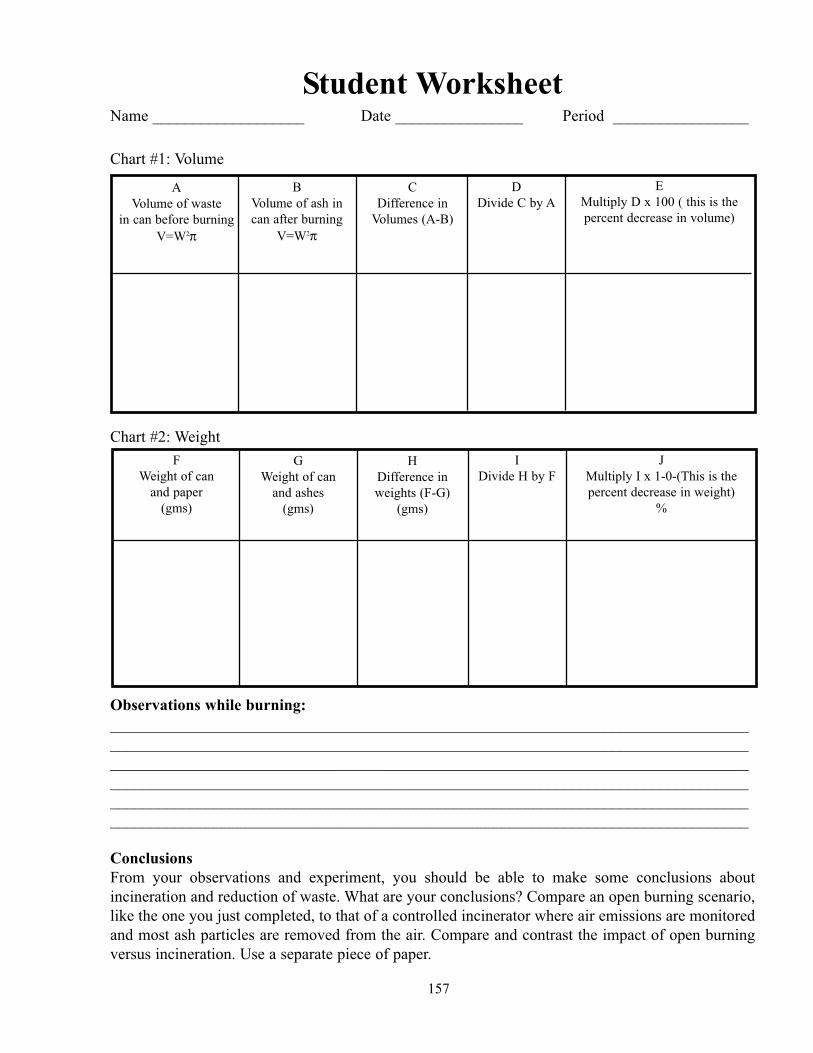
157
Student WorksheetName ___________________ Date ________________ Period _________________
Chart #1: Volume
Chart #2: Weight
Observations while burning:
________________________________________________________________________________
________________________________________________________________________________
________________________________________________________________________________
________________________________________________________________________________
________________________________________________________________________________
________________________________________________________________________________
Conclusions
From your observations and experiment, you should be able to make some conclusions about
incineration and reduction of waste. What are your conclusions? Compare an open burning scenario,
like the one you just completed, to that of a controlled incinerator where air emissions are monitored
and most ash particles are removed from the air. Compare and contrast the impact of open burning
versus incineration. Use a separate piece of paper.
A
Volume of waste
in can before burning
V=W2π
B
Volume of ash in
can after burning
V=W2π
C
Difference in
Volumes (A-B)
D
Divide C by A
E
Multiply D x 100 ( this is the
percent decrease in volume)
F
Weight of can
and paper
(gms)
G
Weight of can
and ashes
(gms)
H
Difference in
weights (F-G)
(gms)
I
Divide H by F
J
Multiply I x 1-0-(This is the
percent decrease in weight)
%

Notes
158
OBJECTIVES: Students will be able to:
1. Define hazardous substances.
2. Describe four categories of hazardous waste, the effects of
each on the environment, and the methods for disposal.
BACKGROUND: According to the Resource Conservation and Recovery Act
(RCRA) of 1976, hazardous waste is defined as any solid, liquid,
or contained gaseous waste that may cause, or significantly
contribute to, serious illness, injury, or death, or that could
damage or pollute land, air, or water when improperly managed.
Hazardous wastes come from many sources and are found in
many forms. They are categorized as toxic, reactive, ignitable, or
corrosive. Examples of such wastes are waste pesticides
generated by agriculture and the waste discharged from industrial
operations such as manufacturing batteries, smelting, and refining
metal.
The disposal of hazardous wastes and substances that might
pollute air, water, or land are regulated by the EPA
(Environmental Protection Agency). Household hazardous wastes
are not regulated. The improper management of hazardous waste
can be disastrous to the environment and to public health.
Damage to the environment may take many forms: groundwater
and water supply contamination, wildlife habitat destruction, soil
contamination, fish kills, livestock loss, air pollution, fire,
explosion, and crop damage. Damage to health may be directly
related to these environmental effects, but it is often more subtle,
even undetectable in its early stages. The price we pay for having
these materials is higher than we realize. The major purpose of this activity is to demonstrate the effects of
hazardous wastes on the environment.
VOCABULARY:hazardous waste, toxic, ignitable, reactive, hazardous substance, corrosive
ADVANCE PREPARATION:1. Explain to the students that they will be investigating these four major categories of hazardous
substances (toxic, reactive, ignitable, and corrosive). Their studies will include the following items:
• The definition
• A demonstration of its effect
• Identification of products containing the hazardous substance
2. Have all the materials on hand to do the experiments. Review with the students the proper lab
techniques. Use extreme care when doing these activities.
Demonstrating Hazardous Wastes
Grades: 6-8
Subjects: Science, Chemistry
Time Needed: Three class periods
Materials: apron
protective eyeglasses
WD-40 spray can
large laboratory beaker (1000 mL)
long match or wood splint
small cube of elemental sodium
acetic acid
4 living plants (annuals are the best)
hydrochloric acid
metal filings
sodium bicarbonate
metal gauze
rubber gloves
salt
gallon container
WASTE MANAGEMENT
159 www.legacyenved.org
PROCEDURE:Setting the Stage1. Begin this activity by asking the students to write down what they think “hazardous waste” means.
2. Ask the students to list the types of hazardous substances. Post the correct responses on the chalkboard
(toxic, ignitable, reactive, corrosive).
ActivityExperiment 1
1. Ask the students to define “ignitable.” Explain the characteristics of ignitability and demonstrate it as
follows (TEACHER DEMONSTRATION ONLY):
• Spray WD-40 into a beaker.
• Quickly ignite the carrier of the substance (propane or butane) using a long match or a lit wood splint.
Warning! Flash fire might occur. The flame will burn out quickly.
Experiment 2
1. Ask the students to define “reactive.” Explain to them the characteristics of “reactivity” and demonstrate
as follows:
• Pour water into a large beaker (1000 mL) until it is half full.
• Drop a pea-sized cube of elemental sodium into the beaker. Immediately cover it with wire gauze to
keep splashing to a minimum. Caution: THIS ACTIVITY IS POTENTIALLY DANGEROUS. KEEP
STUDENTS AT A DISTANCE. USE RUBBER GLOVES, GOGGLES OR A FACE SHIELD, AND AN
APRON.
• Add more small bits of sodium—MINUTE AMOUNTS—if you wish to demonstrate a more violent
reaction.
• Determine the pH of the resulting solution (it may be 12 or 13). If the pH of a basic substance is over
12.5, it is characterized as a corrosive liquid.
• Add enough acetic acid to the beaker to neutralize the sodium hydroxide.
2. Ask the students the following questions:
• Did an explosion occur? If so, why?
• Are bubbles being emitted? If so, why is this occurring? (Hydrogen is given off.)
• Has the temperature of the beaker changed? (This activity generates heat.)
• What products contain sodium in compound form? (table salt, sodium bicarbonate, sodium hydroxide)
Experiment 3
1. Ask the students to define “corrosive.” Explain the characteristics of corrosiveness and demonstrate as
follows:
• Pour a small amount of hydrochloric acid into a beaker.
• Carefully pour some metal filings into the beaker. Ask the students why the filings are dissolving.
2. What would neutralize the acid?
3. Add sodium bicarbonate to neutralize the solution. Ask the students what product contains hydrochloric
acid. What product contains sodium bicarbonate?
Experiment 4
1. Ask the students to define “toxic.” Explain the characteristics of toxicity and demonstrate as follows:
• Prepare a solution of one teaspoon of salt and one gallon of tap water (Solution A–about 2000 ppm).
• Remove one cup of Solution A, and to that cup add nine cups of tap water (Solution B–about 200 ppm).
• Remove one cup of Solution B, and to that cup add nine cups of tap water (Solution C–about 20 ppm).
2 For a control, Solution D will be only tap water.
3. Use equal amounts of Solution A, B, C, and D to water four living plants. (Small annuals work well.)
Water for two weeks.
160
Follow-Up1. Have the students identify products in their homes that are labeled “ignitable,” “explosive,” “corrosive,”
and “toxic” and ask them to bring lists of these products to class.
2. Discuss the lists found in their homes.
3. Keep a record of each plant’s growth and the solution used to water it. Evaluate all demonstrations and
results. Ask the students to describe the effects of each type of hazardous waste.
EXTENSIONS:1. Have the students list what they can do personally to reduce the amounts and kinds of hazardous waste in
the home.
2. Have students think of ways to demonstrate (safely) some of the hazardous effects of common household
products so that their parents and friends will become aware of them.
ORIGINAL DEVELOPMENT RESOURCES:Environmental Protection Agency. (1986). Understanding the small quantity generator hazardous waste
rules: A handbook for small business.Washington DC. www.epa.gov
161

Notes
162
INTRODUCTION TO NATURAL
RESOURCES
What Are Natural Resources?
A good working definition of Natural Resources requires defining the two words, natural and resources,
separately and combining those definitions. “Natural” can be defined as something present or produced, in
nature. “Resource” can be defined as that which is useful and for which there is an available supply. By
combining these two definitions, “natural resources” can be defined as something present in, or produced by,
nature with an available supply that can be drawn upon when needed. Natural resources also can be
categorized as earth materials and as all life forms. Those natural resources include air, water, soils, natural
vegetation, and all rocks and minerals.
Who Uses Natural Resources?
People use natural resources. Every aspect of life requires that we use natural resources. When one gets up in
the morning and eats breakfast, one is using natural resources. The electricity that turned on the lights, the
water in the shower, and the food that is on the table came from natural resources. All day long we use natural
resources. Sometimes they are used in other ways, such as enjoying one’s surroundings by visiting a state or
national park or forest.
Alabama’s Natural Resources
Alabama is fortunate in that it has an abundance of many natural resources. Farmers use the soil to produce
many products, such as cotton, potatoes, tomatoes, and peanuts. On some areas of land, trees are grown to
produce wood to build houses and to make paper for many purposes. In recent years, oil (a product that we
use every day) has been found, and drilled, for in Mobile Bay. Across the state, people use water to produce
electricity (hydroelectric dams) and to fish for food and sport. As one can see, Alabama has an abundance of
natural resources, BUT we must manage them correctly so that they will last for generations to come.
Conserving Our Natural Resources for Future Generations
It is important for Alabamians to pay close attention to the ways they manage natural resources. There are
many public and private organizations that work to assure that our natural resources are adequately
maintained, but, in the end, it is up to the individual citizen to do his or her part. Whether it is by picking up
trash, recycling, planting trees, or volunteering with an environmental organization, everyone makes a
difference, and everyone must help to insure that generations to come have the necessary natural resources.
163

164
OBJECTIVE: Students will be able to:
Explain the importance of the state’s water resources.
BACKGROUND: Water is an important resource in Alabama. The state ranks
seventh nationally in the number of rivers and streams that flow
year round (perennial); 14th nationally in the acreage of ponds,
lakes, and reservoirs; and 24th nationally in the acres of
freshwater wetlands. Alabama has navigable rivers, fishing
ponds, estuaries, wetlands, and even 50 miles of Gulf Coast
shoreline. Thousands of tourists come to Alabama every year to
enjoy the warm summers at the beach with swimming, sailing,
and jet skiing. On rivers and lakes, fishermen and canoers also
appreciate the beauty of the waterways.
Water is important to Alabama for more reasons than just
recreation. Water sustains life. Farmers use it to irrigate their
crops and to sustain their livestock. It is used to transport
materials up and down the rivers, and all humans must have it to
drink. Sixty-two percent of Alabama’s 4.5 million people drink
water from lakes and streams. Thirty-eight percent of drinking
water comes from wells. Water also plays an important role in generating electricity. Alabama has 21
hydroelectric power production dams.
The Clean Vessel Act of 1992 protects these waters. It provides funds for the construction, renovation,
operation, and maintenance of boat sewage pumpout stations and waste reception facilities to improve water
quality. It also provides educational programs to help the public understand the importance of keeping water
clean and to show what people can do to make a difference.
Wonder Water is a game students may play after studying about Alabama’s water resources. The “Wonder
Water: Alabama Water Facts” sheet has all the information used in the game.
VOCABULARY: navigable, basin, perennial, intermittent, ditch, canal, reservoir, wetlands, estuary, average, streamflow,
hydroelectric, wastewater, pumpout station
ADVANCE PREPARATION:1. Gather needed materials for activity.
2. Divide students into teams of four.
PROCEDURE: Setting the Stage
Begin this activity with a discussion about Alabama’s water resources. Topics for discussion may include
uses, such as energy and transportation, and importance to humans and animals. Use “Wonder Water:
Alabama Water Facts” as a resource.
Wonder Water Jeopardy
Grades:6-8
Subject:Science, geography
Time Needed:One class period to play, one class
period or more to talk about
Alabama’s water
Materials: bells (1 per team)
eye droppers (1 per team)
water
cups (1 per team)
NATURAL RESOURCES
165 www.legacyenved.org
Activity1. Divide the class into teams of four.
2. The teacher will ask a question. The team may come up with the answer together, or the first person in line
may answer. The first team to ring the bell has the first opportunity to answer. If incorrect, the second team
may answer.
3. The person with the correct answer fills the eye dropper with water and carries it to the cup marked with a
fill line.
4. The game is over when one team fills up its cup to the line.
Note: Use the water on class plants or outdoor plants after the activity.
EVALUATION: If answered as a team, the teacher may give a written quiz. If the game is done with the individual students
answering, that may serve to evaluate their knowledge.
EXTENSIONS:1. Invite someone to speak to the class whose career is water related.
2. Have students research a particular river and its importance to the people who live by it.
ORIGINAL DEVELOPMENT RESOURCES:Alabama Department of Environmental Management, P.O. Box 301463, Montgomery, AL 36130,
www.adem.state.al.us
Arello, G. Alabama: the river state. 1998. Nature Press. Published through the Alabama Office of Water
Resources and the Alabama Department of Economics and Community Affairs.
www.nowandforeveralabama.org The web site for the interactive, educational division of the Alabama
Nature Conservancy.
ADDITIONAL RESOURCES:Young, B.M. Hall, J.C. & Middleton, R. (2009) Headwaters: A Journey on Alabama Rivers
The Nature Conservancy: Alabama - Protecting the 5th Most Biologically Diverse State in the U.S.
166
WONDER WATERAlabama Water Facts
Alabama has:
14 river basins
77,274 total miles of rivers and streams
47,072 miles of perennial rivers and streams (7th nationally)
30,170 miles of intermittent streams
32 miles of ditches and canals
43 lakes, reservoirs, and ponds (excluding farm ponds)
469,653 acres of ponds, lakes, and reservoirs (14th nationally)
3,600,000 acres of freshwater wetlands (24th nationally)
27,600 acres of coastal wetlands
610 square miles of estuaries
50 miles of Gulf Coast shoreline and beaches
1. The average annual rainfall in Alabama ranges from 48 to 68 inches with only 22 inches draining from the
land to form the state’s rivers and streams.
2. The average streamflow of all streams entering this state is 60,341 cubic feet per second (38,980 million
gallons per day) while the average streamflow of streams leaving the state is 134,793 cubic feet per
second (87,076 million gallons per day).
3. Sixty-three percent of all streamflow (drainage) in Alabama flows into Mobile Bay.
4. Sixty-two percent of Alabama’s 4.5 million people drink water obtained from lakes and streams. Thirty-
eight percent drink water from wells.
5. Alabama has 21 hydroelectric power production dams.
6. Alabama has 17 state parks that provide recreational use of Alabama’s waters.
7. A drop of water entering Alabama from other states may be reused up to 25 times before leaving the state.
8. Alabama has more miles of navigable streams (1,438 miles) than any other state. Seven of the 14 river
basins have navigable rivers.
9. Alabama’s navigable rivers must be nine feet deep and 100 to 300 feet wide before use by barges is
possible.
10. Locks are structures at dams that allow raising or lowering of barges and other watercraft from one level
to another. Each time a lock is operated, 15 to 45 million gallons are needed.
11. More than 230,000 licensed boats use Alabama’s water plus other smaller boats such as canoes and
kayaks.
12. Fishing is important in Alabama and popular in the state’s 38 major lakes and 23 fishing lakes.
13. There are 275 towns and cities that discharge 435 million gallons of treated wastewater per day to
Alabama’s rivers and streams.
14. There are 548 industries that discharge 8,168 million gallons of treated wastewater per day to the state’s
rivers and streams.
15. President George Bush established the Clean Vessel Act of 1992 to improve water quality.
16. The Clean Vessel Act provides funds for the construction, renovation, operation, and maintenance of boat
sewage pumpout stations and waste reception facilities, as well as education programs, to improve water
quality.
167
WONDER WATERAlabama Water Trivia Questions
1. Define the Clean Vessel Act. (A five-year grant to fund states for the construction, renovation,
operation, and maintenance of pumpout stations and waste reception facilities to improve water
quality; also provides funds for public education.)
2. Alabama ranks 18th in the nation with the number of registered boats. How many? (over 250,000)
3. Number of Alabama river basins. (14)
4. Total number of miles of rivers and streams found in Alabama. (77,274)
5. Name at least five uses for Alabama’s water. (shellfish harvesting, recreation, fishing, irrigation,
power production, drinking)
6. Alabama ranks seventh nationally for 47,072 miles of this. (perennial rivers and streams)
7. Alabama ranks first in the nation in navigable _______ (streams).
8. Number of miles of intermittent streams in Alabama. (30,170 miles)
9. Alabama has 32 miles of ditches and ________(canals).
10. There are this many lakes, reservoirs, and ponds excluding farm ponds. (43)
11. With 469,653 acres of ponds, lakes, and reservoirs, how does Alabama rank nationally? (14th)
12. Number of acres of freshwater wetlands. (3,600,000)
13. Alabama ranks 24th in the nation with its 3,600,000 acres of freshwater ________(wetlands).
14. Number of Alabama acres of coastal wetlands. (27,600)
15. Estuaries cover this many square miles in Alabama. (610)
16. The length of Gulf Coast shorelines and beaches within Alabama. (50 miles)
17. What is the average annual rainfall range in Alabama? (48-68 inches)
18. Twenty-two inches of rain drain annually from Alabama land to form these. (rivers and streams)
19. The average streamflow of all streams entering Alabama equals how many gallons per day? (38,980
million gallons)
20. The average streamflow of all streams leaving Alabama equals how many gallons per day? (87,076
million gallons per day)
21. Sixty-three percent of all stream flow in Alabama flows into here. (Mobile Bay)
22. Of the four and a half million residents of Alabama, what percentage get their drinking water from lakes
and streams? (62 percent)
23. What percentage of Alabamians get their drinking water from wells? (38 percent)
24. How many hydroelectric power production dams does Alabama have? (21)
25. How many of Alabama’s state parks provide recreational use of her waters? (17)
26. How many times could one drop of water entering Alabama from another state be reused before leaving
the state? (25 times)
27. Fishing is popular in Alabama and occurs in the state’s ____(38) major lakes and ____(23) fishing lakes.
28. ________(Locks) are structures at dams that allow raising or lowering of barges and other
watercraft from one level to another.
29. Each time a lock is operated, how many gallons of water are needed? (15 to 45 million)
168
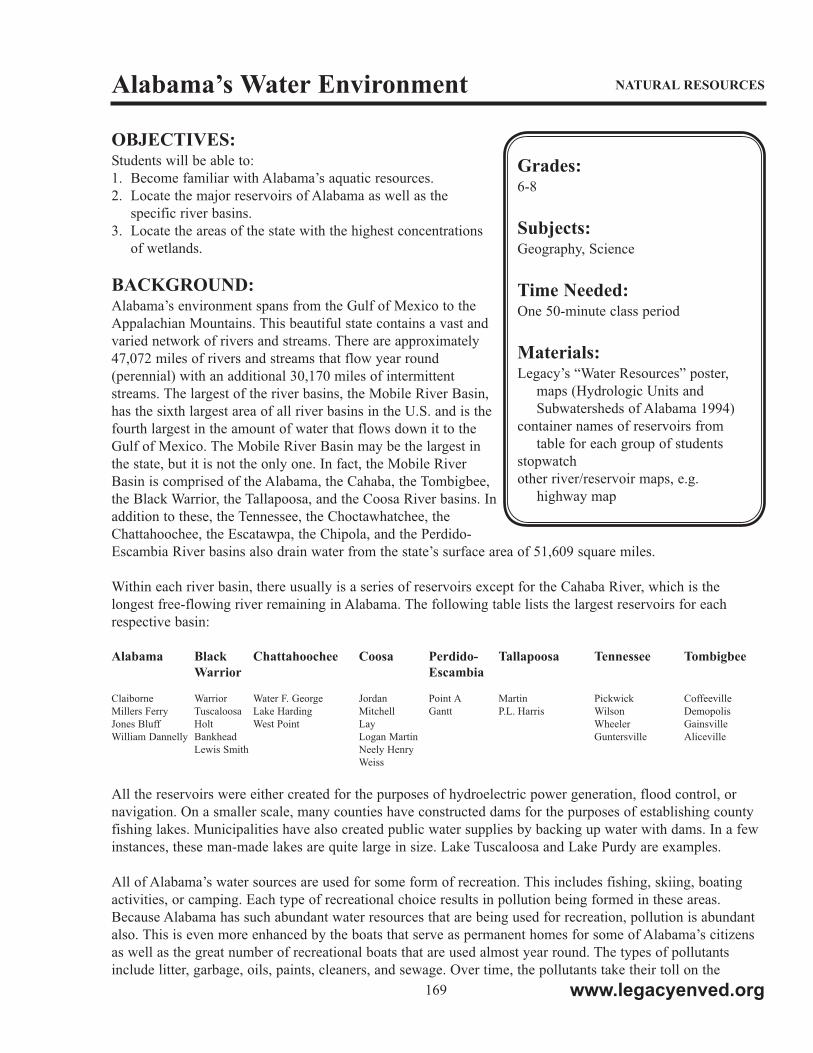
OBJECTIVES:Students will be able to:
1. Become familiar with Alabama’s aquatic resources.
2. Locate the major reservoirs of Alabama as well as the
specific river basins.
3. Locate the areas of the state with the highest concentrations
of wetlands.
BACKGROUND:Alabama’s environment spans from the Gulf of Mexico to the
Appalachian Mountains. This beautiful state contains a vast and
varied network of rivers and streams. There are approximately
47,072 miles of rivers and streams that flow year round
(perennial) with an additional 30,170 miles of intermittent
streams. The largest of the river basins, the Mobile River Basin,
has the sixth largest area of all river basins in the U.S. and is the
fourth largest in the amount of water that flows down it to the
Gulf of Mexico. The Mobile River Basin may be the largest in
the state, but it is not the only one. In fact, the Mobile River
Basin is comprised of the Alabama, the Cahaba, the Tombigbee,
the Black Warrior, the Tallapoosa, and the Coosa River basins. In
addition to these, the Tennessee, the Choctawhatchee, the
Chattahoochee, the Escatawpa, the Chipola, and the Perdido-
Escambia River basins also drain water from the state’s surface area of 51,609 square miles.
Within each river basin, there usually is a series of reservoirs except for the Cahaba River, which is the
longest free-flowing river remaining in Alabama. The following table lists the largest reservoirs for each
respective basin:
Alabama Black Chattahoochee Coosa Perdido- Tallapoosa Tennessee Tombigbee
Warrior Escambia
Claiborne Warrior Water F. George Jordan Point A Martin Pickwick Coffeeville
Millers Ferry Tuscaloosa Lake Harding Mitchell Gantt P.L. Harris Wilson Demopolis
Jones Bluff Holt West Point Lay Wheeler Gainsville
William Dannelly Bankhead Logan Martin Guntersville Aliceville
Lewis Smith Neely Henry
Weiss
All the reservoirs were either created for the purposes of hydroelectric power generation, flood control, or
navigation. On a smaller scale, many counties have constructed dams for the purposes of establishing county
fishing lakes. Municipalities have also created public water supplies by backing up water with dams. In a few
instances, these man-made lakes are quite large in size. Lake Tuscaloosa and Lake Purdy are examples.
All of Alabama’s water sources are used for some form of recreation. This includes fishing, skiing, boating
activities, or camping. Each type of recreational choice results in pollution being formed in these areas.
Because Alabama has such abundant water resources that are being used for recreation, pollution is abundant
also. This is even more enhanced by the boats that serve as permanent homes for some of Alabama’s citizens
as well as the great number of recreational boats that are used almost year round. The types of pollutants
include litter, garbage, oils, paints, cleaners, and sewage. Over time, the pollutants take their toll on the
Alabama’s Water Environment
Grades:6-8
Subjects:Geography, Science
Time Needed: One 50-minute class period
Materials: Legacy’s “Water Resources” poster,
maps (Hydrologic Units and
Subwatersheds of Alabama 1994)
container names of reservoirs from
table for each group of students
stopwatch
other river/reservoir maps, e.g.
highway map
NATURAL RESOURCES
169 www.legacyenved.org
environment. Most fishing and boating occurs on and around the reservoirs in Alabama.
VOCABULARY: non-point source pollution; reservoir
PROCEDURE:1. Provide small groups of two or three students a map of rivers, reservoirs, and basins.
2. Have students pull reservoir names from a bag and quickly mark the maps by placing names in the correct
locations. (This should occur in each group at the same time.) They should develop a chart that identifies
reservoirs and basins where they are found.
3. Or, another technique to measure familiarization is to call out all the reservoir names in random order and
have the students write down the name with the corresponding basin.
4. Discuss non-point source pollution impact on the reservoirs.
5. Students should infer areas with the greatest amount of wetlands. They should defend their choices.
EVALUATION:1. The students will be judged on the most correct answers or the fastest time for the most correct answers.
EXTENSION:1. Have the students research the pros and cons of reservoirs. Then have the students research the Alabama-
Georgia water wars and determine the significance of the reservoirs in this legal action. NOTE: Alabama
and Georgia currently are involved in water rights discussions because Georgia wants to divert water from
a river before it enters the north end of Alabama. Georgia wants to build a reservoir and capture the water
for use.
2. Have students research the environmental impact on these reservoirs from recreational pollution and other
non-point source pollution.
NOTE: This activity can be used with watershed management simulator.
ORIGINAL DEVELOPMENT RESOURCES:www.alabamarivers.org - website of the Alabama Rivers Alliance and good source of information about
watershed management and the tri-state water wars.
Arello, G. Alabama: the river state. 1998. Nature Press. A good source for maps and Alabama river
information.
ADDITIONAL RESOURCES:Young, B.M. Hall, J.C. & Middleton, R. (2009) Headwaters: A Journey on Alabama Rivers
170
OBJECTIVE:Students will be able to:
Describe an endangered species and list reasons for its
decline.
BACKGROUND:Alabama has an abundance of wildlife and plants. In comparison
to other states, Alabama has a high number of threatened and
endangered plants and animals. In fact, it is believed that
Alabama is first in the nation in the total number of species
facing extinction or extirpation. For this reason, it is important for
students to learn ways that these natural resources can be saved.
VOCABULARY:endangered, extirpated
PROCEDURE:1. Before beginning this activity, choose endangered animals or
plants to study. The students should research these plants or
animals and learn why they are endangered. Information can
be obtained from Alabama Natural Heritage, State Lands
Division (see directory).
2. Using the local newspaper, discuss what the paper looks like and how it is formatted.
3. Discuss how different kinds of features (articles) appear in various sections. Students should compare and
contrast these.
4. Design a class newspaper written from an animal’s or plant’s point of view.
5. Let students choose a section—front page, comics, life and leisure, sports—and discuss what kind of
articles would be in each. Discuss what else would be in the section besides articles such as
advertisements, obituaries.
6. Encourage the students to write an article, ad, or comic from an animal’s or plant’s point of view. There
must be something factual in each piece.
7. Each group will have to write headlines for articles and assist in the layout of the newspaper.
EVALUATION: The finished product will be the evaluative instrument. Each student should demonstrate an understanding of
the endangered animal or plant when writing the article for the newspaper.
EXTENSION:Study other endangered animals and plants.
ORIGINAL DEVELOPMENT RESOURCES:State Lands Division, North Union Street, Montgomery, AL 36130, 334-242-3484,
ww.dcnr.state.al/lands.htm
www.pfmt.org/wildlife/endangered - web site includes endangered species by Alabama counties section
Endangered Animals Newspaper
Grades:6-8
Subjects:Interdisciplinary, Communication
Time Needed: 60 minutes
Materials: newspaper
large sheets of paper to make the
newspaper
glue
scissors
small sheets of paper
crayons
markers
NATURAL RESOURCES
171 www.legacyenved.org

Alabama Natural Heritage Program, 1090 South Donahue Drive Auburn University, AL 36849. 334-844-
5017 http://www.natureserve.org
The Nature Conservancy of Alabama, www.nowandforeveralabama.org
ADDITIONAL RESOURCES:The Nature Conservancy: Alabama - Protecting the 5th Most Biologically Diverse State in the U.S.
172
OBJECTIVES: Students will be able to:
1. Identify areas of their homes that need to be made more
energy efficient by using a student-made energy loser detector.
2. Chart areas needing insulation.
BACKGROUND:Take a walk through your house, especially past windows and
doors. Do you feel a draft? Lie down on the floor. Do you feel
cold air? If your house is like most houses in America, it loses
heat through doors, windows, walls, cracks—even through
electrical outlets and switches. We waste hundreds of dollars each
year literally trying to heat or cool the inside. But more important
are the environmental consequences because not only does
wasting energy cost money, but it also promotes air pollution,
acid rain, and global warming. We must learn to educate and
insulate if we are truly to make a difference!
VOCABULARY:insulation, energy efficient, raft, energy saving
ADVANCE PREPARATION:1. Gather printed materials from a home repair store that discuss insulation for the windows, doors, and other
parts of the house. Get enough copies for each student, if possible.
2. Have demo of energy-loser detector to show students how to make this (to make this just tape a strip of
Saran Wrap to a straw). Hold straw horizontal to area of possible energy loss. If air is being lost, the Saran
Wrap will move.
PROCEDURE:Setting the Stage
Talk with students about the importance of saving energy. Ask them what they do around their homes to
save energy.
Activity1. Give each student or each group copies of materials collected from the home repair store.
2. Have each student make an “energy loser detector.”
3. In groups, have each student make a chart listing areas in the home to check for energy loss and whether or
not they need insulating. Specify room and specific area such as kitchen windows, doors, outlets.
Follow-Up1. Have students present their charts and findings.
2. Have students determine what type of insulation to use in each situation.
EXTENSION:Have students check school classroom for energy loss and needed insulation.
Insulating Your Home
Grades:6-8
Subjects: Science, Math, Social Studies
Time Needed: 50 minutes plus homework
Materials: straws
Saran Wrap
brochures about home insulation
NATURAL RESOURCES
173 www.legacyenved.org

ORIGINAL DEVELOPMENT RESOURCES:MacEachern, D. (l990). Save our planet. Dell Publishing.
The recyclers handbook. (l990). Berkeley, CA: The Earth Works Group.
174
OBJECTIVES: Students will be able to:
1. Use field guides to identify plants.
2. Determine if the plants are exotic or native to Alabama.
3. Determine the impact of exotics.
BACKGROUND:Most nature trails are well labeled, and some students have a
working knowledge of many trees and shrubs. The purposes of
this activity are to teach the use of field guides and to extend the
students’ knowledge base to include whether the plant is native to
Alabama or is exotic. “Exotics” are species introduced by people
to an area often with negative consequences for the native
species. This activity can easily be integrated with social studies
by exploring how human cultures change their environments.
What are the pros and cons of those changes?
All plants evolve with natural growth checks that help keep plant
populations in balance, “checks” such as fungus, bacteria and ordinary plant diseases; fish and other animals;
climate; geology, etc. all play their part in Nature’s balancing act. In a balanced ecosystem, variety reigns.
In a balanced ecosystem, there is a biodiversity of plants, growing and evolving.
However, when a non-native plant, a species that evolved someplace else, is introduced into new areas, it
usually does not have its natural growth checks. So, often enough, the non-native plant is able to grow wildly,
quickly covering, smothering and replacing the plants that were naturally there in the first place. The non-
native plant may form an exotic monoculture (where no other plants grow).
VOCABULARY:native, exotic, non-native, exotic monoculture, ecosystem
ADVANCE PREPARATION: Collect plant samples for the first class period.
PROCEDURE:First Class Period1. Give each group a field guide(s) and several samples to key out or identify. Have them record the scientific
and common name, description, habitat, and range of each plant. Label as native to Alabama or exotic.
2. Exchange plant samples with another group and repeat the process until all plants are identified.
3. Compare and discuss information about each plant.
4. Students should research the impacts of exotic plants and identify the ways that each was introduced.
Second Class Period1. Assign each group three specific sections of the school campus in which to work. Assign them ten
minutes to key and record plants in their areas.
2. Give a signal (blow whistle) to move to their second section and then to their third section.
Native Or Exotic?
Grades:6–8
Subjects:Social Studies, Science
Time Needed: Two consecutive class periods
Materials: field guides for native trees and native
shrubs
samples of local plants to identify
references to explore introduced
(exotic) plants
NATURAL RESOURCES
175 www.legacyenved.org
3. Return to the classroom and compile a list in two columns of school yard plants that are native to Alabama
or exotic.
Conclusion1. Discuss with students why exotic plants are not desirable for an area and the negative consequences for an
ecosystem.
2. Have students think of some well-publicized examples of exotic plants (for example, kudzu in Alabama)
and some problems they caused.
EVALUATION:Group test using field guide(s) to key plants and record for each plant: name, description, habitat, range,
native, or exotic.
EXTENSIONS:1. Invite a local botanist or horticulturist (from your local college or nursery or one possibly employed by
your city) to verify the findings of the class.
2. Instruct students to develop a presentation with visual aids about the plants in the community.
ORIGINAL DEVELOPMENT RESOURCES:The Audubon Society Field Guide to North American Trees, New York, NY: Alfred A. Knopf, Inc.
Alabama Forestry Association, 555 Alabama Street, Montgomery, AL 36104-4395, 334-265-8733,
www.alaforestry.org
Peterson Field Guide
Trees and Shrubs in the Heart of Dixie - Blanch Dean
University arboretums and herbariums
Alabama Natural Heritage Program, Department of Conservation and Natural Resources
A Walk Through Alabama, a slide presentation by Alvin Diamond, Troy State University, Center for
Environmental Research and Service, www.troyst.edu
176
OBJECTIVE:Students will be able to:
Describe habitats where animals and plants are found.
BACKGROUND: Alabama forests provide habitats for plants and animals. An
example of a habitat is as close as your backyard, park, a portion
of your school’s property, or a neighboring stream.
VOCABULARY:habitat, adaptation
PROCEDURE:1. Have students choose an area and study it. In some habitats,
they may wish to set up plots of given dimensions for
observation. Have students make close observations and
record them. A magnifying lens would be helpful.
2. These questions are to be answered based on the students’
observations:
• What species live there now? (animals? plants? insects?)
• What sources of food, water, and shelter are there for the various species?
• If carrying out this activity over time, how does this habitat change with different seasons?
• How are the plants and animals adapted to their habitat?
• What could be done to improve the area as a habitat?
3. Have students make a plan to improve the habitat and carry it out. Have them consider how improvements
might adversely affect some creatures or their habitats. Removing dead wood and limbs is not always a
good idea.
4. If the students cannot implement their plan, what resources do they need; or who can do it for them? For
example, a little more water may improve the habitat for plants. Who can assist in obtaining more water
for the site? How will they water the site? How often? What do they expect to happen with these changes
in the habitat?
5. How would the types of species change if a pond were on the school grounds?
EVALUATION: Verbally share the information recorded with other students, and compare and contrast the information.
EXTENSIONS:1. Encourage students to use these procedures to study other habitats they may visit during their vacations
and out-of-town visits.
2. Invite a forester, wildlife biologist, soil scientist, or other natural resource professional into the classroom
to discuss habitat improvement, canopy layers, light intensity, soil pH.
3. Have students research various habitats in Alabama such as forests and streams.
Nurture A Habitat
Grades:6-8
Subjects:Science, Geography
Time Needed: One and one-half class periods (This
activity may be carried out over a
school year.)
Materials: small area (a local park, school yard, or
even a window box terrarium)
NATURAL RESOURCES
177 www.legacyenved.org

ORIGINAL DEVELOPMENT RESOURCES:American Forests Global Releaf. Used with permission. www.americanforests.org
Alabama Forestry Association, www.alaforestry.org
178
OBJECTIVES:Students will be able to:
1. Compare a list of communication factors that interfere with
resolution of controversial issues.
2. Summarize key aspects of the Red-Cockaded Woodpecker, its
habitat needs, and the reason it is an endangered species.
3. Demonstrate cooperative learning by working in small groups
to apply effective communication skills.
BACKGROUND:The Red-Cockaded Woodpecker (Picoides borealis) is an
endangered species that resides in Alabama and other
Southeastern states. Like a number of other endangered species,
the Red-Cockaded Woodpecker has become the subject of
controversy due to conflict between commercial interests and
environmental interests over the need for laws to protect
endangered species.
The Red-Cockaded Woodpecker is an endangered species requiring
a certain kind of forest habitat to survive. Unfortunately, this habitat is also in demand by industry as a source
for wood products. To save the Red-Cockaded Woodpecker from extinction, the government is considering
whether to implement new, strictly enforced regulations to prohibit timber cutting in forest areas where the
Red-Cockaded Woodpecker lives.
This activity involves a simulated discussion to resolve the Red-Cockaded Woodpecker controversy. The
simulation requires students to work in small groups where each student will role-play one of five roles, as
described in the attachment. A primary function of the simulation is to demonstrate how careless language
and the use of “flash-words” (words that elicit conditional emotional reactions) can hamper communication.
VOCABULARY:endangered species, ecosystem, biodiversity, habitat
PROCEDURE: 1. Divide the class into groups of 5, so that within each group there will be one student for each of the five
roles for this activity. (If you have a group with more than 5 students, Mr. Wright, the scientist, is a role
that can be doubled.) Provide the appropriate role description to each player, taking care not to let any
player see another’s role description. Allow a few minutes for players to read quietly and become familiar
with the roles they are to assume. Ask each to identify the “flash-words” used in their role descriptions.
2. Explain that each group is to take 10-15 minutes to discuss the questions of government protection for the
Red-Cockaded Woodpecker and to reach group consensus about whether or not to support new regulations
prohibiting timbering activity near a Red-Cockaded Woodpecker habitat. Emphasize that each student is to
participate/discuss according to the role he or she has been assigned, even if the student does not
personally agree with the behavior or position of the respective role. (Remember that since they are
unaware of each other’s role descriptions, they will not know of the built-in obstacles to reaching group
consensus.)
3. Select a group that is having a good exchange/debate with all players effectively maintaining assigned
roles. Arrange the class to allow clear observation of this selected group (for example, other students can
Of Words And Woodpeckers
Grades:6-8
Subjects:Social Studies, Science
Time Needed: Two hours
Materials: the video and teacher’s guide for
Discovering Alabama: Red-Cockaded Woodpecker
blackboard or flip easel
NATURAL RESOURCES
179 www.legacyenved.org
move to form an observation circle around the selected group). Have the selected group continue
discussion/debate long enough to allow all 5 players to portray their respective roles.
4. End the group discussion and invite the class to share observations about how the group was handling
communication (not about what was correct or incorrect, logical or illogical). For example, an observer
might report, “Mr. Green would not let Mr. Dollar finish anything he began to say,” or “Dr. Wright uses a
lot of words that people might have trouble following,” or “Mr. Waffle talks very loudly,” or “The group
is not making progress to address the task it was assigned.”
5. Explain that people often hold views that are based on feelings or perceptions rather than facts, and that
this often gives rise to controversy before cooperative problem solving can occur. Conduct a brainstorming
session to list things that influence our feelings and perceptions (examples include peer affiliations,
cultural traditions, television, misinformation, self-image).
6. Ask the class to participate in a genuine discussion of the Red-Cockaded Woodpecker issue without
having a simulated role to play. Make a list of questions and concerns about which they would like more
information in order to help reach consensus in the group.
7. Show the video Discovering Alabama: Red-Cockaded Woodpecker.8. After the video, reassemble students in their small groups and distribute copies of the activity/information
sheet located on the last page of the supplementary Teacher’s Guide for the video.
9. Have students try once again to reach consensus about government efforts to protect the Red-Cockaded
Woodpecker. This time they are to make a genuine effort to reach consensus (no simulated roles this time)
and are free to develop new ideas/solutions that might resolve the Red-Cockaded Woodpecker controversy
in a way that helps provide society’s need for wood products while also protecting the habitat for this
endangered species.
EVALUATION:Each group of students will prepare a written report and present their ideas for resolving the Red-Cockaded
Woodpecker controversy. They should include some discussion of how the wood demand will continue to be
met; how Red-Cockaded Woodpecker habitat requirements will be met; and how landowners,
environmentalists, scientists, and the public might be involved in protection efforts.
EXTENSIONS:See extensions and community connections of the Teacher’s Guide for the video Discovering Alabama: Red-Cockaded Woodpecker.
ORIGINAL DEVELOPMENT RESOURCES:The video Discovering Alabama: Red-Cockaded Woodpecker and its supplementary teacher’s guide,
available from the Discovering Alabama, Alabama Museum of Natural History, University of Alabama,
Tuscaloosa, AL 35487 (205) 348-7550.
180
MR. DOLLAR
PRESIDENT
CUT THE TREES, INC.
Mr. Dollar is adamantly opposed to enforced protection for the Red-Cockaded Woodpecker and its habitat. He
believes that such protection is a lock-up of valuable resources and will cost jobs and hurt the economy. He
feels that the most basic American values are the rights of private property owners, the free enterprise system,
and a market-based economy unconstrained by government meddling. He believes that environmental laws
are excessive and that government protection for the Red-Cockaded Woodpecker is just one more unnecessary
constraint against landowners who seek a reasonable profit from their investment. He regards
environmentalists as tree huggers and extremists whose views are based on emotions. He believes that many
animals—for example, the dinosaurs—become extinct due to the normal course of change on Earth. He often
refers to the RCW as the Red-Cockaded Woodpecker and asks what good is it if you can’t use it? He feels
very strongly about this issue and will not agree to any kind of enforced protection for the Red-Cockaded
Woodpecker.
MR. GREEN
PRESIDENT
SAVE THE TREES SOCIETY
Mr. Green is adamantly opposed to any logging on lands where the Red-Cockaded Woodpecker lives or might
be able to live. He believes that forest industry owners are timber beasts who don’t care about the ecology. He
is especially incensed at the logging practice known as clear cutting and feels that timber profiteers are
destroying the virgin forests and wiping out the native biodiversity. He thinks that man is just one part of the
larger community of life in which all things are connected and that if we continue to harm the environment,
soon we will become endangered species, too. He feels very strongly about this and will not accept anything
less than the strongest laws against cutting trees on lands suitable for the Red-Cockaded Woodpecker.
DR. WRIGHT
RESEARCH SCIENTIST
U.S. DEPARTMENT OF FISH AND WOODPECKERS, LABORATORY OF BIODIVERSITY
AND ECOSYSTEM RESEARCH
Dr. Wright is concerned that a species protection policy should be based on science rather than the political
aims of interest groups. He maintains that the specific habitat requirements of Picoides borealis may be
variable depending upon certain parameters that are only partially quantifiable. He believes there is no way
that laymen (including industry executives and environmentalists) can comprehend the implications of the
data generated by control and experimental sites when comparing for understory, midstory, perimeter, and
other aspects of population viability. He is very cautious about ideas or viewpoints other than his own, is
impatient with the unscientific approach of others, and frequently asserts the significance of utilizing
professional expertise in such matters.
181
MR. WAFFLE
LOCAL CONGRESSMAN
Mr. Waffle believes that the most important concern is serving the public; that people want economic growth;
that litter is very unsightly; and that we can have both jobs and a clean environment. He thinks we need
balance. He is pleased with providing leadership for expanding growth of the industry in his area and proud of
environmental improvements attained during his term—especially proud that he was able to get funds for
several new roads and sewer lines. He wants to do all he can for the public interest on this matter.
MR. STORY
REPORTER
THE SENSATIONALIST DAILY NEWS
Mr. Story wants to know Mr. Dollar’s opinion of why people should be opposed to Mr. Green’s organization.
He wants to know Mr. Green’s opinion about how devastating Mr. Dollar’s company has been to the
environment. Mr. Story wants to hear how loggers are raping the old growth forest and how environmentalists
are costing jobs. Mr. Story thinks it is interesting that a rare bird he has never seen is causing a public outcry.
He is curious about what the Red-Cockaded Woodpecker looks like and whether others have actually seen one
but has little interest in analysis of the issue. However, he is very insistent on getting pertinent dates,
locations, and the correct spelling of each person’s name and affiliation. He also wants to know about rumors
that funds for Mr. Waffle’s recent sewer project were awarded to a construction firm owned by Mr. Waffle’s
wife.
182
OBJECTIVES:Students will be able to:
1. Create an energy diary.
2. Analyze their diary entries, and plan changes
3. Compare different brands and models of appliances.
4. Discuss and present a point of view concerning community,
state, and national energy concerns.
BACKGROUND:Before students can be persuaded to change their behavior toward
energy use, they must understand the ways they personally use
energy. They need to understand that everyone uses energy and
contributes to various pollution emissions. Once they identify
their own use of energy and understand why non-renewable
energy must be conserved, they can apply conservation to their
own lives. Families can save energy by buying energy-efficient
appliances. Appliances, such as refrigerators, air conditioners, and
dishwashers, are required to have labels showing yearly energy
use. New automobiles are required to be rated according to fuel
consumption. Wallboards and insulation types for homes have
energy-efficiency ratings.
VOCABULARY:pollution emissions, kilowatt, kilowatt hour (kwh), conservation, externalities, energy
PROCEDURE:1. Have students identify ways in which their activities contribute to pollution emissions by keeping an
energy diary. Students should record for one week the appliances used (lights, television, microwave, car)
and the amount of time spent using them. Remind students to include energy used for refrigerators, air
conditioners, and water heaters.
2. Once they have recorded their energy use, students should examine:
• Ways they could save energy.
• Their willingness to make changes to save energy.
• The impact of these changes on pollution emissions.
3. Have students choose an appliance and compare the operating, purchase, and installation costs of different
brands and models. Students should present to the class. Compare a new, energy-efficient appliance with
an older, inefficient model. How much energy will the most efficient appliance save? What are the
operating costs of the appliance?
4. Have students list energy-saving activities that are used at the community, state, and national levels.
5. Have a class discussion in which each student expresses a point of view about energy and energy
conservation.
6. Have students discuss what their community is doing to conserve energy?
7. Have students discuss whether their city has a public transportation system and whether and how it saves
energy?
8. What are national programs doing to conserve energy or promote conservation? (Check out government
regulations for fuel efficiency standards, alternative energy research, and energy council.) The U.S.
Department of Energy and the state’s energy office also are good sources for this information.
Savings Sleuth
Grades:6-8
Subjects:Math, Environmental Science, Civics
Time Needed: Variable: involves individual, out-of-
class research and class discussion
Materials: diary
information about appliance brands
(costs, energy requirements, etc.)
found on labels of new appliances
and new vehicles
NATURAL RESOURCES
183 www.legacyenved.org
EVALUATION:1. Review student diaries.
2. Review student lists of energy-saving activities.
3. Evaluate behavioral changes planned by the students.
EXTENSIONS:1. Have students publish a newsletter with their findings in the format of a consumer report.
2. List and discuss benefits versus energy costs. This could be an appropriate time to introduce students to the
concept of externalities. (The time-cost of a product must include all indirect cost of producing and using
the product.)
ORIGINAL DEVELOPMENT RESOURCES:Adapted from Growing Greener Cities Education Guide, used with permission.
Environmental Protection Agency Greenlights Program.
U.S. Department of Energy. www.energy.gov
Consumer Reports. Appliance and vehicle energy ratings.
184
OBJECTIVE:Students will be able to:
Demonstrate processes for drinking water purification by the
use of settling and filtration processes.
BACKGROUND:Suspended solids are a common contaminant in surface sources
of untreated (raw) drinking water. Suspended materials must be
removed to make water suitable for consumption or potable. Two
common methods of removing suspended materials are filtration
and precipitation. Water treatment plants use chemicals such as
alum to cause particles to clump together and settle out faster.
VOCABULARY:settling process, potable water, purify, treatment plants, alum
PROCEDURE:Students should:
1. Fill a jar with water, and then place a teaspoon of soil in the
jar. Mix the soil and water well and let the mixture stand for a
few minutes. This mixture represents raw drinking water at a treatment plant. The soil will eventually
settle to the bottom of the jar.
2. Fill another jar (number 2) with water; mix in one teaspoonful of soil and a teaspoonful of alum. This step
demonstrates how an added chemical, alum in this case, speeds up the settling process.
3. Place a filter in the funnel. Place the funnel in the third jar and carefully pour into the funnel only the
water, trying not to pour in much of the dirt and alum that settled out in jar 2. The water filters through,
leaving behind any additional suspended materials (soil) on the filter, illustrating further a method for
drinking water treatment (precipitation followed by filtering).
4. Write down what was observed in the procedure.
5. Research the local drinking water treatment plant process and draw diagrams illustrating the steps in the
process including additional steps such as fluoridation and chlorination.
EVALUATION:Students should be able to explain the settling process, specifically how a settling basin works. In this
evaluation, they should contrast what happened in the first, second, and third jars and know why.
EXTENSION: Arrange for a field trip to a water treatment plant or a speaker to visit the class.
ORIGINAL DEVELOPMENT RESOURCES:Tennessee Valley Authority
Settling Down To Clean Drinking Water
Grades:6-8
Subject:Science
Time Needed: One class period
Materials: three jars
powdered alum
filter paper
1 cup of soil
funnel
spoon
NATURAL RESOURCES
185 www.legacyenved.org

Notes
186
OBJECTIVES: Students will be able to:
1. Describe an urban forest.
2. Explain an urban forest’s contribution to their lives.
BACKGROUND:Until you really know the condition of your urban forest and the
environment in which it exists, you cannot take appropriate
action to improve it.
In 1991 American Forests conducted a survey of 20 major city
forests. It found the average life of a city tree to be just 32 years,
much shorter than that of a tree in a rural forest. The survey also
revealed that many cities remove more trees than they plant.
Regular tree care is needed to help improve the tree condition and
life span of urban forests. In addition, by planting more trees in
the cities, we can help fill those empty spaces along our streets.
By exploring Alabama’s urban forests, students will learn about their local environment, its health, and what
can be done to improve it.
VOCABULARY:urban area, rural, urban forest
PROCEDURE: 1. Ask students, as individuals or in small groups, to write scripts for use on a tour of neighborhood trees to
be conducted by the students for an audience such as another class or an outside group. The neighborhood
might be local residential area, a downtown area, a park or arboretum, or simply the school grounds.
2. The students must think about the audience for whom they are developing this tour. What are the
knowledge and skill levels of those taking the tour? Do your tourists have a scientific interest, or do they
just think trees are pretty? Remind students to be conscious of the safety concerns when someone is taking
the tour. Students also should keep in mind the attention span of younger children. Encourage them to
think about the ways people learn—by seeing, doing, or listening. Trial runs for the class can be useful
before finalizing the script. The tour should include the following information and the “Tree Tour
Worksheet” could be used as a guide:
• Each tree’s location.
• Each tree’s common name and scientific name.
• Each tree’s growing cycle. (Describe when the tree sheds its leaves.)
• A description including some details about leaves, flowers, fruits, seeds. (or one unique feature of a tree
that will help someone remember it—a sycamore has peeling bark, a ginkgo loses all its fan-shaped leaves
in a single day or two).
• The relationship of the tree to other organisms, including people.
• Who takes care of the tree?
• Can you see any animals, birds, or insect inhabitants? What evidence exists?
• Each tree’s size and general health. What are the signs of a healthy or unhealthy tree?
• How old do you think the tree is? If the tree is on public property, who makes decisions concerning the
tree?
Tour The Trees
Grades:6-8
Subjects:Science, Social Studies
Time Needed: Two to three 40-minute class periods
Materials: a tree identification guide
copies of the Tree Tour worksheet
NATURAL RESOURCES
187 www.legacyenved.org
• Have students research the value of this tree, or trees of this type, including historic, environmental,
social, and economic.
EVALUATION:1. Quality of the tour script and ability of students to conduct the tour could be evaluated.
2. The class can have a thorough discussion regarding the ten major points outlined above. The Tree Tour
handout can be used, making sure that all questions are answered.
3. Students also could collect leaves from trees on the tour or take photographs and make a tree scrapbook.
EXTENSIONS: 1. Encourage students to make their tours lively and interesting. They might want to tape-record music to go
along with their tour information, tell an historical anecdote about the area, or bring along a magnifying
glass for looking close-up at features and inhabitants of the tree.
2. Have students complete the “Tree-mendous Alabama Crossword Puzzle” (attached).
ORIGINAL DEVELOPMENT RESOURCES:Adapted from Growing Greener Cities Education Guide, used with permission.
100 Forest Trees of Alabama. Available at www.alabamaforestinfo.org
Alabama Forests. 1998. Video part of Discovering Alabama series. Available at
www.discoveringalabama.com
Alabama Forest Facts. www.alaforestry.org
188
Tree Tour Worksheet
Tree Tour Stop #:
Location:
Common Name:
Description: (Leaves? Flowers? Fruit? Seeds? Any animal, bird, and insect inhabitants? Anything unusual
about this tree? Include size, approximate age, growing cycle, and general health.)
What is the tree’s relationship to other organisms, including people?
Who takes care of this tree?
What is the tree’s future?
What values are provided by this tree?
On the back of this page, make a sketch of the tree and/or its leaves. A leaf rubbing from the tree could be
made or the leaf could be attached to the back of this page.
189
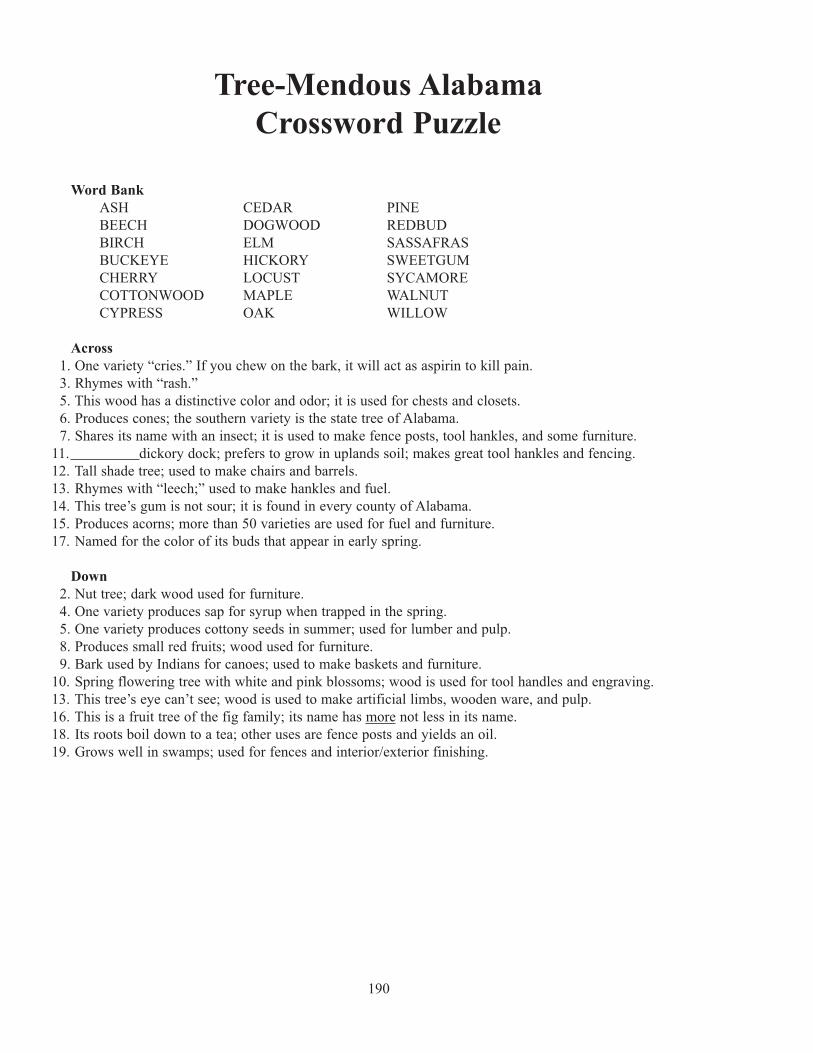
Tree-Mendous Alabama
Crossword Puzzle
Word Bank
ASH CEDAR PINE
BEECH DOGWOOD REDBUD
BIRCH ELM SASSAFRAS
BUCKEYE HICKORY SWEETGUM
CHERRY LOCUST SYCAMORE
COTTONWOOD MAPLE WALNUT
CYPRESS OAK WILLOW
Across
1. One variety “cries.” If you chew on the bark, it will act as aspirin to kill pain.
3. Rhymes with “rash.”
5. This wood has a distinctive color and odor; it is used for chests and closets.
6. Produces cones; the southern variety is the state tree of Alabama.
7. Shares its name with an insect; it is used to make fence posts, tool hankles, and some furniture.
11. dickory dock; prefers to grow in uplands soil; makes great tool hankles and fencing.
12. Tall shade tree; used to make chairs and barrels.
13. Rhymes with “leech;” used to make hankles and fuel.
14. This tree’s gum is not sour; it is found in every county of Alabama.
15. Produces acorns; more than 50 varieties are used for fuel and furniture.
17. Named for the color of its buds that appear in early spring.
Down
2. Nut tree; dark wood used for furniture.
4. One variety produces sap for syrup when trapped in the spring.
5. One variety produces cottony seeds in summer; used for lumber and pulp.
8. Produces small red fruits; wood used for furniture.
9. Bark used by Indians for canoes; used to make baskets and furniture.
10. Spring flowering tree with white and pink blossoms; wood is used for tool handles and engraving.
13. This tree’s eye can’t see; wood is used to make artificial limbs, wooden ware, and pulp.
16. This is a fruit tree of the fig family; its name has more not less in its name.
18. Its roots boil down to a tea; other uses are fence posts and yields an oil.
19. Grows well in swamps; used for fences and interior/exterior finishing.
190
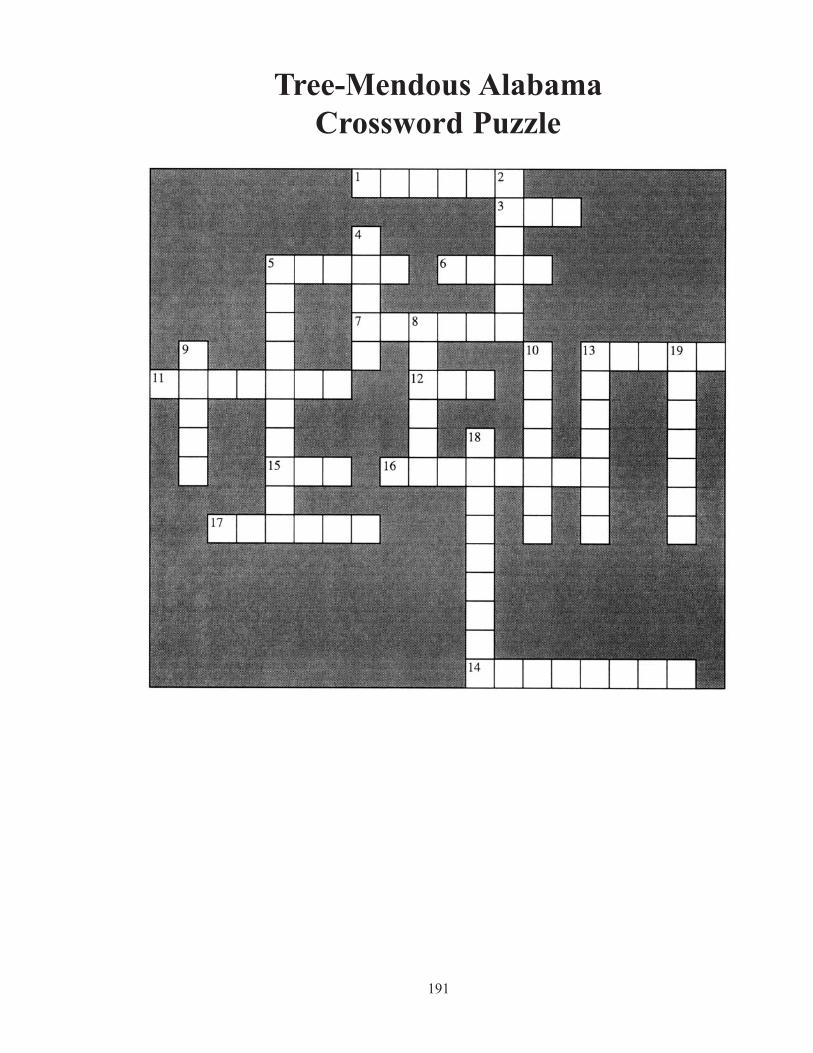
191
Tree-Mendous Alabama
Crossword Puzzle
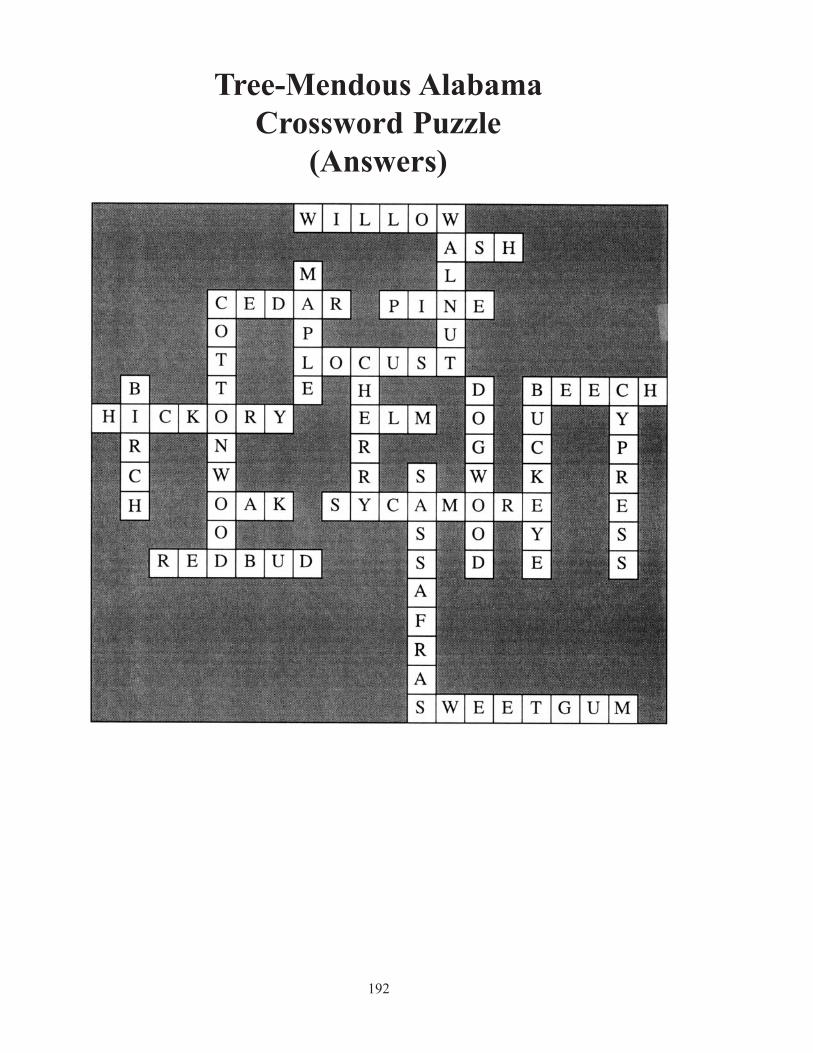
192
Tree-Mendous Alabama
Crossword Puzzle
(Answers)
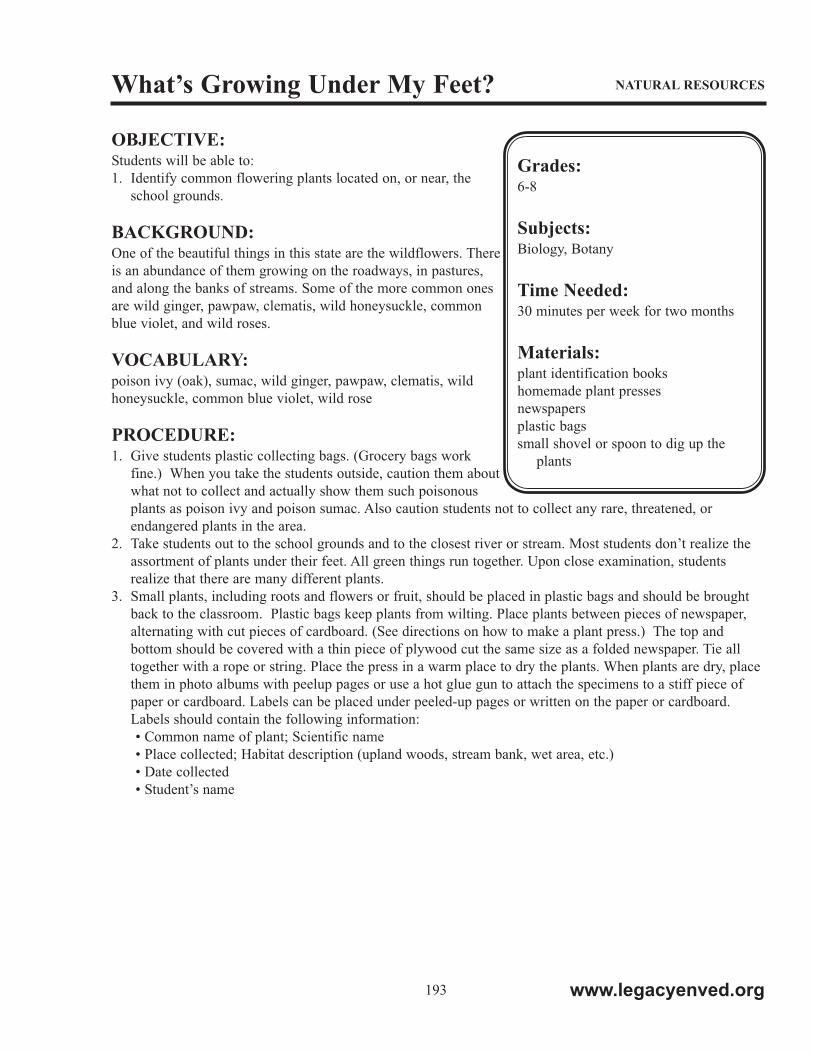
OBJECTIVE:Students will be able to:
1. Identify common flowering plants located on, or near, the
school grounds.
BACKGROUND:One of the beautiful things in this state are the wildflowers. There
is an abundance of them growing on the roadways, in pastures,
and along the banks of streams. Some of the more common ones
are wild ginger, pawpaw, clematis, wild honeysuckle, common
blue violet, and wild roses.
VOCABULARY:poison ivy (oak), sumac, wild ginger, pawpaw, clematis, wild
honeysuckle, common blue violet, wild rose
PROCEDURE:1. Give students plastic collecting bags. (Grocery bags work
fine.) When you take the students outside, caution them about
what not to collect and actually show them such poisonous
plants as poison ivy and poison sumac. Also caution students not to collect any rare, threatened, or
endangered plants in the area.
2. Take students out to the school grounds and to the closest river or stream. Most students don’t realize the
assortment of plants under their feet. All green things run together. Upon close examination, students
realize that there are many different plants.
3. Small plants, including roots and flowers or fruit, should be placed in plastic bags and should be brought
back to the classroom. Plastic bags keep plants from wilting. Place plants between pieces of newspaper,
alternating with cut pieces of cardboard. (See directions on how to make a plant press.) The top and
bottom should be covered with a thin piece of plywood cut the same size as a folded newspaper. Tie all
together with a rope or string. Place the press in a warm place to dry the plants. When plants are dry, place
them in photo albums with peelup pages or use a hot glue gun to attach the specimens to a stiff piece of
paper or cardboard. Labels can be placed under peeled-up pages or written on the paper or cardboard.
Labels should contain the following information:
• Common name of plant; Scientific name
• Place collected; Habitat description (upland woods, stream bank, wet area, etc.)
• Date collected
• Student’s name
What’s Growing Under My Feet?
Grades:6-8
Subjects:Biology, Botany
Time Needed: 30 minutes per week for two months
Materials: plant identification books
homemade plant presses
newspapers
plastic bags
small shovel or spoon to dig up the
plants
NATURAL RESOURCES
193 www.legacyenved.org
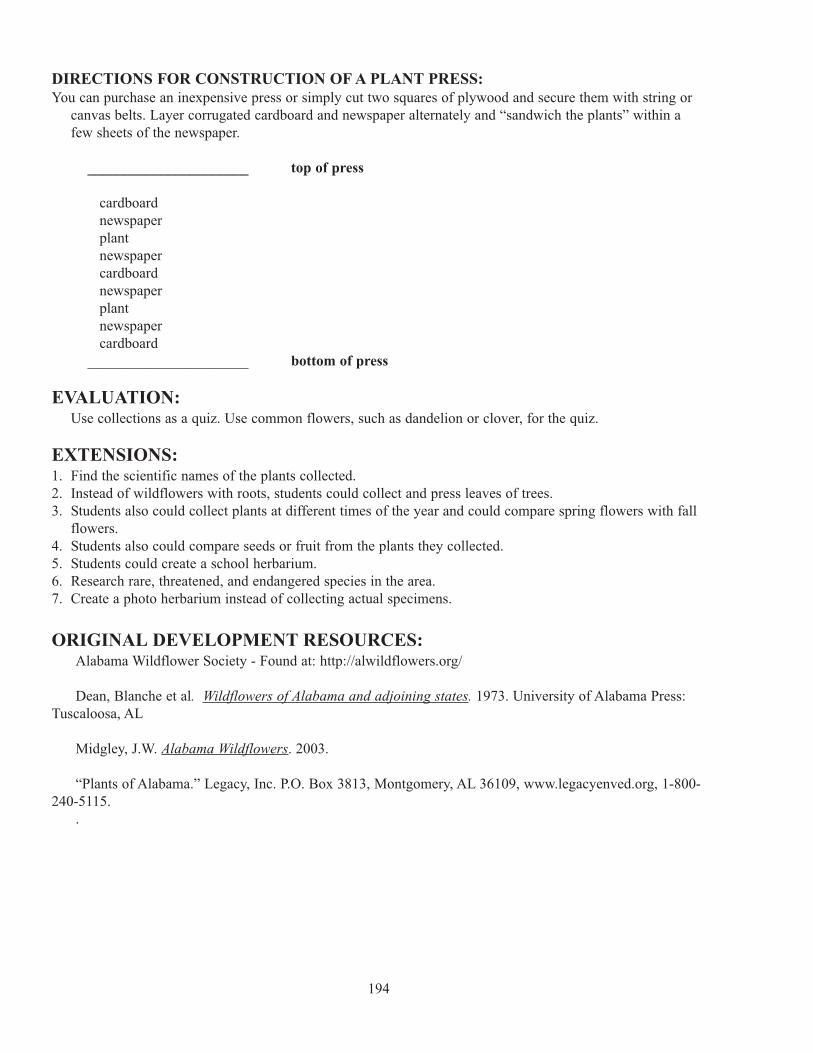
DIRECTIONS FOR CONSTRUCTION OF A PLANT PRESS:
You can purchase an inexpensive press or simply cut two squares of plywood and secure them with string or
canvas belts. Layer corrugated cardboard and newspaper alternately and “sandwich the plants” within a
few sheets of the newspaper.
______________________ top of press
cardboard
newspaper
plant
newspaper
cardboard
newspaper
plant
newspaper
cardboard
______________________ bottom of press
EVALUATION:Use collections as a quiz. Use common flowers, such as dandelion or clover, for the quiz.
EXTENSIONS:1. Find the scientific names of the plants collected.
2. Instead of wildflowers with roots, students could collect and press leaves of trees.
3. Students also could collect plants at different times of the year and could compare spring flowers with fall
flowers.
4. Students also could compare seeds or fruit from the plants they collected.
5. Students could create a school herbarium.
6. Research rare, threatened, and endangered species in the area.
7. Create a photo herbarium instead of collecting actual specimens.
ORIGINAL DEVELOPMENT RESOURCES:Alabama Wildflower Society - Found at: http://alwildflowers.org/
Dean, Blanche et al. Wildflowers of Alabama and adjoining states. 1973. University of Alabama Press:
Tuscaloosa, AL
Midgley, J.W. Alabama Wildflowers. 2003.
“Plants of Alabama.” Legacy, Inc. P.O. Box 3813, Montgomery, AL 36109, www.legacyenved.org, 1-800-
240-5115.
.
194
OBJECTIVES:Students will be able to:
1. Describe some economic and environmental benefits of trees.
2. Discuss how trees or tree-related products fit into the students’
lives.
BACKGROUND:Trees have many values. These include:
Environmental valuesClean water—The hairlike root fibers of trees help filter ground
water, trapping nutrients and pollutants that could contaminate
it.
Soil protection and nourishment—Tree roots hold soil in place so
it cannot easily be swept away by wind or water; the
decaying of dead tree parts returns nutrients to the soil.
Storm water control—Leaves and branches slow the movement
of rain to the ground, allowing it to soak in slowly. Without
trees and other vegetation, heavy rains can wash soil into
streams and rivers, making them more shallow and prone to overflow.
Air quality—Trees provide oxygen and use carbon dioxide. They also intercept particulates, such as dust and
pollen, with their leaves.
Mineral and nutrient cycling—Through growth, transpiration, and death, trees cycle and use minerals and
nutrients from the air, water, and soil (mostly from the soil).
Climate control—Trees moderate temperatures by working as natural barriers to wind, snow, rain, and solar
rays. Through evapotranspiration, trees add moisture and cool the air.
Habitat for wildlife—Trees and forests provide homes for many different species of animals. Some plants
need trees for structural support.
Human ValuesAesthetics (beauty)—Trees beautify urban and community areas such as parks, streets, and school yards.
Recreation and physical health—Forests are great places for activities such as hiking, backpacking, skiing,
hunting, and bird-watching.
Community spirit—Planting and caring for community trees can bring neighbors together to improve their
environment and to build a sense of community and environmental stewardship.
Natural sources of medicines—Trees provide substances with medicinal values such as taxol extracted from
the bark of the yew that is used in treating cancer.
Education—Forested areas offer many resources as outdoor classrooms.
Economy—Making room for trees in cities provides job opportunities and a healthier environment. The forest
industry also provides jobs for many people, from loggers to cabinetmakers and home builders. Trees
planted for energy conservation help consumers save money.
Forest products—More than 5000 products and by-products come from trees. They include wood products,
paper products, sap products, and foods. We use them every day.
VOCABULARY:evapotranspiration, lignin
What’s A Tree Worth?
Grades:6-8
Subjects:Ecology, Botany, Social Studies,
Economics, Fine Arts
Time Needed: Two 40-minute class periods
Materials: copies of “What Are Trees Used For?”
handout
NATURAL RESOURCES
195 www.legacyenved.org
PROCEDURE:1. Ask students to suggest ways that trees or tree-related products fit into their own lives. Remind them of the
natural environment, home, school, food, music, art, transportation, and recreation.
2. Have students read the “What Are Trees Used For?” handout.
3. Have students conduct a survey in their home, yard, garage, workshop, or the classroom of all the products
that are found on the handout. List each and bring the list to class.
4. Students should identify environmental connections of forests or trees to climate.
EVALUATION:1. Have students count the number of products from trees used by each one of them in order to determine
who relies on trees the most.
2. Combine information or data about product use and have students develop graphs.
3. Have students discuss the cooling effect (air conditioning saved) by trees around a home and the
importance of trees as windbreaks.
EXTENSIONS: 1. Have students make an art collage of the products discussed in “What Are Trees Used For?”
2. Invite a forester to discuss the economic and environmental roles of forestry in Alabama.
ORIGINAL DEVELOPMENT RESOURCES:Adapted from Growing Greener Cities Education Guide.
Alabama Forest Facts. www.alaforestry.org
196
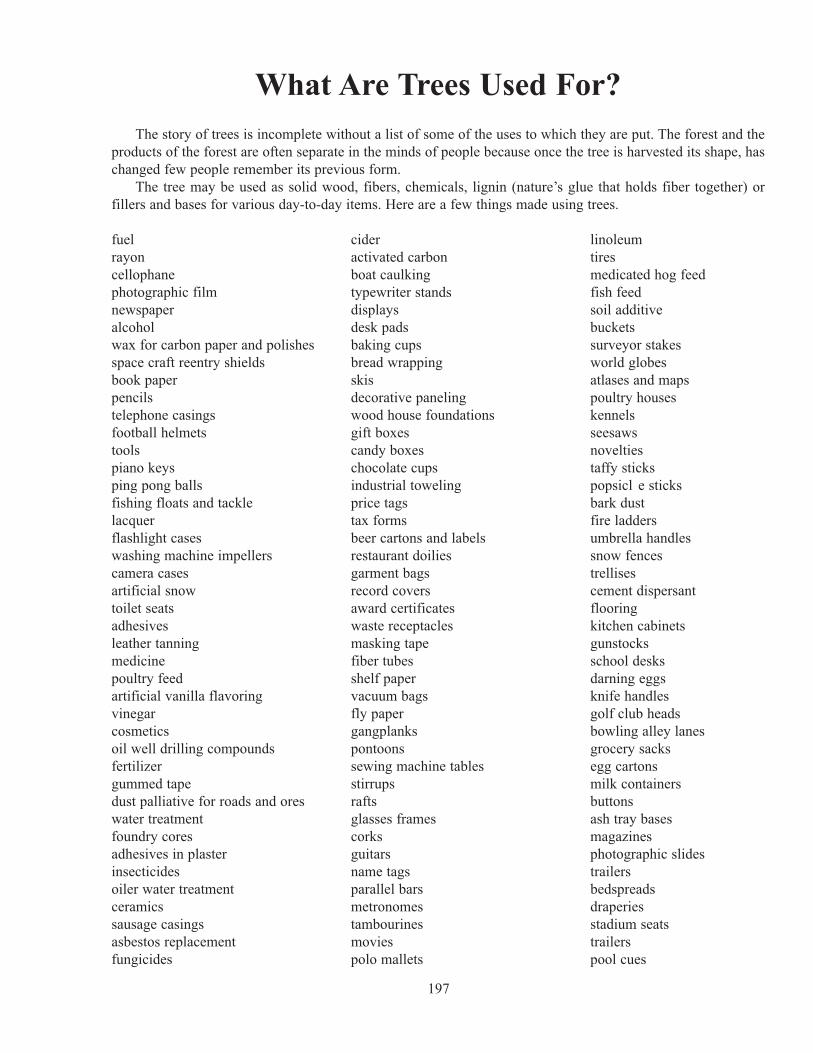
What Are Trees Used For?
The story of trees is incomplete without a list of some of the uses to which they are put. The forest and the
products of the forest are often separate in the minds of people because once the tree is harvested its shape, has
changed few people remember its previous form.
The tree may be used as solid wood, fibers, chemicals, lignin (nature’s glue that holds fiber together) or
fillers and bases for various day-to-day items. Here are a few things made using trees.
fuel cider linoleum
rayon activated carbon tires
cellophane boat caulking medicated hog feed
photographic film typewriter stands fish feed
newspaper displays soil additive
alcohol desk pads buckets
wax for carbon paper and polishes baking cups surveyor stakes
space craft reentry shields bread wrapping world globes
book paper skis atlases and maps
pencils decorative paneling poultry houses
telephone casings wood house foundations kennels
football helmets gift boxes seesaws
tools candy boxes novelties
piano keys chocolate cups taffy sticks
ping pong balls industrial toweling popsicl e sticks
fishing floats and tackle price tags bark dust
lacquer tax forms fire ladders
flashlight cases beer cartons and labels umbrella handles
washing machine impellers restaurant doilies snow fences
camera cases garment bags trellises
artificial snow record covers cement dispersant
toilet seats award certificates flooring
adhesives waste receptacles kitchen cabinets
leather tanning masking tape gunstocks
medicine fiber tubes school desks
poultry feed shelf paper darning eggs
artificial vanilla flavoring vacuum bags knife handles
vinegar fly paper golf club heads
cosmetics gangplanks bowling alley lanes
oil well drilling compounds pontoons grocery sacks
fertilizer sewing machine tables egg cartons
gummed tape stirrups milk containers
dust palliative for roads and ores rafts buttons
water treatment glasses frames ash tray bases
foundry cores corks magazines
adhesives in plaster guitars photographic slides
insecticides name tags trailers
oiler water treatment parallel bars bedspreads
ceramics metronomes draperies
sausage casings tambourines stadium seats
asbestos replacement movies trailers
fungicides polo mallets pool cues
197
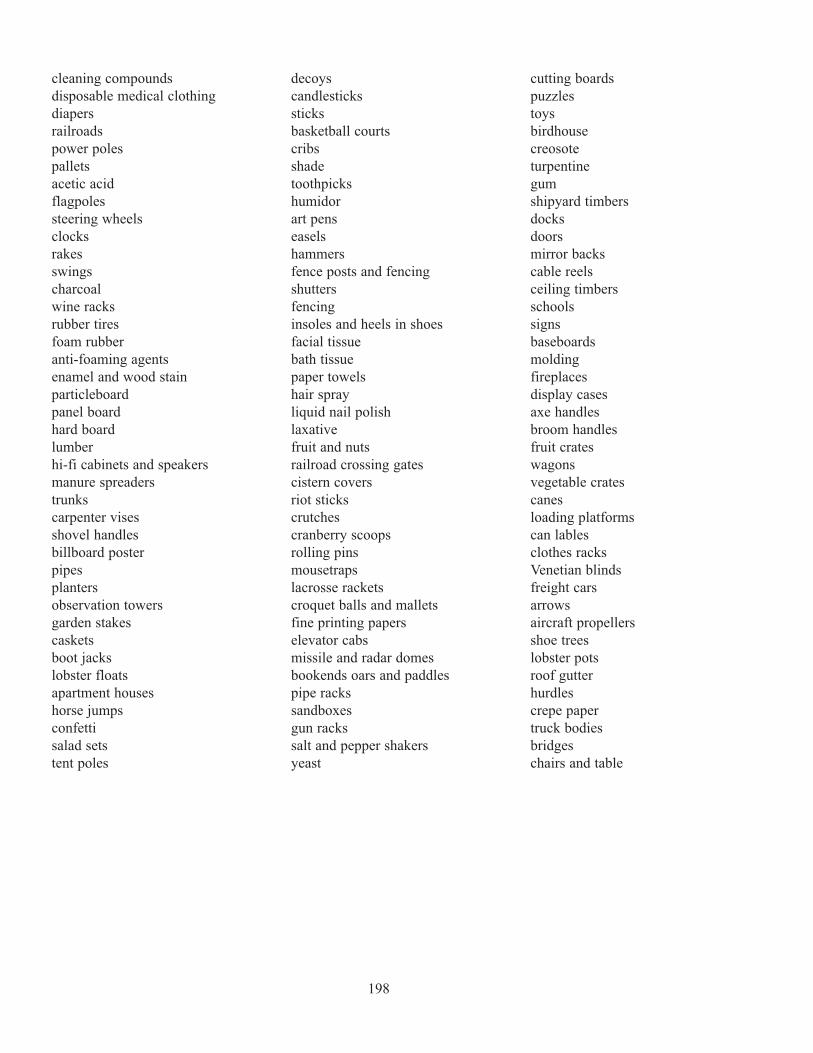
cleaning compounds decoys cutting boards
disposable medical clothing candlesticks puzzles
diapers sticks toys
railroads basketball courts birdhouse
power poles cribs creosote
pallets shade turpentine
acetic acid toothpicks gum
flagpoles humidor shipyard timbers
steering wheels art pens docks
clocks easels doors
rakes hammers mirror backs
swings fence posts and fencing cable reels
charcoal shutters ceiling timbers
wine racks fencing schools
rubber tires insoles and heels in shoes signs
foam rubber facial tissue baseboards
anti-foaming agents bath tissue molding
enamel and wood stain paper towels fireplaces
particleboard hair spray display cases
panel board liquid nail polish axe handles
hard board laxative broom handles
lumber fruit and nuts fruit crates
hi-fi cabinets and speakers railroad crossing gates wagons
manure spreaders cistern covers vegetable crates
trunks riot sticks canes
carpenter vises crutches loading platforms
shovel handles cranberry scoops can lables
billboard poster rolling pins clothes racks
pipes mousetraps Venetian blinds
planters lacrosse rackets freight cars
observation towers croquet balls and mallets arrows
garden stakes fine printing papers aircraft propellers
caskets elevator cabs shoe trees
boot jacks missile and radar domes lobster pots
lobster floats bookends oars and paddles roof gutter
apartment houses pipe racks hurdles
horse jumps sandboxes crepe paper
confetti gun racks truck bodies
salad sets salt and pepper shakers bridges
tent poles yeast chairs and table
198
OBJECTIVES:Students will be able to:
1. Give examples of petroleum products.
2. Define the advantages and disadvantages of petroleum’s use.
BACKGROUND: Petroleum literally means rock oil: oil that comes from rock.
Petroleum is formed from organic matter (plants, animals, and
microbes) that is buried deep below the Earth’s surface by layer
upon layer of sediment (sand, mud). Over long periods of time,
the organic material is transformed by heat and pressure into
crude oil. Petroleum is lighter than water. It moves upward
through the ground water, which fills the tiny holes and crevices
in the rocks, until it reaches an impermeable layer where the
holes are too small for the droplets to pass through.
Oil wells are drilled as deep as six miles into the Earth to search
for petroleum. These wells can cost millions of dollars to drill,
yet drilling is done because petroleum is a valuable natural
resource. Although the major use of petroleum is fuel (gasoline,
jet fuel, heating oil), and petroleum and natural gas are often used
to generate electricity, there are many other uses. Petroleum is
used in our everyday lives. A majority of plastic is made from
petroleum and is used almost everywhere: in cars, houses, toys, computers, clothing, etc. Asphalt used in
road construction is a petroleum product as is the synthetic rubber in tires. Paraffin wax comes from
petroleum as do some fertilizers, pesticides, herbicides, detergents, phonograph records, photographic film,
furniture, packaging materials, surfboards, paints, and artificial fibers used in clothing, upholstery, and carpet
backing. (See the included list for more examples.) Helium, sulfur, and other valuable materials are produced
from oil wells along with petroleum itself. Millions of people around the world are employed to find or
produce petroleum, ship and refine it, and manufacture and market the many products made from it.
There are problems with petroleum that may result from its use. In transporting oil, accidents can happen. Oil
spills can kill plants and animals and spoil beaches. Spills may happen closer to home: people sometimes
dump used oil from vehicle engines onto the ground or into open drains instead of taking it to a recycling
center. This causes pollution. Plastic objects and containers are thrown away, but the plastic does not decay
quickly. It stays around and sometimes may injure or kill wildlife; for example, plastic rings from “six packs”
can choke birds and animals. An action as simple as cutting each of the rings with scissors before throwing it
away could save animal lives! Plastic bottles thrown overboard from ships and boats wash up on beaches.
Thoughtless disposal of plastic causes problems for us all. How can we use petroleum products more sensibly
in our lives?
The burning of fossil fuels (gasoline, heating oil, kerosene, natural gas, and coal) produces the gas carbon
dioxide (CO2) as a by-product. Some scientists theorize that adding excess CO2 to the atmosphere could
cause global climate change (warming). Light energy from the sun is converted into heat energy on the Earth.
Some of this heat is radiated back out into space. CO2 in the atmosphere traps some of this heat energy on the
Earth, thus contributing to global climate change (warming). If the burning of fossil fuels contributes to global
climate change, the results could be catastrophic. If the temperature rose high enough, the glaciers and ice
Why Do We Need Petroleum?
Grades:6-8
Subject:Science
Time Needed: 15-30 minutes to discuss the uses of
petroleum; up to one hour for
students to write their essays or
stories
Materials: copies of activity sheet and illustrations
for all students
colored pencils
marker
paint
paint brushes
NATURAL RESOURCES
199 www.legacyenved.org
caps could melt, raising the level of the oceans and flooding coastal cities like New York, Miami, and New
Orleans.
Some scientists theorize that volcanic eruptions throw more gases and volitile chemicals into the atmosphere
than humans could produce in three million years!
Some people would like to prevent the pollution that the use of petroleum products can cause by doing
without petroleum altogether. Is this possible? What would it be like to live in a world without petroleum?
VOCABULARY:petroleum, fossil fuel, plastic, asphalt, carbon dioxide, global climate change, oil spills, environment, air
pollution, water pollution, sediment, organic matter, crude oil
PROCEDURE:1. Discuss the uses of petroleum products. Bring examples to the classroom, or ask the students to bring
examples. Be sure that they understand how widespread petroleum products are in our society.
2. Discuss pollution related to the use of petroleum. Guide the students to an understanding that the use of
petroleum has environmental consequences. Are there things they can do in their own lives to prevent or
decrease these consequences?
3. The students’ worksheets include two illustrations: a house containing common household items made with
petroleum products and an identical house from which all items made with petroleum have been removed.
Ask the students to draw in the second house non-petroleum replacements for the missing items. Are there
always alternatives? They can use this part of the exercise to warm up for step 4. If time is short, either
step 3 or 4 of the exercise could be eliminated.
4. Have the students creatively express their own ideas about how the world would be different if there were
no petroleum products in it. If they seem to have some trouble getting started, make a few suggestions.
Encourage them to draw or paint and to write essays, stories, or poems. If you want to focus the scope of
the students’ creativity, you could, for example, ask the students to think about what would be different in
their house or their school if all petroleum products were removed. Suggest also that they propose
substitutes for the missing petroleum products they think they would be unable to do without.
EVALUATION: Examination of the student worksheets and evaluation of discussions should determine the level of
students’ assimilation and understanding of the lesson.
EXTENSIONS:1. After the students finish the exercise, ask them to describe what the world would be like without
petroleum. Hearing the other students’ ideas will help them better understand the role of petroleum in their
lives.
2. Another good thing to discuss at the end of the exercise is pollution. Are there petroleum products the
students are willing to live without in order to prevent pollution? What ideas can the students suggest to
deal with pollution problems related to the use of petroleum? Can we use petroleum more wisely?
3. Have the students research plastic recycling. Have them locate plastic recycling centers in the area.
ORIGINAL DEVELOPMENT RESOURCES:The list of products made from petroleum is modified from the American Petroleum Institute’s (API)
“Petrochemical Products” list and from Laurie Sachtleben’s article “Products from Petroleum,” ChevronWorld magazine, Winter 1990.
Oil recycling information from Project ROSE
200
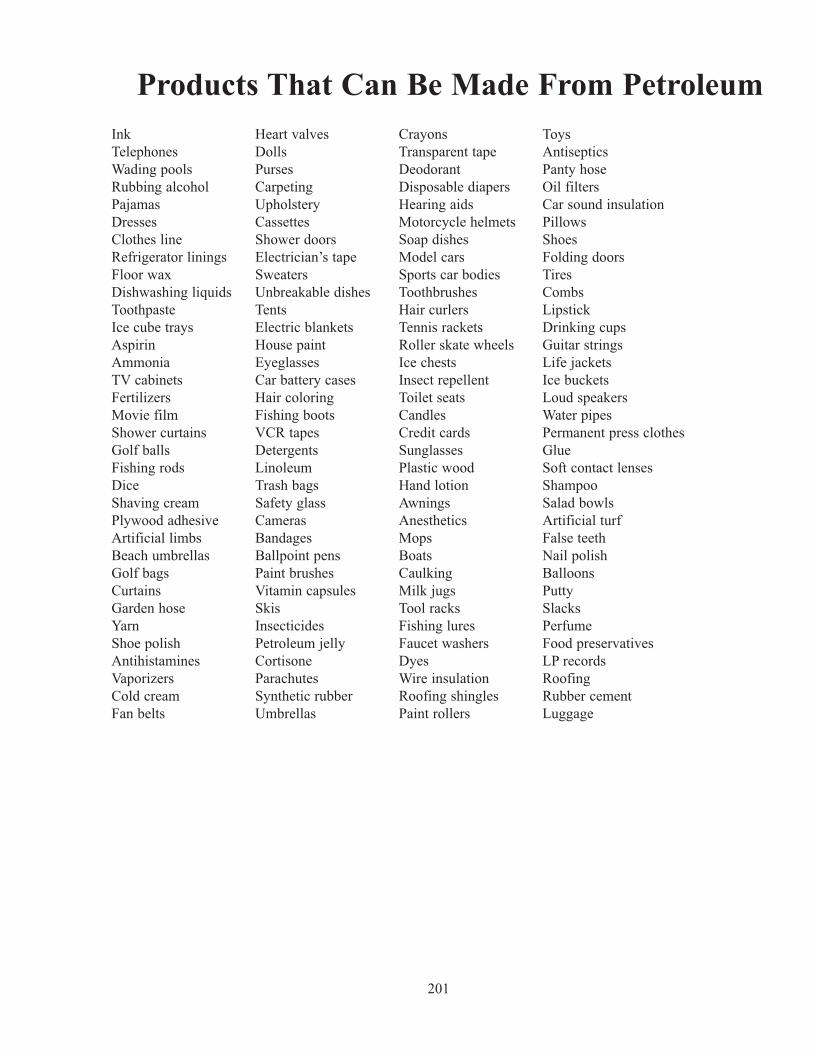
Products That Can Be Made From Petroleum
Ink Heart valves Crayons Toys
Telephones Dolls Transparent tape Antiseptics
Wading pools Purses Deodorant Panty hose
Rubbing alcohol Carpeting Disposable diapers Oil filters
Pajamas Upholstery Hearing aids Car sound insulation
Dresses Cassettes Motorcycle helmets Pillows
Clothes line Shower doors Soap dishes Shoes
Refrigerator linings Electrician’s tape Model cars Folding doors
Floor wax Sweaters Sports car bodies Tires
Dishwashing liquids Unbreakable dishes Toothbrushes Combs
Toothpaste Tents Hair curlers Lipstick
Ice cube trays Electric blankets Tennis rackets Drinking cups
Aspirin House paint Roller skate wheels Guitar strings
Ammonia Eyeglasses Ice chests Life jackets
TV cabinets Car battery cases Insect repellent Ice buckets
Fertilizers Hair coloring Toilet seats Loud speakers
Movie film Fishing boots Candles Water pipes
Shower curtains VCR tapes Credit cards Permanent press clothes
Golf balls Detergents Sunglasses Glue
Fishing rods Linoleum Plastic wood Soft contact lenses
Dice Trash bags Hand lotion Shampoo
Shaving cream Safety glass Awnings Salad bowls
Plywood adhesive Cameras Anesthetics Artificial turf
Artificial limbs Bandages Mops False teeth
Beach umbrellas Ballpoint pens Boats Nail polish
Golf bags Paint brushes Caulking Balloons
Curtains Vitamin capsules Milk jugs Putty
Garden hose Skis Tool racks Slacks
Yarn Insecticides Fishing lures Perfume
Shoe polish Petroleum jelly Faucet washers Food preservatives
Antihistamines Cortisone Dyes LP records
Vaporizers Parachutes Wire insulation Roofing
Cold cream Synthetic rubber Roofing shingles Rubber cement
Fan belts Umbrellas Paint rollers Luggage
201
Student Activity Sheet
Why Do We Need Petroleum?
NAME: ___________________________________
Your teacher will discuss some uses of petroleum as well as some problems caused by the use of petroleum.
Here are a few things you or your family come into contact with every day that are made from petroleum:
gasoline, plastic (everything made from plastic comes from petroleum), artificial rubber, candle wax, fertilizer,
detergents, photographic film, furniture, packaging materials, surfboards, paints, protective gloves, raincoats,
and umbrellas. Petroleum is sometimes used to generate electricity. Helium, sulfur, and other valuable
materials are produced from oil wells along with the petroleum itself. Millions of people around the world
work to find and produce petroleum, ship and refine it, make things out of it, and sell those many products.
Instructions:
This activity sheet includes pictures of two houses. The houses are identical except everything made with
petroleum has been taken out of the second one. On this picture, draw replacements not made with petroleum
products for the missing items.
Is it hard to find petroleum-free replacements for some of these missing items?
Do we need to have all these things?
Use your imagination to think of a world without ANY petroleum in it. Would you like to live in such a
world? What would you have to give up? What would be better? Write an essay, story, or poem or draw a
picture illustrating this petroleum-free world you have imagined and what it would be like.
When you are done, share your ideas. Did some of your friends think of things you hadn’t thought about?
Have you changed your mind about whether or not you would like to live in a world without petroleum? Can
we use the petroleum we have more wisely?
202
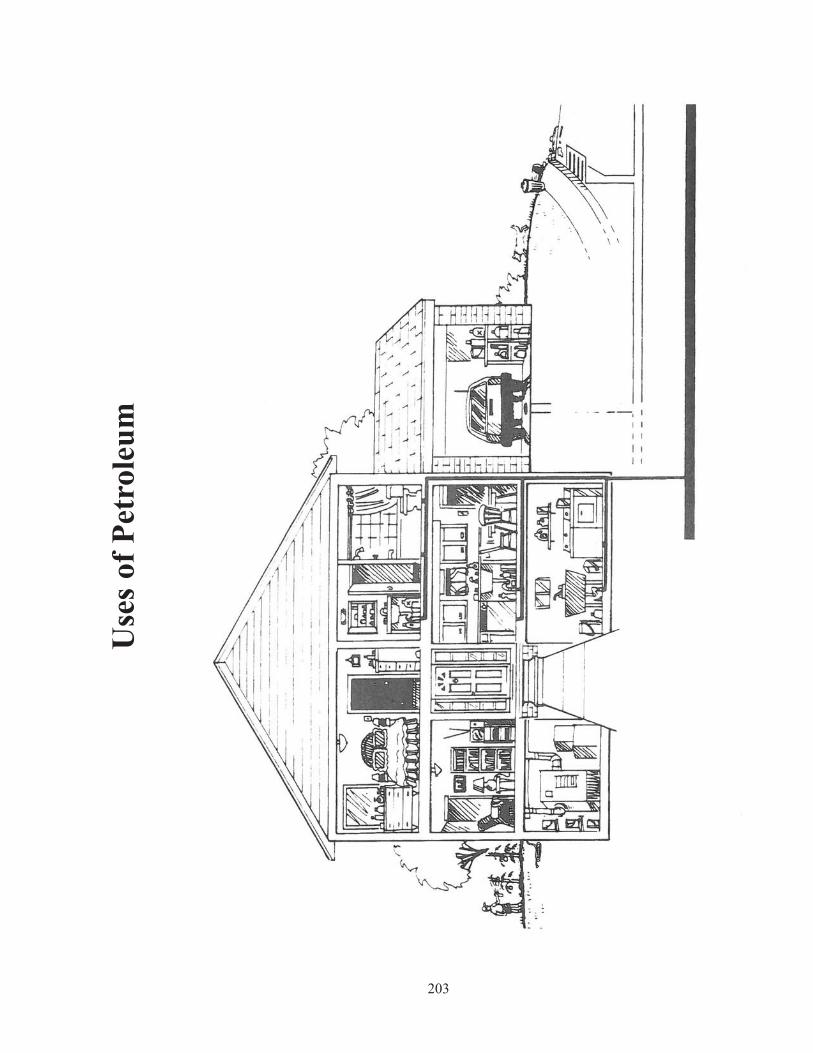
203
Use
s of
Pet
role
um
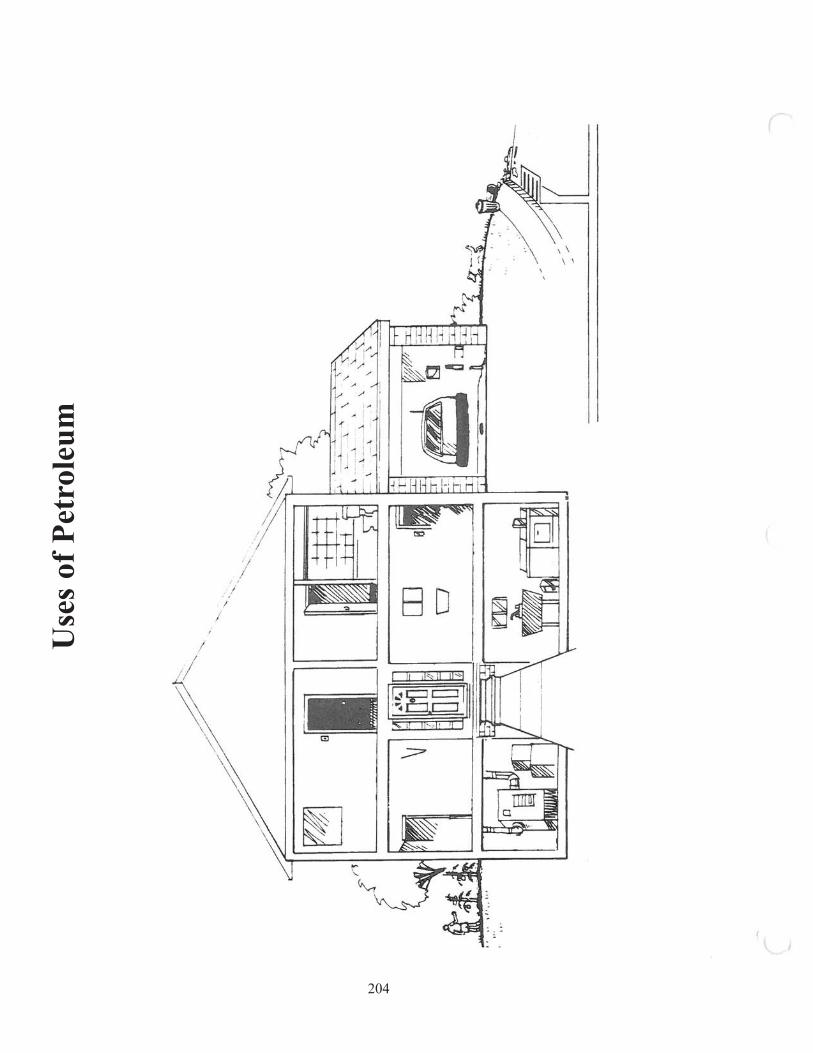
204
Use
s of
Pet
role
um
Glossary
acid rain: Rain with a pH of less than 5.6 caused by emissions from the burning of fossil fuels.
acidity: The measure of the compound that neutrilizesalkalis.
adopt: To accept and take in.
advertising: The process or the product of making something known or public.
aesthetic degradation: Anything that causes the beauty of an area to decrease.
air pollution: Contaminants and particulates in the air
alkalinity: The measure of the base that neutralizes acids.
All Terrain Vehicles (ATVs): Vehicles that were made to go on surfaces other than traditional roads.
anaerobic: Able to live and grow in the absence of free oxygen; often, anaerobic decomposition of organic
wastes results in the production and release of methane gas.
aquatic: An organism that grows or lives in water.
aquifer: An underground geological formation in which the cracks in rocks, sand, soil, or gravel are filled
with water. A unique group of earth materials capable of storing and transmitting significant volumes of water
to a well or spring.
artificial: Made by humans.
artificial reef: A reef made by humans.
ash: Mineral content of a product that remains after complete combustion.
average: The total of a set of numbers divided by how many numbers are in the set.
bacteria: A single-celled microorganism. Some cause diseases most often treated by antibiotics. Some
consume waste or spill products such as sewage, oil, or even chemicals.
bag limits: Maximum amount of fish or game animals permitted by law to be taken by one person in a given
period.
bandwagon: The popular or apparent winning side of a cause.
barnacles: Common name of a crustacean species that attaches itself to ship bottoms and floating timber.
basin: A broad area of the Earth beneath which the strata dip, usually from the sides to the center.
biodegradable: Capable of being decomposed (broken down) by natural biological processes.
British thermal unit (Btu): The amount of heat needed to raise the temperature of one pound of water one
205
degree Fahrenheit.
by-product: Something produced in addition to the principal product.
canal: An artificial waterway.
caretaker: One who looks after something or someone.
chemical pollution: Introduction of chemical contaminants into a body of water.
chlorination: The process of disinfecting water by chlorine gas or hypochlorite.
Clean Vessel Act: A 1992 Act that provides funds to states for the construction, renovation, operation, and
maintenance of vessel sewage pumpout stations and waste reception facilities to improve water quality.
colony: Groups of organisms of the same species living or growing together.
colonization: The establishment of a colony.
commercial fertilizers: Fertilizers used for commercial purposes such as agriculture.
commercial fishing: Fishing on a large scale where the catch is sold to dealers or processors.
composite plants: Of, or relating to, a very large family (compositae) or dicotyledonous herbs, shrubs, and
trees, often considered to be the most highly evolved plants and characterized by florets arranged in dense
heads that resemble single flowers.
compost: Decayed matter formed by biodegradation that can be used as a soil conditioner.
compost bin: Bin or container used to contain or hold compost.
conservation: The use of natural resources in a way that assures their continuing availability to future
generations because they are used wisely and intelligently.
contaminant: An impurity that causes air, soil, or water to be harmful to human health or the environment.
corrode: To wear away gradually by chemical action.
crucial: Of extreme importance.
cullet: Scrap glass that has been broken into tiny pieces.
decompose: To decay or rot; a result of microbial action.
deinking: A process used in paper recycling in which the ink is removed from the paper using special
processes or chemicals.
deteriorate: To decline in the quality of equipment or structures after a period of time due to chemical or
physical action of the environment.
discard: The municipal solid waste remaining after recovery for recycling and composting.
206
disinfect: To cleanse of harmful organisms.
dissolved oxygen (DO): Oxygen gas (O2) dissolved in water.
distillates: The liquid condensed from vapor in distillation.
ditch: Small artificial channel cut through earth or rock to carry water for irrigation or drainage.
E. coli (Escherichia coli): Type of bacteria that is found in the gut of mammals and other animals.
ecosystem: A system dealing with the interrelationship of organisms living in one environment.
efficiently: The ratio of useful work done by a machine or device to the total energy supplied.
energy: The capacity to do work.
entangle: Stopped or hampered movement forward.
environment: All the conditions, circumstances, and influences surrounding and affecting the development or
existence of people or other living things.
Environmental Protection Agency (EPA): The United States agency responsible for efforts to control air and
water pollution, radiation and pesticide hazards, ecological research, and solid waste disposal. It is the agency
of the U.S. government that sets environmental protection and enforcement standards.
estuary: An arm of the sea at the mouth of a river where fresh fish and salt water mix.
eutrophication: A naturally occurring change that takes place after a water body receives inputs of nutrients,
mostly nitrates and phosphates, from erosion and runoff of surrounding lands.
fecal coliform: See E. coli.
fishery biologist: One who studies the life of fishes.
flotation deinking: The process of deinking paper in which the ink is removed from the paper by submerging
it in water and mixing air bubbles into the pulp slurry. The ink rises to the top and is skimmed off the top.
food chain: A predator-prey relationship in which a single species feeds upon another single species, which in
turn feeds upon another single species. As a result, energy in the chain flows in one direction, generally from
primary producers to herbivores to carnivores.
food web:
game fish: Any fish regularly caught for sport.
garbage: Another word for solid waste, particularly household waste.
garbologist: One who studies waste, particularly household waste.
generic: Characteristic of a genus, kind, or class.
207
groundwater: Water that infiltrates into the Earth and is stored in usable amounts in the soil and rock below
the Earth’s surface. Water within the zone of saturation supplies wells and springs.
habitat: Native environment of an animal or plant; part of an ecosystem.
habitat destruction: A situation in which a species loses its normal habitat due to environmental or human
changes.
harmful: Causing or able to cause harm.
hazardous substance: Risky or dangerous substance that can cause organisms to become sick or die.
hazardous waste: Waste or a combination of wastes that, because of its quantity, concentration, or physical,
chemical, or infectious characteristics, may cause, or may significantly contribute to an increase in mortality
or an increase in serious, irreversible, or incapacitating illness.
HDPE (high density polyethylene): A plastic resin commonly used to make milk jugs, detergent containers,
and base cups for plastic soda bottles. The standard plastic code of HDPE is 2.
heat: A form of kinetic energy resulting from the random motions of molecules.
heavy metals: Metallic elements (for example, cadmium, chromium, copper, lead, mercury, nickel, and zinc)
that are often used to manufacture products.
hydroelectric: The generation of electricity that conveys the energy of running water into electric power.
identify: To establish the identity of.
ignitable: Products that may catch fire easily.
incinerate: To burn waste.
inshore waters: Water located near the shore.
insulated: The prevention of the transfer of electricity, heat, or sound.
intermittent: Occurring at intervals.
invertebrates: Animals without a backbone.
issue: A matter that is in dispute between two or more parties; apoint of debate or controversy.
kilowatt hour (kwh): A quantity of electric power equivalent to using one kilowatt for one hour.
landfill: A large outdoor area for waste disposal.
leachate: Rain water or other liquid that has percolated through solid waste and has extracted possibly
hazardous dissolved or suspended materials from it.
life cycle analysis/assessment: A holistic evaluation of all direct and indirect, pre-market and post-market,
208
and recycle/disposal aspects of a product.
limit: Restrict.
litter: Highly visible solid wastes that are generated by the consumer and carelessly discarded outside the
regular disposal system.
malnutrition: Less than the minimum amount of the foods essential for sound growth and health.
manatee: Any of a family of sirenians living in shallow tropical waters near the coasts of South and North
America and West Africa.
manure: Material that fertilizes land, especially refuse of stables and barnyards consisting of livestock
excretion with or without litter.
marine sanitation device: (MSD) Any device installed on-board a vessel that is designed to receive, retain,
treat, or discharge sewage.
marketing: An aggregate of functions involved in moving goods from producer to consumer.
methane gas: A highly combustible gas with no smell or color. Methane is produced by solid waste as it
decomposes.
microorganisms: Organisms too small to be seen with the unaided eye, including bacteria, protozoan, yeast,
viruses, and algae.
migrate: To move from one habitat to another.
minerals: Inorganic substances found in nature; gold, silver, and iron ore are examples of minerals.
monofilament line: A plastic line used in fishing and in numerous fishing nets.
municipal solid wastes: The combined residential and commercial solid waste generated in an area. It
includes paper, cans, bottles, food scraps, and other yard waste items.
natural resources: Valuable, naturally occurring items, such as plants, animals, minerals, water, and air,
which are used by people to help make things such as energy, food, clothes, and buildings.
navigable: Deep enough and wide enough to afford passage to ships.
nitrogen: Chemical element symbol N, atomic number 7, atomic weight 14.0067; the largest single
component of the atmosphere.
noise pollution: Excessive noise in the human environment.
nonrenewable resources: Resources that, in terms of human time scales, are contained within the Earth in
fixed quantity and, therefore, can only be used once in the foreseeable future.
offshore waters: Water not adjacent to land in which the physical properties are slightly influenced by
continental conditions.
209
organic fertilizers: Fertilizers that are made from natural ingredients.
perennial: Present at all seasons of the year; persisting for several years.
PET (polyethylene terephthalate): A plastic commonly used to make soft drink bottles; the standard code for
PET is 1.
pH: A measure of the concentration of hydrogen ions in a solution; the pH scale ranges from 1 to 14, where 7
is neutral, values less than 7 are acidic, and values greater than 7 are basic or alkaline; pH is an inverted
logarithmic scale so that every unit decrease in pH means a 10-fold increase in hydrogen ion concentration.
Thus, a pH of 3 is 10 times as acidic as a pH of 4 and 100 times as acidic as a pH of 5.
pH meter: An instrument used to test the pH of a particular substance.
plastic: Material made from hydrocarbons known for its light weight and durability.
pollute: To cause harm to human health or the environment by contaminating the air, water, or soil.
population: Any group of organisms of the same species that occupies a given space at a given time.
predation: The act of preying on another animal or animals.
pulp: A soft, moist, sticky mass of fibers made up of wood or straw used to make paper and paperboard.
pumpout station: A station located on or near the water used by boats to unload their raw sewage.
raw material: Unprocessed material used in manufacturing.
raw sewage: Untreated sewage.
reactive: A product that may explode.
receptacle facilities: Facilities capable of storing materials.
recreational: Term used to describe something pleasurable.
recreational boating: Boating for pleasure.
recreational fishing: Fishing done for pleasure.
recyclable: Products or materials that can be collected, separated, and processed to be used as raw materials
in the manufacture of new products.
recycling: Any process by which materials that would otherwise become solid waste are collected, separated,
and processed and are then reused or returned to use in the form of raw material or products.
reduce: To cut down on the amount of something produced such as trash.
refuse: A general term for solid waste materials, also called garbage or trash.
remnant: Something left over.
210
reservoir: A body of water collected and stored in an artificial lake.
reuse: To use a product again, either for what it was originally made or for something else.
sanitary landfill: A large outdoor area for waste disposal.
scum: Impure or extraneous matter that rises to the surface of boiling or fermenting liquids.
season: Time or period of time characterized by the Earth’s orbiting around the sun.
sewage: Mostly liquid waste, including human waste, which is transported away by sewers and is purified in
a sewage treatment plant.
size limits: The largest size of a fish that can be legally caught and kept.
sludge: Solid matter that settles to the bottom of septic tanks, or wastewater treatment plant sedimentation. It
must be disposed of by bacterial digestion or other methods or must be pumped out for land disposal or
incineration.
slurry: A thin mixture of water and fine substances such as clay.
society: A community.
soil erosion: The wearing away of soil due to wind or rain.
solid waste: Garbage, refuse, or sludge from a waste treatment facility, water purification plant, or air
pollution control facility. It also includes solid, liquid, semi-solid, or contained gaseous material resulting
from industrial, commercial, mining, and agricultural operations and community activities.
solid waste facility: An operation or plant that handles solid waste.
stability: Ability to maintain original state while external forces are applied.
stewardship: Idea that people have the responsibility to maintain the environment and take care of it.
stream: A flow of water in a channel or bed. A body of running water smaller than a river flowing on the
Earth.
streamflow: The amount of water flowing in a stream.
substrate: A layer beneath the surface soil.
temperate: Having a moderate climate.
tipping fee: The price individuals, communities, and trash haulers pay to dispose of their waste at a landfill.
toxic: Having the characteristic of causing death or damage to humans, animals, or plants.
toxic waste: Waste that can cause death or damage to humans, animals, or plants.
211
treated: The process of adding chemicals to a toxic substance to make it less toxic for the environment.
tropical: Of, or related to, the tropics.
volume: The amount of space an object can occupy.
waste: Any substance, solid, liquid, or gaseous, for which no use can be found by the organism or system that
produces it.
waste disposal: The disposal of waste.
waste management: The proper handling and disposal of waste.
waste material: Material that no longer has any use.
wastewater: Water that has been used, either to manufacture a product or in the home, and that requires
treatment and purification before it can be reused.
wastewater treatment: Physical, chemical, and biological processes used to remove pollutants from
wastewater before discharging it into a water body.
water pollution: Water that has harmful or objectionable material in it.
waterways: Bay or channel through which water may flow.
wetlands: Areas that are inundated or saturated by surface or ground water at a frequency and duration
sufficient to support, and that under normal circumstances do support, a prevalence of vegetation typically
adapted for life in saturated soil conditions.
worm castings: Excretions from a worm.
212
Internet Resources
What is the Internet?
The Internet is a network of networks. In many ways, it is no one thing and resides in no one place. Teachers
can use the Internet to communicate and share information. Research suggests that use of electronic
networking can help teachers (especially new teachers) reduce their sense of isolation, connect with peers, and
increase their sense of professionalism and autonomy. This section explores the uses of the Internet for the
purposes of Environmental Education.
Electronic mail (E-mail) is the most frequently used of the Internet networks. Users are able to participate in
discussion groups, contact particular people, and access information. The most helpful of sources of
information are usually your own colleagues. E-mail provides another way to keep in touch with them within
your school or around the world.
Internet discussion groups are an extension of electronic mail and provide an opportunity to be part of an
electronic community made up of individuals with common interests. Mailing list capability may also provide
online courses, which are often advertised on discussion lists.
General discussion groups for the grade level that you teach are very useful for a wide range of information.
During some times of the year, such as the period near Earth Day, there will be some discussion on
environmental topics and curriculum that you may find useful. You can also pose questions to these discussion
groups; and your colleagues will answer, providing information about where to find resources and how other
teachers at your level handle particular issues and opportunities. These general discussion groups are called
‘listservs”.
Listservs can be found on the world wide web at:
http://www.list.com
This list may provide you with a forum that most nearly meets your specific interests. You can enter keyword
terms and get information about any list that would meet that interest. Information is provided on how to
subscribe to the many diverse listservs that are available,
Once you have found am interesting listserv, send an E-mail message to subscribe. On the address line, type
On the message line, type in Subscribe, the name of the list, and your name. A sample message would read:
Subscribe ECEOL-L Jane Doe
(ECEOL-L is a listserv that serves members of the early childhood profession)
Once you have subscribed, it is appropriate to send a message to the list identifying yourself and your major
interest.
EENETS is a moderated forum for people interested in the development and operation of electronic networks
for environmental education. It does not post all messages sent to the group but only selected messages that
will be of interest to all subscribers. The volume of mail you receive is, therefore, much lower and much more
focused than on a general discussion group. The creation of this list was suggested at the Eco-Ed conference
in Toronto in 1992. This list is an attempt to help coordinate information about projects and networks that are
213
of interest to educators. It is useful to subscribe to EENETS in order to obtain information about other
discussion groups, on-line journals, and environmental meetings.
AskERIC is an internet answering service sponsored by ERIC (the database of the Educational Resources
Information Center). AskERIC can provide information about specific resources for parents, teachers, and
children. Requests for information should be sent by E-mail to:
The GreenDisk Paperless Environmental Journal is a comprehensive guide to the use of computers for
environmental research. It contains over 1,000 listings of World Wide Web sites, listservs, on-line databases,
bulletin board services, software, and educational programs. It is available on disk for IBM or Macintosh
format and includes keyword searching as well as a six-month on-line subscription to updates for the guide. It
can be ordered for $25.00 from :
The GreenDisk Paperless Environmental Journal
P.O. Box 32224
Washington, D.C. 20007
or by internet from [email protected]
World Wide Web
There are many information collections on the World Wide Web (WWW) that contain full text of articles,
lesson plans, and documents. There is often information on projects for children to participate in with their
peers in other parts of the world, information from many government documents, and information from many
cultures. Many sites have interesting graphics and interactive activities.
The following sites have specific information that is of interest to environmental educators. In each case,
teachers should check out the site beforehand to decide which of the many resources available might fit into a
lesson and ways to use them. Since the WWW is developing rapidly, these resources are only a suggested
starting point and will contain links to many other interesting sites.
ALABAMA RESOURCES
AlaWeb - AlaWeb, the official state home page, has information on campgrounds, golf courses, tours, and
other helpful information about the state. Available at:
http://alaweb.asc.edu/ or www.state.al.us
Alabama Information Resources - This is an electronic information guide to “The Heart of Dixie, Alabama.”
Allows users from anywhere in the world to access information about the history, sites, and culture of
Alabama. Available at:
http://www.secis.com/home/ala.html
Official Alabama Pages - These include pages for individual cities, Alabama conventions, visitor bureaus,
travel and tourism offices. Available at:
http://www.scescape.com/cityweb/Alabama.html
Alabama Game and Fish Homepage - Conservation Education Programs; clickable map of public hunting
areas; hunter education program. Available at:
http://www.mindspring.com/~spinson/ag&f.html
214
OTHER RESOURCES
Explorer, a searchable catalog of curricular resources for math and science education; TEXT files on energy,
water, and waste management; Energy Education Resource Guide, School Nature Area Project Bibliographies
with separate lists for primary and secondary school resources for investigating schoolyard ecology; Water
Quality Curricula. Available at:
http://www.nceet.sure.umich.edu/classes.html
Many environmental resources can be found at:
http://www.webdirectory.com/Education/
EE-Link - Provides a keyword search, classroom resources, and regional information. Provides table of
contents and monthly updates. Also the EnviroLink Education Network and the Environmental Education
Network
Commonwealth of Learning - Includes Teacher In-service on Environmental Education; Video on sustainable
development; Professional Development. Available at:
http://www.col.org/envir.html
Econet Environmental Education Directory - Provides a Global Action and Information (GAIN), which
supports and encourages actions for a sustainable society. Available at:
http://www.igc.apc.org/igc/www/enved.html
Scroll down to find these sites:
Dodo Land in Cyberspace: an interactive, educational centre for kids: “Protect the Environment and
Expand Your Imagination.” There are lots of images here, soyou may want to use it with a fast
connection.
The Environment and Natural Resources Policy and Training Project Resources for teachers. You can
find the latest information about energy, industry, forestry, and watershed management.
Two interesting project sites for children at this address are :
The Global Thinking Project, which is a world-wide E-mail project for students and teachers to work
with scientists to understand the global environment.
The International Education and Resource Network (I*EARN) is a site for teachers and youth (ages 6
to 19) to undertake projects via E-mail.
Ranger Rick of the National Wildlife Federation is also available from this site, or www.nwf.org
Environmental Organizations and Projects - There is a listing at http://www.ncet.snre.umich.edu/ that has
electronic brochures for many organizations related to environmental education.
Institute for Global Environmental Strategies - EarthRISE is under development at this site:
http://www.strategies.org/
Internet Resources for Outdoor Recreation Research - This has many on-line resources and many links to
others. It includes Tourism, Ecological Aspects of Outdoor Recreation, Recreational Issues on Public Lands.
215
Available at:
http://www.vt.edu:10021/Y/yfleung/recres.html
Learning Webs - This is a consulting service in the field of environmental education specializing in Arizona.
Services available are fund raising (t-shirts, note cards, pens with environmental themes) educational
resources, and an AzEENet Magazine, a look at environmental publishing on the web. Available at:
http://www.nwf.org/nwf/prog/things.html
Nationwide School Weather Network - Your children can keep track of the weather across the nation at this
site. Available at:
or go to http://www.webdirectory.com/Education/and choose the Automated Weather Source
The Plastic Bag Information Clearinghouse - This has much information about recycling, teaching aids, an
essay contest. Available at:
http://www.plasticbag.com/
or by email at [email protected]
Regional Environmental Education Resources - This site has information about environmental programs and
curricula listed by state. It includes a wealth of valuable information for teachers. Available at:
http://www.nceet.snre.umich.edu/regionalEE.html
State Education and Environment Roundtable - This is working to improve learning by incorporating
environmental curricula into K-12 education. “A major part of our work relates to gathering and disseminating
research about systemic approaches to incorporating environmental education into education reform.”
Available at:
http://millennianet.com/round
Stay up-to-date with what’s new in environmental education on the World Wide Web at EE-Link. Available at:
http://www.nceet.snre.umich.edu/new.html
The Wild Ones Home Page - This will post your children’s art work, writings and experiments related to the
environment on the Internet web pages. Send work by fax to (212) 222-2191 or regular mail to:
The Wild Ones
c/o Wildlife Preservation Trust International
3400 West Girard Ave
Philadelphia, PA 19104
Windows on the Wild - or WOW, is an environmental education program of the World Wildlife Fund (WWF).
The program educates the public about biodiversity issues and helps to stimulate critical thinking on behalf of
the environment. It includes many activities for teachers to use in the classroom.
www.worldlife.org
216
Directories
ECOLOGY
217
Federal Government Organizations
Advisory Committee on Atmospheric Carbon
Dioxide
U.S. Dept. of Energy
Washington, D.C. 20585
Bureau of Reclamation (U.S.)
Main Interior Building
18th and C St., NW
Washington, D.C. 20240
202-343-4662
Environmental Protection Agency (U.S.)
401 Mst., SW
Washington, D.C. 20460
202-382-2080
Environmental Protection Agency (U.S.)
Public Information Center, PM-211 B
401 Mst., SW
Washington, D.C. 20460
Federal Energy Regulatory Commission
Department of Energy
815 N Capitol Street
Washington, D.C. 20426
202-357-8118
Fish and Wildlife Service (U.S.)
Department of the Interior
Main Interior Building
Washington, D.C. 20240
202-343-5634
House Energy and Commerce Committee
U.S. House of Representatives
Washington, D.C. 20515
202-255-2927
House Agricultural Committee
U.S. House of Representatives
Washington, D.C. 20515
202-255-2171
National Marine Fisheries Service
Department of Commerce (U.S.)
1335 East-West Highway
Silver Springs, MD 20910
301-427-2370
National Park Service
Main Interior Building
Washington, D.C. 20240
202-343-4747
Office of Conservation and Renewable Energy
1000 Independence Ave., SW
Washington, D.C. 20585
202-586-9220
Save Our Streams Program
Izaak Walton League of America
707 Conservation Lane
Gaithersburg, MD 20878
Senate Environment and Public Works Committee
U.S. Senate
Washington, D.C. 20515
202-224-6176
Topographic Maps
U.S. Geological Survey
Box 25286
Denver Federal Center
Denver, CO 80225
Topographic Map Symbols
U.S. Geological Survey
National Center
Reston, VA 22202
EPA Regional Offices
U.S. EPA - Region 1
JFK Federal Building
Boston, MA 02203
617-565-3715
218
U.S. EPA - Region II
26 Federal Plaza
New York, NY 10278
212-264-2525
U.S. EPA - Region III
841 Chestnut St.
Philadelphia, PA 19107
215-597-9800
U.S. EPA - Region IV
345 Courtland St., NE
Atlanta, GA 30365
404-347-4727
U.S. EPA - Region V
230 South Dearborn St.
Chicago, IL 60604
312-353-2000
U.S. EPA - Region VI
First Interstate Bank Tower
1445 Ross Ave.
Dallas, TX 75270-2733
214-655-6444
U.S. EPA - Region VII
726 Minnesota Ave.
Kansas City, KS 66101
913-551-7050
U.S. EPA - Region VIII
One Denver Place
999 18th St.
Denver, CO 80202-2405
303-293-1603
U.S. EPA - Region IX
1235 Mission St.
San Francisco, CA 94103
415-744-1468
U.S. EPA - Region X
1200 Sixth Ave.
Seattle, WA 98101
206-442-5810
U.S. Fish and Wildlife Service
SE Regional Office
Richard B. Russell Fed. Building.
75 Spring St., SW, Room. 1200
Atlanta, GA 30303
Alabama State Agencies/Organizations
Alabama Audubon Council
2616 Mountain Brook Parkway
Birmingham, AL 35223
205-879-1935
Alabama Department. of Education
50 N. Ripley
Gordon Persons Building.
Montgomery, AL 36130
334-242-9700 or 334-242-8154
Alabama Energy Extension Service
Box 6282
University, AL 35486
1-800-452-5901
Alabama Power Company
Educational services
P.O. Box 2641
Birmingham, AL 35282-9984
Alabama Waterfowl Association
P.O. Box 67
Guntersville, AL 35768
205-259-2509
Alabama Wilderness Alliance
P.O. Box 223
Moulton, AL 35650
205-974-7678
Alabama Wildlife Federation
P.O. Box 2102
46 Commerce St.
Montgomery, AL 36102
334-832-9453 fax: 334-532-9454
Alabama Wildlife Society
118 Extension Hall
Auburn, AL 36849
205-844-5670
219
Alabama Zoological Society
2630 Cahaba Rd.
Birmingham, AL 35223
Audubon Society
749 Eastern Manor Lane
Birmingham, AL 35215
205-849-9202
Bankhead Watershed Project
P.O. Box 117
Moulton, AL 35650
205-974-7678
Center for Environmental Research and Service
Troy State University
Troy, AL 36081
334-566-4424 or 1-800 642-2377
Environmental Education Association of Alabama
Troy State University
Box 596
Troy, AL 36082
Department. of Conservation and Natural Resources
64 N Union St.
Montgomery, AL 36130
334-261-3486
Department. of Environmental Management.
1751 W.L. Dickinson Dr.
Montgomery, AL 36130
334-271-7700 fax: 334-271-7950
Geological Survey of Alabama
Sate Oil and Gas Board
420 N. Hackberry Lane
Tuscaloosa, AL 35486-9780
205-349-2852
Johnson Research Center - AL Solar Energy Center
University of Alabama in Huntsville
Research Institute/Annex D
Huntsville, AL 35899
1-800-228-5897
Marine Environmental Sciences Consortium
Dauphin Island Sea Lab
Attention: Dr. George Crozier, Director.
P.O. Box 369-370
Dauphin Island, AL 36528
334-861-2141
Perdido Bay Environmental Association
P.O. Box 573
Lillian, AL 36549
334-962-2879
Science, Tech. and Energy Division.
Dept. of Eco. and Community Affairs
P.O. Box 205347
Montgomery, AL 36125-0347
334-284-8952 or 1-800-392-8098
Shoals Audubon Society
1612 Sheffield Dr.
Sheffield, AL 35660
205-383-6338
U.S. Fish and Wildlife Service
P.O. Drawer 1197
Daphne, AL 36526
334-690-2181
Water Resource Res. Institute
Hargis Hall, Room 202
Auburn University, AL 36849
205-826-5075
Other Environmental Agencies/Organizations
Abundant Life Seed Foundation
P.O. Box 772
Port Townsend, WA 98368
206-385-5660
Acid Rain Foundation
1410 Varsity Dr.
Raleigh, NC 27606
919-828-9443 fax: 919-515-3593
220
Alliance for Environmental Education
P.O. Box 368
The Plains, VA 22171
703-253-5812 fax: 703-253-5811
Alliance to Save Energy
1725 K St. NW, Suite 509
Washington, D.C. 20006
202-857-0666 fax: 202-331-9588
American Fisheries Society
5410 Grosvenor Lane, Suite 110
Bethesda, MD 20814-2199
301-897-8616 fax: 301-897-8096
American Forests - Global Releaf Program
P.O. Box 2000
Washington, D.C. 20013
202-667-3300 fax: 202-667-7751
American Forests - Global Releaf
Coordinator
1516 P St., NW
Washington, D.C. 20005
American Forest Foundation
1250 Connecticut Ave., NW
Suite 320
Washington, D.C. 20036
202-463-2462 fax: 202-463-2461
American Geographical Society
156 Fifth Ave., Suite 600
New York, NY 10010-7002
212-242-0214 fax: 212-989-1583
American Meteorological Society
45 Beason Street
Boston, MA 02108
617-227-2425 fax: 617-742-8718
American Nuclear Society
555 N. Kensington Ave.
LaGrange Park, IL 60525
708-579-8265 fax: 708-352-0499
American Society for Environmental Education
P.O. Box 800
Hanover, NH 03755
Americans for Energy Independence
1629 K St., NW, Suite 602
Washington, D.C. 20006
202-466-2105 fax: 202-466-2108
Americans for the Environment
1400 16th St., NW, Box 24
Washington, D.C. 20036
202-797-6665 fax: 202-797-6646
American Nuclear Energy Council
410 First St., NE
Washington, D.C. 20003
202-484-2670
American Rivers
801 Pennsylvania Ave., SE, Suite 400
Washington, D.C. 20003
202-547-6900 fax: 202-543-6142
American Society for Environmental History
Center for Tech. Studies
New Jersey Institute of Technology
Newark, NJ 07012
201-596-3334
Americans for Nuclear Energy
2525 Wilson Blvd.
Arlington, VA 22201
703-528-4430
Animal Protection Institute of America
2831 Fruitridge Rd.
Sacramento, CA 95822
916-731-5521 fax: 916-731-4467
Animal Welfare Institute
P.O. Box 3650
Washington, D.C. 20007
202-337-2332 fax: 202-338-9478
Association for Environmental and Outdoor
Education
Attention: Roger D. Morrow
9616 Verhudson
Gig Harbor, WA 98335
221
Biomass Energy Res. Association
1825 K St., NW, Suite 503
Washington, D.C. 20006
1-800-247-1755
Center for Environmental Education, Inc.
1725 Desales St., SW, Suite 500
Washington, D.C. 20036
Environmental Action, Inc.
1525 New Hampshire Ave. NW
Washington, D.C. 20036
Environmental Education Coalition
R.D.2 Box 1010
Dingsman Ferry, PA 18328
Global Tomorrow Coalition
1325 G St., NW, Suite 915
Washington, D.C. 20005
Greenpeace USA, Inc.
1436 U St., NW
Washington, D.C. 20009
Institute for Earth Education, The
Box 288
Warrenville, IL 6055
International Ecology Society
1471 Barclay St.
St. Paul MN 55106-1405
Keep America Beautiful
9 West Broad St.
Stamford, VCT 06902
Living Lightly
Schilitz Audubon Center
1111 East Brown Deer Rd.
Milwaukee, WI 53217-1999
414-352-2880
National Association for Environmental Education
P.O. Box 569031
Miami, FL 33156
National Clearinghouse on Dev. and Envir. Edu.
American Forum on Global Education
45 John St., Suite 908
New York, NY 10038
National Consortium for Envir. Edu. and Training
School of Natural Resources and Environment
University of Michigan
430 East University Ave.
Ann Arbor, MI 48109
National Wildlife Federation
1400 16th St., NW
Washington, D.C. 20036-2266
National Geographic Society
17th and M St., NW
Washington, D.C. 20036
Nature Conservancy, The
1815 North Lynn St.
Arlington, VA 22209
North American Assoc. for Environmental Education
Box 400
Troy, OH 45373
(NAAEE Membership and Publications Office)
Oceanic Society, The
Executive Offices
1536 16th St., NW
Washington, D.C. 20036
Office of Environmental Education
U.S. EPA
401 M St., SW (A-107)
Washington, D.C. 20460
Population Institute, The
110 Maryland Ave., NE
Washington, D.C. 20002
Project WILD
Attention: Project WILD Director
Western Region. Environmental Education Council
4014 Chatham Lane
Houston, TX 77027
Public Citizen
2000 P St., NW
Washington, D.C. 20036
202-833-3000
222
Science, Mathematics, and Environmental Education
Analysis Center
Information Resource Center
1200 Chambers Rd., Room. 310
Columbus., OH 43212-1792
Wilderness Society, The
1400 I St., NW 10th Floor
Washington, D.C. 20005
Wildlife Conservation International
New York Zoological society
Bronx, NY 10460
Wildlife Society, The
5410 Grosvenor Lane
Bethesca, MD 20814
World Resources Institute
1709 New York Ave., NW
Washington, D.C. 20006
World-Wide Fund - Conservation Foundation
1250 24th St., NW
Washington, D.C. 20037
Worldwatch Institute
1776 Massachusetts Ave., NW
Washington, D.C. 20036
Zero Population Growth, Inc.
1601 Connecticut Ave., NW
Washington, D.C. 20009
Directory
POLLUTION PREVENTION
223
Federal Government Organizations
Environmental Protection Agency
401 M St., SW
Washington, D.C. 20460
202-260-2090
House Agriculture Committee
U.S. House of Representatives
Washington, D.C. 20515
202-255-2171
House Energy and Commerce Committee
U.S. House of Representatives
Washington, D.C. 20515
202-255-2927
Nuclear Regulatory Commission
Washington, D.C. 20555
301-415-7000
Senate Environment and Public Works Committee
U.S. Senate
Washington, D.C. 20515
202-224-6176
Tennessee Valley authority
400 W. Summit Hill Dr.
Knoxville, TN 37902
615-632-2101
United Coast Guard
Department of Transportation
2100 2nd St., SW
Washington, D.C. 20593
202-267-2229
United States Department of Energy
Office of Civilian Radioactive Waste Management
P.O. Box 44375
Washington, D.C. 20026
1-800-225-NWPA
United States Department of the Interior
Interior Building, 1849 C St., NW
Washington, D.C. 20240
202-208-1100
United States Geological Survey
12201 Sunrise Valley Dr
Reston, VA 22092 7
03-648-4000
EPA Regional Offices
See Ecology Directory
Alabama State Agencies/Organizations
Alabama Bottle and Can Coalition
307 Shooting Star Trail
Gurley, AL 35748
205-776-4015
Alabama Department of Education
50 N. Ripley
Gordon Persons Building
Montgomery, AL 36130
334-242-9700 or 334-242-8154
Alabama Lung Association
900 18th St., South
Birmingham, AL 35020
205-933-8821
Alabama PALS: People Against a Littered State
46 Commerce St.
Montgomery, AL 36104
334-263-7737
Alabamians for a Clean Environment
P.O. Box 1526
Livingston, AL 35470
205-652-9854
Center for Environmental Research and Service
Attention: Information and Public Relations
Coordinator
Troy State University
Troy, AL 36082
334-566-4424 or 1-800-642-2377
224
Other Environmental Agencies/Organizations
Acid Rain Foundation, Inc.
1630 Blackhawk Hills
St. Paul, MN 55122
Air and Waste Management Association
P.O. Box 2861
Pittsburgh, PA 15230
412-232-3444 fax: 412-232-3450
Air Pollution Control Association
P.O. Box 2861
Pittsburgh, PA 15230
American Nuclear Energy Council
410 First St., SE
Washington, D.C. 20003
202-484-2670
American Petroleum Institute
1220 L St., NW
Washington, D.C. 20005
202-682-8000
American Rivers
801 Pennsylvania Ave., SE, Suite 400
Washington, D.C. 20003
202-547-6900 fax: 202-543-6142
Amoco Teaching Aids
P.O. Box 1400K
Dayton, OH 45414
Asbestos Information Association of North America
1745 Jefferson Davis Hwy., Suite 406
Arlington, VA 22202
703-412-1150 fax: 703-412-1152
Center for Environmental Information
46 Prince st.
Rochester, NY 14607-1016
716-271-3550 fax: 716-271-0606
Center for Marine Conservation
1725 DeSales St., NW, Suite 500
Washington, D.C. 20036
202-429-5609 fax: 202-872-0619
Chevron Chemical Company
Educational Materials
Public Affairs Department
P.O. Box 3744
San Francisco, CA 94119
Ciba-Geigy Corporation
Attention: Corporation Relations Department
Ardsley, NY 10502
Clean Air Working Group
818 Connecticut Ave., NW
Washington, D.C. 20006
Clean Water Action
1320 18th St., NW, Suite 300
Washington, D.C. 20036
202-457-1286 fax: 202-457-0287
Clean Sites
1199 N. Fairfax St.
Alexandria, VA 22314
703-683-8522
Dow Chemical U.S.A.
Ag Products
P.O. Box 1706
Midland, MI 48640
Environmental Action
6930 Carroll Ave., Suite 600
Takoma Park, MD 20912
301-891-1100 fax: 301-891-2218
Friends of the Sea Otter
140 Franklin St., Suite 309
Monterey, CA 93940
408-373-2747
Georgia-Pacific Corporation
Educational Services
133 Peachtree St., NW
Atlanta, GA 30303
Greenpeace, U.S.A.
1436 U St., NW
Washington, D.C. 20009
202-462-1177 fax: 202-462-4507
225
Hazardous Materials Control Research Institute
7237 Hanover parkway
Greenbelt, MD 20770
301-982-9500 fax: 301-220-3870
Household Hazardous Waste Project
1031 E. Battlefield, Suite 214
Springfield, MO 65807
417-889-5000
Inform
381 Park Ave. South
New York, NY 10016
212-689-4040 fax: 212-447-0689
ICI Americas, Inc.
Ag Chem Division
Attention: Lorraine Smith
Wilmington, Delaware 19897
Institute for Environmental Education
18554 Haskins Rd.
Chagrin Falls, OH 44023-1823
212-543-7303 fax: 216-543-7160
International Bird Rescue Research Center
699 Potter St.
Berkeley, CA 94710
510-841-9086
Keep America Beautiful, Inc.
99 Park Avenue
New York, NY 10016
LaMotte Company
P.O. Box 329
Chestertown, MD 21620
410-778-3100 fax: 410-778-6394
Manufacturers of Emission Controls Association
1707 L St., NW
Washington, D.C. 20036
202-296-4797 fax: 202-331-1388
National Agricultural Chemicals Association
1155 15th St., NW
Madison Building Suite 900
Washington, D.C. 22005
202-296-1585
National Association of Noise Control Officials
53 Cubberly Rd.
Trenton, NJ 08690
609-586-2684
National Coalition Against the Misuse of Pesticides
701 E St., SE, Suite 200
Washington, D.C. 20003
202-543-5450
National Geographic Society
17th and M St., NW
Washington, D.C. 20036
Nuclear Information and Resource Service
1424 16th St., NW, Suite 601
Washington, D.C. 20036
202-328-0002 fax: 202-462-2183
Smithsonian Institution
Office of Environmental Awareness
S. Dillon Ripley Center., Suite 3123
Washington, D.C. 20560
202-357-4797 fax 202-786-2557
Southwest Research and Igrass Roots Information
Center.
P.O. Box 4524
Albuquerque, NM 87106
505-262-1862
Toxicant Program/HHWD Project
METRO M/S 81
821 2nd Ave.
Seattle, WA 98104
Water Environment Federation
601 Wythe St.
Alexandria, VA 22314-1994
1-800-666-0206 fax: 703-684-2492
Directory
WASTE MANAGEMENT
226
Federal Government Organizations
Federal Highway administration
400 7th St., SW
Washington, D.C. 20590
202-366-0600
House Energy and Commerce Committee
U.S. House of Representatives
Washington, D.C. 20515
202-255-2927
United States Department of Energy
Office of Civilian Radioactive Waste Management
P.O. Box 44375
Washington, D.C. 20026
1-800-225-NWPA
EPA Regional Offices
See Ecology Directory
Alabama State Agencies/Organizations
Alabama Bottle and Can Coalition
307 Shooting Star Trail
Gurley, AL 35748
205-776-4015
Alabama Department of Education
50 N. Ripley
Gordon Persons Building
Montgomery, AL 36130
334-242-9700 or 334-242-8154
Alabama PALS: People Against a Littered State
46 Commerce St.
Montgomery, AL 36104
334-263-7737
Environmental Education Association of Alabama
Troy State University
Box 596
Troy, AL 36082
Other Environmental Agencies/Organizations
Aluminum Association, Inc., The
Attention: Manager of Educational Services
818 Connecticut Ave., NW
Washington, D.C. 20006
American Nuclear Energy Council
410 First St., NE
Washington, D.C. 20003
202-484-2670
American Nuclear Society
555 N. Kensington Ave.
LaGrange Park, IL 60525
708-579-8265 fax: 708-352-0499
American Plastics Council
1730 D St., NW
Washington, D.C. 20006
202-737-8300
Americans for Nuclear Energy
2525 Wilson Blvd.
Arlington, VA 22201
703-528-4430
Association of Foam Packaging Recyclers
1025 Connecticut Ave., NW, Suite 515
Washington, D.C. 20036
202-822-6424 fax: 202-331-0538
A-Way With Waste
Washington State Department of Ecology
4350 150th Ave., NE
Redmond, WA 98052
Center for Environmental Information
46 Prince St.
Rochester, NY 14607-1016
716-271-3550 fax: 716-271-0606
Center for Renewable Resources
Publications Department
641 S. Pickett St.
Alexandria, VA 22304
227
Department of Environmental Management
Hazardous Waste Branch, Land Division
1751 Cong. W.L. Dickinson Dr.
Montgomery, Alabama 36130
334-271-7700
Dow Chemical U.S.A.
Ag Products
P.O. Box 1706
Midland, MI 48640
Hazardous Materials Control Research Institute
7237 Hanover parkway
Greenbelt, MD 20770
301-982-9500 fax: 301-220-3870
Hazardous Waste Management and Resource
Recovery Program
University of Alabama
HAMMARR
P.O. Box 1968
University, AL 35486
Household Hazardous Waste Project
1031 E. Battlefield, Suite 214
Springfield, MO 65807
417-889-5000
Inform
381 Park Ave. South
New York, NY 10016
212-689-4040 fax: 212-447-0689
National Clearinghouse on Dev. and Envir. Edu.
American Forum on Global Education
45 John St., Suite 908
New York, NY 10038
National Geographic Society
17th and M St., NW
Washington, D.C. 20036
National Solid Wastes Management Association
1730 Rhode Island Ave., NW, Suite 1000
Washington, D.C. 20036
202-659-0708 fax: 202-775-5917
Nuclear Information and Resource Service
1424 16th St., NW, Suite 601
Washington, D.C. 20036
202-328-0002 fax: 202-462-2183
Polystyrene Packaging Council, Inc.
1025 Connecticut Ave., NW, Suite 515
Washington, D.C. 20036
202-822-6424 fax: 202-331-0538
Reynolds Aluminum Recycling Company
Attention: Public Relations Manager
P.O. Box 27003
Richmond, VA 23261
Smithsonian Institution
Office of Environmental Awareness
S. Dillon Ripley Center., Suite 3123
Washington, D.C. 20560
202-357-4797 fax 202-786-2557
Southwest Research and Igrass Roots Information
Center.
P.O. Box 4524
Albuquerque, NM 87106
505-262-1862
Steel Recycling Institute
680 Andersen Dr.
Pittsburgh, PA 15220
1-800-876-SCRI or 412-922-2772 fax: 412-922-3213
Toxicants in Consumer Products
METRO Exchange Building
821 2nd Ave.
Seattle, WA 98104
206-447-5875
Washington Citizens for Recycling
157 Yesler Way
Seattle, WA 98104
206-343-5171 fax: 206-624-2110
Directory
NATURAL RESOURCES
228
Federal Government Organizations
Army Corps of Engineers
Department of Defense
20 Massachusetts Ave., NW
Washington, D.C.
202-272-0010
Bureau of Land Management (U.S.)
Main Interior Building
18th and C St., NW
Washington, D.C. 20240
202-343-5717
Bureau of Land Management
Department of the Interior (U.S.)
Anasazi Heritage Center
27501 Hwy. 184, P.O. Box 758
Dolores, CO 81323
303-882-4811 fax: 303-882-7595
Bureau of Mines (U.S.)
Motion Pictures
Cockrans Mill Road
P.O. Box 18070
Pittsburgh, PA 15236
412-675-4338
Bureau of Reclamation (U.S.)
Main Interior Building
18th and C St., NW
Washington, D.C. 20240
202-343-4662
Coast Guard (U.S.)
Department of Transport
2100 2nd St., SW
Washington, D.C. 20593
202-267-2229
Department of Agriculture
12th and 14th St., NW
Washington, D.C. 20250
202-477-8732
Department of Defense
The Pentagon
Office of the Secretary
Washington, D.C. 20301-8000
Department of Justice
Environment and Natural Resources Division
10th St. and Constitution Ave., Room 2143
Washington, D.C. 20530
202-514-2701
Department of the Air Force
Washington, D.C. 20330
Department of the Interior
Interior Building
1849 C St., NW
Washington, D.C. 20240
202-208-1100
EPA Regional Offices
See Ecology Directory
Federal Hwy. Administration
400 7th St., NW
Washington, D.C. 20590
202-366-0600
Fish and Wildlife Service (U.S.)
Department of the Interior
Main Interior Building
Washington, D.C. 20240
202-343-5634
Forest Service (U.S.)
P.O. Box 96090
Washington, D.C. 20090
202-447-3957
Geological Survey (U.S.)
12201 Sunrise Valley Dr.
Reston, VA 22092
703-648-4000
229
House Committee on Interior and Insular Affairs
U.S. House of Representatives
Washington, D.C. 20515
202-255-2761
House Energy and Commerce Committee
U.S. House of Representatives
Washington, D.C. 20515
202-255-2927
House Merchant Marine and Fisheries Committee
U.S. House of Representatives
Washington, D.C. 20515
202-255-4047
Minerals Information Office Bureau of Mines (U.S.)
Department of Interior Building
19th and C St., NW MS 2647-MIB
Washington, D.C. 20240
National Marine Fisheries Service
Department of Commerce (U.S.)
1335 East-West Hwy.
Silver Springs, MD 20910
301-427-2370
National Oceanic and Atmospheric Administration
14th St. and Constitution Ave., NW
Washington, D.C. 20230
202-343-4747
National Park Service
Main Interior Building
Washington, D.C. 20240
202-343-4747
Office of Conservation and Renewable Energy
1000 Independence Ave., SW
Washington, D.C. 20585
202-586-9220
Office of Surface Mining
1951 Constitution Ave., NW
Washington, D.C. 20240
202-343-4953
Senate Agriculture, Nutrition and Forestry
Committee
U.S. Senate
Washington, D.C. 20515
202-224-2035
Senate Commerce, Science and Transportation
Committee
U.S. Senate
Washington, D.C. 20515
202-224-5115
Senate Energy and Natural Resources Committee
U.S. Senate
Washington, D.C. 20515
202-224-4917
Soil Conservation Service
Department of Agriculture (U.S.)
14th St. and Independence Ave., SW
P.O. Box 2890
Washington, D.C. 20013
202-447-4543
U.S. Army Construction Engineering Research Lab
P.O. Box 9005
Champaign, IL 61826-9005
217-352-6511
Alabama State Agencies/Organizations
Agriculture and Industries
Attention: Information Director
P.O. Box 3336
Montgomery, AL 36109
334-242-5872
Alabama Audubon Council
2616 Mountain Brook Parkway
Birmingham, AL 35223
205-879-1935
Alabama BASS Chapter Federation
3717 Sola Cr.
Fort Payne, AL 35967
205-845-1441
Alabama Conservancy, The
2717 7th Ave., S. Suite 207
Birmingham, AL 35233
Alabama Cooperative Extension Service
109 Duncan Hall, Auburn Hall
Auburn University, AL 36849-5612
205-844-4444 fax: 205-844-5544
E-mail: [email protected]
Alabama Cooperative Fish and Wildlife Research
230
Unit
331 Funchess Hall,
Auburn University
Auburn, AL 36849
205-844-4796
Alabama Department of Education
50 N. Ripley
Gordon Persons Building
Montgomery, AL 36130
334-242-9700 or 334-242-8154
Alabama Energy Extension Services
Box 6282
University, AL 35486
1-800-452-5901
Alabama Forest Owner’s Association
P.O. Box 104
Helena, AL 35080
205-987-8811
Alabama Forestry Association
555 Alabama St.
Montgomery, AL 36104
334-265-8733
Alabama Forestry Commission
513 Madison Ave.
Montgomery, AL 36130
334-240-9300
Alabama Natural Heritage Section
State Lands Division
Department of Conservation and Natural Resources
64 Union St.
Montgomery, AL 36130
334-242-3484
Alabama Surface Mining Commission
P.O. Box 2390
Jasper, AL 35502
205-221-4130
Alabama Waterfowl Association
Rt. 2, Box 179
Scottsboro, AL 35768
205-259-2509
Alabama Wilderness Alliance
P.O. Box 223
Moulton, AL 35650
205-974-7678
Alabama Wildflower Society
3914 S. River Circle
Birmingham, AL 35243
205-967-0304
Alabama Wildlife Federation
46 Commerce St.
Montgomery, AL 36104
334-832-9453
Alabama Wildlife Society
Auburn University, Department of Zoology
331 Funchess Hall
Auburn, AL 36849-5414
205-844-4850 or 205-844-9247
Alabama Zoological Society
2630 Cahaba Road
Birmingham, AL 35223
Audubon Society
Birmingham Chapter
749 eastern Manor Lane
Birmingham, AL 35215
205-849-9202
Bankhead Watershed Project, The
P.O. Box 117
Moulton, AL 35650
205-974-7678
Bass Anglers Sportsman Society
5845 Carmichael Rd.
Montgomery, AL 36117
334-272-9530
Cahaba River Society
2717 7th Ave., S., Suite 207
Birmingham, AL 35223
Department of Agriculture and Industries
P.O. Box 3336
Montgomery, AL 36193
334-261-2650
231
Department of Conservation and Natural Resources
64 Union St.
Montgomery, AL 36130
334-242-3486
Department of Environmental Management
P.O. Box 301463
Montgomery, AL 36130-1463
Ducks Unlimited
7706 Shadow Bend Dr., SE
Huntsville, AL 35802
205-881-6895
Ducks Unlimited
3413 Old Woods Lane
Birmingham, AL 35243
205-322-8636
Ducks Unlimited
305 4th St., #408
Decatur, AL 35601
205-350-5557
Environmental Education Association of Alabama
Troy State University
Box 596
Troy, AL 36082
Forestry Commission
513 Madison Ave.
Montgomery, AL 36130
334-240-9304
Geological Survey of Alabama
State Oil and Gas Board
P.O. Box 0
Tuscaloosa, AL 35486-9780
205-349-2852
Gulf Coast Conservation Association
P.O. Box 16897
Mobile, AL 36606
334-478-3474
Johnson Research Center/Alabama Solar Energy
Center
University of Alabama In Huntsville
Research Institute, Annex D
Huntsville, AL 35899
1-800-228-5897
Marine Environmental Sciences Consortium
P.O. Box 369-370
Dauphin Island, AL 36528
334-861-2141
Montgomery Zoo
P.O. Box ZEBRA
Montgomery, AL 36109-0313
334-240-4900
National Forests in Alabama
USDA Forest Service
2946 Chestnut St.
Montgomery, AL 36107
334-832-4470
Nature Conservancy of Alabama, The
2821 C 2nd Ave., S.
Birmingham, AL 35233
205-251-1155 fax: 205-252-4444
Sea Grant program
Gulf Coast Research Laboratory
P.O. Box 7000
Ocean Springs, MS 39566-7000
601-875-9341 fax: 601-875-0528
Shoals Audubon Society
1612 Sheffield Dr.
Sheffield, AL 35660
205-383-6338
Soil Conservation Service
P.O. Box 311
Auburn, AL 36830
205-887-4523
The Bankhead Monitor
(A publication about the Bankhead National Forest)
P.O. Box 117
Moulton, AL 35650
The Talladega Monitor
(A publication about the Talladega National Forest)
P.O. Box 117
Moulton, AL 35650
U.S. Forest Service
1765 Highland Ave.
Montgomery, AL 36107
334-832-7630
232
U.S. Fish and Wildlife Service
P.O. Drawer 1197
Daphne, AL 36526
334-690-2181
Water Resource Research Institute
Hargis Hall, Room 202
Auburn University, AL 36849
205-826-5075
Wheeler National Wildlife Refuge
T. 4, Box 250
Decatur, AL 35603
205-353-7243
Wildlife Action of Alabama
P.O. Box 949
Point Clear, AL 36564-0949
334-479-1098
Wildlife Rescue Service
2107 Marlboro Ave.
Birmingham, AL 35226
205-663-7930
Hotline: 205-320-6189
Wildlife Sanctuary
9344 County Road 59
Troy, AL 36081
334-735-2950
Wildlife Society, Alabama Chapter
Route 7, Box 131
Andalusia, Alabama 36420
334-222-7779
Other Agencies/Organizations
Alliance to Save Energy
1725 K St., NW, Suite 509
Washington, D.C. 20006
202-857-0666 fax: 202-331-9588
Alternative Energy Resource Organization
25 S. Ewing, Room 214
Helena, MT 59601
406-443-7272 fax: 416-442-9120
American Association of Zoological Parks and
Aquariums
Oglebay Park
Wheeling, WV 26003
304-242-2160
American Cave Conservation Association
American cave and Karst Center
P.O. Box 409
Horse Cave, KY 42749
502-786-1466 fax: 502-786-1466
American Cetacean Society
P.O. Box 2639
San Pedro, CA 90731
310-548-6279 fax: 310-548-6950
American Coal Foundation
918 16th St., NW, Suite 404
Washington, D.C. 20006-2902
American Council for an Energy Efficient Economy
1001 Connecticut Ave., NW, Suite 801
Washington, D.C. 20036
202-429-8873 fax: 202-429-2248
American Fisheries Society
5410 Grosvenor Lane, Suite 110
Bethesda, MD 20814-2199
301-897-8616 fax: 301-897-8096
American Forest Foundation
1250 Connecticut Ave., NW, Suite 320
Washington, D.C. 20036
202-463-2462 fax: 202-463-2461
American Forests - Global Releaf program
P.O. Box 2000
Washington, D.C. 20013
202-667-3300 fax: 202-667-7751
American Gas Association
1515 Wilson Boulevard
Arlington, VA 22209
American Geographical Society
156 5th Ave., Suite 600
New York, NY 10010-7002
212-242-0214 fax: 212-989-1583
233
American Geological Institute
5220 King St.
Alexandria, VA 22303
703-379-2480 fax: 703-379-7563
American Humane Association
63 Inverness Dr., E.
Englewood. CO 80112
303-792-9900 fax: 303-792-5333
American Institute of Professional Geologists
7828 Vance Dr., Suite 103
Arvada, CO 80003
303-431-0831
American Iron and Steel Institute
attention: Education Cooperation Services
1000 16th St., NW
Washington, D.C. 20036
American Mining Congress
1920 N St., NW, Suite 300
Washington, D.C. 20036-1662
202-861-2800 fax: 202-861-2846
American Nature Study Society
5881 Cold Brook Rd.
Homer, NY 13077
604-749-3655
American Petroleum Institute
1220 L St., NW
Washington, D.C. 20005
202-682-8000
American Rivers
801 Pennsylvania Ave., SE, Suite 400
Washington, D.C. 20003
202-547-6900 fax: 202-543-6142
American Society for Environmental History
Center for Technology Studies
New Jersey Institute of Technology
Newark, NJ 07012
201-596-3334
American Society of Agricultural Engineers
2950 Miles Rd.
St. Joseph, MI 49085
616-429-0300 fax: 616-429-3852
American Society of Agronomy
Crop Science Society of America
Soil Science Society of America
677 South Segoe Rd.
Madison, WI 53711
608-273-8080 fax: 608-273-2021
American Society of Mammalogists
Bell Museum of Natural History
University of Minnesota
Minneapolis, MN 55455
Americans for Energy Independence
1629 K St., NW, Suite 602
Washington, D.C. 20006
202-466-2105 fax: 202-466-2108
Amoco Teaching Aids
P.O. Box 1400K
Dayton, OH 45414
Animal Protection Institute of America
2831 Fruitridge Rd.
Sacramento, CA 95822
916-731-5521 fax: 916-731-4467
Animal Welfare Institute
P.O. Box 3650
Washington, D.C. 20007
Appalachian Mountain Club
5 Joy St.
Boston, MA 02108
617-523-0636
Biomass Energy Research Association
1825 K St., NW, Suite 503
Washington, D.C. 20006
1-800-247-1755
Caretta Research Project
Savannah Science Museum
4405 Paulsen St.
Savannah, GA 31405
912-355-6705 fax: 912-355-0182
Center for Environmental Information
46 Prince St.
Rochester, NY 14607-1016
716-271-2550 fax: 716-271-0606
234
Center for Holistic Resource Management
5820 Fourth St., NW
Albuquerque, NM 87107
505-344-3445 fax: 505-344-9079
Center for Marine Conservation
1725 Desales St., NW, Suite 500
washington, D.C. 20036
Children’s Rainforest, The
P.O. Box 936
Lewsiton, ME 04240
Climate Protection Institute
5833 Balmoral Cr.
Oakland, CA 94619
510-531-0100
Conservation International
1015 18th St., NW, Suite 1000
Washington D.C. 20036
202-429-5660 fax: 202-887-5188
Defenders of Wildlife
1244 19th St., NW
Washington, D.C. 20036
202-659-9510 fax: 202-833-3349
Delta Waterfowl Foundation
102 Wilmot Rd., Suite 410
Deerfield, IL 60015
708-940-7776
Earthtrust
25 Kaneohe Bay Dr., Suite 205
Kailua, HI 96734
808-254-2866 fax: 808-254-6409
EARTH WATCH
Office of Public Affairs
P.O. Box 403N
Watertown, MA 02272
617-926-8200 fax: 617-926-8532
Energy Research Institute
6850 Rattlesnake Hammock Rd.
Naples, FL 33962
813-793-1922 fax: 813-793-1260
Environmental Action
6930 Carroll Ave., Suite 600
Takoma Park, MD 20912
301-891-1100 fax: 301-891-2218
Environmental Education project
19600 S. Molalla Ave.
Oregon City, OR 97045
Environmental Media Corporation
P.O. Box 1016
Chapel Hill, NC 27514
919-933-3003 fax: 919-942-8785
Florida Solar Energy Center
300 State Road 401
Cape Canaveral, FL 32920
Friends of the Sea otter
140 Franklin st., Suite 309
Monterey, CA 93940
408-373-2747
Fund for Animals, The
200 W. 57th St.
New York, NY 10019
212-246-2096 fax: 212-246-2633
Georgia-Pacific Corporation
Educational Services
133 Peachtree St., NW
Atlanta, GA 30303
Hawk-Watch International, Inc.
P.O. Box 35706
Albuquerque, NM 87176-5706
505-255-7622 fax: 505-255-1755
Inform
381 Park Ave., South
New York, NY 10016
212-689-4040 fax: 212-447-0689
Institute for Environmental Education
18554 Haskins Rd.
Chagrin Falls, OH 44023-1823
212-543-7303 fax: 246-543-7160
Marine Technology Society
2000 Florida Ave., NW, Suite 500
Washington, D.C. 20009
235
Mississippi-Alabama Sea Grant Consortium
Caylor Building
Gulf Coast Research laboratory
Ocean Springs, MS 39564
Missouri Botanical Garden
P.O. Box 299
St. Louis, MO 63166
National Audubon Society
801 Pennsylvania Ave., SE
Washington, D.C. 20003
National Clearinghouse on Dev. and Env. Education
American Forum on Global Education
45 John St., Suite 908
New York, NY 10038
National Council for Geographic Education
16A Leonard Hall
Indiana University of Pennsylvania
Indiana, PA 15705
National Consortium for Environmental Education
and Training
School of Natural resources and Environment
University of Michigan
430 East University Ave.
Ann Arbor, MI 48109
National Energy Foundation
5160 Wiley Post Way, Suite 200
Salt Lake City, UT 84116
801-539-1406
National Food and Energy Council
409 Van Diver W., Suite 202
Columbia, MO 65202
314-875-7155
National Geographic Society
17th and M St., NW
Washington, D.C. 20036
National Parks and Conservation Association
1015 31st St., NW
Washington, D.C. 20007
202-223-6722
National Wildflower Research Center
2600 FM 973
North Austin, TX 78725
National Wildlife Federation
1400 16th St., NW
Washington, D.C. 20036-2266
National Wildlife Refuge Association
10824 Fox Hunt Lane
Potomac, MD 20854
301-983-1238
National Zoological Park
Smithsonian Institute
Washington, D.C. 20008
Natural Resources Defense Council, Inc.
40 West 20th St.
New York, NY 10011
North American Bluebird Society
P.O. Box 6295
Silver Spring, MD 20906
Oceanic Society, The
Executive Offices
1536 16th St., NW
Washington, D.C. 20036
Rainforest Action Network
450 Sansome, Suite 700
San Francisco, CA 94111
Resources for the Future
1616 P St., NW
Washington, D.C. 20036
Smithsonian Institution
Office of Environmental awareness
S. Dillon Ripley Center, Suite 3123
Washington, D.C. 20560
202-357-4797 fax: 202-786-2557
Soil Conservation Society of America
7515 N.E. Ankeny Rd.
Ankeny, Iowa 50021-9764
236
Southwest Research and Igrass Roots Information
Center
P.O. Box 4524
Albuquerque, NM 87106
505-262-1862
Student Conservation Association
P.O. Box 550
Charlestown, NH 03603
603-543-1700 fax: 603-543-1828
Tennessee Valley Authority
Division of Land and Economic Resources
1A16 Old City Hall Complex
Knoxville, TN 37902
615-632-6449
Trout Unlimited
501 Church St., NE
Vienna, VA 22180
703-281-1100
Union of Concerned Students
26 Church st.
Cambridge, MA 02238
617-547-5552 fax: 617-864-9405
Wildlife Conservation International
New York Zoological Society
185th St. and Southern Blvd.
Bronx, NY 10460-1099
718-220-5141
World Resources Institute
1709 New York Ave, NW
Washington, D.C. 20006
410-516-6963
World Society for the Protection of Animals
P.O. Box 190
Boston, MA 02130
617-522-7000 fax: 617-522-7077
World Wildlife Fund/Conservation Foundation
1250 24th St., NW
Washington, D.C. 20037
Directory
OTHER ENVIRONMENTAL SOURCES
237
Federal Government Agencies/Organizations
Army Corps of Engineers
Department of Defense
20 Massachussets Ave., NW
Washington, D.C. 20314
202-272-0010
EPA Regional Offices
See Ecology Directory
House Appropriations Committee
U.S. House of Representatives
Washington, D.C. 20515
202-255-2771
House Interior Committee
U.S. House of Representatives
Washington, D.C. 20515
202-255-2761
House Merchant Marine and Fisheries Committee
U.S. House of Representatives
Washington, D.C. 20515
202-255-4047
House Public Works and Transportation Committee
U.S. House of Representatives.
Washington, D.C. 20515
202-255-4472
National Institute for Occupational Safety and Health
U.S. Department of Labor
200 Constitution Ave., NW
Washington, D.C. 20240
202-343-4953
Senate Commerce, Science and Transportation
Committee
U.S. Senate
Washington. D.C. 20515
202-224-5115
State Agencies Organizations
Alabama Cooperative Extension Service
State Headquarters
Auburn University, AL 36849
205-826-4444
Alabama Farmers Federation P.O. Box 11000
Montgomery, AL 36191-0001
334-288-3900
Alabama Handicapped Sportsmen
44 Huntington Place
Northport, AL 35476
205-339-2800
Alabama Hiking Association
P.O. Box 4311
Birmingham, AL 35206
Alabama Solar Association
Route 3, Box 160
Decatur, AL 35603
Alabama State Museum of Natural History
University of AL, Department of Archeology
13075 Moundville Archaeological Park
Moundville, AL 35474
205-371-2266
Bureau of Tourism and Travel
401 Adams Ave., Suite 126
Montgomery, AL 36104
Dothan Landmarks Foundation, Inc.
P.O. Box 6362
Dothan, AL 36302
334-794-3452
Exploreum Museum of Discovery
1906 Springhill
Mobile, AL 36607
334-476-6873
238
Friends of Little River
P.O. Box 111
Mentone, AL 35984
205-634-4510 or 205-634-4066
Ruffner Mountain Nature Center
1214 South 81st St.
Birmingham, AL 35206
205-833-8264
Sierra Club, Alabama Chapter
22 Hilltop Estates
Northport, AL 35476
205-339-4692 or 205-348-6695
Sierra Club, Alabama Chapter
Montgomery Group
P.O. Box 70031
Montgomery, AL 36107
Vulcan Trail Association
Attention: Office Central
P.O. Box 19116
Birmingham, AL 35219-9116
205-933-4170
Other Environmental Agencies/Organizations
American Association for the Advancement of
Science
133 H St., NW
Washington, D.C. 20005
202-326-6640 fax 202-371-9526
American Camping Society
Bradford Woods
5000 State Road 67, North
Martinsville, IN 46151-7902
American Chemical Society
1155 16th St., NW
Washington, D.C. 20036
202-872-4600 fax: 202-833-7732
American Litteral Society
Highlands, NJ 07732
908-291-0055 fax: 908-872-8041
American Nature Study Society
5881 Cold Brook Road
Homer, NY 13077
607-749-3655
American Red Cross
1730 D St., NW
Washington, D.C. 20006
202-737-8300
American Society of Agricultural Engineers
2950 Niles Road
St. Joseph, MI 49085
616-429-0300 fax: 616-429-3852
American Society of Civil Engineers
345 East 47th St.
New York, NY 10017
1-800-548-2723 fax: 212-705-7300
Anheuser-Busch Companies, Inc.
Department of Consumer Awareness and Education
One Busch Place
St. Louis, MO 63118
Call your local distributor
Asbestos Information Association/North America
1745 Jefferson Davis Hwy., Suite 406
Arlington, VA 22202
703-412-1150 fax: 703-412-1152
Association for Experimental Education
P.O. Box 4625
Denver, CO 80204
Association of Interpretive Naturalists, Inc.
Central Business Office
6700 Needwood Rd.
Derwood, MD 20855
Bureau of Outdoor Recreation
DEpartment of Interior
18th an C St., NW
Washington, D.C. 20240
Center for Emergency response Planning
Workplace Health Fund
815 16th St., NW, Suite 301
Washington, D.C. 20006
202-842-7833 fax 202-393-0623
239
Center for Safety in the Arts
5 Beekman St.
New York, NY 10038
212-227-6220
Citizens for a United Earth
1880 Route 64
Ionia, NY 14475
716-624-3673
Coalition for Education in the Outdoors
Box 2000, SUNY College at Cortland
Cortland, NY 13045
607-753-4971
Council on Economic Priorities
30 Irving Place
New York, NY 10003-2386
212-420-1133 fax: 212-420-0988
Council on Outdoor Education
1900 Association Dr.
Reston, VA 22091
Cousteau Society, Inc., The
870 Greebrier Cr., Suite 402
Chesapeake, VA 23320-2641
804-523-9335 fax: 804-523-2747
Development Education Program
Office of the Publisher
The World Bank
1818 H St., NW, #T8082
Washington, D.C. 20433
Earth Island Institute
300 Broadway, Suite 28
San Francisco, CA 94133
415-788-3666 fax: 415-788-7324
Edison Electric Institute
Education Service Department
701 Pennsylvania Ave., NW
Washington, D.C. 20004
Epcot Teachers Center
Walt Disney World
P.O. Box 10000
Lake Buena Vista, FL 32830
Friends of the Earth Foundation, Inc.
1045 Sansome St.
San Francisco, CA 94111
Humane Society of the United States
2100 L St., NW
Washington, D.C. 20037
202-452-1100 fax: 202-778-6132
International Council for Outdoor Education
P.O. Box 17255
Pittsburgh, PA 15235
Izaak Walton League of America, Inc., The
P.O. Box 824
Iowa City, IA 52244
League of Conservation Voters
1707 L St., NW, Suite 550
Washington, D.C. 20036
202-785-8683 fax: 202-835-0491
Monitor
1506 19th St., NW
Washington, D.C. 20036
National Association of Biology Teachers
11250 Roger Bacon Dr., #19
Reston, VA 22090
National Council for Social Studies
3501 Newark St, NW
Washington. D.C. 20016
National Education Association
1201 16th St, NW
Washington, D.C. 20036
National Science for Youth Foundation
130 Azalea Dr.
Roswell, GA 30075
National Science Teachers Association
1742 Connecticut Ave., NW
Washington, D.C. 20009
Outdoor Biology Instructional Strategies
Lawrence Hall of Science
University of California
Berkeley, CA 93305
240
Planetary Society, The
65 North Catalina Ave.
Pasadena, CA 91106
818-793-5100
Project ROSE
University of Alabama
Box G
Tuscaloosa, AL 35487
1-800-452-5501 or 205-349-4878
Rails-to-Trails Conservancy
1400 16th St., NW, Suite 300
Washington, D.C. 20036
202-797-5400 fax: 202-797-5411
Safari Club International
4800 West Gates Pass Rd.
Tucson, AZ 85745
Seventh Generation
Catalog Requests Department
Colchester, VT 05446-1672
1-800-456-1177
Thames Science Center
Gallows Lane
New London, CT 06320
401-849-5952
Union of Concerned Students
26 Church St.
Cambridge, MA 02238
World Food Day
1001 22nd St., NW, Suite 300
Washington, D.C. 20437
World Game Institute
University City Science Center
3508 Market St.
Philadelphia, PA 19104
215-387-0220
Worldwise Schools
United States Peace Corps
1990 K St., NW
Washington, D.C. 20526
Discovering Alabama Program GuideDiscovering Alabama, a public television series, highlights the natural features and environmental issues of
the state. Host Dr. Doug Phillips explores natural features on location by means of backcountry hiking and
canoeing. Produced for general audiences, Discovering Alabama is also designed as an interdisciplinary
teaching. Teachers’ Guides have been published for several of the videos, and others are being developed.
The series is a production of the Alabama Museum of Natural History in cooperation with Alabama Public
Television.
Mobile-Tensaw Delta
Just south of Mobile Bay lies Alabama’s Mobile-Tensaw Delta, named for the juncture of the Mobile and
Tensaw Rivers. Among U.S. river deltas, the Mobile-Tensaw is second in size to the Mississippi River Delta.
It, like other major river deltas of the world, has served as a natural attraction to early adventurers and as a
globally significant wetland. Host Dr. Doug Phillips canoes the delta to examine its historical role in the
exploration and settlement of the New World and its present status as a remarkable natural resource
increasingly subject to competing human uses.
Cheaha Mountain/Talladega National Forest
The Talladega Division of the Talladega National Forest contains the southernmost reaches of the Appalachian
mountain chain, which extends approximately eighty miles into northeast Alabama and includes the state’s
highest peak, Cheaha Mountain, elevation 2,420 feet. Host Dr. Doug Phillips hikes several miles along the
Chinnabee Silent Trail, a footpath constructed in the Talladega National Forest by scout troops from the
Talladega School for the Deaf. Along the way, Phillips describes local history and explores many of the
natural features of the area. He is joined by a group of elementary school students who climb Cheaha
Mountain with him and discover the value of learning in the wondrous classroom of the outdoors.
Cahaba River
Host Dr. Doug Phillips canoes a segment of the Cahaba River in northern Bibb County where the Cahaba lily
grows, describing many natural features of the river and stopping for a close-up look at the rare lily. Joined by
a fisheries biologist from the Alabama Department of Conservation and Natural Resources, Dr. Phillips
discusses a number of concerns about environmental changes along the river. This program is the first of two
Discovering Alabama programs featuring the Cahaba River. A second program, entitled the Cahaba River
Watershed, explores the full length of the Cahaba and examines changes affecting the entire watershed.
Southeast Alabama/Wiregrass Region
Because southeast Alabama lacks prominent features like the mountains of north Alabama or the beaches of
coastal Alabama, it is a region that is sometimes overlooked by those seeking such natural attractions.
However, in this program, Dr. Doug Phillips reveals that the southeast part of the state is quite rich in natural
qualities with their own special wonder. Phillips travels across several southeast Alabama counties exploring a
variety of unique features from the historically and biologically significant wiregrass region to the caves and
sinkholes of adjoining limestone areas and visits the Conecuh National Forest.
241
Oakmulgee Division/Talladega National Forest
Host Dr. Doug Phillips sets out from his own tract of Tuscaloosa County farm and forestland into the
adjoining Oakmulgee Division of the Talladega National Forest. With camera crew in tow, Phillips invites
viewers on a casual interpretive walk across the Oakmulgee to the National Forest Recreation Area, Payne
Lake. Along the way, he examines a variety of plants and animals that live in the Oakmulgee and discusses
the importance of maintaining such forestlands.
Lake Guntersville State Park
Few places can match Alabama’s Lake Guntersville State Park for its combination of mountainous natural
setting and full scale accommodations for recreation. Dr. Doug Phillips explores both of these and other facets
of the park’s popular appeal, giving particular emphasis to the potential of the area’s natural surroundings for
helping to recover the endangered bald eagle, America’s national symbol. Included is a visit with the park
naturalist, who leads a group of children on an interpretive nature walk and discusses the importance of
environmental education for America’s youth.
Coastal Alabama-Natural Diversity
Alabama’s coastal area, though relatively small in size, is diverse in natural qualities. Series host Dr. Doug
Phillips journeys across most of Alabama’s coastal region exploring the area’s rivers, bays, swamps, marshes,
and beaches, together with numerous resident plant and animal species. He is joined at various points by local
naturalists and wildlife officials to discuss environmental change in the region.
Coastal Alabama-Environmental Issues
Host Dr. Doug Phillips highlights a range of primary environmental issues when he revisits coastal Alabama
and examines several of the leading causes of environmental change in the region. Included are interviews
with local experts who add their perspectives to the discussion of activities such as farming, forestry,
commercial fishing, and overall growth and development on the coast of Alabama.
Tannehill State Park
Tannehill Ironworks Historical Sate Park has one of Alabama’s best displays of buildings, tools, and other
lifeway artifacts dating from the period of early European settlement to the time of the first iron making in the
state. Host Dr. Doug Phillips presents many of these important cultural features in the context of the park’s
natural features. Phillips explores Alabama history through visits with teachers at the park’s “living history”
classroom, discussions with craftsmen who have reconstructed historical log buildings, and visits to the park’s
unique Iron and Steel Museum of Alabama.
Little River Canyon
Host Dr. Doug Phillips hikes the seventy-mile length of the Little River from its northeast origins near the
Alabama-Georgia state line into the final fifteen-mile segment of Little River Canyon. Along the way Dr.
Phillips describes the river and the canyon, discusses various features of the area, and recounts several points
of local history. The show’s opening segment recreates the mid-19th century experience of Union troops who
encountered the impassably deep Little River Canyon by surprise as they hurried through Alabama with
Confederate troops in pursuit.
242
Caves of Alabama
With almost 3,000 caves, Alabama ranks among only a few states that have such an abundance of
subterranean wonder. Host Dr. Doug Phillips takes viewers on an actual exploration of an unmapped cave in
north Alabama. During the journey, Phillips and an accompanying caving expert encounter many common
features of caves and discuss how caves are formed, the diversity of geological and biological features that
occur in caves, and the history and location of caves in Alabama.
Oak Mountain State Park
More than 10,000 acres in size, Oak Mountain State Park is Alabama’s largest state park. The park also
happens to be located only minutes from Alabama’s largest city, Birmingham. Host Dr. Doug Phillips leads
viewers on a hurried escape from the crowded urban scene of downtown Birmingham to the serene setting of
Oak Mountain with its forested ridges, valleys, streams, and abundant wildlife. Phillips discusses the
geological origin of Oak Mountain, its early history, and the natural attractions of the area as he hikes through
the remote reaches of the the park. Later, he is joined by a Birmingham area teacher and her students who
regularly visit the park for nature study.
Locust Fork River
Dr. Doug Phillips takes a personal journey when he canoes part of the Locust Fork River in a nostalgic return
to the site of his childhood home. But as Southern writer Thomas Wolfe observed in his novel, You Can’t GoHome Again, things change - for better or worse. On this journey, viewers will learn of the river’s past and
explore crucial questions about its future. For much of this century, the Locust Fork was familiar only to the
residents of its immediate watershed. In recent times, the river has gained attention as more Alabamians
recognize its uncommon appeal and as more citizens have grown concerned about changing land practices
that pose environmental threats to the river.
Moundville
This video features Moundville Archaeological Park and the mound-building Indian culture of the prehistoric
Mississippian Period that lasted from around A.D. 1000 to 1550. The program examines the symbols, beliefs,
and the lifeways of this once dominant southeastern culture and traces two centuries of archaeological study
attempting to understand these early Native Americans and the significance of their earthen mounds. This
video links the science of archaeology with the timeless human quest to understand the meaning of life. The
story of Moundville offers a unique opportunity for interdisciplinary instruction in history, social studies,
science, geography, and environmental education.
Alabama’s Natural Diversity
Alabama often has been viewed as a backwoods region without sophistication. Yet many high-growth urban
areas in our country have become synonymous with a stressful lifestyle often associated with noise, traffic,
pollution, and crime. In comparison, Alabama’s backwoods are no longer equated with being backward. This
video presents an overview of Alabama’s natural qualities from the state’s Appalachian highlands to its coastal
wetlands. Alabama’s great variety of terrain, of wild habitats, and of native plants and animals ranks the state
among the most naturally diverse in the nation. As other parts of our country lose their native natural qualities,
Alabama’s wildlands help to make our state exceptional.
243
Geological History of Alabama
This video presents a brief overview of the geological history of Alabama and describes natural resources in
the state. As far back as the 18th century, geologists from other countries were attracted to Alabama by reports
of the region’s diverse geology. Since then, researchers have pieced together the history of how the landscape
and life forms found in Alabama have changed over time. This video follows those changes, from the Earth’s
formation through the major geological eras (Paleozoic, Mesozoic, and Cenozoic) of the fossil record, and
concludes with the recent scientific question of whether industrial societies cause environmental changes that
may accelerate geological change.
A Walk in the Woods
The fields, streams, and woods that once surrounded our schools are being replaced rapidly by shopping areas
and adjoining parking lots, while bulletin boards, overhead projectors, and computers are now the primary
sources of information. In this video, viewers take a walk in the backwoods and encounter nature on a basic
level, a theme which runs throughout the video using quotations from famous Native Americans. Even with
the many material advances of our industrial society, we remain dependent upon fundamental processes in
nature. The program does not seek to deny the value of technology; rather, the video’s essential purpose is to
underscore the importance of remembering that our natural environment is the basis of life.
Alabama Forests
Alabama is one of the most forested regions in the world. The state contains scores of forest communities that
provide an abundance of natural habitats, home to a great variety of native plants and animals. A healthy
forest is more than merely a collection of trees. It is a setting in which the whole is greater than the sum of its
parts because its parts - soil, water, wildlife, various plants and trees - work together to form a self-
perpetuating natural community, or ecosystem. This video describes the importance of forests in Alabama
while also exploring forest history and key concerns for the future of Alabama’s forests.
Dauphin Island
Dauphin Island is unique among barrier islands because of its special natural qualities and its important role in
the history of American settlement. The island has a diversity of natural habitats including marshlands, forests,
and lakes. The island also attracted a variety of early explorers including the Spanish, the French, and the
English. This video presents both the natural and the human history of Dauphin Island and describes the
forces of geological change to barrier islands. The video concludes by looking at environmental changes
occurring to the island from modern growth and development and examines the question of how to manage
such activities for the island’s future.
Black Warrior River
The Black Warrior River has been prominent in the history and development of Southeastern societies since
the emergence of prehistoric cultures many thousands of years ago. In fact, the river’s name was taken from
the famous Native American Chief Taskalusa (derived from the words tasska and luska meaning black
warrior) who encountered the De Soto expedition in 1540. This video recalls the history of the Black Warrior
River from the time of early human settlement to the present. We examine the river both in terms of its
environmental role and its economic importance, with special focus given to the river’s changing status since
the construction of a series of dams and locks completed earlier this century.
244
The Sipsey Wilderness
This video explores Alabama’s Sipsey Wilderness Area and tells about the environmental controversy
associated with a citizen campaign to preserve the Sipsey in the 1970s. Efforts to gain federal protection for
the Sipsey Wilderness sparked an angry national debate revealing society’s conflicting desires both to subdue
nature and to preserve nature. The video traces this duality from early civilizations to the present, giving
particular focus to the rapid settlement of the American frontier. Dr. Phillips recalls the influence of 19th-
century romanticism and the emergence of a national movement for the preservation of American wilderness
regions.
Village Creek
One of the South’s earliest industrial cities is Birmingham, Alabama, a place known for its history of iron and
steel production. Often forgotten, however, is the history of Birmingham’s natural features that were essential
to the establishment of this city. One of those features is Village Creek which flows through the heart of the
Birmingham area. Village Creek was originally a pure stream extending across a fertile valley that attracted
settlers to the region for the purpose of farming in the early 19th century. As the Industrial Age advanced,
Village Creek changed dramatically and has now become a prime example of how uncontrolled urban growth
can change the native landscape. This video traces the history of Village Creek and examines the value of
urban planning as a means of maintaining a high quality of life in urban areas and preventing environmental
degradation.
Wildlife History
Our nation is rooted in a rich, natural heritage that helped define our national identity. Central to this heritage
is the history of our society’s changing relationship with wildlife. This video gives an overview of Alabama’s
role as a national leader in wildlife conservation and restoration.
Red Hills Salamander
This video follows a team of research scientists as they go on an actual search for the Red Hills salamander
and examine the ecological significance of this threatened species. Private landowners, along with wildlife
officials, develop strategies to conserve the salamanders’ habitat.
Horse Pens 40
Located atop Chandler Mountain in St. Clair County, this site is a unique ring of large rocks forming a natural
corral, used by Indians and settlers for gathering horses, and today operated as a commercial attraction. This
video shows the cultural values and natural beauty of historical Horse Pens 40.
Alabama Adventure
Using beautiful nature footage from throughout Alabama, this special presentation is a visual feast
accompanied accompanied by a continuous musical background for viewers who delight in Alabama’s forests,
beaches, fields, mountains, rivers, flora and fauna.
245
246
Long Leaf Ecosystem
Experts now believe that the Long Leaf ecosystem was at one time the single largest forest ecosystem in the
south. This video highlights on-going efforts to better understand and perpetuate the Long Leaf Ecosystem.
Wetumpka Impact Center
In an 1891 report, state geologist, Professor Eugene Allen Smith, noted that the area around Wetumpka was
“structurally disturbed”. In this video, Dr. Phillips, along with expert geologists, examine evidence that
suggests the altered landscape around Wetumpka is the result of an ancient asteroid collision.
Alabama Trees
In this program, host Dr. Doug Phillips takes an autumn stroll through Alabama woods to introduce viewers to
individual members of the forest community and answer the commonly asked question, “shat kind of tree is
this?”
Native American Festival
This show reflects on Alabama’s native heritage as we learn the importance of the Native American Festival
held each year at Moundville Archeological Park. The show features Native Americans as they demonstrate
arts and crafts unique to the Indian culture, play games from long ago and listen to stories about primary
tribes, tribal territories, and basic lifeways.
Arboretums
Highlighted in this video are four of Alabama’s arboretums and their significant contribution to the
preservation of our native plants and trees.
Mobile River Basin
Few places boast such an abundance of freshwater as our state of Alabama. Join host Dr. Phillips for a
journey across 44,000 square miles of the Mobile River Basin, a freshwater drainage encompassing most of
Alabama.
Fort Morgan
Visit historic Fort Morgan and witness an active archaeological dig, take a trek through an ancient maritime
forest and witness the capture, banding, and release of migratory birds. Fr. Phillips talks to local residents in
presenting the past and considering the future of Fort Morgan Peninsula, one of Alabama’s best coastal
wonders.
247
Fort Toulouse/Jackson
Take a journey back in time for a visit to Fort Toulouse/Jackson State Park and the park’s annual Frontier
Days Festival. Meet Alibamous Indians, French soldiers, Davey Crocket, Andrew Jackson’s regiment, and
converse with 18th century botanist William Bartram while also learning about the natural appeal of the
location.
Sipsey River Swamp
Launch a canoe with Dr. Doug and discover the wild allure of the Sipsey River Swamp. The 100-mile long
Sipsey River is one of Alabama’s few remaining unimpounded rivers, much of it surrounded by river-bottom
swamp.
Forever Wild
Alabama’s “Forever Wild” land conservation program is recognized nationally for its effectiveness in
protecting significant wildlands. This video reflects on the history of how the “Forever Wild” program was
established and tells how Alabamians can participate in promoting such land conservation.
Dugger Mountain Wilderness
The Dugger Mountain Wilderness contains Alabama’s second highest peak, Dugger Mountain, and is one of
several federally designated “wilderness areas” in the state. In this program, Dr. Phillips hikes through the
wilderness as he follows the Pinhoti Hiking Trail. Along the way, he encounters many natural wonders while
considering the citizens, scientists, and government officials interested in protecting the area.
Earth Day
This video visits Selma, Alabama to join the local school system’s annual celebration of Earth Day.
Interviews with teachers, students, parents and various officials highlight the significance of this national day
of environmental appreciation and give special emphasis tot the importance of environmental education
throughout the school year.
Tuscaloosa County
The era of “new south” progress has brought important improvements to the southern region. However, parts
of the South are also experiencing rapid growth and development that could threaten such traditional southern
qualities as abundant natural surroundings and a comfortable pace of life. This video examines Tuscaloosa
County, Alabama as an example of a southern community affected by accelerating new-south growth and
faced with the challenge of managing this change so as to protect local rural and environmental values.
Alabama Soils
Host Dr. Doug and faithful companion Turkey journey across Alabama to examine the seven major soil areas
of the state and learn about the more than 300 soil types associated with these areas. Guest experts discuss
the vital ecological function of healthy soil and highlight the importance of Alabama soils to the state’s
economic and environmental health.

248
Related Documents