6-4 Line Plots and Frequency Tables Lesson Presentation Lesson Presentation Lesson Quizzes Lesson Quizzes

Welcome message from author
This document is posted to help you gain knowledge. Please leave a comment to let me know what you think about it! Share it to your friends and learn new things together.
Transcript
6-4 Line Plots and Frequency Tables
Lesson PresentationLesson Presentation
Lesson QuizzesLesson Quizzes
6-4 Line Plots and Frequency Tables
Review of MA.5.S.7.2 Differentiate…discrete data…and represent those using graphs…
Sunshine State Standards

6-4 Line Plots and Frequency Tables
Vocabulary
frequency
frequency table
line plot
6-4 Line Plots and Frequency Tables
The frequency of a data value is the number of times it occurs.
A frequency table tells the number of times an event, category, or group occurs.

6-4 Line Plots and Frequency Tables
Additional Example 1: Using Tally Marks to Make a Frequency Table
Students in Mr. Ray’s class recorded their fingerprint patterns. Which type of pattern do most students in Mr. Ray’s class have?
whorl loop whorl loop
arch arch loop whorl
loop arch whorl arch
arch whorl arch loop
Make a table to show each type of fingerprint.

6-4 Line Plots and Frequency Tables
A group of four tally marks with a line through it means five. t llll = 5 llll llll = 10
Reading Math
6-4 Line Plots and Frequency Tables
Additional Example 1 Continued
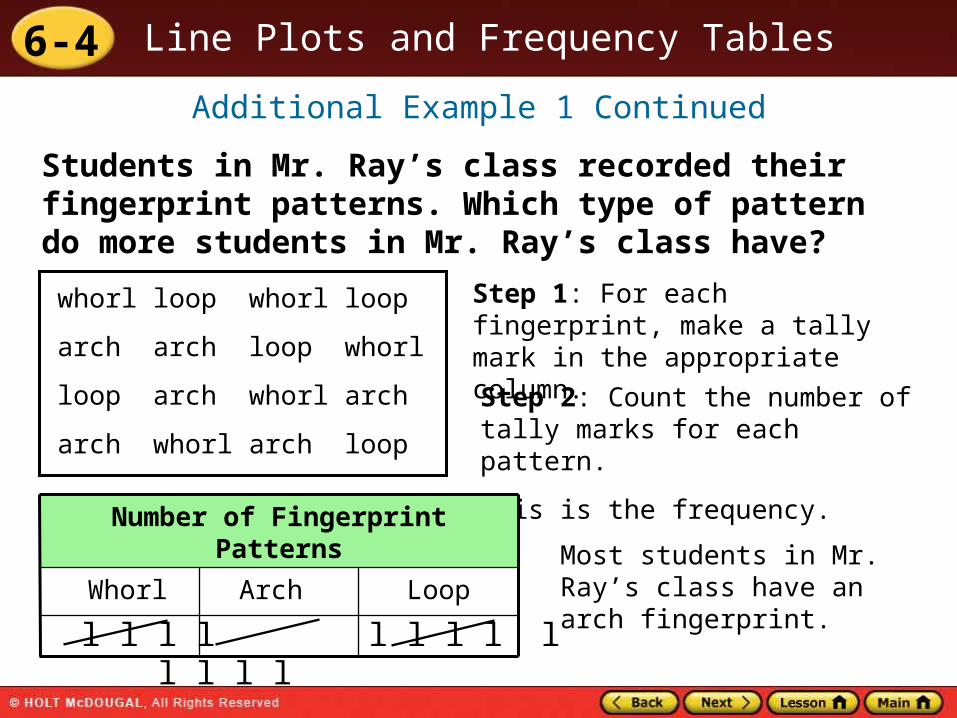
Students in Mr. Ray’s class recorded their fingerprint patterns. Which type of pattern do more students in Mr. Ray’s class have?
whorl loop whorl loop
arch arch loop whorl
loop arch whorl arch
arch whorl arch loop
Step 1: For each fingerprint, make a tally mark in the appropriate column.
Step 2: Count the number of tally marks for each pattern.
This is the frequency.
LoopArch Whorl
Number of Fingerprint Patterns
l l l l l l l l l l l l l
Most students in Mr. Ray’s class have an arch fingerprint.
6-4 Line Plots and Frequency Tables
Check It Out: Example 1
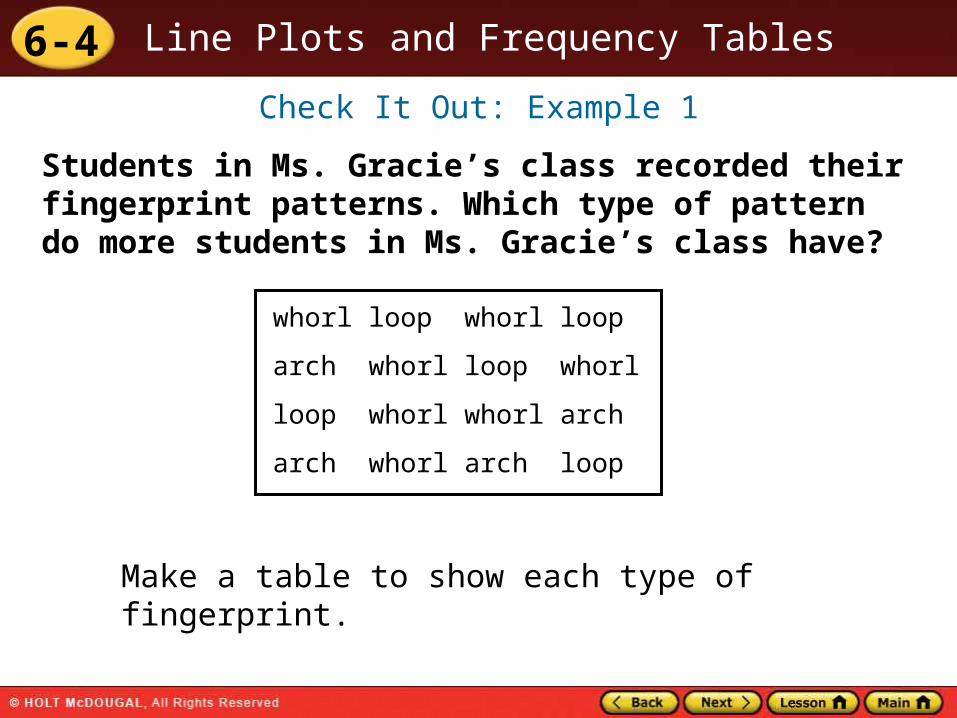
Students in Ms. Gracie’s class recorded their fingerprint patterns. Which type of pattern do more students in Ms. Gracie’s class have?
Make a table to show each type of fingerprint.
whorl loop whorl loop
arch whorl loop whorl
loop whorl whorl arch
arch whorl arch loop

6-4 Line Plots and Frequency Tables
Check It Out: Example 1 Continued
Students in Ms. Gracie’s class recorded their fingerprint patterns. Which type of pattern do more students in Ms. Gracie’s class have?
Step 1: For each fingerprint, make a tally mark in the appropriate column.
whorl loop whorl loop
arch whorl loop whorl
loop whorl whorl arch
arch whorl arch loop
Step 2: Count the number of tally marks for each pattern.
This is the frequency.
LoopArch Whorl
Number of Fingerprint Patterns
l l l l l l l l l l l l l l
Most students in Ms. Gracie’s class have a whorl fingerprint.

6-4 Line Plots and Frequency Tables
A line plot uses a number line and x’s or other symbols to show frequencies of values.

6-4 Line Plots and Frequency Tables
Additional Example 2: Making a Line Plot
Step 1: Draw a number line.
Step 2: For each tennis ball, use an x on the number line to represent how many were collected.
Students collected tennis balls for a project. The number of balls collected by the students is recorded in the table. Make a line plot of the data.
111015151014
101116111410
Tennis Balls Collected
x x x x
5 6 7 8 9 10 11 12 13 14 15 16
x x x
x x
x x x
6-4 Line Plots and Frequency Tables
Check It Out: Example 2
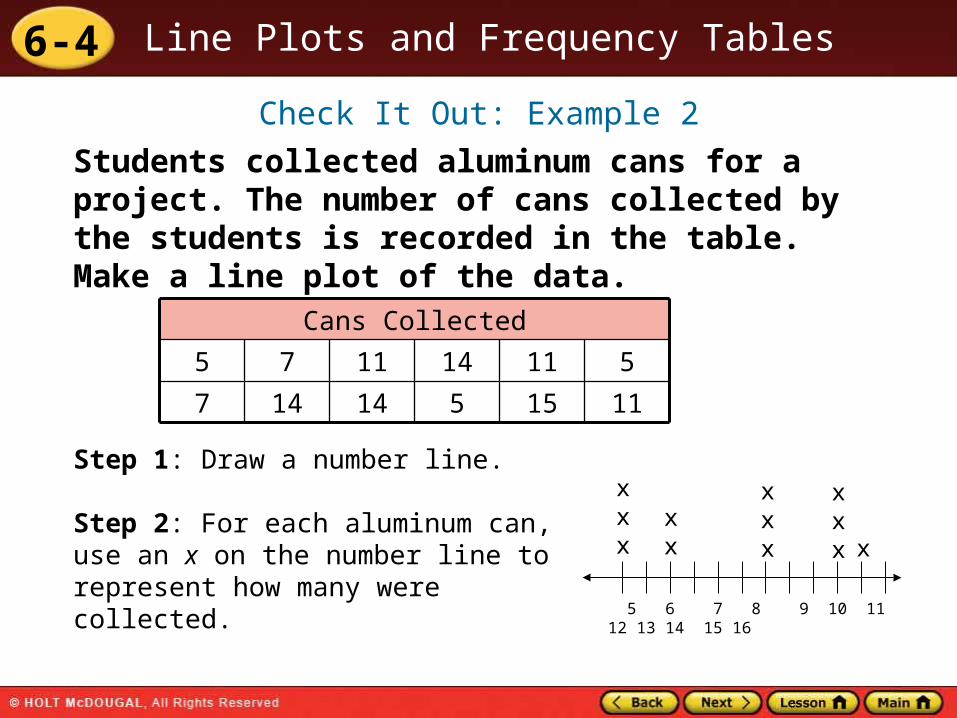
Step 1: Draw a number line.
Step 2: For each aluminum can, use an x on the number line to represent how many were collected.
Students collected aluminum cans for a project. The number of cans collected by the students is recorded in the table. Make a line plot of the data.
1115514147
511141175
Cans Collected
x x x
5 6 7 8 9 10 11 12 13 14 15 16
xx
x xx
x x x x
6-4 Line Plots and Frequency Tables
Additional Example 3: Making a Frequency Table with Intervals
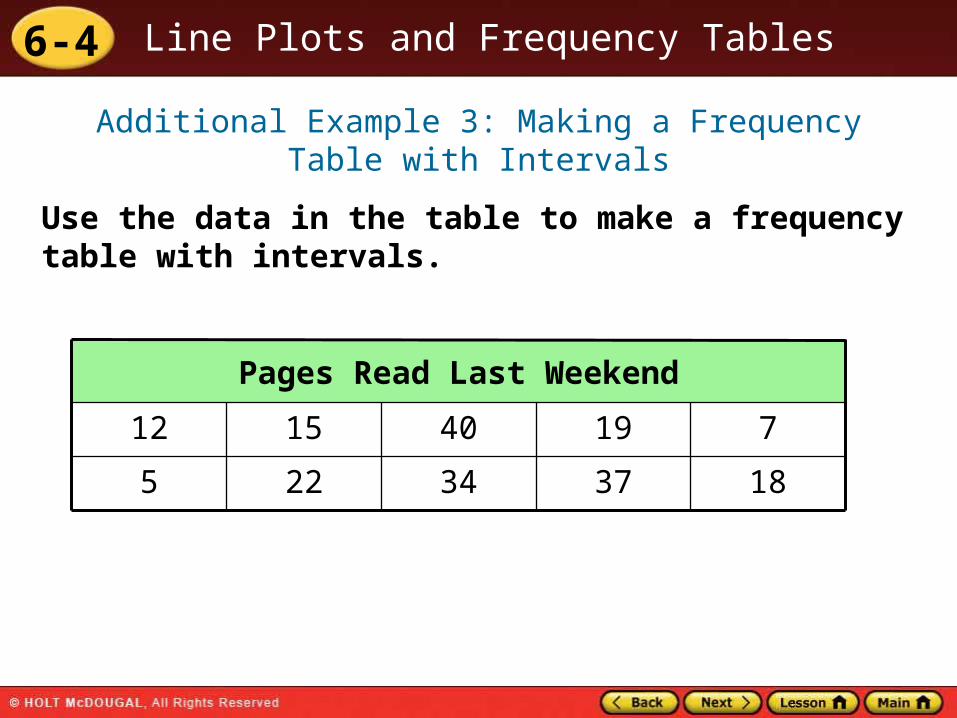
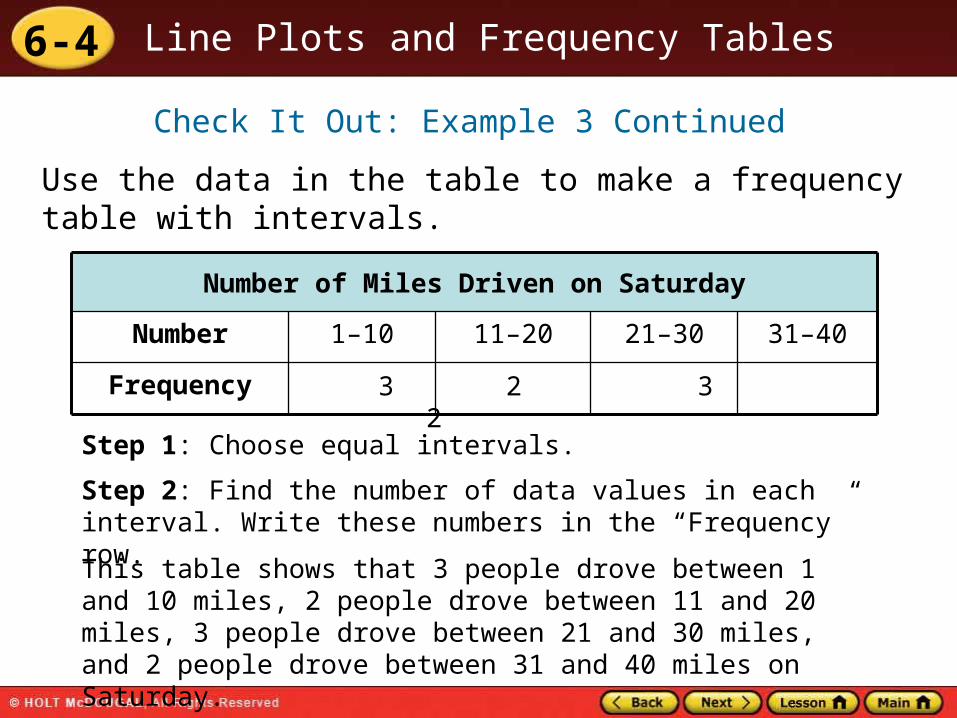
Use the data in the table to make a frequency table with intervals.
183734225
719401512
Pages Read Last Weekend

6-4 Line Plots and Frequency Tables
Additional Example 3 Continued
Use the data in the table to make a frequency table with intervals
Frequency
31–4021–3011–201–10Number
Pages Read Last Weekend
This table shows that 2 students read between 1 and 10 pages, 4 students read between 11 and 20 pages, 1 person read between 21 and 30 pages, and 3 people read between 31 and 40 pages last weekend.
2 4 1 3
Step 1: Choose equal intervals.
Step 2: Find the number of data values in each interval. Write these numbers in the “Frequency” row.

6-4 Line Plots and Frequency Tables
Check It Out: Example 3
Use the data in the table to make a frequency table with intervals.
382134275
71992917
Number of Miles Driven on Saturday
6-4 Line Plots and Frequency Tables
Check It Out: Example 3 Continued
Use the data in the table to make a frequency table with intervals.
Frequency
31–4021–3011–201–10Number
Number of Miles Driven on Saturday
This table shows that 3 people drove between 1 and 10 miles, 2 people drove between 11 and 20 miles, 3 people drove between 21 and 30 miles, and 2 people drove between 31 and 40 miles on Saturday.
3 2 3 2
Step 1: Choose equal intervals.
Step 2: Find the number of data values in each interval. Write these numbers in the “Frequency” row.
6-4 Line Plots and Frequency Tables
Standard Lesson Quiz
Lesson Quizzes
Lesson Quiz for Student Response Systems
6-4 Line Plots and Frequency Tables
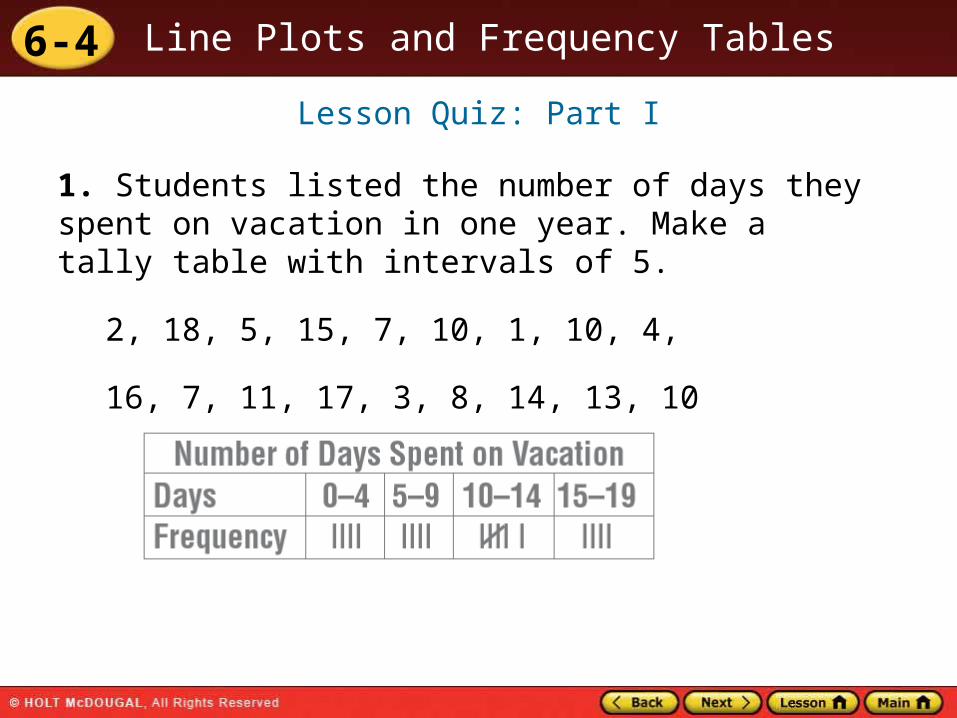
Lesson Quiz: Part I
1. Students listed the number of days they spent on vacation in one year. Make a tally table with intervals of 5.
2, 18, 5, 15, 7, 10, 1, 10, 4,
16, 7, 11, 17, 3, 8, 14, 13, 10

6-4 Line Plots and Frequency Tables
Lesson Quiz: Part II
2. Use your tally table from problem 1 to make a frequency table.

6-4 Line Plots and Frequency Tables
1. Richard listed the number of books lent by their school library each day. Identify the corresponding tally table with intervals of 5.3, 18, 6, 14, 8, 10, 1, 10, 4, 17, 8, 11, 17, 4, 8, 14, 14, 10
A. B.
Lesson Quiz for Student Response Systems

6-4 Line Plots and Frequency Tables
2. Identify the frequency table for the given data.
A.
B.
Lesson Quiz for Student Response Systems
Related Documents