5.8 Cooling Towers 1. Cooling Towers The function of the cooling tower is to reject heat to the atmosphere by reducing the temperature of water circulates through condenser or other heat-rejection equipment. For this reason the state of the air and its path on the psychrometric chart are of little interest. Counterflow mechanical draft tower are commonly found in air- conditioning applications. The main advantage of counterflow is its adaptability to limited space. The thermal capability of any cooling tower can be defined by the following parameters: a. Entering and leaving water temperature b. Entering air wet bulb temperature c. Water flow rate The difference between the entering and leaving water temperature is the cooling range, while the difference in temperature between the cold water and the entering air wet bulb is the approach. The thermal capability of cooling towers for air-conditioning is usually stated in terms of nominal refrigeration tonnage based on heat rejection of 15,000 Btu/hr per ton (1.25 kW/kW) and a flow rate of water of 3 gpm per ton (0.054 L/s per kW) with the water cooled from 95 to 85 F (35 to 29 C) at 78 F (26 C) wet bulb temperature. The performance of a cooling tower for an air-conditioning system is shown in Fig. 13-7. The presentation contains all the variables required to define the thermal capability of the tower and therefore can be used to evaluate tower performance. The tower of Fig. 13-7 is rated at the standard condition of 10 F (5.6 C) cooling range, 7 F (3.9 C) approach, and 3 gpm per ton[0.054 L/(s-kW)]. Each curve of Fig. 13-7 is often given as a family of curves with variable cooling range to allow a more comprehensive evaluation. To simplify the figure, only three curves for one fixed cooling range are used here, with a different flow rate for each. 1

Welcome message from author
This document is posted to help you gain knowledge. Please leave a comment to let me know what you think about it! Share it to your friends and learn new things together.
Transcript
5.8 Cooling Towers
1. Cooling TowersThe function of the cooling tower is to reject heat to the
atmosphere by reducing the temperature of water circulates throughcondenser or other heat-rejection equipment. For this reason thestate of the air and its path on the psychrometric chart are oflittle interest.
Counterflow mechanical draft tower are commonly found in air-conditioning applications. The main advantage of counterflow is itsadaptability to limited space. The thermal capability of any coolingtower can be defined by the following parameters:
a. Entering and leaving water temperatureb. Entering air wet bulb temperaturec. Water flow rate
The difference between the entering and leaving water temperature isthe cooling range, while the difference in temperature between thecold water and the entering air wet bulb is the approach. Thethermal capability of cooling towers for air-conditioning is usuallystated in terms of nominal refrigeration tonnage based on heatrejection of 15,000 Btu/hr per ton (1.25 kW/kW) and a flow rate ofwater of 3 gpm per ton (0.054 L/s per kW) with the water cooled from95 to 85 F (35 to 29 C) at 78 F (26 C) wet bulb temperature.
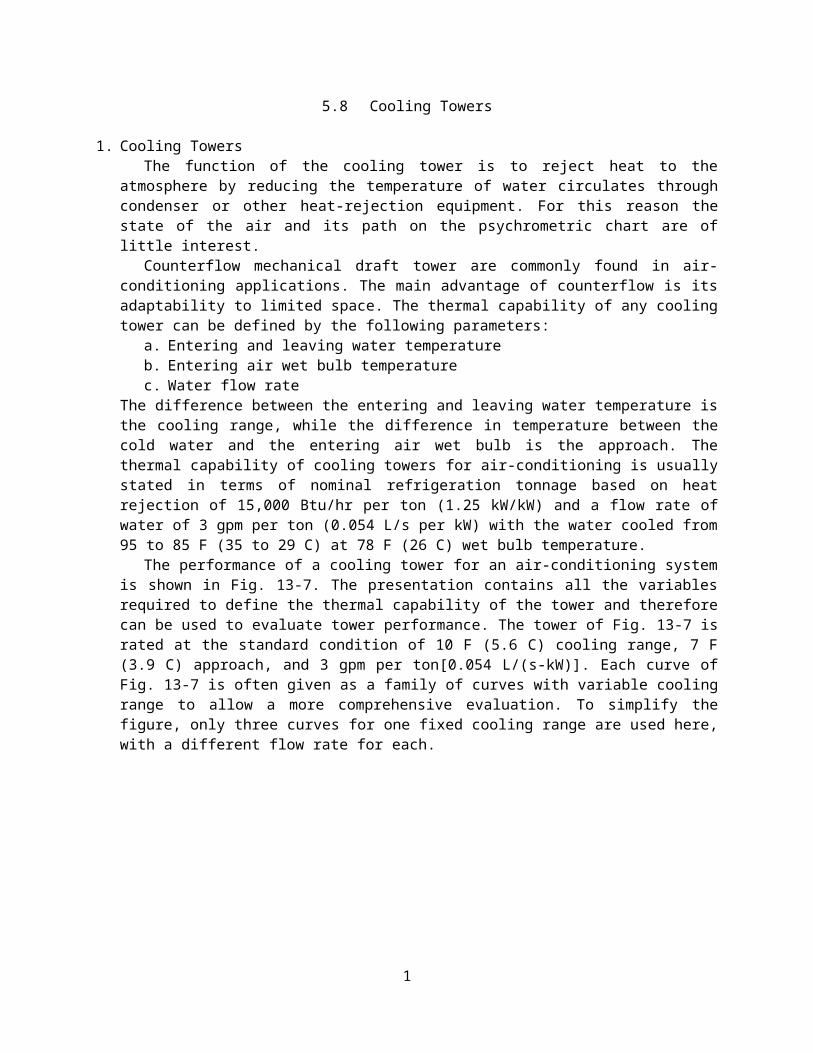
The performance of a cooling tower for an air-conditioning systemis shown in Fig. 13-7. The presentation contains all the variablesrequired to define the thermal capability of the tower and thereforecan be used to evaluate tower performance. The tower of Fig. 13-7 israted at the standard condition of 10 F (5.6 C) cooling range, 7 F(3.9 C) approach, and 3 gpm per ton[0.054 L/(s-kW)]. Each curve ofFig. 13-7 is often given as a family of curves with variable coolingrange to allow a more comprehensive evaluation. To simplify thefigure, only three curves for one fixed cooling range are used here,with a different flow rate for each.
1
An approximate theoretical analysis can be carried out usingEquation (1) for the total energy total energy transfer to the air:
Gadi=Glcldtl=hdam (hi−h)dL (1)To avoid consideration of the interfacial conditions, an overall
coefficient Ui is adopted that relates the driving potential to theenthalpy hl at the bulk water temperature tl. Equation (1) thenbecomes
Gadi=Glcldtl=Uiam (hi−h)dL (2)and when Equation (2) is integrated,
UiamLGlcl
=∫dtlhi−h (3)
Nowml=GlAc and V=AcL
ThenN=
UiamVmlcl
=∫dtlhi−h (4)
where:N = number of transfer units, NTUUi = overall mass-transfer coefficient between the water and air,lbm/(hr-ft2) or kg/(s-m2)Am = mass-transfer surface area per unit volume associated with Ui,ft2/ft3 or m2/m3
2
V = total cooling tower volume, ft3 or m3
ml = mass flow rate of water through the tower, lbm/hr or kg/scl = specific heat of the water, Btu/(lbm-F) or kJ/(kg-C)tl = water temperature at a particular location in the tower, F or Chl = enthalpy of saturated moist air at tl, Btu/lbm or kJ/kgh = enthalpy of the moist air at temperature t, Btu/lbm or kJ/kg
The left-hand side of Equation (4) is a measure of the coolingtower size and has the familiar form of the NTU parameter used inheat-exchanger design.Equation (4) cannot be integrated in a straightforward
mathematical way, however, step-by-step approach can be used.
Example No. 1Water is to be cooled from 100 to 85 F in a counterflow coolingtower when the outside air has a 75 F wet bulb temperature. Thewater-to-air flow ratio (ml/ma) is 1.0. Calculate the transfer unitsas defined by Equation (4).Given:Water from 100 F to 85 FOutside air wet bulb = 75 FRequired:Number of transfer units = NTUSolution:Figure 13-8 is the cooling diagram for the given conditions. As thewater is cooled from tl1 to tl2, the enthalpy of the saturated air hl
follows the saturation curve from A to B. The air entering at wetbulb temperature twb1 has enthalpy h1. (This assumes that the airenthalpy is only a function of wet bulb temperature.) The leavingwater temperature tl2 and the enthalpy h1 define point C, and theinitial driving potential is represented by the distance BC. Theenthalpy increase of the air is a straight-line of the air operatingline CD is therefore clml/ma.
3

Point C represents the air condition at the inlet, and point Drepresents the air conditions leaving the tower. Note that thedriving potential gradually increases from the bottom to the top ofthe tower. Counterflow integration calculations start at the bottomof the tower where the air condition are known. Evaluation of theintegral of Equation (4) may be carried out by plotting tl versus1/(hl – h); however, another method will be used here. The step-by-step procedure is shown in Table 13-1.Water temperatures are listedin column 1 in increments of one or two degrees. Smaller incrementswill give greater accuracy. The film enthalpies shown in column 2are the enthalpy of saturated air at the water temperatures. Column3 shows the air enthalpy, which is determined from Equation (5):
4

Δh=cl mlma
Δtl(5)
where the initial air enthalpy hi is 38.5 Btu/lbma, cl = 1.0Btu/(lbmw-F), ml/ma = 1.0, and Dt is read in column 1 of Table 13-1.The data of column 4 and 5 are obtained from columns 2 and 3. Column6 is the average of two steps from column 5 multiplied by the watertemperature increment (column 1) for the same step. The number oftransfer units is then given in column 7 as the summation of column6. Column 8 gives the temperature range over which the water hasbeen cooled. The last entry in column 7 is the number of transferunits required for this problem.
Table 13-1 Counterflow Cooling Tower Integrating Calculations1 2 3 4 5 6 7 8
WaterTemperature tl, F
Enthalpy ofFilm,
hl,,Btu/lbma
Enthalpy ofAir,h,
Btu/lbma
Enthalpy
Difference, hl
– h,Btu/lbm
a
Reciprocal ofEnthalp
yDifference,1
(hl−h ) ,lbma/Bt
u
Average,
Δtlhl−h ,F-
lbma/Btu
Summation,
∑Δtlhl−h ,
F-lbma/Btu
Cooling
Range,F
85 49.4 338.5 10.9 0.09170.0905 0.0905 1
86 50.7 39.5 11.2 0.08930.1748 0.2653 3
88 53.2 41.5 11.7 0.08550.1661 0.4314 5
90 55.9 43.5 12.4 0.08060.1558 0.5872 7
92 58.8 45.5 13.3 0.07520.1451 0.7323 9
94 61.8 47.5 14.3 0.06990.1348 0.8671 11
96 64.9 49.5 15.4 0.06490.1248 0.9919 13
98 68.2 51.5 16.7 0.05990.1148 1.1067 15
100 71.7 53.5 18.2 0.0549
5
It is evident from Table 13-1 that either an increase in thecooling range or a decrease in the leaving water temperature willincrease the number of transfer units. These two factors are quiteimportant in cooling tower design. The heat exchangers with whichthe cooling tower is connected should be designed with the coolingtower in mind. It may be more economical to enlarge the heatexchangers and/or increase the flow rate of the water than toincrease the size of the cooling tower.
To continue the problem of tower design, we need information onthe overall mass-coefficient per unit volume, Uiam. There is littletheory to predict this coefficient; therefore, we must rely onexperiments. After many tests have been made on towers of a similartype, it is possible to predict Uiam with reasonable accuracy.
Then the volume of the tower required for a given set ofconditions is given by
V=NmlclUiam (6)
where N is the number of transfer units given by Equation (5). Thecross-sectional area of the tower is defined by
Ac=maGa
=mlGl (7)
and the height of the tower is given byL=
VAc (8)
Example No. 2Suppose the cooling tower of Example No. 1 must handle 1000 gpm ofwater. It has been determined that an air mass velocity of 1500lbma/(hr-ft2) is acceptable without excessive water carry-over(drift). The overall mass-transfer coefficient per unit volume Uiam
is estimated to be 120 lbm/(hr-ft3) for the type of tower to beused. Estimate the tower dimensions for the required duty.Given:Result of Example No. 1Flow rate = 1000 gpmAir mass velocity = 1500 lbma/(hr-ft2)Uiam is 120 lbm/(hr-ft3)Solution:The transfer units N required for the tower were found to be 1.1067in Example No. 1. Then the total volume of the tower is given byEquation (6) as
6
V=1.1067 (1000) (8.33 ) (60) (1.0)120
=4609 ft3
The cross-sectional area of the tower may be determined fromEquation (7) using the mass velocity of the air and the water-to-airration:
Ac=maGa
=( maml )(mlGa)=(1.0 )
mlGa
Ac=1000 (8.33) (60)1500
=333 ft2
which is equivalent to an 18 x 18 cross section. Then from Equation(8)
L=VAc
=4609333
=13.8 ft
2. Catalog DataFor many HVAC applications, factory-assembled cooling towers are
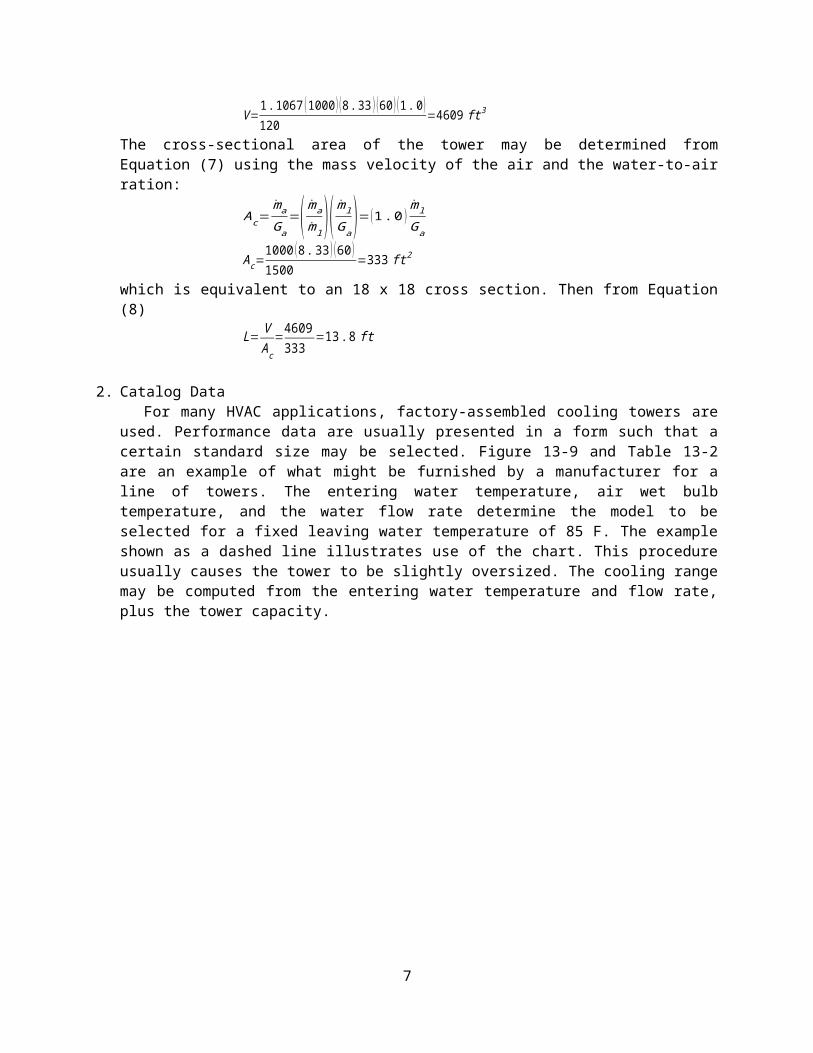
used. Performance data are usually presented in a form such that acertain standard size may be selected. Figure 13-9 and Table 13-2are an example of what might be furnished by a manufacturer for aline of towers. The entering water temperature, air wet bulbtemperature, and the water flow rate determine the model to beselected for a fixed leaving water temperature of 85 F. The exampleshown as a dashed line illustrates use of the chart. This procedureusually causes the tower to be slightly oversized. The cooling rangemay be computed from the entering water temperature and flow rate,plus the tower capacity.
7
8

In Table 13-2 the nominal rating in tons refers to a typicalrefrigeration system with which the cooling tower may be used andincludes the heat transferred to the evaporator plus the power tothe compressor, about 15,000 Btu/hr per refrigeration ton.
Example No. 3Select a cooling tower using Fig. 13-9 and Table 13-2 for theconditions of Examples 1 and 2. Compute the cooling range, approach,and heat-transfer rate.Given:Results of Examples No. 1 and 2.Required:Cooling range, approach, and heat-transfer rate.Solution:The entering water temperature and air wet bulb temperature are 100F and 75 F, respectively, with a water flow rate of 1000 gpm.Referring to Fig. 13-9, a model L would be the obvious choice (ortwo model G). With a cooling range of 15 F the tower capacity is
q=mwcpwΔtr=500 gpm×Δtq=500 (1000 ) (15)=7.5×10⁶ Btu /hr
of about 500 tons (Table 13-2).Suppose that the heat exchangers (condensers) in the circuit
could be changed so that the water would enter the tower at 103 Fwith a flow rate of 835 gpm. This is still the same duty of about7.5 x 106 Btu/hr. Referring back to Fig. 13-9, a model K tower fitsthis situation. The cooling range is
tl1−tl2=103−85=18 Fand the approach is
tl2−twb1=85−78=10 FThe reader is referred to the HVAC Systems and Equipment Volume
of the ASHRAE Handbook, which has a great deal of information oncooling tower performance and selection.
- End -
9
Related Documents