5.2A TOTAL LIGHTNING AS AN INDICATOR OF MESOCYCLONE BEHAVIOR Sarah M. Stough 1 , Lawrence D. Carey 1 , and Christopher J. Schultz 1,2 * 1 Department of Atmospheric Science, University of Alabama in Huntsville, Huntsville, AL, USA 2 Earth Science Office, NASA Marshall Space Flight Center, Huntsville, AL, USA 1. INTRODUCTION With the increasing availability of total (i.e., in- cloud and cloud-to-ground) lightning data, many studies have documented the relationship between total lightning activity and severe weather (e.g., Williams et al. 1999; Goodman et al. 2005; Steiger et al. 2007; Montanya et al. 2009; Schultz et al. 2009; Darden et al. 2010; Gatlin and Goodman 2010; Pineda et al. 2011; Schultz et al. 2011). This relationship has recently been explored further through the framework of the lightning jump, which is characterized by a definable rapid increase in lightning flash rate (Schultz et al. 2009; Gatlin and Goodman 2010; Schultz et al. 2011). From related research, it has been found that rapid increases in total lightning flash rate, or lightning jumps, often precede instances of severe phenomena at the ground. These results indicate that lightning data may possess some operational utility in providing increased confidence in warning decisions given added awareness of storm characteristics, resulting in increased warning lead time. In order to maximize the capabilities of total lightning data for nowcasting severe storms, its fusion with proven tools has become a major goal in the research and operational communities. This is also driven by anticipated widespread total lightning detection capabilities afforded by the Geostationary Operational Environmental Satellite Series R (GOES-R) Geostationary Lightning Mapper (Goodman et al. 2013). As such, this study lays some of the conceptual groundwork for fusing radar with total lightning on a national level into a multi-sensor algorithm for severe weather detection and forecasting. The premise for such an algorithm is based upon the microphysical and kinematic connection between storm electrification and dynamics. In particular, the updraft plays a pivotal role in both charge separation leading to flash initiation and mesocyclogenesis. The primary means for cloud electrification is thought to be the rebounding collisions between graupel and ice crystals in the presence of supercooled water, or so-called non- inductive charging (NIC) (Takahashi 1978). NIC at the particle scale is followed by storm scale charge separation due to differences in particle fall speeds and the action of a vigorous updraft. The low-to-mid-level updraft that is responsible for cloud electrification via NIC and ultimately flash production could also contribute to the tilting of environmental horizontal vorticity into the vertical, the subsequent stretching of this vertical vorticity, and the development and intensification of a mesocyclone (Rakov and Uman 2003; Lemon and Doswell 1979). A quasi-steady, rotating updraft, or mesocyclone, extending through the depth of a storm is often the primary indicator in the initial diagnosis of a severe supercell storm. Although only roughly 26% of mesocyclones have been found to be associated with tornadoes, approximately 90% of all mesocyclones are associated with severe phenomena (Stumpf et al. 1998; Trapp et al. 2005). Despite this knowledge, challenges remain in nowcasting severe weather that include correctly identifying and diagnosing the first severe storm of the day as well as providing advanced warning on the first tornado of the day (Brotzge and Ericksen 2009; Brotzge and Donner 2013). The work here explores the temporal relationship between enhanced supercell rotation and intensification of lightning activity objectively identified by the Schultz et al. (2009; 2011) two- sigma lightning jump. Using National Weather Service (NWS) Weather Surveillance Radar – 1988 Doppler (WSR-88D) and Lightning Mapping Array (LMA) data, an initial investigation of supercell thunderstorms is conducted to determine how lightning coupled with radar may give earlier indication of updraft strength to improve situational awareness, increase warning lead time, or potentially “tip the scales” between severe versus tornado warnings given a priori environmental knowledge. Section 2 provides additional information about the datasets used, while Section 3 details analysis methods. Results and interpretation are provided in Section 4 with concluding remarks and future work outlined in Section 5. 1 * Corresponding author address: Sarah M. Stough, Univ. of Alabama in Huntsville, Earth System Science Center, Huntsville, AL 35805-1912; e-mail: [email protected]

Welcome message from author
This document is posted to help you gain knowledge. Please leave a comment to let me know what you think about it! Share it to your friends and learn new things together.
Transcript

5.2A TOTAL LIGHTNING AS AN INDICATOR OF MESOCYCLONE BEHAVIOR !Sarah M. Stough 1, Lawrence D. Carey1, and Christopher J. Schultz1,2 * !
1Department of Atmospheric Science, University of Alabama in Huntsville, Huntsville, AL, USA 2Earth Science Office, NASA Marshall Space Flight Center, Huntsville, AL, USA !!
1. INTRODUCTION !With the increasing availability of total (i.e., in-
cloud and cloud-to-ground) lightning data, many studies have documented the relationship between total lightning activity and severe weather (e.g., Williams et al. 1999; Goodman et al. 2005; Steiger et al. 2007; Montanya et al. 2009; Schultz et al. 2009; Darden et al. 2010; Gatlin and Goodman 2010; Pineda et al. 2011; Schultz et al. 2011). This relationship has recently been explored further through the framework of the lightning jump, which is characterized by a definable rapid increase in lightning flash rate (Schultz et al. 2009; Gatlin and Goodman 2010; Schultz et al. 2011). From related research, it has been found that rapid increases in total lightning flash rate, or lightning jumps, often precede instances of severe phenomena at the ground. These results indicate that lightning data may possess some operational utility in providing increased confidence in warning decisions given added awareness of storm characteristics, resulting in increased warning lead time.
In order to maximize the capabilities of total lightning data for nowcasting severe storms, its fusion with proven tools has become a major goal in the research and operational communities. This is also driven by anticipated widespread total lightning detection capabilities afforded by the Geostationary Operational Environmental Satellite Series R (GOES-R) Geostationary Lightning Mapper (Goodman et al. 2013). As such, this study lays some of the conceptual groundwork for fusing radar with total lightning on a national level into a multi-sensor algorithm for severe weather detection and forecasting.
The premise for such an algorithm is based upon the microphysical and kinematic connection between storm electrification and dynamics. In particular, the updraft plays a pivotal role in both charge separation leading to flash initiation and mesocyclogenesis. The primary means for cloud electrification is thought to be the rebounding collisions between graupel and ice crystals in the presence of supercooled water, or so-called non-inductive charging (NIC) (Takahashi 1978). NIC at
the particle scale is followed by storm scale charge separation due to differences in particle fall speeds and the action of a vigorous updraft. The low-to-mid-level updraft that is responsible for cloud electrification via NIC and ultimately flash production could also contribute to the tilting of environmental horizontal vorticity into the vertical, the subsequent stretching of this vertical vorticity, and the development and intensification of a mesocyclone (Rakov and Uman 2003; Lemon and Doswell 1979).
A quas i -s teady, ro ta t ing updra f t , o r mesocyclone, extending through the depth of a storm is often the primary indicator in the initial diagnosis of a severe supercell storm. Although only roughly 26% of mesocyclones have been found to be associated with tornadoes, approximately 90% of all mesocyclones are associated with severe phenomena (Stumpf et al. 1998; Trapp et al. 2005). Despite this knowledge, challenges remain in nowcasting severe weather that include correctly identifying and diagnosing the first severe storm of the day as well as providing advanced warning on the first tornado of the day (Brotzge and Ericksen 2009; Brotzge and Donner 2013).
The work here explores the temporal relationship between enhanced supercell rotation and intensification of lightning activity objectively identified by the Schultz et al. (2009; 2011) two-sigma lightning jump. Using National Weather Service (NWS) Weather Surveillance Radar – 1988 Doppler (WSR-88D) and Lightning Mapping Array (LMA) data, an initial investigation of supercell thunderstorms is conducted to determine how lightning coupled with radar may give earlier indication of updraft strength to improve situational awareness, increase warning lead time, or potentially “tip the scales” between severe versus tornado warnings given a priori environmental knowledge. Section 2 provides additional information about the datasets used, while Section 3 details analysis methods. Results and interpretation are provided in Section 4 with concluding remarks and future work outlined in Section 5. !
!1
* Corresponding author address: Sarah M. Stough, Univ. of Alabama in Huntsville, Earth System Science Center, Huntsville, AL 35805-1912; e-mail: [email protected]
!

2. DATA !The primary data sources for this study
include total lightning data from local LMA networks as well as archived Level II and Level III data from several S-band WSR-88D radars in the Next Generation Weather Radar (NEXRAD) network available from the National Oceanic and Atmospheric Administration (NOAA) National Climatic Data Center (NCDC). These data were collected from the North Alabama and Central Oklahoma regions for three separate storm case studies. !2.1 Lightning Data !
Data from the North Alabama Lightning Mapping Array (NALMA) and the Oklahoma Lightning Mapping Array (OKLMA) were used in this study (Goodman et al. 2005; MacGorman et al. 2008). LMAs are small-scale networks that measure the time of arrival (TOA) of very high frequency (VHF) radio waves emitted by lightning discharges. These networks are capable of detecting individual point VHF radiation sources associated with electrical breakdown, such that they can be mapped in two or three dimensions to represent individual stepped leaders of a flash. To reconstruct a lightning flash, an algorithm is used to cluster the sources by time and location proximity factors into groups comprising the flash. Here, a flash clustering algorithm similar to that described in McCaul et al. (2005) is used. In general, LMA stations typically record the time and magnitude of the peak radiation emitted from lightning in intervals of 80 µs, in a local unused television channel (e.g., at about 80 MHz for the NALMA). These measurements result in tens to hundreds of recorded source points detected per flash from multiple stations, at least six for better spatiotemporal resolution, whose time recordings and stationary positions are used to locate the emittance time and location of each source in a flash. For each source point, a chi2 statistic is calculated revealing a goodness of fit and quality of the data. Together, all of these points can provide mapped sources with horizontal (vertical) location errors of less than 500 m (1000 m) within a range of 100 km of the network (Koshak et al. 2004). Outside of this network range, however, measurements have been determined to decrease in location accuracy, particularly for height calculations (Koshak et al. 2004). !2.2 Radar Data
Storms selected for this study were analyzed and interrogated based upon both radar reflectivity
factor characteristics and Doppler velocity calculations from several S-band radars in the WSR-88D network. Crum and Alberty (1993) explain the benefits and limitations of the original NEXRAD network, which has since been upgraded to dual-polarization capabilities. Reflectivity was generally used in each case to a s s e s s s t o r m s t r u c t u r e f o r s u p e r c e l l characteristics. Meanwhile, Doppler velocity data were analyzed for qualities of storm-scale rotation and the presence of a mesocyclone.
In addition to the Level II digital level base data of reflectivity and Doppler velocity, two of the output product datasets from the Level III Radar Product Generator (RPG) were also used. The NOAA National Severe Storms Laboratory (NSSL) Digital Mesocyclone Detection Algorithm (MDA) and Tornado Detection Algorithm (TDA), referred to in the data by product codes “NMD” and “TVS”, respectively, were chosen so that an objective definition and time history of storm rotation would be available for analysis (Mitchell et al. 1998; Stumpf et al. 1998). While both algorithms rely upon spatial Doppler velocity constraints for identification, the MDA additionally requires persistent identification through time of rotation defined by different horizontal spatial requirements and more detailed vertical spatial constraints than the TDA. The TDA product is described in detail in Mitchell et al. (1998), while the MDA is documented by Stumpf et al. (1998). Only the presence of a tornado vortex signature (TVS) from the TDA output, or lack thereof, was considered in this study; however, the mesocyclone strength index (MSI) attribute from the NMD output was chosen as an analysis parameter. This attribute takes into account vertically integrated strength ranks of rotation computed and thresholded based on gate-to-gate Doppler velocity difference and shear (Stumpf et al. 1998). !3. METHODS !
Three supercell storms were analyzed for lightning flash rate and storm-scale rotation characteristics. While the NMD and TVS data were already in the form of post-processed algorithm output, associating lightning flashes with storms, calculating lightning jumps, and determining a proxy for mesocyclone presence, persistence, and strength in Doppler velocity data required data manipulation before combined analysis. For the process of associating lightning flashes with particular storms and conversion of Doppler velocity data into layered azimuthal shear fields, the Warning Decision Support System - Integrated Information (WDSS-II) was used (Lakshmanan et al. 2007). After identifying the total lightning
!2

flashes associated with each storm through time, the Schultz et al. (2009) two-sigma lightning jump algorithm was implemented on the flash counts to identify lightning jumps in each storm. !3.1 Lightning Association and Jump Computation !
Lightning mapping arrays produce source maps, and resultant flash maps, that cover the entire LMA domain. To determine the flash rate and lightning jump associated with a particular storm, spatiotemporal boundaries must be identified for each storm to isolate its specific flashes. Using the K-Means identification and tracking algorithm described by Lakshmanan et al. (2009, 2010), storm features based on flash extent density (i.e., the number of lightning flashes that pass through an area per minute) computed in WDSS-II from LMA source data were identified and tracked. While flash extent density is exclusively a product of lightning data, it displays similar storm structure in terms of size and shape as radar reflectivity with usually clearer boundaries between storm features. Examples of this may be seen in Fig. 1. The output from the K-Means algorithm includes spatial boundaries based on feature footprints for each storm at two-minute intervals. Flash initiation locations from flashes computed using the McCaul et al. (2005) algorithm that fall within each footprint’s boundary over the previous two-minute period are then said to be associated with that storm.
After lightning flashes have been associated with a particular storm, the Schultz et al. (2009, 2011) two-sigma lightning jump algorithm is applied to determine the presence of a rapid increase in flash rate. It should be noted that this algorithm requires twelve minutes of “spin-up” time so that the first flashes a storm produces are not falsely marked as a lightning jump. When tracking is based on flash extent density, a storm is sometimes flashing before the tracking algorithm detects its presence, and therefore the 12-minute rule truncates the applicable data and legitimate jumps are sometimes missed. In these cases, results of the lightning jump algorithm are also considered when flashes are associated based on tracked reflectivity which often identifies a storm before it becomes electrically active. !3.2 Azimuthal Shear !
In Doppler velocity data, couplets of relative maxima in inbound and outbound radial velocity are often associated with storm mesocyclones. When the couplet is collocated in azimuth rather than radially, the azimuthal derivative of the radial
velocity is referred to as azimuthal shear, which can be used as a proxy for a rotating updraft. Using the WDSS-II Linear Least Squares Derivative (LLSD) algorithm, maps of azimuthal shear through a specified depth can be computed from dealiased radial velocity fields (Miller et al. 2013). These maps were produced from zero to three kilometers and from three to six kilometers as representation of relative low- and mid-level storm rotation. Maximum values of azimuthal shear for each layer were then identified from the region of the storm mesocyclone for each approximate five minute radar scan period. !4. RESULTS AND DISCUSSION !
One tornadic supercell was analyzed from each of the North Alabama/Tennessee Valley and central Oklahoma regions, with a third non-tornadic storm from North Alabama included. For the storms from the North Alabama region, WSR-88D data from the KHTX radar site were primarily utilized as its coverage closely overlaps that of the NALMA and it was closest to the storms of interest for the majority of their existence. For analysis of the storm from Central Oklahoma, radar data from the KTLX site was chosen as it was closest to the storm and the center of the OKLMA. !4.1 10 April 2009 !
The supercell considered on this date originated a few kilometers north of the Alabama/Tennessee state line ahead of a quasi-linear convective system approaching from the west, seen in Fig. 1. It was analyzed between 1702 UTC and 1834 UTC, during which time it propagated to the north/northeast before merging with the convective line. Although it never produced a tornado, it was associated with hail reports of up to 1.75 inches in diameter.
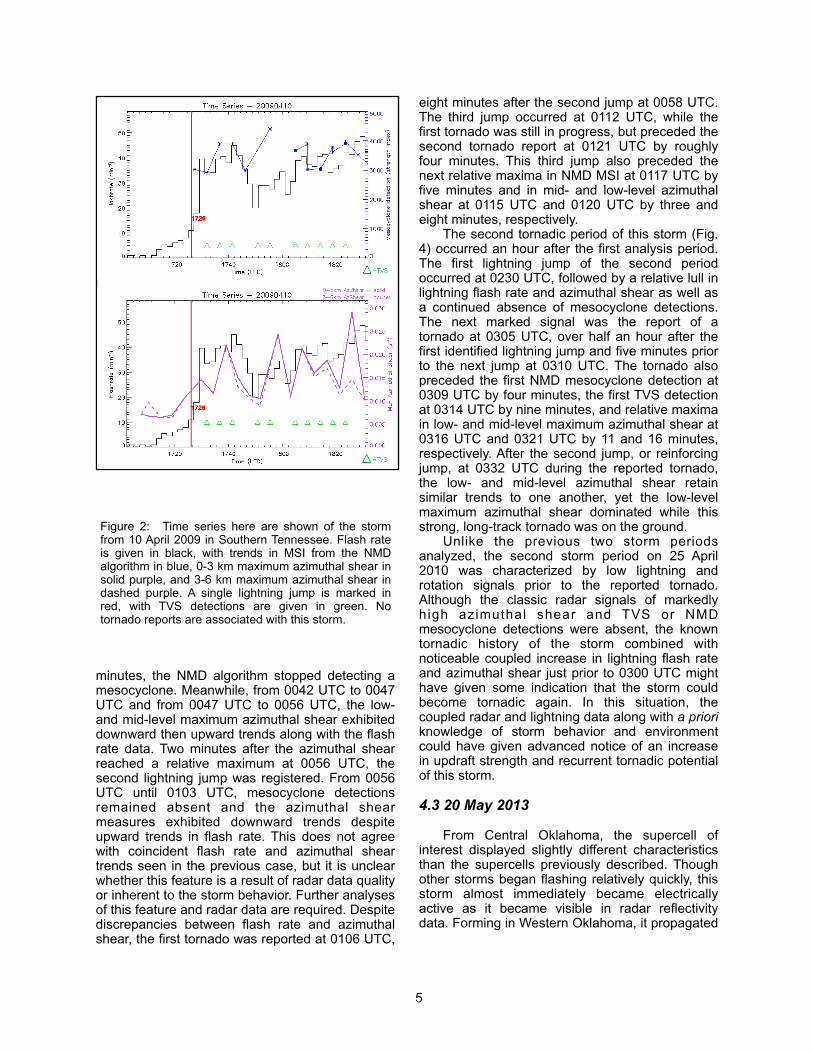
Through the lifetime of the storm, low- and mid-level azimuthal shear trends exhibited nearly similar values as seen in Fig. 2, indicating that the maximum azimuthal shear associated with the storm was typically located near the 3-km level. The NMD MSI roughly mirrored these trends as well. Also, trends in lightning flash rate replicated those of the rotation parameters well, with particularly similar trends between lightning and the layer maximum azimuthal shear values as opposed to the MSI.
At 1726 UTC, the supercell produced its only objectively identified lightning jump, which was followed within ten minutes by the first associated TVS at 1731 UTC a relative maximum in NMD MSI at 1736 UTC. This jump also preceded
!3

coincident maxima in low- and mid-level layer maximum azimuthal shear at 1739 UTC. The first mesocyclone detection at 1727 UTC occurred almost simultaneously with the first lightning jump at 1726 UTC; however, maximum azimuthal shear could be detected in low- and mid-levels 20 minutes prior to the first NMD mesocyclone detection and increased at the same rate as the flash rate.
Although the lightning jump only preceded the NMD mesocyclone by a minute, it occurred several minutes prior to the maxima in rotation parameters. After mesocyclone formation, persistently high flash rates agreed with continued enhanced azimuthal shear and MSI. When the NMD gave only a single detection in the period between 1746 UTC and 1804 UTC, the slight increase in flash rate again coincided with upward trends in maximum azimuthal shear from 1751 UTC to 1758 UTC and preceded the resumed
cont inuous automated detec t ion o f the mesocyclone. !4.2 25 April 2010 !
This isolated supercell developed in West Central Alabama just outside of the 150 km LMA domain (Fig. 3). After crossing into the NALMA domain, it was analyzed over two separate periods lasting from 0028 UTC to 0041 UTC and from 0220 UTC to 0401 UTC to capture different tornadic cycles. The first period encompasses two separate EF1 tornadoes, while the second covers the development of a long track EF3 tornado in eastern Alabama.
During the first tornadic period of the storm, the first lightning jump occurred at 0042 UTC, roughly simultaneously with the first mesocyclone detection (Fig. 3). Following this jump, the MSI remained relatively constant and within 15
!4
Figure 1: Flash extend density and reflectivity at -10ºC at the time the storm was first tracked (1702 UTC), the time of the first lightning jump (1726 UTC), and at the time of the first NMD detection (1728 UTC). The storm of interest is circled in yellow.
minutes, the NMD algorithm stopped detecting a mesocyclone. Meanwhile, from 0042 UTC to 0047 UTC and from 0047 UTC to 0056 UTC, the low- and mid-level maximum azimuthal shear exhibited downward then upward trends along with the flash rate data. Two minutes after the azimuthal shear reached a relative maximum at 0056 UTC, the second lightning jump was registered. From 0056 UTC until 0103 UTC, mesocyclone detections remained absent and the azimuthal shear measures exhibited downward trends despite upward trends in flash rate. This does not agree with coincident flash rate and azimuthal shear trends seen in the previous case, but it is unclear whether this feature is a result of radar data quality or inherent to the storm behavior. Further analyses of this feature and radar data are required. Despite discrepancies between flash rate and azimuthal shear, the first tornado was reported at 0106 UTC,
eight minutes after the second jump at 0058 UTC. The third jump occurred at 0112 UTC, while the first tornado was still in progress, but preceded the second tornado report at 0121 UTC by roughly four minutes. This third jump also preceded the next relative maxima in NMD MSI at 0117 UTC by five minutes and in mid- and low-level azimuthal shear at 0115 UTC and 0120 UTC by three and eight minutes, respectively.
The second tornadic period of this storm (Fig. 4) occurred an hour after the first analysis period. The first lightning jump of the second period occurred at 0230 UTC, followed by a relative lull in lightning flash rate and azimuthal shear as well as a continued absence of mesocyclone detections. The next marked signal was the report of a tornado at 0305 UTC, over half an hour after the first identified lightning jump and five minutes prior to the next jump at 0310 UTC. The tornado also preceded the first NMD mesocyclone detection at 0309 UTC by four minutes, the first TVS detection at 0314 UTC by nine minutes, and relative maxima in low- and mid-level maximum azimuthal shear at 0316 UTC and 0321 UTC by 11 and 16 minutes, respectively. After the second jump, or reinforcing jump, at 0332 UTC during the reported tornado, the low- and mid-level azimuthal shear retain similar trends to one another, yet the low-level maximum azimuthal shear dominated while this strong, long-track tornado was on the ground.
Unlike the previous two storm periods analyzed, the second storm period on 25 April 2010 was characterized by low lightning and rotation signals prior to the reported tornado. Although the classic radar signals of markedly high azimuthal shear and TVS or NMD mesocyclone detections were absent, the known tornadic history of the storm combined with noticeable coupled increase in lightning flash rate and azimuthal shear just prior to 0300 UTC might have given some indication that the storm could become tornadic again. In this situation, the coupled radar and lightning data along with a priori knowledge of storm behavior and environment could have given advanced notice of an increase in updraft strength and recurrent tornadic potential of this storm. !4.3 20 May 2013 !
From Central Oklahoma, the supercell of interest displayed slightly different characteristics than the supercells previously described. Though other storms began flashing relatively quickly, this storm almost immediately became electrically active as it became visible in radar reflectivity data. Forming in Western Oklahoma, it propagated
!5
Figure 2: Time series here are shown of the storm from 10 April 2009 in Southern Tennessee. Flash rate is given in black, with trends in MSI from the NMD algorithm in blue, 0-3 km maximum azimuthal shear in solid purple, and 3-6 km maximum azimuthal shear in dashed purple. A single lightning jump is marked in red, with TVS detections are given in green. No tornado reports are associated with this storm.

to the east/northeast over the next 90 minutes, producing a violent EF5 tornado.
The first lightning jump associated with the storm was objectively identified at 1910 UTC. Because of the explosive growth of this storm, the tracking method based on flash extent density did not develop a long enough history to identify this early lightning jump. The jump was determined using semi-objective storm tracking outlined in Stano et al. (2014), and is visibly obvious in the flash rate data (Fig 5). This first jump occurred six minutes prior to the first NMD mesocyclone detection at 1916 UTC, seen in Fig. 5. Then, a second reinforcing jump at 1926 UTC occurred prior to the noticeable rise of the MSI detected at 1929 UTC; 12 minutes prior to the first TVS detection at 1938 UTC; 10 and 14 minutes prior to relative maxima in mid- and low-level layer maximum azimuthal shear at 1932 UTC and 1940 UTC, respectively; and 30 minutes before the time the tornado was first reported at 1956 UTC. Despite the 30 minute lull between the second jump and the tornado, the lightning flash rate remained unusually high at nearly two flashes per second or greater, peaking around 150 flashes per
minute. Azimuthal shear values also maintained high thresholds at or above 0.02 s-1. While this storm was well-forecast and may have been obviously severe with radar interrogation alone, coupling the total lightning and radar trends may have increased confidence earlier that the storm was increasing in intensity, benefitting warning decisions.
Toward the end of the storm analysis period, which lasted from 1908 UTC to 2050 UTC, there was a noticeable downward trend in azimuthal shear values at low- and mid-levels, while lightning flash rates were markedly low despite the presence of a third jump. From roughly the time of 2014 UTC forward, however, the quality of l ightning data were questionable due to communications issues with the network caused by electrical failure during the time the tornado impacted the OKLMA real-time data network. !5. CONCLUSIONS !
The present study examines three supercell storms in a preliminary evaluation of how trends in lightning flash rate may be related to mesocyclone
!6
Figure 3: Time series here are shown of the first tornadic period of the storm from 25 April 2010 in Central Alabama. Plotting is as given in Figure 2, with the addition of a solid green line representing the duration of two tornadoes reported with this storm.
Figure 4: Time series here are shown of the second tornadic period of the storm from 25 April 2010 in Central Alabama. Plotting is as given in Figures 2 and 4.

and storm rotation evolution. The outcome of this and future work will ultimately contribute to the concept of a fused radar-lightning algorithm for enhanced nowcasting. The parameters used for the lightning and mesocyclone analysis here include total flash rate with the lightning jump as a measure of rapid increase in intensity and enhancement of storm mesocyclones given by NMD MSI and the proxy of layer maximum azimuthal shear.
Recurring elements in this analysis include similar trending in lightning flash rate and low-level layer maximum azimuthal shear, as well as mid-level layer maximum azimuthal shear to a lesser extent. Further, increased lightning activity denoted by a lightning jump often occurred simultaneously or slightly before the first mesocyclone detections given by the NMD, and prior to TVS detections.
Tornadoes reported in this study were not always preceded by a lightning jump or even a mesocyclone detection or TVS. Rather, only a simultaneous uptrend in lightning flash rate and layer maximum azimuthal shear were noted prior
to one tornado report in a supercell with tornadic history. In instances such as this, it is possible that lightning data reinforcing standard radar metrics of rotation with added updraft strength information may increase forecaster confidence in perception of storm severity, especially given prior knowledge of a storm’s behavior and the environment.
It is important to note that lightning is primarily a mid-level process that may not be able to elucidate many complex low-level processes leading to tornadogenesis in supercells. However, lightning can allude to rapid updraft strengthening which can provide a useful estimate of storm severity potential when combined with Doppler radar velocity indications of rotation.
While these preliminary results show that lightning flash rate and mesocyclone behavior trend similarly, possibly as a result of the common factor of the updraft, other parameters should be added to the analysis for better understanding of the physical link and development of integrated radar-lightning nowcasting concepts and methods. Plans for future investigation include temporal study of the storm-modified storm relative helicity evidenced by the evolving differential reflectivity (ZDR) arc signature with respect to lightning flash rate (Kumjian et al. 2008, 2009). Additionally, an examination of other dual-polarization signatures of severe to tornadic storms with respect to lightning, such as the documented link between separation of specific differential phase (KDP) and ZDR and tornadogenesis (Crowe et al. 2012), would help to determine whether there is a definable link between the low- and mid-level processes discussed in part here. Other l ightn ing characteristics, such as the IC to CG ratio, as well as inclusion of a larger sample of more regionally-diverse tornadic and nontornadic storms will offer additional insight into the merit of these early results. !Acknowledgements: The work is supported by NOAA/NASA GOES-R GLM Risk Reduction Research (R3). We thank Dr. Steven Goodman, Senior (Chief) Scientist, GOES-R System Program, for his guidance and support throughout this work. !6. REFERENCES !Brotzge, J., S. Erickson, 2009: NWS Tornado Warnings with Zero or Negative Lead Times. Wea. Forecasting, 24, 140–154. doi: http://dx.doi.org/10.1175/ 2008WAF2007076.1 Brotzge, J., W. Donner, 2013: The Tornado Warning Process: A Review of Current
!7
Figure 5: Time series here are shown storm from 20 May 2013 in Central Oklahoma. Plotting is as given in Figures 2 and 3. Note that the first lightning jump was determined using reflectivity to track the storm feature used for lightning association. Also, lightning data after 2014 UTC should be disregarded as quality was diminished due to tornado impacts to LMA network power and communications.

Research, Challenges, and Opportunities. Bull. Amer. Meteor. Soc., 94, 1715–1733. doi: http://dx.doi.org/10.1175/BAMS- D-12-00147.1 Crowe, C. C., C. J. Schultz, M. Kumjian, L. D. Carey, and W. A. Petersen, 2012: Use of dual- polarization signatures in diagnosing tornadic potential. Electronic J. Operational Meteor., 13, 57-78. Crum, T. D., R. L. Alberty, 1993: The WSR-88D and the WSR-88D Operational Support Facility. Bull. Amer. Meteor. Soc., 74, 1669–1687. Gatlin, P. N., S. J. Goodman, 2010: A Total Lightning Trending Algorithm to Identify Severe Thunderstorms. J. Atmos. Oceanic Technol., 27, 3–22. doi: http://dx.doi.org/ 10.1175/2009JTECHA1286.1 Goodman, S. J., and Coauthors, 2005: The North Alabama Lightning Mapping Array: Recent severe storm observations and future prospects. Atmos. Res., 76, 423–437. Goodman, S. J., R. J. Blakeslee, W. J. Koshak, D.
Mach, J. Bailey, D. Buechler, L. Carey, C. Schultz, M. Bateman, E. McCaul Jr., G. Stano, 2013: The GOES-R Geostationary Lightning Mapper (GLM). Atmos. Res., 125-126, 34-49.
Koshak, W. J., and Coauthors, 2004: North Alabama Lightning Mapping Array (LMA): VHF source retrieval algorithm and error analyses. J. Atmos. Oceanic Technol., 21, 543–558. Kumjian, M. R., A. V. Ryzhkov, 2008: Polarimetric Signatures in Supercell Thunderstorms. J. Appl. Meteor. Climatol., 47, 1940–1961. doi: http:// dx.doi.org/10.1175/2007JAMC1874.1 Kumjian, Matthew R., Alexander V. Ryzhkov, 2009: Storm-Relative Helicity Revealed from Polarimetric Radar Measurements. J. Atmos. Sci., 66, 667–685. doi: http://dx.doi.org/ 10.1175/2008JAS2815.1 Lakshmanan, V., T. Smith, G. J. Stumpf, and K. Hondl, 2007: The warning decision support system—Integrated information. Wea. Forecasting, 22, 596–612. Lakshmanan, V., K. Hondl, and R. Rabin, 2009: An efficient, general-purpose technique for identifying storm cells in geospatial images. J. Ocean. Atmos. Tech., 26, 523-537. doi: http:// dx.doi.org/10.1175/2008JTECHA1153.1 Lakshmanan, V., and T. Smith, 2010: An objective method of evaluating and devising storm tracking algorithms. Wea. and Forecasting, 29, 721-729. doi: http://dx.doi.org/ 10.1175/2009WAF2222330.1 Lemon, L. R., C. A. Doswell, 1979: Severe Thunderstorm Evolution and Mesocyclone Structure as Related to Tornadogenesis. Mon. Wea. Rev., 107, 1184–1197.
MacGorman, D. R., W. David Rust, T. J. Schuur, M. I. Biggerstaff, J. M. Straka, C. L. Ziegler, E. R. Mansell, E. C. Bruning, K. M. Kuhlman, N. R. Lund, N. S. Biermann, C. Payne, L. D. Carey, P. R. Krhebiel, W. Rison, K. B. Eack and W. H . B e a s l e y, 2 0 0 8 : T E L E X T h e Thunderstorm Electrification and Lightning Experiment. Bull. Amer. Meteor. Soc., 89, 997–1013.
McCaul, E. W., J. Bailey, J. Hall, S. J. Goodman, R. Blakeslee, and D. E. Buechler, 2005: A flash clustering algorithm for North Alabama Lightning Mapping Array data. Preprints, Conf. on Meteorological Applications of Lightning Data, San Diego, CA, Amer. Meteor. Soc., 5.2. [Available online at http://ams.confex.com/ams/ Annual2005/techprogram/paper_84373.htm]. Miller, Madison L., Valliappa Lakshmanan, Travis M. Smith, 2013: An Automated Method for Depicting Mesocyclone Paths and Intensities. Wea. Forecasting, 28, 570–585. doi: http://dx.doi.org/10.1175/WAF- D-12-00065.1 Mitchell, E. D., S. V. Vasiloff, G.J. Stumpf, A. Witt, M. D. Eilts, J. T. Johnson, K. W. Thomas, 1998: The National Severe Storms Laboratory Tornado Detection Algorithm. Wea. Forecasting, 13, 352–366. Montanya, J., S. Soula, N. Pineda, O. van der Velde, P. Clapers, G. Sola, J. Bech, and D. Romero (2009), Study of the total lightning activity in a hailstorm, J. Atmos. Res., 91, 430-437. doi:10.1016/j.atmosres.2008.06.008. NOAA National Severe Storms Laboratory, cited 2014: NSSL Research Tools: Oklahoma Lightning Mapping Array. [Available online at: https://www.nssl.noaa.gov/tools/oklma/] Pineda, N., J. Bech, T. Rigo, J. Montanyà. (2011) A Mediterranean nocturnal heavy rainfall and tornadic event. Part II: Total lightning analysis. Atmospheric Research 100:4, 638-648. doi: 10.1016/j.atmosres.2010.10.027. Schultz, C. J., W. A. Petersen, L. D. Carey, 2009: Preliminary Development and Evaluation of Lightning Jump Algorithms for the Real-Time Detection of Severe Weather. J. Appl. Meteor. Climatol., 48, 2543–2563. doi: http://dx.doi.org/ 10.1175/2009JAMC2237.1 Schultz, Christopher J., Walter A. Petersen, Lawrence D. Carey, 2011: Lightning and Severe Weather: A Comparison between Total and Cloud-to-Ground Lightning Trends. Wea. Forecasting, 26, 744–755. doi: http://dx.doi.org/ 10.1175/WAF-D-10-05026.1 Stano, G. T., C. J. Schultz, L. D. Carey, D. R.
MacGorman, and K. C. Calhoun, 2014: Total
!8
lightning observations and tools for the 20 May 2013 Moore, Oklahoma Supercell. J. Operational Meteor., in press.
Steiger, S. M., R. E. Orville, and L. D. Carey, 2007: Total lightning signatures of thunderstorm intensity over north Texas. Part I: Supercells. Mon. Wea. Rev., 135, 3281–3302. doi: http:// dx.doi.org/10.1175/MWR3472.1 Stumpf, G. J., A. Witt, E. D. Mitchell, P. L. Spencer, J. T. Johnson, M. D. Eilts, K. W. Thomas, D. W. Burgess, 1998: The National Severe Storms Laboratory Mesocyclone Detection Algorithm for the WSR-88D*. Wea. Forecasting, 13, 304–326. Takahashi, T., 1978: Riming electrification as a
c h a r g e g e n e r a t i o n m e c h a n i s m i n thunderstorms. J. Atmos. Sci., 35, 1536-1548.
Trapp, R. J., G. J. Stumpf, K. L. Manross, 2005: A Reassessment of the Percentage of Tornadic Mesocyclones. Wea. Forecasting, 20, 680–687. doi: http://dx.doi.org/10.1175/WAF864.1 Uman, V. A., and M. A. Uman, 2003: Lightning: Physics and Effects. Cambridge University Press, 687 pp. Williams, E. R., and Coauthors, 1999: The behavior of total lightning activity in severe Florida thunderstorms. Atmos. Res., 51, 245– 265. !!
!9
Related Documents