5.2 Greenhouse Effect

Welcome message from author
This document is posted to help you gain knowledge. Please leave a comment to let me know what you think about it! Share it to your friends and learn new things together.
Transcript

5.2 Greenhouse Effect
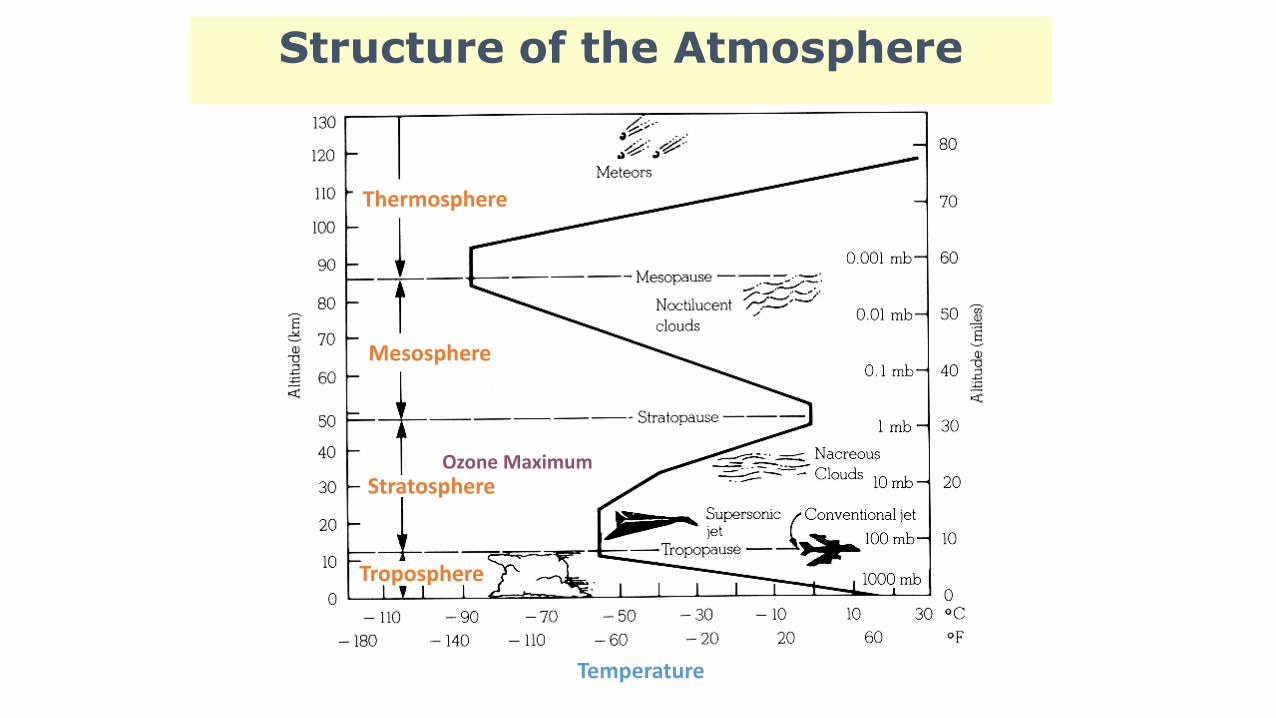
Structure of the Atmosphere
Thermosphere
Mesosphere
Ozone MaximumStratosphere
Troposphere
Temperature
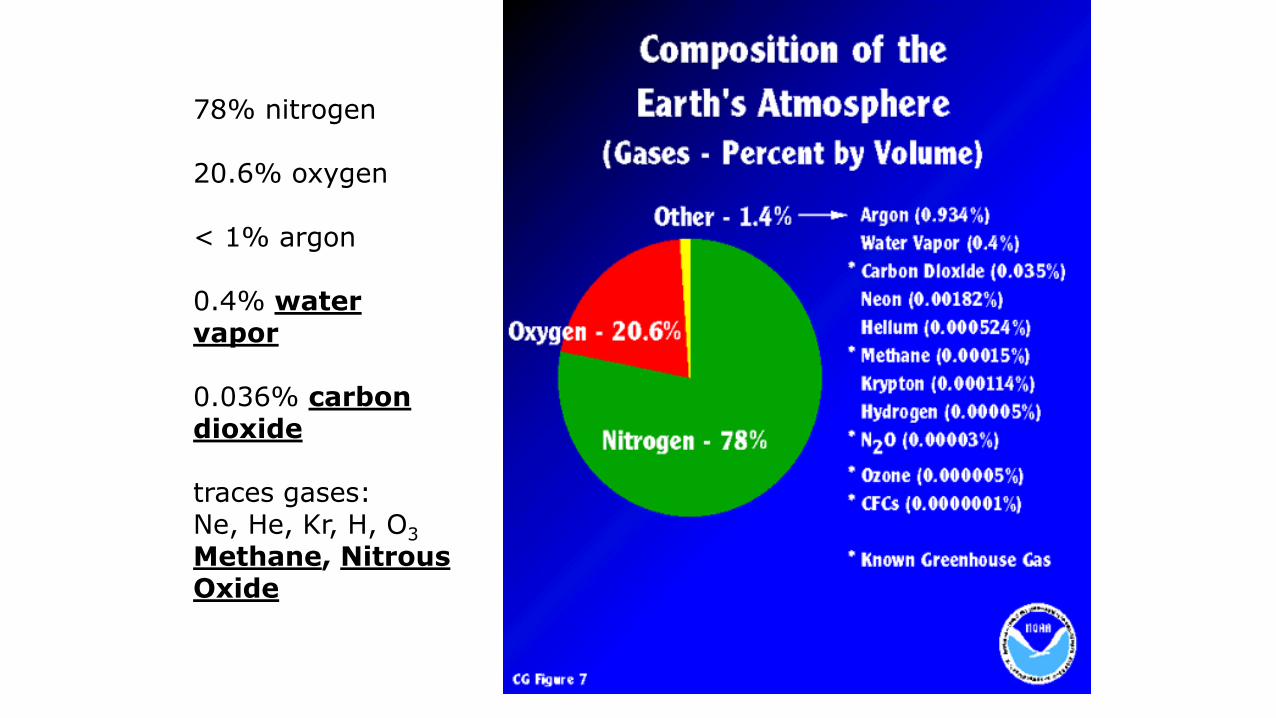
78% nitrogen
20.6% oxygen
< 1% argon
0.4% water vapor
0.036% carbon dioxide
traces gases:Ne, He, Kr, H, O3
Methane, Nitrous Oxide
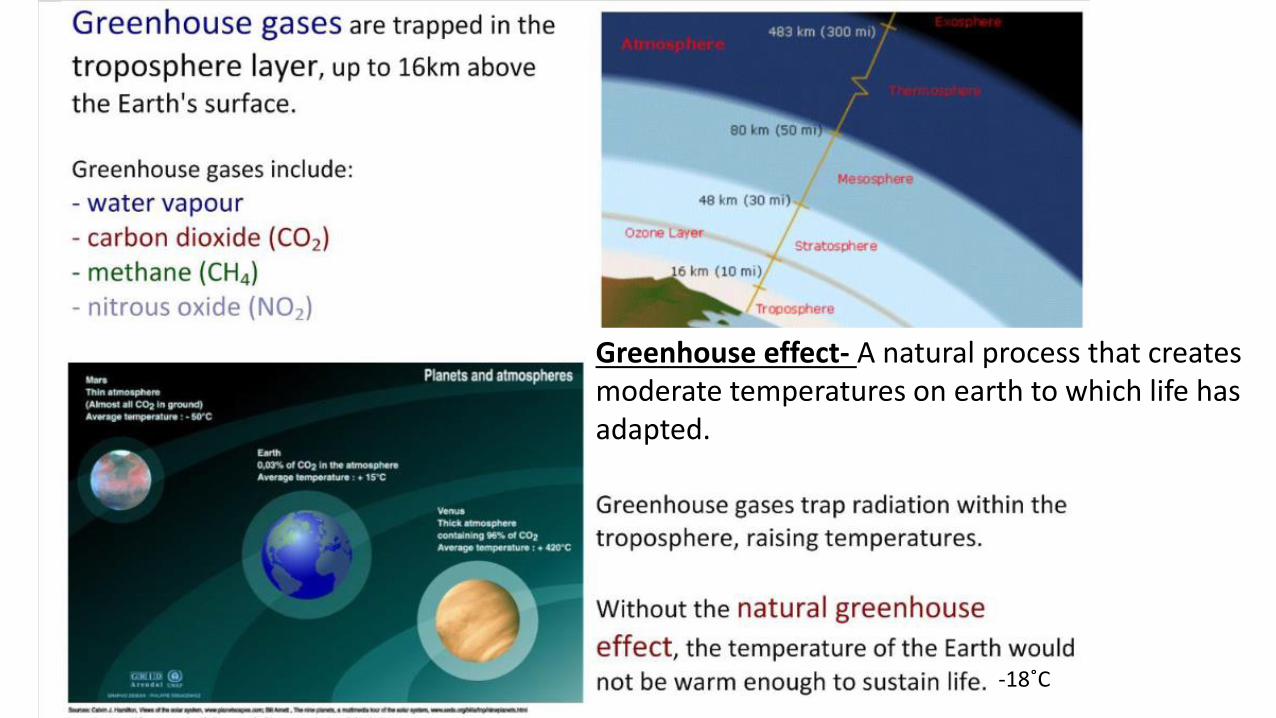
Greenhouse effect- A natural process that creates moderate temperatures on earth to which life has adapted.
-18˚C
Greenhouse Effect & Global Warming
• The “greenhouse effect” & global warming are not the same thing.
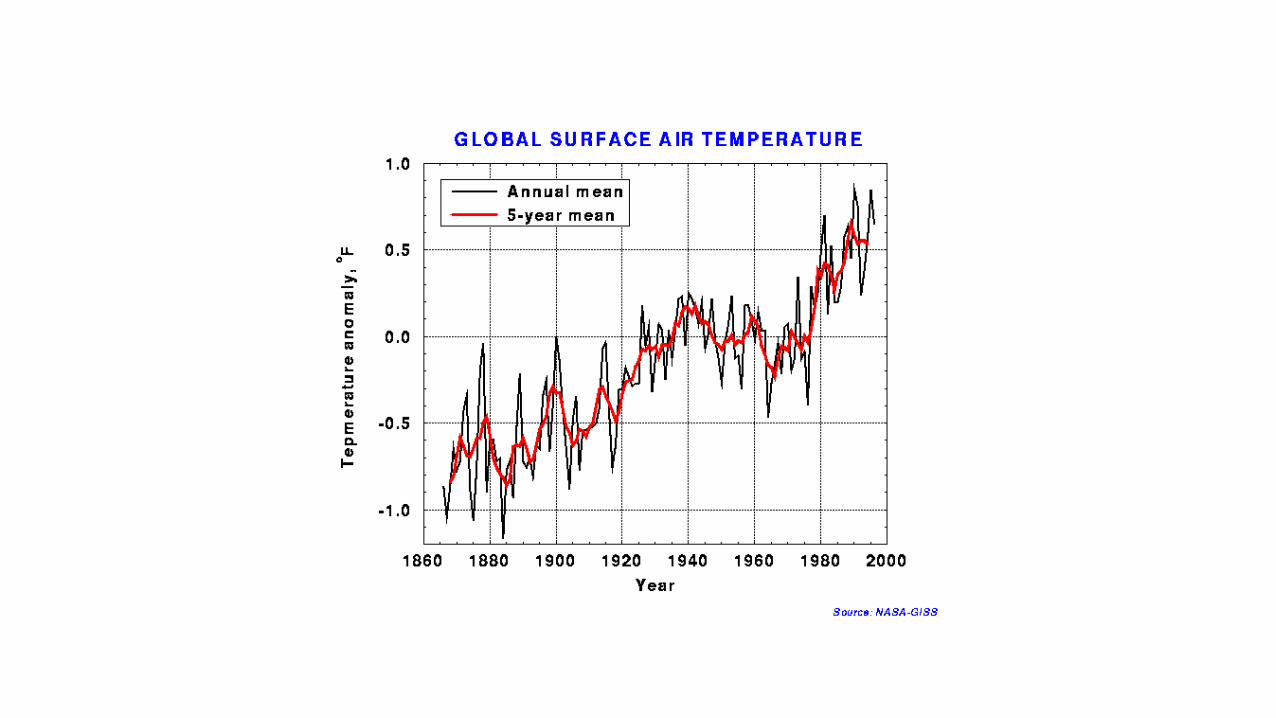
– Global warming refers to a rise in the temperature of the surface of the earth
• An increase in the concentration of greenhouse gases leads to an increase in the magnitude of the greenhouse effect. (Called enhanced greenhouse effect)
– This results in global warming
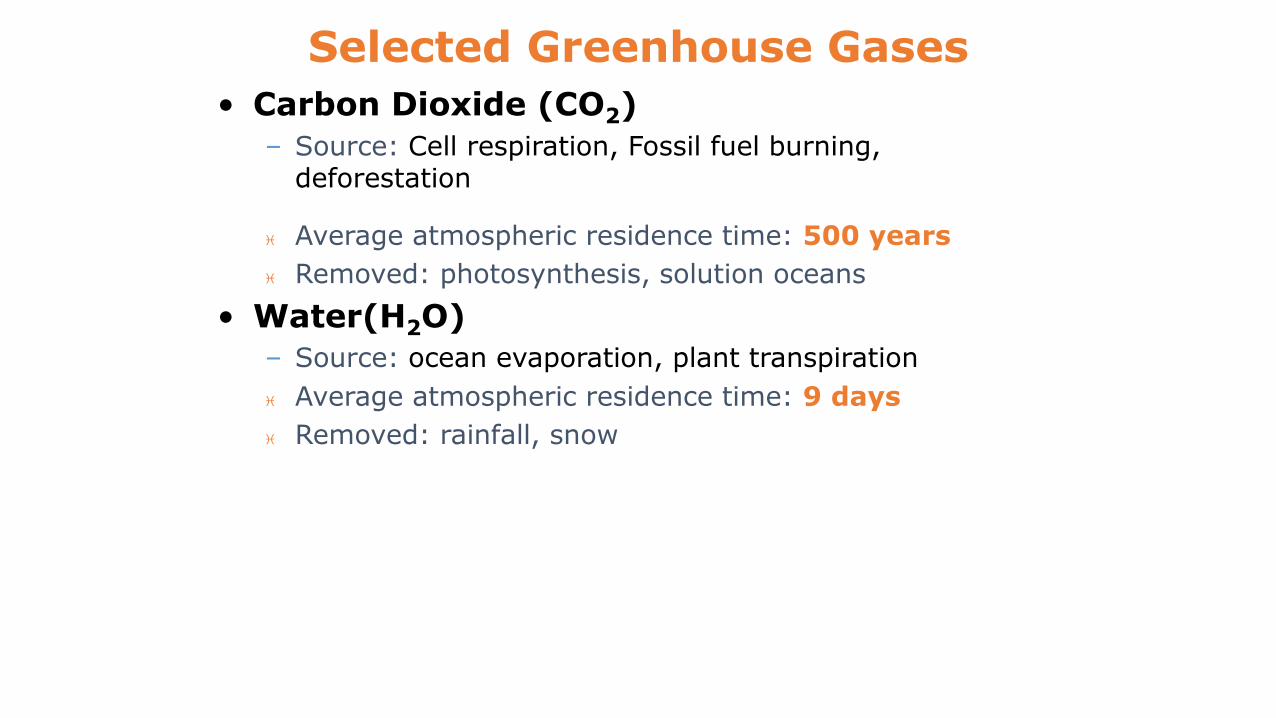
Selected Greenhouse Gases
• Carbon Dioxide (CO2)
– Source: Cell respiration, Fossil fuel burning, deforestation
Average atmospheric residence time: 500 years
Removed: photosynthesis, solution oceans
• Water(H2O)
– Source: ocean evaporation, plant transpiration
Average atmospheric residence time: 9 days
Removed: rainfall, snow
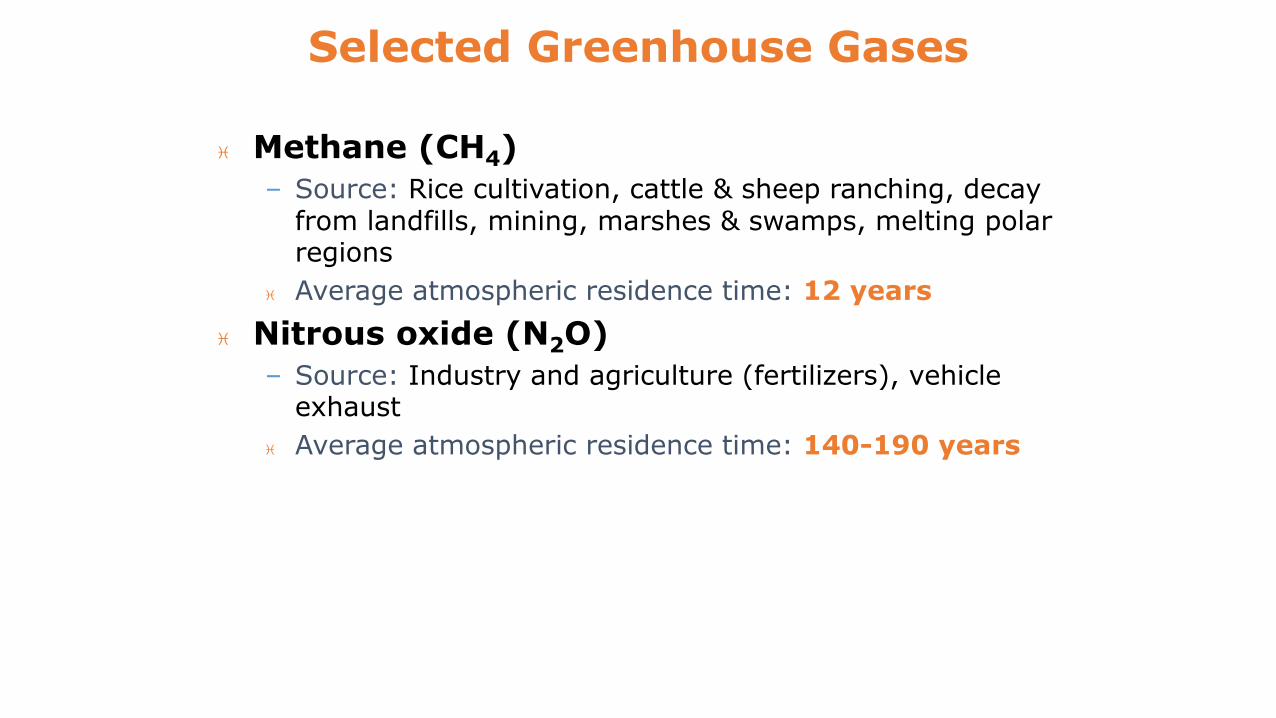
Selected Greenhouse Gases
Methane (CH4)
– Source: Rice cultivation, cattle & sheep ranching, decay from landfills, mining, marshes & swamps, melting polar regions
Average atmospheric residence time: 12 years
Nitrous oxide (N2O)
– Source: Industry and agriculture (fertilizers), vehicle exhaust
Average atmospheric residence time: 140-190 years
Impact of gases
• How readily the gas absorbs long-wave radiation
• Concentration of the gas in atmosphere
Determined by rate of release and stability

70-75%
70-85%Captured
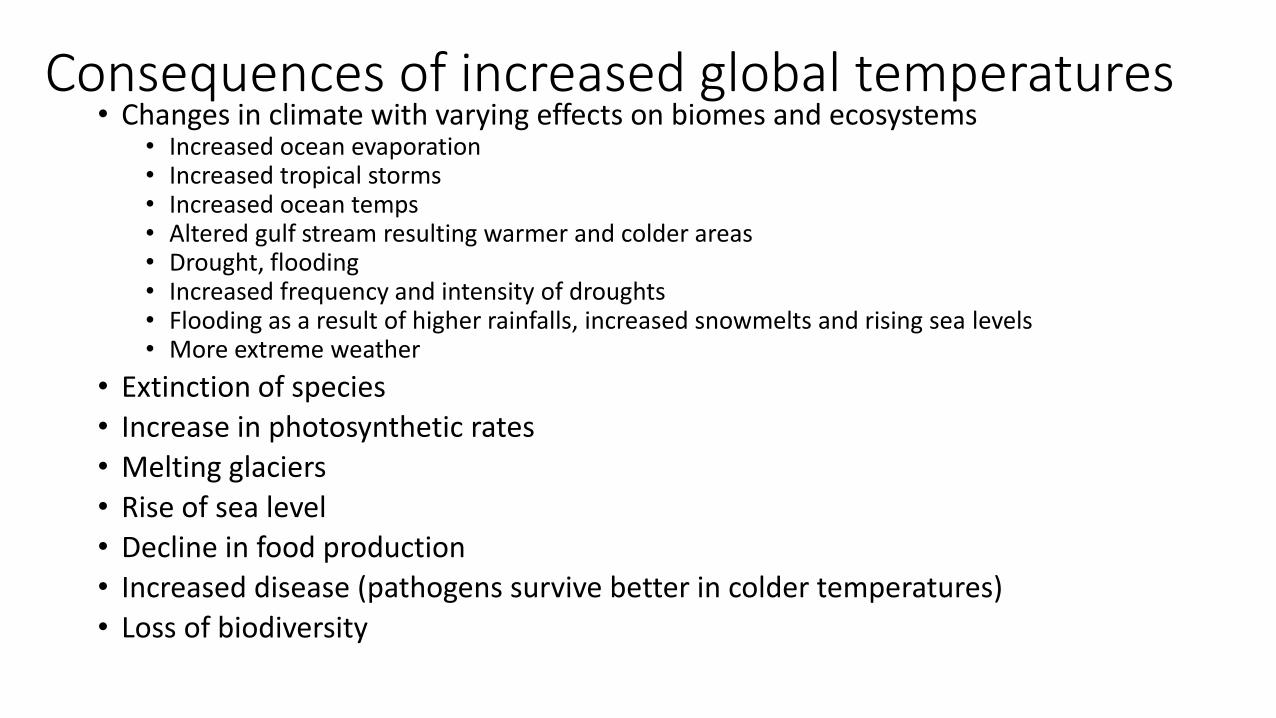
Consequences of increased global temperatures• Changes in climate with varying effects on biomes and ecosystems
• Increased ocean evaporation• Increased tropical storms• Increased ocean temps• Altered gulf stream resulting warmer and colder areas• Drought, flooding• Increased frequency and intensity of droughts• Flooding as a result of higher rainfalls, increased snowmelts and rising sea levels• More extreme weather
• Extinction of species
• Increase in photosynthetic rates
• Melting glaciers
• Rise of sea level
• Decline in food production
• Increased disease (pathogens survive better in colder temperatures)
• Loss of biodiversity
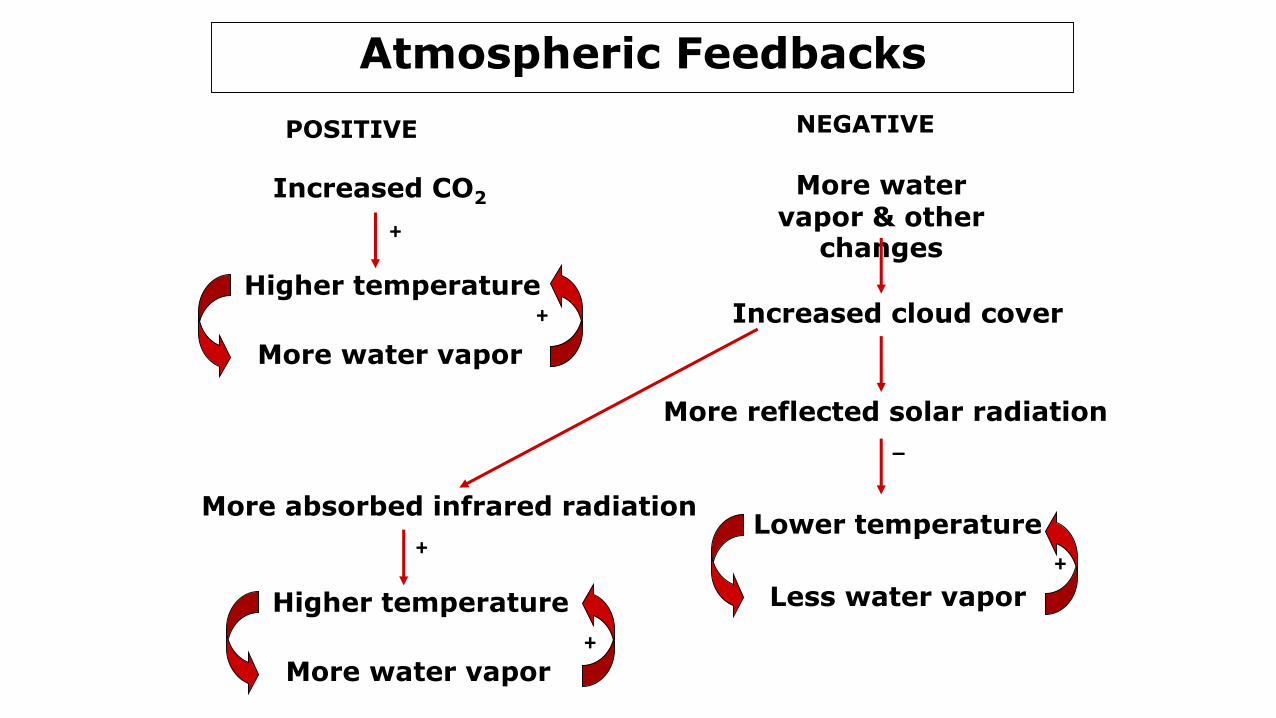
Atmospheric Feedbacks
Increased CO2
Higher temperature
More water vapor
POSITIVE NEGATIVE
More water vapor & other
changes
Increased cloud cover
More reflected solar radiation
Lower temperature
Less water vapor
More absorbed infrared radiation
Higher temperature
More water vapor
+
+
+
+
+
–
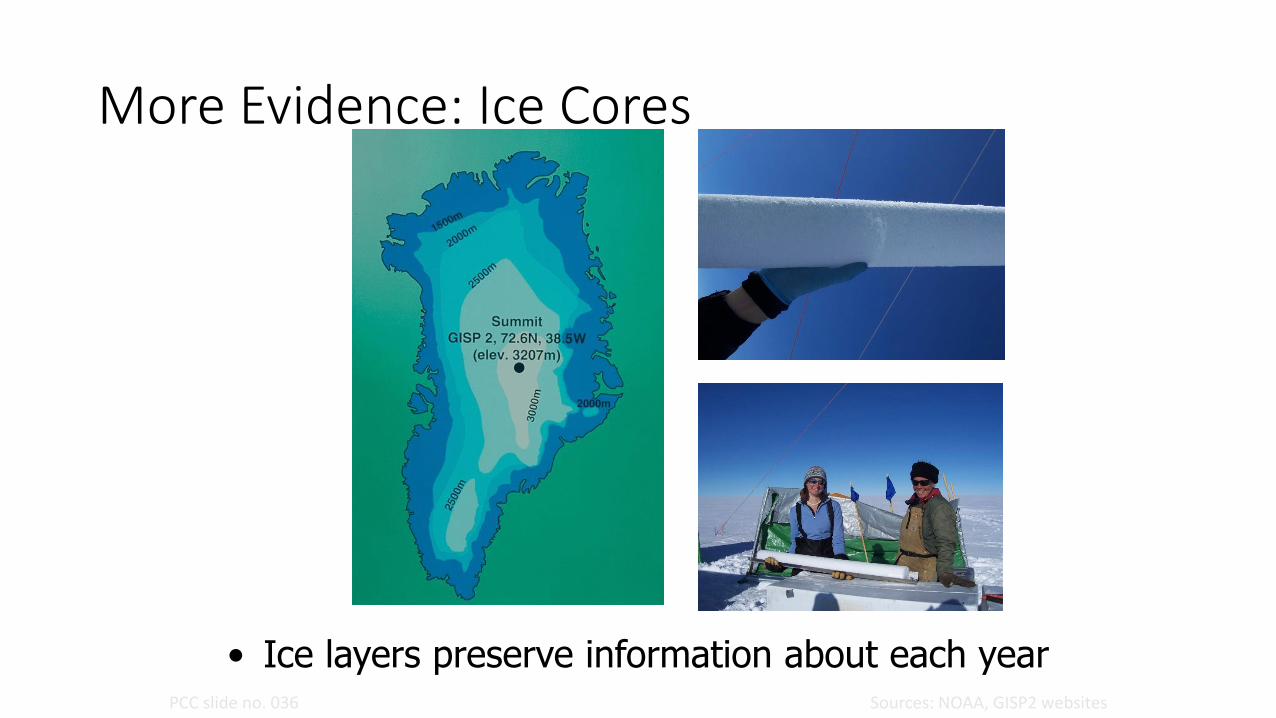
More Evidence: Ice Cores
• Ice layers preserve information about each yearSources: NOAA, GISP2 websitesPCC slide no. 036

Influence of industry
• Recorded in ice cores
• CO2 low as 180 ppm during ice ages
• CO2 260-280 ppm until late 18th century
• Biggest rise 1950- increased global industrialization, fossil fuel consumption increased
• CO2 now near 400 ppm

Greenhouse gases and temperature650,000 BP to present
Source: IPCC, 2007PCC slide no. 006
CO2 In 2008:386 ppm(NOAA)
Climate Change vs. Variability
• Even in a stable climate regime, there will always be some variation (wet/dry years, warm/cold years)
• A year with completely “average” or “normal” climate conditions is rare.
Climate variability is natural.
The challenge for scientists is to determine whether any increase/decrease in precipitation, temperature, frequency of storms, sea level, etc. is due to climate variability or climate change.
Claims & Counter Claims
• Scientists are cautious
– Evidence & uncertainties• Impression: evidence is weak
• Climate patterns are complex
– Difficult to predict consequences of additional CO2 increases
– Tipping points – massive change- difficult to predict
• Consequences in climate pattern changes bad for humans/organisms
– Immediate action needed despite uncertainty
– Companies make huge profits from fossil fuels• Possible reports to minimize risks
Why can’t scientist know what problems the Greenhouse effect will cause?
• Climate is a complex phenomena with many emergent properties often based on time frames beyond the human experience. This makes predictions of location and timing difficult.

Opposition to Climate Change Science
• Factors influencing temp
– Green house gas concentrations
– Volcanic activity– Ocean currents
• Fluctuations in global temps in recent years
• All claims and evidence must be evaluated using scientific methods
• Beware of internet sites that are biased and not supported by credible evidence
Coral Reefs & CO2
• Ocean surface pH
– Estimated 8.179 late 18th century
– Current levels ~ 8.069– 30% acidification
• Calcium carbonate skeletons
– Need to absorb carbonate ions from water
– Dissolved CO2 reduces carbonate ion concentration
– If carbonate ion [] is to low, coral skeletons can dissolve
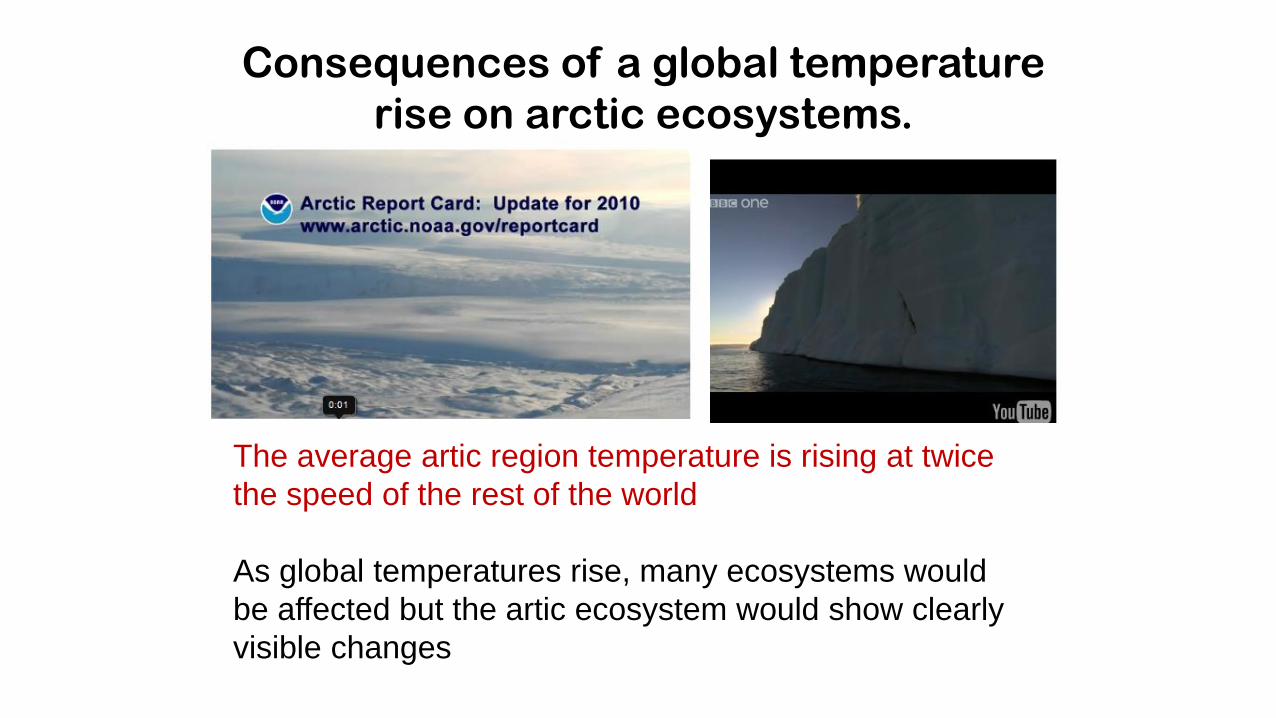
Consequences of a global temperature
rise on arctic ecosystems.
The average artic region temperature is rising at twice
the speed of the rest of the world
As global temperatures rise, many ecosystems would
be affected but the artic ecosystem would show clearly
visible changes

Sea Level Rise
• Melting of
• Greenland Ice Sheet
• Antarctic Ice Sheet
• Glaciers and ice caps
• Expansion of heated (warm) sea water
2 - 4 C warming by ~2100
0.18 - 0.59 meter rise in sea levelIPCC (2007)
Negative Effects• Increased rates of decomposition of detritus previously trapped in permafrost –releasing methane gas
• Expansion of the range of habitats available to Temperate species
• Species, like caribou, polar bears, seals, are changing their migration pattern to respond in changes to their feeding patterns
• Loss of ice habitat,
• Changes in distribution of prey species affecting higher trophic levels
• Increased success of pest species, including pathogens
• Native people are finding it harder to hunt
• Villages move as environment becomes a swamp due to permafrost disappearing
• Polar bears hibernate less as temperature rises. Must swim further and more often to reach prey/destination which uses more energy
• Biodiversity could change and herbivore animals would need to change their eating patterns

Positive Effects
• Milder climate would enable other species to survive in Artic (though competition could lead to extinction of other plant species)
• Plant productivity would increase biodiversity in the area
Related Documents