1 SteamWizard® THERMAL ENERGY SYSTEM ANALYZER Manual and user guide Thornhill Automation Services July 2013 Version 1.24 for Windows 9X, 2000, XP, Vista, 7, 8 Copyright 2013 Thornhill Automation Services

Welcome message from author
This document is posted to help you gain knowledge. Please leave a comment to let me know what you think about it! Share it to your friends and learn new things together.
Transcript

1
SteamWizard®
THERMAL ENERGY SYSTEM
ANALYZER
Manual and user guide
Thornhill Automation Services
July 2013
Version 1.24 for Windows 9X, 2000, XP, Vista, 7, 8
Copyright 2013 Thornhill Automation Services

2
All rights reserved
108, Sugarloaf Street, Ontario, Canada L3K 2N4
905 834 9624
www.steamwiz.com

3
Table of Contents 1. Introduction 7 1.1 An Economic Model of Your Plant with no Programming 7 2. System Requirements 7 3. Getting Started 8 3.1 Installing SteamWizard 8 3.2 Opening SteamWizard 8 3.3 Getting an Authorisation Number 8 3.4 Entering the Authorisation Number 9 3.5 A Quick Look 9 4. Starting and Configuring SteamWizard 10 4.1 Configuring a System 11 4.2 Configuration
4.2.1 Main Display 12 4.2.2 Graphic Display 12
4.3 Details: Individual Configuration Displays 15 4.3.1 Steam Headers 17 4.3.2 Boilers 18 4.3.3 Heat Recovery Steam Generators (HRSGs) 20 4.3.4 Gas Turbines 21 4.3.5 Steam Turbine/Generators 22 4.3.6 Pressure Reducing Valves (RVs) 24 4.3.7 Fuel Configuration 25

4
5. SteamWizard Run Mode 26 5.1SteamWizard Main (P&ID) Display 26 5.2 Run Mode Utility Display 28 5.3 Detail Displays of Process Plant 30 5.3.1 Steam Header Detail Display 30
5.3.2 Boiler Detail Display 31 5.3.3 Heat Recovery Steam Generator Detail Display 31 5.3.4 Turbine/Generator Detail Display 32 5.3.5 Turbine/Generator Section Detail Display 32 5.3.6 Turbine Control Detail Display 32 5.3.7 Pressure Reducing Valve Detail Display 33
5.3.8 Feedwater Data Display 33
5.4 Auxiliary Displays 34 5.4.1 Boiler Firing Parameters 34 5.4.2 Fuel Cost Parameters 34 5.4.3 Boiler Efficiency 35 5.4.4 Boiler Steam Temperature 35
5.4.5Turbine Flow Limits 36 5.5 Controller Displays 37 5.5.1 P+I Control 37 5.5.2 Manual Control Station 37

5
6. Auxiliary Functions 38
6.1 Trend Display 38
6.2 Saving a Scenario 40 6.3 Synchronising SteamWizard to Current Plant State 41 6.4 Importing/Exporting Data from SteamWizard 42 6.5 View Configuration Spreadsheet 42 6.6 Scenario Data 43 6.7 Print Overview Function 43 6.8 Currency Change Function 43
Appendices Appendix 1 - Software Block Diagram 45
Appendix 2 - A note on accuracy 45 Appendix 3 - Note on Configuration Spreadsheet 46 Appendix 4 - Data Spreadsheet Cost Attribution 46 Appendix 5 - Units of measurement 47 Appendix 6 - License Agreement 48

6
Illustrations
Figure Page 1 SteamWizard Startup Display 9 2 SteamWizard Configuration Display – Main Selections 12 3 SteamWizard Configuration Display – Plant Items Selections 13 4 SteamWizard Configuration Display – Control Selections 13 5 Steam Header Configuration Display 17 6 Boiler Configuration Display 18 7 HRSG Configuration Display 20 8 Gas Turbine Configuration Display 21 9 Steam Turbine/Generator Configuration Display 21 10 PRV Configuration Display 25 11 Fuel Configuration Display 26 12 SteamWizard Overview (P&ID) Display 27 13 SteamWizard Analysis Display 28 14 SteamWizard Run Mode Utility Display 29 15 SteamWizard Run Mode Utility Display – Graphics 30 16 SteamWizard Run Mode Utility Display – Data Transfer 30 17 Steam Header Detail Display 31 18 Boiler Detail Display 31 19 HRSG Detail Display 31 20 Turbine Generator Display 32 21 Turbine Section Display 32 22 Turbine Section Controls Display 32 23 Pressure Reducing Valve Display 33 24 Feedwater Data Display 33 25 Boiler Firing Parameters Display 34 26 Fuel Cost Data Display 34 27 Boiler Efficiency Display 35 28 Boiler Steam Temperature Display 35 29 Turbine Flow Limits Display 36 30 Proportional & Integral Controller Display 36 31 Manual Station Display 37 32 Graphic Trend Display 38 33 Numeric Trend Display 39 34 Save & Restore Scenario to Disk Display 40 35 SteamWizard Run Mode Utility Data Transfer Selection 42 36 SteamWizard Configuration Display 42 37 SteamWizard Software Block Diagram 44 38 SteamWizard Configuration spreadsheet example 45 39 Units of Measurement 46

7
1. Introduction
Thank you for using SteamWizard ® – a great way to evaluate and optimize your plant energy system. SteamWizard lets you build a computer model of your steam system easily with basic computer skills and quickly assess your steam and electrical generation costs and test strategies to reduce them.
1.1 An Economic Model of Your Steam Plant with No Programming:
Using System SteamWizard you can configure a dynamic model of your energy system and use it to simulate different operating scenarios. You can evaluate the operational and economic consequences of various operating strategies and analyze the consequences of equipment failures or planned outages. Building your energy system model is easy and does not require any programming. You build the model by configuring function blocks using the information normally supplied by equipment vendors in a familiar engineering data format. Building blocks are included for boilers, steam headers, gas turbines and HRSGs, steam turbine/generators and pressure reducing stations. Standard power industry terms and units are used throughout. Features of SteamWizard include:
Viewing your plant model state on a flow diagram (P&ID) display with live updates. Dynamic display of steam and electrical energy costs on flow diagram. Real time feedback of fuel costs of steam and electricity on a P&ID display . Ability to test operating changes (‘What If’ analysis’) /impose random load changes. Synchronising the plant model to the actual plant to show current costs . Spreadsheets showing comprehensive thermodynamic and cost data. Specifying your own fuels/changing fuel characteristics. Archiving an unlimited number of scenarios of the model. View your configuration as a spreadsheet. Customising titles and descriptions of every saved model and scenario . Graphic and numeric trend displays of up to six process measurements.
SteamWizard approximates system dynamics using header volumes, boiler response times and controller tuning that you can specify if the information is available (otherwise it uses reasonable default values). It automatically creates appropriate DCS like controls to converge your plant model to a steady state condition or cope with simulated random loads changes. SteamWizard accurately recalculates steam properties as conditions change. The SteamWizard has two modes – ‘Configuration mode’ allowing you to build a new system or modify an existing one and ‘Run mode’ that runs the model in real time or faster. SteamWizard has the feel of a real process, using familiar control components to achieve convergence to a stable equilibrium, rather than being an abstract purely mathematical ‘solver’.
2. System Requirement:
The following is a list of SteamWizard system requirements:
Personal computer running Windows 9x, NT, 2000, XP, Vista, Seven Recommended CPU speed is 1.2 GHz /512 Mbytes RAM or better Licensed copy of MS Excel (to use spreadsheet creation and synchronization features) As large a display resolution as possible at least XGA (1024x768) is recommended (see sec.
4.1 ‘Configuring a System)

8
3. Getting Started The following explains how to install and open SteamWizard, how to run an existing model simulation, how to use the configuration templates to modify an existing model or build a new one from scratch and describes the main SteamWizard window and P&ID display window. 3.1 Installing SteamWizard ®: To install SteamWizard, follow these steps:
1. Insert the SteamWizard CD into your CD drive. 2. Go to the Windows Start menu and click on ‘Run’, type X:\Setup.exe where ‘X’ is the drive
letter of your CD drive. 3. Follow the on screen instructions.
You will be asked to accept or modify some default settings such as the drive and directory in which SteamWizard will be installed and the title that will appear on the Start menu. Normally these will be acceptable and you will not have to change them. Note that you may be asked to choose between retaining an existing file on your computer and overwriting it with a file from the CD. TAS recommends that you retain the existing file, particularly if it is more recent than the version in the CD. 3.2 Opening SteamWizard ®: To open SteamWizard click the SteamWizard shortcut on your desktop (it should be created automatically on installation). If no shortcut appeared:
1 Click the Start button located on the left side if the Windows taskbar. 2 Select ‘Programs’ 3 Select ‘SteamWizard’ (or the alternative title you chose during installation) 4 Select ‘SteamWizard’ from the list of options
You can create a shortcut by right clicking on ‘SteamWizard’ then selecting ‘Create a shortcut’, then dragging the new shortcut onto the desktop.
If you have already entered your authorization number, this will bring up the SteamWizard start menu that enables you to choose a number of options for using the program. If you have not yet entered an authorization number, a help screen will appear to guide you through this process (see sections 2.3 and 2.4 below). 3.3 Getting an Authorization Number: SteamWizard requires an Authorization number to run. This is to protect the legitimate user and TAS by allowing only properly licensed copies to be used. It also allows you to freely copy and distribute the CD if you wish, as recipients can obtain a fully functional 30-day demo license from TAS at no charge. The authorization number is specific to the computer on which the software is installed. One and three ‘seat’ licenses are available. To obtain your Authorization number(s) you need to E-mail TAS with your eight digit ‘Product ID’. The product ID is shown on the initial display that appears the first time you run the program. This display also shows TAS E-mail address and phone number which are: [email protected] ; phone: 905 834 9624 TAS will E-mail a 16 digit authorization number back to you; the number will be permanently valid for users who have paid the license fee or valid for 30 days if they wish to use SteamWizard on a trial basis.

9
3.4 Entering the Authorization Number: When you start the program for the first time, as well as the initial welcome display, a smaller message box will appear that asks you to click ‘Yes’ to enter the authorization number or ‘No’ to obtain the Product ID. After you have obtained an authorization number, re-start the program and click ‘Yes’ on the message box. A message will appear confirming your number has been accepted, and you will be asked to read and click on acceptance of the licensing agreement. This is the only time the initial help displays and authorization number boxes will appear, subsequently when you start the program, it will go directly to the main start display. 3.5 A Quick Look at SteamWizard: A detailed description of SteamWizard is given on later pages, but for a quick exploration, click the SteamWizard icon on your desktop. Click ‘Run’ button on the opening display and click ‘Yes’ in response to the message box that asks if you want to use an existing scenario. The file save/restore display now appears that lets you select one of four pre-stored systems supplied with Steam Wizard (one small, two medium and one large); double-click on the ‘Init_CP’ item on the ‘directories’ list on the right side, then click on one of the items in the ‘files’ list on the left hand side, then click the Select button at the top. The selected system will then be shown on the System View display that shows the simulator in a P&ID type format and shows it’s capabilities and includes examples of the energy system components available. The system starts at equilibrium – click the ‘Randomise’ button near the top left hand side and then the red ‘Start Model‘ button; randomise varies the steam loads to disturb the system, which will then try to re-extablish equilibrium. Placing the cursor over an item brings up a message describing it. Try clicking the various symbols to display sub menus and data displays – you cannot break anything as the scenario is stored on your hard drive. Clicking on any of the white data ‘boxes’ or colour coded square TG or PRV connection symbols brings up detail displays with more process information about the item. Some of the items have controls associated with them and controller displays will appear with the other detail displays At the right of each steam header is the current steam cost. At the top the total cost of steam and of electricity per hour are displayed. Also at the top right of the display are buttons for clearing all detail displays and for starting/stopping the simulator. Various functions are available on the task bar as follows:
System Data such as feedwater and scenario data and print system display. Reset header pressures or elapsed model time. Trend display and process disturbance selection. View plant or control configuration details on a spreadsheet. Data analysis – spreadsheets showing thermodynamic and cost data. Return to configuration display.
These options are all described in more detail in section 5.1, page 22.There are also some background indications at the top left, such as suppressing prompts and ‘tooltips’ and process disturbance status. You can change the state of the system by changing boiler loads, flow and pressure setpoints etc., tripping boilers and so forth. The controls built into the various system items will then cause the system to reach static equilibrium like a real energy system would if there were no process disturbances. Each header has a plant demand (external load) indicator – clicking on this lets you change the demand by displaying a data entry port. While the equilibrium state (all pressures and flows unchanging) is ideal for analysis purposes in real plants it rarely happens, so to emulate realistic conditions there is a ‘randomize’ function that can be selected to cause unpredictable load changes on steam headers. Several example systems are stored as a ‘checkpoint’ files available via the file save/restore display (a checkpoint is a digital snapshot of the entire state of the energy system). Your own system and scenarios are selected in the same way using this display.

10
4. Starting and Configuring SteamWizard:
Figure 1 SteamWizard Start up Display
Click the SteamWizard icon on your windows desktop or the SteamWizard item on the windows applications display to bring up the SteamWizard start menu. This is the root display that enables you to access all the software functions; it acts as a bridge between the ‘configuration’ and ‘run’ modes of the software and co-exists with both – it is always present on the taskbar in a minimized state. The option buttons along the top offer utility functions like viewing the about and license displays, minimising the display etc. The larger buttons lower down offer the following choices:
Configure a new or existing system Run the SteamWizard Quit the program
There is always a configuration loaded in SteamWizard (in your computer’s RAM), the above commands apply to whatever is loaded. When SteamWizard starts up a default energy ‘demo’ system is automatically loaded that includes examples of the various types of plant available. ‘Configure a new or existing system’ puts you in model building (configuration) mode. Clicking this will get you to the main configuration display this is described in detail in ‘Configuration’. ‘Run the SteamWizard’ puts you in run mode. Clicking this will invoke message boxes asking if you would like to select a previously stored scenario or start the simulation with whatever configuration is currently loaded, it then runs the configured system showa the overview (P&ID ) display that shows the entire energy system with key values (see section 5.1 page 22) ‘Quit the program’ shuts the program down but will ask you first if you wish to save any unsaved data.

11
4.1 Configuring a System: The basis of building your system is a set of configuration displays that allow you specify the units of measurement and to enter the details of your system. To make life simple, SteamWizard will not let you configure a system that won’t run. It’s far simpler to avoid an error in the first place than try to trouble shoot the whole plant model later on. SteamWizard checks things like all inlets being at a higher nominal header pressure than corresponding outlets; that all required connections are specified, before it lets you build a plant item. Because energy system plant connections must be specified, one or more steam header must be built first, thereafter items can be added in any order. Note that, except for steam headers, the build order also determines the P&ID display position – the first item built is on the left on any header. For steam headers, the headers are shown in descending order of pressure, the highest at the top. The maximum number of headers that can be shown is dependent on the screen resolution of your computer, with 1024 x 768 up to four headers can be shown. The configuration displays have some rules built in that will prompt (and require) you to make certain choices and use valid selections, invalid choices are not offered. The display will not let you ‘build’ an item if the entries are incomplete or in error. Building an item means transferring the data from the display to an instance of the building block that is added to the system configuration in memory. As soon as this is done, the item is ready to be saved to disc (see section 7.1 page 34) – save early and save often! Saving one block also saves the whole configuration automatically. There are numerous help messages to guide you in the right direction and explain why a certain selection was not accepted: some of these can be turned off if they become tedious (click ‘Omit Prompts’). SteamWiz has a set of standard process building blocks or templates such as boiler and turbine blocks; each block has a configuration display that allows you to configure it to correspond to an item in your energy system. After block configuration is complete and copied to the current configuration, it can then be used as a template for similar units. Any number of items of each type can be built. When SteamWizard is running, the blocks are shown on the main display in the order they were built, starting from the left. The minimum possible system is one steam header and one boiler. Other types of unit are optional, typically there will be several boilers and headers with PRVs (pressure reducing valves) and or back pressure turbines, as well as external plant steam loads on each header. There are two strategies for building a system. One is to load and modify an existing system modifying deleting and adding items as required. The other is to clear the current system from memory and start from scratch. The first is easier because it reduces the amount of work and the configuration displays already contain example data that can act as a guide. When all the blocks for your system are complete, you can run the model immediately - no configuration is required. Some of the required input data may not be available or may be inaccurate but a reasonable estimate or nominal entry is acceptable provided you remember the well known computer principle that quality of results depends on the quality of the input (ie. ‘Garbage in/Garbage out’). It is possible to verify the sensitivity of SteamWizard results to such uncertainty by making changes in the questionable data point and monitoring the effect on calculated cost per unit input change. Note that entering data in the data boxes on the configuration displays is always done by clicking the box first, then entering the data on the resulting ‘pop up’ form. This is so that the data can be verified before it becomes part of the configuration. Entering keystrokes with the cursor in a data box results in a warning message and the entries are discarded.

12
4.2 Configuration Displays: If you’re not running a model, then you’re in configuration mode with the Startup display visible (or minimized on the taskbar). If you’re looking at the P&ID display showing live process values you’re in run mode and you can get to configure mode by clicking the ‘Re-configure’ item on the task bar or by selecting ‘Start Up Display’ on the windows taskbar or on the Utility Display ‘Graphics’ menu selection. This will bring up the Startup display (section 4) that also has a ‘Configure System’ button; clicking either of these buttons will invoke the configuration display clearing the run mode (P&ID) display. 4.2.1 Configuration Graphic Display:
Figure 5. SteamWizard ‘Graphical Config. Display’ The configuration graphic display is shown above with an example configuration, it shows the system model configuration as you build it. The Configuration Graphic display above allows you to see your system model grow as you build it. Clicking on an item displays its data box that you use as a template to create a new item of the same type with a different name. It can be identical in engineering terms or quite different. Alternatively you can click on one of the buttons on the right hand side of the display, which bring up a blank data box for the item type that you need to fill in from scratch.

13
The grey buttons on the right of the graphic represent the available components - headers, entry form for that particular component type, showing the data for one of the existing ones, if any (clicking
on an existing item will also do this). When you have completed the form and clicked the ‘Build’ button, the device will be shown attached to the appropriate header(s) on the display as well as being added to the model database. Naturally you must start with a header otherwise you cannot specify or show an item’s steam connection(s) and the display will not let you build an isolated device. You’ll get a warning message if you try to add an item before you’ve built any headers!
The colored buttons allow you to select a new project or save the one you are working on using the Save/Restore display (see Pg.39), or to show the configuration or startup displays or quit the program. At the top left of the display there are buttons that toggle the prompt and tooltip functions on and off, since experienced users may find them distracting or annoying. There are also toolbar functions for turning prompt messaged and ‘tooltips’ off if required, since these can be intrusive for experienced users. Note: Although you can build as many headers as you like, there is a limit to how many can be seen on screen. A 1024 x 768 resolution display can show up to 4 headers; to show more than this, a higher resolution (and probably a larger screen) is required. 4.2.2 Configuration Utility Display:
Figure 2 SteamWizard Configuration Utility Display.
Clicking on either ‘Configure System’ button described above after a warning message, causes the configuration display (fig.2) and the configuration graphic display (Fig.5 sec 4.2.2) to appear. The messages relate to selecting a system from a file menu, saving the currently running system and changing the project or scenario names. Selecting and loading a scenario will cause the current system/scenario to be lost, so this is your ‘prompt’ to save if you need to. The display shows the current project name and offers six selections:
Configuration Control displays Text Files Save config. View Configuration Clear config.
It’s easier to configure a system by modifying an existing one, such as the default system, since the data already present on the configuration displays indicates the type of data required. There is a different display for each type of plant. On any of them you can delete items not required by clicking ‘delete’, or clone a point by entering a new point name - SteamWizard will ask you if you want to build a new item. Until you click ‘build’ the data is just present on the display, after ‘building’ the point, it is present as a member of the collection of items of that type that make up the system and it will show up on the list of items shown on the list display at the bottom of each display (click the ‘down’ arrow).

14
The configuration button on the left of the configuration display is the ‘core’ function that invokes a list of available energy components to configure (shown on fig. 3 below). Clicking one of these brings up the configuration display for that item. The display will be pre-loaded with data for the first item of its type
Figure 3 SteamWizard Configuration Display – Plant Items Selection
The available items are:
Change Project Name Steam Headers (includes external steam load) Boiler fuels Boilers Heat Recovery Steam Generators (HRSGs) Steam turbine /Generators (TGs) Gas Turbines (GTs) Pressure Reducing Valves (PRVs)
For details of each type of display, see ‘Individual Configuration Displays’ section 4.3, page 11. Using the menu choices on the configuration menu, select the plant type you wish to work on by clicking the appropriate menu item. The next section explains details of configuring each plant type using it’s particular configuration display. Each configuration display has a list function that shows all the items of each type currently loaded. You can delete or modify any of these at any time with the exception of headers. With headers, there are some limitations such as not deleting one if anything is still connected to it, or changing it’s place on the pressure sequence.
Figure 4 SteamWizard Configuration Display – Control Selections Appropriate controls are automatically built for plant items that you add to the system, you can view these in configuration mode by clicking on the ‘Control Displays’ command to the right of Configuration on the configuration display, this brings up a list of four control components (shown on fig. 4 above):
AI ( Analog input) Auto/Manual P+I Controllers AO Analog Output)
Clicking on any of these brings up a display that shows the control points associated with the configuration, on a ‘drop down’ menu. The first item on the list is displayed by default. The control points shown were automatically built when the associated plant item was built, the controls and associated Áuto/Manual’

15
stations allow the system to reach a stable equilibrium stat and allow you to modify boiler loads, pressure setpoints etc. to reproduce and explore operating strategies. The displays do not allow changes here, but are shown to allow you to verify that the controls have been correctly built. The controls have instrument tags used for internal communication; these are automatically assigned to eliminate a possible source of errors and to save you time and effort. Since the control algorithms are normally not visible, and are automatically shown when required, difference between the actual plant control system tag names and the Steam Wiz tag names should not be an issue. Further to the right is ‘Text Files’ - clicking this brings up the ‘File Save’ menu that allows you to save or restore an energy system configuration in the form of a set of text files. This method of storage has some advantages over the normal ‘checkpoint’ method of storage in terms of flexibility, but is also has fewer safeguards against file errors. Unlike checkpoint files, the text files can be opened by the user with Microsoft ‘Word’, ‘Notepad’ or a text editor to read the detailed configuration or to change items or conditions without using SteamWizard’s configuration menus. You can also build new items by copying pasting and modifying existing items. If you elect to use text files however, you are on your own regarding configuration validity, since all the safeguards of the configuration displays are circumvented. This capability is for the proverbial advanced user – the technically inclined will enjoy getting down to the detail of the model complete with internal parameter names. These files also have a potential use in permitting software upgrades that might invalidate checkpoint files – the upgrade would include a file converter that would upgrade a configuration saved as a set of text files, so that it could be loaded successfully in the upgraded SteamWizard software. Next right is ‘Load/Save Config.’ Clicking this brings up a sub-menu offering ‘Save’ or ‘Load’. Clicking on either of these invokes the ‘File’ display, that allows you to save or restore an energy system configuration in the form of checkpoint files. This is the normal way of saving and restoring configurations and is a rapid and efficient way of storing your work. The files can be used to archive work and later restore it to SteamWizard for re-use or modification. You cannot be open these files independently of SteamWizard since they are binary files, however they are compact and are rapidly processed. ‘View Configuration’, to the right of ‘Save/Restore’: clicking this brings up a sub-menu offering to create Excel spreadsheets showing either the details of the configuration you are creating (see appendix 3) or of the digital controls that were automatically created with it. To use this feature you must have your own licensed copy of Excel installed on your computer. At the extreme right, the ‘Clear Config.’ button allows you to delete the current configuration entirely. This allows you to make a fresh start, configuring a completely new energy system from scratch. If you click on this function, youwill be asked for confirmation before the deletion takes place.

16
4.3 Individual Configuration Displays: This section explains the detail features of the individual plant types to be configured and modeled by SteamWizard. Configuring a system means entering the data describing it on configuration displays for each of the various types of plant item. These entry displays have a consistent set of common functions accessed by data boxes and command buttons as follows:
- System ID data box - Descriptor data box - Build button (titled ‘build’ + name of plant type (boiler etc.) - Reconstitute button - Delete button - Omit Prompts button
All the configured items must have a system ID or identifier, ID must be entered first and must be unique because the SteamWizard uses it to reference the process item being built, the ID must be short 4 or less characters. The descriptor is not mandatory but is used in many displays when the SteamWizard is running – it can also be used to identify the process item as well as describe it. The entry method for these and other data entry tasks is to click on the data boxes and enter the data value on the resulting data entry window. For selection tasks where there are a limited number of choices such as connecting headers, appropriate selection buttons appear on the right of the display when the data box is clicked. The Build button converts the data temporarily stored in the display to software blocks (objects) in SteamWizard that are ready to run. The Reconstitute button allows an existing item from the currently loaded configuration to be uploaded into the display for modification or as a template for ‘cloning’ the item. It does this by invoking a window that prompts you to enter the ID of the item you are looking for – if you don’t know the ID of the item there is a list feature described below. If some configuration entries to the previous item were made, a warning message will prompt you to save them before proceeding. The Delete button is self explanatory and removes the item shown from the currently loaded configuration. There are some things to be borne in mind when deleting, such as the interdependence of gas turbines and associated HRSGs (heat recovery steam generators). Headers cannot be deleted until all connecting items are themselves deleted or moved. There are individual deletion buttons for HRSG pressure circuits. The Omit Prompts button suppresses some of the less important help and information messages - this speeds things up for a practiced user, since the messages require acknowledgement. At the base of each display there is a list feature: clicking on the down arrow causes a drop down list to appear that shows all items of the same type to be shown. Clicking on an item reconstitutes it into the form exactly as the Reconstitute button does. If some configuration entries to the original item were made, a warning message will prompt you to save them before proceeding. There are controls associated with the various plant types available, and these are built automatically to make the task of configuration of the SteamWizard easier. The only choices here are the types of control, for instance boilers can be pressure controlled, flow controlled or manually loaded. The SteamWizard limits headers to one (plant master) pressure controller for boilers, but ‘override’ PRV controls can also be assigned.

17
4.3.1 Steam Headers:
Figure 5 Steam Header Configuration Display
Steam headers are built simply by specifying a short identifier (eg. ‘HP’) and a descriptor, followed by its’ normal pressure then temperature and optionally, its internal volume and header energy loss per unit time (expressed as a percentage of maximum design energy input to the header). The header identifier must be entered first and is used by SteamWizard to reference the header. The entry menu checks the temperature is not less than saturation temperature and that the volume entered can store enough mass of steam at the nominal conditions to give reasonable time response and stability. Not shown on the display is safety relief valve (RV) trip pressure - this is automatically set at a reasonable percent above normal header pressure. If dynamics are not a priority or the volume is not available, the SteamWizard assigns a reasonable volume by default and this appears automatically once the pressure and temperature have been assigned; this number can be changed by clicking on the data box like the other entries. Normally all the headers would be built first since you cannot build a plant item if the header it connects to is not yet built. Note that changing header operating pressure above or below adjacent headers in pressure sequence is not permitted if any connections have been made to the header since this might violate the connection rules. When the header data has been entered, click the ‘Build Header’ button – this causes various checks to be made that may request that you modify your data entries. Then you are offered the choice of saving the configuration to disc using the ‘Save/Restore’ display (see section 7.1, page 34. You will need to make some connections before you can run the SteamWizard with the new header - at least a steam source. Note that to delete a header, you must first delete or move any item connected to it. A quick way to identify the connected items, click ‘Connections’ and a message listing all the items connected to the header will be displayed.

18
4.3.2 Boilers
Figure 6 Boiler configuration Display
Boiler are configured by entering the ID, header connection, fuel types, maximum flow capacity, superheat/saturation status, superheater pressure drop, efficiency, steam temperature curves, percent blowdown, blowdown percent heat recovery, control type, and boiler response time. If your boiler produces saturated steam, you don’t need to enter any steam temperature data or superheater pressure drop. For header connection, fuel selection, control type and superheat/saturation selection, click the data box then click one of the selection buttons There are shortcut keys marked ‘Stm. Temp.’ and ‘Efficiency’ to make the temp and efficiency data points the same as the 100% load entries (a flat characteristic), to speed up entry if curve data is not available (you would probably use the Vendors guaranteed efficiency at 100% load). The curves are represented by four line segments requiring five data points. Presence of a desuperheater is simulated by having a flat characteristic over the upper load range.

19
You can select control type as pressure controlled, flow controlled or manually loaded. The SteamWizard limits each header to one (plant master) pressure controller for boilers, but ‘override’ PRV controls can also be assigned. For pressure control, each Boiler will be provided with a manual station that can be put in Cascade or Manual mode when the SteamWizard is running, the input to the manual station or ‘boiler master’ being derived from the common header plant master controller. If all the boilers are base loaded, the plant master will be initialized to prevent control ‘windup’. If a boiler is flow controlled it will have its’ own dedicated flow controller, if it is manually controlled, it will just have a manual station. At the bottom of the display there is a section for specifying feedwater conditions, condensate return temperature and flow (as % of. boiler steam flow). You must also select the deaerator saturation conditions (thus feedwater temperature) by choosing the header supplying steam to the deaerator. Changes to feed- water parameters will affect all boilers since you are modifying the common feedwater database. Some of the information like blowdown flow and heat recovery or condensate return data may not be available but a reasonable estimate or nominal entry is acceptable provided you remember the computer adage that quality of results depends on the quality of the input (ie. ‘Garbage in/Garbage out’). It is possible to verify the sensitivity of SteamWizard results to such uncertainty by making changes in the questionable data point and monitoring the effect on calculated cost per unit input change at equilibrium conditions.
20
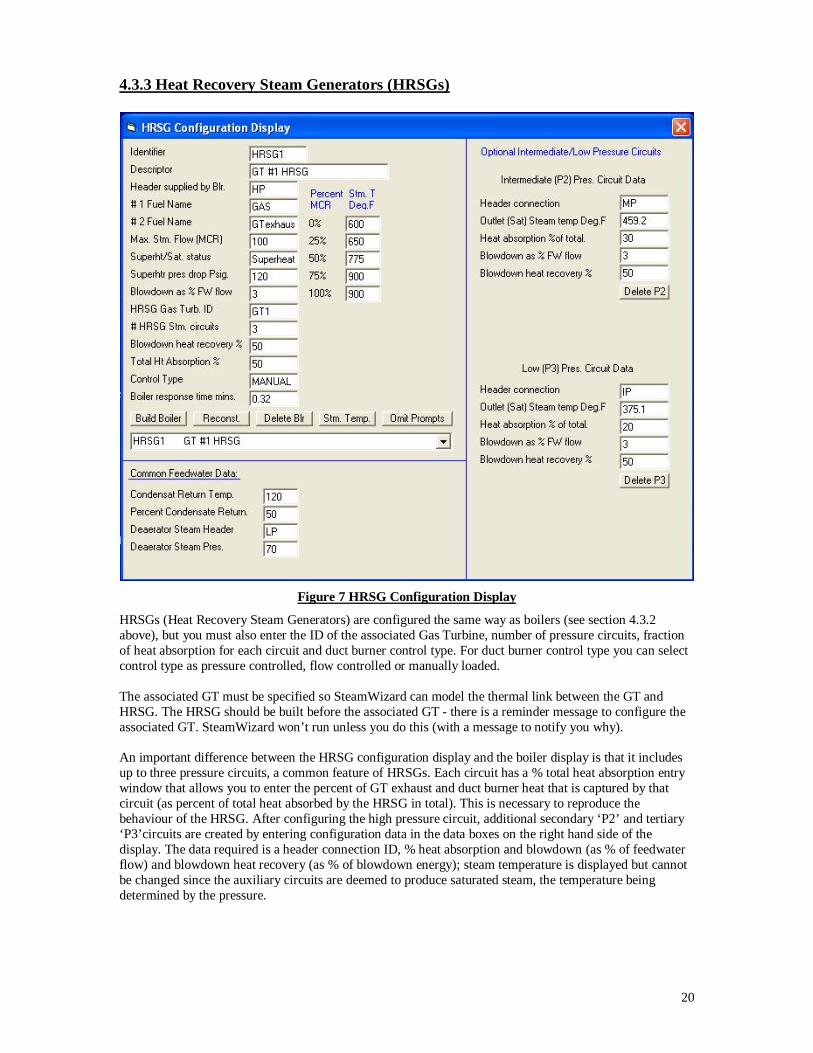
4.3.3 Heat Recovery Steam Generators (HRSGs)
Figure 7 HRSG Configuration Display
HRSGs (Heat Recovery Steam Generators) are configured the same way as boilers (see section 4.3.2 above), but you must also enter the ID of the associated Gas Turbine, number of pressure circuits, fraction of heat absorption for each circuit and duct burner control type. For duct burner control type you can select control type as pressure controlled, flow controlled or manually loaded. The associated GT must be specified so SteamWizard can model the thermal link between the GT and HRSG. The HRSG should be built before the associated GT - there is a reminder message to configure the associated GT. SteamWizard won’t run unless you do this (with a message to notify you why). An important difference between the HRSG configuration display and the boiler display is that it includes up to three pressure circuits, a common feature of HRSGs. Each circuit has a % total heat absorption entry window that allows you to enter the percent of GT exhaust and duct burner heat that is captured by that circuit (as percent of total heat absorbed by the HRSG in total). This is necessary to reproduce the behaviour of the HRSG. After configuring the high pressure circuit, additional secondary ‘P2’ and tertiary ‘P3’circuits are created by entering configuration data in the data boxes on the right hand side of the display. The data required is a header connection ID, % heat absorption and blowdown (as % of feedwater flow) and blowdown heat recovery (as % of blowdown energy); steam temperature is displayed but cannot be changed since the auxiliary circuits are deemed to produce saturated steam, the temperature being determined by the pressure.

21
4.3.4 Gas Turbines
Figure 8 Gas Turbine Configuration Display
Gas turbine building requires fuel type, associated HRSG, response time in minutes, maximum rate of power increase, absolute maximum power capacity, generator efficiency and ambient temperature limits. In addition there are two tables of values defining the GT operating characteristics as four segment ‘breakpoint’ curves. For fuel selection and HRSG selection, click on the data box then click the appropriate selection button. Gas turbine data is usually available from the vendor as a predicted performance table. The HRSG must be specified so SteamWizard can model the thermal link between the GT and HRSG so normally you would configure the HRSG before the GT. Click on the associated HRSG data box and the available HRSGs appear as selection buttons. The GT can be built before the associated HRSG but with a reminder message to return to complete the configuration. SteamWizard won’t run unless you do this (with a message to notify you why). The absolute maximum power corresponds to the low temperature limit since GT power capacity is strongly increased by lowering the ambient air (compressor inlet) temperature and hence density. Generator and transmission efficiency is used to back-calculate the residual energy contained in the GT exhaust after electrical output is deducted. The table on the left of the blue bar allows the GT capacity versus air inlet temperature characteristic to be specified as four segment ‘breakpoint’ curves. The temperature breakpoints are automatically assigned based on the previously entered ambient temperature limits. Click on a maximum power window to invoke the data entry port and prompt and then enter the power for that temp.

22
The table on the right of the blue bar allows the generated power versus GT fuel flow and HRSG efficiency to be entered as four segment ‘breakpoint’ curves. Efficiencies curves for both fired and unfired conditions can be entered; there is also a curve for maximum duct burner flow as a function of power, although normally maximum duct burner flow is a constant. 4.3.5 Steam Turbine/Generators
Figure 9 Steam Turbine/Generator Configuration Display
Steam turbine/Generator configuration starts with ID, descriptor, condenser conditions (if present), generator capacity and parasitic load both in Megawatts. Parasitic load includes excitation energy, lube oil and coolant pump loads. The above 4 or six lines are common to all sections and the data below relates to a particular turbine section. Entering the condenser pressure in one unit automatically calculates the value in the other unit.

23
Next the first turbine section is defined. This requires a control variable, type and identity be defined: throttle and extraction or exhaust connection must be defined in addition to valve flow limits, turbine efficiency and selection of backpressure or condensing as the final section connection. Separate turbine (engine) efficiencies are assigned to each section. Engine efficiency relates the mechanical work extracted by steam expansion through the section to the work from expansion in an ideal or ‘reversible’ heat engine. It is the change in steam enthalpy between inlet and outlet divided by the enthalpy change achieved by an ideal heat engine with the same steam pressures – ‘ideal’ here means that the steam entropy is not increased by the expansion process. The section efficiency enables SteamWizard to calculate section steam outlet temperature, and by energy balance the turbine section shaft power. Total generation is the sum of power generated from each section.
Formally:
Section Engine Efficiency =
(Section Inlet Enthalpy – Outlet Enthalpy) / (Section Inlet Enthalpy – Ideal Outlet Enthalpy)
Where Ideal outlet Enthalpy = Enthalpy at outlet pressure having the same Entropy as the inlet steam Typically, if you are trying to predict the performance of a steam turbine section, you probably know the end point pressure and the turbine section efficiency, you can then enter efficiency directly. If you are trying to define the performance of a turbine section from either a heat balance or actual plant data, you will know the end point pressure and perhaps enthalpy, temperature or quality (if the endpoint is in the wet region.) In that case use a commercially available steam property PC application such as ‘Desk Top Steam’ to derive section efficiency. Valve flow limits are normally obtained from the TG vendor. Header connections are made using selection buttons that appear when the connection window is clicked. If the turbine has a condenser, condenser pressure windows appear beneath the descriptor line. If there are more sections to add, clicking on the ‘Section Number’ allows the next section to be added. Only permissible header connection buttons will appear for each section - lower pressure headers than for the previous section extraction. There can in principle be as many sections as there are headers (including a final condensing section). The data required for turbine configuration is generally available as a family of guaranteed throttle and extraction flow versus power curves, one for each section, supplied by the vendor.
The turbine configuration display has two drop down lists, one for turbine selection and one for section selection within that turbine. To select a section, click the arrow on the right of the lower of the two data boxes at the bottom of the form and click on the desired section, its data will then be shown and can be modified. To add a section, click on the section number (top) data box and follow the prompts, the section number will be automatically incremented. Sections must be built in order of pressure (highest first), when data for a section is complete the section must be built by clicking the ‘Build’ button. Although a turbine/generator can be ‘cloned’, from an existing example in your model, only the first section will be copied. Subsequent sections must be entered anew. This is necessary to force the builder function to create new controls for each section. Miscellaneous mechanical drive turbines can be included as part of the general external header load, and subtracted from the load of the exhaust header in case of back pressure turbines.

24
4.3.6 Pressure Reducing Valves
Figure 10 PRV Configuration Display
Pressure reducing valves (PRVs) are fairly straight forward most of the above choices being fairly self explanatory. The header connections are identified by ID and are selected from available headers using buttons that appear when the connections window is clicked – only suitable headers are shown (for instance if the inlet header has been specified, only lower pressure ones are shown for the outlet header). You can configure or remove a de-superheater by clicking ‘Config De-superheater’ and clicking the de-superheater button of the two selection buttons that appear. If a de-superheater is configured, the temperature control is ‘implied’ and is not accessible; the setpoint is entered by clicking on the line below the de-superheater entry and entering the setpoint in the message window. To select the valve characteristic, click one of the selection buttons that appear when the data box is clicked. The characteristic is the relationship between valve opening (%) and percent of wide open flow coefficient; it only affects dynamics and control stability and not final equilibrium state. There are three valve parameters for flow: Cv relates to liquid flow, Cg to gas flow and C1 to pressure recovery downstream of the valve. The relationship between these is given by the following equation: Cg = Cv x C1 The pressure drop across the valve is calculated by SteamWizard using an industry standard formula that depends on Cv and C1, but in fact any two variables can be specified and the third will be calculated and displayed per the above expression. For control there is a choice of controlling either upstream or downstream header.

25
4.3.7 Fuel Configuration Display: The fuel configuration display at left comes with a number of default fuels that are pre-loaded into SteamWizard. You can use the display to modify them or to add any number of new fuels. To enter or modify numerical data click on the data boxes and enter the data on the resulting data entry window. Apart from ID and descriptor, you must specify solid/liquid/gas state, calorific value, mass or volume unit, specific gravity (SG), flow timebase, cost per unit or cost per BTU. You must enter the physical state of the fuel before selecting units so appropriate flow and HHV units can be assigned. The flow unit will automatically be shown on the last line based on the measurement unit and flow timebase selected. Unit, fuel state and timebase entry is based on selection buttons that appear on the right of the display when the data box is clicked - click the appropriate button to select the item.
Changing any cost value will automatically update the other two based on current units selected. Changing the SG will automatically update the HHV per unit volume based on BTU/Lb. Changing either HHV entry (per mass or per volume value) will automatically update the other one. This ensures the values are consistent.
Fig. 11 Fuel Configuration Display

26
5. SteamWizard Run Mode and Displays In run mode the function blocks and controls that make up the model of your plant are processed in a way that allows them to interact in a realistic way, conforming to the laws of thermodynamics. The controls will cause the modeled plant to approach or reach thermodynamic equilibrium, depending on the tuning of the controls. Such stability almost never happens in a real plant, so it’s more difficult to evaluate energy processes through ‘snapshot’ type data collection. Data collected in this way do not allow for rates of change and hence of energy storage effects in boilers and headers. SteamWizard allows you to reach much closer to true equilibrium to evaluate costs without these distorting effects. Note that entering data in the data boxes on the run mode displays is always done by clicking the box first, then entering the data on the resulting ‘pop up’ form. This is so that the data can be verified before it becomes part of the model. Entering keystrokes with the cursor in a data box results in a warning message and the entries are discarded. The main displays in run mode are the flow diagram or system overview display and the utility display; in addition there are detail displays for each type of process plant. 5.1 P&ID or SteamWizard Main Status Display:
Figure 12 SteamWizard Overview (P&ID) Display

27
The P&ID display appears automatically when SteamWizard is in run mode; it shows the steam headers with all the items of plant connected to them. The headers are shown in descending order of pressure from the top. Connected boilers, PRVs etc. are shown from the left in the order in which they were built. Connecting lines from headers to PRVs and from TG extractions to headers are not shown to avoid visual clutter. Square icons, color matched to the connecting header, symbolize these connections; they also act as buttons to invoke detail displays for each connection when you click on them. With each plant item there is a data window showing pressure, flow etc., clicking on this will invoke a detail display or displays from which operating changes can be made and more detail about the item can be seen (see section 5.4 ‘Detail Displays’ Page 30) Beneath each header there is a steam load ‘window’ that shows total external steam load of the header, clicking on these allows the load to be changed. The load represents such things as heating or export steam, miscellaneous turbine drives etc. and includes anything not specifically configured. Every item has associated controls that are automatically created and named corresponding to the control options configured for the item (eg. turbine flow or pressure control). These controls are shown when the item data window is clicked. Each control item has a tag name that is used for internal communication; these are automatically assigned at build time per the control type you configured. Automatic assignment saves a lot of time and effort and avoids the possibility of control configuration errors. For each header the energy cost per hour is shown at current conditions and at the top of the display total energy costs of steam and power for the plant are shown. Elapsed time count rate follows model speed changes. Also at the top right of the display are buttons for clearing all detail displays and for starting/stopping the simulator. There is an elapsed time indication at the top of the display. This shows model time elapsed since the run was started. Various functions are available on the task bar (left to right):
View plant or control configuration details on a spreadsheet. Create data analysis spreadsheets showing comprehensive thermodynamic and cost data for
total system or sub classes (headers, boilers, GTs, TGs, PRVs.) Feedwater data System data (scenario data), print system display. Reset header pressures or elapsed model time. Return to configuration display to modify plant model. Graphical Trend display and process disturbance selection.
The functions of these are described in more detail in ‘Auxiliary Functions’ section 6, page 34. The ‘View Details’ function displays configuration or controls data for the current system on an Excel spreadsheet (requires a licensed copy of MS Excel). At the top left of the display are command buttons to stop SteamWizard calculating, to switch to configuration mode, to reset the model elapsed time indicator, to start random load changes and to reset the headers to nominal pressure, in case an operating decision causes the headers pressures to be ‘beyond recall’. At the lower left are command buttons to invoke the utility menu and to clear detail displays. On the right hand side there are two sets of horizontal bar indicators. These show the net flow and pressure error of each header. The bars show how far each header is from equilibrium – both bars are minimized when equilibrium is achieved - every variable is at setpoint and no further control changes will be made.. The width of the bars shows magnitude (no sign) and is scaled to the normal operating value for the header for consistent scale (% of normal pressure/flow per unit width). When the bars have been minimized they turn green and when they are all green SteamWizard will stop - the ‘stop’ button then changes to read ‘Start Model’ and turns from green to red. If a destabilizing change is subsequently made, SteamWizard must be restarted and re-converged.

28
5.2 Run Mode Utility Display: The utility display appears superimposed on the overview display when SteamWizard is in run mode and it contains various model functions on command buttons just beneath the title. Some functions of the overview display may be cause it to cover the utility display, but clicking anywhere on the blue background of the overview will bring it ‘to the front’. Alternatively you can click the utility title on the windows taskbar.
Figure 11 SteamWizard ‘Run Mode’ Utility Display
Clicking the Graphics command on the left shows a list of graphic displays available in run mode as shown in fig.13 above. Clicking a list item invokes the named display.
Figure 15 SteamWizard ‘Run Mode’ Utility Display - Graphics
Clicking Save/Restore’ invokes a display that allows you to save and restore operating scenarios to/from disc; you can also change titles and scenario names. Display functionality is described further in ‘Saving a Scenario Section 6.1, page 34. The ‘Printers’ command invokes the standard windows printer menu for printing the main display. The overview display is printed with a light background to conserve ink and to aid readability. The ‘Data Transfer’ function command uses MS Excel and you must have a properly licensed copy of Excel to use it. It can initiate two kinds of spreadsheet displays ‘Synchronise’ and ‘Import/Export’ that show all process values of the plant and all control inputs. The process values (process variables) can be used by any application capable of pulling data from an Excel spreadsheet. The control inputs (ie controller outputs) can be modified from the spreadsheet or by any application that can write to it. The spreadsheet is automatically formatted and populated to correspond to the current configuration in SteamWizard. The spreadsheet can act as a software interface to other applications.
Figure 16 SteamWizard ‘Run Mode’ Utility Display – Data Transfer

29
The Synchronise function uses static data and is intended for off line experimentation. This is a very useful feature as it allows you to try out operating strategies to take you from the current plant conditions to a more economical or otherwise better operating state – the classic ‘what if’ type of analysis. It works by creating a spreadsheet that you can use as an interface with other software or for off line analysis. For more details see ‘Some useful features’ under ‘Synchronisation’, section 6.2, page 41. The Import/Export function is similar to synchronisation except that it works in real time, for instance to continuously monitor plant costs by forcing the model to duplicate the real plant state as it changes. Note this feature requires additional software to pull data from the plant DCS interface and copy it to the spreadsheet. For more details see ‘Some useful features’ under ‘Import/export’, section 6.3, page 41. ‘Minimise’ hides the utility display in the Windows taskbar. ‘Quit’ shuts the program via a ‘second thoughts’ message that allows you a chance to save or change your mind. Clicking the ‘calculation speed’ box below the command buttons allows you to change the model speed; clicking the box brings up a message prompting you to enter a new speed. The practical limit of speed depends on the complexity of the system you configured, the power of your CPU and what other applications you have running. You may not achieve the nominal speed increase over real time and you can see this in the elapsed model time indication that reflects the actual number of iterations performed. SteamWizard does a lot of calculation and the more CPU power the better! 5.3 Detail Displays of process Plant There are detail displays associated with each plant type, these are invoked from the overview display as described above (section 5.1 page 22), by clicking on any of the data boxes or connection symbols on the display. In most cases, several displays appear including associated controls. To prevent too much clutter, invoking a new display removes those already being shown. There is also a clear display button on the overview display to clear all detail displays with a single ‘click’. 5.3.1 Header Detail
The steam header detail display shows header steam pressure, temperature and enthalpy, supply flow, demand, and net flows, external load, safety relief valve (RV) flow and energy loss rate. None of the data box values can be changed. In addition there are random load change up and down keys. These cause the amplitude of random load changes to be larger or smaller for each header, relative to the default value which has an arbitrary of unity. The RV trip pressures are automatically set at a reasonable percent above normal header pressure to keep the model within a physically realistic state from which you can recover. An alternative under these circumstances would be to restore the last saved state -remember ‘save early and save often’. Associated Displays: none
Figure 17 Steam Header Detail

30
5.3.2 Boiler Detail
The boiler detail shows the boiler descriptor and basic boiler operating data as shown in fig.17. Except formanually controlled fuels, none of the values can be modified, but there are a number of auxiliary displays you can invoke by clicking on command buttons at the top of the display. These displays allow you to modify boiler variables such as load/efficiency curve, steam temperature curve, fuel parameters and some boiler parameters such as min/max demand, lag time, fuel HHV, blowdown flow (as % of feed flow) and heat recovery (see auxiliary diaplays section 6 page34). If the boiler is automatically controlled, the controlled fuel is always at the top of the list, the others being manually controlled. The automatic fuel can only be changed from the manual station that is displayed next to the HRSG detail and it must be in manual mode. The manual fuel flows can be changed by clicking the flow data boxes and entering the flow on the resulting data entry window. If more than one boiler is controlling a header pressure, its manual
Figure 18 Boiler Detail Display station and the corresponding pressure controller and will be shown with each boiler. If all the boiler manual stations are put in manual mode, the pressure controller will be initialized and its output frozen so that it does not ‘wind up’ (see also Manual Station Display section 5.5.1 page 32) A trip button enables you to ‘trip’ the boiler, cutting off the fuel supply and causing steam flow to decline to zero per the configured lag time. Associated displays: Manual station (Always shown)
Header Pressure Control Detail (optional) Boiler parameters Boiler Efficiency Curve Data Fuel parameters Steam Temperature Curve
5.3.3 Heat Recovery Steam Generator (HRSG) Display
The HRSG detail shows the steam generator description and the same basic boiler variables as the regular boiler detail, except for demand. The HRSG does not have a total demand value since some of its ‘fuel’ is GT exhaust that is externally controlled. The duct burner fuel flow can be changed from the associated manual station that is displayed next to the HRSG detail. The display buttons at the top are the same as the boiler detail display except there is no efficiency button, since HRSG efficiency is specified on the associated GT (configuration) display. Associated displays: Manual station (Always shown) Gas Turbine Detail (Always shown) Boiler parameters Fuel parameters Steam Temperature Curve
Figure 19 HRSG Detail

31
5.3.4 Turbine/Generator Display:
The turbine/generator display shows the current generator output in Megawatts and the generator maximum power limit. On turbines with MW control an extra data box appears showing power setpoint value. You can change the target value by clicking on the data box and entering the new efficiency value on the resulting data entry window.
The trip button trips the turbine and shuts off all steam flows and power generation – the button caption changes to ‘Run’ and clicking it again will restart the turbine with the original setpoints. The ‘Limits’ button invokes a detail display allowing you to modify section maximum and minimum steam flows.
Figure 20 Turbine Generator
Associated Displays: Turbine Section (Always shown)
Section Controls Detail (Always shown) Turbine flow limits (Optional)
5.3.5 Turbine Section Display:
The turbine section display shows section valve position and extraction steam flow, pressure and temperature. This is a purely information display and none of the data points can be changed. If this is the first section, the throttle valve position is shown.
Associated Displays: Turbine/Generator (Always shown) Section Controls Detail (Always shown) Turbine flow limits (Optional)
Figure 21 Turbine Section 5.3.6 Turbine Controls:
The turbine extraction control display shows the section extraction steam flow and setpoint data. You can change the setpoint by clicking on the data box and entering the new setpoint on the resulting data entry window. One display is shown for each turbine section, directly beneath each section display.
Associated Displays: Turbine/Generator (Always shown) Turbine Section Detail (Always shown) Turbine flow limits (Optional)
Figure 22 T/G Section Control

32
5.3.7 Pressure Reducing Valve Detail
The pressure reducing valve detail display shows the basic valve operating data as well as % of maximum flow capacity (Cv) and steam inlet and outlet enthalpy. It also shows desuperheater data where desuperheating has been configured for the valve. The controls for steam temperature are not accessible but the setpoint can be changed by clicking on the data box for outlet temperature; this brings up a message box that prompts you to enter a new setpoint. It will not accept a setpoint below steam saturation temperature. If the PRV does not have a desuperheater configured, then the spray flow data are not shown. If more than one PRV is controlling a header pressure, its manual station and the pressure controller will be shown with each PRV. If all the PRV manual stations are put in manual mode, the pressure controller will be frozen so that its output does not ‘wind up’ (see also Manual Station Display section 5.5.1 page 32) .
Figure 23 PRV Detail Display Associated Displays: Manual Station (Always shown)
Header Pressure Control Detail (optional) 5.3.8 Feedwater Data
The feedwater data display shows feedwater temperature and enthalpy, condensate temperature and enthalpy, feedwater flow, condensate return flow (as % of feedwater flow) and deaerator temperature and pressure.
Only condensate temperature and return percentage can be changed. You can change these values by clicking on the appropriate data box and entering the new value on the resulting data entry window.
Changes to a feedwater parameter will affect all boilers since you are modifying the common feedwater database.
Figure 24 Feedwater Data

33
5.4 Auxiliary Displays: Several auxiliary displays associated with boilers, HRSGs and steam turbines; they are not automatically shown when a plant detail display is invoked, to avoid unnecessary clutter. They can be invoked from the detail display when needed by clicking on command buttons at the top of the display. The displays show boiler fuel parameters, fuel costs, steam temperature and boiler efficiency curves feedwater data and turbine flow limits. 5.4.1 Boiler Firing Parameters:
Figure 25 Boiler Firing Parameters
This display lets you change fuel maximum and minimum demand limits for automatic control (as % of maximum capacity or in eng. units), boiler lag time, fuel calorific value (HHV), blowdown flow (as % feedwater flow) and % of heat recovery from blowdown. A data point can be modified by clicking on the appropriate data box and entering the change on the resulting data entry window. Changes to a fuel HHV will affect all boilers that use the fuel, since you are modifying the common fuel database. 5.4.2 Fuel Cost Parameters:
Figure 26 Fuel Cost Data Display

34
This display shows fuel costs per unit mass, per flow unit and per MBTU, plus calorific value (HHV). The flow units (per timebase) are shown in a column on the left, after the fuel name. Any of these data point can be modified by clicking on the appropriate data box and entering the change on the resulting data entry window; Changing any cost item will automatically update the other two cost numbers for that fuel. All cost and HHV changes will be applied to the common fuel database, but you must click on the ‘Apply Changes’ button for them to take effect.
5.4.3 Boiler Efficiency Curve:
The boiler efficiency display at left is invoked from the boiler detail display and enables you to modify boiler efficiency. The boiler efficiency characteristic is represented by a four line segment ‘curve’ defined by five breakpoints. These specify boiler efficiencies corresponding to even load increments between 0% and 100% of boiler maximum continuous rating (MCR).
The individual breakpoints defining the shape of the efficiency curve cannot be changed here – for that you must go to the boiler configuration display, but by modifying the top (swing) fuel efficiency on the top data box on the left of the display you can shift the whole curve to have that efficiency at MCR – in other words you can raise or lower the curve on the efficiency axis. Click on the data box and enter the new efficiency value on the resulting data entry
Figure 27 Boiler Efficiency Display window. You can change the secondary fuels similarly.
Boiler efficiency with secondary fuels is based on the same curve, shifted to match the secondary fuel’s efficiency at MCR. For mixed fuel firing, boiler efficiency is based on an average of fuel efficiencies ‘weighted’ by the heat release (MBTU/Hr) derived from each fuel.
You must click the ‘Accept Data’ button for any changes you make to take effect.
5.4.4 Boiler Steam Temperature Curve:
The boiler steam temperature display at left is invoked from the boiler detail display and permits you to modify the boiler outlet steam temperature characteristic that is approximated by a four segment ‘curve’. The curve is defined by five breakpoints specifying steam temperature corresponding to even load increments between 0% and 100% of maximum boiler continuous rating (MCR).
You can modify the breakpoints by clicking on the appropriate data box and entering the change on the resulting data entry window; the display will check that the entered value is above saturation temperature.
You must click the ‘Accept Data’ button for the changes to take effect.
Figure 28 Boiler Steam Temp.

35
5.4.5 Turbine Flow Limits:
The turbine flow limit display at left is invoked from the turbine/generator display and permits you to modify the turbine section flow in kPPH limits lag time (in decimal minutes) and generator MW setpoint limits. You can modify the limits by clicking on the appropriate data box and entering the change on the resulting data entry window.
Figure 29 Turbine Flow Limits
5.4.6 System Data Analysis (Spreadsheet) Menu :
Figure 30 SteamWizard Data Analysis Display
Clicking on ‘Data Analysis’ on the toolbar invokes a selection menu shown in fig. 30 above. This enables you to display detailed engineering and cost information on the status of the system on an Excel spreadsheet (provided your computer has MS Excel installed). By clicking on the relevant button, you can request data on the individual plant types or all types (’Total Data’). The total data spreadsheet takes a while to build so progress is indicated by the length of two horizontal bars: yellow for calculating, green for formatting, accompanied by text describing the current operation. A separate worksheet is created for each plant type. For steam headers there are three choices:
A summary sheet showing the complete data for each header but not individual steam sources. A sheet showing headers in descending order of pressure with each steam source. A sheet sorted by plant type ordered with boilers first, then turbines and finally PRVs
(The last two sheets show the same data in the same column order.)

36
The data is not strictly valid until SteamWizard has reached equilibrium and a warning will be issued if it has not reached equilibrium yet. The spreadsheet will still be created but with a cautionary note: if the process is near equilibrium, the error will probably be small. Appendix 4 gives details about the attribution of costs, separation of feedwater costs and direct fuel costs of steam, energy split between gas turbines and HRSGs, etc.

37
5.5 Control Displays; The purpose of SteamWizard is to converge on the equilibrium state of the plant model that corresponds to the starting conditions you specify (setpoints, temperatures flows etc.) and then to calculate fuel the costs associated with that state. Rather than using abstract mathematical algorithms to achieve this, SteamWizard converges the same way a real plant does, using proportional and integral (P+I) controllers and manual stations to manipulate control valve positions, boiler demands, turbine extraction flows etc. These controls work the same way real digital controls do and the detail displays that allow you to interact with the controls are described below. 5.5.1 P+I Control Display:
The controller display at left shows the conventional P+I algorithm information including process variable value, setpoint, setpoint bias, output, mode, gain, integral time constant and output limits. You can modify any of these except mode by clicking on the appropriate data box and entering the change on the resulting data entry window. To change the controller mode, click on the mode button at lower right
You can change the controller instance shown by clicking on the ‘Change Tag’ button and entering the tag name in the resulting data entry window or by clicking the down arrow at the lower right and clicking on one the controllers shown on the drop down list that appears.
Figure 30 P+I Controller Display
A controllers in SteamWizard will have at least one manual station connected to its output and if the manual station or stations are put in manual mode (freezing its output), the controller will be will be initialised, its output also frozen so that it does not ‘wind up’ due to integral action. When the first manual station is restored to cascade mode, the controller output will be initialised to equal the manual station output. This prevents any output disturbance due to the controller output suddenly causing the manual station output to change. 5.5.2 Manual Station Control Display:
Manual stations are for boilers and PRVs. And are a way of isolating a control device or demand from a connected P+I controller in a standardised way.
The manual station (automan) display at left shows the bias, output, output limits, rate limit and mode. You can modify any of these, except mode, by clicking on the appropriate data box and entering the change on the resulting data entry window. To change the mode, click on the mode button at lower right.
The mode has two possible states –‘Manual’ in which the output is fixed at the last value set by you or by a controller connected to the input and ‘Cascade’ in which the output is equal to a connected controller’s output plus or minus the value of the bias, depending on it’s sign (if there is no controller, cascade is mode
Figure 31 Manual Station Display is not available). Bias is only relevant if the station is receiving an input from a controller and there are other manual stations connected to the same controller. Bias allows one of the stations to have a higher or lower output than the others without putting it in manual mode. The bias value is added to the control signal to produce the

38
station output; because the bias is signed it can increase or decrease the output from the controller output value. When the first manual station is restored to cascade mode, the controller output will be initialised to equal the manual station output. This prevents any output disturbance due to the controller output suddenly causing the manual station output to change. If a manual station is restored to cascade mode, the controller output will be initialised to equal the manual station output. This prevents any output disturbance due to the controller output suddenly causing the manual station output to change. If there are other manual stations connected to the controller output their bias terms will be ‘back-calculated’ to equal the difference between the controller output and the manual (input + bias = previous manual output). station output when they are restored to cascade mode. The Bias term is subsequently gradually removed at a rate equal to the rate limit. The rate limit restricts the rate at which the output can change in % per minute. Output is the value in percent that is used by the connected plant item to calculate its load point (boiler demand, PRV valve position etc.) The output limits limit the output range when the station is in cascade mode.
You can change the manual station shown by clicking on the ‘Change Tag’ button and entering the tag name in the resulting data entry window or by clicking the down arrow at the lower right and clicking on one the manual stations shown on the drop down list that appears.

39
6. Auxiliary Functions: 6.1 Trend Display Overview:
The trend display shows selected model variables graphically as they vary with elapsed time. The display follows typical process control trending conventions and allows up to six variables to be displayed at one time. Notable features are as follows:
Eight user selectable timebases between 1 minute and 4 hours of displayed duration. List of points available for trending. Automatic or manual assignment of trend colors ‘on the fly’. User set trend ranges with ‘smart’ initial assignment. Cursor to indicate trend values at a selected time. Indication of trend variable descriptors and ranges User can delete and assign trend variables ‘on the fly’. Remembers previous trend range values of each point. Print display and corresponding numerical data.
6.1.1 Trend Display:
Figure 32 Trend Display

40
Clicking on one of the point descriptors or it’s data boxes on the left invokes its range values on the vertical (right hand) scale, the colored ‘current value’ box border color indicates which variable/trace range is being displayed. Clicking the high and low range values invokes a popup menu that allows the user to enter a new range value. Clicking on the trend area brings the cursor to the ‘clicked’ point on the time axis and changes the values displayed to the right of the descriptors to the trace values at the cursor time.
Normally the traces are refreshed every 5 seconds, to limit CPU loading, but the ‘Refresh’ button forces the traces to be refreshed immediately. The ‘T base’ button invokes the timebase (time span) list - trends of 20 minutes or less use real time values, trends of 1 hour or more use 0.2 minute average values.
The ‘Sel. Tag’ button shows a list of available variables. The ‘Delete’ button deletes whichever variable/trace is currently selected.
The ‘Ranges’ button shows a list of all the trended points with their range values. To avoid having to write down all the ranges, the ranges function is temporarily invoked for printing.
The ‘Print’ button causes the selected printer to print the display as shown. The ‘Sel P’ (printer select) button invokes the standard Windows printer menu allowing the selection of a suitable (preferably color) printer.
The ‘Trnd #’ (Numeric Trend) button creates a spreadsheet showing the numerical values of the graphical trend display; the spreadsheet header has a comprehensive data block plus tag-name, range and time stamp information for each set of trend values.
Figure 33 Numeric Trend Display

41
6.2 Saving a Scenario: Saving and retrieving a scenario to disc is via the ‘Save/Restore’ Display. Here the term scenario means a configured system (plant model) plus its complete state at a particular moment. If a scenario is restored to SteamWizard, it is as if time has been stopped – the system will resume its behavior as if nothing had happened. A scenario can be given a detailed description and will automatically have the project name and a time/date stamp assigned when it is saved.
Saving can be done in two ways corresponding to two types of file format: the normal method is to save a checkpoint (binary) file using the file save display. This method had the disadvantage that it cannot be edited. Viewing or changing it can be done by restoring the scenario to SteamWizard and making the changes there. The other method of saving a scenario is to save it as a text file. This takes a little longer but can be viewed and edited off line, provided you don’t mind dealing with strange parameter names. The danger with text files is that there is no protection against invalid entries or typos. These may cause error messages at run time or cause SteamWizard to behave unpredictably. The display for saving to checkpoint is shown at left, and can be called up from the utility display or the configuration display or is automatically invoked by various other displays. The drive and directory are selected in the usual windows fashion and a file extension can be selected from the existing extensions shown on the left hand list.
Figure 34 Save and Restore a Scenario to Disk Display
If a new scenario extension is required it can be entered at the top of the display as three numerals, numerical file extensions are the method of identifying scenarios. You can enter the project name and scenario detail descriptor in the windows at the bottom of the display. Clicking on the ‘Save Scenario’ button saves the scenario to the selected drive/directory as a series of filenames related to plant types all with the file extension you specified. The time and date of the save are also saved and will be displayed when the scenario is later selected for restoration. The ‘View Configuration’ button invokes a multi-page spreadsheet display showing all configuration data contained in the checkpoint. Saving to a text file uses a display almost identical to the checkpoint display, and is called up from the configuration display using the ‘Text File’ button. Because the file can be viewed with a text editor or word processor; no spreadsheet viewing function is available for text files, although the configuration can be viewed after loading in run mode with the ‘View Config’ function. The status of the saving operation is shown while in progress since it can occupy several minutes.

42
6.3 Synchronising SteamWizard to the current Plant state: The ‘Synchronise’ function allows you to copy the state of the real plant to your plant model, either on a one-shot or continuous basis. The one-shot (static) function is intended for off line experimentation; this is a very useful feature as it allows you to evaluate operating strategies to transition from the actual plant conditions to a lower cost or otherwise better operating state – the classic ‘what if’ type of analysis. It works by creating an MS Excel spreadsheet that you can use as an interface with other software or for off line analysis. You must have a properly licensed copy of Excel to use this function. The continuous synchronisation function is the same as the one-shot except that it is repeated automatically every 10 seconds. Continuous synchronisation makes SteamWizard a continuous indicator of plant performance, using the built in economic analysis functions. Both sync. functions use the real world setpoints and target values to program Steam Wiz’s controls, which continue to operate. With continuous synchronisation SteamWizard will attempt to converge between updates – unless the plant state is changing rapidly or your CPU is slow, the model will give a reasonable indication of real-time costs. The spreadsheet shows all process variables of the plant and all control variables (set points, fuel rates etc.) The process variables can be freely used by any application capable of pulling data from a spreadsheet. The control variables can be modified from the spreadsheet or by any application that can write to it. The spreadsheet is automatically formatted and populated to correspond to the current configuration in SteamWizard. The spreadsheet can act as a software interface to other applications.
Figure 35 SteamWizard ‘Run Mode’ Utility Display – Data Transfer Selection
You can find this function by clicking ‘Data Transfer’ on the utility display then clicking the ‘Synchronise to external Data’ command. This invokes a message box that may state a file already exists with the required file name. This is a windows safety feature since you are creating a new spreadsheet with the same name as an existing one - click ‘Yes’ to proceed or ‘No’ to change the filename. After several seconds the spreadsheet appears, you can now paste in the data you wish the program to use in the ‘real state’ column. Note: you must complete data entry to the cells before synchronising – leaving a cell with no data entered will cause the synchronization process to fail (but SteamWizard will continue to run). For single-shot synchronisation, when you click the ‘synchronise to external data’ command, the ‘synchronise’ button on the Utility graphic changes from ‘inactive’/grey to ‘Active’/Red - clicking it will cause the model to load the new values and continue running with them. Sychronisation is a single shot process and happens only once per ‘click’ of the Synchronise button, but you can synchronise any number of times. If the process fails, just cancel out of all windows that appear, close the spreadsheet and start again, to save the spreadsheet use a different name, as the default file name will be overwritten. For continuous synchronisation no action is required after the spreadsheet is created and displayed. Data transfer takes place automatically every 10 seconds of real (clock) time. Note this feature requires you to provide external software to pull data from the plant digital control system (DCS) interface and write it to the spreadsheet.

43
6.4 Importing and Exporting Data from SteamWizard: The Import/Export function works in real time to continuously export all model process variables to a spreadsheet for analysis or other uses, at the same time accepting control inputs (setpoints, target values etc.) and external variables (steam temp. and header steam loads) from an external source. Note this feature requires additional software to pull data from the plant digital control system (DCS) interface. The two way data transfer is repeated every 10 seconds of real (clock) time. If your independent software writes to the import section of the spreadsheet, the model will periodically accept control controller setpoints manually adjusted fuel flows and externally specified conditions such as external header steam loads, boiler steam temperatures etc. Normal steam temperature calculation is suspended while data transfer is active and resumes automatically when you cancel it. You must have a properly licensed copy of Excel to use this function. This function can be used to test and evaluate an externally determined control strategy responding to the exported model variables. The update frequency is reasonable since the control inputs are setpoints rather than actual controller outputs, which would require a much faster update frequency. 6.5 ‘View Configuration’ Display: This feature is accessed from the overview display or from the configuration display. Clicking the ‘View Config.’ button on either display creates a spreadsheet that shows all the configuration data you entered itemised per plant type, with a separate sheet (page) for each type. You may see a message asking if you want to overwrite the existing default filename. Click ‘yes’ and proceed, you can save the spreadsheet under a different name to ensure it does not get overwritten. You must have a properly licensed copy of MS ‘Excel’ to use this function. The configuration shown in run mode is the current configuration that is running. The configuration shown when in configuration mode (invoked from the file/save display) is whatever configuration was specified by file-extension, this enables you to inspect the configuration before you load it in configuration mode. Fig. shows the sample minimal system configuration display for headers.
Figure 36 SteamWizard Configuration Display – Steam Header Sheet.

44
6.6 Scenario Display: This feature is accessed from the overview display taskbar or from the configuration display and shows the title and save date of the current scenario running. The scenario name can be changed and re-saved using the File save display. 6.7 Print Overview Display Function: This uses the default printer to print the display in ‘landscape’ orientation. It prints background much lighter than it appears on screen to conserve ink/toner. 6.8 Currency Change Function: On the start display, the currency change button allows you to apply different currency symbols. This does not convert from a previous currency and you must re-enter the fuel prices in the new currency.

45
Appendix 1- Software Block Diagram:
Figure 37 - SteamWizard Software Block Diagram
Appendix 2 - A note on accuracy: The accuracy attained by SteamWizard reflects the accuracy generally available from industrial instrumentation. Some measurements are inherently less accurate than others. Temperatures, especially if measured with resistance temperature detectors are quite accurate (< ½ % of span). Continuous flow has to be inferred and is inherently less accurate measurement than pressure and temperature - often worse than +/- 1 - 2% and difficult to verify; calibrating a differential pressure transmitter does nothing to correct a worn orifice plate or flow nozzle. SteamWizard depends on data derived from industrial grade measuring instruments that are typically (optimistically) within +/- 1 % of span. The other factor determining the accuracy attained by SteamWizard is the property of steam and water calculations. These have been developed to achieve accuracy better than 0.2 % and are for the most part better than 0.1%. The aim was to make the accuracy of SteamWizard results a function of the input data accuracy, rather than of the internal calculations.

46
Appendix 3 – Configuration Spreadsheet: Figure 35 below shows the turbine/generator page of a configuration spreadsheet. This shows the engineering parameters and units on the left two columns then columns for each item to the right. In the case of turbines, there is one column per section with common parameters in the leftmost column for each item. There are also explanatory notes relevant to each device type.
Figure 38 - Configuration spreadsheet page for Turbine/Generators
Appendix 4 – Units of Measurement: The following units were used for each measurement type:
Measurement US Unit Name Electric Power MW Megawatts (Million Watts) Energy MBTU Million British Thermal Units Energy flow MBTU/Hr. Million BTU per hour Enthalpy Btu/Lb. British Thermal Units per Pound Steam/Water flow kPPH Thousands of Pounds per hour Compressible flow kSCFH Thousands of Std. Cubic Feet per hour Liquid (fuel) flow Gpm/Gph Gallons (US) per minute/Gallons (US) per hour Solid flow Tons per hour (Short) Tons per hour Mass Lb. Pounds Mass Regular Pressure Psig. Pounds per Square Foot Gauge Draft Pressure In.WC Inches Water Column Temperature Deg.F Degrees Fahrenheit
Figure 39 - SteamWizard Units of measurement

47
Appendix 5 – Data Spreadsheet and Cost Attribution: The data spreadsheets show the engineering data and energy costs for steam headers, boilers, PRVs, turbines and users. There are several effects that complicate attribution of costs, such as the energy recycled into feedwater heating and the energy split between gas turbines and HRSGs. Cost of Steam For internal use only the fuel cost of generating steam is considered, but for steam exported from the system, the cost of feedwater is added to this. This enables the deaerator exit feedwater cost to be evaluated in a straightforward manner, since typically the steam supplying the deaerator is cascades through several headers via various devices such as turbines and PRVs. The cost of electrical generation and steam supply to external users therefore has the cost of feedwater added to the internal ‘fuel cost’ of steam attributed to the particular use. Costs of Gas Turbines and HRSGs: This section describes the principles used to assign operating costs to GTs and HRSGs, whose fuel energy is shared and whose cost attribution is therefore not immediately obvious. The attribution of costs to gas turbines and HRSGs is based on treating GT exhaust as HRSG ‘fuel’ with the residual fuel energy not absorbed by the GT. The division of costs is then fuel cost times the fraction of energy absorbed by each machine, taking into account combined cycle efficiency (εCC ) and generator efficiency (εgen). Costs are attributed to each HRSG pressure circuit in proportion to the fraction of HRSG energy absorption is assigned to that circuit. The following definition of combined cycle efficiency is used:
εCC = (GT shaft energy + HRSG steam energy + blowdown energy*) / (GT + Duct Burner fuel energy) *Note: conventionally efficiency includes blowdown energy since it has been absorbed and may be recovered. Combined cycle efficiency is an overall characteristic inherent in the vendors fuel/power curves. The GT cost fraction is calculated as follows: GT cost fraction = GT shaft energy ÷ Total Energy absorbed by GT & HRSG
= (Generator kW x 3413 / εGen ) / ((GT + Duct Bnr. Fuel BTU ) x εCC) Finally:
GT (electrical) cost per hour = GT Fuel cost per hour x GT cost fraction GT (electrical) cost per kWh = GT (electrical) cost per hour / (generated power (MW) x 1000) For a HRSG, the cost of GT exhaust energy is calculated thus: GT Exhaust energy cost/hour = GT Fuel cost per hour x (1 – GT cost fraction) Also: Total HRSG fuel cost/hour = GT Exhaust energy cost/hour + Duct burner fuel cost/ hour For each HRSG steam circuit, costs are attributed in proportion to the percentage of total HRSG energy absorption absorbed by that circuit, as entered during configuration. Having calculated a HRSG circuit’s fuel costs, its steam cost is calculated in exactly the same manner as the power boilers.

48
Cost of Steam Turbine Power Generation: Power cost in $/Hr. for steam turbine/generators is given by: Throttle steam cost $/MBTU x (Throttle flow x Inlet Enthalpy - ∑ (Extr. flow x Extr. Enthalpy)) / 106
Where flows are in Lb/Hr. and enthalpies are in BTU/Lb. and the export steam cost $/MBTU is used. The expression inside the brackets gives the residual turbine shaft energy in BTU/Hr. going to the generator after the extraction steam energy has been subtracted. The cost per kWh is then simply Power Cost $/Hr. / (MW x 1000), times100 for cents per kWh. Appendix 6 – License Agreement: You must agree to the following agreement before you can use SteamWizard, as denoted by clicking on the I Agree target on the start up license agreement page. THORNHILL AUTOMATION SERVICES LICENSE TERMS: This License Agreement governs your use of the enclosed Software product. By installing and/or using the Software, you agree to be bound by the terms of this Agreement. If you do not agree to these terms and conditions, promptly return all the components of this product to the place of purchase and your money will be refunded. License: This License Agreement allows you to use one copy of the enclosed Software on a single computer. If you install the Software on a network server, you must purchase a separate copy of the Software for each computer that will be used to operate the Software. If the Software is permanently installed on the hard disk or other storage device of a computer (other than a network server) and one person uses that computer more than 80% of the time it is in use, then that person may also use the Software on a portable or home computer. Copyright: The Software is owned by THORNHILL AUTOMATION SERVICES ("TAS") and is protected by Canadian copyright laws and international treaty provisions. Therefore you must treat the Software like any other copyrighted material except that you may either (a) make one copy of the original Software disks solely for backup or archival purposes, or b) transfer the Software to a single hard disk, provided you keep the original solely for backup or archival purposes. You may print a single copy only of the user documentation accompanying the Software in electronic form. Other Restrictions: This License must be retained by you. You may not rent or lease the Software. You may transfer our rights under this License on a permanent basis only if you transfer this License, the Software, and all accompanying printed materials, retain no copies, and the recipient agrees to the terms of this License. You may not reverse engineer, decompile, or dis-assemble the Software. Limited Warranty: TAS warrants that the Software will perform substantially in accordance with the accompanying printed materials for a period of ninety (90) days from the date of receipt. Any implied warranties on the Software are limited to ninety (90) days. Some jurisdictions do not allow limitations on duration of an implied warranty, so the above limitation may not apply to you. Customer Remedies: TAS's entire liability and your exclusive remedy shall be, at TAS's option, either (a) return of the price you paid or (b) repair and replacement of the Software that does not meet TAS's Limited Warranty and that is returned to TAS with a copy of your receipt. This Limited Warranty is void if failure of the Software has resulted from accident, abuse, or misapplication. Any replacement Software will be warranted for the remainder of the original warranty period or thirty (30) days, whichever is longer. Outside Canada, neither these remedies nor any product support services offered by TAS are available without proof of purchase from an authorized non-Canadian source. NO OTHER WARRANTIES: TO THE MAXIMUM EXTENT PERMITTED BY APPLICABLE LAW, TAS DISCLAIMS ALL OTHER WARRANTIES, EITHER EXPRESS OR IMPLIED, INCLUDING BUT NOT LIMITED TO IMPLIED WARRANTIES OF MERCHANTABILITY AND FITNESS FOR A PARTICULAR PURPOSE, WITH RESPECT TO THE SOFTWARE AND ACCOMPANYING WRITTEN MATERIALS. THIS LIMITED WARRANTY GIVES YOU SPECIFIC LEGAL RIGHTS. YOU MAY HAVE OTHER RIGHTS, WHICH VARY FROM JURISDICTION TO JURISDICTION. NO LIABILITY FOR CONSEQUENTIAL DAMAGES: TO THE MAXIMUM EXTENT PERMITTED BY APPLICABLE LAW, IN NO EVENT SHALL TAS BE LIABLE FOR ANY DAMAGES WHATSOEVER (INCLUDING, WITHOUT LIMITATION, DAMAGES FOR LOSS OF BUSINESS PROFITS, BUSINESS INTERRUPTION, LOSS OF BUSINESS INFORMATION, OR OTHER PECUNIARY LOSS) ARISING OUT OF THE USE OF INABILITY TO USE THIS TAS PRODUCT, EVEN IF TAS HAS BEEN ADVISED OF THE POSSIBILITY OF SUCH DAMAGES. BECAUSE SOME JURISDICTIONS DO NOT ALLOW THE EXCLUSION OR LIMITATION OF LIABILITY FOR CONSEQUENTIAL OR INCIDENTAL DAMAGES, HE ABOVE LIMITATION MAY NOT APPLY TO YOU. Should you have any questions concerning this agreement, please contact in writing: THORNHILL AUTOMATION SERVICES - 108, SUGARLOAF STREET, PORT COLBORNE, ONT. CANADA, L3K 2N4
Related Documents


