5-1 5 SITE EVALUATION 5.1 Introduction Site selection is one of the most profound and vexing choices one faces in planning an observatory. The properties of the site impact the range of science that can be contemplated, the cost of construction and operations and the working environment for the observatory staff and visiting astronomers. The question of site is made all the more daunting because the choice is final and yet must be made on the basis of information that is incomplete at best. The GMT project is in the enviable position of having clear access to a developed site with a long history of excellent performance. The Las Campanas Observatory (LCO) in Chile has been known to be an outstanding site for more than 30 years. The quality of the seeing at LCO is as good, or better, than at any other developed site in Chile. There is negligible light pollution and little prospect of any in the future. The weather patterns have been stable over the past 30 years and there are reasons to believe that the cyclical variations present in the tropical zones do not reach the latitude of Las Campanas. It appears that there are no currently developed peaks in Chile that exceed LCO as an astronomical site. Las Campanas has been a field station for the Carnegie Institution of Washington since 1969. Carnegie has clear title to the land and a solid working relationship with the Chilean government and the major research universities. Other parties are able to construct and operate telescopes on Las Campanas under the umbrella of Carnegie’s agreement with the U. de Chile and several institutions have done so. Building the GMT at Las Campanas not only avoids potential legal and financial obstacles, it also reduces operation expenses by distributing infrastructure costs among other users of the site. The proximity of LCO to La Serena (the regional capital) provides a convenient logistical base and ensures a stable source of qualified employees who enjoy a high quality of life, a non-trivial consideration for an operation of the size and complexity envisioned for GMT. Several of the GMT partner institutions have an on-going commitment to Las Campanas via their participation in the Magellan twin 6.5m telescope consortium. This provides both strong scientific synergy between the two facilities and, potentially, simplifications and cost savings in operations. There are two known scientific drawbacks to the LCO site. The first relates to the fraction of clear nights. Las Campanas and the other mid-latitude sites (Cerro Tololo, Cerro Pachon, La Silla) have seasonal weather patterns that negatively impact the fraction of photometric nights in the Chilean winter. Sites to the north (e.g. Paranal) are affected less by winter weather, and so have a higher fraction of clear nights. However, the precise extent of this effect is unclear as the more northerly sites may suffer more from long term weather cycles. The counter argument is that locating GMT at a new site in the north of Chile, while improving the number of photometric nights, exposes the project to the risk of long-term variability of the seeing. This appears to be the case at Paranal, where the wind patterns have changed since the time of the VLT site survey. At this time, it is felt that the potential gains offered by a moderate elevation northern site are more than offset by the risks associated with selecting a new site on the basis of a short site survey.

Welcome message from author
This document is posted to help you gain knowledge. Please leave a comment to let me know what you think about it! Share it to your friends and learn new things together.
Transcript
5-1
5 SITE EVALUATION
5.1 Introduction
Site selection is one of the most profound and vexing choices one faces in planning an observatory. The properties of the site impact the range of science that can be contemplated, the cost of construction and operations and the working environment for the observatory staff and visiting astronomers. The question of site is made all the more daunting because the choice is final and yet must be made on the basis of information that is incomplete at best.
The GMT project is in the enviable position of having clear access to a developed site with a long history of excellent performance. The Las Campanas Observatory (LCO) in Chile has been known to be an outstanding site for more than 30 years. The quality of the seeing at LCO is as good, or better, than at any other developed site in Chile. There is negligible light pollution and little prospect of any in the future. The weather patterns have been stable over the past 30 years and there are reasons to believe that the cyclical variations present in the tropical zones do not reach the latitude of Las Campanas. It appears that there are no currently developed peaks in Chile that exceed LCO as an astronomical site.
Las Campanas has been a field station for the Carnegie Institution of Washington since 1969. Carnegie has clear title to the land and a solid working relationship with the Chilean government and the major research universities. Other parties are able to construct and operate telescopes on Las Campanas under the umbrella of Carnegie’s agreement with the U. de Chile and several institutions have done so. Building the GMT at Las Campanas not only avoids potential legal and financial obstacles, it also reduces operation expenses by distributing infrastructure costs among other users of the site. The proximity of LCO to La Serena (the regional capital) provides a convenient logistical base and ensures a stable source of qualified employees who enjoy a high quality of life, a non-trivial consideration for an operation of the size and complexity envisioned for GMT. Several of the GMT partner institutions have an on-going commitment to Las Campanas via their participation in the Magellan twin 6.5m telescope consortium. This provides both strong scientific synergy between the two facilities and, potentially, simplifications and cost savings in operations.
There are two known scientific drawbacks to the LCO site. The first relates to the fraction of clear nights. Las Campanas and the other mid-latitude sites (Cerro Tololo, Cerro Pachon, La Silla) have seasonal weather patterns that negatively impact the fraction of photometric nights in the Chilean winter. Sites to the north (e.g. Paranal) are affected less by winter weather, and so have a higher fraction of clear nights. However, the precise extent of this effect is unclear as the more northerly sites may suffer more from long term weather cycles. The counter argument is that locating GMT at a new site in the north of Chile, while improving the number of photometric nights, exposes the project to the risk of long-term variability of the seeing. This appears to be the case at Paranal, where the wind patterns have changed since the time of the VLT site survey. At this time, it is felt that the potential gains offered by a moderate elevation northern site are more than offset by the risks associated with selecting a new site on the basis of a short site survey.
5-2
The second drawback to LCO and sites of similar elevation is their relatively high levels of precipitable water vapor. Atmospheric water adversely impacts mid-IR astronomy through reduced transparency and increased background. There is no doubt that a high elevation (> 4000 m) site offers superior mid-IR characteristics compared to Las Campanas and similar sites However, constructing GMT at a 4000+ m site will increase the cost of construction and operations. At this time, the project has chosen to focus on development at LCO, while characterizing the site’s mid-IR performance. After two years of monitoring, it will be clearer if the site has sufficient performance in the mid-IR to meet the GMT science goals.
After weighing both scientific and programmatic considerations, the GMT project, in concert with the GMT Board and Science Working Group, has designated Las Campanas as the baseline site and confined its site testing effort to characterizing sites within the LCO property. The aim is to identify the best peak within LCO in terms of seeing and wind speeds. The fraction of the time suitable for mid-IR observations is also being determined. The GMT project is in contact with the NOAO/NIO office regarding their site testing of Cerro Tolanchar at 4500 m as a potential high elevation alternative site for GMT. The Project believes that the most prudent approach is to maintain the project options with respect to a high site, while building on the significant advantages offered by unimpeded access to a first-rate mid-elevation site at LCO. If LCO is found to be unable to meet the science goals of GMT, then alternative sites will be considered based on data obtained from the NOAO/NIO site survey.
This chapter describes the scientific context of the GMT site selection process and reviews the testing program underway at LCO. In Appendix 5-1, information regarding alternative ELT sites in Chile is provided.
5.2 CONSIDERATIONS FOR SITE SELECTION
The choice of site will have a significant impact on the type of scientific investigations that can be carried out with the GMT. The critical aspects of the site vary from one science area, and observational technique, to another. While all science areas require clear weather and all benefit from photometric conditions, only some are sensitive to either water vapor or seeing. It is also true that near-IR and mid-IR science is largely insensitive to light pollution, but a site with significant light pollution, or a clear threat of such in the future, would be rejected in any case.
Most premier astronomical sites are confined to coastal mountain ranges and islands. Viable sites at this time include the Hawaiian and Canary islands, the coastal ranges of Chile, Baja California, Namibia, and, possibly, continental sites in central Asia, although few of these have been characterized. Continental sites in North America suffer from light pollution and legal and environmental challenges that make development difficult.
The seeing and mid-IR performance requirements of a site are somewhat subjective, as better seeing and lower water vapor are always desired, but they can be quantified somewhat with metrics based on the GMT science goals. The SWG has used the science requirements document to assess the impact of site selection with regard to PWV and seeing. For each science area, a sensitivity to water vapor can be assigned. Similarly, a sensitivity to seeing can be estimated, with the expectation that beyond 2 µm all sites will deliver good seeing and that beyond 5 µm the telescope should deliver diffraction-limited imaging nearly all of the time. It is worth noting

5-3
that while all visible wavelength science has a low sensitivity to PWV, not all mid-IR science areas are equally impacted by high PWV. Programs that are limited primarily by resolution rather than sensitivity may have only moderate sensitivity to PWV. Finally, to each science topic, a weighting factor must be assigned that is based on a combination of a qualitative assessment of its future scientific impact and the suitability of the GMT for this particular area. This metric provides guidance and balance in weighing the scientific promise of potential sites.
5.2.1 Hemisphere Choice
While one might a priori consider sites anywhere on the globe, there are strong scientific motivations for a southern hemisphere location for the GMT. A location in the south makes the most sense in terms of both the science and the synergy with other facilities. Direct access to the Magellanic Clouds, the Galactic center, the bulk of the Milky Way star forming complexes and many of the best exoplanet targets, more than offsets the loss of access to M31 and other northern hemisphere-unique targets.
Most of the current GMT partners are involved in the operation of the twin 6.5 m Magellan telescopes at Las Campanas and these telescopes can play a key role in supporting GMT science once it goes into operation. A site in the south would also offer unique opportunities for synergy with ALMA and, perhaps, the Square Kilometer Array, for which a southern site is likely, but not certain.
5.2.2 Impact of Cloud Cover
The impact of cloud cover on the science capability of the facility is quite clear. The importance of the difference between the number of photometric nights and usable nights is not as obvious. It is unlikely that the GMT will be used for precise absolute photometry in the classical sense; all-sky 1% accuracy is not at the core of any of the science goals for this telescope. In the era of large sky surveys (e.g. the Sloan Digital Sky Survey, LSST) photometric zero-points and color terms can, in principle, be determined at, or near, any intermediate or high latitude location in the sky. Sites with low photometric fractions are, however, less productive than sites with high fractions of photometric and usable nights.
Meeting the GMT science goals in a reasonable period of time requires that the fraction of photometric nights to be greater than 60% with a goal of greater than 70%. Spectroscopic nights (useable nights with some cloud) should, together with photometric nights, account for more than 70% of all nights, averaged over the year with a goal of greater than 80%.
5.2.3 Impact of Seeing
The impact of good natural seeing can not be overstated. Not only are resolution-critical problems, such as strong-lensing, crowded field photometry, and nuclear velocity distributions strongly seeing dependent, the depth of all sky-limited observations depend on seeing to somewhere between the first and second power. Adaptive optics corrections are also highly sensitive to the native seeing through the size of the isoplanatic angle and length of the coherence time.
5-4
The GMT SWG’s science requirement metric indicates that 61% of the science is strongly impacted by poor seeing, 32% is moderately sensitive to seeing and 7% has little or no sensitivity. This prescription requires that any site selected for GMT have good seeing (FWHM < 0.7″) for no less than 60% of the time.
5.2.4 Impact of PWV on Mid-IR Science
The near and mid-IR atmospheric windows are set by the absorption spectrum of water and CO2. Sites with high water vapor levels have narrower, and less stable, windows. High water vapor levels not only reduce transparency, they also increase the thermal-IR background and introduce strong and sharp spectral features within the otherwise transparent mid-IR atmospheric windows.
Using the science requirement metric, the GMT SWG concluded that 28% of the science impact of the telescope is highly sensitive to PWV, while 33% is moderately sensitive and 39% has little or no sensitivity.
As the PWV-sensitive science comprises a minority fraction of the science mission, it can be completed efficiently with somewhat less than the 28% fraction of dry nights implied by the above discussion. The SWG believes that a site with good mid-IR performance (PWV < 1.5 mm) for no less than 15% of the nights would allow completion of the science goals in a reasonable time, particularly if the observing schedule can be optimized to make good use of the driest periods.
5.2.5 Risk Factors
In addition to the criteria discussed above, the Project is considering risk factors. These include potential future light pollution, long-term weather patterns that affect seeing and the photometric fraction, and potential legal entanglements. Issues of cost and schedule risk during the construction phase, cost of operations, and ability to staff the site must also be weighed. The latter considerations favor the coastal sites as their low elevations allow construction and operation costs to be estimated with the benefit of experience at LCO, Cerro Tololo, Pachón, and Paranal. The reasonable proximity to significant population centers (e.g. La Serena, Antofagasta) also favor the coastal sites as they provide both a base of operations for the observatory and acceptable living conditions for the mountain staff.
The high elevation sites, while offering clear advantages in the mid-IR have significant disadvantages in other respects. The primitive state of knowledge regarding seeing and wind conditions at these sites exposes the project to significant risks, particularly in the visible and near-IR. The remoteness of the high sites presents a significant barrier to operations and staffing. There are no significant population centers near the high northern sites from which skilled technical personnel might be drawn. Retaining staff at these sites in the face of either long commutes and/or bleak living conditions will be a challenge. While the impact of the high sites on the cost of construction and operations are not well determined, there is no doubt regarding the sign. It seems optimistic to expect that the impact on cost could be less than 10%, or roughly $50M for a project on the scale of the GMT.
5-5
5.2.6 Derived Site Requirements
In Chapter 3 the GMT science requirements are reported, including the criteria by which sites are to be evaluated. These are, in priority order:
• The telescope shall be sited at a location known to be free of significant light pollution at the time of construction. Also, every effort shall be made to select a site with minimal prospect of increasing light pollution.
• The site shall be thoroughly tested for atmospheric seeing and must have a median FWHM better than 0.65″ at 550 nm at the zenith with a goal of 0.5″ or better.
• The fraction of photometric nights is required to be greater than 60% with a goal of greater than 70%. Spectroscopic nights (useable nights with some cloud) should, together with photometric nights, account for more than 70% of all nights, averaged over the year with a goal of greater than 80%. The fraction of clear hours expected to be lost to winds in excess of the operating limit should be less than 3%.
• For the 10th percentile of the driest conditions, the column of precipitable water vapor (PWV) shall be less than 1.5 mm.
In order for the facility to operate effectively, the site must meet a number of other requirements. The site should be free of legal claims, active commercial operations, and historical and cultural artifacts that would hinder development of an observatory. There must be reasonable access to the site, both for personnel and for large equipment and structures. If the site is not developed to the point of having water and power, a feasible path to providing such support must be identified. Finally, the site should be within reasonable commuting distance from a population center that can provide acceptable living conditions for the staff and their families, and which can also serve as a transshipment point for getting materials to and from the mountain.
5.3 CHILEAN ELT SITES
Chile is one of the few places on Earth with mountains that meet the stringent requirements for the GMT. Given the existing scientific and technical infrastructure, and GMT partner participation in Chile, it is clear that the project should focus its efforts on potential sites in north-central and northern Chile. Sites to the south of the La Serena area are ruled out by the clear weather requirements.
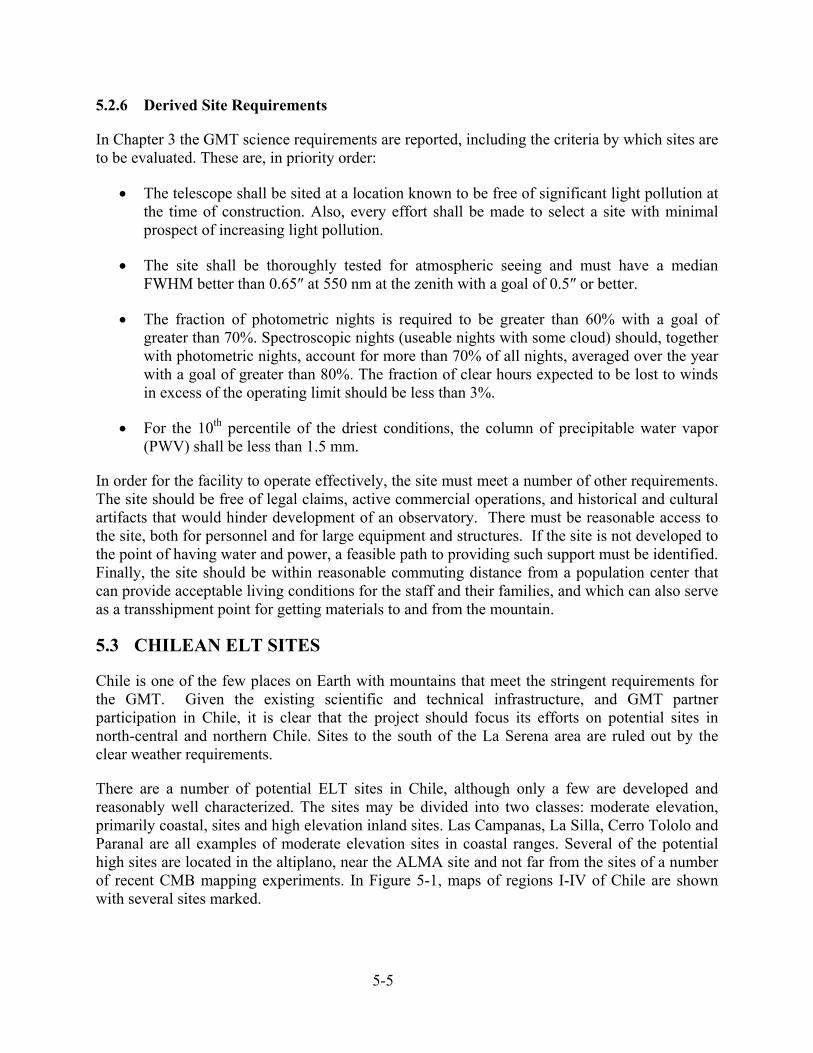
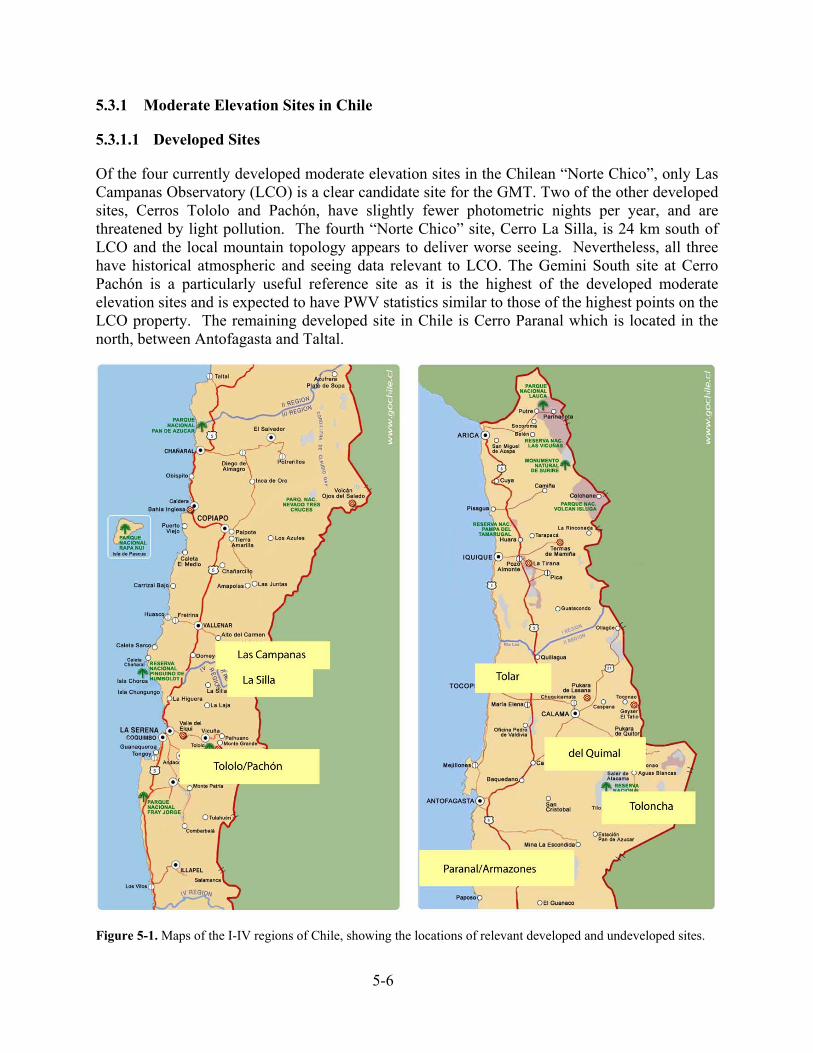
There are a number of potential ELT sites in Chile, although only a few are developed and reasonably well characterized. The sites may be divided into two classes: moderate elevation, primarily coastal, sites and high elevation inland sites. Las Campanas, La Silla, Cerro Tololo and Paranal are all examples of moderate elevation sites in coastal ranges. Several of the potential high sites are located in the altiplano, near the ALMA site and not far from the sites of a number of recent CMB mapping experiments. In Figure 5-1, maps of regions I-IV of Chile are shown with several sites marked.
5-6
5.3.1 Moderate Elevation Sites in Chile
5.3.1.1 Developed Sites
Of the four currently developed moderate elevation sites in the Chilean “Norte Chico”, only Las Campanas Observatory (LCO) is a clear candidate site for the GMT. Two of the other developed sites, Cerros Tololo and Pachón, have slightly fewer photometric nights per year, and are threatened by light pollution. The fourth “Norte Chico” site, Cerro La Silla, is 24 km south of LCO and the local mountain topology appears to deliver worse seeing. Nevertheless, all three have historical atmospheric and seeing data relevant to LCO. The Gemini South site at Cerro Pachón is a particularly useful reference site as it is the highest of the developed moderate elevation sites and is expected to have PWV statistics similar to those of the highest points on the LCO property. The remaining developed site in Chile is Cerro Paranal which is located in the north, between Antofagasta and Taltal.
Figure 5-1. Maps of the I-IV regions of Chile, showing the locations of relevant developed and undeveloped sites.
5-7
Among the coastal sites that are currently developed (LCO, Tololo, La Silla, Pachón, Paranal), LCO and Pachón have the best reported seeing statistics. Paranal has a higher clear fraction, but this advantage is offset by the poorer seeing compared to LCO or Pachón. Cerro Paranal is not a candidate site for the GMT, in any case, because the entire peak is occupied by the four European Southern Observatory (ESO) Very Large Telescopes (VLT).
Of the developed coastal sites, LCO is the clear choice for the GMT. It’s excellent seeing, long-baseline statistical database of weather and seeing, low risk of light pollution, adequate space for development, extant infrastructure, and legal standing within Chile are second to none. The significant downsides to LCO are the somewhat lower fraction of clear nights compared to the northern coastal sites and the high PWV. It can be argued that the loss of clear nights compared to a site like Cerro Paranal is more than offset by the advantages listed above. What remains unclear is the fraction of the time at LCO that can be used effectively for mid-IR work. This may be a strong function of the windows in question. LCO may not be a competitive site for 25 µm work for more than a negligible number of nights per year, but it might be quite competitive at 3.5 and 10 µm on many tens of nights per year. Understanding this issue in detail is one of the goals of the GMT site testing program.
5.3.1.2 Undeveloped Sites
Two mountains in the Chilean north stand out as the best of the undeveloped moderate elevation sites in the NOAO/NIO-funded study of potential sites for the Thirty Meter Telescope (TMT), hereafter the “Erasmus Report”. Cerro Tolar is a low elevation site near the coast between Antofagasta and Iquique, which according to the remote sensing data employed in the Erasmus Report, is ~80% photometric year-round1. Nevertheless, Tolar is uncomfortably close (17 km) to the city of Tocopilla (population ~23,000), and so light pollution is a concern. Cerro Armazones, which is due east of Cerro Paranal and is the highest of all the moderate elevation sites considered in this section, has a similarly large fraction of photometric nights, and is considerably more distance from major light pollution sources. Further details of the known properties of Cerros Tolar and Armazones are given in Appendix 5-1.
5.3.2 High Elevation Sites in Chile
The Project Science Working Group and the Science Working Group have agreed that very high elevation sites (> 4500 m) are impractical for the GMT and should not be considered. There are, however, a few potentially suitable peaks with altitudes in the range 4000-4500 m in the altiplano of the north of Chile. NOAO/CTIO staff compiled an exhaustive list of potential sites for the TMT by examining topographical maps2. The criteria for selection in this survey included altitude, volcanology, proximity to mines, light pollution, and local terrain characteristics.
1 Erasmus used satellite images to measure cloud cover. Typically three or more images were available per night. The nine pixels centered on a site location (equivalent to an area of the sky down to 60º from the zenith for an observer on the ground) were examined for evidence of cloud. An image was classified as showing photometric conditions if all nine pixels were clear.
2 See http://www.ctio.noao.edu/sitetests/survey/ssurvey.html
5-8
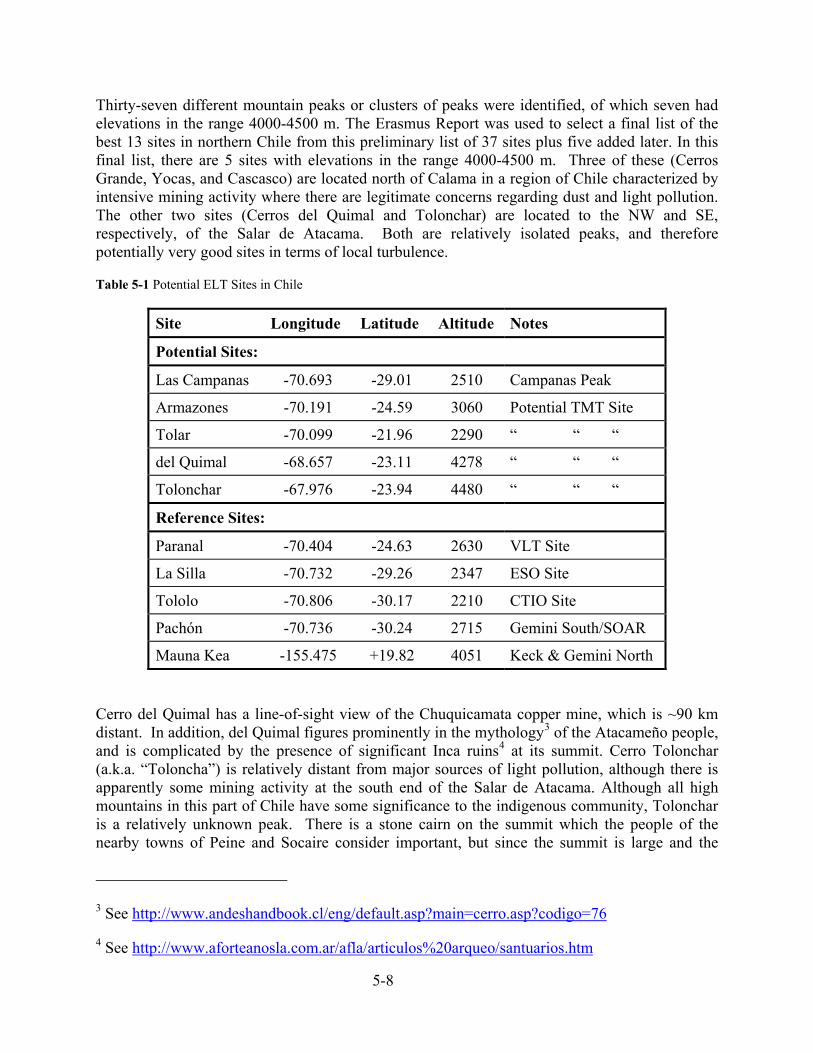
Thirty-seven different mountain peaks or clusters of peaks were identified, of which seven had elevations in the range 4000-4500 m. The Erasmus Report was used to select a final list of the best 13 sites in northern Chile from this preliminary list of 37 sites plus five added later. In this final list, there are 5 sites with elevations in the range 4000-4500 m. Three of these (Cerros Grande, Yocas, and Cascasco) are located north of Calama in a region of Chile characterized by intensive mining activity where there are legitimate concerns regarding dust and light pollution. The other two sites (Cerros del Quimal and Tolonchar) are located to the NW and SE, respectively, of the Salar de Atacama. Both are relatively isolated peaks, and therefore potentially very good sites in terms of local turbulence.
Table 5-1 Potential ELT Sites in Chile
Site Longitude Latitude Altitude Notes
Potential Sites:
Las Campanas -70.693 -29.01 2510 Campanas Peak
Armazones -70.191 -24.59 3060 Potential TMT Site
Tolar -70.099 -21.96 2290 “ “ “
del Quimal -68.657 -23.11 4278 “ “ “
Tolonchar -67.976 -23.94 4480 “ “ “
Reference Sites:
Paranal -70.404 -24.63 2630 VLT Site
La Silla -70.732 -29.26 2347 ESO Site
Tololo -70.806 -30.17 2210 CTIO Site
Pachón -70.736 -30.24 2715 Gemini South/SOAR
Mauna Kea -155.475 +19.82 4051 Keck & Gemini North
Cerro del Quimal has a line-of-sight view of the Chuquicamata copper mine, which is ~90 km distant. In addition, del Quimal figures prominently in the mythology3 of the Atacameño people, and is complicated by the presence of significant Inca ruins4 at its summit. Cerro Tolonchar (a.k.a. “Toloncha”) is relatively distant from major sources of light pollution, although there is apparently some mining activity at the south end of the Salar de Atacama. Although all high mountains in this part of Chile have some significance to the indigenous community, Tolonchar is a relatively unknown peak. There is a stone cairn on the summit which the people of the nearby towns of Peine and Socaire consider important, but since the summit is large and the
3 See http://www.andeshandbook.cl/eng/default.asp?main=cerro.asp?codigo=76
4 See http://www.aforteanosla.com.ar/afla/articulos%20arqueo/santuarios.htm

5-9
structure small, this is probably not a serious issue5. Details of the known properties of Cerros del Quimal and Tolonchar are found in Appendix 5-1.
In Table 5-1 are listed the locations and altitudes of the best of the potential GMT sites in Chile mentioned above. For reference, the developed sites of Paranal, La Silla, Tololo, Pachón, and Mauna Kea are also listed.
5.4 GMT BASELINE SITE
Based on the above considerations, the GMT Science Working Group made a recommendation with respect to site testing for the GMT. The group feels that Las Campanas has the potential to meet all of the GMT science goals and requested that the project thoroughly test LCO while keeping abreast of site surveys being carried out in Chile. This approach was endorsed by the GMT Board and has formed the basis of the GMT site testing program. The recommendation is repeated verbatim below.
“At this time we believe that the preponderance of the scientific evidence and risk favor Las Campanas as the GMT site. We believe that an intensive effort should be undertaken to characterize the site in terms of its PWV properties over two Chilean winter seasons. A robust determination of not only the number of dry hours per year, but the coherence time of dry weather should be determined. While this activity is in progress, we believe that Cerro Tolanchar should be designated as the alternative site. Efforts should be made to keep abreast of the site testing activity that will soon be underway at this site under the direction of the TMT program. A period of two years or more will be needed to learn anything significant about the seeing properties at Cerro Tolanchar. During that time we should have a fair understanding of the PWV properties of LCO. We believe that the project should operate for this period, mid-2005 to mid-2007, with the assumption that LCO will be the site. At such a time as the SWG and project feel is appropriate, the issue of the sight selection should be reviewed and the SWG will make a final recommendation regarding the site. The expectation is that this will occur in mid to late-2007.”
5.4.1 Summary of the Properties of Las Campanas
The GMT Board has designated Las Campanas as the baseline site. In this and the following section, the properties of the site and the available peaks are described in detail. The major points that are detailed in these sections are:
• Las Campanas is located in a region of negligible light pollution and is at low risk by virtue of its location in a dry and nearly mining-free area. Light pollution controls are in place which are designed to protect the site for decades to come.
• The available GMT sites on LCO have median seeing values that range from 0.6-0.7″ FWHM and are approximately 0.1″ better in the summer months than in the winter. The
5 R. Blum, private communication

5-10
best seeing images recorded to date have FWHM ~ 0.2″. The seeing appears to have evolved little, if at all, in the more than 25 years that LCO has been used as an astronomical site. Initial results from turbulence profile measurements indicate that the ground layer is highly variable in its contribution to the total seeing.
• The average photometric fraction at LCO is between 60-65%, and approximately 80% of the potential observing time is usable.
• The wind direction is very stable; the prevailing wind is from the NE 80% of the time, and from the SW the rest of the time. The average wind speed is 5.4 m/s but varies among the various peaks. The fraction of observing time lost to high winds is typically less than 5%.
• The PWV levels are lowest in the Chilean winter, and reach levels near 1 mm approximately 10% of the time in the winter months. The winter season median is approximately 2.3 mm.
5.4.2 Basis for Selection
As described above, the long and well-documented history of clear weather, dark skies and excellent seeing has led the GMT Board to designate Las Campanas as the presumptive GMT site for the purpose of planning. In this section, the general properties of LCO and potential telescope sites within the property are reviewed.
5.4.3 History and Infrastructure
The Carnegie Institution of Washington developed the Las Campanas Observatory site in the late 1960’s. Horace Babcock, then Carnegie Director, arranged the purchase of the land from the Chilean government. Carnegie’s land, which covers ~200 km2, is located just north of ESO’s La Silla Observatory and shares a common road accessing the Pan-American Highway (Route 5). The mountain is connected to the Chilean power grid and draws water from wells within the property. Facilities exist to support the current complement of telescopes and their support staff. Additional support facilities would be required if the GMT were to be sited on Las Campanas.
5.4.4 Sites Within the LCO Property
There are several developed telescope sites within LCO and there are a number of remaining sites with potential equal to those of the sites currently in use. Some of these will require more development than others. In Figure 5-2, a topographical projection of the LCO property is shown with the current telescopes and potential GMT sites marked. Figure 5-3 displays views of LCO from the prevailing wind direction (NE). Below, each of the potential GMT sites with the LCO property is briefly reviewed.
Manquis. The du Pont 2.5m telescope is situated at the flat NW terminus of the LCO ridge. Except for the Manquis Ridge, this site is lower than the others on the property and the du Pont telescope delivers slightly worse image quality than the 6.5m telescopes. It is not clear if this is a property of the atmosphere above this site or, perhaps more likely, that the poorer images are the result of dome seeing and telescope aberrations. Nevertheless, image quality (FWHM) of 0.5″ or

5-11
better is quite common in the near-IR with this telescope. The wind speed at this site is lower than that at either Manqui or Campanas Peak. At both this site and the adjacent Manquis Ridge, there are no significant upwind obstructions for either the primary or secondary wind directions; the only sources of interference lie to the SE. While this site is currently occupied by the du Pont telescope, the GMT Science Working Group (SWG) believes that it should be considered as a potential site for the GMT. The du Pont would have to be relocated or decommissioned.
Figure 5-2 Potential sites at Las Campanas. The purple circles show the locations of site testing towers. The wind directions are displayed in the corners, with the NE wind occurring 80% of the time.
Manquis Ridge. The duPont 2.5 m and Swope 1.0 m telescopes lie at the NW and SE ends, respectively, of the Manquis Ridge. There is a large and reasonably level area along the ridge between these two telescopes. A seeing tower was erected on the ridge during the Magellan site survey and a new DIMM instrument has been installed in this tower. From the Magellan site survey, there is evidence that this site may have slightly poorer seeing (~0.05″) than Manqui (the Magellan site), but it benefits from lower wind speeds.
Manqui. There is no room on Manqui, the site of the 6.5m Baade and Clay telescopes, for another large telescope. However, this site is the best characterized of the LCO sites and thus serves as a reference for the mountain. A seeing tower with a MASS/DIMM unit has been installed just NW of the Clay telescope. The Magellan site survey showed that the median seeing at this site, corrected for missing low frequencies, is near 0.62″ at 500 nm. The 6.5 m telescopes appear to achieve a median seeing close to this level.

5-12
Figure 5-3 Views of Las Campanas Observatory as seen from the direction of the prevailing wind (NE). To the left is La Mollaca Alta, just to the left of center is Campanas Peak; Alcaino Peak, and Manqui, site of the 6.5m telescopes, follow to the right. At the far end, Manquis ridge and Manquis, site of the 2.5m, can be seen. (Images produced using Google Earth.)
Alcaino Peak. Midway between Manqui and Las Campanas Peak lies an intermediate peak, named “Alcaino”. This was the site of the Nagoya 5 m radio telescope until mid-2004. This site has not been surveyed in detail and it was not included in the original Magellan site survey. A seeing tower has been erected and a DIMM unit began operating in April 2005. The topography of this site is similar to that of Manqui, the site of the 6.5 m telescopes, although there is a ridge to the north that could possibly produce some ground layer turbulence when the wind comes from the primary NE direction. A significant amount of rock would need to be removed to produce a large enough area for the GMT and associated facilities.
Campanas Peak. Las Campanas Peak lies at the southern end of the primary ridge and was the highest of the sites tested as part of the Magellan site survey. The peak has no upwind obstructions for either of the two principal wind directions. At the time of the Magellan site survey the seeing at this site was essentially the same as that at Manqui, but the wind speed was higher. A new seeing monitor constructed by the GMT project is currently compiling new seeing data. A considerable amount of rock would need to be removed from this site to produce a large enough area for the GMT and associated facilities, but it is feasible. There is some concern regarding the topography of this site. If the primary wind direction were to move from

5-13
NE to ENE or due east, there would be significant up-wind exposure associated with La Mollaca Alta. This could degrade the seeing at Campanas Peak. However, in comparing the data currently being taken with measurements made during the Magellan site testing campaign in 1988-1991, there is no evidence that the wind conditions at this site have changed in any significant way over the last 15 years (see section 5.5.4).
La Mollaca Alta. The highest peak on the Carnegie property, La Mollaca Alta lies to the ENE of Campanas Peak. The site is totally undeveloped and very little inspection has occurred. The peak is the most pointed of all the potential LCO sites and would require significant leveling to make room for GMT. There are no upwind obstructions in the primary wind direction (NE), but there are potential sources of turbulence upwind from the secondary wind direction (SW). At present there is no meteorological or seeing monitoring equipment in place.
5.5 LCO SITE CHARACTERIZATION METHODS AND RESULTS
An extensive site testing program has been underway for approximately one year to identify the best available location at LCO for the GMT. Meteorological (cloud cover, temperature, wind, and humidity) and seeing data are being obtained at three potential sites, and will be compared with identical data being taken at the Magellan telescopes site. In addition, measurements of the turbulence profile of the free-atmosphere above LCO are being collected, and the PWV levels are being regularly monitored at one of the sites. Finally, the historical data from 30 years of operation at LCO and previous site surveys give insight to the long-term stability of the site. In this section, the methodology and early results from this new site testing program are presented.
5.5.1 Light Pollution
Light pollution increases the sky brightness at astronomical sites via the scattering of artificial light from cities and other human activities. The impact of light pollution is best determined from direct measurements of the sky brightness from the ground. Large-scale surveys of light pollution, however, are possible with satellite imaging. Models of the scattering process have been used to produce maps of the worldwide light pollution at sea level (http://www.lightpollution.it). In Figure 5-4, the results of the calculation for the “Norte Chico” of Chile are shown. The lowest contours correspond to 1-10% increases in sky brightness, the blue contours range from 10-30% increase over the natural sky brightness. This map is based on satellite imagery obtained in 1996-1997. Similar maps for potential ELT sites in the north of Chile are shown for comparison in Figure 5-1-1 of Appendix 5-1.
Figure 5-4 shows that Cerro Pachón is on the edge of a significant light pollution zone, whereas Las Campanas is located in a dark region between the glow produced by La Serena/Coquimbo to the southwest, and Vallenar/Huasco to the northwest. It should be noted that Cerro Pachón is still a dark site overhead and has suffered no detectable increase in background due to manmade sources6. Hence, the model used to produce Figure 5-4 may over-predict somewhat the impact of light pollution.
6 http://www.ctio.noao.edu/site/pachon_sky/

5-14
Thanks to the combined efforts of all of the international observatories operating in Chile, a strong "lighting law" (DS686) was promulgated by the Chilean Government in December 1998, ordering that all lighting fixtures in the II, III and IV regions of Chile be changed for fixtures which prevent light from shining directly into the sky. The changeover process had mostly been completed by late 2005, which implies that the skies are likely darker than when Figure 5-4 was produced. The nearest source of light pollution to LCO, Vallenar, has had small population growth (1.7%) over the last decade, and is expected to remain a small town.
Figure 5-4 Map of the artificial sky brightness at zenith based on satellite imaging obtained in 1996-1997.
5.5.2 Seeing
5.5.2.1 Historical Data
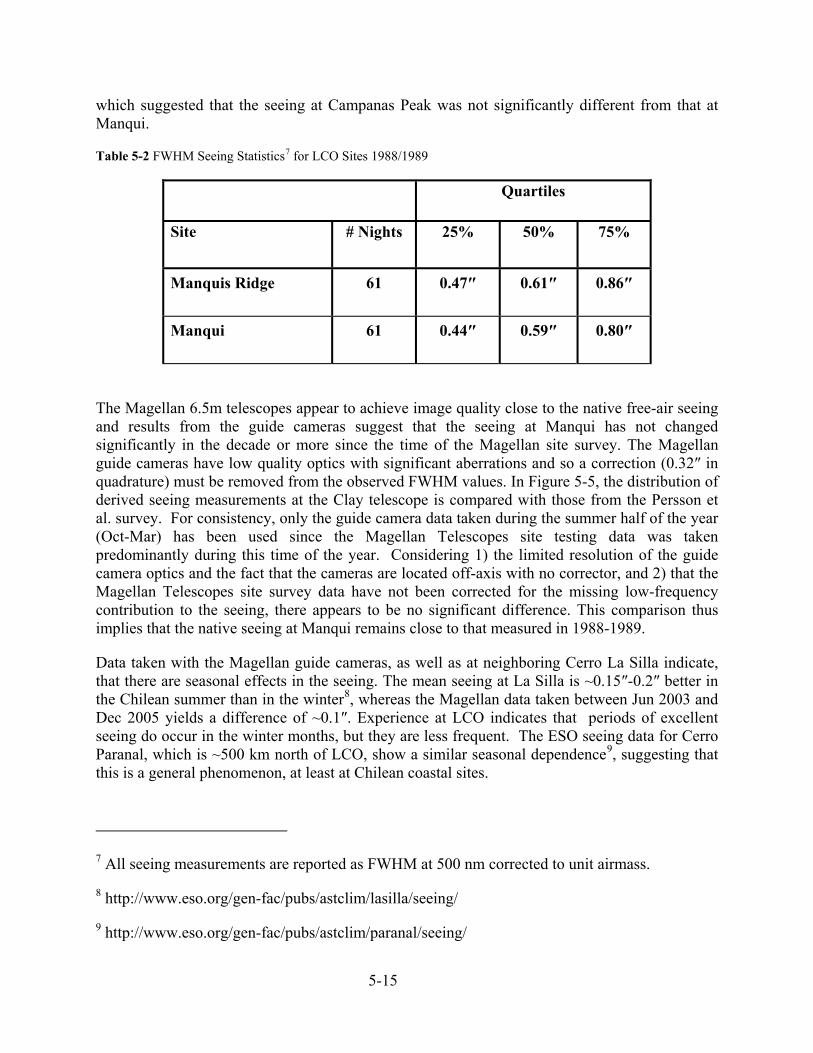
At the time of the Magellan site survey, seeing monitors were deployed at three sites on the LCO property. The details of the apparatus and analysis techniques are given in Persson et al. (1990). The Persson-Babcock instrument (ASM) estimates the seeing by measuring the image motion of a star at high (2-200 Hz) frequencies. A small correction must be applied to the data for the missing low spatial frequencies. A concerted seeing monitoring campaign comparing Manquis Ridge and Manqui was carried out on 61 nights between Oct 1988 and May 1989, and on another 22 nights between Nov 1989 and Jun 1990. The results from the 1988/1989 campaign are listed in Table 5-2, excluding the correction for low spatial frequencies. The small difference observed in the seeing at the Manquis Ridge compared to that at Manqui was confirmed by the 1989/1990 data (when the seeing monitors where interchanged to reduce possible systematic uncertainties), with the final estimated difference being 0.05 ± 0.02 arcsec. A smaller sampling of data was obtained comparing Campanas Peak with Manquis Ridge between spring 1990 and fall 1991,
5-15
which suggested that the seeing at Campanas Peak was not significantly different from that at Manqui.
Table 5-2 FWHM Seeing Statistics7 for LCO Sites 1988/1989
Quartiles
Site # Nights 25% 50% 75%
Manquis Ridge 61 0.47″ 0.61″ 0.86″
Manqui 61 0.44″ 0.59″ 0.80″
The Magellan 6.5m telescopes appear to achieve image quality close to the native free-air seeing and results from the guide cameras suggest that the seeing at Manqui has not changed significantly in the decade or more since the time of the Magellan site survey. The Magellan guide cameras have low quality optics with significant aberrations and so a correction (0.32″ in quadrature) must be removed from the observed FWHM values. In Figure 5-5, the distribution of derived seeing measurements at the Clay telescope is compared with those from the Persson et al. survey. For consistency, only the guide camera data taken during the summer half of the year (Oct-Mar) has been used since the Magellan Telescopes site testing data was taken predominantly during this time of the year. Considering 1) the limited resolution of the guide camera optics and the fact that the cameras are located off-axis with no corrector, and 2) that the Magellan Telescopes site survey data have not been corrected for the missing low-frequency contribution to the seeing, there appears to be no significant difference. This comparison thus implies that the native seeing at Manqui remains close to that measured in 1988-1989.
Data taken with the Magellan guide cameras, as well as at neighboring Cerro La Silla indicate, that there are seasonal effects in the seeing. The mean seeing at La Silla is ~0.15″-0.2″ better in the Chilean summer than in the winter8, whereas the Magellan data taken between Jun 2003 and Dec 2005 yields a difference of ~0.1″. Experience at LCO indicates that periods of excellent seeing do occur in the winter months, but they are less frequent. The ESO seeing data for Cerro Paranal, which is ~500 km north of LCO, show a similar seasonal dependence9, suggesting that this is a general phenomenon, at least at Chilean coastal sites.
7 All seeing measurements are reported as FWHM at 500 nm corrected to unit airmass.
8 http://www.eso.org/gen-fac/pubs/astclim/lasilla/seeing/
9 http://www.eso.org/gen-fac/pubs/astclim/paranal/seeing/

5-16
Figure 5-5 The delivered image quality at the Clay telescope during the summer half of the year (Oct-Mar) as derived from guide camera images obtained between Jun 2003 and Dec 2005. The Magellan Telescopes site survey quartiles and median are shown in red.
5.5.2.2 Current Seeing Monitoring
The seeing is being monitored at four LCO sites through the use of differential image motion monitors (DIMM). The DIMM (first implemented in a modern fashion by Sarazin and Roddier 1990) functions by relating the FWHM from a long exposure in a large telescope to variances in the difference in the motion of two images of the same star through the use of Kolmogorov turbulence theory. The two images are created by placing a mask with two sub-apertures containing prisms at the front of the optical tube. The GMT instruments are based on the CTIO RoboDIMM10, but have several improvements. Following a technique developed by the TMT project, software was written to use a drift scan readout mode which allows for many more image motion measurements to be made per minute and thus improved statistics. Image quality has also been improved by using two, thinner prisms as opposed to one thicker prism and an open aperture.
Turbulence in the atmosphere above 500 m is being monitored by a multi-aperture scintillation sensor (MASS, Kornilov et al, 2002). The spatial scale of the scintillation variation depends on the distance to the layer in which the turbulence giving rise to the wave front phase disturbance
10 http://www.ctio.noao.edu//telescopes/dimm/dimm.html

5-17
exists. Thus, the turbulence profile at a small number of discrete layers can be restored by fitting a model to the differences between the scintillation indices within four concentric apertures. The GMT MASS has an accompanying DIMM built into it. Instead of having prisms in a mask at the end of the optical tube, the two images are created by small mirrors in the pupil plane of the MASS instrument. This instrument, known as a MASS/DIMM, was fabricated and provided by CTIO11 and put into operation in a tower at the Magellan telescopes site (Manqui). Since the MASS operates only above 500 m, the profiles are valid for all nearby sites. In addition to the turbulence profile, the MASS also measures free atmospheric seeing (essentially the integral of the turbulence profile), the adaptive optics time constant and the isoplanatic angle. The difference between the DIMM seeing and the free atmosphere MASS seeing is a measure of the portion of the total seeing contributed by a ground layer.
Site Comparison
Between 2005 Apr 20 and Nov 28, seeing data has been collected on 126 nights in common from the DIMMs located at Manquis Ridge, Manqui, and Alcaino. During this time period, only the DIMM at Alcaino was functioning in a completely nominal mode. At Manquis Ridge, testing of equipment was ongoing during much of this time and as a result not all of the data is of the same quality as at the other sites.
The DIMM located at the Magellan Telescopes site, Manqui, is a combined MASS/DIMM instrument. In a recent, side-by-side comparison between the MASS/DIMM and one of the GMT DIMM units, an average offset of 0.05″ was observed where the MASS/DIMM measured systematically smaller seeing. This offset was determined during a period of 10 nights and was seen to vary between 0.0″ and 0.1″. Further study of this issue is ongoing and a better calibration between the MASS/DIMM and the GMT DIMM units is forthcoming. In the meantime, the conservative approach of adjusting the Manqui values upwards by 0.05″ has been adopted. If the difference between the MASS/DIMM and the GMT DIMM unit is caused by something in the instrumentation, the adjustment may be quite close to the actual forthcoming calibration.
Table 5-3 Seeing Percentiles in arcsec for 126 nights between 2005 Apr 20-Nov 28. The data for Manqui have been adjusted upward by 0.05″ to account for a possible measuring error in the MASS/DIMM (see text).
Percentile Manquis Ridge Manqui (Adjusted) Alcaino Pk.
10 0.48″ 0.45″ 0.45″
25 0.59″ 0.54″ 0.55″
50 0.76″ 0.68″ 0.71″
75 0.98″ 0.88″ 0.90″
90 1.20″ 1.10″ 1.12″
11 http://www.ctio.noao.edu/%7Eatokovin/profiler/

5-18
Over these 126 nights, Manquis Ridge showed the worst seeing of the three sites. Table 5-3 lists the 10, 25, 50, 75, and 90 percentiles for all three sites. The measurements for Alcaino Peak are slightly worse than those for Manqui, but the differences are probably within the errors12.
On Sep 29, 2005, a DIMM was installed at Campanas Peak. Between 2005 Sep 29 and Nov 28 there are 46 nights of data in common between all four sites. Table 5-4 shows the 10, 25, 50, 75, and 90 percentiles for all four sites during this period. Overall the seeing was generally better during these 46 nights as compared to the 126 night set discussed in the previous paragraphs. This is not unexpected since the former data were taken primarily during the spring, whereas the 126-night data set includes more winter data than Spring data. During this time period, Manquis Ridge again shows the worst seeing. Likewise, the seeing at Manqui and Alcaino Peak is essentially indistinguishable. Finally, there is a suggestion that Campanas Peak shows the best seeing of all of the sites, particularly at the larger percentiles.
Table 5-4 Seeing Percentiles in arcsec for 46 nights between 2005 Sep 29-Nov 28. The data for Manqui have been adjusted upward by 0.05″ to account for a possible measuring error in the MASS/DIMM (see text).
percentile Manquis Ridge Manqui (adjusted) Alcaino Pk. Campanas Pk.
10 0.45″ 0.43″ 0.42″ 0.41″
25 0.54″ 0.50″ 0.49″ 0.48″
50 0.66″ 0.62″ 0.61″ 0.59″
75 0.84″ 0.79″ 0.79″ 0.76″
90 1.03″ 1.01″ 1.00″ 0.95″
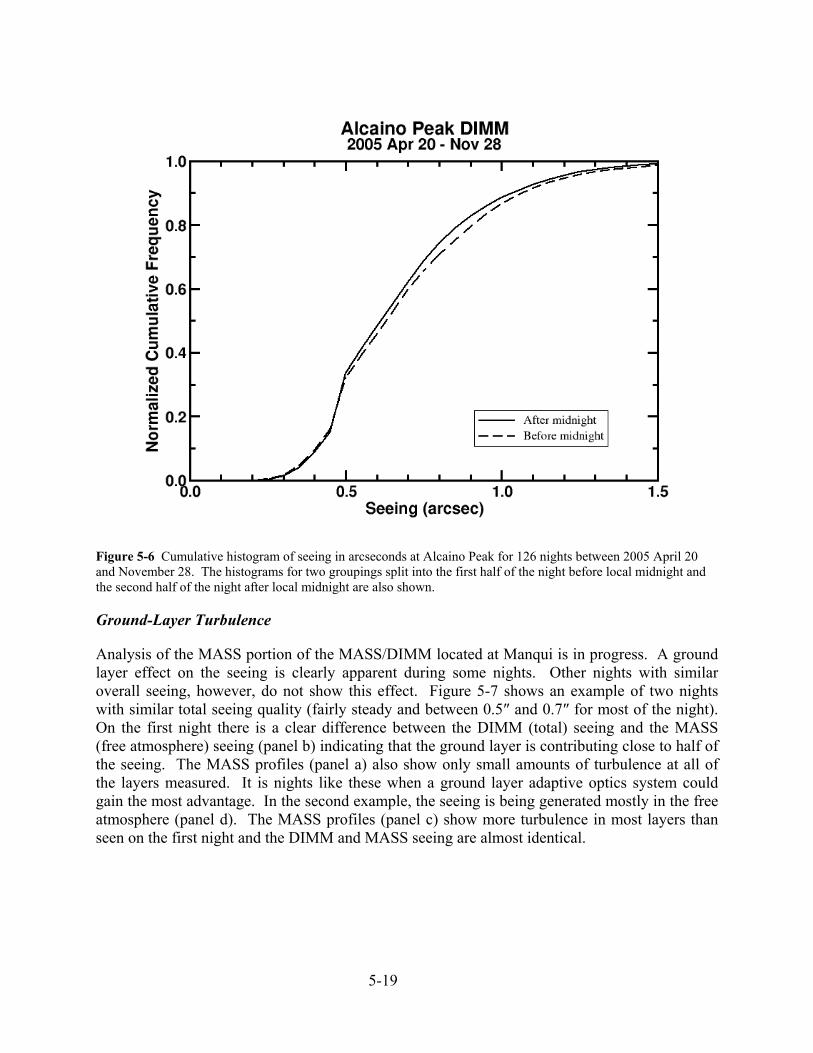
Dependence of Seeing on Wind Direction The Alcaino Peak seeing data was chosen to explore the relationship between the prominence of southwesterly winds during the first half of the night (see Figure 5-10 in section 5.5.4) and the seeing. As shown in Figure 5-6, the measurements taken after midnight are slightly better than those made before midnight at values greater than 0.5″. However, a proper error analysis is required to judge the reality of this result.
12 The reader should bear in mind that the analysis presented in this section is still very preliminary, and that a full determination of the errors in the DIMM measurements has yet to be carried out.
5-19
Figure 5-6 Cumulative histogram of seeing in arcseconds at Alcaino Peak for 126 nights between 2005 April 20 and November 28. The histograms for two groupings split into the first half of the night before local midnight and the second half of the night after local midnight are also shown.
Ground-Layer Turbulence
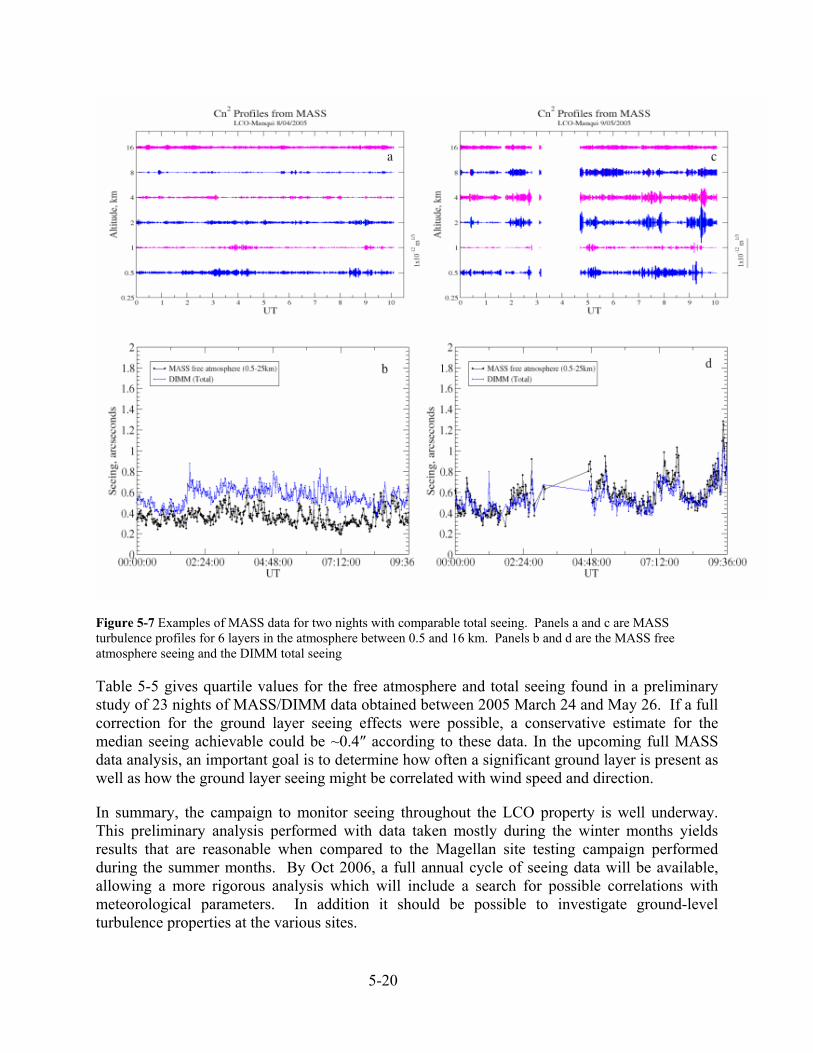
Analysis of the MASS portion of the MASS/DIMM located at Manqui is in progress. A ground layer effect on the seeing is clearly apparent during some nights. Other nights with similar overall seeing, however, do not show this effect. Figure 5-7 shows an example of two nights with similar total seeing quality (fairly steady and between 0.5″ and 0.7″ for most of the night). On the first night there is a clear difference between the DIMM (total) seeing and the MASS (free atmosphere) seeing (panel b) indicating that the ground layer is contributing close to half of the seeing. The MASS profiles (panel a) also show only small amounts of turbulence at all of the layers measured. It is nights like these when a ground layer adaptive optics system could gain the most advantage. In the second example, the seeing is being generated mostly in the free atmosphere (panel d). The MASS profiles (panel c) show more turbulence in most layers than seen on the first night and the DIMM and MASS seeing are almost identical.
5-20
Figure 5-7 Examples of MASS data for two nights with comparable total seeing. Panels a and c are MASS turbulence profiles for 6 layers in the atmosphere between 0.5 and 16 km. Panels b and d are the MASS free atmosphere seeing and the DIMM total seeing
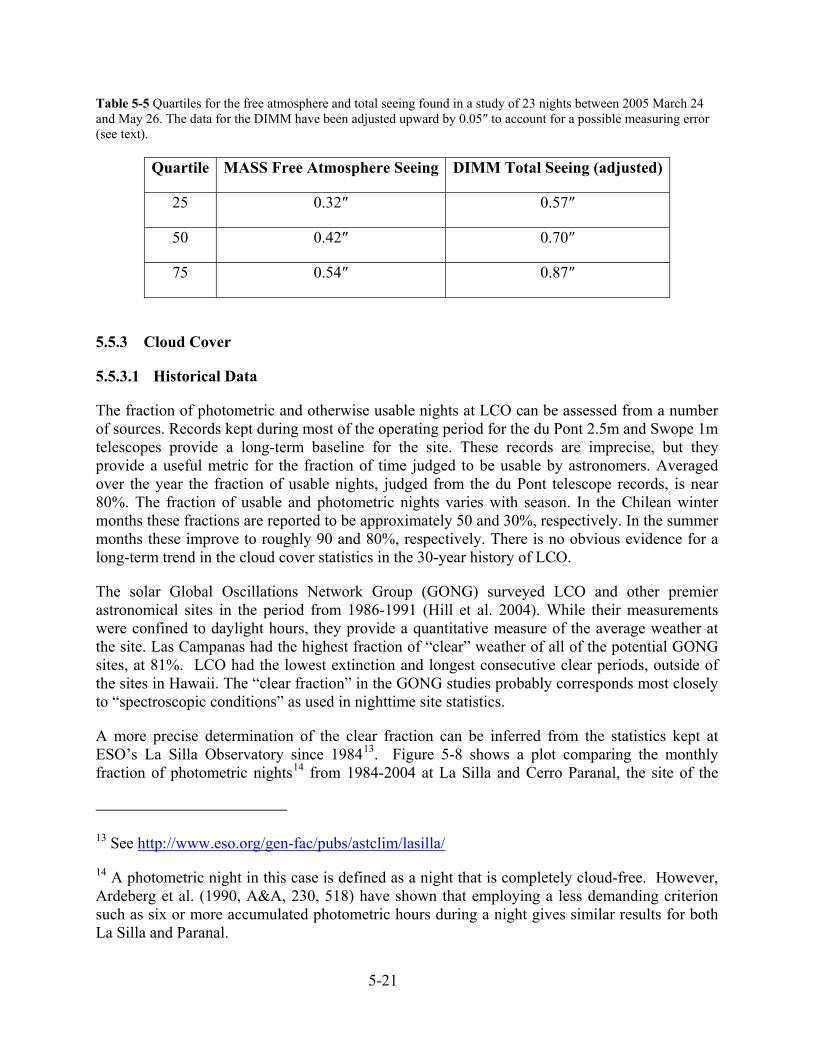
Table 5-5 gives quartile values for the free atmosphere and total seeing found in a preliminary study of 23 nights of MASS/DIMM data obtained between 2005 March 24 and May 26. If a full correction for the ground layer seeing effects were possible, a conservative estimate for the median seeing achievable could be ~0.4″ according to these data. In the upcoming full MASS data analysis, an important goal is to determine how often a significant ground layer is present as well as how the ground layer seeing might be correlated with wind speed and direction.
In summary, the campaign to monitor seeing throughout the LCO property is well underway. This preliminary analysis performed with data taken mostly during the winter months yields results that are reasonable when compared to the Magellan site testing campaign performed during the summer months. By Oct 2006, a full annual cycle of seeing data will be available, allowing a more rigorous analysis which will include a search for possible correlations with meteorological parameters. In addition it should be possible to investigate ground-level turbulence properties at the various sites.
5-21
Table 5-5 Quartiles for the free atmosphere and total seeing found in a study of 23 nights between 2005 March 24 and May 26. The data for the DIMM have been adjusted upward by 0.05″ to account for a possible measuring error (see text).
Quartile MASS Free Atmosphere Seeing DIMM Total Seeing (adjusted)
25 0.32″ 0.57″
50 0.42″ 0.70″
75 0.54″ 0.87″
5.5.3 Cloud Cover
5.5.3.1 Historical Data
The fraction of photometric and otherwise usable nights at LCO can be assessed from a number of sources. Records kept during most of the operating period for the du Pont 2.5m and Swope 1m telescopes provide a long-term baseline for the site. These records are imprecise, but they provide a useful metric for the fraction of time judged to be usable by astronomers. Averaged over the year the fraction of usable nights, judged from the du Pont telescope records, is near 80%. The fraction of usable and photometric nights varies with season. In the Chilean winter months these fractions are reported to be approximately 50 and 30%, respectively. In the summer months these improve to roughly 90 and 80%, respectively. There is no obvious evidence for a long-term trend in the cloud cover statistics in the 30-year history of LCO.
The solar Global Oscillations Network Group (GONG) surveyed LCO and other premier astronomical sites in the period from 1986-1991 (Hill et al. 2004). While their measurements were confined to daylight hours, they provide a quantitative measure of the average weather at the site. Las Campanas had the highest fraction of “clear” weather of all of the potential GONG sites, at 81%. LCO had the lowest extinction and longest consecutive clear periods, outside of the sites in Hawaii. The “clear fraction” in the GONG studies probably corresponds most closely to “spectroscopic conditions” as used in nighttime site statistics.
A more precise determination of the clear fraction can be inferred from the statistics kept at ESO’s La Silla Observatory since 198413. Figure 5-8 shows a plot comparing the monthly fraction of photometric nights14 from 1984-2004 at La Silla and Cerro Paranal, the site of the
13 See http://www.eso.org/gen-fac/pubs/astclim/lasilla/
14 A photometric night in this case is defined as a night that is completely cloud-free. However, Ardeberg et al. (1990, A&A, 230, 518) have shown that employing a less demanding criterion such as six or more accumulated photometric hours during a night gives similar results for both La Silla and Paranal.

5-22
ESO Very Large Telescope (VLT). The data, which have been smoothed using a 12-month running mean, yield an average of 61% of nights photometric for La Silla. In the summer months, the average increases to ~85%, while in the winter it decreases to 35-40%. La Silla is located only 24 km south of Las Campanas, and at a similar elevation. Hence, these data provide an accurate representation of the cloud cover at LCO over the same period (and, indeed, are consistent with the LCO experience). Figure 5-8 illustrates two further points: 1) during the last 6-7 years, the average number of photometric nights per year in the La Silla-LCO region of Chile has been very similar to that at Cerro Paranal, and 2) periods of lower numbers of photometric nights at both La Silla and Paranal appear to be well correlated with El Niño events.
Figure 5-8 Monthly fraction of photometric nights at Cerros La Silla and Paranal. Shown for comparison is the El Niño Southern Oscillation Index (SOI). The cloud cover data have been smoothed using a 12-month running mean. (Source: M. Sarazin, TMT Site Testing Workshop, Vancouver, Jun 2005)
Recently, NOAO/NIO commissioned a site study based on remote sensing data. Images from the GOES-8 satellite were analyzed and Las Campanas was found to have a night-time clear fraction of 60%, very close to the La Silla average. However, the fraction of usable nights was judged to be only slightly higher, 65%, which is significantly at odds with experience. There are uncertainties in the calibration of the GOES-8 images and some question regarding the comparisons between sites separated by large distances. The NIO study suggests that sites in the southwest US (e.g. Palomar and Kitt Peak) have photometric fractions equal to those of Cerro Tololo and Las Campanas. This is in conflict with general experience, the observing records of the Chilean and US observatories, and the GONG site surveys (GONG found a 67% clear fraction in Tucson as opposed to 77% at Tololo and 81% at LCO).

5-23
5.5.3.2 Current Cloud Cover Monitoring
Since the Magellan telescopes went into operation, records have been kept regarding the fraction of time judged as lost to weather by the observers. From May 2001 to April 2005, this statistic has averaged ~16% year round (26% in winter, 7% in summer). These numbers may overestimate somewhat the fraction of time that is actually suitable for astronomy since observers will often push to the limit when using the largest telescopes. Nevertheless, the implied percentage of usable weather of 84% is close to that found during the GONG site survey.
A copy of the TASCA (Tololo All-Sky Camera)15 has been put into operation on LCO for monitoring clouds and light pollution. The GMT instrument, called CASCA (Campanas All-Sky Camera), uses a fisheye lens and CCD to take images of the entire sky in blue, red, Z, and Y bands every few minutes. Images are also obtained twice a night through a Na filter to monitor light pollution. The CASCA images may be viewed from a webpage16, and are also being archived. Software being developed by the LSST project will eventually be available for analyzing the CASCA images to give quantitative information on the sky transparency. In addition, since early 2005, the site testing equipment operators have been recording visual estimates of the cloud cover approximately every 2 hours during each night that they are on duty. These data will provide a useful check of the analysis of the CASCA images.
Thus the historical record and recent monitoring are in reasonably good agreement that LCO has usable weather ~80% of the time, and an average monthly fraction of photometric nights of ~60%, i.e., there are ~220 photometric nights per year. Note that the seasonal trends are such that the number of photometric hours per night, on average, is fairly constant throughout the year in contrast to sites that experience monsoon season.
5.5.4 Wind Speed and Direction
Wind affects the operation of the observatory in several ways. Moderate winds aid in flushing warm air from the dome, reducing both dome and mirror seeing. High winds buffet the telescope, and at sufficiently high speeds the dome must be closed to ensure the safety of the telescope and exclude wind-blown dust. The site selection process should consider the impact of wind on telescope time and the image error budget.
5.5.4.1 Historical Data
The wind speed at Las Campanas was measured at the Manquis Ridge, Manqui, and Campanas Peak sites as part of the Magellan site survey from 1988-1991, and has been recorded sporadically over longer times at the site of the du Pont weather station. Table 5-6 shows the results from the Magellan site testing campaign expressed as cumulative percentiles. The data correspond only to nights suitable for astronomy. These measurements indicate a clear trend with altitude: the highest site, Campanas Peak, is significantly windier than Manqui (where the
15 http://www.ctio.noao.edu/~david/tasca.htm
16 http://ascam2.lco.cl/
5-24
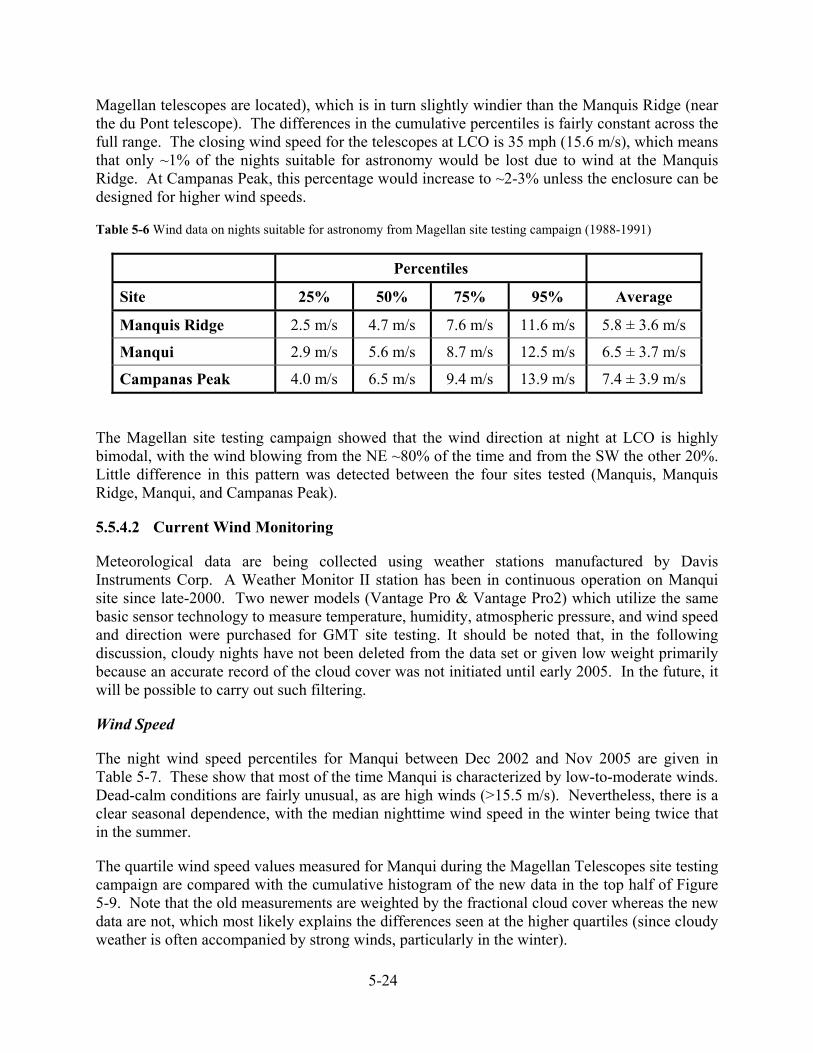
Magellan telescopes are located), which is in turn slightly windier than the Manquis Ridge (near the du Pont telescope). The differences in the cumulative percentiles is fairly constant across the full range. The closing wind speed for the telescopes at LCO is 35 mph (15.6 m/s), which means that only ~1% of the nights suitable for astronomy would be lost due to wind at the Manquis Ridge. At Campanas Peak, this percentage would increase to ~2-3% unless the enclosure can be designed for higher wind speeds.
Table 5-6 Wind data on nights suitable for astronomy from Magellan site testing campaign (1988-1991)
Percentiles
Site 25% 50% 75% 95% Average
Manquis Ridge 2.5 m/s 4.7 m/s 7.6 m/s 11.6 m/s 5.8 ± 3.6 m/s
Manqui 2.9 m/s 5.6 m/s 8.7 m/s 12.5 m/s 6.5 ± 3.7 m/s
Campanas Peak 4.0 m/s 6.5 m/s 9.4 m/s 13.9 m/s 7.4 ± 3.9 m/s
The Magellan site testing campaign showed that the wind direction at night at LCO is highly bimodal, with the wind blowing from the NE ~80% of the time and from the SW the other 20%. Little difference in this pattern was detected between the four sites tested (Manquis, Manquis Ridge, Manqui, and Campanas Peak).
5.5.4.2 Current Wind Monitoring
Meteorological data are being collected using weather stations manufactured by Davis Instruments Corp. A Weather Monitor II station has been in continuous operation on Manqui site since late-2000. Two newer models (Vantage Pro & Vantage Pro2) which utilize the same basic sensor technology to measure temperature, humidity, atmospheric pressure, and wind speed and direction were purchased for GMT site testing. It should be noted that, in the following discussion, cloudy nights have not been deleted from the data set or given low weight primarily because an accurate record of the cloud cover was not initiated until early 2005. In the future, it will be possible to carry out such filtering.
Wind Speed
The night wind speed percentiles for Manqui between Dec 2002 and Nov 2005 are given in Table 5-7. These show that most of the time Manqui is characterized by low-to-moderate winds. Dead-calm conditions are fairly unusual, as are high winds (>15.5 m/s). Nevertheless, there is a clear seasonal dependence, with the median nighttime wind speed in the winter being twice that in the summer.
The quartile wind speed values measured for Manqui during the Magellan Telescopes site testing campaign are compared with the cumulative histogram of the new data in the top half of Figure 5-9. Note that the old measurements are weighted by the fractional cloud cover whereas the new data are not, which most likely explains the differences seen at the higher quartiles (since cloudy weather is often accompanied by strong winds, particularly in the winter).

5-25
Table 5-7 Night wind speed data for Manqui (Dec 02-Nov 05)
Percentiles
Season 5% 25% 50% 75% 95%
Summer (Dec-Feb) <0.1 m/s 1.9 m/s 3.7 m/s 5.9 m/s 9.4 m/s
Fall (Mar-May) 0.3 m/s 3.5 m/s 7.4 m/s 11.0 m/s 15.2 m/s
Winter (Jun-Aug) <0.1 m/s 4.2 m/s 8.2 m/s 11.6 m/s 16.9 m/s
Spring (Sep-Nov) 0.7 m/s 3.4 m/s 6.3 m/s 9.3 m/s 14.3 m/s
All <0.1 m/s 3.0 m/s 6.3 m/s 10.0 m/s 15.1 m/s
Figure 5-9 (Top) Cumulative histogram of wind speed data collected over three years at Manqui. The data have not been filtered or weighted for cloud cover. Shown for comparison are the quartiles found from a year of data taken in 1987-1988 during the Magellan site survey. The latter data are weighted by the fractional cloudiness. (Bottom) Cumulative histograms of wind speed data taken between Dec 2004 and Nov 2005 at Manquis Ridge, Manqui, Campanas Peak, and Alcaino Peak.

5-26
The lower half of Figure 5-9 shows a comparison of the cumulative histograms of new wind speed data obtained between Dec 2004 and Nov 2005 when the Davis weather stations were operating at all four LCO sites being tested. These measurements confirm that Campanas Peak is significantly windier than the other three sites. There is also slight evidence that the Manquis Ridge is the least windy site, although the differences are small. Alcaino Peak, for which wind data had not before been obtained, is very similar in its characteristics to Manqui, the present site of the Magellan Telescopes.
Wind Direction
Histograms of the new measurements of wind direction for Manqui are plotted in Figure 5-10. As was known from the original Magellan site survey, the wind at LCO is highly bimodal. Most of the time the wind comes from the NE, while a smaller fraction of the time it blows from the SW. In Figure 5.10, the data are divided between summer and winter, which makes it quite clear that the SW component is much more common in the summer months.
Figure 5-10. Histogram of wind speed direction for wind speeds > 2.2 m/s (5 mph) collected over three years at Mannqui (site of the Magellan telescopes). The data have not been filtered or weighted for cloud cover. Note that difference in the strength of the SW component between summer and winter, and between the first half of the night and the second half.
Figure 5-10 also shows the difference between the first and second halves of the night in summer and winter, where it can be seen that the SW component is strongest during the first half of the night. The SW wind is clearly associated with the heating during the day of the valley below Las Campanas. On a typical summer day, the wind is calm in the morning hours, but starts blowing around mid-day from the west. During the afternoon, the wind typically changes to the SW, and then drops in intensity around sunset. From early evening to midnight, the wind moves from SW to NE, and blows predominantly from the NE during the last half of the night. This explains why the SW wind is more prominent during the first half of the night. In the colder winter months,
5-27
this daily cycle is less common, again accounting for the observation that the SW wind is less common in winter than in summer.
The new data taken for the Manquis Ridge show that its wind direction characteristics are very similar to those of Manqui. Due to technical problems associated with the Davis weather stations at Alcaino Peak and Campanas Peak, the wind direction data obtained for these sites is less reliable. However, the numbers indicate that, in general terms, the wind tends to blow from the same direction at all four sites.
5.5.5 Temperature
5.5.5.1 Historical Data
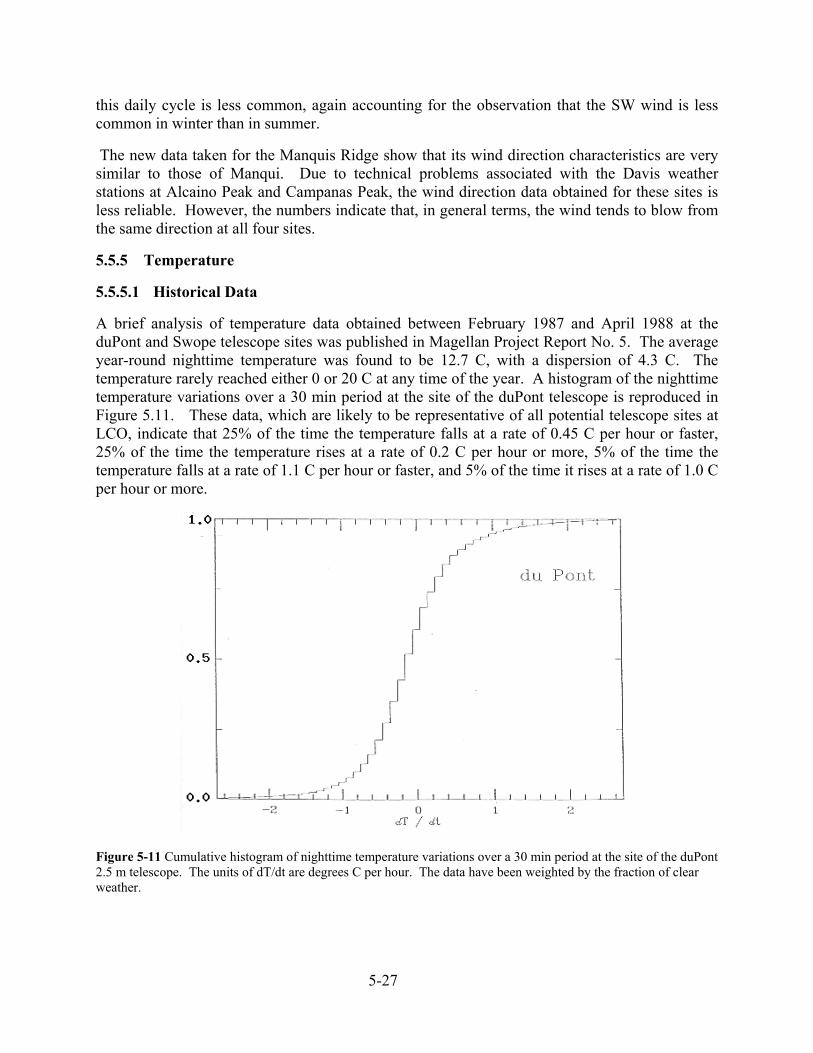
A brief analysis of temperature data obtained between February 1987 and April 1988 at the duPont and Swope telescope sites was published in Magellan Project Report No. 5. The average year-round nighttime temperature was found to be 12.7 C, with a dispersion of 4.3 C. The temperature rarely reached either 0 or 20 C at any time of the year. A histogram of the nighttime temperature variations over a 30 min period at the site of the duPont telescope is reproduced in Figure 5.11. These data, which are likely to be representative of all potential telescope sites at LCO, indicate that 25% of the time the temperature falls at a rate of 0.45 C per hour or faster, 25% of the time the temperature rises at a rate of 0.2 C per hour or more, 5% of the time the temperature falls at a rate of 1.1 C per hour or faster, and 5% of the time it rises at a rate of 1.0 C per hour or more.
Figure 5-11 Cumulative histogram of nighttime temperature variations over a 30 min period at the site of the duPont 2.5 m telescope. The units of dT/dt are degrees C per hour. The data have been weighted by the fraction of clear weather.
5-28
5.5.5.2 Current Temperature Monitoring
Night temperature percentiles for Manqui obtained with the Davis Weather Monitor II station between Dec 2002 and Nov 2005 are given in Table 5-8. The most striking aspect of these numbers is the very small seasonal variation in the maximum night temperatures reached at LCO vs. the large range in the minimum temperatures. This reflects the fact that while summer-like conditions can actually occur year-round, the low temperatures associated with the passage of cold fronts are completely absent in the summer months.
Table 5-8 Night temperature data for Manqui (Dec 02-Nov 05)
Percentiles
Season 5% 25% 50% 75% 95%
Summer (Dec-Feb) 11 C 13 C 15 C 16 C 18 C
Fall (Mar-May) 5 C 10 C 13 C 15 C 17 C
Winter (Jun-Aug) 1 C 7 C 11 C 14 C 16 C
Spring (Sep-Nov) 4 C 9 C 12 C 14 C 16 C
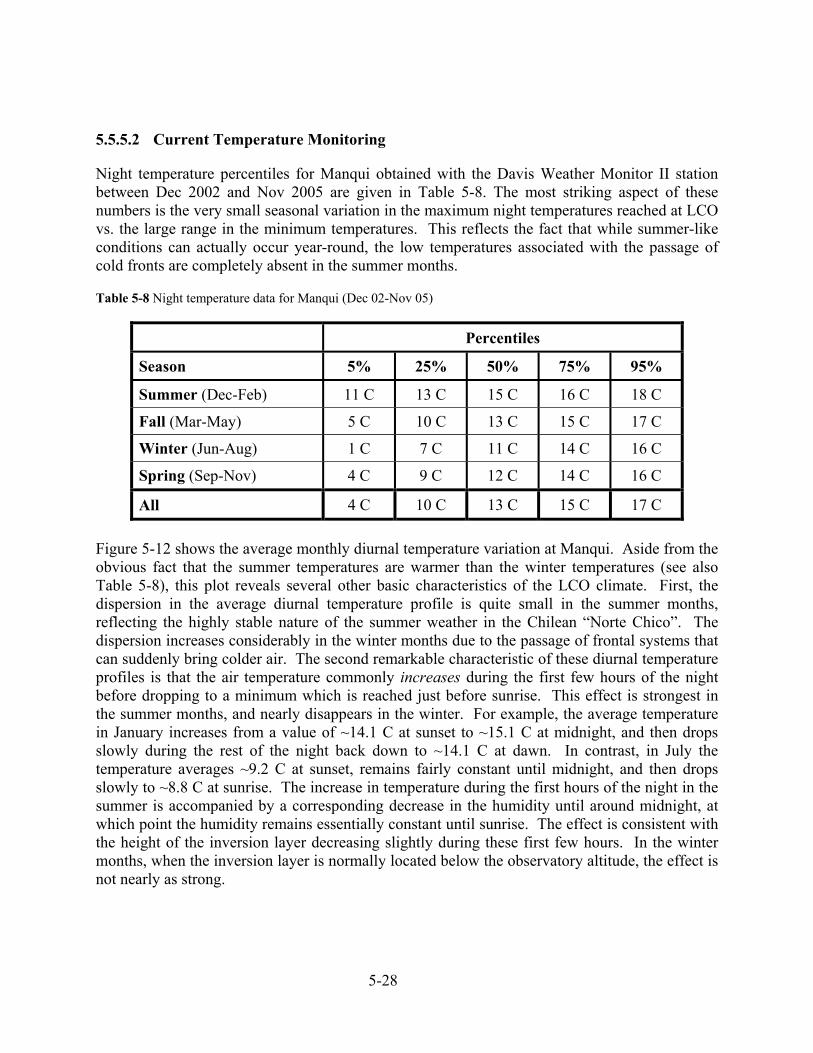
All 4 C 10 C 13 C 15 C 17 C Figure 5-12 shows the average monthly diurnal temperature variation at Manqui. Aside from the obvious fact that the summer temperatures are warmer than the winter temperatures (see also Table 5-8), this plot reveals several other basic characteristics of the LCO climate. First, the dispersion in the average diurnal temperature profile is quite small in the summer months, reflecting the highly stable nature of the summer weather in the Chilean “Norte Chico”. The dispersion increases considerably in the winter months due to the passage of frontal systems that can suddenly bring colder air. The second remarkable characteristic of these diurnal temperature profiles is that the air temperature commonly increases during the first few hours of the night before dropping to a minimum which is reached just before sunrise. This effect is strongest in the summer months, and nearly disappears in the winter. For example, the average temperature in January increases from a value of ~14.1 C at sunset to ~15.1 C at midnight, and then drops slowly during the rest of the night back down to ~14.1 C at dawn. In contrast, in July the temperature averages ~9.2 C at sunset, remains fairly constant until midnight, and then drops slowly to ~8.8 C at sunrise. The increase in temperature during the first hours of the night in the summer is accompanied by a corresponding decrease in the humidity until around midnight, at which point the humidity remains essentially constant until sunrise. The effect is consistent with the height of the inversion layer decreasing slightly during these first few hours. In the winter months, when the inversion layer is normally located below the observatory altitude, the effect is not nearly as strong.
5-29
Temperature data have been collected since Dec 2004 with the Vantage Pro weather stations operating at Manquis Ridge, Campanas Pk., and Alcaino Peak. The temperature differences observed from site to site are completely consistent with the differences in elevation.
Figure 5-12 Plots of the diurnal temperature variation as a function of the month of the year. The data correspond to Manqui. The error bars illustrate the rms dispersion of each point.
5.5.6 Precipitable Water Vapor
High columns of water vapor in the atmosphere above the telescope can significantly impact sensitivity, particularly in the mid-IR. H20 is not only a source of opacity, in the thermal IR reductions in transmission are accompanied by increased emissivity and, hence, higher backgrounds. Water vapor, ozone and CO2 lines define the atmospheric transmission windows for wavelengths longer than 0.9 µm and the impact of water is particularly severe in the 25 µm window. In addition to defining the atmospheric windows, water lines impact significant portions of the in-band spectrum. At high elevations the equivalent widths of the water lines scale roughly
5-30
linearly with the PWV column; at low elevations and high columns, pressure broadening extends the wings of the lines, affecting a larger range of wavelengths than one would expect from a simple scaling by PWV column. The PWV properties of most Chilean sites are poorly or incompletely characterized. There is essentially no information for LCO, and there are only modest amounts of data for Cerros Paranal, La Silla, and Pachón. Due to their proximity and similar elevations, La Silla, Tololo, and Pachón are the most relevant comparison for LCO.
5.5.6.1 Historical Data for La Silla, Tololo, and Pachón
La Silla
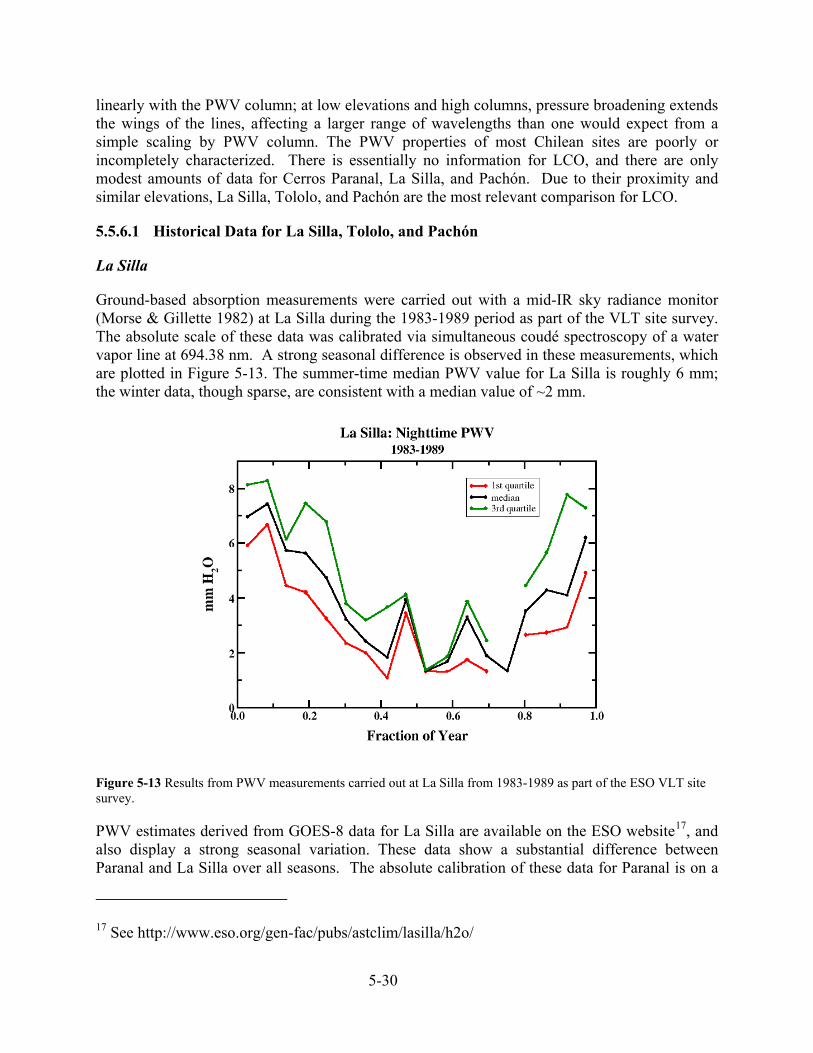
Ground-based absorption measurements were carried out with a mid-IR sky radiance monitor (Morse & Gillette 1982) at La Silla during the 1983-1989 period as part of the VLT site survey. The absolute scale of these data was calibrated via simultaneous coudé spectroscopy of a water vapor line at 694.38 nm. A strong seasonal difference is observed in these measurements, which are plotted in Figure 5-13. The summer-time median PWV value for La Silla is roughly 6 mm; the winter data, though sparse, are consistent with a median value of ~2 mm.
Figure 5-13 Results from PWV measurements carried out at La Silla from 1983-1989 as part of the ESO VLT site survey.
PWV estimates derived from GOES-8 data for La Silla are available on the ESO website17, and also display a strong seasonal variation. These data show a substantial difference between Paranal and La Silla over all seasons. The absolute calibration of these data for Paranal is on a
17 See http://www.eso.org/gen-fac/pubs/astclim/lasilla/h2o/

5-31
fairly solid footing; the calibration for La Silla is less certain (Sarazin, private communication). Indeed, the data show many nights with PWV well over 10-15 mm and most of the summer nights are over 5 mm, in contrast to the data from the more-reliably calibrated VLT site survey (cf. Figure 5-1-2 of Appendix 5-1).
A brief campaign was carried out at La Silla in 1981 by Sherwood and Greve (ESO 2nd IR Workshop, pp. 173). They measured the PWV level 24 hours a day for 10 days using an IR hygrometer. A four-day period with PWV <2 mm followed a 2 day wet period (PWV ~ 5-6 mm). During the driest period they observed with a 350 µm filter and measured PWV levels of 0.6-0.7 mm, well below the sensitivity limit of the broad-band 1 mm system. They note that the water column is higher during the day and that the Hansen and Caimanque data for Tololo (see below) are biased to high columns. The Sherwood and Greve data show two important results at La Silla that are likely to be applicable to Las Campanas: 1) there are multi-day periods of very dry weather, and 2) there are periods in which PWV levels drop below 1 mm and most surveys to date have been insensitive to these very dry conditions.
Cerros Tololo and Pachón
Figure 5-14 taken from Hansen and Caimanque (1975) shows daytime measurements from Cerro Tololo, a site further south and slightly lower than La Silla. These data show that summer days are characterized by PWV levels from ~3-6 mm while clear winter days are in the 1.5-3 mm range. Figure 3 in Hansen and Caimanque shows that in June and July 45-50% of clear days have PWV below 2 mm. The clear fraction in the winter is typically ~50%, so one can expect a total of roughly 20-25 nights of dry (PWV < 2 mm) weather in a Chilean winter if the 1973-1975 period is representative.
Figure 5-14. Daytime PWV measurements from Cerro Tololo for 10/73-5/75 from Hansen and Ciamanque.
There are other data that suggest that the coastal sites are fairly dry in the Chilean winter. The median atmospheric emissivity at 20 µm in the winters of 1988-1990 was 40 and 47% at Pachón
5-32
and Tololo, respectively18. This compares reasonably well with the annual median emissivity of 36% at Mauna Kea. The value for Campanas Peak is likely to be closer to Pachón than Tololo given its elevation and latitude.
In summary, all of the available data for La Silla, Tololo, and Pachón point to there being strong seasonal variations in the PWV at Las Campanas. There is good reason to believe that in the winter the PWV on Campanas Peak is comparable to median conditions at high elevation sites. Nevertheless, some uncertainties remain in reconciling the various data sets. The discrepancies will be finally resolved by measurements taken at the site.
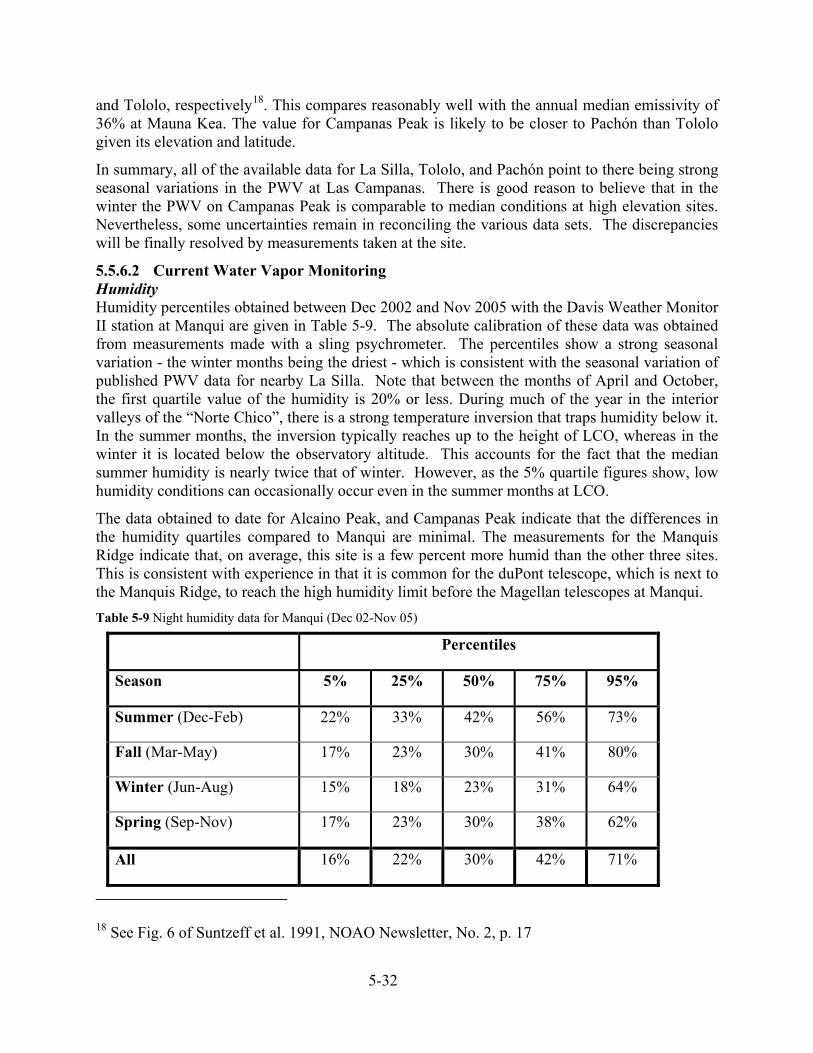
5.5.6.2 Current Water Vapor Monitoring Humidity Humidity percentiles obtained between Dec 2002 and Nov 2005 with the Davis Weather Monitor II station at Manqui are given in Table 5-9. The absolute calibration of these data was obtained from measurements made with a sling psychrometer. The percentiles show a strong seasonal variation - the winter months being the driest - which is consistent with the seasonal variation of published PWV data for nearby La Silla. Note that between the months of April and October, the first quartile value of the humidity is 20% or less. During much of the year in the interior valleys of the “Norte Chico”, there is a strong temperature inversion that traps humidity below it. In the summer months, the inversion typically reaches up to the height of LCO, whereas in the winter it is located below the observatory altitude. This accounts for the fact that the median summer humidity is nearly twice that of winter. However, as the 5% quartile figures show, low humidity conditions can occasionally occur even in the summer months at LCO.
The data obtained to date for Alcaino Peak, and Campanas Peak indicate that the differences in the humidity quartiles compared to Manqui are minimal. The measurements for the Manquis Ridge indicate that, on average, this site is a few percent more humid than the other three sites. This is consistent with experience in that it is common for the duPont telescope, which is next to the Manquis Ridge, to reach the high humidity limit before the Magellan telescopes at Manqui. Table 5-9 Night humidity data for Manqui (Dec 02-Nov 05)
Percentiles
Season 5% 25% 50% 75% 95%
Summer (Dec-Feb) 22% 33% 42% 56% 73%
Fall (Mar-May) 17% 23% 30% 41% 80%
Winter (Jun-Aug) 15% 18% 23% 31% 64%
Spring (Sep-Nov) 17% 23% 30% 38% 62%
All 16% 22% 30% 42% 71%
18 See Fig. 6 of Suntzeff et al. 1991, NOAO Newsletter, No. 2, p. 17
5-33
PWV Column Measurements
One of the most important objectives of the GMT site testing campaign at LCO is to ascertain the PWV characteristics of the site. The project has therefore taken a multipronged approach to this problem consisting of the following elements:
• A copy of IRMA19 (Infrared Radiometer for Millimeter Astronomy) has been purchased from the University of Lethbridge Astronomical Instrumentation Group. IRMA monitors a spectral emission line of water vapor at a wavelength of ~20 µm. The advantage of working at this wavelength is that the water lines are very strong and the technology is reasonably uncomplicated, allowing good signal-to-noise measurements to be achieved on very short time scales. IRMA has also been adopted by the TMT project for measuring PWV, and GMT is collaborating with TMT to produce the copies of IRMA that will be used by both projects to monitor the PWV at LCO and several sites in the north of Chile. An agreement is in place to share these data. An older copy of IRMA is currently being tested on LCO, but useful data from this device have only recently started to be collected and calibration procedures are still being working out.
• A GPS system is being installed by a group from Ohio State University. The precision of PWV measurements made with GPS systems is low (typically in the 0.5-1 mm range) and below about 2 mm of PWV they are insensitive. Nevertheless, these devices have the advantage of being inexpensive and easy to operate. More details can be found at http://www.paroscientific.com/GPSMETSupport.htm.
• A 225 GHz tipping radiometer belonging to the University of Arizona’s Mt. Graham Observatory was loaned to LCO during the winter months of 2005. This instrument measures the wings of various opaque ground-state transitions of water vapor in the 225 GHz band. The resulting opacity at 1.2 cm can be directly related to the PWV.
• High-dispersion spectroscopy of certain weak H2O absorption lines in the optical and near-IR wavelength regions can be used to directly derive the PWV. One such line identified by Brault et al. (1975, J. Quant. Spectrosc. Radiat. Transfer, 15, 549) lies at a wavelength of 694.38 nm, and is readily observed with the MIKE spectrograph on the Magellan Clay telescope. This method is not practical for constant monitoring of the PWV, but provides an excellent tool for verifying the absolute calibration of the IRMA and 225 GHz tipper measurements.
Although considerable progress was made in getting the IRMA and GPS equipment installed at LCO during the (Chilean) winter of 2005, there is still some work to do before these devices produce definitive results. Much more successful was the observing campaign carried out from mid-July to mid-September 2005 with the Mt. Graham 225 GHz tipping radiometer, which was installed at Alcaino Peak. Concurrent echelle observations of the H2O line at 694.38 nm
19 http://www.uleth.ca/phy/naylor/irma.shtml

5-34
obtained with the MIKE spectrograph on the Clay telescope were used to derive the relationship between the tipper 225 GHz opacity measurements and the actual column of PWV. As shown in the top half of Figure 5-15, an excellent correlation covering PWV values ranging from ~1-7 mm was obtained. The precision of this calibration is of order ±15%, and is limited by the relatively small number of MIKE spectra (11) obtained and the usage of only one spectral line to estimate the PWV. An effort is currently underway to identify other optical H2O lines that can be used to improve the precision of this technique.
A cumulative histogram of the calibrated PWV measurements from the 225 GHz tipper is plotted in the lower half of Figure 5-15. These data were obtained on a total of 29 full and partial nights when the conditions were judged to be photometric. Percentiles derived from these data are listed in Table 5-10. The median value of 2.4 mm is in excellent agreement with all previous measurements of the PWV at neighboring La Silla except the estimates based on GOES-8 imaging for which the absolute calibration is known to be uncertain. The data indicate that LCO most likely meets the GMT science requirement that the PWV column be <1.5 mm for the 10th percentile of the driest conditions. This result awaits confirmation by the IRMA measurements, which will also provide information on the year-round PWV characteristics at LCO.
Figure 5-15 (Top) Correlation between 225 GHz tipping radiometer opacity values and concurrent PWV measurements obtained from MIKE spectra. (Bottom) Cumulative histogram of final, calibrated PWV measurements obtained with the 225 GHz tipper at LCO from mid-July to late-August 2005.
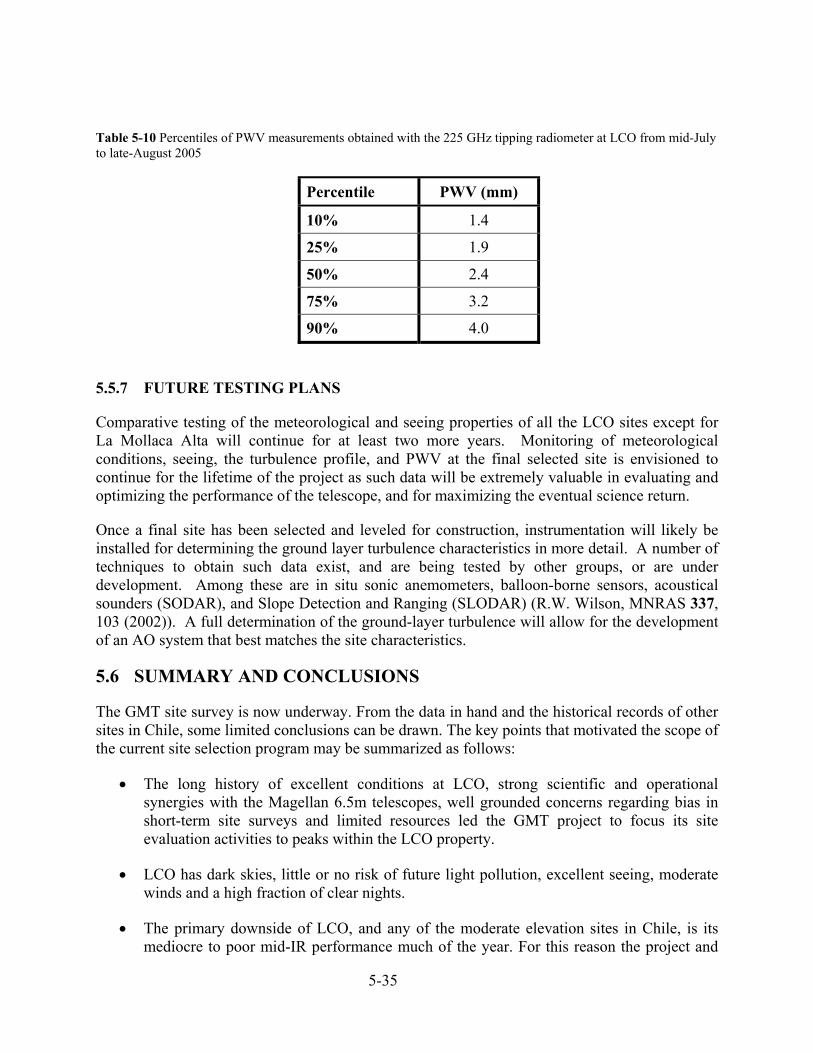
5-35
Table 5-10 Percentiles of PWV measurements obtained with the 225 GHz tipping radiometer at LCO from mid-July to late-August 2005
Percentile PWV (mm)
10% 1.4
25% 1.9
50% 2.4
75% 3.2
90% 4.0
5.5.7 FUTURE TESTING PLANS
Comparative testing of the meteorological and seeing properties of all the LCO sites except for La Mollaca Alta will continue for at least two more years. Monitoring of meteorological conditions, seeing, the turbulence profile, and PWV at the final selected site is envisioned to continue for the lifetime of the project as such data will be extremely valuable in evaluating and optimizing the performance of the telescope, and for maximizing the eventual science return.
Once a final site has been selected and leveled for construction, instrumentation will likely be installed for determining the ground layer turbulence characteristics in more detail. A number of techniques to obtain such data exist, and are being tested by other groups, or are under development. Among these are in situ sonic anemometers, balloon-borne sensors, acoustical sounders (SODAR), and Slope Detection and Ranging (SLODAR) (R.W. Wilson, MNRAS 337, 103 (2002)). A full determination of the ground-layer turbulence will allow for the development of an AO system that best matches the site characteristics.
5.6 SUMMARY AND CONCLUSIONS
The GMT site survey is now underway. From the data in hand and the historical records of other sites in Chile, some limited conclusions can be drawn. The key points that motivated the scope of the current site selection program may be summarized as follows:
• The long history of excellent conditions at LCO, strong scientific and operational synergies with the Magellan 6.5m telescopes, well grounded concerns regarding bias in short-term site surveys and limited resources led the GMT project to focus its site evaluation activities to peaks within the LCO property.
• LCO has dark skies, little or no risk of future light pollution, excellent seeing, moderate winds and a high fraction of clear nights.
• The primary downside of LCO, and any of the moderate elevation sites in Chile, is its mediocre to poor mid-IR performance much of the year. For this reason the project and
5-36
the GMT Science Working Group have identified one or two high elevation peaks that could serve as alternative GMT sites.
• The project is monitoring the meteorological conditions, seeing, atmospheric turbulence, sky brightness and PWV levels at several sites on Las Campanas. The project has opened a dialog with the TMT project and the NOAO NIO office to keep informed regarding conditions at Cerro Tolanchar, a 4500 m peak in northern Chile.
The site survey and characterization activities will continue at all of the potential LCO sites for the next two years or more. During this time, the following questions will be addressed:
• Which location is optimal in terms of total scientific return? This includes image quality, observing time, image stability, time lost to high wind, the size and scale of the ground layer and the AO time constant and isoplanatic angle.
• Can the GMT science mission, including thermal-IR-critical science, be completed on LCO in a reasonable period of time?
• What are the implications of the site regarding the optimal approach to AO and instrumental priorities?
• Is there enough information regarding the performance and cost implications of other Chilean sites to make an informed judgment regarding the merits of locating the GMT at one of the alternate sites?
Answering these questions will require integration of the site testing results with the GMT science mission and its instrument complement. As both the properties of the potential sites and the GMT science mission come into sharper focus in the next two years, the project will be in a better position to judge the optimal location for the telescope from a scientific, cost and operations perspective.

5-37
Appendix 5-1. POTENTIAL ELT SITES IN NORTHERN CHILE
Two moderate elevation sites (Cerros Tolar and Armazones) and two high elevation sites (Cerros del Quimal and Tolonchar) have been identified by the TMT project as the best potential undeveloped ELT sites in northern Chile. A description of the known characteristics of these is presented in this appendix.
5-1.1 Accessibility and infrastructure issues
Moderate Elevation Sites - Cerros Armazones and Tolar. Cerros Armazones and Tolar have remarkably similar aspects and characteristics. Both are located in one of the most arid regions on earth, the Atacama Desert. Cerro Armazones lies approximately 120 km south-southeast of the city of Antofagasta (population ~300,000), and is only 22 km east of the VLT site at Cerro Paranal. Armazones is the site of a small observatory owned by the Universidad Catolica del Norte20, although the telescopes are not located at the summit, but rather in a saddle just south of the summit. There is an existing dirt road to the summit, which is the site of several communications antennas. The summit is small, and has room enough for one large telescope after a substantial leveling of the summit.
The ESO experience at Cerro Paranal indicates that it is unlikely to find any source of reliable water near Armazones, and that water would need to be trucked from Antofagasta. To connect Armazones with the Chilean power grid would require running electrical lines several tens of kilometers, but it might be possible to share this cost with ESO, as they currently generate electricity on site.
Cerro Tolar is located approximately 170 km north of Antofagasta, but is only 17 km northwest of the town of Tocopilla (population ~23,000). There is an existing 4-wheel drive road to the summit. Like Armazones, the summit of Tolar is quite small, and could realistically accommodate only one large telescope. Tolar is extremely arid, and water would most likely have to be trucked to the summit. However, the Chilean power grid is relatively nearby (10-15 km).
High Elevation Sites - Cerros del Quimal and Tolonchar. Both Cerros del Quimal and Tolonchar are relatively isolated peaks. Cerro del Quimal has two summit peaks which are nearly equal in height and oriented east-west with a separation of ~0.5 km. The western summit is the smaller of the two, and is populated by many Inca ruins. The larger eastern summit has fewer ruins, but is not well located with respect to the prevailing wind directions, which usually blows mostly from the west and north in this part of Chile. Currently, there is no access to Cerro del Quimal other than by foot.
Cerro Tolonchar (a.k.a. Tolonchar) has a large and relatively flat summit. There is a stone cairn at the top which the local indigenous people consider important, but otherwise there are no significant archaeological ruins on the summit. The TMT project has contracted to have a road
20 See http://www.ucn.cl/instituto_astronomia/contenido.asp?toShow=observatorio

5-38
bulldozed to the top of Tolonchar, and site testing equipment is scheduled to be installed there by early-2006.
It is not known if there is sufficient underground water near Cerros del Quimal or Tolonchar to support the operation of a large telescope. High voltage power lines pass just to the south of Tolonchar, within a few kilometers of the summit. The distance from del Quimal to the nearest power lines is unknown.
Figure 5-1-1. Map of the artificial sky brightness at zenith based on satellite imaging obtained in 1996-1997.
5-1.2 Light pollution
Moderate Elevation Sites - Cerros Armazones and Tolar. Figure 5-1-1 shows light pollution calculations for northern Chile based on satellite imagery obtained in 1996-1997. The lowest contours correspond to 1-10% increases in sky brightness, the blue contours range from 10-30% increase over the natural sky brightness. Cerro Armazones is located in a region with dark skies between Antofagasta to the north, Taltal to the south, and the Escondida mine to the east. Cerro Tolar, on the other hand, is on the edge of the area of light pollution produced by Tocopilla, a city with ~25,000 inhabitants. Nevertheless, Tocopilla is not directly visible from the summit of Tolar, and is frequently covered by low clouds.

5-39
High Elevation Sites - Cerros del Quimal and Tolonchar. Figure 5-1-1 indicates that both Cerros del Quimal and Tolonchar are located in dark regions. Cerro del Quimal, however, lies on the edge of the lowest contour of light pollution due to the city of Calama (population ~140,000) and the Chuquicamata copper mine.
5-1.3 Seeing
Moderate Elevation Sites - Cerros Armazones and Tolar. The TMT site testing program is currently measuring the image quality obtained at Cerros Tolar and Armazones. There are no published seeing observations for Tolar, but a small amount of data was collected for Armazones during the original VLT site testing campaign. These agreed to within 0.02″ (0.65″ vs. 0.63″) with seeing measurements carried out simultaneously at nearby Cerro Paranal (Sarazin 1990). Much more data have been obtained for Cerro Paranal, which has been monitored continuously since 1989. At the time of the VLT site surveys the mean FWHM seeing at Paranal was ~ 0.6-0.7″. However, by the time of the completion of VLT UT1 in 1998, the seeing at Paranal had evolved to a mean of ~ 0.9″. There are clear indications that this long-term secular change in the seeing at Paranal is associated mostly with changes in the prevailing surface wind direction.21 When the wind comes from the good seeing direction, the flow above Paranal comes from the steep coastal slopes. The bad seeing direction corresponds approximately to the orientation of the ridge on which the peak of Paranal is located. As these appear to be effects of local terrain, there is no a priori reason to believe that the seeing at neighboring Cerro Armazones has suffered a similar degradation. Comparison of the TMT MASS/DIMM data for Armazones with the ESO MASS/DIMM at Paranal should eventually answer this question.
High Elevation Sites - Cerros del Quimal and Tolonchar. Seeing measurements have never been carried out at Cerros del Quimal or Tolonchar, although the TMT project expects to have a DIMM operating on Tolonchar by early-2006. Except for a single study (Giovanelli et al. 2001) at Cerro Chico, a 100 m hill which lies above the Chajnantor plain where the ALMA project is being constructed, there is a complete ignorance of the quality of the seeing at high altitude sites in the Chilean altiplano. The Cerro Chico DIMM data covered 38 nights and yielded a median seeing of 0.7″ FWHM. Comparison with simultaneous measurements obtained at Cerro Paranal indicated that the seeing at Cerro Chico was about 12% better, on average, than that at Paranal on the 34 nights in common.
5-1.4 Meteorological characteristics
Moderate Elevation Sites - Cerros Armazones and Tolar. The Erasmus study found clear fractions of ~80% for Cerros Armazones and Tolar from 1993-1999, implying that both sites should have significantly less cloud cover than LCO, La Silla and Cerro Pachon. This is confirmed by the statistics kept by ESO at Cerros La Silla and Paranal. As shown in Figure 5-8 of Chapter 5, the monthly fraction of photometric nights at Paranal (located 22 km east of Armazones) has averaged 76% over the period 1984-2004, whereas the number for La Silla (24 km south of LCO) over the same period was 61%. However, closer inspection of this figure
21 See http://www.eso.org/gen-fac/pubs/astclim/paranal/asm/verif/longverif.html
5-40
shows that the difference between the two sites was greater from 1984-1994 than it has been during the last ten years. It is possible that this behavior is related to the Pacific Decadal Oscillation (PDO), which is a long-lived, El Niño-like pattern of Pacific climate variability22. PDO events during the 20th century have persisted for 20-30 years. In terms of the number of additional photometric nights per year, in 1985 the difference between Paranal and La Silla was as large as ~90 nights, whereas in recent years it has been more like ~20 nights. These additional nights are concentrated in the Chilean winter season which affects La Silla more than Paranal.
At present, there are no published data on the wind speed at Cerro Tolar, but the peak appears to be characterized by relatively low winds much of the time (R. Blum, private communication). Cerro Armazones is known from the original VLT site testing campaign to be a relatively windy site, with median wind speeds that are very similar to those of neighboring Cerro Paranal. During the 1989-1999 period, the wind speed exceeded the closing speed (15 m/s) for 5.5% of the time at Paranal. This probably translates to less than 20 effective lost nights since some of the high winds occur during cloudy conditions.
High Elevation Sites - Cerros del Quimal and Tolonchar. The Erasmus study yielded clear fractions from 1993-1999 of 77% and 70%, respectively, for Cerros del Quimal and Tolonchar. Thus, both sites appear to fall between Armazones/Tolar and the mid-latitude sites in terms of number of photometric nights. There is no obvious seasonal dependence in the Erasmus data for del Quimal, while Tolonchar has a lower fraction of clear nights in the winter. As of yet, there is no information on typical wind speeds or directions for either mountain.
5-1.5 Precipitable water vapor
Moderate Elevation Sites - Cerros Armazones and Tolar. In situ measurements of the PWV at Cerro Armazones were obtained with a mid-IR sky radiance monitor as part of the VLT site testing effort. These showed no significant difference in comparison with similar data obtained for nearby Cerro Paranal (Sarazin 1990). The Paranal observations are reasonably extensive, and correspond to the period 1983-1989 (Figure 5-1-2). These data give a median value of 2.8 mm year round. There is a clear seasonal effect, with the median decreasing to just below 2 mm in the winter, and increasing to 4-5 mm in the summer. In contrast with the situation for Cerro La Silla (see section 5.5.6.1 of Chapter 5), the PWV estimates for Paranal derived in more recent years from GOES-8 satellite data give a picture which is fully consistent with the in-situ measurements.
There currently are no in-situ observations of the PWV at Cerro Tolar, but remote sensing data can be used to estimate a median value. The Erasmus report gives a clear-night median PWV of 4.0 mm for the period 1993-1999 for Tolar. The same report lists a median of 2.9 mm for Armazones, which agrees reasonably well with the in-situ data for this site. The higher PWV for Tolar is consistent with its considerably lower elevation compared to Armazones (2290 m vs. 3060 m).
22 See http://tao.atmos.washington.edu/pdo/
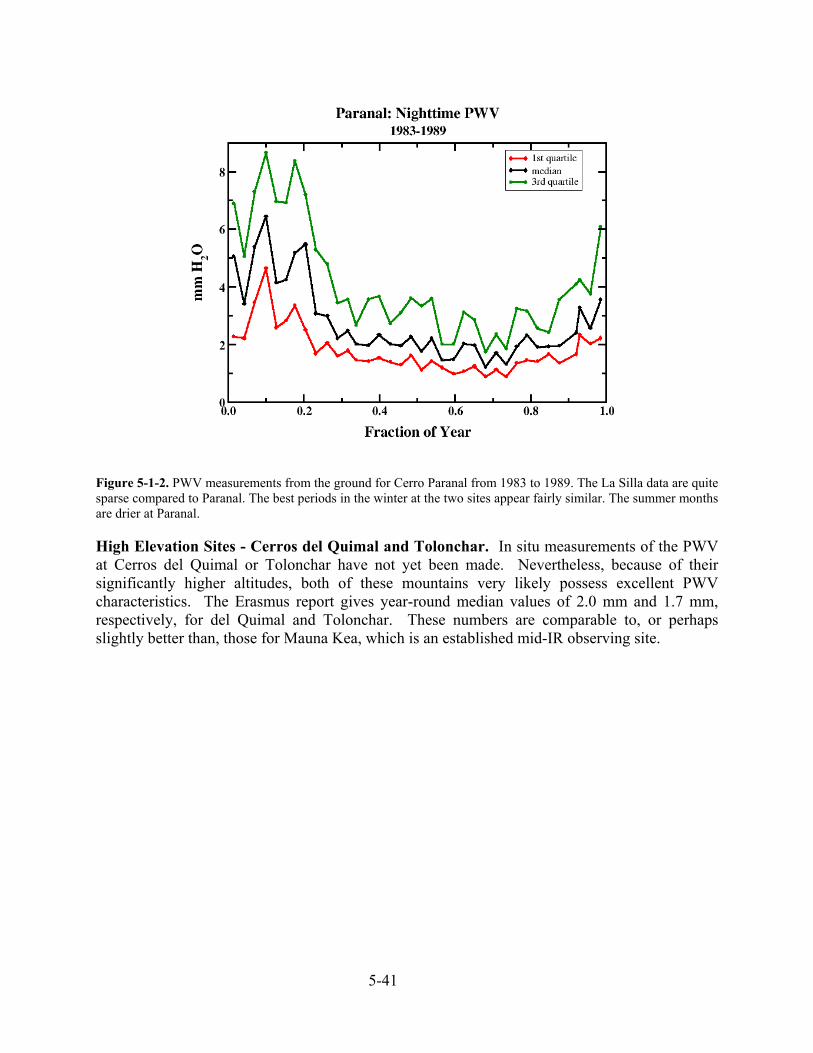
5-41
Figure 5-1-2. PWV measurements from the ground for Cerro Paranal from 1983 to 1989. The La Silla data are quite sparse compared to Paranal. The best periods in the winter at the two sites appear fairly similar. The summer months are drier at Paranal.
High Elevation Sites - Cerros del Quimal and Tolonchar. In situ measurements of the PWV at Cerros del Quimal or Tolonchar have not yet been made. Nevertheless, because of their significantly higher altitudes, both of these mountains very likely possess excellent PWV characteristics. The Erasmus report gives year-round median values of 2.0 mm and 1.7 mm, respectively, for del Quimal and Tolonchar. These numbers are comparable to, or perhaps slightly better than, those for Mauna Kea, which is an established mid-IR observing site.
Related Documents