O’Brien, P.E., Cooper, A.K., Richter, C., et al., 2001 Proceedings of the Ocean Drilling Program, Initial Reports Volume 188 5. SITE 1167 1 Shipboard Scientific Party 2 PRINCIPAL RESULTS Hole 1167A Position: 66°24.01′S, 72°17.05′E Start hole: 2200 hr, 22 February 2000 End hole: 0825 hr, 28 February 2000 Time on hole (hr): 130.42 Seafloor (drill-pipe measurement from rig floor, mbrf): 1651.3 Distance between rig floor and sea level (m): 11.3 Water depth (drill-pipe measurement from sea level, m): 1640.0 Total depth (drill-pipe measurement from rig floor, mbrf): 2098.8 Penetration (mbsf): 447.5 Coring totals: type: APC; number: 6; cored: 39.7 m; recovered: 86.3%; type: XCB; number: 43; cored: 407.8 m; recovered: 38.5% Lithology: Unit I–clay and sandy clay with isolated beds of fine sand and rare lonestones Unit II–clayey silty sand and diamictons with abundant dis- persed granules and pebbles, coarse sand, and clay Hole 1167B Position: 66°23.98′S, 72°17.01′E Start hole: 0825 hr, 28 February 2000 End hole: 1730 hr, 29 February 2000 Time on hole (hr): 33.08 Seafloor (drill-pipe measurement from rig floor, mbrf): 1651.3 Distance between rig floor and sea level (m): 11.3 Water depth (drill-pipe measurement from sea level, m): 1640.0 Total depth (drill-pipe measurement from rig floor, mbrf): 2098.8 1 Examples of how to reference the whole or part of this volume. 2 Shipboard Scientific Party addresses. Ms 188IR-105

Welcome message from author
This document is posted to help you gain knowledge. Please leave a comment to let me know what you think about it! Share it to your friends and learn new things together.
Transcript

O’Brien, P.E., Cooper, A.K., Richter, C., et al., 2001Proceedings of the Ocean Drilling Program, Initial Reports Volume 188
5. SITE 11671
Shipboard Scientific Party2
PRINCIPAL RESULTS
Hole 1167A
Position: 66°24.01′S, 72°17.05′EStart hole: 2200 hr, 22 February 2000End hole: 0825 hr, 28 February 2000Time on hole (hr): 130.42Seafloor (drill-pipe measurement from rig floor, mbrf): 1651.3Distance between rig floor and sea level (m): 11.3Water depth (drill-pipe measurement from sea level, m): 1640.0Total depth (drill-pipe measurement from rig floor, mbrf): 2098.8Penetration (mbsf): 447.5Coring totals: type: APC; number: 6; cored: 39.7 m; recovered: 86.3%;
type: XCB; number: 43; cored: 407.8 m; recovered: 38.5%Lithology:
Unit I–clay and sandy clay with isolated beds of fine sand andrare lonestonesUnit II–clayey silty sand and diamictons with abundant dis-persed granules and pebbles, coarse sand, and clay
Hole 1167B
Position: 66°23.98′S, 72°17.01′EStart hole: 0825 hr, 28 February 2000End hole: 1730 hr, 29 February 2000Time on hole (hr): 33.08Seafloor (drill-pipe measurement from rig floor, mbrf): 1651.3Distance between rig floor and sea level (m): 11.3Water depth (drill-pipe measurement from sea level, m): 1640.0Total depth (drill-pipe measurement from rig floor, mbrf): 2098.8
1Examples of how to reference the whole or part of this volume.2Shipboard Scientific Party addresses.
Ms 188IR-105
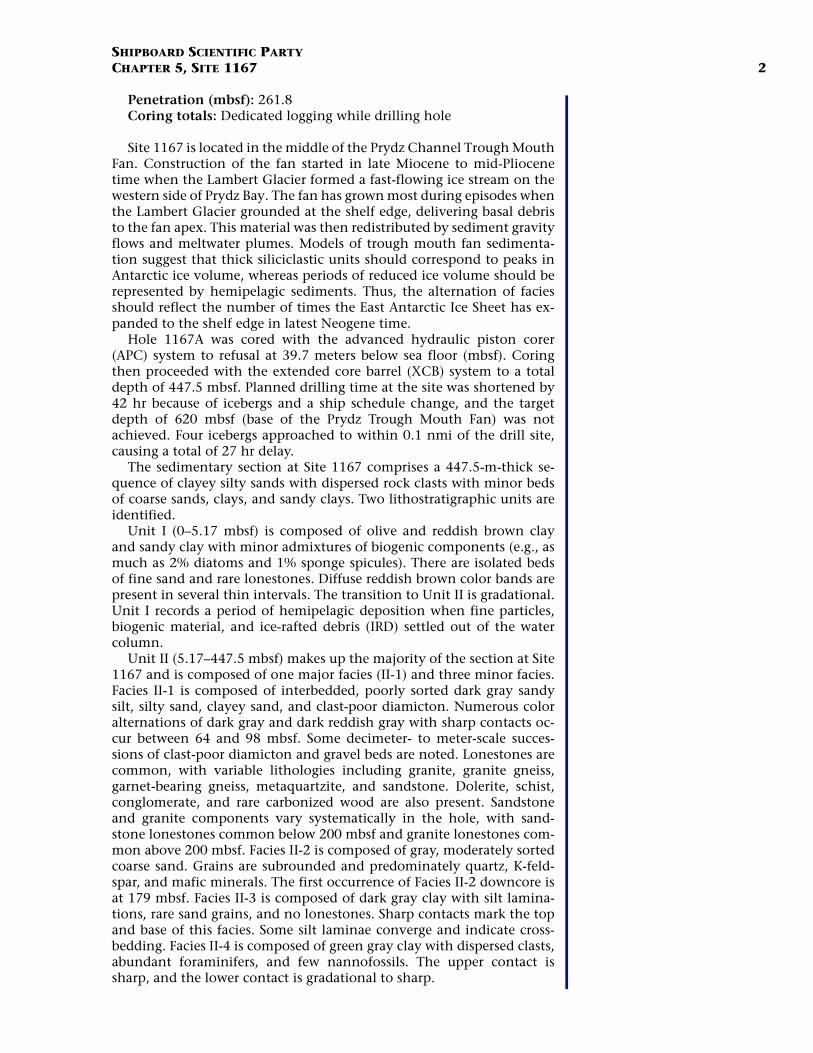
SHIPBOARD SCIENTIFIC PARTYCHAPTER 5, SITE 1167 2
Penetration (mbsf): 261.8Coring totals: Dedicated logging while drilling hole
Site 1167 is located in the middle of the Prydz Channel Trough MouthFan. Construction of the fan started in late Miocene to mid-Pliocenetime when the Lambert Glacier formed a fast-flowing ice stream on thewestern side of Prydz Bay. The fan has grown most during episodes whenthe Lambert Glacier grounded at the shelf edge, delivering basal debristo the fan apex. This material was then redistributed by sediment gravityflows and meltwater plumes. Models of trough mouth fan sedimenta-tion suggest that thick siliciclastic units should correspond to peaks inAntarctic ice volume, whereas periods of reduced ice volume should berepresented by hemipelagic sediments. Thus, the alternation of faciesshould reflect the number of times the East Antarctic Ice Sheet has ex-panded to the shelf edge in latest Neogene time.
Hole 1167A was cored with the advanced hydraulic piston corer(APC) system to refusal at 39.7 meters below sea floor (mbsf). Coringthen proceeded with the extended core barrel (XCB) system to a totaldepth of 447.5 mbsf. Planned drilling time at the site was shortened by42 hr because of icebergs and a ship schedule change, and the targetdepth of 620 mbsf (base of the Prydz Trough Mouth Fan) was notachieved. Four icebergs approached to within 0.1 nmi of the drill site,causing a total of 27 hr delay.
The sedimentary section at Site 1167 comprises a 447.5-m-thick se-quence of clayey silty sands with dispersed rock clasts with minor bedsof coarse sands, clays, and sandy clays. Two lithostratigraphic units areidentified.
Unit I (0–5.17 mbsf) is composed of olive and reddish brown clayand sandy clay with minor admixtures of biogenic components (e.g., asmuch as 2% diatoms and 1% sponge spicules). There are isolated bedsof fine sand and rare lonestones. Diffuse reddish brown color bands arepresent in several thin intervals. The transition to Unit II is gradational.Unit I records a period of hemipelagic deposition when fine particles,biogenic material, and ice-rafted debris (IRD) settled out of the watercolumn.
Unit II (5.17–447.5 mbsf) makes up the majority of the section at Site1167 and is composed of one major facies (II-1) and three minor facies.Facies II-1 is composed of interbedded, poorly sorted dark gray sandysilt, silty sand, clayey sand, and clast-poor diamicton. Numerous coloralternations of dark gray and dark reddish gray with sharp contacts oc-cur between 64 and 98 mbsf. Some decimeter- to meter-scale succes-sions of clast-poor diamicton and gravel beds are noted. Lonestones arecommon, with variable lithologies including granite, granite gneiss,garnet-bearing gneiss, metaquartzite, and sandstone. Dolerite, schist,conglomerate, and rare carbonized wood are also present. Sandstoneand granite components vary systematically in the hole, with sand-stone lonestones common below 200 mbsf and granite lonestones com-mon above 200 mbsf. Facies II-2 is composed of gray, moderately sortedcoarse sand. Grains are subrounded and predominately quartz, K-feld-spar, and mafic minerals. The first occurrence of Facies II-2 downcore isat 179 mbsf. Facies II-3 is composed of dark gray clay with silt lamina-tions, rare sand grains, and no lonestones. Sharp contacts mark the topand base of this facies. Some silt laminae converge and indicate cross-bedding. Facies II-4 is composed of green gray clay with dispersed clasts,abundant foraminifers, and few nannofossils. The upper contact issharp, and the lower contact is gradational to sharp.

SHIPBOARD SCIENTIFIC PARTYCHAPTER 5, SITE 1167 3
Unit II (Facies II-1 and II-2) records deposition by mass transport,probably massive debris flows, as evidenced by poor sorting, abundantfloating clasts, little visible grading, and a lack of biogenic components.The debris flows most likely represent deposition during glacial periodswhen ice extended to the shelf break and could deliver large volumes ofsediment to the upper continental slope. Individual flows cannot beidentified visually. The thin intervals of fine-grained sediment (FaciesII-3 and II-4) are similar in appearance and composition to muddy con-tourites observed at Site 1165 and, hence, may denote times when con-tour currents were active on the fan. The silt laminae and bioturbationin Facies II-3 are not consistent with turbidite deposition. Facies II-4may record short intervals, possibly interglacials, when pelagic deposi-tion dominated.
Sixteen lithologic varieties of lonestones were cataloged, and theygenerally vary randomly in size, with only a small size increase down-hole to 200 mbsf. Below ~160 mbsf, the number of lonestones permeter remains fairly consistent, except for three intervals (160–210,300–320, and 410–420 mbsf) where there are downward increases. Sys-tematic variations in concentration of sandstone and granite clasts(noted above) suggest that two different source areas may have deliv-ered material to Site 1167 at different times.
X-ray diffraction (XRD) analyses show that the total clay mineralcontent is relatively constant throughout the hole. XRD analyses ofclay types give mixed results for Units I and II, with smectite more com-mon in Unit I and at depths below 382 mbsf than elsewhere and illitefound in all samples. Further detailed analyses are likely to clarifywhether changes in illite-smectite ratios relate to times of glacial ad-vances.
Chronostratigraphy at Site 1167 is poorly controlled because of theunexpected paucity of siliceous microfossils; however, dates in Unit Iare younger than 0.66 Ma, and a sample from ~215 mbsf seems to be ofearly or middle Pleistocene age. Foraminifers are present consistentlythroughout the section and include pelagic foraminifer shelf faunas indiamictons and in situ midbathyal faunas in a few samples. Changes inforaminifer faunas closely match changes detected in various lithologi-cal parameters. Age control at this time is not adequate to determine av-erage sedimentation rates.
Magnetostratigraphic analyses identified the Matuyama/Brunhesboundary between 30 and 34 mbsf. The magnetic polarity below 34mbsf remains mainly reversed and possibly includes the Jaramillo andOlduvai Subchrons. The concentration-dependent magnetic parameters(susceptibility and anhysteretic and isothermal remanent magnetiza-tion) indicate that magnetite concentrations have large-scale cyclic(tens to hundreds of meters) variations, which are not commonly seen.The values increase abruptly uphole at ~208 mbsf, between 113 and151.2 mbsf, and between 55 and 78.5 mbsf, followed by a nearly linearuphole decrease. Superimposed on the large-scale cycles are small-scalevariations. The anhysteretic over isothermal remanent magnetizationratio indicates that the magnetic grain size changes uphole from finerto coarser above 217 mbsf. The origin of the large-scale cycles is not yetunderstood, but it is likely related to systematic changes in sedimentprovenance caused by changes in the volume of ice from differentsources and the location of areas of maximum erosion during glacial pe-riods.
Interstitial water profiles document downhole sediment diagenesis,mixing of chemically distinct subsurface interstitial waters, and diffu-
SHIPBOARD SCIENTIFIC PARTYCHAPTER 5, SITE 1167 4
sional exchange with modern bottom seawater. From 0 to 20 mbsf,chlorinity and sulfate increase by ~3% over seafloor values, suggestingthat high-salinity last-glacial-maximum seawater is preserved. Sulfatedecreases downhole from the seafloor (30 mM) to 433 mbsf (24 mM) ina stepped profile, raising the possibility that a number of “fossil” sulfatereduction zones may also be preserved. Dissolved manganese increasesdownhole from 15 to 20 mM between the seafloor and ~25 mbsf. Alka-linity decreases downhole from 3 to 1.3 mM between the seafloor and40 mbsf before steadily increasing to 2 mM at 433 mbsf. From 0 to ~60mbsf, dissolved downhole profiles of calcium (10–25 mM), magnesium(56–42 mM), potassium (12–2 mM), and lithium (30–5 mM) all suggestdiagenetic silicate-clay reactions are occurring. Below 5 mbsf, dissolvedsilica concentrations are enriched slightly over modern bottom waters(~300 vs. ~220 mM), reflecting the absence of biogenic opal within thesediments. Calcium carbonate is a minor component in the matrix sed-iments throughout the hole and is slightly more abundant in lithos-tratigraphic Unit II than in Unit I.
The concentration of hydrocarbon gases was at background levels (4–10 ppmv) for methane, and ethane was present above detection limitsonly in a few cores from deeper than 350 mbsf. The organic carbon(OC) content averages ~0.4 wt% with no apparent trend with depth.Organic matter characterization by Rock-Eval pyrolysis indicates thatall samples contain predominantly recycled and degraded thermallymature organic matter.
Sediment water content and void ratio decrease sharply with depthin lithostratigraphic Unit I, reflecting normal compaction. Within UnitII, these properties were relatively uniform, except for a downhole de-crease at 210 mbsf, where grain density and magnetic susceptibility val-ues also decrease abruptly. P-wave velocities increase at this depth.Undrained shear strength values increase uniformly throughout thehole at a lower than typical rate, possibly because of the clay mineral-ogy combined with the high proportions of silt and sand within thesediment. There is no evidence of sediment overcompaction.
Wireline logging operations in Hole 1167A were attempted with thetriple combination (triple combo) tool string. The tool string was low-ered to 151 mbsf, where an obstruction halted further progress. A con-glomerate interval was noted in the cores at this depth. Log data werecollected from this depth to the base of pipe at 86.9 mbsf, covering aninterval of 66 m. Time constraints, poor hole conditions, and problemsencountered with the lockable flapper valve resulted in a decision toswitch to logging while drilling (LWD) in a new hole. Excellent spectralgamma-ray and resistivity data were recorded to 261.8 mbsf before timeran out. Resistivity data show several clay and gravel-rich beds, withhigh gamma-ray values for a red bed interval at 60–90 mbsf, and lowvalues between 90 and 120 and 215 and 255 mbsf. The change to lowvalues may be due to a reduced concentration of granitic clasts or achange from a clay-rich to a sandier matrix.
Site 1167 is the first drill site where the sedimentary fans that arecommon on the upper continental slope around Antarctica, seaward ofglacially carved sections of the continental shelf, were directly sampled.The site reveals previously unknown large-scale (20 m to >200 m thick)cycles in magnetic susceptibility and other properties that are not yetfully explained but are likely due to systematic changes in the LambertGlacier ice-drainage basin during Pleistocene and late Pliocene(?) time.Within the large cycles are likely many separate debris flows and inter-bedded hemipelagic muds that indicate times of individual advances
SHIPBOARD SCIENTIFIC PARTYCHAPTER 5, SITE 1167 5
and retreats of the ice front to, or near, the continental shelf edge. Thedebris flows are well represented in the cores, but the mud intervals aresparse and may either have not been recovered or have been removedby younger flows. Because there are few age control points, it is not yetpossible to determine sedimentation rates at Site 1167. If the rates arehigh, as we suspect from the few available age dates, then almost allsediment during the latest Neogene glacial intervals sampled at Site1167 were deposited as debris flows on the trough mouth fan and didnot reach Wild Drift (Site 1165), where sediment rates are low. Alterna-tively, some of the fine component of the latest Neogene glacial sedi-ment is being carried away by deep ocean currents.
BACKGROUND AND OBJECTIVES
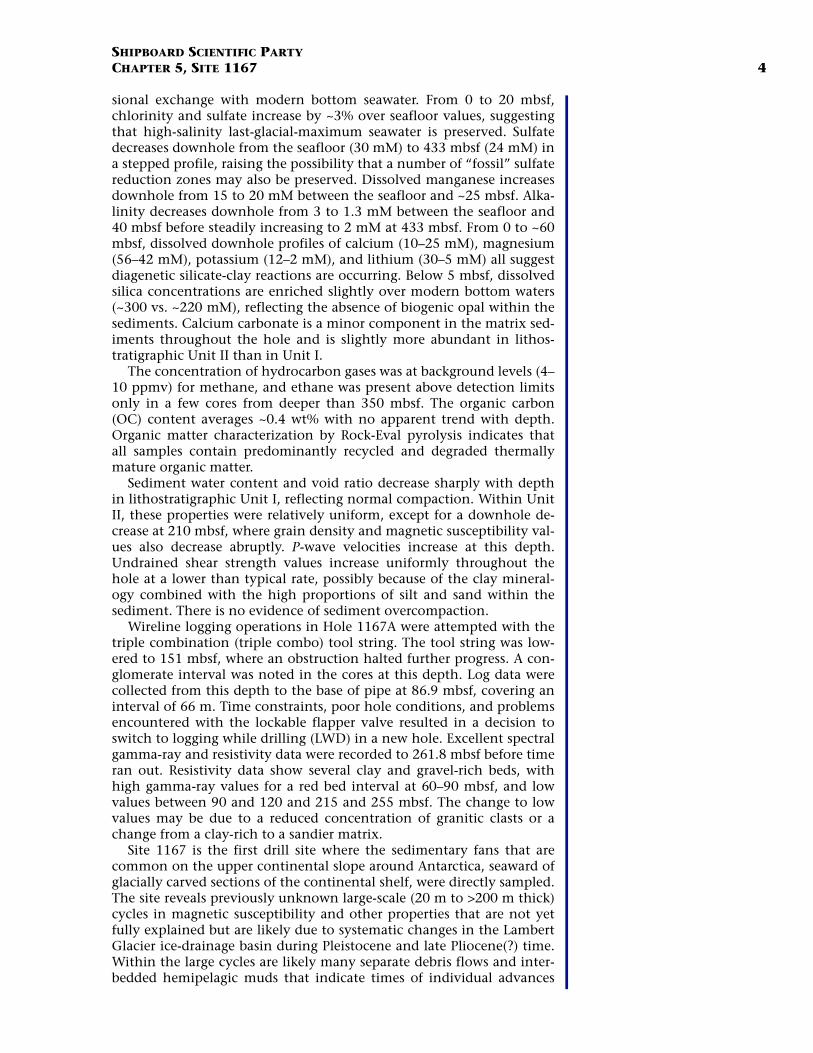
The Amery Ice Shelf–Lambert Glacier ice drainage system drains~22% of the East Antarctic Ice Sheet (EAIS); therefore, Lambert Glacierresponds to fluctuations in the EAIS. During Cenozoic glacial episodes,the Lambert Glacier advanced to various points on the shelf, sometimesto the shelf edge, prograding the shelf (see Figs. F1, p. 29, and F2, p. 30,in the “Leg Summary” chapter; Fig. F1). A major change in Prydz Bayshelf progradation took place in late Neogene time when a fast-flowingice stream developed and excavated a channel (Prydz Channel) acrossthe shelf on the western side of Prydz Bay (see Fig. F3, p. 31, in the “LegSummary” chapter). The erosion surface marking this change can bemapped from the shelf to the continental rise (Surface PP12; Surface Aof Mitzukoshi et al., 1986). Since then, basal debris carried to the shelfedge by the ice stream has been deposited in a trough mouth fan on theupper slope, similar to fans deposited on other high-latitude margins(Boulton, 1990; Larter and Cunningham, 1993). This change may re-flect the earliest growth of thick ice on the Ingrid Christensen Coast,deflecting the Lambert Glacier when it advanced (O’Brien and Harris,1996).
Grounding zone wedges formed by Lambert Glacier in the PrydzChannel are only ~80 km seaward of the current Amery Ice Shelf edge(O’Brien et al., 1999). Domack et al. (1998) used 14C accelerated massspectrometry dating of cores from the wedge crests and Prydz Channelto demonstrate that these wedges are last glacial maximum (LGM)grounding zone deposits, indicating that Lambert Glacier did notground at the shelf edge during the LGM. This raises questions as towhich glacial episodes throughout late Neogene time produced a majoradvance and what paleoenvironmental conditions existed when themajor advance occurred. The best location to find answers to thesequestions is in the trough mouth fan, which received siliciclastic sedi-ment from the ice front when the shelf eroded during major ice ad-vances and deposited hemipelagic material during interglacials andsmaller glaciations.
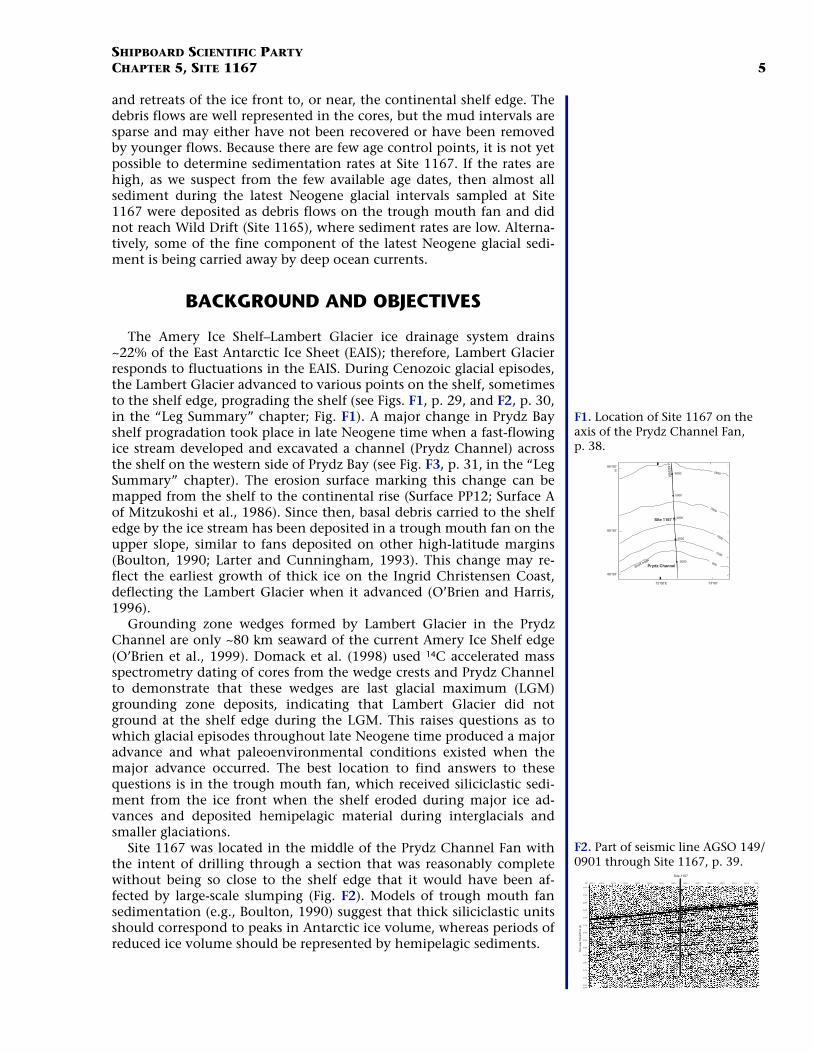
Site 1167 was located in the middle of the Prydz Channel Fan withthe intent of drilling through a section that was reasonably completewithout being so close to the shelf edge that it would have been af-fected by large-scale slumping (Fig. F2). Models of trough mouth fansedimentation (e.g., Boulton, 1990) suggest that thick siliciclastic unitsshould correspond to peaks in Antarctic ice volume, whereas periods ofreduced ice volume should be represented by hemipelagic sediments.
2500
2000
1500
1000
600
72°00'E 73°00'
66°00'S
66°30'
66°50'
Prydz Channel2000
Shelf edge
6000
149/0901
5000
4000Site 1167
3000
F1. Location of Site 1167 on the axis of the Prydz Channel Fan, p. 38.
Site 1167
SP 38933902.53912.53922.53932.53942.53952.53962.53972.53982.53992.54002.54012.54022.54032.5
2.140
2.200
2.250
2.300
2.350
2.400
2.450
2.500
2.550
2.600
2.650
2.700
2.750
2.8002.815
Two-
way
trav
eltim
e (s
)
F2. Part of seismic line AGSO 149/0901 through Site 1167, p. 39.

SHIPBOARD SCIENTIFIC PARTYCHAPTER 5, SITE 1167 6
OPERATIONS
Hole 1167A
The 97-nmi voyage to Site 1167 was accomplished at an averagespeed of 11.4 kt. The vessel approached the Global Positioning Systemcoordinates of proposed site PBF-6A on 22 February at 2200 hr, and abeacon was deployed at 2238 hr. Hole 1167A was spudded with the APCat 0925 hr on 23 February. The seafloor depth was established from therecovery of the first core at 1651.3 meters below sea level. APC coringproceeded without incident, but with varying recovery (77%–103%), to39.7 mbsf (Tables T1, T2). APC refusal was reached when the core barrelof Core 6H did not achieve a full stroke and was recovered empty andpartially bent. A successful Adara tool heat-flow measurement wastaken at the mudline and on Core 5H (see “In Situ Temperatures,”p. 30). Coring with the XCB system resumed at 1445 hr with Core 7Xand continued through Core 21X to a depth of 179.2 mbsf, when oper-ations had to be suspended because of an approaching iceberg. Afterpumping a 30-bbl sepiolite mud sweep, the pipe was pulled to 42.6mbsf while the movement of the iceberg was monitored. The icebergcame to within 0.1 nmi before passing the drill site. The decision wasmade to run back to bottom and resume coring by 1000 hr, when theiceberg had reached a range of 0.3 nmi and was moving away from thedrill site. XCB coring was resumed and continued until Core 28X wasrecovered from a depth of 246.5 mbsf. Another iceberg approached thedrill site at 2345 hr on 24 February. This iceberg came to within 0.5 nmiof the vessel. The iceberg was monitored for an hour, during whichtime it passed the drill site and was moving away. The drill string wasagain run to bottom with the top drive still in place. At a depth of 161.7mbsf, the driller noted 25,000 lb of downward drag. Light reaming wasrequired to reach bottom. A core barrel was deployed, and at 0600 hr on25 February XCB coring resumed.
Coring operations were short lived, however, when another icebergarrived on the scene. After recovering Core 34X from a depth of 303.2mbsf, the drill string was once again pulled back to the seafloor, withthe end of the pipe placed at 42.6 mbsf.
The plan was to deploy a free fall funnel (FFF) once the pipe was at asafe depth below the seafloor. This plan had to be changed when theiceberg increased its approach speed and changed course, moving di-rectly toward Site 1167. The decision was made to not deploy the FFFand to remain in position to pull the remaining drill pipe free of theseafloor should the need arise.
On 25 February at 2145 hr, the iceberg had moved to a distance of1.5 nmi from the drill site and was continuing away at a rapid rate. Thedecision was made to deploy the FFF at this point because more icebergswere in the vicinity. The drill string was once again run into the hole.As before, the driller encountered an obstruction at 168.7 mbsf, result-ing in 25,000 lb of down drag and requiring light reaming to reach thebottom.
Coring continued to Core 49X, a total depth of 447.5 mbsf. Recoveryand rate of penetration were extremely variable throughout the coringcycle, as we intermittently drilled through coarse sand and gravel bedsand encountered occasional dropstones. The decision was made to haltcoring operations short of the 620 mbsf objective, to conserve adequatetime for wireline logging and LWD operations and to meet the 15-hr
T1. Coring summary, p. 85.
T2. Expanded coring summary, p. 86.

SHIPBOARD SCIENTIFIC PARTYCHAPTER 5, SITE 1167 7
early departure from the site required as an additional transit-time con-tingency.
Logging Operations in Hole 1167A
In preparation for logging, the XCB bit was placed at a depth of 86.9mbsf and the Schlumberger wireline sheaves were rigged up. The firstsuite of logging tools to be deployed was the triple combo consisting ofthe dual-induction tool model E (DIT), high-temperature lithodensitysonde (HLDS), neutron array porosity sonde (APS), and high-tempera-ture natural gamma sonde (HNGS). The tools were deployed on 27 Feb-ruary at 1905 hr; however, they could only be lowered to a depth of148.7 mbsf, or 61.7 m below the end of the pipe. This short section waslogged back to the bit. The tool could not be retracted back into thepipe without circulating the rig pumps to open the flapper valve.
While the logging tools were being recovered, it was decided that fur-ther wireline logging efforts had to be abandoned. The logging toolswere laid out, and by 2400 hr on 27 February the Schlumberger wirelinesheaves were rigged down. The hole was filled with a 30-m cementplug, and the pipe was pulled clear of the seafloor by 0215 hr. The bitcleared the rotary table at 0825 hr, ending Hole 1167A. Total time lostbecause of icebergs and ice-related problems amounted to 26.75 hr atHole 1167A.
Hole 1167B
The vessel was offset 50 m to the northwest for a dedicated LWD/MWD hole. After waiting on weather for 4.25 hr, the drill string wastripped to the bottom and Hole 1167B was spudded at 2100 hr on 28February. Drilling with the LWD/MWD system proceeded smoothlythroughout the night with excellent results. The time allocated for thisoperation ran out at 0930 hr on 29 February, and drilling was halted ata depth of 261.8 mbsf. All LWD/MWD systems and the real time datatelemetry equipment performed perfectly.
The hole was displaced with 66 bbl of bentonite gel mud, and thepipe was recovered, clearing the seafloor at 1110 hr on 29 February.During the pipe trip, the positioning beacons were released and recov-ered. While we attempted to release the third beacon, the portable com-mand unit cable was sucked into the No. 6 thruster well. The cable wassevered immediately, and the transducers head was lost. As a result, bea-con No. 3 could not be released. The hydrophones and thrusters wereretracted, and the drilling equipment was secured for transit. At 1730 hron 29 February 2000, the vessel departed the last site of Leg 188 and be-gan the transit to Hobart, Tasmania.
LITHOSTRATIGRAPHY
Hole 1167A was drilled to a maximum depth of 447.5 mbsf. We re-covered a succession of predominately clayey silty sands with dispersedrock clasts and minor beds of coarse sands, clays, and sandy clays. Twolithostratigraphic units are identified (Figs. F3, F4). Unit I is composedof olive and reddish brown clay and sandy clay with minor admixturesof biogenic components. There is a gradational transition into Unit II,which makes up the majority of the section at Site 1167 and is com-posed of one major facies (Facies II-1) along with three minor facies. Fa-
1H2H
3H
4H5H7X8X
9X
10X
11X
12X
13X
14X
15X
16X
17X
18X
19X
20X
21X
22X
23X
24X
25X
26X
27X
28X
29X
30X
31X
32X
33X
34X
35X
36X
37X
38X
39X
40X
41X
42X
43X
44X
45X
46X
47X
48X
49X
Dep
th (
mbs
f)
Clay Silt SandI
II
0
10
cm Unit I: Clay and sandy clay with isolated beds of fine sand and rare lonestones; minor biogenic componentPROCESS HEMIPELAGIC
Unit II: Clayey silty sand with local diamicton beds and minor foraminifersPROCESS DEBRIS FLOW
One major facies and three minor facies:
Facies II-1: Dark gray sandy silt, silty sand, clayey sand, and clast-poor diamicton
Facies II-2: Gray, moderately sorted coarse sand
Facies II-3: Dark gray clay and clay with light-colored silt laminae
Facies II-4: Green gray clay with dispersed clasts, abundant foraminifers, and minor nannofossil component
F-II-1
F-II-2
F-II-2
F-II-2
F-II-1
F-II-1
F-II-1
F-II-1
F-II-1
F-II-1
F-II-4
F-II-4
F-II-3
F-II-3
F-II-3
F-II-3
Intervals with red color banding
F-II-4
Gravel bed
F-II-4
0
50
100
150
200
250
300
350
400
450
Cor
e
0
10
cm
0
10
cm
Rec
over
y
Lith
o. u
nit
F3. Lithostratigraphic units and fa-cies, p. 40.
Colorreflectance
(%)
0 10 20
Lonestones(per meter of core)
1H
2H
3H
4H
5H7X
8X
9X
10X
11X
12X
13X
14X
15X
16X
17X
18X
19X
20X
21X
22X
23X
24X
25X
26X
27X
28X
29X
30X
31X
32X
33X
34X
35X
36X
37X
38X
39X
40X
41X
43X
42X
44X
45X
46X
47X
48X
49X
I
II
Ple
isto
cen
e
0 50 100
PercentX-ray Diffraction
Counts
0 2 4 6
Lonestones(average size in cm)
4 8 12 16
Co
re
Rec
over
y
1167A
Lithology
Lith
o. u
nit
Age
X-Raydiffractioncounts (%)
0
50
100
150
200
250
300
350
400
450
Dep
th (
mbs
f)
F4. Composite stratigraphic sec-tion showing core recovery, a sim-plified summary of lithology, age, lonestone, XRD, and color reflec-tance data, p. 41.

SHIPBOARD SCIENTIFIC PARTYCHAPTER 5, SITE 1167 8
cies II-1 is composed of interbedded, poorly sorted dark gray sandy silt,silty sand, clayey sand, and clast-poor diamicton. Facies II-2 is com-posed of moderately sorted gray coarse sand. Facies II-3 is composed ofdark gray clay with silt laminations. Facies II-4 is composed of green-gray clay with dispersed clasts, abundant foraminifers, and rare nanno-fossils. Calcium carbonate is a minor component in the matrix sedi-ments throughout the hole and is slightly more abundant in Unit IIthan in Unit I.
Unit I
Interval: Section 188-1167A-1H-1, 0 cm, through Section 1H-CC,15 cm
Depth: 0–5.17 mbsfAge: Holocene to Pleistocene (<0.66 Ma)
Unit I comprises a relatively short interval at the top of the hole andis composed of olive (5Y 4/3) clay and sandy clay with isolated beds offine sand and rare lonestones and brown to reddish brown (10YR 4/3)sandy clay (Figs. F3, F5). The sediments are very low in CaCO3 content,with a maximum of only 0.50 wt% (see “Organic Geochemistry,”p. 24). Unit I contains up to 2% diatoms and 1% sponge spicules (see“Smear Slides,” p. 12).
Diffuse reddish brown color bands (10YR 4/3) are present in severalshort intervals in Unit I (188-1167A-1H-1, 143–146 cm; 1H-2, 42–58cm, and 69–76 cm; 1H-3, 50–59 cm; and 1H-3, 140–145 cm). A nor-mally graded sand bed is found in interval 188-1167A-1H-2, 92–106 cm(2.42–2.56 mbsf), and grades upward from granules and very coarsesand at the bottom to medium sand at the top (Fig. F5).
Interpretation
Unit I sediments record a period of hemipelagic deposition. This in-terpretation is supported by the fine-grained nature of the sediments aswell as the presence of diatoms and sponge spicules (1%–2% recordedfrom smear slides). The lonestones that are present are likely IRD. Thenormally graded sand bed can be interpreted as the Ta unit in the subdi-vision of turbidites by Bouma (1962).
Unit II
Interval: Section 188-1167A-2H-3, 0 cm, through Section 49X-CC,22 cm
Depth: 5.17–447.5 mbsfAge: Pleistocene and Holocene
At the lower boundary of Unit I, there is a sharp color change and gra-dational transition from the clays and sandy clays into the coarser sedi-ments of Unit II. Unit II comprises the rest of the section and is com-posed of four facies. Facies II-1 is the primary component of the unit andconsists of diamictons and sediments characterized by abundant dis-persed granules and pebbles in a matrix of varying proportions of sand,silt, and clay. Facies II-2 consists of coarse sands, Facies II-3 consists ofgray clays and common silt laminations, and Facies II-4 consists of bio-genic-rich green-gray clays. These three facies comprise only thin inter-beds and collectively account for <2% of the sediment in Unit II. Calci-
cm
95
100
105
90
F5. Clay and sandy clay typical of Unit I, p. 43.

SHIPBOARD SCIENTIFIC PARTYCHAPTER 5, SITE 1167 9
um carbonate content is generally <1 wt% but is relatively higher thanin Unit I and ranges from 0.50 to 1.25 wt%. Smear-slide data indicatethat quartz and clay minerals are the primary components of the matrixsediment throughout Unit II. Heavy minerals, opaques, and garnet makeup the majority of other components, but their percentages decrease be-low Section 188-1167A-26X-6, 90 cm.
Facies II-1
Facies II-1 consists of dark gray (5Y 4/1), very dark gray (5Y 3/1, 10YR3/1), and reddish gray (5YR 4/2) poorly sorted sandy silt, silty sand,clayey sand, and clast-poor diamicton with dispersed granules and peb-bles of varying sizes and lithologies (Figs. F3, F6). The relative propor-tions of sand, silt, clay, and clasts change frequently, and few clast-supported beds are present.
Lonestones are common throughout Facies II-1 and consist of vari-able lithologies including granite, granite gneiss, garnet-bearing gneiss,metaquartzite, and sandstone. Dolerite, schist, conglomerate, variousminerals, and rare carbonized wood are also present (Fig. F7). The distri-bution of granite and sandstone lonestones varies systematically. From425 to 200 mbsf, sandstone lonestones are more abundant than above200 mbsf, whereas granite lonestones are more abundant from 200mbsf to the top of the hole (Fig. F8).
The highest concentrations of rock clasts (>5%) are within interval188-1167A-19X-2, 0 cm, through 24X-1, 88 cm. Several decimeter- tometer-scale successions of clast-poor diamicton are present in this inter-val. Clast-poor diamictons are also present in intervals 188-1167A-5H-4,25–90 cm; 30X-4, 28–41 cm; 37X-CC, 0–10 cm; and 43X-2, 0–90 cm.Diamictons have a sandy silt or silty sand matrix. Gravel beds are inter-bedded with poorly sorted sandy silt in interval 188-1167A-19X-1, 124cm, through 19X-2, 130 cm (151.6–153.1 mbsf), and are characterizedby subangular to subrounded granules and small pebbles. One gravelbed in interval 188-1167A-19X-2, 50–80 cm (150.8–151.1 mbsf), is com-posed of ~60% clasts and 40% matrix material (Fig. F9). Additionally,sand and gravel concentrations are present in intervals 188-1167A-13X-2, 60–65 cm; 13X-4, 30–44 cm, and 65–67 cm; and 41X-3, 54–57 cm.
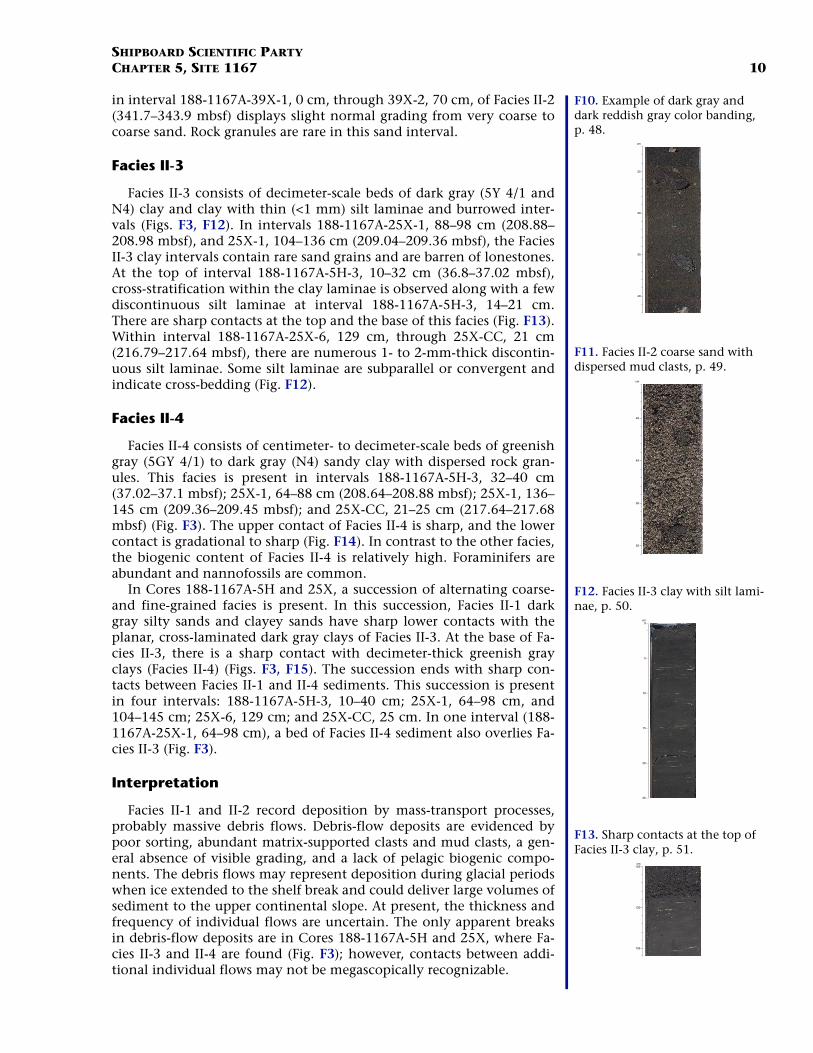
Numerous color alternations of dark gray (5Y 4/1) and dark reddishgray (5YR 4/2) are present in interval 188-1167A-10X-1, 8 cm, through13X-4, 21 cm (64.38–97.59 mbsf), and minor reddish gray color band-ing is present in interval 1167A-48X-2, 30–40 cm (430.1–430.2 mbsf).The color contacts are fairly sharp and are both planar and wavy. No ap-parent lithologic change or sedimentary structures are associated withthe color transitions (Fig. F10). Facies II-1 is barren of diatoms and radi-olarians, whereas foraminifers are a minor component in this facies (see“Biostratigraphy and Sedimentation Rates,” p. 14).
Facies II-2
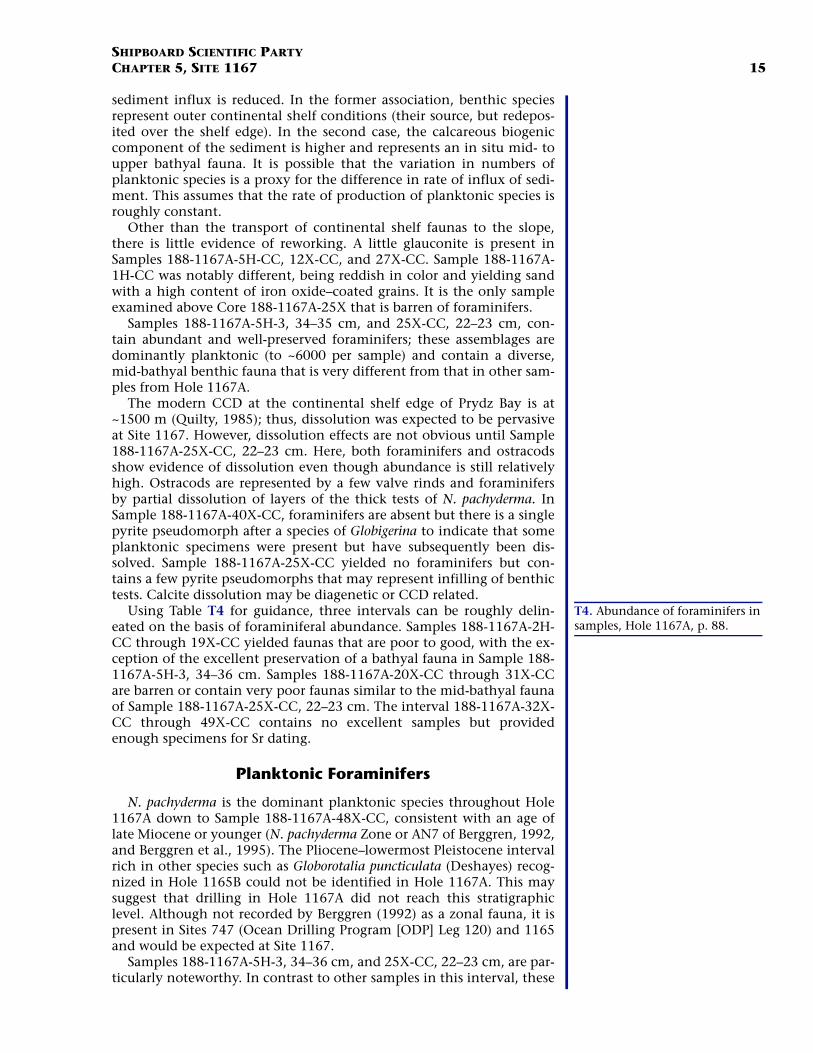
Facies II-2 consists of moderately sorted gray coarse sand with rare tocommon dispersed granules (Fig. F3). Grains are subrounded and pre-dominantly composed of quartz, K-feldspar, and mafic minerals. Thefirst occurrence of sand is at the top of the core in interval 188-1167A-22X-1, 0–50 cm (179.2–179.7 mbsf), and drilling operation contamina-tion cannot be ruled out. Dispersed mud clasts as large as 2 cm in diam-eter are common in the Facies II-2 sand bed in interval 188-1167A-37X-1, 0 cm, through 37X-3, 89 cm (322.5–326.39 mbsf) (Fig. F11). The sand
cm
50
55
65
60
45
F6. Silty sand with dispersed clasts typical of Facies II-1, p. 44.
0
50
100
150
200
250
300
350
400
450
0 1 2 3 4 5 6 7 8 9 10 11 12 13 14 15 16
0 1 2 3 4 5 6 7 8 9 10 11 12 13 14 15 16
Dep
th (
mbs
f)
1 = Garnet gneiss2 = Gneiss3 = Metaquartzite4 = Conglomerate5 = Coal6 = Granite to gabbro7 = Sandstone8 = Quartz9 = Biotite10 = Pyrite11 = Claystone/mudstone12 = Dolerite13 = Matrix clast14 = Unknown + Bituminite?15 = Schist16 = Blue gneiss
Legend
F7. Lonestone lithologies and dis-tribution in Hole 1167A, p. 45.
012345
0 1 2 3 4 50
100
200
300
400
500
Distribution of sandstone lonestones in recovered core(number/m)
Dep
th (
mbs
f)
Distribution of granite/igneous lonestones in recovered core(number/m)
Granite
Sandstone
F8. Distribution and frequency of sandstone vs. granite/igneous lon-estones in Hole 1167A, p. 46.
cm
000
65
75
70
55
50
80
F9. Gravel bed from Facies II-1, p. 47.
SHIPBOARD SCIENTIFIC PARTYCHAPTER 5, SITE 1167 10
in interval 188-1167A-39X-1, 0 cm, through 39X-2, 70 cm, of Facies II-2(341.7–343.9 mbsf) displays slight normal grading from very coarse tocoarse sand. Rock granules are rare in this sand interval.
Facies II-3
Facies II-3 consists of decimeter-scale beds of dark gray (5Y 4/1 andN4) clay and clay with thin (<1 mm) silt laminae and burrowed inter-vals (Figs. F3, F12). In intervals 188-1167A-25X-1, 88–98 cm (208.88–208.98 mbsf), and 25X-1, 104–136 cm (209.04–209.36 mbsf), the FaciesII-3 clay intervals contain rare sand grains and are barren of lonestones.At the top of interval 188-1167A-5H-3, 10–32 cm (36.8–37.02 mbsf),cross-stratification within the clay laminae is observed along with a fewdiscontinuous silt laminae at interval 188-1167A-5H-3, 14–21 cm.There are sharp contacts at the top and the base of this facies (Fig. F13).Within interval 188-1167A-25X-6, 129 cm, through 25X-CC, 21 cm(216.79–217.64 mbsf), there are numerous 1- to 2-mm-thick discontin-uous silt laminae. Some silt laminae are subparallel or convergent andindicate cross-bedding (Fig. F12).
Facies II-4
Facies II-4 consists of centimeter- to decimeter-scale beds of greenishgray (5GY 4/1) to dark gray (N4) sandy clay with dispersed rock gran-ules. This facies is present in intervals 188-1167A-5H-3, 32–40 cm(37.02–37.1 mbsf); 25X-1, 64–88 cm (208.64–208.88 mbsf); 25X-1, 136–145 cm (209.36–209.45 mbsf); and 25X-CC, 21–25 cm (217.64–217.68mbsf) (Fig. F3). The upper contact of Facies II-4 is sharp, and the lowercontact is gradational to sharp (Fig. F14). In contrast to the other facies,the biogenic content of Facies II-4 is relatively high. Foraminifers areabundant and nannofossils are common.
In Cores 188-1167A-5H and 25X, a succession of alternating coarse-and fine-grained facies is present. In this succession, Facies II-1 darkgray silty sands and clayey sands have sharp lower contacts with theplanar, cross-laminated dark gray clays of Facies II-3. At the base of Fa-cies II-3, there is a sharp contact with decimeter-thick greenish grayclays (Facies II-4) (Figs. F3, F15). The succession ends with sharp con-tacts between Facies II-1 and II-4 sediments. This succession is presentin four intervals: 188-1167A-5H-3, 10–40 cm; 25X-1, 64–98 cm, and104–145 cm; 25X-6, 129 cm; and 25X-CC, 25 cm. In one interval (188-1167A-25X-1, 64–98 cm), a bed of Facies II-4 sediment also overlies Fa-cies II-3 (Fig. F3).
Interpretation
Facies II-1 and II-2 record deposition by mass-transport processes,probably massive debris flows. Debris-flow deposits are evidenced bypoor sorting, abundant matrix-supported clasts and mud clasts, a gen-eral absence of visible grading, and a lack of pelagic biogenic compo-nents. The debris flows may represent deposition during glacial periodswhen ice extended to the shelf break and could deliver large volumes ofsediment to the upper continental slope. At present, the thickness andfrequency of individual flows are uncertain. The only apparent breaksin debris-flow deposits are in Cores 188-1167A-5H and 25X, where Fa-cies II-3 and II-4 are found (Fig. F3); however, contacts between addi-tional individual flows may not be megascopically recognizable.
cm
25
30
35
40
F10. Example of dark gray and dark reddish gray color banding, p. 48.
cm
40
45
50
55
F11. Facies II-2 coarse sand with dispersed mud clasts, p. 49.
cm
10
15
25
20
5
0
F12. Facies II-3 clay with silt lami-nae, p. 50.
cm
135
130
125
F13. Sharp contacts at the top of Facies II-3 clay, p. 51.

SHIPBOARD SCIENTIFIC PARTYCHAPTER 5, SITE 1167 11
The thin intervals of fine-grained sediments in Facies II-3 and II-4 in-dicate a change in the mode of sedimentation and a break in debris-flow deposition. Clays with silt laminae are similar in appearance andcomposition to the sediments of lithostratigraphic Unit III at Site 1165(see “Lithostratigraphy,” p. 7), which are interpreted as muddy con-tourites. Therefore, Facies II-3 may record short intervals when contourcurrents were active on the fan. The nature of the silt laminae and bio-turbation within Facies II-3 would argue against deposition by turbiditycurrents. The abundance of pelagic foraminifers in Facies II-4 suggestspelagic deposition, whereas the dispersed sand and granules suggestdeposition of IRD. This facies thus appears to represent short intervals,possibly interglacials, when mass transport and contour-current deposi-tion were interrupted and pelagic deposition was dominant.
Lonestones
Lonestones from Site 1167 (>1 cm largest visible diameter on the cutface of each core) were cataloged and assigned to one of 16 lithologicvarieties (Table T3). Figure F4 illustrates the downhole variation in aver-age size of the lonestone clasts. In general, size variations seem to berandom with only a minor increase downhole from 0 to ~200 mbsf.The number of lonestones per meter of core remains fairly consistentfrom 0 to ~160 mbsf, below which there is a series of downward in-creases in lonestone concentration from 160 to 210, 300 to 320, and410 to 420 mbsf. A slight overall downhole increase in lonestones permeter is also noted below 200 mbsf (Fig. F4).
The distribution of the 16 lithologies was plotted against depth to ex-amine possible changes in provenance of the penetrated sediments (Fig.F7). In general, the vertical distribution of lithology groups appears tobe random; however, closer inspection of items 6 (granite group) and 7(sandstone group) suggests that this is not the case. These two lithologygroups, granite (including diorites and gabbros for the purposes of bin-ning) and sandstone, show systematic changes in distribution down-hole (Fig. F8). The granite group is most abundant in the upper part ofthe hole and decreases downhole between 0 and ~200 mbsf. Below thispoint, the abundance of granite group clasts is significantly reduced. Incontrast, the sandstone group clasts demonstrate the opposite trend:few or no sandstone clasts appear down to ~180 mbsf, below which thenumber of sandstone clasts per meter of core increases significantly(Fig. F7). This type of distribution (i.e., an inverse relationship betweenclast groups) suggests the possibility that two different source areas de-livered material to Site 1167 and that one source area (granite) gave wayto the other (sandstone). In addition to the variation in sandstone andgranite distributions, a greater abundance of schist clasts (item 15 inFig. F7) and dark clasts of unknown composition (item 14 in Fig. F7)above 180 mbsf may also indicate a change in the predominance ofsource areas.
Blue gneiss with cordierite is present in Section 188-1167A-46X-CC,25 cm. Blue gneiss with cordierite is a conspicuous lithology in theLarseman Hills region of Princess Elizabeth Land (Tingey, 1991); there-fore, the blue gneiss in Core 188-1167A-46X is possible evidence thatthis region was a source area for the recovered sediments at Site 1167.
A possible bituminite clast is present in Section 188-1167A-30X-3,105 cm (~260 mbsf) (Fig. F7). This 2-cm elongate clast is black,rounded, striated, and malleable and exhibits a low specific gravity. Pos-sible sources of this clast are unclear.
cm
35
40
50
45
30
25
Upper contact
Lower contact
F14. Sharp contact at the top and gradational contact at the base of Facies II-4 clay, p. 52.
cm
20
25
35
30
15
10
40
45
50
F15. Typical succession of coarse- and fine-grained facies, p. 53.
T3. List of lonestone and dispersed granules, p. 87.

SHIPBOARD SCIENTIFIC PARTYCHAPTER 5, SITE 1167 12
Smear Slides
The mineralogy of smear slides reveals no trend at this site. Similarly,the grain-size distribution within the mud-sized sediments and the ma-trix of the coarser grained varieties estimated using smear slides pre-sents no systematic trend (Fig. F16). Several peaks in the abundance ofclay-sized and silt-sized components reflect minor changes in sedimenttype as described in the body of the report.
X-Ray Diffraction Mineralogy
At Site 1167, 44 samples were analyzed for bulk mineralogy and 13samples were analyzed for clay minerals. XRD bulk mineralogy datashow that the sediments are primarily composed of quartz, plagioclase,K-feldspar, and a mixture of clay minerals (Fig. F4). In Sample 188-1167A-9X-1, 25–26 cm, a minor amount of hornblende and calcite ispresent. Total clay content remains relatively constant throughout thehole. Total quartz content in the upper 208 mbsf is slightly less than indeeper portions of the hole, whereas from 208 mbsf downhole, the rela-tive abundance of plagioclase decreases and the abundance of K-feld-spar stays constant. Poor sorting and differences in abundance of verycoarse material in sediments may cause the slight irregular variability inquartz content downhole.
Thirteen samples were chosen for an overview of clay mineralogychanges in Units I and II. These samples were taken from the clay ofUnit I, clayey silty sands and diamictons of Unit II, and three thin claybeds in intervals 188-1167A-5H-3, 12–13 cm; 25X-1, 126–127 cm; and25X-7, 17–18 cm. In Unit I, an olive-gray clay (4.93 mbsf; Sample 188-1167A-1H-4, 43–44 cm) contains kaolinite, smectite, and illite, withsome clay-sized quartz, plagioclase, and K-feldspar (Fig. F17). A samplefrom the underlying dark gray poorly sorted sandy clay with some dis-persed granules of Facies II-1 (36.82 mbsf; Sample 188-1167A-5H-3, 12–13 cm) mainly consists of illite, kaolinite, and minor chlorite (Fig. F17).Smectite is absent, and there is more illite and less kaolinite than foundin the clays of Unit I. The gray to greenish gray clay bed of Facies II-4(209.26 mbsf; Sample 188-1167A-25X-1, 126–127 cm) exhibits a verysimilar clay mineral distribution to the sample at the top of the hole inUnit I; however, a Facies II-3 sample of the dark clay with few silt lami-nae (217.2 mbsf; Sample 188-1167A-25X-7, 17–18 cm) shows a distinc-tively different clay-mineral assemblage including kaolinite, less illite,and no smectite (Fig. F18).
The Facies II-1 color-banded reddish gray poorly sorted clayey sandwith dispersed clasts (64.61 mbsf; Sample 188-1167A-10R-1, 31–32 cm)contains kaolinite, illite, and smectite (Fig. F19). The most typical li-thology of Facies II-1 (Samples 188-1167A-14X-1, 39–40 cm; 27X-1, 39–40 cm; 33X-2, 43–44 cm; 38X-1, 58–59 cm; 43X-2, 104–105 cm; 47X-1,55–56 cm; and 48X-2, 35–38 cm) demonstrates these same clay miner-als; however, the ratio of smectite to illite varies slightly and comparedto the abundance of kaolinite remains fairly constant throughout thesection (Fig. F19). Below 382 mbsf, the abundance of smectite is highercompared to upper portions of the sediments. The poorly sorted sandysilt to silty sand of Facies II-1 (429.13 mbsf; Sample 188-1167A-48X-1,83–84 cm) contains predominantly kaolinite, illite, smectite, and also aminor amount of chlorite (Fig. F19).
The presence of smectite in clays of Facies II-4 at two different hori-zons (4.93 and 209.26 mbsf), coupled with the presence of biogenic
0 20 40 60 80 100
0 20 40 60 80 1000
50
100
150
200
250
300
350
400
Dep
th (
mbs
f)
%
Clay
Silt
Sand
F16. Percentages of sand, silt, and clay from smear slides, p. 54.
Heated
2 6 10 14 18 22 26 30 34
Illite K
aolin
ite
Kao
linite
Quartz + Illite
188-1167A-5H-3W, 12-13 cm
188-1167A-1H-1W, 45-46 cm
Heated
Glycolated
Untreated
Qua
rtz
800
400
0
Diffraction angle (2θ)
Inte
nsity
(co
unts
)
1600
1200
2400
2000
2800
3200
PlagioclaseK-feldspar
Pla
gioc
lase
Sm
ectit
e
Chl
orite
Untreated
Glycolated
F17. X-ray diffractograms of clay-sized fractions of sediment from Cores 188-1167A-1H and 5X, p. 55.
Untreated
Glycolated
Heated
2 6 10 14 18 22 26 30 34
Illite
Kao
linite Kao
linite
Quartz + Illite
188-1167A-25X-7W, 17-18 cm
188-1167A-25X-1W, 126-127 cm
Heated
Glycolated
Untreated
Qua
rtz
800
400
0
Diffraction angle (2θ)
Inte
nsity
(co
unts
)
1600
1200
2400
2000
2800
3200
Plagioclase
K-feldspar
Sm
ectit
e
F18. X-ray diffractograms of clay-sized fractions of sediment from Core 188-1167A-25X, p. 56.
Untreated
Glycolated
Heated
2 6 10 14 18 22 26 30 34
Illite
Kao
linite
Kao
linite Quartz + Illite
188-1167A-14X-1W, 68-69 cm
188-1167A-10X-1W, 31-32 cm
Heated
Glycolated
Untreated
Qua
rtz
800
400
0
Diffraction angle (2θ)
Inte
nsity
(co
unts
)
1600
1200
2400
2000
2800
3200
Plagioclase
K-feldspar
Sm
ectit
e
188-1167A-48X-1W, 83-84 cm
Chl
orite
Sm
ectit
e
Heated
Glycolated
Untreated
3600
4200
F19. X-ray diffractograms of clay-sized fractions of sediment from Cores 188-1167A-10X, 14X, and 48X, p. 57.

SHIPBOARD SCIENTIFIC PARTYCHAPTER 5, SITE 1167 13
components, suggests more hemipelagic sedimentation in these inter-vals. The clay-rich intervals with silty laminae of Facies II-3 (36.82 and217.2 mbsf) are dominated by illite and resemble those overlying andunderlying poorly sorted sandy silts to silty sands of Facies II-1, whichsuggests a similar sediment source for both these clays and the debrisflows. Slight changes in illite/smectite ratios may relate to variations insediment sources or may result from different glacial and gravitationalflow processes (cf. Ehrmann and Fütterer, 1994). Thus, changes in theclay-mineral assemblages in trough-mouth fan deposits may provide in-direct information about periods of glacial advances to the shelf edgeduring late Pliocene–Pleistocene time; however, smectite dominance inthe hole below 382 mbsf is probably more directly linked to sediment-source characteristics, as is the slightly higher total quartz content be-low 208 mbsf. Overall, the presence of kaolinite relates only to thesource area characteristics, where chemically weathered basement andsedimentary rocks were common. During the Pliocene–Pleistocene, lessweathered sources were likely available, and these provided the variousamounts of illite and smectite observed in the sediments.
Environmental Interpretation
Subtle changes in composition downcore at Site 1167 may suggestimportant implications for the glacial history in the Prydz Bay region.Unit I, the thin Holocene to upper Pleistocene hemipelagite interval,records the most recent deposition on the slope and represents intergla-cial conditions when fine particles and biogenic material settled out ofthe water column, and IRD was supplied by icebergs.
Unit II records a thick succession of debris flows on the slope. Therelatively thin intervals of Facies II-3 and II-4 clays represent relativelyshort periods when conditions changed and an alternate form of sedi-mentation (i.e., current-driven or hemipelagic) was preserved. It is pos-sible that these intervals represent changes from glacial to interglacialconditions or minor fluctuations during a glacial period.
Changes in sediment composition can be identified on differentscales at Site 1167. Repetitive changes in sediment composition may becaused by short-term climate cyclicity, perhaps advances and retreats ofthe grounding line without major shifts in glacial flow patterns. Slightchanges in illite/smectite ratios may be related to these grounding-lineprocesses; however, in sediment from the lower part of the hole, smec-tite dominance is probably related more to source-area characteristicsthan to grounding-line processes. Large-scale shifts in sediment compo-sition may be related to major rearrangements within the Lambert Gla-cier–Amery Ice shelf drainage system.
Several lithologic downhole parameters change at 200–210 mbsf.Lonestone data show a significant upward change from sandstone togranite stones at ~200 mbsf, which may suggest a shift in sedimentprovenance. XRD bulk mineralogy shows a higher abundance of plagio-clase above 210 mbsf than below, whereas quartz is more abundant be-low 210 mbsf than above. Clay mineralogy data shows higher kaolinite/illite ratios for the lower part of the hole than found above 210 mbsf.Additionally, magnetic susceptibility (see “Paleomagnetism,” p. 19),grain density and porosity (see “Physical Properties,” p. 25), naturalgamma-ray data (see “Downhole Measurements,” p. 31), and datafrom foraminifer residues (see “Appendix,” p. 37) all exhibit distinctivechanges near 210 mbsf.

SHIPBOARD SCIENTIFIC PARTYCHAPTER 5, SITE 1167 14
BIOSTRATIGRAPHY ANDSEDIMENTATION RATES
Introduction
Hole 1167A was drilled on the Prydz Bay Trough Mouth Fan in orderto penetrate a late Miocene and younger sequence and elucidate thehistory of the advance and retreat of the ice sheet to and from the Ant-arctic continental shelf edge.
Foraminifers are the only consistently present microfossil in Hole1167A. The dominance of Neogloboquadrina pachyderma (Ehrenberg)suggests that the section is late Miocene or younger in age (N. pachy-derma Zone or AN7 of Berggren et al., 1995). The foraminifers present inthe diamictons indicate that outer continental shelf faunas are being re-cycled. Clay-rich horizons contain in situ mid-bathyal faunas.
Diatoms indicate that Core 188-1167A-1H is <0.66 Ma (Thalassiosiralentiginosa Zone) in age. Calcareous nannofossils in Sample 188-1167A-5H-3, 35–36 cm, are likely to be mid-Pleistocene in age (Zones CN12–14a of Samtleben, 1980), and those in Sample 188-1167A-25X-CC, 22–23 cm, are early to mid-Pleistocene in age (Zone CN13b).
Biostratigraphic results from Hole 1167A are summarized in FigureF20.
Foraminifers
Introduction
N. pachyderma (Ehrenberg) dominates all foraminferal assemblagesrecovered from Hole 1167A. Above 217 mbsf, all samples other thanSample 188-1167A-1H-CC contain some foraminifers; below Sample188-1167A-25X-CC, a high proportion of samples are barren.
Two distinct associations of foraminifers are present in Hole 1167A.The most common association is with very coarse poorly sorted sand-stone dominated by angular terrigenous debris. Samples from these in-tervals yield few foraminifers, but over many samples a diverse arrayemerges. These faunas are dominated by N. pachyderma (Ehrenberg)with one or two subordinate planktonic species. Higher in the hole,benthics comprise a few percent of each sample. Benthic shelf calcar-eous species, especially cassidulinids but with a few buliminid species,indicate an infaunal element. Sediments barren of foraminifers couldrepresent times of reduced habitat availability and lower sea level (gla-cial maxima), and sections with greater foraminiferal content could in-dicate greater habitat availability during times of low ice cover andhigher sea level (glacial minima). Glacial-interglacial variations in thecarbonate compensation depth (CCD) may have affected carbonatepreservation at Site 1167.
The second association occurs in the few gray clay samples. This li-thology yields abundant (99%) planktonic foraminifers dominated byN. pachyderma. Benthic forms are rare but more diverse and typical ofthe bathyal or slope environment. The presence of echinoid spines sug-gests that the seafloor supported a more diverse fauna than in othersamples.
The two associations represent fundamentally different environ-ments of deposition consistent with the hypothesis of (1) periodic in-flux of shelf sediment and (2) pelagic conditions when the shelf
Tim
e-ro
ckun
its
Cor
e
Rec
over
y Magneto-stratigraphy
Pol. ChronDiatoms
Radio-larians
Plank.Foram.
Nanno-fossils
Biostratigraphy
Hole 1167A
T. lentiginosa
Top
core
dept
h(m
bsf)
Barren
AN7
Chi/Psi
C1nI
CN14a?
CN13b?BarrenBarren
0.005.20
14.7024.2033.7039.7039.7045.0054.7064.3073.7083.3093.00
102.60112.30121.90131.50140.70150.30159.90169.60179.20188.80198.40208.00217.60227.20236.90246.50256.10265.70275.30284.60293.90303.20312.80322.50332.10341.70351.30360.90370.60380.20389.80399.40409.00418.70428.30437.90
1 H 2 H 3 H 4 H 5 H 6 H 7 X 8 X 9 X
10 X 11 X 12 X 13 X 14 X 15 X 16 X 17 X 18 X 19 X 20 X 21 X 22 X 23 X 24 X 25 X 26 X 27 X 28 X 29 X 30 X 31 X 32 X 33 X 34 X 35 X 36 X 37 X 38 X 39 X 40 X 41 X 42 X 43 X 44 X 45 X 46 X 47 X 48 X 49 X
C1r.2r
low
er P
leis
toce
neup
per
mid
-P
leis
toce
ne
Lith
o. u
nit
C1r.1r
F20. Core recovery, lithostrati-graphic units, magnetostratigra-phy, and biostratigraphic zones for Hole 1167A, p. 58.
SHIPBOARD SCIENTIFIC PARTYCHAPTER 5, SITE 1167 15
sediment influx is reduced. In the former association, benthic speciesrepresent outer continental shelf conditions (their source, but redepos-ited over the shelf edge). In the second case, the calcareous biogeniccomponent of the sediment is higher and represents an in situ mid- toupper bathyal fauna. It is possible that the variation in numbers ofplanktonic species is a proxy for the difference in rate of influx of sedi-ment. This assumes that the rate of production of planktonic species isroughly constant.
Other than the transport of continental shelf faunas to the slope,there is little evidence of reworking. A little glauconite is present inSamples 188-1167A-5H-CC, 12X-CC, and 27X-CC. Sample 188-1167A-1H-CC was notably different, being reddish in color and yielding sandwith a high content of iron oxide–coated grains. It is the only sampleexamined above Core 188-1167A-25X that is barren of foraminifers.
Samples 188-1167A-5H-3, 34–35 cm, and 25X-CC, 22–23 cm, con-tain abundant and well-preserved foraminifers; these assemblages aredominantly planktonic (to ~6000 per sample) and contain a diverse,mid-bathyal benthic fauna that is very different from that in other sam-ples from Hole 1167A.
The modern CCD at the continental shelf edge of Prydz Bay is at~1500 m (Quilty, 1985); thus, dissolution was expected to be pervasiveat Site 1167. However, dissolution effects are not obvious until Sample188-1167A-25X-CC, 22–23 cm. Here, both foraminifers and ostracodsshow evidence of dissolution even though abundance is still relativelyhigh. Ostracods are represented by a few valve rinds and foraminifersby partial dissolution of layers of the thick tests of N. pachyderma. InSample 188-1167A-40X-CC, foraminifers are absent but there is a singlepyrite pseudomorph after a species of Globigerina to indicate that someplanktonic specimens were present but have subsequently been dis-solved. Sample 188-1167A-25X-CC yielded no foraminifers but con-tains a few pyrite pseudomorphs that may represent infilling of benthictests. Calcite dissolution may be diagenetic or CCD related.
Using Table T4 for guidance, three intervals can be roughly delin-eated on the basis of foraminiferal abundance. Samples 188-1167A-2H-CC through 19X-CC yielded faunas that are poor to good, with the ex-ception of the excellent preservation of a bathyal fauna in Sample 188-1167A-5H-3, 34–36 cm. Samples 188-1167A-20X-CC through 31X-CCare barren or contain very poor faunas similar to the mid-bathyal faunaof Sample 188-1167A-25X-CC, 22–23 cm. The interval 188-1167A-32X-CC through 49X-CC contains no excellent samples but providedenough specimens for Sr dating.
Planktonic Foraminifers
N. pachyderma is the dominant planktonic species throughout Hole1167A down to Sample 188-1167A-48X-CC, consistent with an age oflate Miocene or younger (N. pachyderma Zone or AN7 of Berggren, 1992,and Berggren et al., 1995). The Pliocene–lowermost Pleistocene intervalrich in other species such as Globorotalia puncticulata (Deshayes) recog-nized in Hole 1165B could not be identified in Hole 1167A. This maysuggest that drilling in Hole 1167A did not reach this stratigraphiclevel. Although not recorded by Berggren (1992) as a zonal fauna, it ispresent in Sites 747 (Ocean Drilling Program [ODP] Leg 120) and 1165and would be expected at Site 1167.
Samples 188-1167A-5H-3, 34–36 cm, and 25X-CC, 22–23 cm, are par-ticularly noteworthy. In contrast to other samples in this interval, these
T4. Abundance of foraminifers in samples, Hole 1167A, p. 88.
SHIPBOARD SCIENTIFIC PARTYCHAPTER 5, SITE 1167 16
samples yielded rich faunas dominated by N. pachyderma but with oneor two other planktonic species well represented (with a total plank-tonic component well over 98% of the total foraminifer fauna). Sam-ples have been set aside for Sr dating and for detailed taxonomic studyof a Globorotalia (Tenuitella) sp. that is common in the fauna. It also hasa small benthic component of environmental significance. These as-semblages are characteristic of the slope faunas.
Specimens of N. pachyderma in Sample 188-1167A-37X-CC are un-usual in being very small and compact, in contrast to samples abovethis level, which are large, less compact, and generally more abundant.N. pachyderma is, as expected, almost 100% sinistrally coiled, althougha few dextral specimens were seen (e.g., in Sample 188-1167A-19X-CC).
Eight samples with adequate numbers of N. pachyderma were setaside for postcruise Sr dating. It is expected that further samples will beobtainable when all samples have been processed. There is ample ma-terial in most samples for oxygen/carbon isotope studies.
Benthic Foraminifers
The benthic component of Hole 1167A samples is dominated by spe-cies of Globocassidulina and common buliminids and is considered to bean allochthonous fauna. This is the only Leg 188 section to contain ev-idence of a significant infauna, perhaps reflecting high nutrient condi-tions near a zone of upwelling. Upwelling here may simply be afunction of the flow of Circumpolar Deep Water into Prydz Bay fromthe deeper ocean. These faunas probably represent outer shelf faunasthat have been moved downslope.
Globocassidulina biora (Crespin) is a very characteristic Antarctic spe-cies; its first occurrence (FO) may, when documented fully, provide auseful chronostratigraphic marker. From preliminary observations, theFO of this taxon is noted in Sample 188-1167A-19X-CC.
Samples 188-1167A-5H-3, 34–36 cm, and 25X-CC, 22–23 cm, con-tain faunas that, although constituting <1% of the total foraminiferalfauna, yield forms not seen elsewhere during Leg 188. This assemblageis not a shelf fauna and includes Planulina wuellerstorfi (Schwager). Thecontrast between this fauna and the globocassidulinid-dominated shelffaunas is very marked and suggests that this fauna is in situ and not aproduct of transport from shallower depths.
Sample 188-1167A-8H-CC provided a well-preserved fauna with evi-dence (ostracods and echinoid spines) of a diverse fauna on the sea-floor.
Calcareous Nannofossils
Only a few samples examined from Cores 188-1167A-1H through49X contained calcareous nannofossils. Sample 188-1167A-5H-3, 35–36cm, was taken from a fine-grained muddy interval at the base of a sandydiamictite. The sample contains few moderately to well-preserved nan-nofossils, including Gephyrocapsa sp. morphotypes with central bars notpreserved. One specimen of Gephyrocapsa ericsonii was noted with a barintact, and a few small Pseudoemiliania lacunosa were noted. The assem-blage also included rare Calcidiscus leptoporus and few fragments of thecalcareous dinocyst, Thoracosphaera. A reworked specimen of the LateCretaceous species Gartnerago obliquum was observed, consistent withthe suggestion by Quilty et al. (1999) of the presence of uppermost Cre-taceous marine sediments in the region.
SHIPBOARD SCIENTIFIC PARTYCHAPTER 5, SITE 1167 17
The presence of P. lacunosa along with Gephyrocapsa places this sam-ple in nannofossil Zones CN12–CN14a of late Pliocene to mid-Pleis-tocene age (Fig. F20); however, the small G. ericsonii morphotypes prob-ably indicate a younger mid-Pleistocene age (Zone 14a?) (Samtleben,1980).
Within Core 188-1167A-25X, several centimeter-scale green tobrown claystone intervals were sampled and contained rare to fewmoderately to well-preserved calcareous nannofossils. Notably, Sample188-1167A-25X-CC, 22–23 cm, contained P. lacunosa, Gephyrocapsaspp., C. leptoporus, Coccolithus pelagicus, and rare large forms (5.5 µm) ofGephyrocapsa caribbeanica. A similar assemblage of rare nannofossils,without the large Gephyrocapsa, was also noted in Sample 188-1167A-27X-CC. The presence of G. caribbeanica and P. lacunosa indicates anearly to mid-Pleistocene age (Zone CN13b) for this interval.
Discussion
Modern calcareous nannoplankton do not thrive in surface waterssouth of the Antarctic Divergence (>62°S) (Findlay, 1998), and few oc-currences of nannofossils have been reported from Quaternary sedi-ments of the Antarctic region. Previous drilling on the KerguelenPlateau has revealed depauperate Pleistocene assemblages of similarcomposition to those noted here (Wei and Thierstein, 1991; Wei andWise, 1992). Comparable Quaternary nannofossil assemblages were alsonoted in sediments of the Antarctic Peninsula Pacific margin (Barker,Camerlenghi, Acton, et al., 1999).
Particularly interesting at Site 1167 is the presence of the calcareousdinoflagellate Thoracosphaera, which was not previously noted in Qua-ternary Antarctic sediments until Villa and Wise (1998) reported rarespecimens in shelf sediments of this age from the Ross Sea region (CapeRoberts Project). Because no other nannofossils were noted in their as-semblages and age control is limited at both localities, it is difficult todetermine whether the Thoracosphaera-bearing sediments of Site 1167are correlative. Regardless, Villa and Wise (1998) point out that thepresence of Thoracosphaera may indicate warmer conditions and/or re-sult from its ability to develop cysts in response to rapidly changingconditions, as is noted for the Quaternary. The presence of calcareousnannofossils along with Thoracosphaera at Site 1167 likely suggestswarmer sea-surface temperatures at this locality at various timesthroughout the Quaternary.
Diatoms
Diatoms are absent from the entire section of Hole 1167A, except forlimited intervals within Core 188-1167A-1H and Sample 188-1167A-36X-CC (313.30 mbsf). Between the top of Core 188-1167A-1H (Sample188-1167A-1H-1, 1–2 cm; 0.01 mbsf) and its base (Sample 188-1167A-1H-CC; 5.02 mbsf), only extant diatoms are present. This interval isplaced within the T. lentiginosa Zone based on the absence of Actinocy-clus ingens (last occurrence [LO] = 0.66 Ma). Diatom abundance andpreservation decrease down through Core 188-1167A-1H, and they areentirely absent in Sample 188-1167A-2H-CC. A broken specimen of A.ingens was observed in Sample 188-1167A-1H-CC and is interpreted asreworked.
At depths below 5.02 mbsf, only one diatom specimen was observed.A slightly recrystallized specimen of Denticulopsis dimorpha (FO = 12.2

SHIPBOARD SCIENTIFIC PARTYCHAPTER 5, SITE 1167 18
Ma; last common occurrence = 10.7 Ma) was noted in Sample 188-1167A-36X-CC (313.30 mbsf) and is interpreted to be reworked. Calcar-eous nannofossil and foraminifer biostratigraphy indicate a Pliocene–Pleistocene age for this interval.
The absence of diatoms through almost all of Hole 1167A is notewor-thy, given that there are well-preserved and abundant in situ planktonicforaminiferal assemblages in several intervals. Fine-grained intervals inCore 188-1167A-25X, for example, were sampled thoroughly, and nosiliceous microfossils were observed (whole frustules, fragments, or oth-erwise). The presence of common planktonic foraminifers and rare nan-nofossils in these intervals would suggest, however, that phytoplanktonprimary production occurred. The lack of diatoms from the foraminifer-rich sediment samples could result from numerous processes, such as(1) lightly silicified biocoenosis that was not preserved in the sedimentsbecause of dissolution in the water column and/or at the sediment/water interface or (2) the dominance of nonsiliceous phytoplanktoncommunities that may have outcompeted, or filled a niche unfavorableto, the diatoms. Water-current winnowing is not considered a factor be-cause of the presence of clay-dominated sediments and rare calcareousnannofossils, which are smaller than most diatoms and more suscepti-ble to winnowing.
Hole 1167A is dominated by coarse-sediment lithofacies. Massivelybedded sands and sandy diamicts present through lithostratigraphicUnit II are interpreted as representing sediment-gravity flows (see“Lithostratigraphy,” p. 7). The absence of diatoms in these intervals isinterpreted (at least partially) to result from the dilution of biosiliceousparticles by rapid accumulation of terrigenous material.
Radiolarians
A radiolarian fauna was found only in Sample 188-1167A-1H-CC.This sample contains rare, well-preserved radiolarians, but it is not clearwhether it should be assigned to the Chi Zone (1.9–0.83 Ma) or the PsiZone (0.83–0.46 Ma) of Lazarus (1992). Triceraspyris antarctica (Haecker)and Lithelius nautilodes Popofsky are both present in this sample; thesetaxa are reported to have a FO at the base of the Chi Zone (Lazarus,1992). Missing from the sample, however, are Cycladophora pliocenica(Hays) Lombari and Lazarus, which has a LO in the middle of the ChiZone, and Pterocanium c. trilobum (Haeckel), which has a LO at the topof the Chi Zone (or bottom of Psi Zone). This suggests that this samplecould be assigned to the Psi Zone. Also present in this sample are Spon-gotrochus? glacialis, Antarctissa denticulata, Antarctissa cyclindrica, andPhorticum clevei, all high-latitude species consistent with assignment tothe Chi or Psi Zones.
The radiolarian fauna in Sample 188-1167A-1H-CC on the continen-tal slope are very similar to those noted in Sample 188-1166A-1R-2, 70–72 cm, from the continental shelf site. At both sites, all core-catchersamples were processed and examined for radiolarians, but both siteswere nearly barren below these uppermost samples. At Site 1167, it ap-pears that the radiolarians were never deposited, as no traces werefound in any samples below the top level; at Site 1166, however, someevidence was seen of rare, poorly preserved radiolarians in Core 188-1166A-13R.

SHIPBOARD SCIENTIFIC PARTYCHAPTER 5, SITE 1167 19
Paleontological Summary of Site 1167
At Hole 1167A, it was expected that siliceous microfossils would pro-vide chronostratigraphic control, but except for Core 188-1167A-1H,where they indicate an age younger than 0.66 Ma, they were essentiallyabsent. Likewise, calcareous nannofossils provided little control otherthan for Sample 188-1167A-25X-CC, 22–23 cm, which is assigned anage of early to mid-Pleistocene.
Foraminifers are present in most samples, but the low diversity oflong-ranging planktonic taxa allows an age assessment only of lateMiocene or younger. These foraminifers do, however, provide at leasteight samples for postcruise Sr dating. Thus, assessment of ages throughthe section depends on finalizing paleomagnetic analyses and determi-nation of Sr dates. The value of foraminifers also lies in their use for re-construction of paleoenvironments. Two faunal associations—mid-bathyal (in situ) and outer continental shelf (recycled)—are recognized,and their distribution is consistent with changes in lithology.
Sedimentation Rates
Chronostratigraphic control in Hole 1167A is of insufficient resolu-tion to warrant construction of an age-depth plot and interpretation ofsedimentation rates. Assuming that the section is still Pleistocene at thebase of the hole, the sedimentation rate may be as high as ~400 m/m.y.Improved age control may emerge as Sr dating and refined of paleomag-netic data are integrated.
PALEOMAGNETISM
Methods
All the archive-half sections from Hole 1167A (APC and XCB cores)were subjected to pass-through measurements, except for Sections 188-1167A-19X-2; 37X-1, 37X-2, and 37X-3; and 39X-1 and 39X-2 becausethey were sandy. The natural remanent magnetization (NRM) and re-manent magnetization after alternating field (AF) demagnetizationwere measured routinely using the shipboard pass-through cryogenicmagnetometer at 4-cm intervals. Three AF steps at 10, 20, and 30 mTwere used for all core sections. A total of 252 discrete samples (standardoriented 8-cm3 cubes) were collected from the center of the workinghalves at a frequency of one or two per section. The lithofacies aremainly dominated by coarse-grained sediments with dispersed clastsand minor beds of coarse sands, clays, and sandy clays (see “Litho-stratigraphy,” p. 7). When possible, samples were selected from fine-grained horizons; however, there was often no alternative but to samplefrom the sandstone-dominated lithofacies.
A total of 175 samples, after measurement of NRM, were AF demag-netized at successive peak fields of 2, 7, 10, 20, 30, 40, 50, and 60 mT.Thermal demagnetization was conducted on 12 samples collectedthroughout the core at temperatures of 100°, 200°, 300°, 350°, 400°,500°, 550°, 600°, 650°, and 700°C. Magnetic susceptibility was mea-sured after each step to monitor for thermal alteration of the magneticfraction.
Rock magnetic analyses were performed on a set of representativediscrete samples after they had been subjected to AF demagnetization

SHIPBOARD SCIENTIFIC PARTYCHAPTER 5, SITE 1167 20
in order to obtain a quantitative estimate of downcore variation in thecomposition, concentration, and grain size of the magnetic minerals.These variations often provide valuable information about changes inpaleoenvironmental conditions in a sedimentary basin and its sur-rounding regions (Thompson and Olfield, 1986; Verosub and Roberts,1995). The mineral magnetic analyses followed the same approach thatwas utilized at Sites 1165 and 1166.
Low-field magnetic susceptibility (k) was routinely measured for eachdiscrete sample (252), and the resultant data were compared with thewhole-core susceptibility log (see “Physical Properties,” p. 25). The fre-quency-dependent susceptibility, fd(%), was measured on 59 selectedsamples. Anhysteretic remanent magnetization (ARM) was measuredfor 172 samples using a 100-mT AF with a superimposed 0.05-mT biasfield. On 164 samples, an isothermal remanent magnetization (IRM)was imparted in a direct-current field of 1.3 T. On 57 of these samples,the IRM was then demagnetized by inverting the sample and applying abackfield of 300 mT to determine the S-ratio (–IRM–0.3T/IRM1T) (e.g.,Verosub and Roberts, 1995). The progressive acquisition of IRM wasstudied for 12 selected samples.
Time constraints did not allow the investigation of the coercivity ofremanence (Bcr) or the analysis of thermal demagnetization of the com-posite IRM (Lowrie, 1990).
Results
Rock Magnetism
Analyses of the rock magnetic properties from Hole 1167A suggestthat the core can be divided into two main units (Units I and II) and anumber of subunits based on the abundance and grain size of the mag-netic minerals in the sedimentary sequence. The main unit boundarycoincides with a lithologic change at 217 mbsf (see “Lithostratigra-phy,” p. 7), whereas the subunit boundaries cannot be directly relatedto visual lithologic variations in the core.
Magnetic Unit I (0–198.6 mbsf) can be divided into five subunits onthe basis of changes in the concentration-dependent parameters (k,IRM intensity, and ARM intensity), which have similar patterns of vari-ation (Fig. F21). Subunit IA (0–4 mbsf) is characterized by relatively lowk, ARM, and IRM. At the boundary between Subunits IA and IB (4mbsf), the magnetic susceptibility jumps from ~23 × 10–5 to 126 × 10–5
SI then rises in a quasi-linear fashion to ~300 × 10–5 SI at 55 mbsf. Be-tween 55.0 and 78.5 mbsf (Subunit IC), the magnetic susceptibility(along with the other magnetic concentration parameters) drops to 128× 10–5 SI, after which it remains approximately constant with a meanvalue of 160 × 10–5 SI. In Subunit ID (78.5–112.2 mbsf), susceptibilityrises quasi-linearly to 224 × 10–5 SI. Lack of recovery from ~113 to 151.2mbsf renders susceptibility levels at the base of this unit uncertain. Sub-unit IE (112.2/151.2–198.6 mbsf) is characterized by a quasi-linear risein k from 178 × 10–5 to 214 × 10–5 SI.
Unit II (208.3–447.7 mbsf) can also be divided into subunits on thebasis of downcore variations in k, IRM intensity, and ARM intensity.Subunit IIA (208.3–217.5 mbsf), corresponding to decimeter-scale bedsof dark gray clay (lithostratigraphic Unit II-3; see “Lithostratigraphy,”p. 7), is characterized by relatively constant values of k. The sharp risein k at the base of this unit is probably related to the presence of igne-ous clasts in the samples. The susceptibility steadily increases downcore
IA
IB
IC
ID
IE
IIA
Susceptibility (10-5 SI)
Dep
th (
mbs
f)
IIB
0 100 200 300
0
100
200
300
400
ARM (A/m)0 0.2 0.4 0.6
IA
IB
IC
ID
IE
IIA
IIB
IRM 1.3T (A/m)0 5 10 15 20
IA
IB
IC
ID
IE
IIA
IIB
F21. Downcore variation of con-centration-dependent parameters, p. 59.
SHIPBOARD SCIENTIFIC PARTYCHAPTER 5, SITE 1167 21
between 217.5 and 447.7 mbsf (Subunit IIB). The sandy horizon at ~325mbsf is reflected in low susceptibility at this depth.
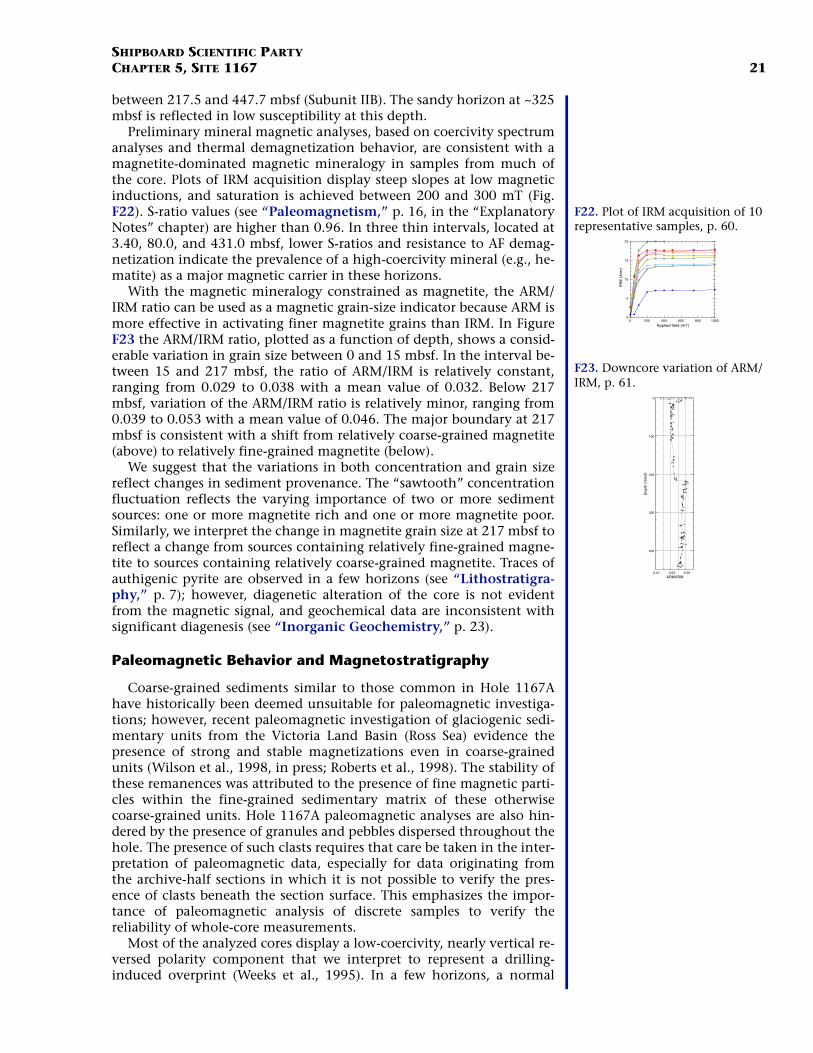
Preliminary mineral magnetic analyses, based on coercivity spectrumanalyses and thermal demagnetization behavior, are consistent with amagnetite-dominated magnetic mineralogy in samples from much ofthe core. Plots of IRM acquisition display steep slopes at low magneticinductions, and saturation is achieved between 200 and 300 mT (Fig.F22). S-ratio values (see “Paleomagnetism,” p. 16, in the “ExplanatoryNotes” chapter) are higher than 0.96. In three thin intervals, located at3.40, 80.0, and 431.0 mbsf, lower S-ratios and resistance to AF demag-netization indicate the prevalence of a high-coercivity mineral (e.g., he-matite) as a major magnetic carrier in these horizons.
With the magnetic mineralogy constrained as magnetite, the ARM/IRM ratio can be used as a magnetic grain-size indicator because ARM ismore effective in activating finer magnetite grains than IRM. In FigureF23 the ARM/IRM ratio, plotted as a function of depth, shows a consid-erable variation in grain size between 0 and 15 mbsf. In the interval be-tween 15 and 217 mbsf, the ratio of ARM/IRM is relatively constant,ranging from 0.029 to 0.038 with a mean value of 0.032. Below 217mbsf, variation of the ARM/IRM ratio is relatively minor, ranging from0.039 to 0.053 with a mean value of 0.046. The major boundary at 217mbsf is consistent with a shift from relatively coarse-grained magnetite(above) to relatively fine-grained magnetite (below).
We suggest that the variations in both concentration and grain sizereflect changes in sediment provenance. The “sawtooth” concentrationfluctuation reflects the varying importance of two or more sedimentsources: one or more magnetite rich and one or more magnetite poor.Similarly, we interpret the change in magnetite grain size at 217 mbsf toreflect a change from sources containing relatively fine-grained magne-tite to sources containing relatively coarse-grained magnetite. Traces ofauthigenic pyrite are observed in a few horizons (see “Lithostratigra-phy,” p. 7); however, diagenetic alteration of the core is not evidentfrom the magnetic signal, and geochemical data are inconsistent withsignificant diagenesis (see “Inorganic Geochemistry,” p. 23).
Paleomagnetic Behavior and Magnetostratigraphy
Coarse-grained sediments similar to those common in Hole 1167Ahave historically been deemed unsuitable for paleomagnetic investiga-tions; however, recent paleomagnetic investigation of glaciogenic sedi-mentary units from the Victoria Land Basin (Ross Sea) evidence thepresence of strong and stable magnetizations even in coarse-grainedunits (Wilson et al., 1998, in press; Roberts et al., 1998). The stability ofthese remanences was attributed to the presence of fine magnetic parti-cles within the fine-grained sedimentary matrix of these otherwisecoarse-grained units. Hole 1167A paleomagnetic analyses are also hin-dered by the presence of granules and pebbles dispersed throughout thehole. The presence of such clasts requires that care be taken in the inter-pretation of paleomagnetic data, especially for data originating fromthe archive-half sections in which it is not possible to verify the pres-ence of clasts beneath the section surface. This emphasizes the impor-tance of paleomagnetic analysis of discrete samples to verify thereliability of whole-core measurements.
Most of the analyzed cores display a low-coercivity, nearly vertical re-versed polarity component that we interpret to represent a drilling-induced overprint (Weeks et al., 1995). In a few horizons, a normal
0
5
10
15
20
0 200 400 600 800 1000
IRM
(A
/m)
Applied field (mT)
F22. Plot of IRM acquisition of 10 representative samples, p. 60.
0.01 0.03 0.05
0
100
200
300
400
ARM/IRM
Dep
th (
mbs
f)
F23. Downcore variation of ARM/IRM, p. 61.

SHIPBOARD SCIENTIFIC PARTYCHAPTER 5, SITE 1167 22
polarity drilling-induced overprint was also observed. In most cases thiscomponent was removed with peak AFs of <10 mT. After the removal ofthis overprint, a stable characteristic remanence component (ChRM) isevident for a large portion of the analyzed archive halves and discretesamples (Fig. F24). In some cases, this component and the characteristiccomponent of magnetization have completely overlapping coercivityspectra, rendering no demagnetization interval over which only onecomponent is removed (Dunlop, 1979). In these situations it is not pos-sible to isolate the two components.
For 76% of the discrete samples, stable paleomagnetic behavior wasevident from the vector component diagram. In most cases the ChRMdirection was determined using a best-fit line that was constrained,based on principal component analysis, through the origin of the vec-tor component diagram. In some cases the best-fit line was not con-strained through the origin of the plot. The ChRM directions are inexcellent agreement with the directions obtained from long-core mea-surements, with the exception of the reversed polarity direction indi-cated by a discrete sample at 16.92 mbsf where, conversely, the long-core measurement indicated a normal polarity.
Preliminary magnetostratigraphic interpretation for Hole 1167A isshown in Figure F25. The uppermost 30-m interval of the polarityrecord is entirely normal. Transitional directions are recorded over astratigraphic interval of ~4 m, between 30 and 34 mbsf. Consideringthat the process of polarity reversal occurs over periods of ~5–10 k.y.(Jacobs, 1994), it is possible to estimate a sedimentation rate for this in-terval (~0.4–0.8 m/k.y.). From 34 mbsf to the bottom of the hole, thepolarity is reversed with two short normal polarity intervals at ~355and at ~380 mbsf.
Biostratigraphic data are restricted to a diatom assemblage constrain-ing the top of Core 188-1167A-1H to <0.66 Ma and two nannofossil as-semblages: a Zone CN14a assemblage at 37.05 mbsf and a Zone CN13bassemblage between ~218 and 228 mbsf, with ages of 0.4–0.9 Ma and0.9–2.0 Ma, respectively (see “Biostratigraphy and SedimentationRates,” p. 14). Constrained by these nannofossil datums, the uppernormal polarity magnetozone is correlated with the Brunhes (C1n)Chron and the long reversed interval, between 34.0 mbsf and the bot-tom of the hole (447.5 mbsf), is correlated with the C1r.1r and C1r.2rChrons. We suggest that the Jaramillo Subchron (C1r.1n) is missingpossibly because of unconformities in the record (e.g., at 55 m) that aresuggested from sharp changes of the concentration-dependent parame-ters (Fig. F21).
Eight samples with adequate numbers of the planktonic species N.pachyderma have been collected for Sr dating (see “Biostratigraphy andSedimentation Rates,” p. 14). These samples, close to the interpretedBrunhes/Matuyama boundary and to the two thin normal polarity in-tervals, will further constrain this preliminary magnetostratigraphic in-terpretation.
Notably, the inclinations downcore are consistently shallower thanexpected for the site latitude (66°S). We suggest that observed shallowinclinations are due to sediment compaction immediately after deposi-tion (e.g., Anson and Kodama, 1987; Arason and Levi, 1990).
27.43 mbsf
NRM = 5.01e-2 A/m
J/J
max
Temperature (˚C)0 80
Field (mT)
27.47 mbsf
NRM = 5.17e-2 A/m
J/J
max
0 80
NRM = 2.11e-2 A/m
0 80Field (mT)
J/J
max
80.0 mbsf
0 80Field (mT)
J/J
max
211.25 mbsf
NRM = 4.53e-2 A/m
N,Up
E,N
NRM
100
300
400
N,Up
E,N
NRM
10
30
N,Up
E,N
NRM
5
20
N,Up
E,E
NRM
7
20
10
200
N
S
EW
Equalarea
N
S
EW
Equalarea
N
S
EW
Equalarea
N
S
EW
Equalarea
F24. Vector component diagrams of demagnetization (AF) behavior of four samples from Hole 1167A, p. 62.
?
?
CN14a0.4-0.9 Ma
CN13b0.9-2 Ma
Nannofossil stratigraphy Polarity Chrons
Depth (mbsf)
Age(Ma)
30-34 0.78
C1n
C1r.1r
C1r.2r
0 0.04 0.08
0
5 0
100
150
200
250
300
350
400
450
Intensity (A/m)
Dep
th (
mbs
f)
-90 -45 0 4 5 9 0Inclination (°)
~218-228
F25. Magnetostratigraphic record from Hole 1167A, p. 64.

SHIPBOARD SCIENTIFIC PARTYCHAPTER 5, SITE 1167 23
INORGANIC GEOCHEMISTRY
Thirty-seven interstitial water samples were collected from Hole1167A and analyzed according to the procedures outlined in “Inor-ganic Geochemistry,” p. 19, in the “Explanatory Notes” chapter (TableT5). The sampling protocol required one 5- to 15-cm-long whole-roundinterval from each section of core to 60 mbsf, one whole-round intervalper core to 100 mbsf, and one whole-round interval every two to threecores to the bottom of the hole. The shallowest sample was taken from1.45 mbsf and the deepest from 432.65 mbsf, ensuring coverage of di-agenetic processes throughout the complete cored section.
Salinity and Chlorinity
An ~2% increase occurs in both salinity and chlorinity near the sea-floor between 10 and 50 mbsf (Fig. F26). Salinity increases downholefrom 35.0 at the seafloor to 35.5 at ~22 mbsf and remains at 35.5 to 50mbsf. Chlorinity increases from 560 to 572 mM over the same interval.It is likely that the interstitial waters above ~50 mbsf represent high-salinity last-glacial seawater, although in situ hydration of clay mineralscannot be discounted with the current data. Both salinity and chlorin-ity decrease in parallel from 100 to 325 mbsf (34.5–34.0 and 560–540mM, respectively). Chlorinity then increases to 433 mbsf (541–552mM), whereas salinity remains constant.
Sulfate, Ammonium, Alkalinity,Phosphate, and Manganese
Sulfate parallels salinity and chlorinity profiles between 10 and 50mbsf, increasing from 28.8 mM near the seafloor to 29.8 mM at ~19mbsf. From 20 to 433 mbsf, sulfate decreases in a stepped profile to 24mM at 433 mbsf. As sulfate is not exhausted as an organic matter oxi-dant, CO2 reduction does not occur at Site 1167 (cf. Site 1165).
Ammonium increases linearly from near-surface values of 0 µM to amaximum of ~80–90 µM between 60 and 100 mbsf. Below 100 mbsf,ammonium decreases steadily to ~60 µM at 433 mbsf. These low am-monium concentrations (an order of magnitude less than ammoniumat Site 1165) reflect limited sulfate reduction. Two additional productsof sulfate reduction, alkalinity and phosphate, behave nonconserva-tively. Alkalinity decreases linearly from seafloor values of ~3 mM to 1.3mM at ~40 mbsf and remains relatively constant from 100 mbsf to thebase of the hole. Similarities in the downhole profiles of alkalinity, po-tassium, lithium, and magnesium and the inverse trend shown by cal-cium (see “Magnesium, Calcium, Strontium, and Sodium,” p. 24)suggest that alkalinity is responding to an unidentified diagenetic sili-cate mineral reaction. Seafloor concentrations of phosphate (6.0 µM)rapidly decrease to zero at 10 mbsf. Aside from a small excursion to 2.1µM between 46 and 49 mbsf, phosphate concentrations remain belowthe detection limit to the base of the core.
Dissolved manganese decreases rapidly from 25 to 15 µM in the first10 m of the core. Below 10 mbsf, manganese concentrations increase to20 µM at 22 mbsf and then decrease to ~17 µM at ~30 mbsf, where theyremain more or less constant to the base of the core. High manganeseconcentrations between 20 and 30 mbsf are the product of the reduc-tion of manganese oxides during the oxidation of OC. Comparison of
T5. Interstitial water chemistry from shipboard measurements, p. 89.
1 2 3 40
100
200
300
400
Alkalinity (mM)
Dep
th (
mbs
f)
20 24 28
SO4 (mM)
0 40 80
NH4 (µM)
33.5 34.5 35.50
100
200
300
400
Salinity
Dep
th (
mbs
f)
530 550 570
Cl (mM)7.6 7.8 8 8.2 8.4
pH
0 2 4 60
100
200
300
400
PO4 (µM)
Dep
th (
mbs
f)
0 10 20 30
Mn (µM)0 20 40 60
Ca and Mg (mM)
F26. Interstitial water chemistry profiles vs. depth, p. 65.
SHIPBOARD SCIENTIFIC PARTYCHAPTER 5, SITE 1167 24
the phosphate and manganese profiles (Fig. F26) suggests that phos-phate may be adsorbed onto the surface of manganese (or iron) hydrox-ides.
Magnesium, Calcium, Strontium, and Sodium
Dissolved magnesium concentrations decrease rapidly from 54.5 mMat the seafloor to ~40 mM at 50 mbsf. Between 50 and 433 mbsf, mag-nesium decreases from 40 to 30 mM, with a small change in gradient at~100 mbsf. Dissolved calcium concentrations show an inverse trend,increasing rapidly from 11 mM at the seafloor to 24 mM at 50 mbsf. Be-tween 50 and 433 mbsf, calcium concentrations increase from 24 to 28mM. A small change in gradient is again apparent at ~100 mbsf. Thestrong negative linear correlation (∆Ca2+/∆Mg2+ = –1) observed through-out the core is likely due to silicate reconstitution reactions. The generaldownhole decrease in sodium concentration may reflect the albitiza-tion of plagioclase, with the associated release of calcium to the intersti-tial waters. Clay mineral reactions (e.g., smectite formation) maypartially account for the magnesium decrease. Dissolved strontium con-centrations increase downhole from ~100 µM at the seafloor to ~200µM at 335 mbsf (Fig. F26). The strontium profile is consistent with aminor downhole increase in calcium carbonate reconstitution reac-tions.
Potassium, Lithium, and Silica
Dissolved potassium decreases from ~12 to ~2 mM between the sea-floor and 100 mbsf (Fig. F26), with a marked change in slope at ~50mbsf. Below 100 mbsf, potassium concentrations remain at ~2 mM to433 mbsf. Lithium decreases from ~30 µM at the seafloor to ~5 µM at~40 mbsf. Below ~40 mbsf, lithium concentrations increase nonlinearlyto ~10 µM at 335 mbsf. The profiles suggest that both potassium andlithium are participating in the same diagenetic reactions as calciumand magnesium. The overall low lithium concentrations argue againstthe alteration of volcanic material as a major contributing factor.
Dissolved silica concentrations are high from the seafloor to 5 mbsf(568–673 µM) because of the dissolution of siliceous microplankton inthe near-surface sediments (see “Biostratigraphy and SedimentationRates,” p. 14). Immediately below this zone, silica values return to ~200µM, approximating the concentrations found in modern undersatu-rated bottom seawater. Silica concentrations increase gradually down-hole to ~300 µM at 433 mbsf.
ORGANIC GEOCHEMISTRY
Shipboard organic geochemical studies of cores from Site 1167 in-cluded monitoring of hydrocarbon gases, carbonate and OC, total sul-fur (TS) and total nitrogen (TN) content, and Rock-Eval pyrolysischaracterization of organic matter. Procedures are summarized in “Or-ganic Geochemistry,” p. 20 in the “Explanatory Notes” chapter.
Hydrocarbon Gases
Cores recovered from Site 1167 were monitored for hydrocarbongases measured by the headspace method. All reliable analyses were at

SHIPBOARD SCIENTIFIC PARTYCHAPTER 5, SITE 1167 25
background levels (4–10 parts per million by volume [ppmv]) for meth-ane, and ethane was present in detectable amounts only in a few coresdeeper than 350 mbsf.
Carbon and Elemental Analyses
Sixty-five sediment samples were analyzed for inorganic carbon (IC;calcium carbonate), and 27 selected (darker colored) samples from Site1167 were analyzed for total carbon, OC (by difference), TN, and TS.The results are reported in Table T6. IC and OC contents are plottedagainst depth in Figure F27. Carbonate content is generally low (~0.1wt% IC) with two samples having 0.4 wt% IC.
OC content averages ~0.4 wt% and shows no apparent trend withdepth. Only two samples (at 279.03 and 409.04 mbsf) approach 1 wt%OC.
TN contents are generally <0.04 wt%, except for the two deepestsamples analyzed (433.59 and 441.91 mbsf). These samples have car-bon/nitrogen values (1.0 and 0.7) that are so low, it suggests that theslightly elevated TN contents are spurious measurements.
TS contents are uniformly low, with many samples having no detect-able sulfur.
Organic Matter Characterization
Nine samples from Site 1167 were characterized by Rock-Eval pyroly-sis (Table T7). Samples with >0.5 wt% OC were selected for analysis. Py-rolyzable hydrocarbons (S2 yields) range from 0.09 to 0.21 mg ofhydrocarbon/g of sediment. The pyrolyzable fraction of the OC is uni-formly low (hydrogen index values of 17–38 mg of hydrocarbon/g ofcarbon). The elevated Tmax values (451°–534°C) and the broad S2 peakshapes in the pyrograms (not shown) indicate that all samples containpredominantly recycled and degraded thermally mature organic matter.
PHYSICAL PROPERTIES
Multisensor Track
Measurements with the multisensor track (MST) were obtained at 4-cm intervals for gamma-ray attenuation (GRA) bulk density, P-wave ve-locity, and magnetic susceptibility. Natural gamma radiation (NGR) wasmeasured at 12-cm intervals. No P-wave velocity data were recorded onXCB cores (i.e., below 39.7 mbsf). MST results in XCB cores were de-graded in quality because of drilling disturbance associated with coringand incompletely filled core liners. This disturbance is illustrated by acomparison of GRA bulk densities with discrete density determinations(see “Moisture and Density Measurements,” p. 26). In Figure F28, wepresent edited MST data from Hole 1167A measured on APC cores (0–40mbsf). Measurements from deeper intervals may also be useful in dis-cerning lithologic changes but need extensive postcruise editing. This isexemplified by apparent 20-cm-scale cyclic changes in GRA bulk densi-ties, which are pervasive in the XCB-cored part of the hole, and whichare the result of spiraling gouges produced by the core catcher on theouter surface of the sample. The MST measurements are available (seethe “Related Leg Data” contents list).
T6. Carbon, nitrogen, and sulfur analyses of sediments, p. 90.
0
100
200
300
400
0 0.1 0.2 0.3 0.4 0.5
Inorganic carbon (wt%)
Dep
th (
mbs
f)
A0 0.2 0.4 0.6 0.8 1.0
Organic carbon (wt%)B
F27. Weight percent inorganic car-bon and organic carbon in sedi-ments, p. 67.
T7. Organic carbon and Rock-Eval pyrolysis on selected samples, p. 91.
Lithostratigraphicunit
II
I
0 200 400 6000
5
10
15
20
25
30
35
40
Magnetic susceptibility
(10–5 SI)
Dep
th (
mbs
f)
1.4 1.6 1.8 2.0 2.2 2.4
GRA bulk density
(g/cm3 )1500 1650 1800 1950
P-wave velocity(m/s)
0 1 2 3 4 5
Natural gamma radiation (cps)
F28. GRA bulk-density, PWL, MS, and NGR measurements from Hole 1167A, p. 68.

SHIPBOARD SCIENTIFIC PARTYCHAPTER 5, SITE 1167 26
GRA bulk density, P-wave velocity, and magnetic susceptibility ex-hibit similar downhole patterns for the upper 40 mbsf at Site 1167.Throughout lithostratigraphic Unit I (0–5.72 mbsf), these parametersshow a large variability (magnetic susceptibility: 90 × 10–5 to 310 × 10–5
SI, GRA bulk density: 1.55–2 g/cm3, P-wave velocity: 1500–1650 m/s),possibly reflecting latest Pleistocene and Holocene glacial–interglacialchanges in hemipelagic sedimentation. The transition from Unit I toUnit II is characterized by an abrupt step to higher density (~2.2 g/cm3)and magnetic susceptibility (~300 × 10–5 SI) values. No P-wave data wererecorded for this transition. Sediment at the top of lithostratigraphicUnit II (5.72–40 mbsf) displays relatively uniform physical propertieswith a slight trend to increasing values downhole, a response to gravita-tional sediment compaction. Offsets from a trend to higher magneticsusceptibilities (~400 × 10–5 SI) occur at 15–16 mbsf and below 35 mbsf.Farther downhole, the magnetic susceptibilities show a sawtooth-liketrend that is also apparent in the discrete magnetic measurements (see“Paleomagnetism,” p. 19, for more details).
NGR measurements from Site 1167 vary between 1 and 3 cps (Fig.F29) throughout the hole. The 20-m moving average, however, showssome subtle changes. It is fairly constant for the upper 320 m, exceptfor a slight increase at ~210 mbsf that may be a response to the claybeds found at this level (see “Lithostratigraphy,” p. 7). Clays normallycontain more radioactive elements than sands. The LWD tool (see“Downhole Measurements,” p. 31), however, indicates a decrease inNGR at ~210 mbsf, a difference that may reflect either the inaccuraciesin MST measurements over rather short intervals compared to the LWDtool or different instrumental sensitivities to the various parts of thegamma-ray spectrum. The changes observed at ~210 mbsf in many pa-rameters prompted binning of the NGR spectra above and below 200mbsf. No significant difference can be seen between these two spectra(Fig. F29). At ~320 mbsf, there is a slight decrease in the NGR values.There are no changes in other physical properties at this level, exceptfor the offset in the ARM and IRM (see “Paleomagnetism,” p. 19).
Moisture and Density Measurements
Gravimetric and volumetric determinations of moisture and density(MAD) were made for 138 samples from Hole 1167A (Cores 188-1167A-1H through 49X). One sample was taken, where possible, from eachsection of each core. Wet mass, dry mass, and dry volume were mea-sured and used to calculate percentage water weight, porosity, dry den-sity, bulk density, and grain density (see “Physical Properties,” p. 21,in the “Explanatory Notes” chapter; also see the “Related Leg Data”contents list for available raw data).
The grain densities measured at Site 1167 are shown in Figure F30.Eight determinations of grain density were made in lithostratigraphicUnit I (0–5.72 mbsf), giving an average value of 2.70 g/cm3 with a rangeof 2.65–2.74 g/cm3. Within Unit I, the measured values show no trendwith depth.
A total of 130 determinations of grain density were made in litho-stratigraphic Unit II (5.72–443.70 mbsf). From 5.72 to 210 mbsf, themean value is 2.70 g/cm3, with a range of 2.67–2.74 g/cm3 (67 measure-ments). Over this interval, there is no trend in the values with depth. At~210 mbsf, the grain density abruptly decreases, and from 210 to
Lith
o.un
it11
67A
Rec
over
y
0
Dep
th (
mbs
f)
0 25 50 75
XRD counts (%)0 5 10 15
NGR (cps)
100 150 200 250
100 150 200 250
I
II
K
ThU
Channel
Channel
Cou
nts
Cou
nts
Bulk mineralogy
Natural gammaradiation (NGR)
Binned natural gamma spectra
50
100
150
200
250
300
350
400
450
0
100
200
0
100
200
0 - 200 mbsf
200 - 439 mbsf
Hornblende
Total clay minerals
Quartz
K-feldspar
Plagioclase
Calcite
Pyrite
F29. Bulk mineralogy from XRD, NGR, and binned natural gamma spectra vs. depth, p. 69.
20 30 40 50 60 70
Porosity (%)B
28 29 30 31 32
180
190
200
210
220
230
I
II
Lith
ostr
atig
raph
icun
it
Cor
ere
cove
ry
0
100
200
300
400
2.5 2.55 2.6 2.65 2.7 2.75 2.8
Dep
th (
mbs
f)
Grain density (g/cm3)A
F30. Grain density and porosity from discrete measurements, p. 71.

SHIPBOARD SCIENTIFIC PARTYCHAPTER 5, SITE 1167 27
443.70 mbsf, the mean value is 2.69 g/cm3, with a range of 2.66–2.73 g/cm3 (63 measurements).
The porosities measured at Site 1167 are shown in Figure F30. Eightdeterminations of porosity were made in lithostratigraphic Unit I.Within the unit (0–5.72 mbsf), the porosity decreases sharply withdepth, dropping from a value of 68.1% at 0.30 mbsf to 42.3% at 5.54mbsf. The average value of porosity in Unit I is 59.7%. The decrease inporosity from the top to the bottom of Unit I is attributed to compac-tion under increasing effective overburden stresses.
A total of 67 determinations of porosity were made from the top oflithostratigraphic Unit II (5.72 mbsf) to 210 mbsf. Within this interval,the porosity decreases with depth, from 41.0% at 6.43 mbsf to ~31% at210 mbsf. About half of this decrease occurs in the upper 10 m of theunit. At 210 mbsf, the porosity abruptly decreases; from 210 to 443.70mbsf, the mean value is 27.6%, with a range of 22.7%–31.7% (57 mea-surements).
Other parameters that are derived from the measured data includebulk density, dry density, water content, and void ratio. Bulk-densityand dry density values are presented in Figure F31. Eight determina-tions of bulk density were made in lithostratigraphic Unit I. Within theunit (0–5.72 mbsf), the bulk density increases sharply with depth, risingfrom a value of 1.55 g/cm3 at 0.30 mbsf to 2.01 g/cm3 at 5.54 mbsf. Theaverage value of bulk density in Unit I is 1.70 g/cm3. The increase inbulk density from the top to the bottom of Unit I is attributed to com-paction under increasing effective overburden stresses.
A total of 67 determinations of bulk density were made from the topof lithostratigraphic Unit II (5.72–210 mbsf). Within this interval, thebulk density increases with depth, from 2.00 g/cm3 at 6.43 mbsf to~2.19 g/cm3 at 210 mbsf. About half of this increase occurs in the upper10 m of the unit. At 210 mbsf, the bulk density abruptly increases to2.21 g/cm3. From 210 to 443.70 mbsf, the mean value is 2.23 g/cm3,with a range of 2.16–2.31 g/cm3 (57 measurements). The bulk densitygradually increases with depth, from ~2.21 g/cm3 at 210 mbsf to ~2.25g/cm3 at 443.7 mbsf.
Water content (as a percentage of dry mass corrected for salt content)and void ratio are presented in Figure F32. These plots show trends sim-ilar to those observed in the porosity data.
The decrease in grain density and porosity—and hence in bulk den-sity, dry density, water content, and void ratio—at 210 mbsf correlateswith a sharp drop in magnetic susceptibility seen at about the samedepth (see “Paleomagnetism,” p. 19). Analysis of the clasts found inthe diamict of Unit II shows that above 210 mbsf more granite andother igneous clasts are present, whereas below 210 mbsf more sand-stone clasts are present (see “Lithostratigraphy,” p. 7). This suggeststhat the physical property changes observed in the sediment at 210mbsf are a result of a change of provenance of the diamict, and hence,differing ice-flow configurations.
As described previously in this section (see “Multisensor Track,”p. 25), bulk-density data were obtained from the GRA bulk densiometerin addition to the discrete MAD measurements. To compare the GRAbulk-density data to the discrete MAD measurements, the GRA data setwas cleaned by removing the data points at the top of each core sectionas well as any data points <1.0 g/cm3. Figure F33A presents the cleanedGRA data, superimposed on the bulk densities computed from the dis-crete MAD measurements. The plot demonstrates that there is good
0.5 0.9 1.3 1.7 2.1 2.5
Dry density (g/cm3)B
I
II
Lith
ostr
atig
raph
icun
it
Cor
ere
cove
ry
0
100
200
300
400
1.5 1.7 1.9 2.1 2.3 2.5
Dep
th (
mbs
f)
Bulk density (g/cm3)A
F31. Bulk density and dry density from discrete measurements, p. 72.
0 0.5 1.0 1.5 2.0 2.5
Void ratioB
0.38 0.43 0.48
180
190
200
210
220
230
Lith
ostr
atig
raph
icun
it
I
II
Cor
ere
cove
ry
0
100
200
300
400
0 20 40 60 80 100
Dep
th (
mbs
f)
Water content (% of dry weight)A
F32. Water content and void ratio from discrete measurements, p. 73.
0.8 1.0 1.2 1.4 1.6
B MAD density / GRA density
APC
XCB
Lith
ostr
atig
raph
icun
it
I
II
Cor
ere
cove
ry
1.0 1.5 2.0 2.5 3.00
100
200
300
400
500
GRA density MAD density
Bulk density (g/cm3)
Dep
th (
mbs
f)
A
F33. GRA bulk-density data vs. bulk density from MAD measure-ments, p. 74.

SHIPBOARD SCIENTIFIC PARTYCHAPTER 5, SITE 1167 28
agreement between the two measurement methods to ~40 mbsf andthat below this depth the discrete measurements are consistentlyhigher than the GRA measurements. The ratio of the discrete bulk-den-sity measurements to the GRA measurements for corresponding depths(Fig. F33B) is relatively constant and is equal to 0.975 for APC cores (0–39.7 mbsf) and 1.076 for XCB cores (39.7–443.7 mbsf). These ratiosagree well with those determined at Site 1165 (see “Moisture and Den-sity Measurements,” p. 56, in the “Site 1165” chapter). This indicatesthat different calibration constants should be used for the GRA bulkdensiometer depending on the coring method being employed or thatGRA measurements on different core types using the same GRA bulkdensiometer calibration should be scaled to correct the measurements.
Velocimetry
P-wave velocities on split cores were measured at a frequency of onemeasurement per recovered section. The velocity probes P-wave sensor(PWS1 and PWS2), which allow measurements in z- and y-directions insoft sediments, were used on Cores 188-1167A-1R through 3R. Below 24mbsf, the sediments became too stiff to insert the probes and P-wavevelocities were measured in the x-direction (through the core liner) byusing probe PWS3. In some intervals blocks of consolidated sedimentwere cut out, and the P-wave velocity was measured in x-, y-, and z-directions by using PWS3. The laboratory velocity measurements pre-sented here (Fig. F34) were not corrected to in situ temperature andpressure conditions. Velocity data are compiled in Table T8 (also see the“Related Leg Data” contents list).
From 2 to 60 mbsf (lithostratigraphic Unit 1 and the top of Unit 2),P-wave velocities at Site 1167 increase from 1503 to 1986 m/s, which re-sults in a velocity gradient of 9.7 s–1 and is most likely related to sedi-ment compaction. Below 60 mbsf, the homogeneous sedimentcomposition in lithostratigraphic Unit II is reflected by a relatively uni-form P-wave velocity, which increases slightly to values of ~2200 m/sclose to the bottom of the hole (445 mbsf). The change in the velocitygradient at 60 mbsf correlates with a significant drop in magnetic sus-ceptibility (see “Paleomagnetism,” p. 19), which could indicate a gen-eral change in sediment composition. No corresponding change,however, is seen in the MAD parameters. The most prominent velocityfeature in Unit II is a steplike increase in average velocity from 1986 to2115 m/s below 181 mbsf, which correlates with a drop in porosity anda change to lower grain density. This feature is possibly caused by ahigher quartz content below 181 mbsf, as indicated by XRD results.
Undrained Shear Strengths
A total of 27 automatic vane shear (AVS), 71 fall cone (FC), and 103pocket penetrometer (PP) measurements were obtained, with resultsspanning the entire recovered interval (Table T9). Down to 50 mbsf, FCand AVS measurements were taken, whereas FC and PP measurementswere made between 60 and 300 mbsf. Below 300 mbsf, the sedimentstrength was only within the range of PP measurements. The FC mea-surements gave higher shear strengths than either the AVS and the PP.AVS measurements may be too low because of the lack of confinementof the samples, allowing horizontal deformation and/or cracking of thesediment during vane rotation. The FC and PP gave similar shearstrengths at Sites 1165 and 1166. The difference observed in Hole
1500 1750 2000 2250 25000
100
200
300
400
z - directiony - directionz - direction
P-wave velocity (m/s)
Dep
th (
mbs
f)
Lith
ostr
atig
raph
icun
it
I
II
F34. Discrete velocity measure-ments obtained with the PWS, p. 75.
T8. Discrete P-wave measure-ments, p. 92.
T9. Measurements of undrained shear strength, p. 93.
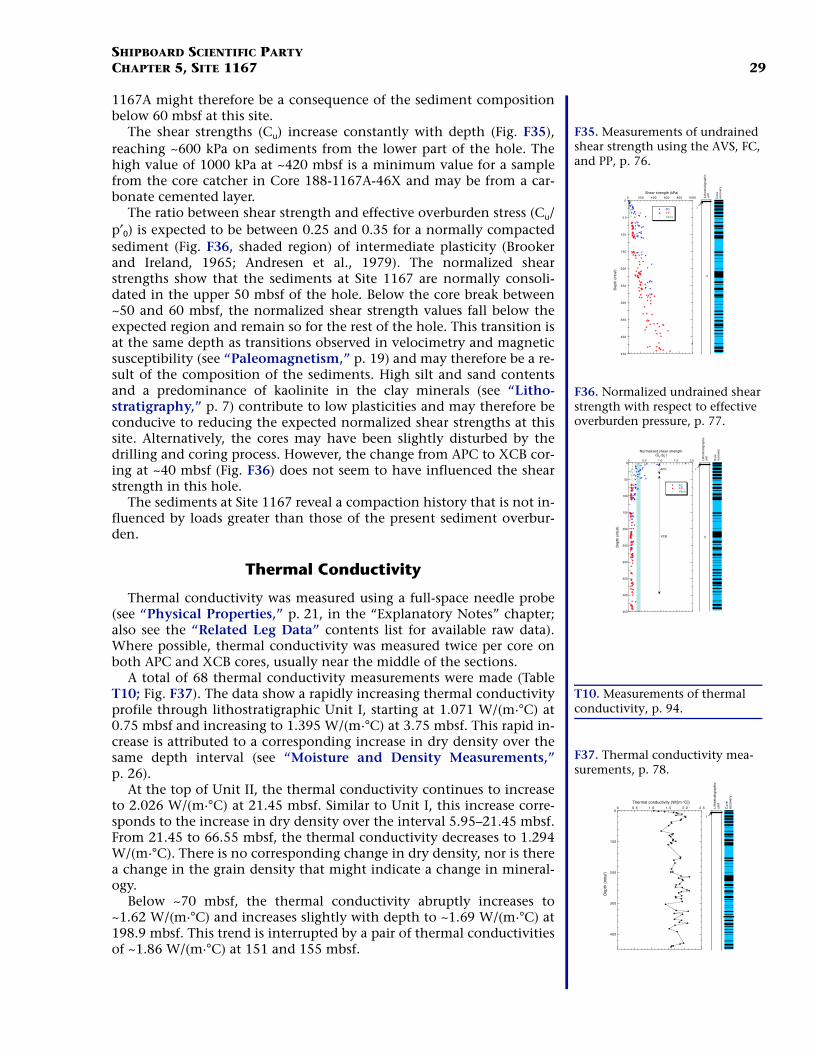
SHIPBOARD SCIENTIFIC PARTYCHAPTER 5, SITE 1167 29
1167A might therefore be a consequence of the sediment compositionbelow 60 mbsf at this site.
The shear strengths (Cu) increase constantly with depth (Fig. F35),reaching ~600 kPa on sediments from the lower part of the hole. Thehigh value of 1000 kPa at ~420 mbsf is a minimum value for a samplefrom the core catcher in Core 188-1167A-46X and may be from a car-bonate cemented layer.
The ratio between shear strength and effective overburden stress (Cu/p′0) is expected to be between 0.25 and 0.35 for a normally compactedsediment (Fig. F36, shaded region) of intermediate plasticity (Brookerand Ireland, 1965; Andresen et al., 1979). The normalized shearstrengths show that the sediments at Site 1167 are normally consoli-dated in the upper 50 mbsf of the hole. Below the core break between~50 and 60 mbsf, the normalized shear strength values fall below theexpected region and remain so for the rest of the hole. This transition isat the same depth as transitions observed in velocimetry and magneticsusceptibility (see “Paleomagnetism,” p. 19) and may therefore be a re-sult of the composition of the sediments. High silt and sand contentsand a predominance of kaolinite in the clay minerals (see “Litho-stratigraphy,” p. 7) contribute to low plasticities and may therefore beconducive to reducing the expected normalized shear strengths at thissite. Alternatively, the cores may have been slightly disturbed by thedrilling and coring process. However, the change from APC to XCB cor-ing at ~40 mbsf (Fig. F36) does not seem to have influenced the shearstrength in this hole.
The sediments at Site 1167 reveal a compaction history that is not in-fluenced by loads greater than those of the present sediment overbur-den.
Thermal Conductivity
Thermal conductivity was measured using a full-space needle probe(see “Physical Properties,” p. 21, in the “Explanatory Notes” chapter;also see the “Related Leg Data” contents list for available raw data).Where possible, thermal conductivity was measured twice per core onboth APC and XCB cores, usually near the middle of the sections.
A total of 68 thermal conductivity measurements were made (TableT10; Fig. F37). The data show a rapidly increasing thermal conductivityprofile through lithostratigraphic Unit I, starting at 1.071 W/(m·°C) at0.75 mbsf and increasing to 1.395 W/(m·°C) at 3.75 mbsf. This rapid in-crease is attributed to a corresponding increase in dry density over thesame depth interval (see “Moisture and Density Measurements,”p. 26).
At the top of Unit II, the thermal conductivity continues to increaseto 2.026 W/(m·°C) at 21.45 mbsf. Similar to Unit I, this increase corre-sponds to the increase in dry density over the interval 5.95–21.45 mbsf.From 21.45 to 66.55 mbsf, the thermal conductivity decreases to 1.294W/(m·°C). There is no corresponding change in dry density, nor is therea change in the grain density that might indicate a change in mineral-ogy.
Below ~70 mbsf, the thermal conductivity abruptly increases to~1.62 W/(m·°C) and increases slightly with depth to ~1.69 W/(m·°C) at198.9 mbsf. This trend is interrupted by a pair of thermal conductivitiesof ~1.86 W/(m·°C) at 151 and 155 mbsf.
0 200 400 600 800 10000
5 0
100
150
200
250
300
350
400
450
FCP PVane
Shear strength (kPa)
Dep
th (
mbs
f)
Lith
ostr
atig
raph
icu
nit
I
I I
Co
rere
cove
ry
F35. Measurements of undrained shear strength using the AVS, FC, and PP, p. 76.
0 0.5 1.0 1.5 2.00
50
100
150
200
250
300
350
400
450
Normalized shear strength(Cu /p'0 )
FCPPVane
Dep
th (
mbs
f)
APC
XCB
I
II
Lith
ostr
atig
raph
icun
it
Cor
ere
cove
ry
F36. Normalized undrained shear strength with respect to effective overburden pressure, p. 77.
T10. Measurements of thermal conductivity, p. 94.
0 0.5 1.0 1.5 2.0 2.50
100
200
300
400
Thermal conductivity (W/[m·°C])
Dep
th (
mbs
f)
Lith
ostr
atig
raph
icu
nit
I
Co
rere
cove
ry
F37. Thermal conductivity mea-surements, p. 78.

SHIPBOARD SCIENTIFIC PARTYCHAPTER 5, SITE 1167 30
At 210 mbsf, the thermal conductivity increases abruptly to 1.89 W/(m·°C). This value is maintained to a depth of 295 mbsf. The abrupt in-crease at 210 mbsf corresponds to an abrupt decrease in the grain den-sity (see “Moisture and Density Measurements,” p. 26) and istherefore attributed to a change in the sediment mineralogy. Thischange of mineralogy is also indicated by an abrupt decrease in themagnetic susceptibility at 210 mbsf, associated with a downholechange from coarser (above 120 mbsf) to finer magnetite grains at thisdepth (see “Paleomagnetism,” p. 19). Below 295 mbsf to 443.7 mbsf,the thermal conductivity decreases slightly to an average value of 1.77W/[m·°C]) over the length of the interval.
Summary
There are two major changes observed in the physical properties atSite 1167. The first is at 5.9 mbsf at the transition between lithostrati-graphic Units I and II and is associated with an abrupt increase in mag-netic susceptibility and a change to a lower gradient in density. Anincrease in the P-wave velocity also appears at this depth, but the PWLdata for the transition was not obtained on the MST. The other changeis at 210 mbsf, where a downhole decrease in grain density and porosityand an increase in bulk density are found. The change at 5.9 mbsf mostlikely is due to the combined effect of gravitational compaction and theincreasing content of sand down through Core 188-1167A-1H (see“Lithostratigraphy,” p. 7) and into the diamicts of Core 188-1167A-2H. The change of physical properties at 210 mbsf indicates a change inmineralogy as seen in the downhole shift to lower grain density. Thebulk mineralogy (Fig. F29) suggests that there is a downward increase inquartz and a reduction in the plagioclase contents at this level. Thesechanges imply that the sediment source area shifted, likely in responseto reconfiguration of the glacier drainage on the Antarctic continent.
IN SITU TEMPERATURES
At Site 1167, because of a rapid downward increase in induration ofthe sediments, only one Adara temperature tool measurement fromCore 188-1167A-5H (39.7 mbsf) was made. The seafloor temperature(TSF) and stabilized sediment temperature were determined using theTFIT software package (Table T11; Fig. F38). From these data, a geother-mal gradient of 17.1°C/km was estimated.
The heat flow and downhole temperatures were estimated accordingto the methodology described in “In Situ Temperatures,” p. 62, in the“Site 1165” chapter. Using a measured thermal conductivity of 1.59 W/(m·°C) (see “Physical Properties,” p. 25), the heat flow was determinedto be 27.2 mW/m2. The estimated temperature at total depth (441.7mbsf) was determined to be 7.1°C (Table T11; Fig. F39). The geothermalgradient and heat flow values (17.1°C/km and 27.2 mW/m2, respec-tively) (Table T11) are significantly less than those determined for Site1165 (53.4°C/km and 51.4 mW/m2, respectively) (see “In Situ Temper-atures,” p. 62, in the “Site 1165” chapter).
This difference in thermal conditions at Sites 1167 and 1165 may bedue to differing thermal conductivities and sedimentation rates. At Site1167, the thermal conductivity is 1.6 W/(m·°C) over the upper 100mbsf (see “Physical Properties,” p. 25); however, over a similar depthinterval at Site 1165, the mean measured thermal conductivity was sig-
T11. Measured and estimated tem-peratures, geothermal gradients, and heat-flow estimates, p. 95.
0
1
2
3
4
5
6
7
0 100 200 300 400 500 600 700 800
Calculated profile
Measured temperature
Mea
sure
d te
mpe
ratu
re (
°C)
Time (s)
Mudline temperature
TSF
= 0.09°C
APC fired into sediment
Heating spike due to friction
Stabilized sediment temperature (0.77°C)
F38. Measured temperature vs. time from deployment of the Adara temperature tool for Core 188-1167A-4H, p. 79.
0 1 2 3 4 5 6 7 8
0
100
200
300
400
500
Measured temperatureEstimated temperature
Temperature (°C)
Dep
th (
mbs
f)
0 .090.77
7.1
F39. Measured and estimated tem-perature vs. depth profile, p. 80.

SHIPBOARD SCIENTIFIC PARTYCHAPTER 5, SITE 1167 31
nificantly lower, at 0.90 W/(m·°C) (see “Physical Properties,” p. 54, inthe “Site 1165” chapter). In general, the thermal conductivities werehigher throughout the sediment section at Site 1167. This higher ther-mal conductivity at Site 1167 allows for a greater rate of heat loss fromthe sediments. Also, sedimentation rates are higher at Site 1167 (up to~400 m/m.y.) (see “Sedimentation Rates” p. 19, in “Biostratigraphyand Sedimentation Rates”) than at Site 1165 (15 m/m.y. in the upper-most Miocene to Pleistocene section) (see “Biostratigraphy and Sedi-mentation Rates,” p. 21, in the “Site 1165” chapter). The highsedimentation rate at Site 1167 may have significantly reduced thethermal profile of the sediments compared to that of Site 1165.
The depth to the base of the gas hydrate stability zone (GHSZ) wasdetermined using the Ocean Drilling Program Pollution Prevention andSafety Panel hydrate stability equation, which was modified for seawa-ter (Pollution Prevention and Safety Program, 1992). As only a smallvariation in the downhole thermal gradients was noted (Table T11),only the initial measured thermal gradient of 17.1°C was used to esti-mate the base of the GHSZ at 1190 mbsf.
DOWNHOLE MEASUREMENTS
Operations
Downhole measurements were made after completion of APC/XCBcoring in Hole 1167A and while drilling Hole 1167B. During coring, op-erational problems were experienced with the drill pipe sticking andthe lockable flapper valve jamming with sediment. Hole conditioninginvolving a wiper trip and circulation of 195 barrels of sepiolite mudwas therefore undertaken prior to logging. Despite this precaution,however, similar problems hampered wireline operations in Hole1167A.
The triple combo tool, which measures resistivity, density, porosity,and natural gamma, was the only tool string run in Hole 1167A (Fig.F40; Table T12). While exiting the pipe during the initial run into thehole, the triple combo got stuck with only 10 m of the tool string pro-truding out of the base of the pipe. It was likely that the lockable flap-per valve had not latched open properly when the go-devil was pumpeddownhole. The problem was resolved by rigging up the circulator andincreasing the pump pressure until the tool string eventually came free.After these initial difficulties, the triple combo tool string was loweredto 151 mbsf, where its passage downhole was halted by an obstruction.A conglomerate interval was observed in the cores at this depth, andthe drillers had noted sticking just below this depth while pulling pipefor both the wiper trip and while waiting for an iceberg to pass.
The hole was logged from 151 mbsf up to the base of pipe at 85 mbsf,covering an interval of 66 m, without extending the HLDS caliper arm.The depth to the seafloor was determined to be 1649 mbrf from the de-crease in gamma-ray values at the sediment/water interface (driller’smudline depth = 1651.3 mbrf) (Table T12).
High tension was recorded at the head of the tool when the toolstring entered the pipe, even with continued pumping. Because of timeconstraints, poor hole conditions, problems encountered with the lock-able flapper valve, and the high probability of our encountering furtherdifficulties, we decided to switch to LWD.
Trip
le c
ombo
(1
pass
)
151.0 mbsf
Pipe depth = 85.0 mbsf (logger's)87.0 mbsf (driller's)
Seafloor = 1649.0 mbrf (logger's)1652.0 mbrf (LWD)1651.3 mbrf (driller's)
Wireline logging (1167A) LWD (1167B)
261.1 mbsf
Dep
th (
mbs
f) 100
200
0
300
F40. Logging summary diagram, p. 81.
T12. Logging operations summa-ry, p. 96.

SHIPBOARD SCIENTIFIC PARTYCHAPTER 5, SITE 1167 32
Logging While Drilling/Measurement While Drilling
LWD operations were carried out in Hole 1167B, offset by 50 m fromHole 1167A. The aims of LWD/MWD at this hole were twofold: torecord spectral gamma and resistivity logs with the compensated dualresistivity (CDR) LWD tool and to record weight on bit and other drill-ing parameters for the engineering experiment on the efficacy of thepassive heave compensation system. The spudding of Hole 1167B wasdelayed for 4 hr by a storm; spudding with LWD tools required lowheave because the tools were narrower and hence weaker than the drillcollars above them. Low pump rates were used for the top 17 m of thehole, so looser sediment was not washed away to leave a wide hole thatwould have degraded resistivity and natural gamma readings. However,measurement-while-drilling (MWD) communications required a higherpump rate of 70 spm (350 gal/min), so below 17 mbsf, the pump ratewas increased and the MWD tool began communication. The datatransmission rate was 3 bits/s, and the frequency of the mud pulse was12 Hz; no problems were experienced with MWD data transmission.The hole was drilled to 261.1 mbsf at an average rate of 22 m/hr.
For the engineering experiment, data were recorded under a range ofoperating conditions from low weight on bit in softer formations to 25KlbF (1000 lb force) in harder formations in the deeper parts of thehole. The amplitude of the heave varied considerably during the courseof drilling.
Total gamma-ray emission and resistivity data from the CDR weredownloaded from the tool when it came back to the surface. The datawere then processed by the Anadrill engineer to move the data fromevenly spaced time intervals to a depth scale. Correlation with the over-lapping interval of wireline logs was mostly good (Fig. F41). Differencescan be attributed to washouts in the wireline-logged hole that causedintervals of anomalously low natural gamma, resistivity, density, andporosity logs. LWD measurements are made only minutes after the holeis drilled, so the borehole is likely to be in good condition for logging.Although the total natural gamma data from the CDR were good, thelogs derived from the natural gamma spectrum (potassium, thorium,and uranium) required further processing.
Logging Units
Unit 1 (0–8 mbsf)
Unit 1 is a clay-rich unit, corresponding to lithostratigraphic Unit I.It is characterized by slightly higher gamma-ray values and lower resis-tivity values relative to the underlying unit. Resistivity values are low atthe surface because the sediments are soft and less lithified; however, arelatively rapid increase in resistivity with depth is observed as a resultof compaction.
Unit 2 (8–257 mbsf)
A general compaction trend of increasing resistivity values is ob-served with depth. Clay-rich beds can be detected as drops in the resis-tivity values (Fig. F42). The gamma-ray log highlights the presence of amore radioactive interval at 62–90 mbsf, coincident with a red-coloredinterval seen at 65–84 mbsf. The lower radioactivity levels observed be-
12X
13X
14X
15X
16X
17X
18X
0 150(gAPI)Wireline (MSGR)
0 150(gAPI)LWD (GR)
1 3.5(Ωm)
Wireline medium (IMPM)
1 3.5(Ωm)Wireline shallow (SFLU)
1 3.5(Ωm)LWD deep (ATR)
1 3.5(Ωm)LWD shallow (PSR)
1 2.5(g/cm3)Density (RHOM) Porosity (APLC)
0 1(fraction) 1 6(barn/e–)PEF
Cor
e
Rec
over
y
2b
2c
Dep
th (
mbs
f)
1167A
90
110
130
100
120
140
150
Resistivity
Gamma ray
F41. Gamma-ray, resistivity, den-sity, and porosity logs, p. 82.
Cor
eR
ecov
ery
Loggingunit
1
2a
2b
2c
2d
1H
2H
3H
4H
5H6H7X
8X
9X
10X
11X
12X
13X
14X
15X
16X
17X
18X
19X
20X
21X
22X
23X
24X
25X
26X
27X
28X
29X
30X
0 150(gAPI)Wireline (MSGR)
0 150(gAPI)LWD (GR)
1 3.5(Ωm)Wireline medium (IMPH)
1 3.5(Ωm)LWD deep (ATR)
1 3.5(Ωm)LWD shallow (PSR)
0 350(SI)
Susceptibility
Clay Silt Sand
I
II
Lithostratigraphicunit
0
20
40
60
80
100
120
140
160
180
200
220
240
260
1167A
Dep
th (m
bsf)
Resistivity
Gamma ray
F42. Gamma-ray and resistivity logs and core susceptibility, p. 83.

SHIPBOARD SCIENTIFIC PARTYCHAPTER 5, SITE 1167 33
tween 90 and 120 mbsf and from 215 to 255 mbsf may correspond to adecrease in the proportion of granitic clasts or a change from a clay-richto a sandier matrix.
Subunit 2a (8–62 mbsf)
This subunit is characterized by relatively low gamma-ray values andincreasing resistivity with depth. There are thin intervals with low resis-tivity and low gamma-ray values at 18, 35, and 41 mbsf. A clay bed wasobserved in Core 188-1167A-5H, and since clay beds generally have alower resistivity than diamict, we are inclined to interpret the resistivitylows as clay beds within the diamict. However, clay layers might not beexpected to have the observed lower gamma-ray values because theycontain radioactive potassium and thorium. On the other hand, it isquite likely that K-feldspars and heavy minerals contribute significantlyto the natural gamma signal at this site, so that an increase in clay min-erals would have a minor effect on the logs. Possible alternative litholo-gies for the low-resistivity intervals are clay with microfossils, silty orsandy clay, or perhaps gravels.
Subunit 2b (62–90 mbsf)
This subunit has higher gamma-ray values than the subunits aboveand below; it contains no major drops in resistivity. Red-colored bedsare observed in the core from this interval.
Subunit 2c (90–216 mbsf)
This subunit is similar to Subunit 2a, apart from having generallyhigher resistivities attributed to compaction with depth. It contains sev-eral drops in resistivity; those at 213 and 215 mbsf were observed inCore 188-1167A-25X as clay beds. In contrast to Subunit 2a, these resis-tivity lows are accompanied by natural gamma highs (Fig. F42). A ma-jor interval of resistivity lows (116–127 mbsf) is found in a zone of zerocore recovery. Conglomerate and sand beds were observed in Cores188-1167A-19X and 22X respectively; they are tentatively correlatedwith small positive peaks in the resistivity log at 153 and 181 mbsf.However, the conglomerate bed might also be the cause of the large lowin resistivity values at 148 mbsf if the material between the clasts ispoorly compacted (which is conceivable since the conglomerate is clastsupported).
Subunit 2d (216–255 mbsf)
This subunit is defined by a drop in the gamma-ray values relative toSubunit 2c, above. This is likely to be related to the decrease in graniticclasts and the increase in sandstone clasts observed in the cores aroundthis depth; granites are typically more radioactive than sandstones. Re-sistivities in the upper part of Subunit 2d are higher than in Subunit 2c;there is one drop in resistivity at 235 mbsf.
Resistivity Lows, Clay Beds, and the Trendsin Magnetic Susceptibility
We interpret the thin intervals of low-resistivity values as clay beds,given the known low resistivity of clay compared to diamict and the ab-sence of other major lithologies from the cores in the logged interval.The position of the clay beds appears to be related to the “sawtooth”trends observed in the core magnetic susceptibility record (Fig. F42).Clay beds are found at the step in susceptibility values at 116–127 mbsf

SHIPBOARD SCIENTIFIC PARTYCHAPTER 5, SITE 1167 34
and 190–126 mbsf, but the relationship is not so clear cut in the upper100 m of the hole.
Temperature Log
The Lamont-Doherty Earth Observatory temperature-acceleration-pressure (TAP) tool recorded the temperature of the fluid in Hole 1067Aas the triple combo tool string was run (Fig. F43). The measurementsunderestimate the formation temperature, as the fluid temperature doesnot have time to equilibrate to the formation temperature. A tempera-ture of 4.5°C was recorded at 151 mbsf. The downgoing and upgoingcurves have an offset, owing to the borehole still reequilibrating duringacquisition.
1.0 1.5 2.0 2.5 3.0 3.5 4.0 4.5 5.0
0
50
100
150
Temperature (°C)
Dep
th (
mbs
f)
Pipe
F43. Downhole temperatures from the TAP tool, p. 84.

SHIPBOARD SCIENTIFIC PARTYCHAPTER 5, SITE 1167 35
REFERENCES
Andresen, A., Berre, T., Kleven, A., and Lunne, T., 1979. Procedures used to obtain soilparameters for foundation engineering in the North Sea. Norw. Geotech. Inst. Publ.,129:1–18.
Anson, G.L., and Kodama, K.P., 1987. Compaction-induced shallowing of the post-depositional remanent magnetization in a synthetic sediment. Geophys. J. R.Astron. Soc., 88:673–692.
Arason, P., and Levi, S., 1990. Compaction and inclination shallowing in deep-seasediments from the Pacific Ocean. J. Geophys. Res., 95:4501–4510.
Barker, P.F., Camerlenghi, A., Acton, G.D., et al., 1999. Proc. ODP, Init. Repts. [CD-ROM], 178: College Station, TX (Ocean Drilling Program).
Berggren, W.A., 1992. Neogene planktonic foraminifer magnetobiostratigraphy of thesouthern Kerguelen Plateau (Sites 747, 748, and 751). In Wise, S.W., Jr., Schlich, R.,et al., Proc. ODP, Sci. Results, 120 (Pt. 2): College Station, TX (Ocean Drilling Pro-gram), 631–647.
Berggren, W.A., Kent, D.V., Swisher, C.C., III, and Aubry, M.-P., 1995. A revised Ceno-zoic geochronology and chronostratigraphy. In Berggren, W.A., Kent, D.V., Aubry,M.-P., and Hardenbol, J. (Eds.), Geochronology, Time Scales and Global StratigraphicCorrelation. Spec. Publ.—Soc. Econ. Paleontol. Mineral. (Soc. Sediment. Geol.),54:129–212.
Boulton, G. S., 1990. Sedimentary and sea level changes during glacial cycles andtheir control on glaciomarine facies architecture. In Dowdeswell, J.A., and Scourse,J.D. (Eds.), Glacimarine Environments: Processes and Sediments. Geol. Soc. Spec. Publ.London, 53:15–52.]
Bouma, A.H., 1962. Sedimentology of Some Flysch Deposits: A Graphic Approach to FaciesInterpretation: Amsterdam (Elsevier).
Brooker, E.W., and Ireland, H.O., 1965. Earth pressures at rest related to stress history.Can. Geotech. J., 2:1–15.
Domack, E., O’Brien, P.E., Harris, P.T., Taylor, F., Quilty, P.G., DeSantis, L., and Raker,B., 1998. Late Quaternary sedimentary facies in Prydz Bay, East Antarctica andtheir relationship to glacial advance onto the continental shelf. Antarct.Sci.,10:227–235.
Dunlop, D.J., 1979. One the use of Zijderveld vector diagrams in multicomponentpaleomagnetic studies. Phys. Earth Planet. Inter., 20:12–24.
Ehrmann, W.E., and Fütterer, D.K., 1994. Clay mineral assemblages in the CenozoicAntarctic Ocean. Terra Antart., 1:475–476.
Findlay, C.S., 1998. Living and fossil calcareous nannoplankton from the Australiansector of the Southern Ocean: implications for paleoceanography [Dissert.]. Univ.of Tasmania, Hobart.
Forsberg, C.F., Solheim, A., Elverhøi, A., Jansen, E., Channell, J.E.T., and Andersen,E.S., 1999. The depositional environment of the western Svalbard margin duringthe late Pliocene and the Pleistocene: sedimentary facies changes at Site 986. InRaymo, M.E., Jansen, E., Blum, P., and Herbert, T.D. (Eds.), Proc. ODP, Sci. Results,162: College Station, TX (Ocean Drilling Program), 233–246.
Jacobs, J.A., 1994. Reversals of the Earth’s Magnetic Field (2nd ed.): Cambridge (Cam-bridge Univ. Press).
Larter, R.D., and Cunningham, A.P., 1993. The depositional pattern and distributionof glacial-interglacial sequences on the Antarctic Peninsula Pacific Margin. Mar.Geol., 109:203–219.
Lazarus, D., 1992. Antarctic Neogene radiolarians from the Kerguelen Plateau, Legs119 and 120. In Wise, S.W., Jr., Schlich, R., et al., Proc. ODP, Sci. Results, 120: Col-lege Station, TX (Ocean Drilling Program), 785–809.
Lowrie, W., 1990. Identification of ferromagnetic minerals in a rock by coercivity andunblocking temperature properties. Geophys. Res. Lett., 17:159–162.

SHIPBOARD SCIENTIFIC PARTYCHAPTER 5, SITE 1167 36
Mizukoshi, I., Sunouchi, H., Saki, T., Sato, S., and Tanahashi, M., 1986. Preliminaryreport of geological geophysical surveys off Amery Ice Shelf, East Antarctica. Mem.Nat. Inst. Polar Res. Spec. Iss. Jpn., 43:48–61.
O’Brien, P.E., De Santis, L., Harris, P.T., Domack, E., and Quilty, P.G., 1999. Ice shelfgrounding zone features of western Prydz Bay, Antarctica: sedimentary processesfrom seismic and sidescan images. Antarct. Sci.,11:78–91.
O’Brien, P.E., and Harris, P.T., 1996. Patterns of glacial erosion and deposition inPrydz Bay and the past behaviour of the Lambert Glacier. Pap. Proc. R. Soc. Tasma-nia,130:79–86.
Pollution Prevention and Safety Panel, 1992. Ocean Drilling Program guidelines forpollution prevention and safety. JOIDES J., 18:1–24.
Quilty, P.G., 1985. Distribution of foraminiferids in sediments of Prydz Bay, Antarc-tica. Spec. Publ. S. Aust. Dep. Mines Energy, 5:329–340.
Quilty, P.G., Truswell, E.M., O’Brien, P.E., and Taylor, F., 1999. Paleocene-Eocene bio-stratigraphy and palaeoenvironment of East Antarctica: new data from Mac. Rob-ertson Shelf and western Prydz Bay. AGSO J. Aust. Geol Geophys., 17:133–143.
Roberts, A.P., Wilson, G.S., Florindo, F., Sagnotti, L., Verosub, K.L., and Harwood,D.M., 1998. Magnetostratigraphy of lower Miocene strata from the CRP-1 core,McMurdo Sound, Ross Sea, Antarctica. Terra Antart., 5:703–713.
Samtleben, C., 1980. Die Evolution der Coccolithophoriden-Gattung Gephyrocapsanach Befunden im Atlantik. Palaontol. Z., 54:91–127.
Thompson, R., and Oldfield, F., 1986. Environmental Magnetism: London (Allen andUnwin).
Tingey, R.J., 1991. The regional geology of Archean and Proterozoic rocks in Antarc-tica. In Tingey, R.J. (Ed.), The Geology of Antarctica: Oxford (Clarendon Press), 1–58.
Verosub, K.L., and Roberts, A.P., 1995. Environmental magnetism: past, present, andfuture. J. Geophys. Res., 100:2175–2192.
Villa, G., and Wise, S.W., Jr., 1998. Quaternary calcareous nannofossils from the Ant-arctic region. Terra Antart., 5:479–484.
Weeks, R.J., Roberts, A.P., Verosub, K.L., Okada, M., and Dubuisson, G.J., 1995. Mag-netostratigraphy of upper Cenozoic sediments from Leg 145, North Pacific Ocean.In Rea, D.K., Basov, I.A., Scholl, D.W., and Allan, J.F. (Eds.), Proc. ODP, Sci. Results,145: College Station, TX (Ocean Drilling Program), 491–521.
Wei, W., and Thierstein, H.R., 1991. Upper Cretaceous and Cenozoic calcareous nan-nofossils of the Kerguelen Plateau (southern Indian Ocean) and Prydz Bay (EastAntarctica). In Barron, J., Larsen, B., et al., Proc. ODP, Sci. Results, 119: College Sta-tion, TX (Ocean Drilling Program), 467–494.
Wei, W., and Wise, S.W., Jr., 1992. Oligocene-Pleistocene calcareous nannofossilsfrom Southern Ocean Sites 747, 748, and 751. In Wise, S.W., Jr., Schlich, R., et al.,Proc. ODP, Sci. Results, 120: College Station, TX (Ocean Drilling Program), 509–521.
Wilson, G.S., Florindo, F., Sagnotti, L., Verosub, K.L., and Roberts, A.P., in press. Mag-netostratigraphy of Oligocene-Miocene glaciomarine strata from the CRP-2/2Acore, McMurdo Sound, Ross Sea, Antarctica. Terra Antart.
Wilson, G.S., Roberts, A.P., Verosub, K.L., Florindo, F., and Sagnotti, L., 1998. Magne-tobiostratigraphic chronology of the Eocene-Oligocene transition in the CIROS-1core, Victoria Land margin, Antarctica: implications for Antarctic glacial history.Geol. Soc. Am. Bull., 110:35–47.
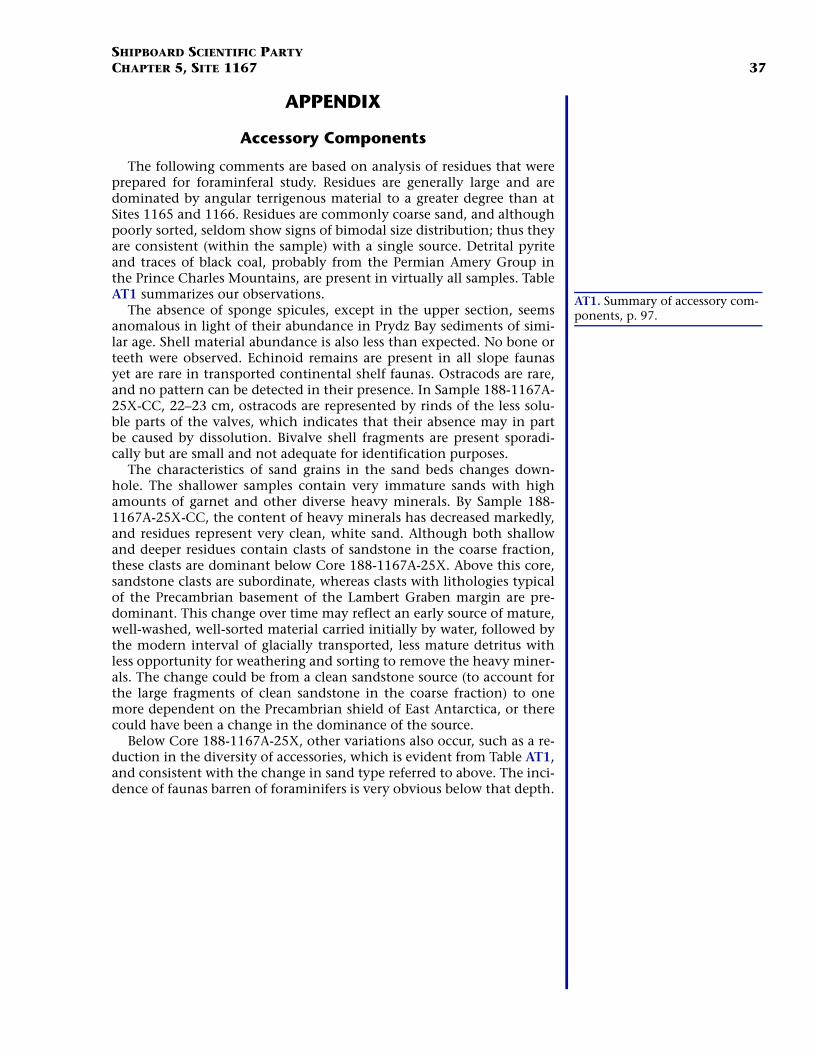
SHIPBOARD SCIENTIFIC PARTYCHAPTER 5, SITE 1167 37
APPENDIX
Accessory Components
The following comments are based on analysis of residues that wereprepared for foraminferal study. Residues are generally large and aredominated by angular terrigenous material to a greater degree than atSites 1165 and 1166. Residues are commonly coarse sand, and althoughpoorly sorted, seldom show signs of bimodal size distribution; thus theyare consistent (within the sample) with a single source. Detrital pyriteand traces of black coal, probably from the Permian Amery Group inthe Prince Charles Mountains, are present in virtually all samples. TableAT1 summarizes our observations.
The absence of sponge spicules, except in the upper section, seemsanomalous in light of their abundance in Prydz Bay sediments of simi-lar age. Shell material abundance is also less than expected. No bone orteeth were observed. Echinoid remains are present in all slope faunasyet are rare in transported continental shelf faunas. Ostracods are rare,and no pattern can be detected in their presence. In Sample 188-1167A-25X-CC, 22–23 cm, ostracods are represented by rinds of the less solu-ble parts of the valves, which indicates that their absence may in partbe caused by dissolution. Bivalve shell fragments are present sporadi-cally but are small and not adequate for identification purposes.
The characteristics of sand grains in the sand beds changes down-hole. The shallower samples contain very immature sands with highamounts of garnet and other diverse heavy minerals. By Sample 188-1167A-25X-CC, the content of heavy minerals has decreased markedly,and residues represent very clean, white sand. Although both shallowand deeper residues contain clasts of sandstone in the coarse fraction,these clasts are dominant below Core 188-1167A-25X. Above this core,sandstone clasts are subordinate, whereas clasts with lithologies typicalof the Precambrian basement of the Lambert Graben margin are pre-dominant. This change over time may reflect an early source of mature,well-washed, well-sorted material carried initially by water, followed bythe modern interval of glacially transported, less mature detritus withless opportunity for weathering and sorting to remove the heavy miner-als. The change could be from a clean sandstone source (to account forthe large fragments of clean sandstone in the coarse fraction) to onemore dependent on the Precambrian shield of East Antarctica, or therecould have been a change in the dominance of the source.
Below Core 188-1167A-25X, other variations also occur, such as a re-duction in the diversity of accessories, which is evident from Table AT1,and consistent with the change in sand type referred to above. The inci-dence of faunas barren of foraminifers is very obvious below that depth.
AT1. Summary of accessory com-ponents, p. 97.
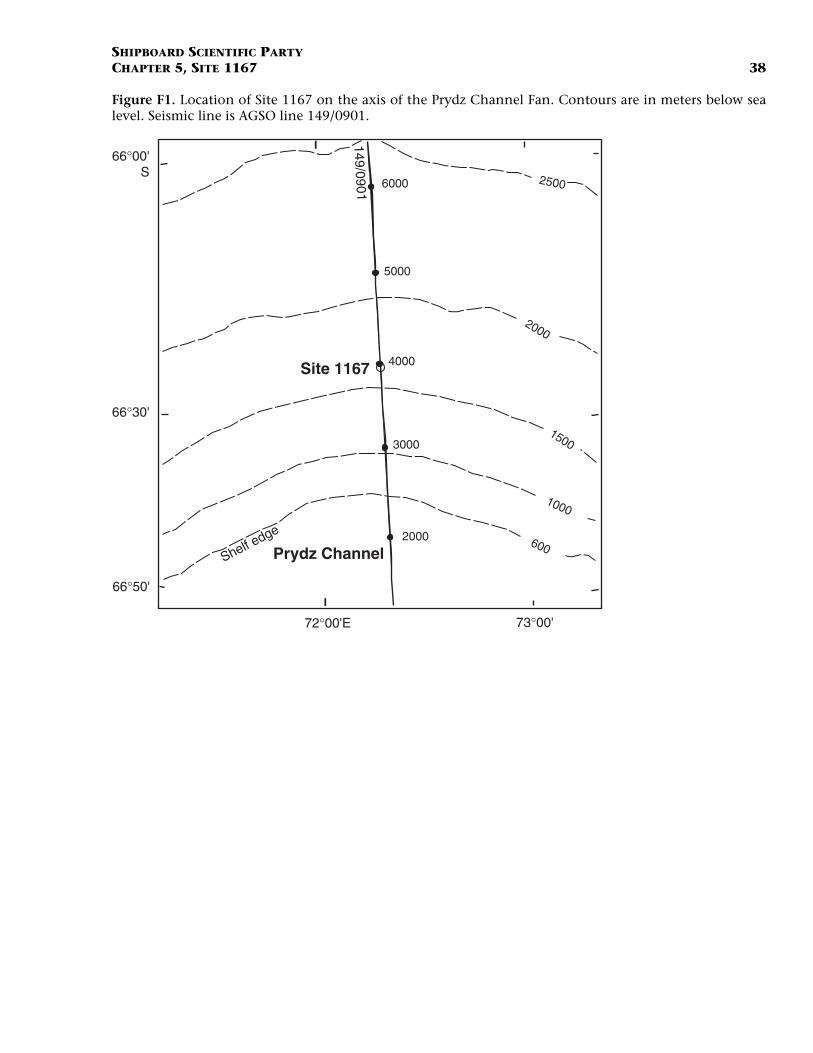
SHIPBOARD SCIENTIFIC PARTYCHAPTER 5, SITE 1167 38
Figure F1. Location of Site 1167 on the axis of the Prydz Channel Fan. Contours are in meters below sealevel. Seismic line is AGSO line 149/0901.
2500
2000
1500
1000
600
72°00'E 73°00'
66°00'S
66°30'
66°50'
Prydz Channel2000
Shelf edge
6000
149/0901
5000
4000Site 1167
3000

SH
IPB
OA
RD
SC
IEN
TIFIC P
AR
TY
CH
AP
TE
R 5
, SIT
E 11
67
39
Figure
S 38933902.53912.53922.5
2.14
2.20
2.25
2.30
2.35
2.40
2.45
2.50
2.55
2.60
2.65
2.70
2.75
2.802.81
Two-
way
trav
eltim
e (s
)
F2. Part of seismic line AGSO 149/0901 through Site 1167. SP = shotpoint.
Site 1167
P 3932.53942.53952.53962.53972.53982.53992.54002.54012.54022.54032.5
0
0
0
0
0
0
0
0
0
0
0
0
0
05

SHIPBOARD SCIENTIFIC PARTYCHAPTER 5, SITE 1167 40
Figure F3. Site 1167 lithostratigraphic units and facies.
1H2H
3H
4H5H7X8X
9X
10X
11X
12X
13X
14X
15X
16X
17X
18X
19X
20X
21X
22X
23X
24X
25X
26X
27X
28X
29X
30X
31X
32X
33X
34X
35X
36X
37X
38X
39X
40X
41X
42X
43X
44X
45X
46X
47X
48X
49X
Dep
th (
mbs
f)
Clay Silt SandI
II
0
10
cm Unit I: Clay and sandy clay with isolated beds of fine sand and rare lonestones; minor biogenic componentPROCESS HEMIPELAGIC
Unit II: Clayey silty sand with local diamicton beds and minor foraminifersPROCESS DEBRIS FLOW
One major facies and three minor facies:
Facies II-1: Dark gray sandy silt, silty sand, clayey sand, and clast-poor diamicton
Facies II-2: Gray, moderately sorted coarse sand
Facies II-3: Dark gray clay and clay with light-colored silt laminae
Facies II-4: Green gray clay with dispersed clasts, abundant foraminifers, and minor nannofossil component
F-II-1
F-II-2
F-II-2
F-II-2
F-II-1
F-II-1
F-II-1
F-II-1
F-II-1
F-II-1
F-II-4
F-II-4
F-II-3
F-II-3
F-II-3
F-II-3
Intervals with red color banding
F-II-4
Gravel bed
F-II-4
0
50
100
150
200
250
300
350
400
450
Cor
e
0
10
cm
0
10
cm
Rec
over
y
Lith
o. u
nit

SHIPBOARD SCIENTIFIC PARTYCHAPTER 5, SITE 1167 41
Figure F4. Composite stratigraphic section for Site 1167 showing core recovery, a simplified summary oflithology, lithologic unit boundaries, and age. Lithologic symbols are explained in Figure F3, p. 42, in the“Explanatory Notes” chapter. Also shown are lonestone distribution and average size, minerals identifiedby XRD, and color reflectance. XRD shows the percentage of most abundant minerals. See Figure F12, p. 41,in the “Leg Summary” chapter for lithology and mineral legends. This graph was plotted using the methodsdeveloped by Forsberg et al. (1999). The thin line in the color reflectance shows the percent reflectancedownhole (L*). The thick line is a 200-point moving average. (Figure shown on next page.)

SHIPBOARD SCIENTIFIC PARTYCHAPTER 5, SITE 1167 42
Figure F4 (continued). (Caption shown on previous page.)
Colorreflectance
(%)
0 10 20
Lonestones(per meter of core)
1H
2H
3H
4H
5H7X
8X
9X
10X
11X
12X
13X
14X
15X
16X
17X
18X
19X
20X
21X
22X
23X
24X
25X
26X
27X
28X
29X
30X
31X
32X
33X
34X
35X
36X
37X
38X
39X
40X
41X
43X
42X
44X
45X
46X
47X
48X
49X
I
II
Ple
isto
cen
e
0 50 100
PercentX-ray Diffraction
Counts
0 2 4 6
Lonestones(average size in cm)
4 8 12 16
Co
re
Rec
over
y
1167A
Lithology
Lith
o. u
nit
Age
X-Raydiffractioncounts (%)
0
50
100
150
200
250
300
350
400
450
Dep
th (
mbs
f)
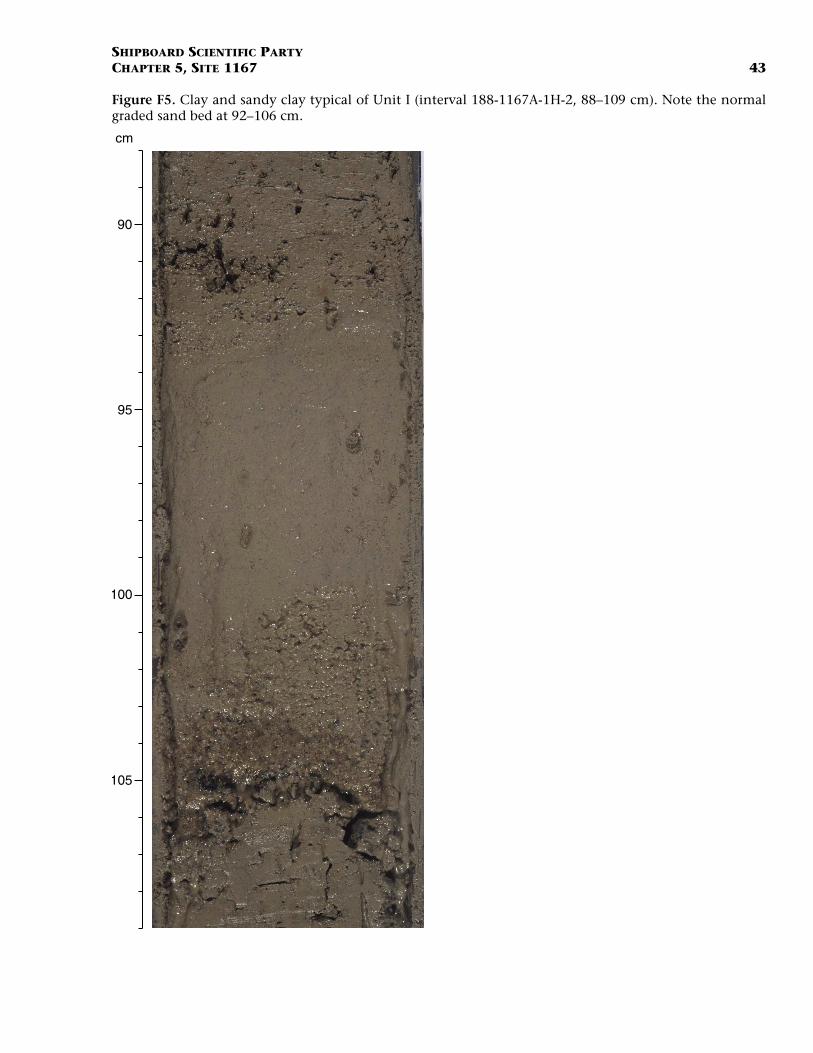
SHIPBOARD SCIENTIFIC PARTYCHAPTER 5, SITE 1167 43
Figure F5. Clay and sandy clay typical of Unit I (interval 188-1167A-1H-2, 88–109 cm). Note the normalgraded sand bed at 92–106 cm.
cm
95
100
105
90

SHIPBOARD SCIENTIFIC PARTYCHAPTER 5, SITE 1167 44
Figure F6. Silty sand with dispersed clasts typical of Facies II-1 (interval 188-1167A-5H-4, 45–65 cm).
cm
50
55
65
60
45

SHIPBOARD SCIENTIFIC PARTYCHAPTER 5, SITE 1167 45
Figure F7. Lonestone lithologies and distribution in Hole 1167A.
0
50
100
150
200
250
300
350
400
450
0 1 2 3 4 5 6 7 8 9 10 11 12 13 14 15 16
0 1 2 3 4 5 6 7 8 9 10 11 12 13 14 15 16
Dep
th (
mbs
f)
1 = Garnet gneiss2 = Gneiss3 = Metaquartzite4 = Conglomerate5 = Coal6 = Granite to gabbro7 = Sandstone8 = Quartz9 = Biotite10 = Pyrite11 = Claystone/mudstone12 = Dolerite13 = Matrix clast14 = Unknown + Bituminite?15 = Schist16 = Blue gneiss
Legend
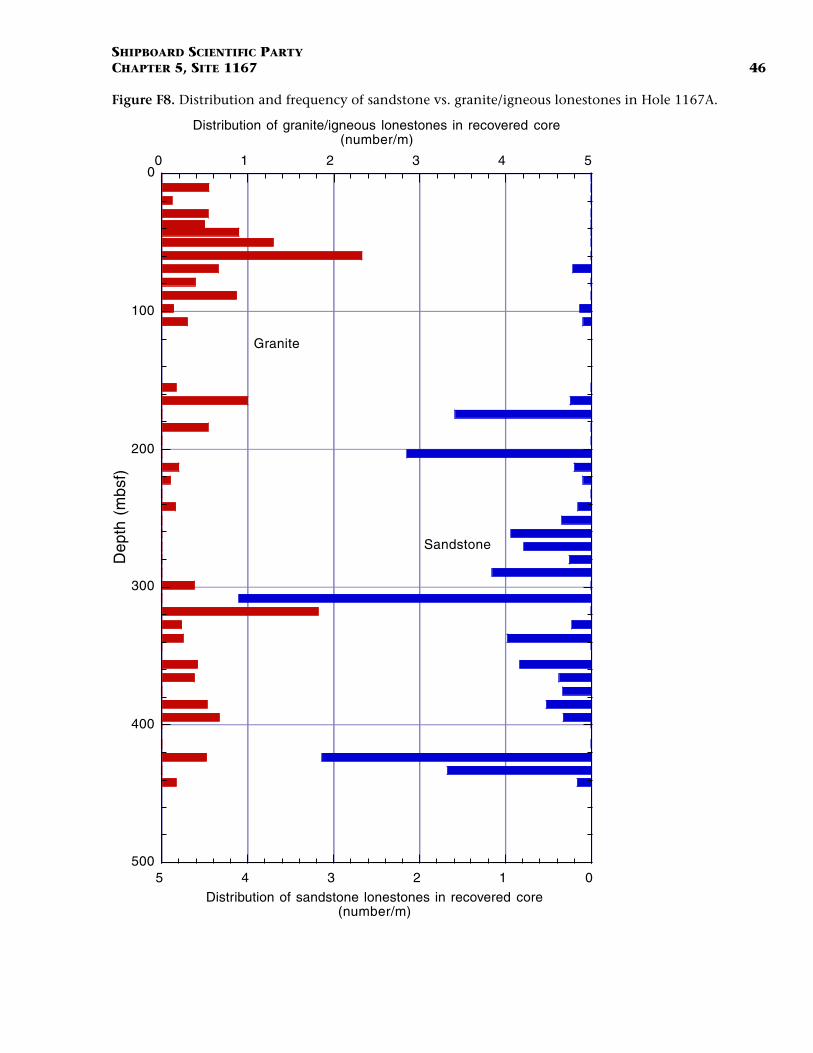
SHIPBOARD SCIENTIFIC PARTYCHAPTER 5, SITE 1167 46
Figure F8. Distribution and frequency of sandstone vs. granite/igneous lonestones in Hole 1167A.
012345
0 1 2 3 4 50
100
200
300
400
500
Distribution of sandstone lonestones in recovered core(number/m)
Dep
th (
mbs
f)Distribution of granite/igneous lonestones in recovered core
(number/m)
Granite
Sandstone

SHIPBOARD SCIENTIFIC PARTYCHAPTER 5, SITE 1167 47
Figure F9. Gravel bed from Facies II-1 (interval 188-1167A-19X-2, 50–80 cm).
cm
60
65
75
70
55
50
80
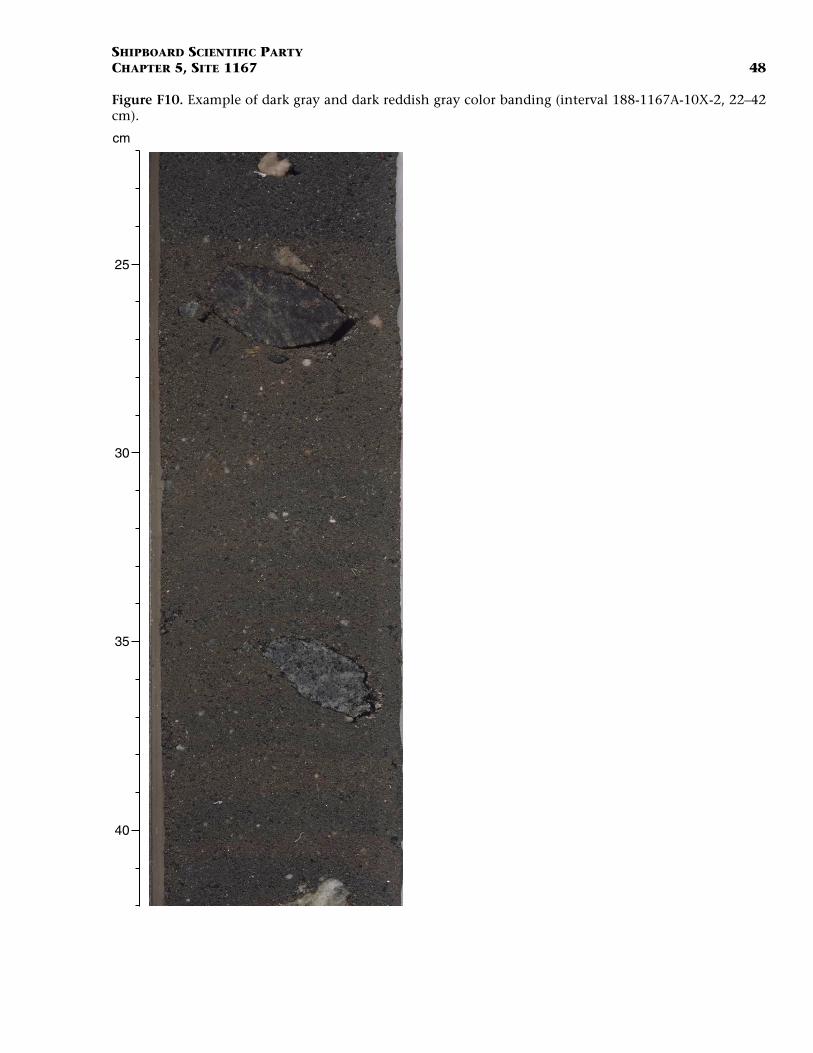
SHIPBOARD SCIENTIFIC PARTYCHAPTER 5, SITE 1167 48
Figure F10. Example of dark gray and dark reddish gray color banding (interval 188-1167A-10X-2, 22–42cm).
cm
25
30
35
40

SHIPBOARD SCIENTIFIC PARTYCHAPTER 5, SITE 1167 49
Figure F11. Facies II-2 coarse sand with dispersed mud clasts (interval 188-1167A-37X-3, 36–56 cm).
cm
40
45
50
55

SHIPBOARD SCIENTIFIC PARTYCHAPTER 5, SITE 1167 50
Figure F12. Facies II-3 clay with silt laminae (interval 188-1167A-25X-7, 0–25 cm). Note the cross-beddingof clays.
cm
10
15
25
20
5
0

SHIPBOARD SCIENTIFIC PARTYCHAPTER 5, SITE 1167 51
Figure F13. Sharp contacts at the top of Facies II-3 clay (interval 188-1167A-25X-6, 125–136 cm).
cm
135
130
125

SHIPBOARD SCIENTIFIC PARTYCHAPTER 5, SITE 1167 52
Figure F14. Sharp contact at the top and gradational contact at the base of Facies II-4 clay (interval 188-1167A-5H-3, 25–50 cm).
cm
35
40
50
45
30
25
Upper contact
Lower contact
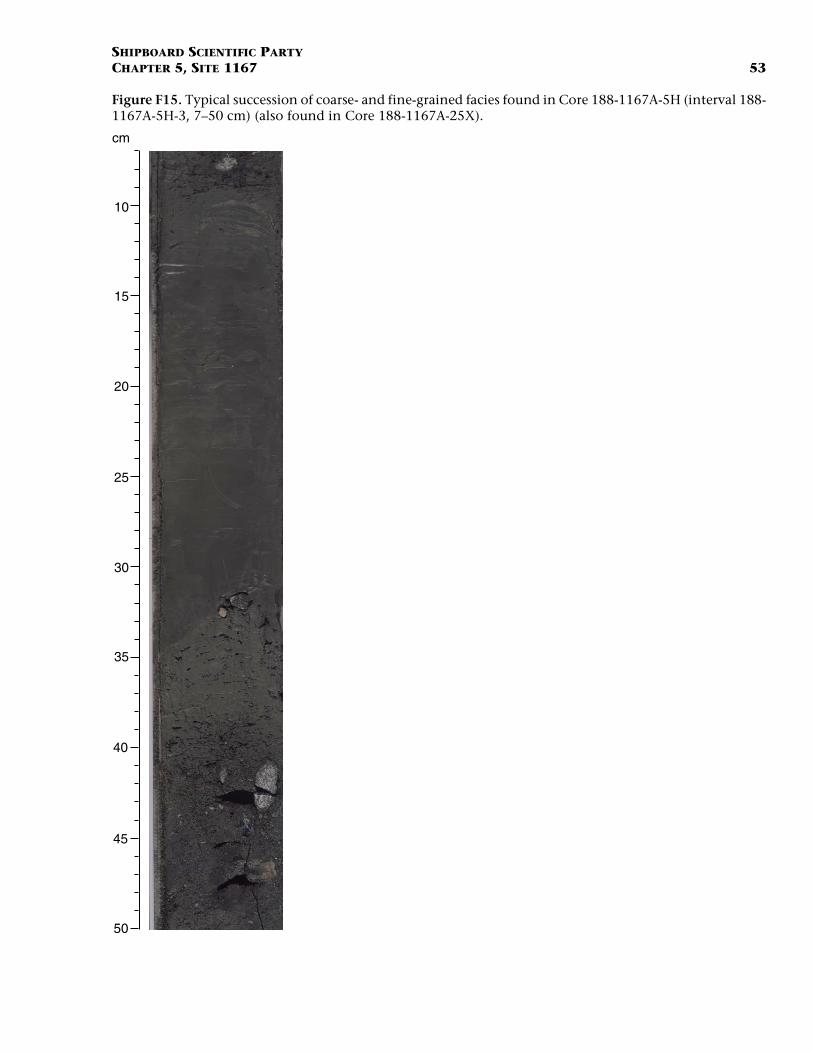
SHIPBOARD SCIENTIFIC PARTYCHAPTER 5, SITE 1167 53
Figure F15. Typical succession of coarse- and fine-grained facies found in Core 188-1167A-5H (interval 188-1167A-5H-3, 7–50 cm) (also found in Core 188-1167A-25X).
cm
20
25
35
30
15
10
40
45
50

SHIPBOARD SCIENTIFIC PARTYCHAPTER 5, SITE 1167 54
Figure F16. Percentages of sand, silt, and clay from Site 1167 smear slides.
0 20 40 60 80 100
0 20 40 60 80 1000
50
100
150
200
250
300
350
400
Dep
th (
mbs
f)
%
Clay
Silt
Sand

SHIPBOARD SCIENTIFIC PARTYCHAPTER 5, SITE 1167 55
Figure F17. X-ray diffractograms of clay-sized fractions of sediment from Samples 188-1167A-1H-4, 45–46cm, and 5X-3, 12–13 cm.
Heated
2 6 10 14 18 22 26 30 34
Illite K
aolin
ite
Kao
linite
Quartz + Illite
188-1167A-5H-3W, 12-13 cm
188-1167A-1H-1W, 45-46 cm
Heated
Glycolated
Untreated
Qua
rtz
800
400
0
Diffraction angle (2θ)
Inte
nsity
(co
unts
)
1600
1200
2400
2000
2800
3200
PlagioclaseK-feldspar
Pla
gioc
lase
Sm
ectit
e
Chl
orite
Untreated
Glycolated
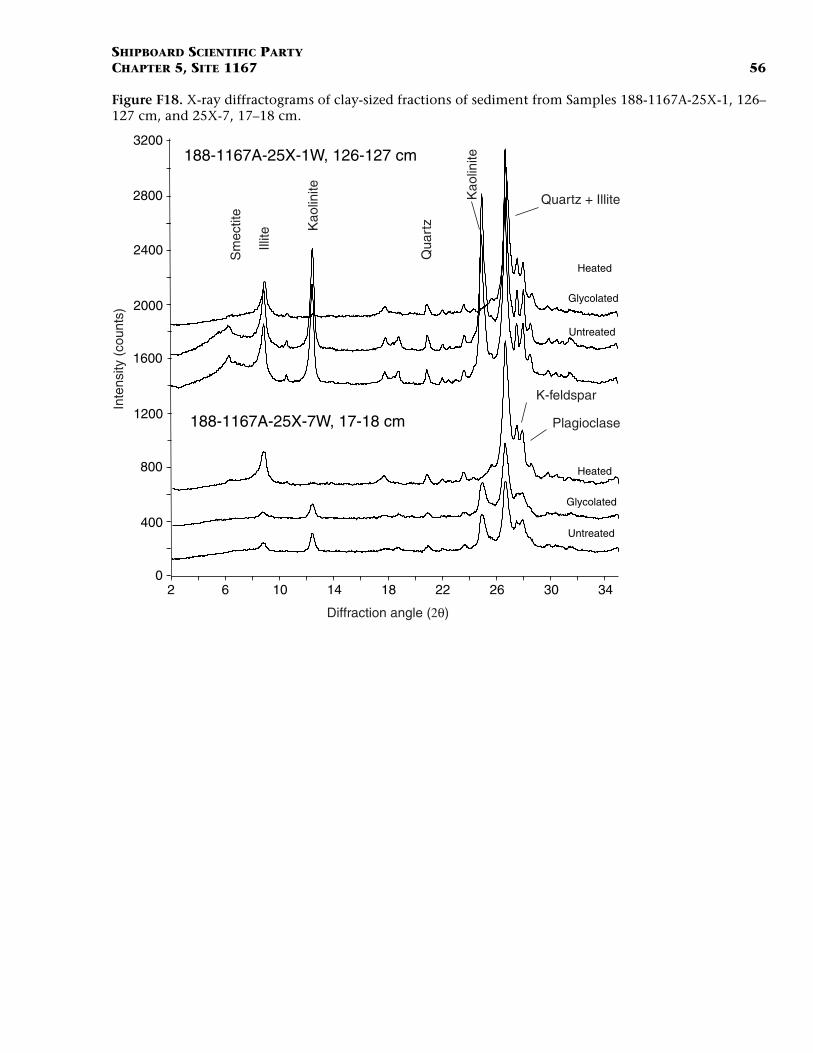
SHIPBOARD SCIENTIFIC PARTYCHAPTER 5, SITE 1167 56
Figure F18. X-ray diffractograms of clay-sized fractions of sediment from Samples 188-1167A-25X-1, 126–127 cm, and 25X-7, 17–18 cm.
Untreated
Glycolated
Heated
2 6 10 14 18 22 26 30 34
Illite
Kao
linite Kao
linite
Quartz + Illite
188-1167A-25X-7W, 17-18 cm
188-1167A-25X-1W, 126-127 cm
Heated
Glycolated
Untreated
Qua
rtz
800
400
0
Diffraction angle (2θ)
Inte
nsity
(co
unts
)
1600
1200
2400
2000
2800
3200
Plagioclase
K-feldspar
Sm
ectit
e
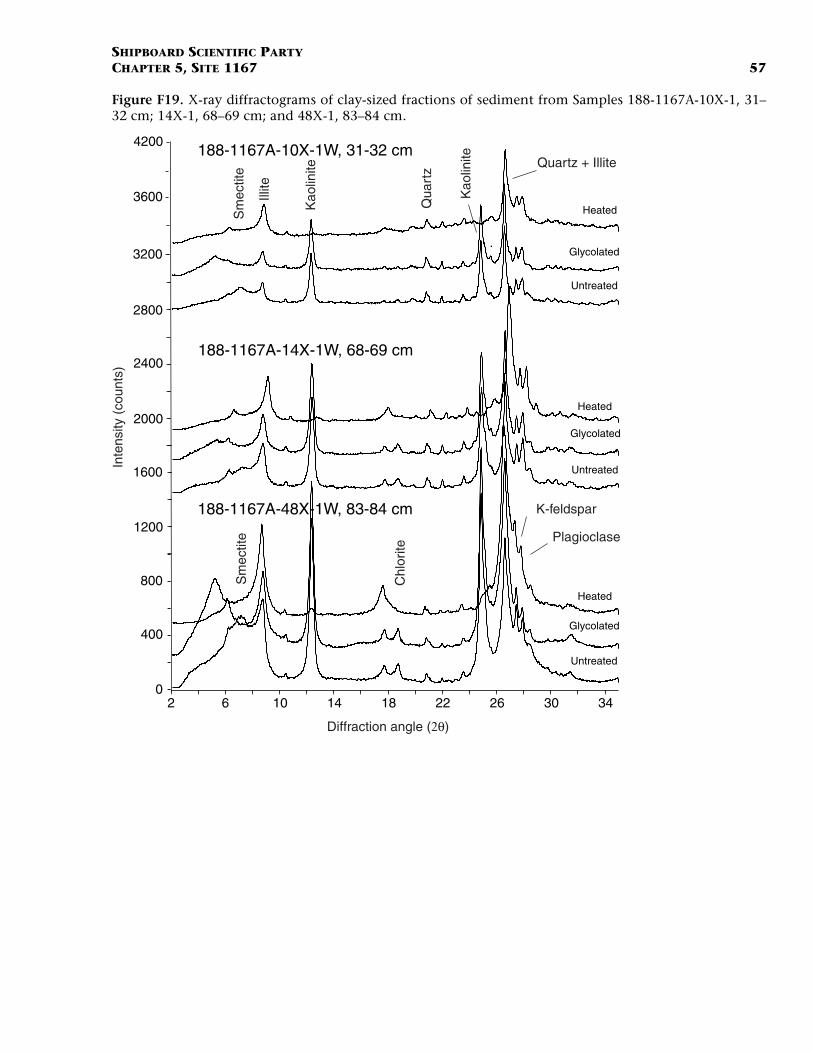
SHIPBOARD SCIENTIFIC PARTYCHAPTER 5, SITE 1167 57
Figure F19. X-ray diffractograms of clay-sized fractions of sediment from Samples 188-1167A-10X-1, 31–32 cm; 14X-1, 68–69 cm; and 48X-1, 83–84 cm.
Untreated
Glycolated
Heated
2 6 10 14 18 22 26 30 34
Illite
Kao
linite
Kao
linite Quartz + Illite
188-1167A-14X-1W, 68-69 cm
188-1167A-10X-1W, 31-32 cm
Heated
Glycolated
Untreated
Qua
rtz
800
400
0
Diffraction angle (2θ)
Inte
nsity
(co
unts
)
1600
1200
2400
2000
2800
3200
Plagioclase
K-feldspar
Sm
ectit
e
188-1167A-48X-1W, 83-84 cm
Chl
orite
Sm
ectit
e
Heated
Glycolated
Untreated
3600
4200

SHIPBOARD SCIENTIFIC PARTYCHAPTER 5, SITE 1167 58
Figure F20. Graphical summary of core recovery, lithostratigraphic units, magnetostratigraphy, and bio-stratigraphic zones for Hole 1167A.
Tim
e-ro
ckun
its
Cor
e
Rec
over
y Magneto-stratigraphy
Pol. ChronDiatoms
Radio-larians
Plank.Foram.
Nanno-fossils
Biostratigraphy
Hole 1167A
T. lentiginosa
Top
core
dept
h(m
bsf)
Barren
AN7
Chi/Psi
C1nI
CN14a?
CN13b?BarrenBarren
0.005.20
14.7024.2033.7039.7039.7045.0054.7064.3073.7083.3093.00
102.60112.30121.90131.50140.70150.30159.90169.60179.20188.80198.40208.00217.60227.20236.90246.50256.10265.70275.30284.60293.90303.20312.80322.50332.10341.70351.30360.90370.60380.20389.80399.40409.00418.70428.30437.90
1 H 2 H 3 H 4 H 5 H 6 H 7 X 8 X 9 X
10 X 11 X 12 X 13 X 14 X 15 X 16 X 17 X 18 X 19 X 20 X 21 X 22 X 23 X 24 X 25 X 26 X 27 X 28 X 29 X 30 X 31 X 32 X 33 X 34 X 35 X 36 X 37 X 38 X 39 X 40 X 41 X 42 X 43 X 44 X 45 X 46 X 47 X 48 X 49 X
C1r.2r
low
er P
leis
toce
neup
per
mid
-P
leis
toce
ne
Lith
o. u
nit
C1r.1r

SHIPBOARD SCIENTIFIC PARTYCHAPTER 5, SITE 1167 59
Figure F21. Downcore variation of concentration-dependent parameters (k, ARM, and IRM) at Site 1167.The horizontal solid lines indicate the boundaries between intervals with differing magnetic properties.ARM = anhysteretic remanent magnetization; IRM = isothermal remanent magnetization.
IA
IB
IC
ID
IE
IIA
Susceptibility (10-5 SI)
Dep
th (
mbs
f)
IIB
0 100 200 300
0
100
200
300
400
ARM (A/m)0 0.2 0.4 0.6
IA
IB
IC
ID
IE
IIA
IIB
IRM 1.3T (A/m)0 5 10 15 20
IA
IB
IC
ID
IE
IIA
IIB

SHIPBOARD SCIENTIFIC PARTYCHAPTER 5, SITE 1167 60
Figure F22. Plot of isothermal remanent magnetization (IRM) acquisition of 10 representative samples. Sat-uration of IRM is reached in fields of 0.2–0.3 T.
0
5
10
15
20
0 200 400 600 800 1000
IRM
(A
/m)
Applied field (mT)
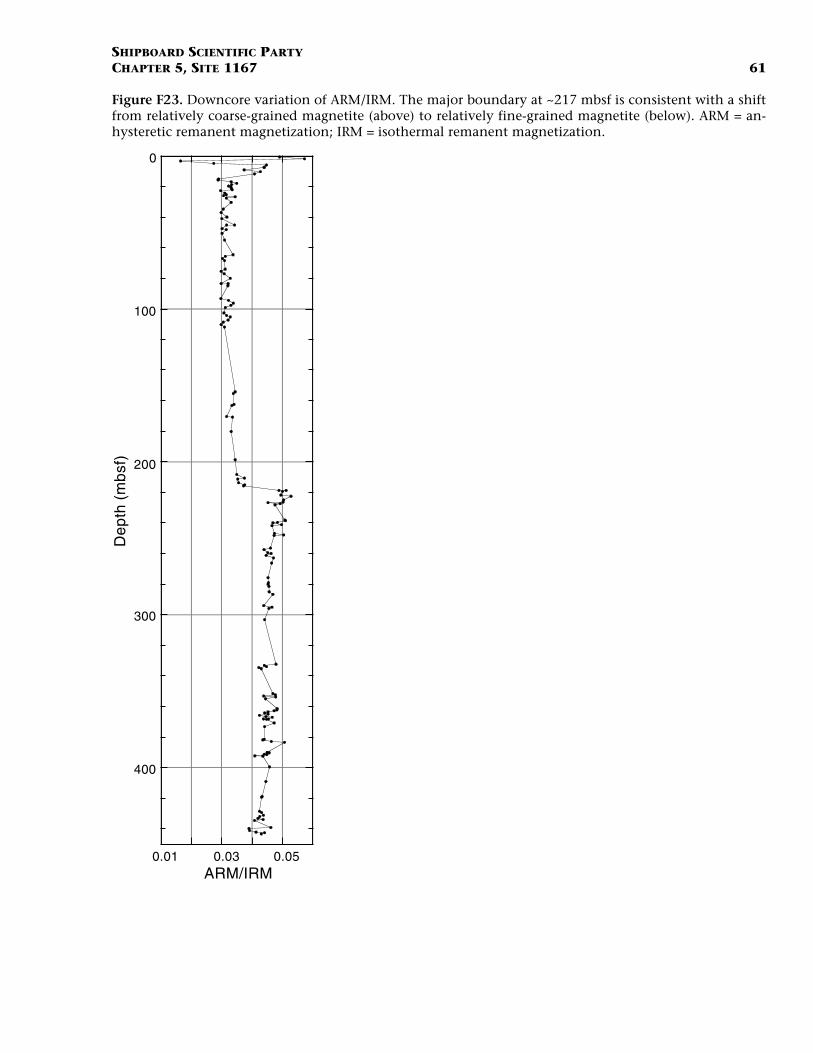
SHIPBOARD SCIENTIFIC PARTYCHAPTER 5, SITE 1167 61
Figure F23. Downcore variation of ARM/IRM. The major boundary at ~217 mbsf is consistent with a shiftfrom relatively coarse-grained magnetite (above) to relatively fine-grained magnetite (below). ARM = an-hysteretic remanent magnetization; IRM = isothermal remanent magnetization.
0.01 0.03 0.05
0
100
200
300
400
ARM/IRM
Dep
th (
mbs
f)

SHIPBOARD SCIENTIFIC PARTYCHAPTER 5, SITE 1167 62
Figure F24. Vector component diagrams (with normalized intensity decay plots) of demagnetization (AF)behavior of four samples from Hole 1167A. Open symbols = projections onto the vertical plane; solid sym-bols = projections onto the horizontal plane. Numbers denote demagnetization levels in milliteslas and indegrees Celsius. Dashed lines = linear regression fits that indicate the characteristic remanence componentfor each sample. The stereoplots are equal-area projections, with open symbols indicating upper hemi-sphere projections and solid symbols indicating lower hemisphere projections. The core is not azimuthallyoriented; therefore, the declination values are not meaningful. NRM = natural remanent magnetization.(Figure shown on next page.)

SHIPBOARD SCIENTIFIC PARTYCHAPTER 5, SITE 1167 63
Figure F24 (continued). (Caption shown on previous page.)
27.43 mbsf
NRM = 5.01e-2 A/m
J/J
max
Temperature (˚C)0 80
Field (mT)
27.47 mbsf
NRM = 5.17e-2 A/m
J/J
max
0 80
NRM = 2.11e-2 A/m
0 80Field (mT)
J/J
max
80.0 mbsf
0 80Field (mT)
J/J
max
211.25 mbsf
NRM = 4.53e-2 A/m
N,Up
E,N
NRM
100
300
400
N,Up
E,N
NRM
10
30
N,Up
E,N
NRM
5
20
N,Up
E,E
NRM
7
20
10
200
N
S
EW
Equalarea
N
S
EW
Equalarea
N
S
EW
Equalarea
N
S
EW
Equalarea

SHIPBOARD SCIENTIFIC PARTYCHAPTER 5, SITE 1167 64
Figure F25. Magnetostratigraphic record from Hole 1167A. Plot of NRM intensity and inclination after de-magnetization at 30 mT. The inclinations obtained from split cores (solid circles) are compared with incli-nations from stepwise-demagnetized discrete samples (solid squares). Inclinations for discrete samples weredetermined by linear regression fits to multiple demagnetization steps. Polarity is shown on the log to theright. Black = normal polarity intervals; white = reversed polarity intervals. The depths of the two nanno-fossil assemblages are also indicated.
?
?
CN14a0.4-0.9 Ma
CN13b0.9-2 Ma
Nannofossil stratigraphy Polarity Chrons
Depth (mbsf)
Age(Ma)
30-34 0.78
C1n
C1r.1r
C1r.2r
0 0.04 0.08
0
5 0
100
150
200
250
300
350
400
450
Intensity (A/m)
Dep
th (
mbs
f)
-90 -45 0 4 5 9 0Inclination (°)
~218-228

SHIPBOARD SCIENTIFIC PARTYCHAPTER 5, SITE 1167 65
Figure F26. Interstitial water chemistry profiles vs. depth for salinity, chlorinity, pH, alkalinity, ammonium,phosphate, calcium (solid circles), magnesium (open circles), strontium, potassium, lithium, sodium, silica,manganese, and sulfate at Site 1167. Data are reported in Table T5, p. 89. (Continued on next page.)
1 2 3 40
100
200
300
400
Alkalinity (mM)
Dep
th (
mbs
f)
20 24 28
SO4 (mM)
0 40 80
NH4 (µM)
33.5 34.5 35.50
100
200
300
400
Salinity
Dep
th (
mbs
f)
530 550 570
Cl (mM)7.6 7.8 8 8.2 8.4
pH
0 2 4 60
100
200
300
400
PO4 (µM)
Dep
th (
mbs
f)
0 10 20 30
Mn (µM)0 20 40 60
Ca and Mg (mM)

SHIPBOARD SCIENTIFIC PARTYCHAPTER 5, SITE 1167 66
Figure F26 (continued).
460 480 5000
100
200
300
400
Na (mM)
Dep
th (
mbs
f)
100 300 500 700
Si (µM)
0 100 2000
100
200
300
400
Sr (µM)D
epth
(m
bsf)
0 4 8 12
K (mM)
0 10 20 30
Li (µM)
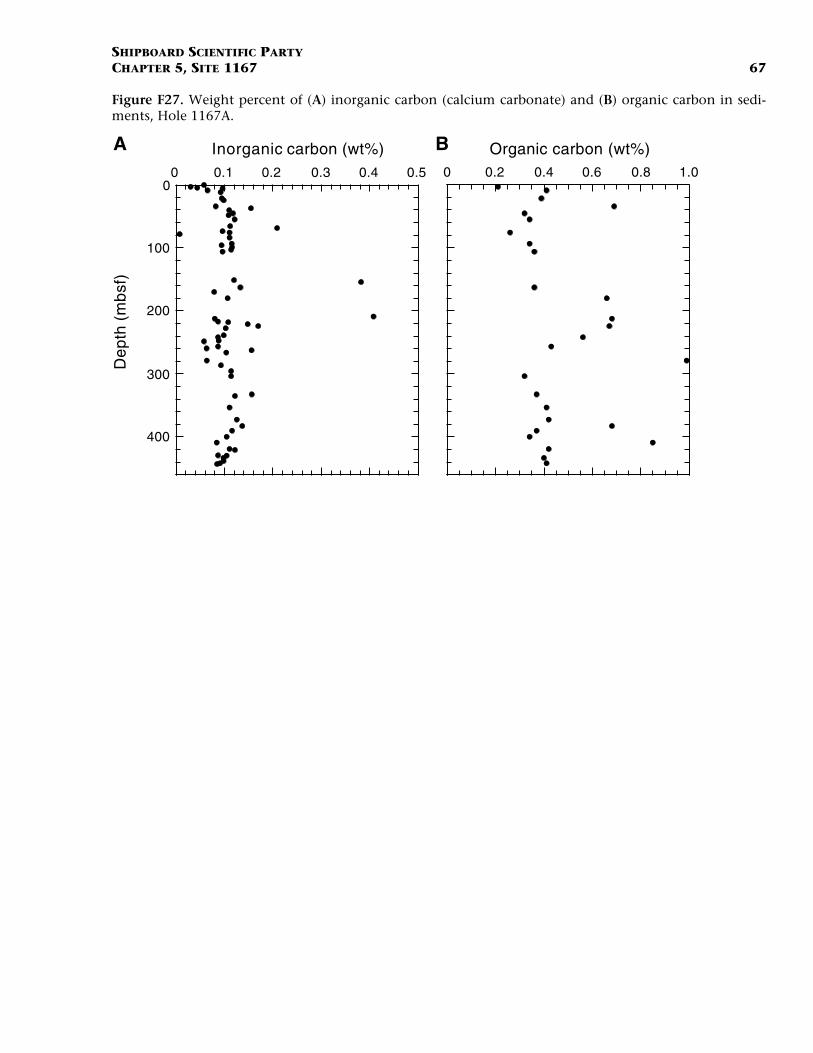
SHIPBOARD SCIENTIFIC PARTYCHAPTER 5, SITE 1167 67
Figure F27. Weight percent of (A) inorganic carbon (calcium carbonate) and (B) organic carbon in sedi-ments, Hole 1167A.
0
100
200
300
400
0 0.1 0.2 0.3 0.4 0.5
Inorganic carbon (wt%)
Dep
th (
mbs
f)
A0 0.2 0.4 0.6 0.8 1.0
Organic carbon (wt%)B
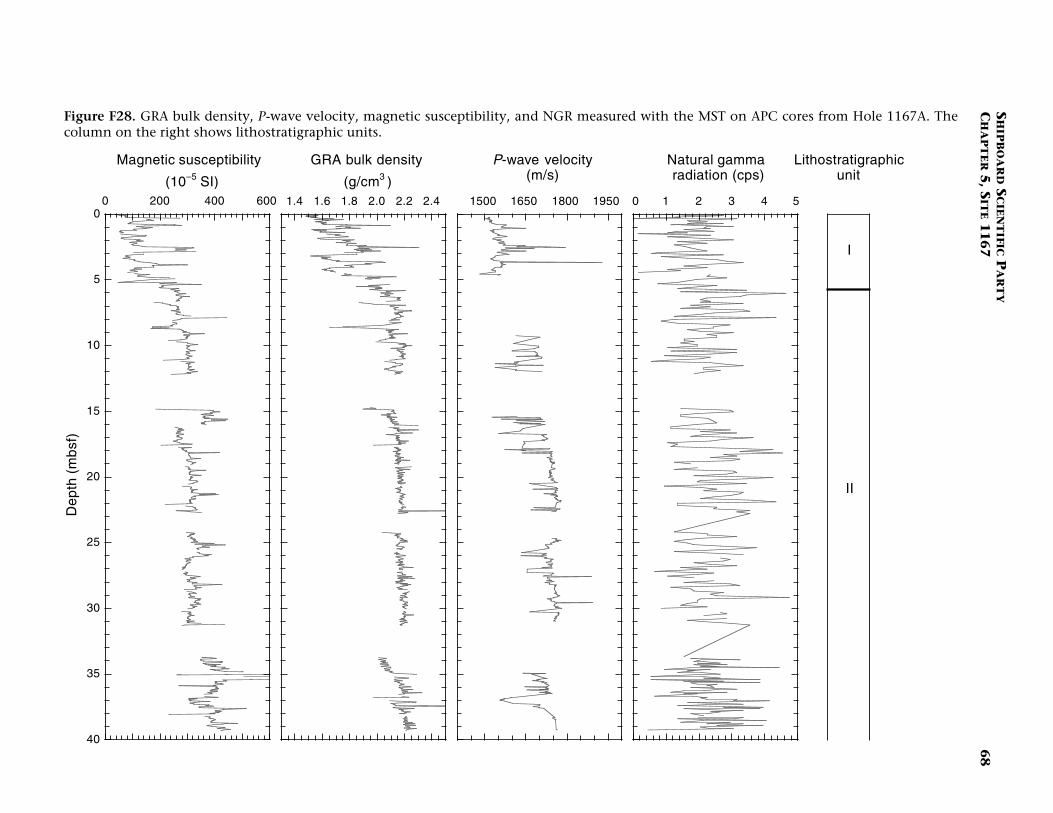
SH
IPB
OA
RD
SC
IEN
TIFIC P
AR
TY
CH
AP
TE
R 5
, SIT
E 11
67
68
Figure C cores from Hole 1167A. Thecolum
Lithostratigraphicunit
II
I
0
5
10
15
20
25
30
35
40
Dep
th (
mbs
f)
5
F28. GRA bulk density, P-wave velocity, magnetic susceptibility, and NGR measured with the MST on APn on the right shows lithostratigraphic units.
0 200 400 600
Magnetic susceptibility
(10–5 SI)1.4 1.6 1.8 2.0 2.2 2.4
GRA bulk density
(g/cm3 )1500 1650 1800 1950
P-wave velocity(m/s)
0 1 2 3 4
Natural gamma radiation (cps)

SHIPBOARD SCIENTIFIC PARTYCHAPTER 5, SITE 1167 69
Figure F29. Plots showing bulk mineralogy from X-ray diffraction (XRD), NGR, and binned natural gammaspectra vs. depth at Site 1167. Core recovery and lithostratigraphic units are shown on the left. The linethrough the NGR data is a 20-m moving average. The binned NGR spectra show channels 100 through 248(1.16–2.99 MeV) from the MST natural gamma detector. The characteristic peak positions of gamma radi-ation associated with potassium (K), uranium (U), and thorium (Th) are shown on the lowermost spectrum.(Figure shown on next page.)

SHIPBOARD SCIENTIFIC PARTYCHAPTER 5, SITE 1167 70
Figure F29 (continued). (Caption shown on previous page.)
Lith
o.un
it11
67A
Rec
over
y
0
Dep
th (
mbs
f)
0 25 50 75
XRD counts (%)0 5 10 15
NGR (cps)
100 150 200 250
100 150 200 250
I
II
K
ThU
Channel
Channel
Cou
nts
Cou
nts
Bulk mineralogy
Natural gammaradiation (NGR)
Binned natural gamma spectra
50
100
150
200
250
300
350
400
450
0
100
200
0
100
200
0 - 200 mbsf
200 - 439 mbsf
Hornblende
Total clay minerals
Quartz
K-feldspar
Plagioclase
Calcite
Pyrite
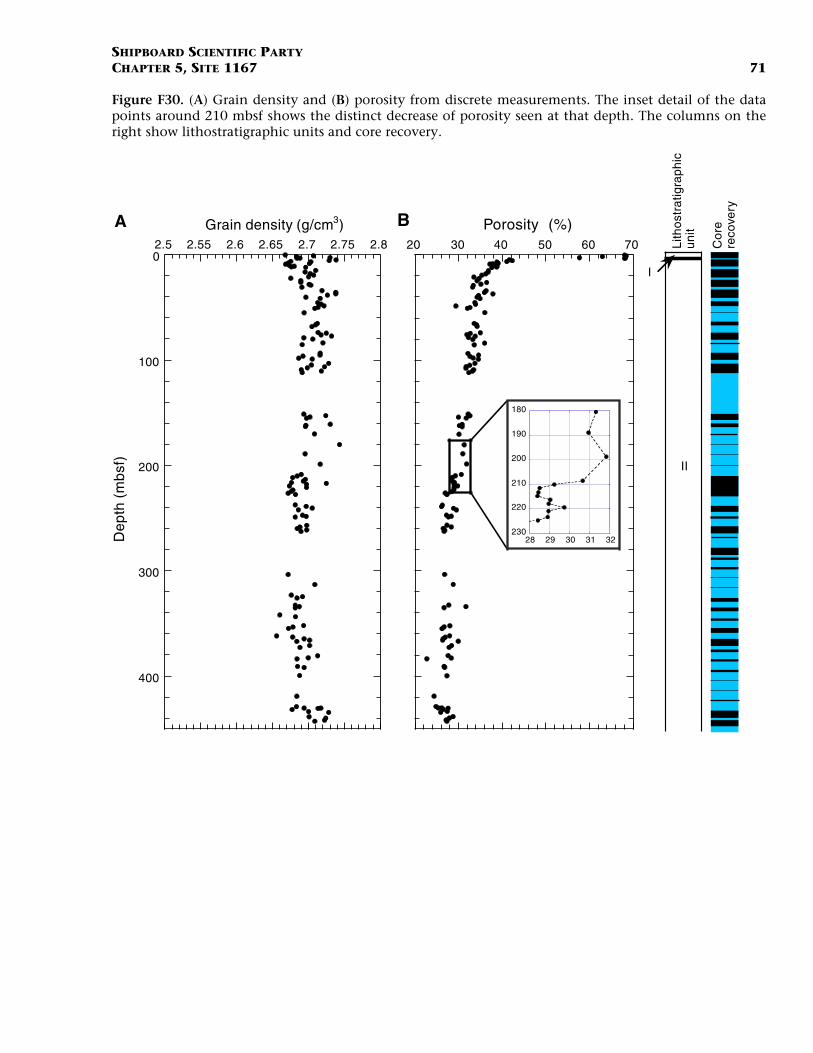
SHIPBOARD SCIENTIFIC PARTYCHAPTER 5, SITE 1167 71
Figure F30. (A) Grain density and (B) porosity from discrete measurements. The inset detail of the datapoints around 210 mbsf shows the distinct decrease of porosity seen at that depth. The columns on theright show lithostratigraphic units and core recovery.
20 30 40 50 60 70
Porosity (%)B
28 29 30 31 32
180
190
200
210
220
230
I
II
Lith
ostr
atig
raph
icun
it
Cor
ere
cove
ry
0
100
200
300
400
2.5 2.55 2.6 2.65 2.7 2.75 2.8
Dep
th (
mbs
f)
Grain density (g/cm3)A
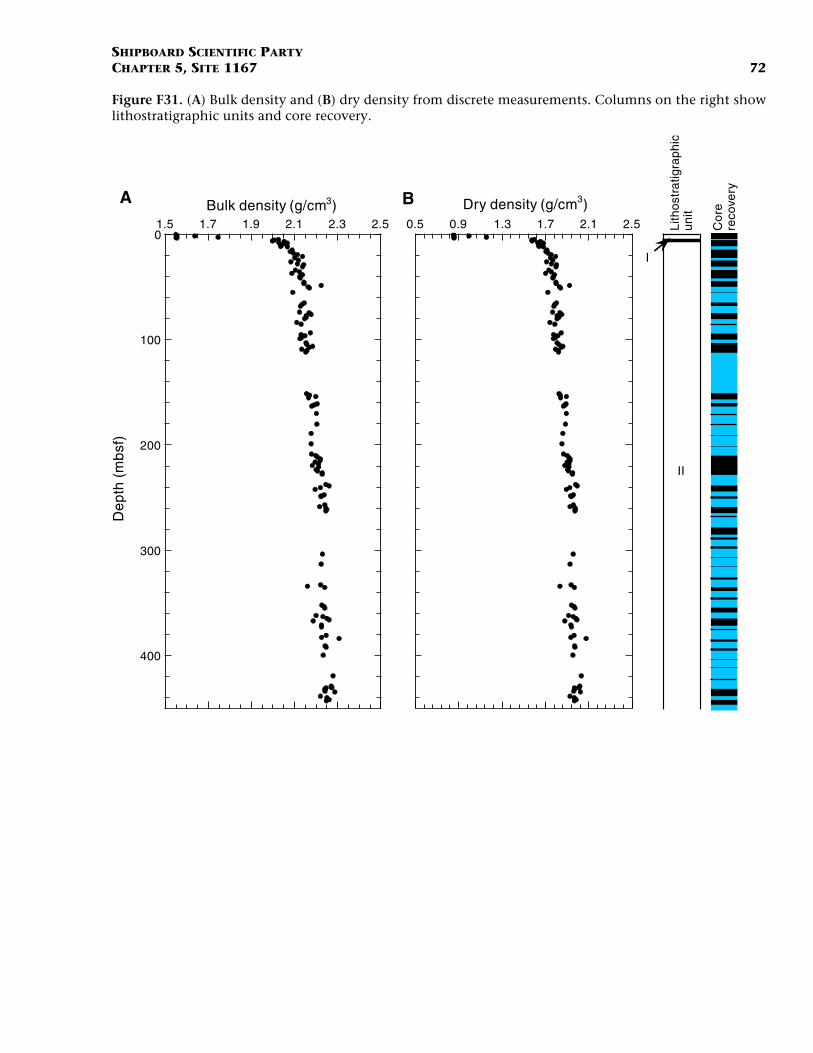
SHIPBOARD SCIENTIFIC PARTYCHAPTER 5, SITE 1167 72
Figure F31. (A) Bulk density and (B) dry density from discrete measurements. Columns on the right showlithostratigraphic units and core recovery.
0.5 0.9 1.3 1.7 2.1 2.5
Dry density (g/cm3)B
I
II
Lith
ostr
atig
raph
icun
it
Cor
ere
cove
ry
0
100
200
300
400
1.5 1.7 1.9 2.1 2.3 2.5
Dep
th (
mbs
f)
Bulk density (g/cm3)A
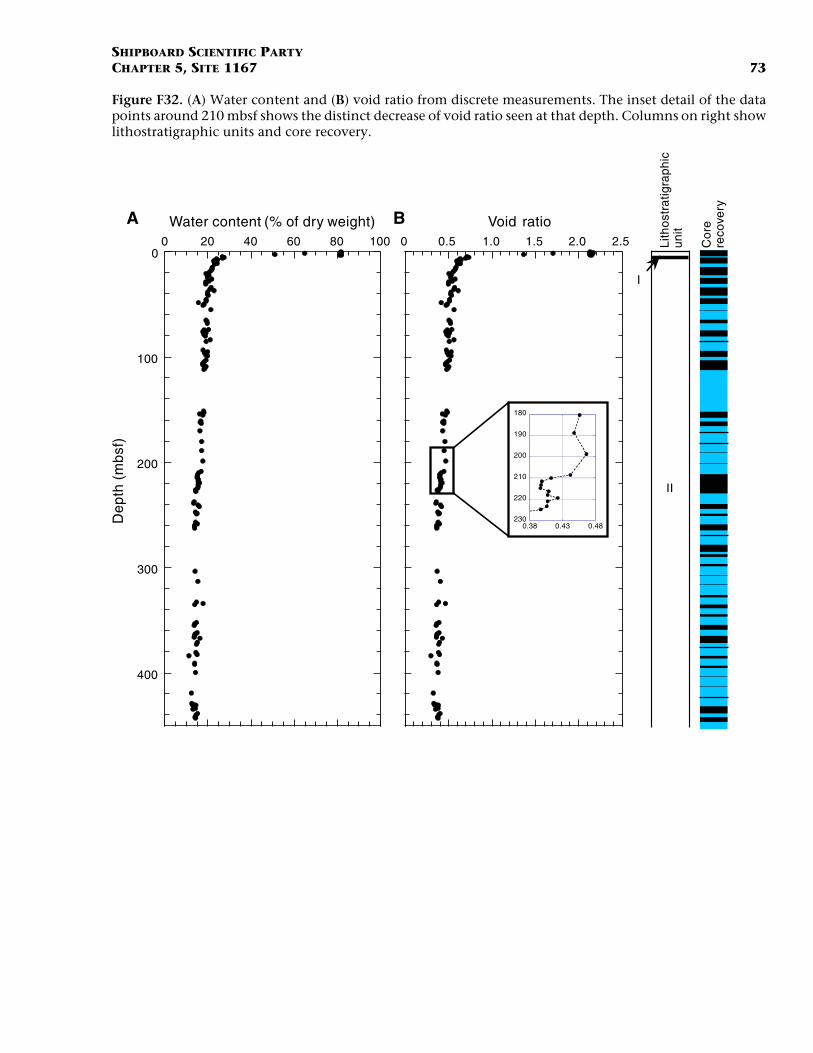
SHIPBOARD SCIENTIFIC PARTYCHAPTER 5, SITE 1167 73
Figure F32. (A) Water content and (B) void ratio from discrete measurements. The inset detail of the datapoints around 210 mbsf shows the distinct decrease of void ratio seen at that depth. Columns on right showlithostratigraphic units and core recovery.
0 0.5 1.0 1.5 2.0 2.5
Void ratioB
0.38 0.43 0.48
180
190
200
210
220
230
Lith
ostr
atig
raph
icun
it
I
II
Cor
ere
cove
ry
0
100
200
300
400
0 20 40 60 80 100
Dep
th (
mbs
f)
Water content (% of dry weight)A
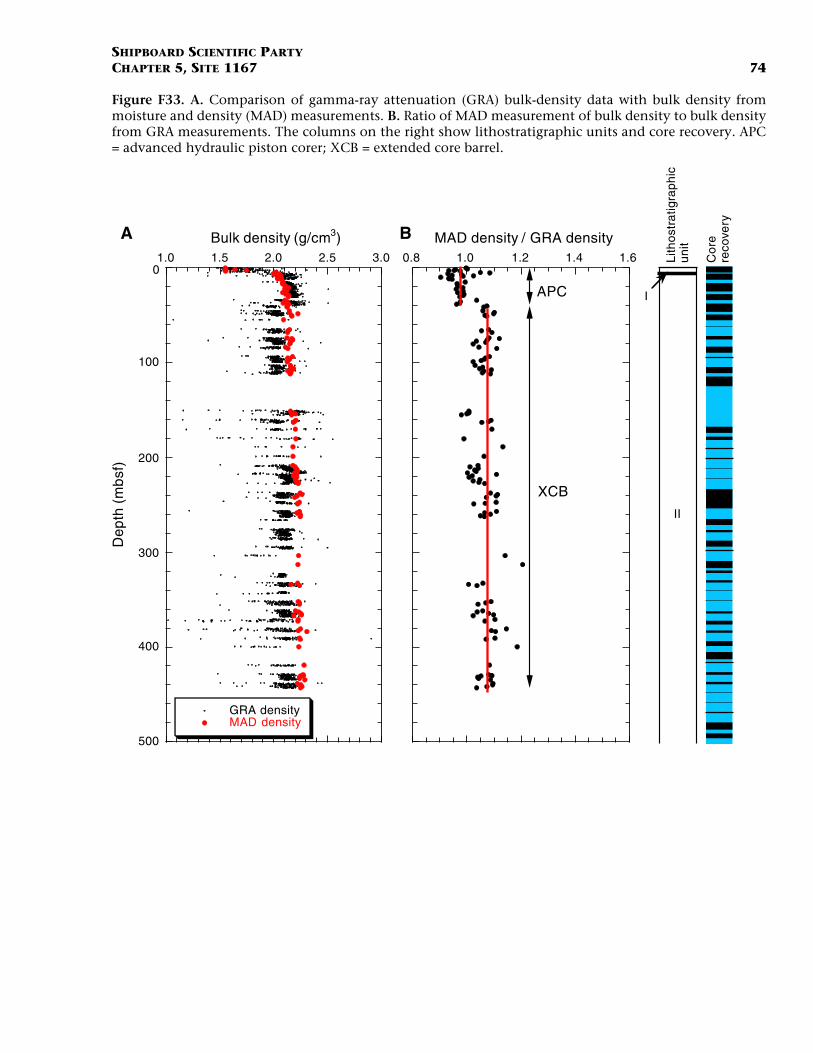
SHIPBOARD SCIENTIFIC PARTYCHAPTER 5, SITE 1167 74
Figure F33. A. Comparison of gamma-ray attenuation (GRA) bulk-density data with bulk density frommoisture and density (MAD) measurements. B. Ratio of MAD measurement of bulk density to bulk densityfrom GRA measurements. The columns on the right show lithostratigraphic units and core recovery. APC= advanced hydraulic piston corer; XCB = extended core barrel.
0.8 1.0 1.2 1.4 1.6
B MAD density / GRA density
APC
XCB
Lith
ostr
atig
raph
icun
it
I
II
Cor
ere
cove
ry
1.0 1.5 2.0 2.5 3.00
100
200
300
400
500
GRA density MAD density
Bulk density (g/cm3)
Dep
th (
mbs
f)
A
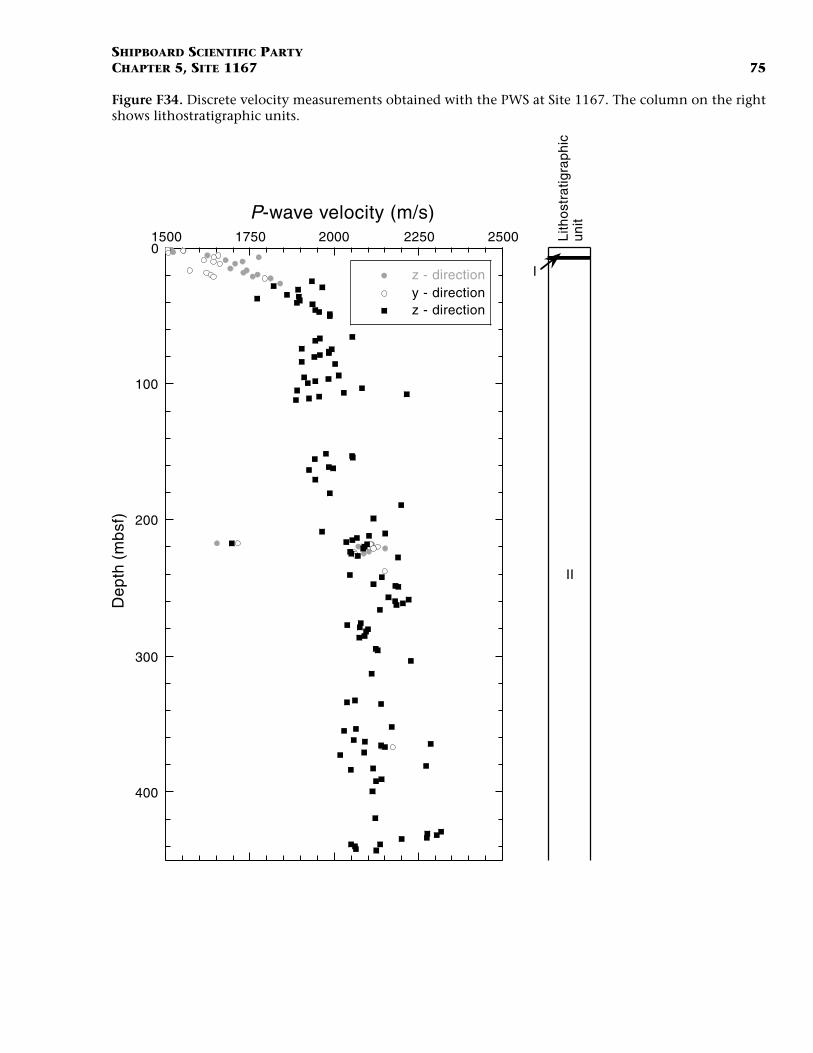
SHIPBOARD SCIENTIFIC PARTYCHAPTER 5, SITE 1167 75
Figure F34. Discrete velocity measurements obtained with the PWS at Site 1167. The column on the rightshows lithostratigraphic units.
1500 1750 2000 2250 25000
100
200
300
400
z - directiony - directionz - direction
P-wave velocity (m/s)
Dep
th (
mbs
f)
Lith
ostr
atig
raph
icun
it
I
II
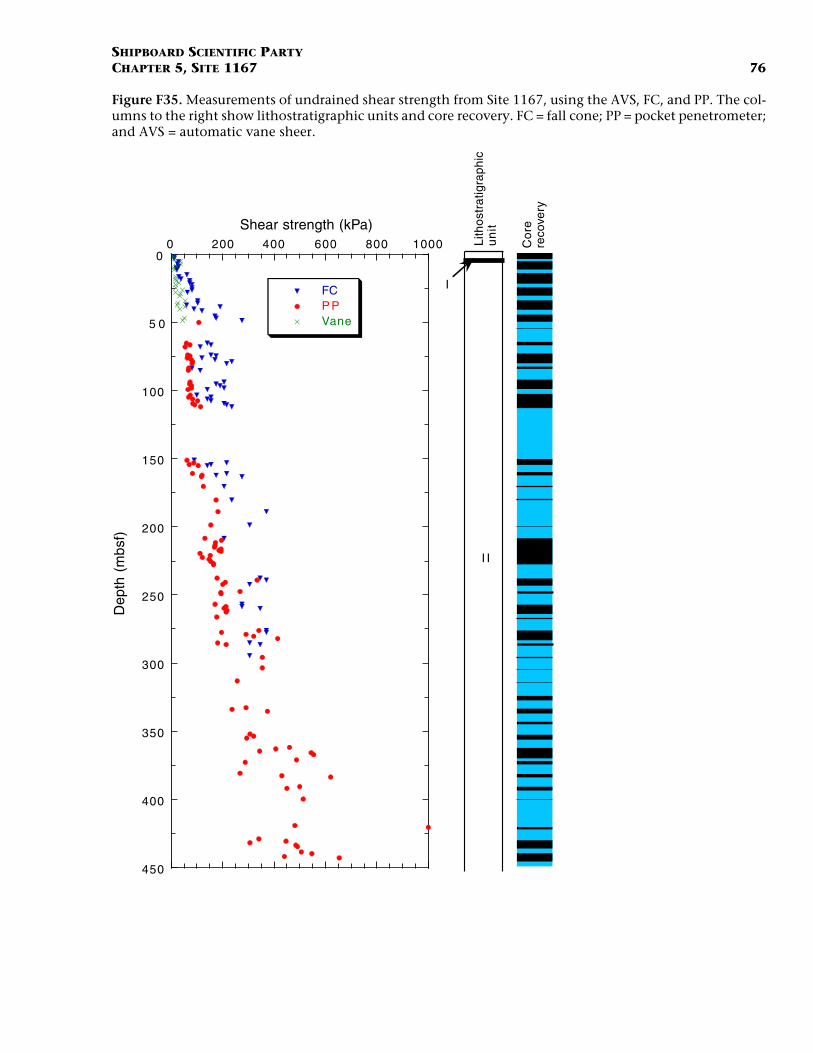
SHIPBOARD SCIENTIFIC PARTYCHAPTER 5, SITE 1167 76
Figure F35. Measurements of undrained shear strength from Site 1167, using the AVS, FC, and PP. The col-umns to the right show lithostratigraphic units and core recovery. FC = fall cone; PP = pocket penetrometer;and AVS = automatic vane sheer.
0 200 400 600 800 10000
5 0
100
150
200
250
300
350
400
450
FCP PVane
Shear strength (kPa)
Dep
th (
mbs
f)
Lith
ostr
atig
raph
icu
nit
I
I I
Co
rere
cove
ry

SHIPBOARD SCIENTIFIC PARTYCHAPTER 5, SITE 1167 77
Figure F36. Normalized undrained shear strength with respect to effective overburden pressure. The shadedarea shows the expected range for sediments of intermediate plasticity. The regions where advanced hy-draulic piston corer (APC) and extended core barrel (XCB) coring was used is indicated. The columns to theright show lithostratigraphic units and core recovery. FC = fall cone; PP = pocket penetrometer.
0 0.5 1.0 1.5 2.00
50
100
150
200
250
300
350
400
450
Normalized shear strength(Cu /p'0 )
FCPPVane
Dep
th (
mbs
f)
APC
XCB
I
II
Lith
ostr
atig
raph
icun
it
Cor
ere
cove
ry

SHIPBOARD SCIENTIFIC PARTYCHAPTER 5, SITE 1167 78
Figure F37. Thermal conductivity measurements from Site 1167. The columns on the right show litho-stratigraphic units and core recovery.
0 0.5 1.0 1.5 2.0 2.50
100
200
300
400
Thermal conductivity (W/[m·°C])
Dep
th (
mbs
f)
Lith
ostr
atig
raph
icu
nit
I
Co
rere
cove
ry

SHIPBOARD SCIENTIFIC PARTYCHAPTER 5, SITE 1167 79
Figure F38. Measured temperature vs. time from deployment of the Adara temperature tool for Core 188-1167A-4H (39.7 mbsf). TSF = seafloor temperature; APC = advanced hydraulic piston corer.
0
1
2
3
4
5
6
7
0 100 200 300 400 500 600 700 800
Calculated profile
Measured temperature
Mea
sure
d te
mpe
ratu
re (
°C)
Time (s)
Mudline temperature
TSF
= 0.09°C
APC fired into sediment
Heating spike due to friction
Stabilized sediment temperature (0.77°C)
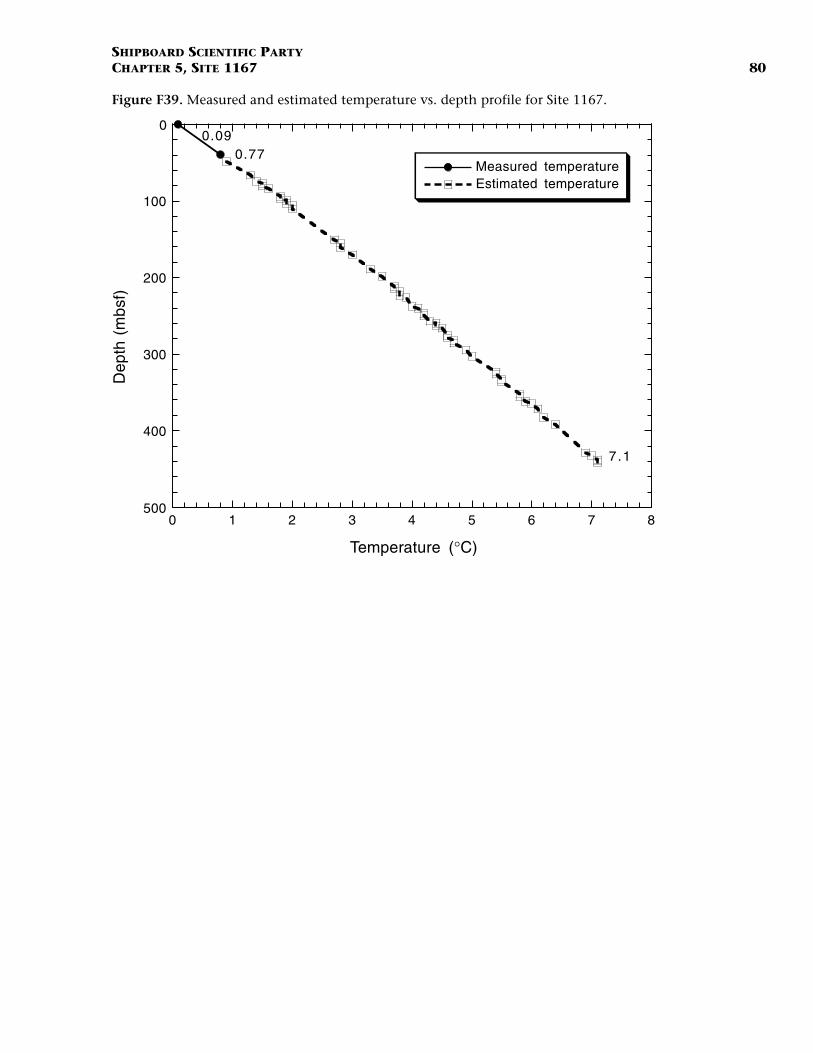
SHIPBOARD SCIENTIFIC PARTYCHAPTER 5, SITE 1167 80
Figure F39. Measured and estimated temperature vs. depth profile for Site 1167.
0 1 2 3 4 5 6 7 8
0
100
200
300
400
500
Measured temperatureEstimated temperature
Temperature (°C)
Dep
th (
mbs
f)0 .09
0.77
7.1
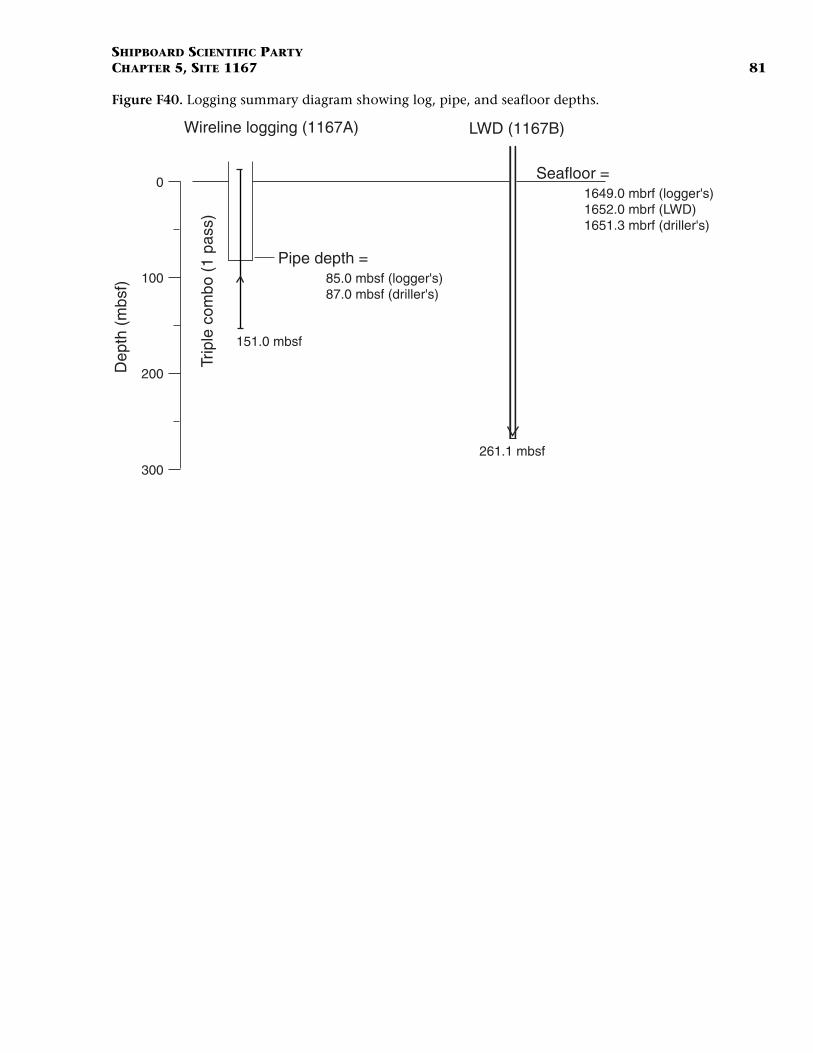
SHIPBOARD SCIENTIFIC PARTYCHAPTER 5, SITE 1167 81
Figure F40. Logging summary diagram showing log, pipe, and seafloor depths.
Trip
le c
ombo
(1
pass
)
151.0 mbsf
Pipe depth = 85.0 mbsf (logger's)87.0 mbsf (driller's)
Seafloor = 1649.0 mbrf (logger's)1652.0 mbrf (LWD)1651.3 mbrf (driller's)
Wireline logging (1167A) LWD (1167B)
261.1 mbsf
Dep
th (
mbs
f) 100
200
0
300

SHIPBOARD SCIENTIFIC PARTYCHAPTER 5, SITE 1167 82
Figure F41. Gamma-ray, resistivity, density, and porosity logs from the triple combo wireline tools andgamma ray and resistivity from the CDR LWD tool over the 85- to 150-mbsf interval that was covered byboth wireline logging and LWD.
12X
13X
14X
15X
16X
17X
18X
0 150(gAPI)Wireline (MSGR)
0 150(gAPI)LWD (GR)
1 3.5(Ωm)
Wireline medium (IMPM)
1 3.5(Ωm)Wireline shallow (SFLU)
1 3.5(Ωm)LWD deep (ATR)
1 3.5(Ωm)LWD shallow (PSR)
1 2.5(g/cm3)Density (RHOM) Porosity (APLC)
0 1(fraction) 1 6(barn/e–)PEF
Cor
e
Rec
over
y
2b
2c
Dep
th (
mbs
f)
1167A
90
110
130
100
120
140
150
Resistivity
Gamma ray

SHIPBOARD SCIENTIFIC PARTYCHAPTER 5, SITE 1167 83
Figure F42. Gamma-ray and resistivity logs and susceptibility measured on core samples. Thin shaded in-tervals = intervals of low resistivity interpreted as clays.
Cor
eR
ecov
ery
Loggingunit
1
2a
2b
2c
2d
1H
2H
3H
4H
5H6H7X
8X
9X
10X
11X
12X
13X
14X
15X
16X
17X
18X
19X
20X
21X
22X
23X
24X
25X
26X
27X
28X
29X
30X
0 150(gAPI)Wireline (MSGR)
0 150(gAPI)LWD (GR)
1 3.5(Ωm)Wireline medium (IMPH)
1 3.5(Ωm)LWD deep (ATR)
1 3.5(Ωm)LWD shallow (PSR)
0 350(SI)
Susceptibility
Clay Silt Sand
I
II
Lithostratigraphicunit
0
20
40
60
80
100
120
140
160
180
200
220
240
260
1167A
Dep
th (m
bsf)
Resistivity
Gamma ray

SHIPBOARD SCIENTIFIC PARTYCHAPTER 5, SITE 1167 84
Figure F43. Downhole temperatures from the TAP tool (see “Temperature Log,” p. 34, in “Downhole Mea-surements.”
1.0 1.5 2.0 2.5 3.0 3.5 4.0 4.5 5.0
0
50
100
150
Temperature (°C)
Dep
th (
mbs
f)
Pipe
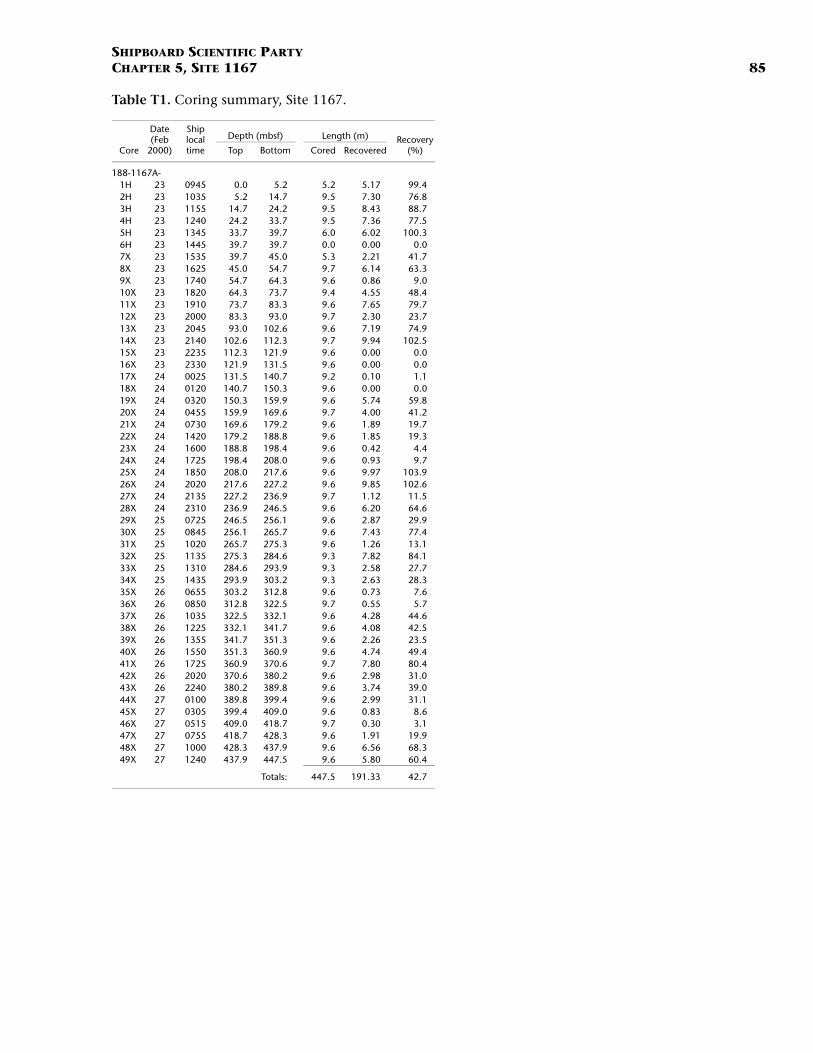
SHIPBOARD SCIENTIFIC PARTYCHAPTER 5, SITE 1167 85
Table T1. Coring summary, Site 1167.
Core
Date (Feb
2000)
Ship local time
Depth (mbsf) Length (m) Recovery (%) Top Bottom Cored Recovered
188-1167A-1H 23 0945 0.0 5.2 5.2 5.17 99.42H 23 1035 5.2 14.7 9.5 7.30 76.83H 23 1155 14.7 24.2 9.5 8.43 88.74H 23 1240 24.2 33.7 9.5 7.36 77.55H 23 1345 33.7 39.7 6.0 6.02 100.36H 23 1445 39.7 39.7 0.0 0.00 0.07X 23 1535 39.7 45.0 5.3 2.21 41.78X 23 1625 45.0 54.7 9.7 6.14 63.39X 23 1740 54.7 64.3 9.6 0.86 9.010X 23 1820 64.3 73.7 9.4 4.55 48.411X 23 1910 73.7 83.3 9.6 7.65 79.712X 23 2000 83.3 93.0 9.7 2.30 23.713X 23 2045 93.0 102.6 9.6 7.19 74.914X 23 2140 102.6 112.3 9.7 9.94 102.515X 23 2235 112.3 121.9 9.6 0.00 0.016X 23 2330 121.9 131.5 9.6 0.00 0.017X 24 0025 131.5 140.7 9.2 0.10 1.118X 24 0120 140.7 150.3 9.6 0.00 0.019X 24 0320 150.3 159.9 9.6 5.74 59.820X 24 0455 159.9 169.6 9.7 4.00 41.221X 24 0730 169.6 179.2 9.6 1.89 19.722X 24 1420 179.2 188.8 9.6 1.85 19.323X 24 1600 188.8 198.4 9.6 0.42 4.424X 24 1725 198.4 208.0 9.6 0.93 9.725X 24 1850 208.0 217.6 9.6 9.97 103.926X 24 2020 217.6 227.2 9.6 9.85 102.627X 24 2135 227.2 236.9 9.7 1.12 11.528X 24 2310 236.9 246.5 9.6 6.20 64.629X 25 0725 246.5 256.1 9.6 2.87 29.930X 25 0845 256.1 265.7 9.6 7.43 77.431X 25 1020 265.7 275.3 9.6 1.26 13.132X 25 1135 275.3 284.6 9.3 7.82 84.133X 25 1310 284.6 293.9 9.3 2.58 27.734X 25 1435 293.9 303.2 9.3 2.63 28.335X 26 0655 303.2 312.8 9.6 0.73 7.636X 26 0850 312.8 322.5 9.7 0.55 5.737X 26 1035 322.5 332.1 9.6 4.28 44.638X 26 1225 332.1 341.7 9.6 4.08 42.539X 26 1355 341.7 351.3 9.6 2.26 23.540X 26 1550 351.3 360.9 9.6 4.74 49.441X 26 1725 360.9 370.6 9.7 7.80 80.442X 26 2020 370.6 380.2 9.6 2.98 31.043X 26 2240 380.2 389.8 9.6 3.74 39.044X 27 0100 389.8 399.4 9.6 2.99 31.145X 27 0305 399.4 409.0 9.6 0.83 8.646X 27 0515 409.0 418.7 9.7 0.30 3.147X 27 0755 418.7 428.3 9.6 1.91 19.948X 27 1000 428.3 437.9 9.6 6.56 68.349X 27 1240 437.9 447.5 9.6 5.80 60.4
Totals: 447.5 191.33 42.7

SH
IPB
OA
RD
SC
IEN
TIFIC P
AR
TY
CH
AP
TE
R 5
, SIT
E 11
67
86
Table
Notes: C tology sample, IW = interstitial watersamp for geotechnical experiments. Only aporti
Core
Position: Water de
188-11671H
2H
3H
4H
5H
T2. Expanded coring summary, Site 1167.
C = core catcher (number in parentheses indicates which section the core catcher is stored with). NS = all of the core catcher was used for paleonle, HS = headspace sample, HSTL = headspace sample for shore-based investigation, PAL = paleontology sample, CARL = whole-round samples on of this table appears here. The complete table is available in ASCII format.
Date (Feb
2000)
Ship local time
Core depth (mbsf) Length (m) Recovery (%) Section
Length (m) Section depth (mbsf) Catwalk samples Comment Top Bottom Cored Recovered Liner Curated Top Bottom
66.40018°S, 17.28419°E pth (mbrf; APC calculation): 1651.3
A-23 0945 0.0 5.2 5.2 5.17 99.4
1 1.50 1.50 0.00 1.50 IW 2 1.50 1.50 1.50 3.00 IW 3 1.50 1.50 3.00 4.50 IW, HS 4 0.52 0.52 4.50 5.02 CC (NS) 0.15 0.15 5.02 5.17 PAL All to PAL
5.17 5.17
23 1035 5.2 14.7 9.5 7.30 76.8 1 1.50 1.50 5.20 6.70 IW 2 1.50 1.50 6.70 8.20 IW 3 1.50 1.50 8.20 9.70 IW 4 1.50 1.50 9.70 11.20 IW, HS 5 1.01 1.01 11.20 12.21 CC (w/5) 0.29 0.29 12.21 12.50 PAL
7.30 7.30
23 1155 14.7 24.2 9.5 8.43 88.7 1 1.50 1.50 14.70 16.20 IW 2 1.50 1.50 16.20 17.70 IW 3 1.50 1.50 17.70 19.20 IW 4 1.50 1.50 19.20 20.70 IW 5 1.50 1.50 20.70 22.20 HS, HSTL, IW 6 0.64 0.64 22.20 22.84 CC (w/6) 0.29 0.29 22.84 23.13 PAL
8.43 8.43
23 1240 24.2 33.7 9.5 7.36 77.5 1 1.50 1.50 24.20 25.70 IW 2 1.50 1.50 25.70 27.20 IW 3 1.50 1.50 27.20 28.70 IW 4 1.50 1.50 28.70 30.20 IW 5 1.17 1.17 30.20 31.37 HS CC (w/5) 0.19 0.19 31.37 31.56 PAL
7.36 7.36
23 1345 33.7 39.7 6.0 6.02 100.3 1 1.50 1.50 33.70 35.20 IW 2 1.50 1.50 35.20 36.70 IW 3 1.50 1.50 36.70 38.20 IW, PAL 4 1.15 1.15 38.20 39.35 HS

SHIPBOARD SCIENTIFIC PARTYCHAPTER 5, SITE 1167 87
Table T3. List of lonestone and dispersed granules, Site 1167.
Note: Only a portion of this table appears here. The complete table is available in ASCII format.
Core SectionDepth (cm)
Depth (mbsf) Lithology Angularity
Size (cm)
General shape Comments
188-1167A-1H 1 42 0.42 Quartzite/gneiss? Subangular 1.5 Ovoid Fe stained/gneissic banding1H 1 48 0.48 Quartzite/gneiss? Subrounded 1.5 Ovoid Fe stained/gneissic banding1H 1 86 0.86 Garnet gneiss Subangular 3 Pyramidal Weathered?1H 1 96 0.96 Pyroxene gneiss Subangular 2 Pyramidal Weathered?1H 1 102 1.02 Pyroxene gneiss Angular 3 Flat tabular1H 2 55 2.05 Granitic gneiss Angular 2 Triangular1H 2 71 2.21 Metasediment Subangular 3 Flat tabular Bedded, mica-schist and quartzite1H 2 134 2.84 Quartzite/gneiss Subangular 2 Ovoid Fe stained/gneissic banding1H 3 63 3.63 Pebble conglomerate Subrounded 2 Ovoid Weathered/Fe stained1H 3 64 3.64 Granite gneiss Subangular 3.5 Pyramidal1H 3 64 3.65 Pebble conglomerate Subrounded 1.5 Ovoid Weathered/Fe stained1H 4 22 4.72 Pyroxene gneiss Subangular 4 Blocky1H 4 30 4.80 Garnet gneiss Subangular 5 Blocky1H 4 30 4.81 Quartzite/gneiss Subangular 2 Flat tabular2H 1 94 6.14 Gneiss Subangular 1.5 Ovoid2H 2 23 6.93 Garnet gneiss Subangular 1.5 Ovoid2H 2 26 6.96 Coal clast Subrounded 0.5 Blocky2H 2 62 7.32 Quartzite/gneiss Subangular 4 Blocky Gneissic banding2H 2 114 7.84 Metasediment/schist Subrounded 2 Flat tabular2H 3 7 8.27 Coaly clast Subrounded 0.52H 3 90 9.10 Granite Subangular 2 Blocky2H 3 92 9.12 Granite Subangular 1.5 Blocky2H 3 144 9.64 Green quartzite? Subrounded 1.5 Ovoid2H 4 104 10.74 Granite Subangular 2 Blocky2H 5 26 11.46 Granite Subangular 1 Blocky2H CC 17 12.38 Biotite clast Subrounded 0.5 Flat ovoid3H 1 133 16.03 Pyrite clast 1 Flattened burrow? Pseudomorph after a burrow?3H 1 140 16.10 Garnet gneiss Subangular 4 Flat tabular3H 2 25 16.45 Green quartzite Angular 4 Blocky Metasandstone/thin section3H 2 50 16.70 2 × garnet gneiss Subangular 2 Blocky3H 2 107 17.27 Sandstone Subangular 3 Ovoid White/well cemented/quartzite?3H 3 40 18.10 Garnet gneiss Subangular 1 Blocky3H 3 45 18.15 Dark green quartzite? Subangular 3 Flat tabular Possible banding/thin section3H 3 103 18.73 Granite Subangular 1.5 Ovoid3H 3 104 18.74 Quartz clast Subangular 1 Blocky3H 6 40 22.60 Garnet gneiss Subangular 6 Blocky4H 1 26 24.46 Dark green quartzite? Angular 2 Platy Metamorphic4H 2 52 26.22 Quartzite? Subrounded 2 Ovoid Metamorphic?4H 2 120 26.90 Quartz Rounded 2 Spherical4H 3 52 27.72 Diorite Rounded 3 Elongate4H 3 99 28.19 Granite Angular 3 Square4H 4 50 29.20 Tonalite? Subangular 3 Triangular Igneous?4H 4 98 29.68 Gneiss Rounded 2 ~Spherical4H 5 1 30.21 Granite Subangular 2 Platy4H 5 31 30.51 Metamorphic? Angular 2 Platy Schist?5H 1 42 34.12 Quartzite? Subrounded 1 Ovoid5H 1 81 34.51 Claystone Rounded 2 Ovoid5H 1 90 34.60 Red granite Subangular 1 Spherical5H 1 95 34.65 Granite Subangular 1 Spherical5H 1 132 35.02 Quartzite? Subrounded 1 Ovoid5H 2 10 35.30 Pyrite clast Subangular 1 Ovoid5H 2 17 35.37 Pyrite clast Subangular 2 Ovoid5H 2 27 35.47 Pyrite clast Subangular 2 Ovoid5H 2 33 35.53 Pyrite clast Subrounded 1 Ovoid5H 2 80 36.00 Pyrite clast Subangular 2 Ovoid5H 2 122 36.42 Metamorphic? Subangular 3 Ovoid5H 3 75 37.45 Granite gneiss Subrounded 7 Ovoid5H 4 34 38.54 Intermediate igneous Subrounded 3 Quadratic5H 4 62 38.82 Schist Rounded 1 ~Spherical5H 5 21 39.56 Schist Subrounded 3 Oblate7X 1 33 40.03 Quartzite Rounded 5 Oblong7X 1 37 40.07 Gneiss Subrounded 3 ~Spherical7X 1 40 40.10 Dark, dense, unknown Subang. 4 Oblong7X 2 40 41.60 Tonalite Subrounded 3 Oblong7X 2 53 41.73 Tonalite Subrounded 2 Oblong8X 1 133 46.33 Granite gneiss Rounded 4 Oblong
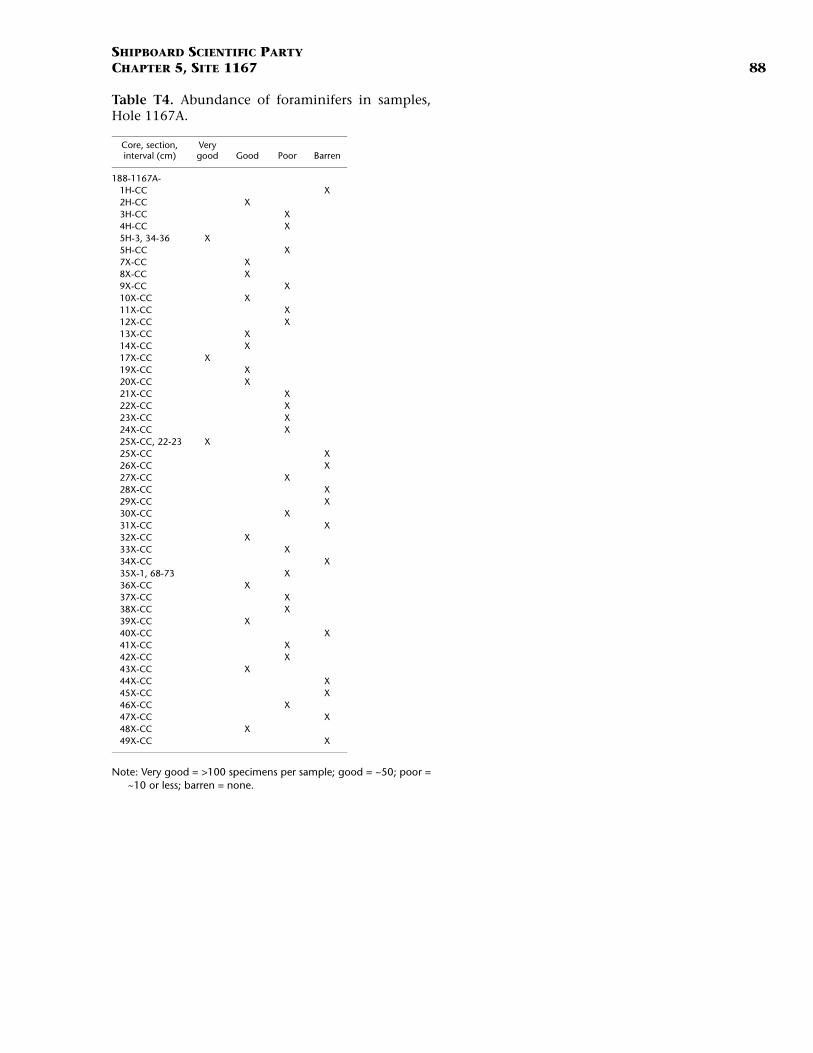
SHIPBOARD SCIENTIFIC PARTYCHAPTER 5, SITE 1167 88
Table T4. Abundance of foraminifers in samples,Hole 1167A.
Note: Very good = >100 specimens per sample; good = ~50; poor =~10 or less; barren = none.
Core, section, interval (cm)
Very good Good Poor Barren
188-1167A-1H-CC X2H-CC X3H-CC X4H-CC X5H-3, 34-36 X5H-CC X7X-CC X8X-CC X9X-CC X10X-CC X11X-CC X12X-CC X13X-CC X14X-CC X17X-CC X19X-CC X20X-CC X21X-CC X22X-CC X23X-CC X24X-CC X25X-CC, 22-23 X25X-CC X26X-CC X27X-CC X28X-CC X29X-CC X30X-CC X31X-CC X32X-CC X33X-CC X34X-CC X35X-1, 68-73 X36X-CC X37X-CC X38X-CC X39X-CC X40X-CC X41X-CC X42X-CC X43X-CC X44X-CC X45X-CC X46X-CC X47X-CC X48X-CC X49X-CC X
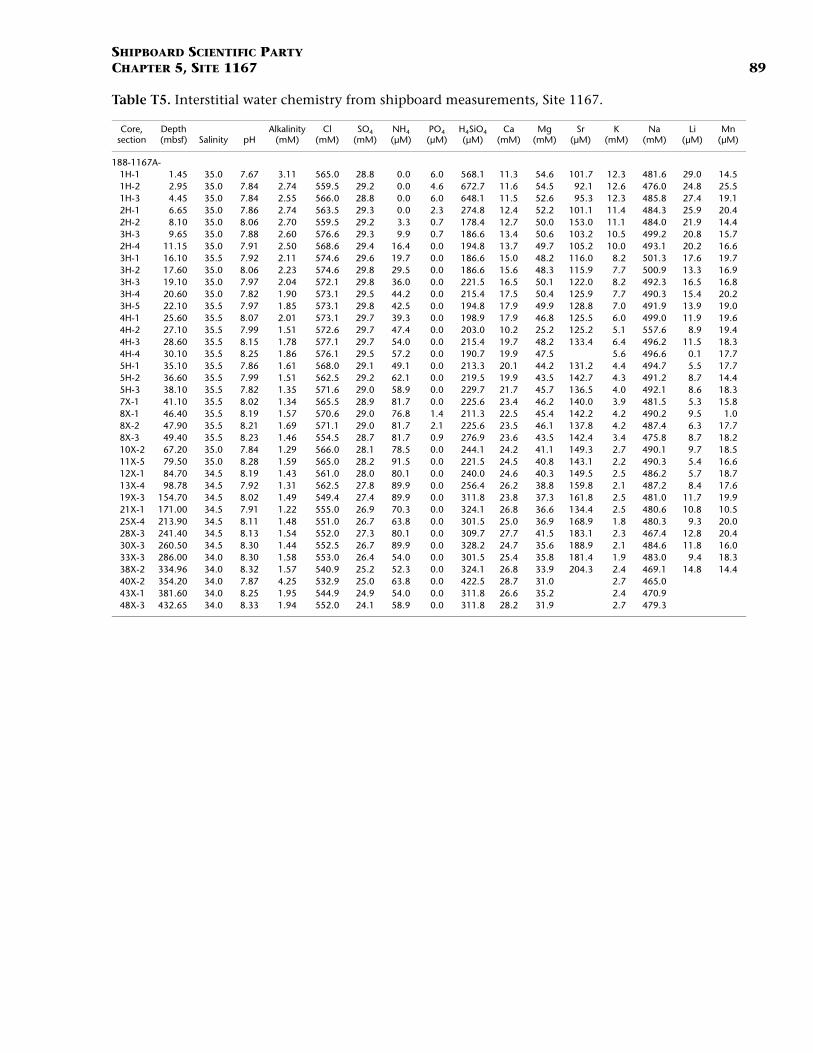
SHIPBOARD SCIENTIFIC PARTYCHAPTER 5, SITE 1167 89
Table T5. Interstitial water chemistry from shipboard measurements, Site 1167.
Core, section
Depth (mbsf) Salinity pH
Alkalinity (mM)
Cl (mM)
SO4 (mM)
NH4 (µM)
PO4 (µM)
H4SiO4(µM)
Ca (mM)
Mg (mM)
Sr (µM)
K (mM)
Na (mM)
Li (µM)
Mn (µM)
188-1167A-1H-1 1.45 35.0 7.67 3.11 565.0 28.8 0.0 6.0 568.1 11.3 54.6 101.7 12.3 481.6 29.0 14.51H-2 2.95 35.0 7.84 2.74 559.5 29.2 0.0 4.6 672.7 11.6 54.5 92.1 12.6 476.0 24.8 25.51H-3 4.45 35.0 7.84 2.55 566.0 28.8 0.0 6.0 648.1 11.5 52.6 95.3 12.3 485.8 27.4 19.12H-1 6.65 35.0 7.86 2.74 563.5 29.3 0.0 2.3 274.8 12.4 52.2 101.1 11.4 484.3 25.9 20.42H-2 8.10 35.0 8.06 2.70 559.5 29.2 3.3 0.7 178.4 12.7 50.0 153.0 11.1 484.0 21.9 14.43H-3 9.65 35.0 7.88 2.60 576.6 29.3 9.9 0.7 186.6 13.4 50.6 103.2 10.5 499.2 20.8 15.72H-4 11.15 35.0 7.91 2.50 568.6 29.4 16.4 0.0 194.8 13.7 49.7 105.2 10.0 493.1 20.2 16.63H-1 16.10 35.5 7.92 2.11 574.6 29.6 19.7 0.0 186.6 15.0 48.2 116.0 8.2 501.3 17.6 19.73H-2 17.60 35.0 8.06 2.23 574.6 29.8 29.5 0.0 186.6 15.6 48.3 115.9 7.7 500.9 13.3 16.93H-3 19.10 35.0 7.97 2.04 572.1 29.8 36.0 0.0 221.5 16.5 50.1 122.0 8.2 492.3 16.5 16.83H-4 20.60 35.0 7.82 1.90 573.1 29.5 44.2 0.0 215.4 17.5 50.4 125.9 7.7 490.3 15.4 20.23H-5 22.10 35.5 7.97 1.85 573.1 29.8 42.5 0.0 194.8 17.9 49.9 128.8 7.0 491.9 13.9 19.04H-1 25.60 35.5 8.07 2.01 573.1 29.7 39.3 0.0 198.9 17.9 46.8 125.5 6.0 499.0 11.9 19.64H-2 27.10 35.5 7.99 1.51 572.6 29.7 47.4 0.0 203.0 10.2 25.2 125.2 5.1 557.6 8.9 19.44H-3 28.60 35.5 8.15 1.78 577.1 29.7 54.0 0.0 215.4 19.7 48.2 133.4 6.4 496.2 11.5 18.34H-4 30.10 35.5 8.25 1.86 576.1 29.5 57.2 0.0 190.7 19.9 47.5 5.6 496.6 0.1 17.75H-1 35.10 35.5 7.86 1.61 568.0 29.1 49.1 0.0 213.3 20.1 44.2 131.2 4.4 494.7 5.5 17.75H-2 36.60 35.5 7.99 1.51 562.5 29.2 62.1 0.0 219.5 19.9 43.5 142.7 4.3 491.2 8.7 14.45H-3 38.10 35.5 7.82 1.35 571.6 29.0 58.9 0.0 229.7 21.7 45.7 136.5 4.0 492.1 8.6 18.37X-1 41.10 35.5 8.02 1.34 565.5 28.9 81.7 0.0 225.6 23.4 46.2 140.0 3.9 481.5 5.3 15.88X-1 46.40 35.5 8.19 1.57 570.6 29.0 76.8 1.4 211.3 22.5 45.4 142.2 4.2 490.2 9.5 1.08X-2 47.90 35.5 8.21 1.69 571.1 29.0 81.7 2.1 225.6 23.5 46.1 137.8 4.2 487.4 6.3 17.78X-3 49.40 35.5 8.23 1.46 554.5 28.7 81.7 0.9 276.9 23.6 43.5 142.4 3.4 475.8 8.7 18.210X-2 67.20 35.0 7.84 1.29 566.0 28.1 78.5 0.0 244.1 24.2 41.1 149.3 2.7 490.1 9.7 18.511X-5 79.50 35.0 8.28 1.59 565.0 28.2 91.5 0.0 221.5 24.5 40.8 143.1 2.2 490.3 5.4 16.612X-1 84.70 34.5 8.19 1.43 561.0 28.0 80.1 0.0 240.0 24.6 40.3 149.5 2.5 486.2 5.7 18.713X-4 98.78 34.5 7.92 1.31 562.5 27.8 89.9 0.0 256.4 26.2 38.8 159.8 2.1 487.2 8.4 17.619X-3 154.70 34.5 8.02 1.49 549.4 27.4 89.9 0.0 311.8 23.8 37.3 161.8 2.5 481.0 11.7 19.921X-1 171.00 34.5 7.91 1.22 555.0 26.9 70.3 0.0 324.1 26.8 36.6 134.4 2.5 480.6 10.8 10.525X-4 213.90 34.5 8.11 1.48 551.0 26.7 63.8 0.0 301.5 25.0 36.9 168.9 1.8 480.3 9.3 20.028X-3 241.40 34.5 8.13 1.54 552.0 27.3 80.1 0.0 309.7 27.7 41.5 183.1 2.3 467.4 12.8 20.430X-3 260.50 34.5 8.30 1.44 552.5 26.7 89.9 0.0 328.2 24.7 35.6 188.9 2.1 484.6 11.8 16.033X-3 286.00 34.0 8.30 1.58 553.0 26.4 54.0 0.0 301.5 25.4 35.8 181.4 1.9 483.0 9.4 18.338X-2 334.96 34.0 8.32 1.57 540.9 25.2 52.3 0.0 324.1 26.8 33.9 204.3 2.4 469.1 14.8 14.440X-2 354.20 34.0 7.87 4.25 532.9 25.0 63.8 0.0 422.5 28.7 31.0 2.7 465.043X-1 381.60 34.0 8.25 1.95 544.9 24.9 54.0 0.0 311.8 26.6 35.2 2.4 470.948X-3 432.65 34.0 8.33 1.94 552.0 24.1 58.9 0.0 311.8 28.2 31.9 2.7 479.3

SHIPBOARD SCIENTIFIC PARTYCHAPTER 5, SITE 1167 90
Table T6. Carbon, nitrogen, and sulfur analyses of sedi-ments, Site 1167.
Note: IC = inorganic carbon, CaCO3 = calcium carbonate, TC = total carbon,OC = organic carbon, TN = total nitrogen, TS = total sulfur.
Core, section, interval (cm)
Depth (mbsf)
IC (wt%)
CaCO3 (wt%)
TC (wt%)
OC (wt%)
TN (wt%)
TS (wt%) C/N
188-1167A-1H-1, 0-5 0.33 0.058 0.481H-3, 39-40 3.39 0.030 0.25 0.24 0.21 0.02 0.11 50.001H-4, 44-45 4.94 0.044 0.362H-1, 38-39 5.58 0.096 0.802H-3, 80-81 9.00 0.065 0.54 0.47 0.41 0.03 0.03 15.672H-5, 84-85 12.04 0.092 0.773H-5, 85-86 21.55 0.095 0.79 0.49 0.39 0.02 0.04 24.504H-1, 48-49 24.68 0.099 0.835H-1, 50-51 34.20 0.082 0.68 0.77 0.69 0.03 0 25.675H-3, 50-51 37.20 0.155 1.297X-1, 50-51 40.20 0.110 0.928X-1, 50-51 45.50 0.118 0.98 0.44 0.32 0.02 0.01 22.008X-3, 50-51 48.50 0.109 0.919X-1, 26-27 54.96 0.121 1.01 0.46 0.34 0.04 0.01 11.5010X-1,120-121 65.50 0.112 0.9310X-3,120-121 68.50 0.209 1.7411X-1, 30-31 74.00 0.096 0.8011X-3, 31-32 75.84 0.111 0.93 0.37 0.26 0.02 0.01 18.5011X-5, 29-30 78.39 0.008 0.0612X-1, 40-41 83.70 0.111 0.9313X-1, 39-40 93.39 0.115 0.96 0.46 0.34 0.04 0.02 11.5013X-3, 40-41 96.28 0.094 0.7913X-5, 39-40 99.27 0.116 0.9714X-1, 66-67 103.26 0.114 0.9514X-3, 71-72 106.31 0.096 0.80 0.46 0.36 0.04 0.02 11.5019X-1, 101-102 151.31 0.120 1.0019X-3, 83-84 154.13 0.382 3.1820X-3, 31-32 163.21 0.133 1.11 0.49 0.36 0.03 0.02 16.3321X-1, 65-66 170.25 0.079 0.6622X-1, 103-105 180.23 0.107 0.89 0.77 0.66 0.02 0 38.5025X-1, 125-126 209.25 0.408 3.4025X-4, 34-35 212.84 0.080 0.67 0.76 0.68 0.04 0 19.0025X-7, 16-17 217.16 0.087 0.7226X-1, 50-51 218.10 0.108 0.9026X-3, 50-51 221.10 0.148 1.2326X-5, 50-51 224.10 0.170 1.41 0.84 0.67 0.04 0 21.0027X-1, 50-51 227.58 0.103 0.8628X-2, 37-38 238.77 0.099 0.8328X-4, 39-40 241.89 0.087 0.73 0.65 0.56 0.03 0 21.6729X-1, 85-86 247.35 0.088 0.7429X-2, 42-43 248.42 0.058 0.4930X-1, 73-74 256.83 0.087 0.72 0.52 0.43 0.02 0 26.0030X-3, 66-67 259.76 0.063 0.5330X-5, 47-48 262.57 0.156 1.3031X-1, 55-56 266.25 0.104 0.8632X-3, 73-74 279.03 0.064 0.54 1.06 0.99 0.03 0 35.3333X-2, 43-44 286.53 0.093 0.7734X-2, 39-40 295.79 0.114 0.9535X-1, 37-38 303.57 0.114 0.95 0.44 0.32 0.02 0 22.0038X-1, 59-60 332.69 0.157 1.31 0.53 0.37 0.02 0.03 26.5038X-3, 28-29 335.34 0.122 1.0140X-2, 64-65 353.44 0.111 0.93 0.52 0.41 0.02 0 26.0042X-2, 69-70 372.79 0.126 1.05 0.55 0.42 0.02 0 27.5043X-2, 104-105 382.74 0.137 1.14 0.82 0.68 0.03 0 27.3344X-1, 47-48 390.27 0.116 0.97 0.49 0.37 0.03 0 16.3345X-1, 42-43 399.82 0.105 0.88 0.45 0.34 0.02 0 22.5046X-CC, 4-5 409.04 0.084 0.70 0.93 0.85 0.02 0 46.5047X-1, 56-57 419.26 0.111 0.92 0.53 0.42 0.02 0 26.5047X-CC, 40-41 420.49 0.122 1.0248X-1, 84-85 429.14 0.087 0.7348X-2, 35-38 430.15 0.105 0.8748X-4, 79-80 433.59 0.098 0.81 0.50 0.40 0.50 0 1.0049X-1, 70-71 438.60 0.098 0.8249X-3, 101-102 441.91 0.091 0.76 0.50 0.41 0.70 0 0.7149X-4, 54-55 442.94 0.085 0.71

SHIPBOARD SCIENTIFIC PARTYCHAPTER 5, SITE 1167 91
Table T7. Organic carbon and Rock-Eval pyrolysis on se-lected samples, Site 1167.
Note: For explanation of column headings, see “Organic Matter Charac-terization,” p. 21, in “Organic Geochemistry,” in the “ExplanatoryNotes” chapter.
Core, section, interval (cm)
Depth(mbsf)
OC wt%
S1 (mg/g)
S2 (mg/g)
S3 (mg/g)
HI (mg/g C)
Tmax (°C)
188-1167A-5H-1, 50-51 34.20 0.69 0.02 0.12 0.14 17 51514X-3, 71-72 106.31 0.40 0.02 0.09 0.20 23 53422X-1, 103-105 180.23 0.66 0.12 0.18 0.40 27 48025X-4, 34-35 212.84 0.68 0.08 0.21 0.29 31 46226X-5, 50-51 224.10 0.67 0.08 0.13 0.40 19 48028X-4, 39-40 241.89 0.56 0.15 0.21 0.42 38 45132X-3, 73-74 279.03 0.99 0.12 0.21 0.37 21 48043X-2, 104-105 382.74 0.68 0.16 0.15 0.53 22 46546X-CC, 4-5 409.04 0.88 0.15 0.21 0.42 24 471

SHIPBOARD SCIENTIFIC PARTYCHAPTER 5, SITE 1167 92
Table T8. Discrete P-wave measurements, Site 1167.
Core, section, interval (cm)
Depth (mbsf) Direction
Velocity (m/s)
Core temperature
(°C) Method
188-1167A-1H-1, 125.3 1.25 y 1505 20.8 PWS21H-1, 125.2 1.25 z 1516 20.1 PWS11H-2, 45.1 1.95 y 1551 21.1 PWS21H-2, 44.8 1.95 z 1553 20.0 PWS11H-3, 26.3 3.26 z 1522 20.0 PWS11H-3, 28.1 3.28 y 1507 21.1 PWS22H-1, 36.4 5.56 y 1656 18.1 PWS22H-1, 36.4 5.56 z 1623 18.0 PWS12H-2, 33.4 7.03 y 1643 17.9 PWS22H-2, 33.3 7.03 z 1776 17.9 PWS12H-3, 76.5 8.97 z 1678 19.1 PWS12H-3, 77.7 8.98 y 1613 19.2 PWS22H-4, 32.5 10.02 y 1641 19.2 PWS22H-4, 32.4 10.02 z 1728 19.3 PWS12H-5, 34.4 11.54 y 1659 19.3 PWS22H-5, 33.7 11.54 z 1706 19.2 PWS13H-1, 35.1 15.05 z 1692 19.7 PWS13H-2, 35.4 16.55 z 1740 20.2 PWS13H-2, 36.4 16.56 y 1572 20.1 PWS23H-3, 36.1 18.06 y 1621 19.8 PWS23H-3, 36.3 18.06 z 1731 19.8 PWS13H-4, 31.0 19.51 z 1772 19.9 PWS13H-4, 32.9 19.53 y 1634 19.9 PWS23H-5, 38.0 21.08 z 1758 20.0 PWS13H-5, 40.2 21.10 y 1642 20.1 PWS23H-6, 19.9 22.40 y 1794 20.5 PWS23H-6, 19.9 22.40 z 1811 20.4 PWS14H-1, 36.9 24.57 x 1934 23.6 PWS34H-2, 45.5 26.16 z 1840 20.8 PWS14H-3, 81.2 28.01 x 1820 20.6 PWS34H-4, 38.9 29.09 x 1965 20.2 PWS34H-5, 54.3 30.74 x 1893 20.0 PWS35H-1, 54.2 34.24 x 1860 20.3 PWS35H-2, 58.4 35.78 x 1895 20.8 PWS35H-3, 55.4 37.25 x 1771 21.0 PWS35H-4, 43.9 38.64 x 1898 20.9 PWS37X-1, 50.1 40.20 x 1889 21.1 PWS37X-2, 25.7 41.46 x 1936 20.7 PWS38X-1, 55.5 45.56 x 1944 20.7 PWS38X-2, 48.2 46.98 x 1955 20.4 PWS38X-3, 62.1 48.62 x 1987 20.6 PWS38X-4, 60.0 50.10 x 1987 23.2 PWS310X-1, 97.8 65.28 x 2054 19.5 PWS310X-2, 74.2 66.54 x 1958 19.8 PWS310X-3, 79.4 68.09 x 1944 19.5 PWS311X-1, 27.8 73.98 x 1903 21.0 PWS311X-2, 60.5 74.64 x 1992 20.1 PWS311X-3, 55.9 76.09 x 1984 20.1 PWS311X-4, 67.4 77.27 x 1984 20.4 PWS311X-5, 68.9 78.79 x 1957 20.3 PWS311X-6, 69.2 80.29 x 1941 20.5 PWS312X-1, 44.4 83.74 x 1904 20.6 PWS312X-2, 58.0 85.38 x 2003 19.7 PWS313X-1, 75.1 93.75 x 2013 20.1 PWS313X-2, 77.3 95.27 x 1911 20.0 PWS313X-3, 58.9 96.47 x 1983 19.7 PWS313X-4, 71.8 98.10 x 1944 20.0 PWS313X-5, 35.7 99.24 x 1922 20.5 PWS314X-1, 66.2 103.26 x 2082 19.4 PWS314X-2, 69.9 104.80 x 1890 19.3 PWS314X-3, 74.6 106.35 x 2028 19.4 PWS314X-4, 57.0 107.67 x 2215 20.4 PWS314X-5, 70.8 109.31 x 1955 20.4 PWS314X-6, 49.9 110.60 x 1925 20.6 PWS314X-7, 17.1 111.77 x 1886 20.5 PWS319X-1, 98.3 151.28 x 1976 20.4 PWS319X-2, 113.0 152.93 x 2053 20.6 PWS3
Notes: PWS1 = P-wave sensor 1, PWS2 = P-wave sensor 2, PWS3 =P-wave sensor 3. Only a portion of this table appears here. Thecomplete table is available in ASCII format.
19X-3, 83.7 154.14 x 2055 20.3 PWS319X-4, 39.4 155.19 x 1942 19.7 PWS320X-1, 115.2 161.05 x 1984 19.7 PWS320X-2, 71.0 162.11 x 1997 19.1 PWS320X-3, 33.1 163.23 x 1925 19.0 PWS321X-1, 68.8 170.29 x 1944 18.5 PWS322X-1, 120.8 180.41 x 1987 19.8 PWS323X-1, 17.1 188.97 x 2199 20.6 PWS324X-1, 42.4 198.82 x 2117 19.7 PWS325X-1, 57.1 208.57 x 1964 20.1 PWS325X-2, 54.7 210.05 x 2152 20.6 PWS325X-3, 57.9 211.58 x 2103 20.6 PWS325X-4, 83.5 213.34 x 2067 20.3 PWS325X-5, 81.7 214.82 x 2054 20.2 PWS325X-6, 84.3 216.34 x 2036 19.7 PWS325X-7, 27.0 217.27 x 1695 20.0 PWS325X-7, 27.0 217.27 z 1652 19.8 PWS325X-7, 27.0 217.27 y 1714 19.7 PWS326X-1, 38.0 217.98 x 2098 22.5 PWS326X-1, 38.0 217.98 z 2113 22.6 PWS326X-1, 38.0 217.98 y 2109 22.5 PWS326X-2, 37.0 219.47 x 2090 22.5 PWS326X-2, 37.0 219.47 z 2072 22.5 PWS326X-2, 37.0 219.47 y 2129 22.6 PWS326X-3, 37.0 220.97 x 2086 22.7 PWS326X-3, 37.0 220.97 z 2152 22.7 PWS326X-3, 37.0 220.97 y 2117 22.6 PWS326X-4, 122.0 223.32 x 2048 22.7 PWS326X-4, 122.0 223.32 z 2103 22.6 PWS326X-4, 122.0 223.32 y 2058 22.7 PWS326X-5, 122.0 224.82 x 2051 22.6 PWS326X-5, 122.0 224.82 z 2088 22.6 PWS326X-5, 122.0 224.82 y 2063 22.6 PWS326X-6, 122.0 226.32 x 2070 22.6 PWS326X-6, 122.0 226.32 z 2070 22.6 PWS326X-6, 122.0 226.32 y 2065 22.7 PWS327X-1, 51.2 227.71 x 2190 20.2 PWS328X-1, 67.0 237.57 y 2151 18.8 PWS328X-2, 75.4 239.15 x 2570 19.2 PWS328X-3, 75.0 240.65 x 2047 18.7 PWS328X-4, 76.1 242.26 x 2141 19.0 PWS329X-1, 85.9 247.36 x 2117 20.3 PWS329X-2, 44.2 248.44 x 2182 20.3 PWS329X-CC, 19.7 249.10 x 2191 20.2 PWS330X-1, 75.7 256.86 x 2161 20.9 PWS330X-2, 87.8 258.48 x 2221 20.4 PWS330X-3, 70.0 259.80 x 2181 22.8 PWS330X-4, 86.4 261.46 x 2204 19.5 PWS330X-5, 49.8 262.60 x 2185 19.3 PWS331X-1, 46.3 266.16 x 2136 21.2 PWS332X-1, 74.2 276.04 x 2079 20.7 PWS332X-2, 65.0 277.45 x 2039 19.9 PWS332X-3, 72.5 279.02 x 2076 19.7 PWS332X-4, 52.8 280.33 x 2101 19.5 PWS332X-5, 76.2 282.06 x 2095 19.8 PWS333X-1, 64.6 285.25 x 2090 19.7 PWS333X-2, 50.4 286.60 x 2075 19.6 PWS334X-1, 69.5 294.60 x 2123 20.1 PWS334X-2, 42.3 295.82 x 2129 19.9 PWS335X-1, 32.9 303.53 x 2228 18.5 PWS336X-CC, 21.4 313.01 x 2111 17.9 PWS338X-1, 61.1 332.71 x 2062 20.0 PWS338X-2, 47.3 334.07 x 2038 20.4 PWS338X-3, 32.5 335.39 x 2139 20.3 PWS3
Core, section, interval (cm)
Depth (mbsf) Direction
Velocity (m/s)
Core temperature
(°C) Method

SHIPBOARD SCIENTIFIC PARTYCHAPTER 5, SITE 1167 93
Table T9. Measurements of undrained shear strength, Site 1167.
Automated vane shear data Fall cone data
Pocket penetrometer data
Depth (mbsf)
Cu (kPa)
Depth (mbsf)
Cu (kPa)
Depth (mbsf)
Cu (kPa)
1.25 5.21 1.95 12.00 50.10 106.671.95 10.20 3.30 11.00 65.28 58.333.28 11.09 5.52 28.00 66.54 71.675.58 34.60 7.02 24.00 68.09 53.337.08 34.60 8.98 28.00 73.98 63.338.95 19.52 10.02 18.00 74.64 71.67
10.05 9.09 11.53 22.00 76.09 61.6711.45 10.98 15.05 60.00 77.27 76.6716.54 15.97 16.53 30.00 78.79 82.5016.54 15.97 18.06 38.00 80.29 80.0018.09 16.08 19.46 72.00 83.76 67.5019.53 20.18 21.10 72.00 85.38 65.8321.07 29.39 22.40 80.00 93.75 72.5022.40 16.74 24.69 80.00 95.27 70.0024.57 17.41 26.24 80.00 96.47 78.3326.26 42.91 27.93 62.00 98.10 78.3327.97 15.86 34.18 103.00 99.24 65.0029.03 34.49 35.82 103.00 103.26 73.3330.57 32.60 37.26 59.00 104.80 67.5034.20 53.67 38.58 190.00 106.35 82.5035.81 25.39 40.28 88.00 107.60 101.6737.27 22.62 41.52 119.00 109.35 83.3338.59 53.11 45.32 170.00 110.50 90.8340.30 33.16 47.02 175.00 111.85 113.3340.30 33.16 48.54 275.00 151.28 60.0047.03 51.23 65.28 140.00 152.93 87.3348.56 44.24 66.54 155.00 154.14 69.17
68.09 113.00 155.19 105.0073.98 155.00 161.05 81.6774.64 175.00 162.11 119.1776.09 119.00 163.23 116.6777.27 170.00 170.29 125.0078.79 235.00 180.40 175.0080.29 215.00 188.95 180.8383.76 80.00 198.78 153.3385.38 113.00 208.58 130.8393.75 205.00 210.09 195.0095.27 175.00 211.59 171.6796.47 190.00 213.38 170.0098.10 205.00 214.89 168.3399.24 140.00 216.35 193.33
103.26 99.00 217.30 185.00104.80 155.00 218.00 193.33106.35 140.00 219.50 111.67107.60 155.00 221.00 151.67109.35 205.00 222.50 120.00110.50 215.00 224.00 146.67111.85 235.00 225.50 153.33151.28 89.00 226.90 163.33152.93 215.00 227.75 164.17154.14 155.00 237.63 177.50155.19 140.00 239.04 333.33161.05 215.00 240.69 210.00
Note: This table is also available in ASCII format.
162.11 175.00 242.30 200.00163.23 275.00 247.35 266.67170.29 205.00 248.44 192.50180.40 235.00 249.10 193.33188.95 370.00 256.86 170.00198.78 305.00 258.46 211.67208.58 205.00 259.75 205.00237.58 345.00 261.43 216.67239.04 370.00 262.55 213.33242.30 305.00 266.17 176.67256.86 275.00 276.00 340.00258.46 275.00 277.40 195.00259.96 345.00 279.00 290.00276.00 370.00 280.38 320.00277.40 370.00 282.00 413.33285.20 305.00 285.20 180.00286.55 345.00 286.55 213.33294.55 305.00 295.80 353.33
303.53 353.33313.03 256.67332.65 290.00334.05 236.67335.36 373.33352.15 306.67353.45 320.00355.02 293.33361.81 460.00363.10 406.67364.59 343.33365.97 543.33367.20 553.33371.08 486.67372.78 286.67380.84 266.67382.74 430.00383.69 620.00390.70 500.00392.03 450.00399.74 513.33419.20 480.00420.49 1000.00429.15 340.00430.67 446.67431.90 306.67433.60 483.33434.65 490.00438.62 506.67439.85 546.67442.00 440.00443.00 653.33
Automated vane shear data Fall cone data
Pocket penetrometer data
Depth (mbsf)
Cu (kPa)
Depth (mbsf)
Cu (kPa)
Depth (mbsf)
Cu (kPa)
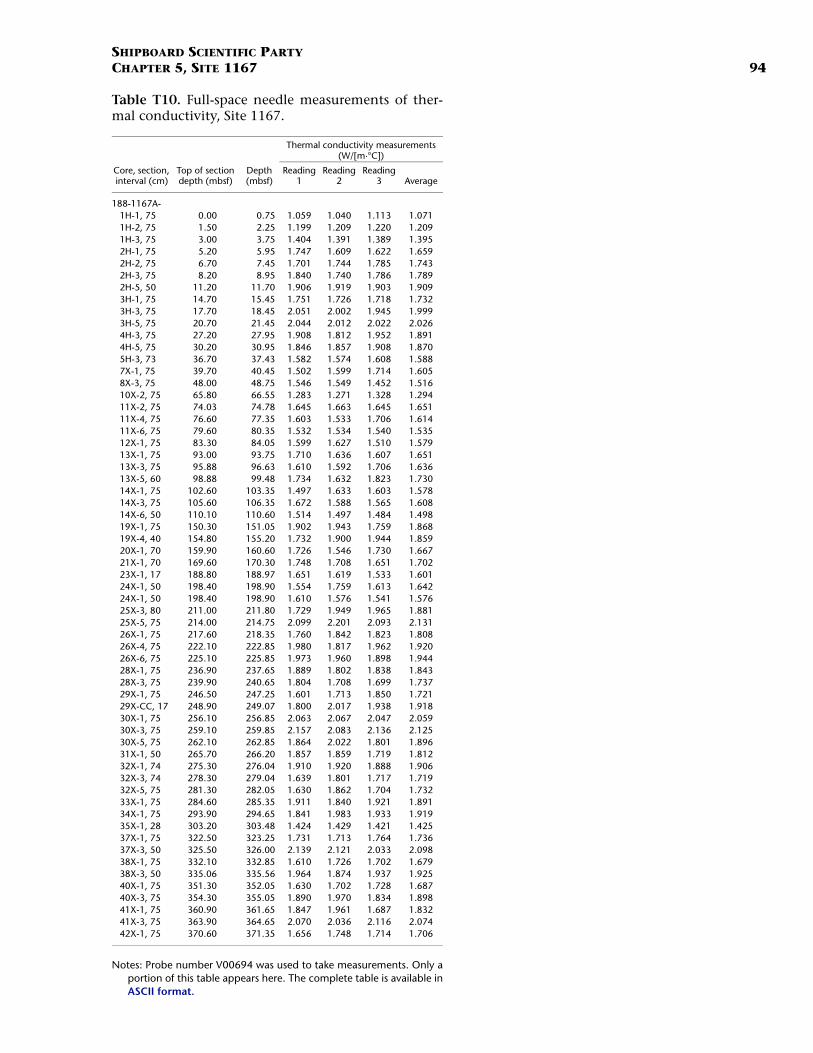
SHIPBOARD SCIENTIFIC PARTYCHAPTER 5, SITE 1167 94
Table T10. Full-space needle measurements of ther-mal conductivity, Site 1167.
Notes: Probe number V00694 was used to take measurements. Only aportion of this table appears here. The complete table is available inASCII format.
Core, section, interval (cm)
Top of section depth (mbsf)
Depth (mbsf)
Thermal conductivity measurements (W/[m·°C])
Reading 1
Reading 2
Reading 3 Average
188-1167A-1H-1, 75 0.00 0.75 1.059 1.040 1.113 1.0711H-2, 75 1.50 2.25 1.199 1.209 1.220 1.2091H-3, 75 3.00 3.75 1.404 1.391 1.389 1.3952H-1, 75 5.20 5.95 1.747 1.609 1.622 1.6592H-2, 75 6.70 7.45 1.701 1.744 1.785 1.7432H-3, 75 8.20 8.95 1.840 1.740 1.786 1.7892H-5, 50 11.20 11.70 1.906 1.919 1.903 1.9093H-1, 75 14.70 15.45 1.751 1.726 1.718 1.7323H-3, 75 17.70 18.45 2.051 2.002 1.945 1.9993H-5, 75 20.70 21.45 2.044 2.012 2.022 2.0264H-3, 75 27.20 27.95 1.908 1.812 1.952 1.8914H-5, 75 30.20 30.95 1.846 1.857 1.908 1.8705H-3, 73 36.70 37.43 1.582 1.574 1.608 1.5887X-1, 75 39.70 40.45 1.502 1.599 1.714 1.6058X-3, 75 48.00 48.75 1.546 1.549 1.452 1.51610X-2, 75 65.80 66.55 1.283 1.271 1.328 1.29411X-2, 75 74.03 74.78 1.645 1.663 1.645 1.65111X-4, 75 76.60 77.35 1.603 1.533 1.706 1.61411X-6, 75 79.60 80.35 1.532 1.534 1.540 1.53512X-1, 75 83.30 84.05 1.599 1.627 1.510 1.57913X-1, 75 93.00 93.75 1.710 1.636 1.607 1.65113X-3, 75 95.88 96.63 1.610 1.592 1.706 1.63613X-5, 60 98.88 99.48 1.734 1.632 1.823 1.73014X-1, 75 102.60 103.35 1.497 1.633 1.603 1.57814X-3, 75 105.60 106.35 1.672 1.588 1.565 1.60814X-6, 50 110.10 110.60 1.514 1.497 1.484 1.49819X-1, 75 150.30 151.05 1.902 1.943 1.759 1.86819X-4, 40 154.80 155.20 1.732 1.900 1.944 1.85920X-1, 70 159.90 160.60 1.726 1.546 1.730 1.66721X-1, 70 169.60 170.30 1.748 1.708 1.651 1.70223X-1, 17 188.80 188.97 1.651 1.619 1.533 1.60124X-1, 50 198.40 198.90 1.554 1.759 1.613 1.64224X-1, 50 198.40 198.90 1.610 1.576 1.541 1.57625X-3, 80 211.00 211.80 1.729 1.949 1.965 1.88125X-5, 75 214.00 214.75 2.099 2.201 2.093 2.13126X-1, 75 217.60 218.35 1.760 1.842 1.823 1.80826X-4, 75 222.10 222.85 1.980 1.817 1.962 1.92026X-6, 75 225.10 225.85 1.973 1.960 1.898 1.94428X-1, 75 236.90 237.65 1.889 1.802 1.838 1.84328X-3, 75 239.90 240.65 1.804 1.708 1.699 1.73729X-1, 75 246.50 247.25 1.601 1.713 1.850 1.72129X-CC, 17 248.90 249.07 1.800 2.017 1.938 1.91830X-1, 75 256.10 256.85 2.063 2.067 2.047 2.05930X-3, 75 259.10 259.85 2.157 2.083 2.136 2.12530X-5, 75 262.10 262.85 1.864 2.022 1.801 1.89631X-1, 50 265.70 266.20 1.857 1.859 1.719 1.81232X-1, 74 275.30 276.04 1.910 1.920 1.888 1.90632X-3, 74 278.30 279.04 1.639 1.801 1.717 1.71932X-5, 75 281.30 282.05 1.630 1.862 1.704 1.73233X-1, 75 284.60 285.35 1.911 1.840 1.921 1.89134X-1, 75 293.90 294.65 1.841 1.983 1.933 1.91935X-1, 28 303.20 303.48 1.424 1.429 1.421 1.42537X-1, 75 322.50 323.25 1.731 1.713 1.764 1.73637X-3, 50 325.50 326.00 2.139 2.121 2.033 2.09838X-1, 75 332.10 332.85 1.610 1.726 1.702 1.67938X-3, 50 335.06 335.56 1.964 1.874 1.937 1.92540X-1, 75 351.30 352.05 1.630 1.702 1.728 1.68740X-3, 75 354.30 355.05 1.890 1.970 1.834 1.89841X-1, 75 360.90 361.65 1.847 1.961 1.687 1.83241X-3, 75 363.90 364.65 2.070 2.036 2.116 2.07442X-1, 75 370.60 371.35 1.656 1.748 1.714 1.706

SHIPBOARD SCIENTIFIC PARTYCHAPTER 5, SITE 1167 95
Table T11. Measured and estimated temperatures, geo-thermal gradients, and heat-flow estimates, Site 1167.
Note: Bold numbers show measured values. All others are estimatedvalues based on projection of the temperature gradient.
Depth (mbsf)
Measured conductivity (W/[m·°C])
Stabilized temperature
(°C)
Thermal gradient (°C/km)
Heat flow
(mW/m2)
Average thermal gradient (°C/km)
0.0 0.0939.7 1.59 0.77 17.1 27.240.5 1.61 0.8 17.0 27.2 17.348.8 1.52 0.9 18.0 27.2 17.366.6 1.29 1.3 21.0 27.2 17.974.8 1.65 1.4 16.5 27.2 18.077.4 1.61 1.5 16.9 27.2 18.080.4 1.54 1.5 17.7 27.2 17.984.1 1.58 1.6 17.2 27.2 17.993.8 1.65 1.8 16.5 27.2 17.896.6 1.64 1.8 16.6 27.2 17.899.5 1.73 1.9 15.7 27.2 17.7
103.4 1.58 1.9 17.3 27.2 17.7106.4 1.61 2.0 16.9 27.2 17.7110.6 1.50 2.0 18.2 27.2 17.7151.1 1.87 2.7 14.6 27.2 17.3155.2 1.86 2.8 14.6 27.2 17.2160.6 1.67 2.8 16.3 27.2 17.2170.3 1.70 3.0 16.0 27.2 17.1189.0 1.62 3.3 16.8 27.2 17.1198.9 1.58 3.5 17.3 27.2 17.0211.8 1.95 3.7 14.0 27.2 16.9214.8 2.20 3.7 12.4 27.2 16.9218.4 1.84 3.8 14.8 27.2 16.8222.9 1.82 3.8 15.0 27.2 16.8225.9 1.96 3.9 13.9 27.2 16.7237.7 1.80 4.1 15.1 27.2 16.6240.7 1.71 4.1 15.9 27.2 16.6247.3 1.71 4.2 15.9 27.2 16.6249.1 2.02 4.2 13.5 27.2 16.6256.9 2.07 4.3 13.2 27.2 16.5259.9 2.08 4.4 13.1 27.2 16.4262.9 2.02 4.4 13.5 27.2 16.4266.2 1.86 4.5 14.6 27.2 16.4276.0 1.92 4.6 14.2 27.2 16.3279.0 1.80 4.6 15.1 27.2 16.3282.1 1.86 4.7 14.6 27.2 16.3285.4 1.84 4.7 14.8 27.2 16.3294.7 1.98 4.9 13.7 27.2 16.2303.5 1.43 5.0 19.0 27.2 16.2323.3 1.71 5.4 15.9 27.2 16.3326.0 2.12 5.4 12.8 27.2 16.3332.9 1.73 5.5 15.8 27.2 16.2335.6 1.87 5.5 14.5 27.2 16.2352.1 1.70 5.8 16.0 27.2 16.2355.1 1.97 5.8 13.8 27.2 16.2361.7 1.96 5.9 13.9 27.2 16.1364.7 2.04 6.0 13.4 27.2 16.1371.4 1.75 6.1 15.6 27.2 16.1382.5 1.63 6.2 16.7 27.2 16.1392.1 1.80 6.4 15.1 27.2 16.1429.1 2.00 6.9 13.6 27.2 15.9432.1 1.93 7.0 14.1 27.2 15.9438.7 1.63 7.1 16.7 27.2 15.9437.9 1.61 7.1 16.9 27.2 15.9441.7 1.51 7.1 18.0 27.2 15.9

SH
IPB
OA
RD
SC
IEN
TIFIC P
AR
TY
CH
AP
TE
R 5
, SIT
E 11
67
96
Table
Note: C t while drilling; mbrf = meters below rig floor; mbsl = meters below sea level.
Comments
Holes 116 mmenced at 1700 on 2/27/00. Wiper trip, sepiolite was circulated; no KCl used. Sea state/heave: average 5 m.
Water deMudlin 7000 ft/hr.Mudlin peed = 500-900 ft/hr.Mudlin ate of penetration = 20 m/hr (calculation includes time for making drill-pipe connections).
Drill-pipe ased at 0930 on 2/29/00.Initial pInitial p set at 86.95 mbsf.
Final piFinal piFinal piFinal pi ial log depth.
Sticking eDepth dge only 12 m below the base of the pipe. Fluid was pumped downhole until pressure increased enough
Depth Depth ncountered at 151 mbsf; the tool could not break through this obstruction.Depth
Final tool(mbrf; (mbsf):
Total hole to reach total cored depth; however, the upper 265 m was successfully logged with LWD/MWD.
Length o
T12. Logging operations summary, Site 1167.
DR = compensated dual resistivity tool; LWD = logging while drilling; MWD = measuremen
Operations depth summary Run 1 LWD/MWD
7A and 1167B Triple combo Power Pulse CDR Logging operations co2.5 m; maximum 4.
pth, seafloor or mudline:e (mbrf): driller's depth 1651.3 Run into hole speed =e (mbrf): logger's depth 1649.0 1652.0 Triple combo uprun se (mbsl) 1640.3 1641.0 LWD/MWD average r
depth during logging: Logging operations ceipe depth (mbrf): driller's depth 1738.3ipe depth (mbsf): using driller's depth 87.0 Initial pipe depth was
pe depth (mbrf): driller's depth 1738.3 1913.1pe depth (mbrf): depth from logs 1734.0pe depth (mbsf): using driller's depth 87.0 262.1pe depth (mbsf): using logger's depth 85.0 Final pipe depth = init
ncountered during logging:of first bridge or ledge (mbrf; winch) 1740.0 Tool got stuck at a bri
to release the tool.of first bridge or ledge (mbsf) 91.0of second bridge or ledge (mbrf; winch) 1800.0 A second bridge was eof second bridge or ledge (mbsf) 151.0
depth:winch) 1800.0 1913.1 using logger's depth 151.0 261.1
depth (m): 447.5 261.1 Wireline logging failed
f logging run (m): 66.0 261.1
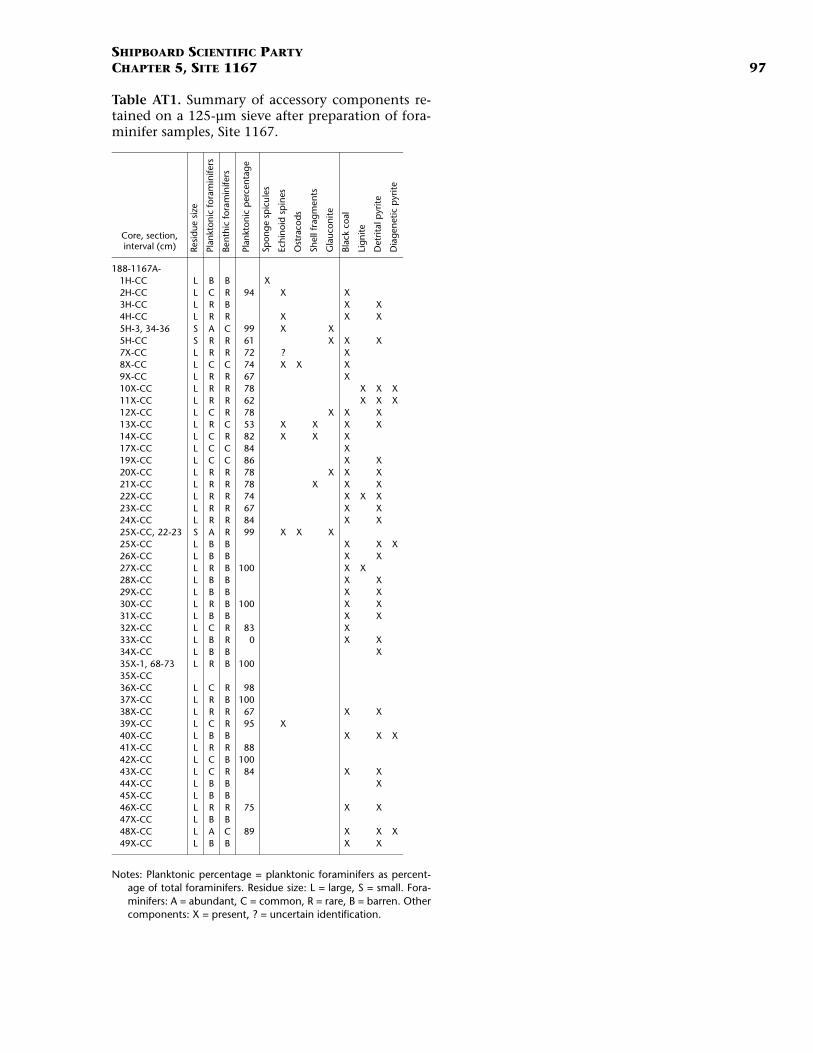
SHIPBOARD SCIENTIFIC PARTYCHAPTER 5, SITE 1167 97
Table AT1. Summary of accessory components re-tained on a 125-µm sieve after preparation of fora-minifer samples, Site 1167.
Notes: Planktonic percentage = planktonic foraminifers as percent-age of total foraminifers. Residue size: L = large, S = small. Fora-minifers: A = abundant, C = common, R = rare, B = barren. Othercomponents: X = present, ? = uncertain identification.
Core, section,interval (cm) Re
sid
ue s
ize
Plan
kton
ic fo
ram
inife
rs
Bent
hic
fora
min
ifers
Plan
kton
ic p
erce
ntag
e
Spon
ge
spic
ules
Echi
noid
sp
ines
Ost
raco
ds
Shel
l fra
gmen
ts
Gla
ucon
ite
Blac
k co
al
Lign
ite
Det
rital
pyr
ite
Dia
gene
tic p
yrite
188-1167A-1H-CC L B B X2H-CC L C R 94 X X3H-CC L R B X X4H-CC L R R X X X5H-3, 34-36 S A C 99 X X5H-CC S R R 61 X X X7X-CC L R R 72 ? X8X-CC L C C 74 X X X9X-CC L R R 67 X10X-CC L R R 78 X X X11X-CC L R R 62 X X X12X-CC L C R 78 X X X13X-CC L R C 53 X X X X14X-CC L C R 82 X X X17X-CC L C C 84 X19X-CC L C C 86 X X20X-CC L R R 78 X X X21X-CC L R R 78 X X X22X-CC L R R 74 X X X23X-CC L R R 67 X X24X-CC L R R 84 X X25X-CC, 22-23 S A R 99 X X X25X-CC L B B X X X26X-CC L B B X X27X-CC L R B 100 X X28X-CC L B B X X29X-CC L B B X X30X-CC L R B 100 X X31X-CC L B B X X32X-CC L C R 83 X33X-CC L B R 0 X X34X-CC L B B X35X-1, 68-73 L R B 10035X-CC36X-CC L C R 9837X-CC L R B 10038X-CC L R R 67 X X39X-CC L C R 95 X40X-CC L B B X X X41X-CC L R R 8842X-CC L C B 10043X-CC L C R 84 X X44X-CC L B B X45X-CC L B B46X-CC L R R 75 X X47X-CC L B B48X-CC L A C 89 X X X49X-CC L B B X X
Related Documents