Over Lesson 8–9 A. A B. B C. C D. D Which is an equation for the line of best fit for the scatter plot where x is the years since 1998 and y is the number of visitors in thousands? A. y = 3x + 15 B. y = x + 5 C. y = 3x – 15 D. Use the line of best fit from above to predict the number of visitors in 2010.

5-Minute Check 1
Jan 01, 2016
A B C D. A. y = 3 x + 15 B. y = x + 5 C. y = 3 x – 15 D. Which is an equation for the line of best fit for the scatter plot where x is the years since 1998 and y is the number of visitors in thousands?. - PowerPoint PPT Presentation
Welcome message from author
This document is posted to help you gain knowledge. Please leave a comment to let me know what you think about it! Share it to your friends and learn new things together.
Transcript

Over Lesson 8–9
A. A
B. B
C. C
D. D
Which is an equation for the line of best fit for the scatter plot where x is the years since 1998 and y is the number of visitors in thousands?
A. y = 3x + 15B. y = x + 5C. y = 3x – 15D.
Use the line of best fit from above to predict the number of visitors in 2010.


You have already solved linear equations by graphing. (Lesson 8–2)
• Solve systems of linear equations by graphing.
• Solve systems of linear equations by substitution.

• system of equations
• substitution
A set of two or more equations with the same variables
Use algebraic methods to find an exact solution of a system of equations.

Solve by Graphing
Solve the system of equations by graphing.
y = –x + 4y = 2x + 1
Graph each line.

Solve by Graphing
Answer: The solution of the system is (1, 3).
The graphs appear to intersect at (1, 3). Check this by replacing x with 1 and y with 3.
Check
y = –x + 4 y = 2x + 1
3 = 3 3 = 33 = –1 + 4 3 = 2(1) + 1
??

A. A
B. B
C. C
D. D
A. (2, 1)
B. (2, –1)
C. (1, 2)
D. (1, –2)
What is the solution of the system of equations?y = –x + 3y = 4x – 2

A. Catori and Mark each download songs. Mark downloaded 4 times as many songs as Catori. Mark also downloaded 6 more songs than Catori.
Write a system of equations to represent this situation.
Let x represent Catori’s songs and y represent Mark’s songs.
y = 4x Mark downloaded 4 times asmany songs as Catori.
y = x + 6 Mark downloaded 6 more songsthan Catori.
Answer: y = 4x and y = x + 6

B. Catori and Mark each download songs. Mark downloaded 4 times as many songs as Catori. Mark also downloaded 6 more songs than Catori.
Solve the system by graphing. Explain what the solution means.
Graph the equations y = 4x and y = x + 6 on the same coordinate grid. The equations intersect at (2, 8).
Answer: So, the solution to the system is x = 2 and y = 8. This means that Catori downloaded 2 songs and Mark downloaded 8 songs.
A. A
B. B
C. C
D. D
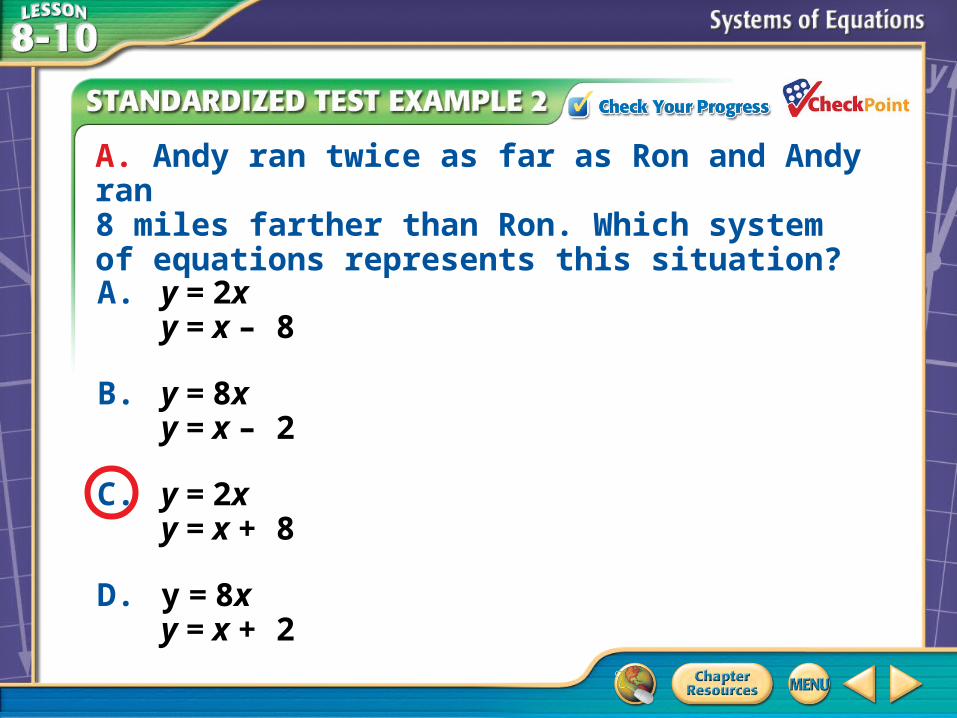
A. y = 2xy = x – 8
B. y = 8xy = x – 2
C. y = 2xy = x + 8
D. y = 8xy = x + 2
A. Andy ran twice as far as Ron and Andy ran 8 miles farther than Ron. Which system of equations represents this situation?

A. A
B. B
C. C
D. D
A. Andy ran 10 miles.Ron ran 5 miles.
B. Andy ran 12 miles.Ron ran 6 miles.
C. Andy ran 16 miles.Ron ran 8 miles.
D. Andy ran 18 miles.Ron ran 9 miles.
B. Andy ran twice as far as Ron and Andy ran 8 miles farther than Ron. How far did each person run?

No Solution and Infinitely Many Solutions
A. Solve the system of equations by graphing.
y = –x – 32x + 2y = –6
Both equations have the same graph. Any ordered pair on the graph will satisfy both equations.
Answer: Therefore, there are infinitely many solutions of this system of equations.

No Solution and Infinitely Many Solutions
B. Solve the system of equations by graphing.
y = 2xy = 2x – 4
The graphs appear to be parallel lines.
Answer: Since there is no coordinate pair that is a solution to both equations, there is no solution of this system of equations.

A. A
B. B
C. C
D. D
A. (0, 1)
B. (1, 2)
C. infinitely many solutions
D. no solution
A. Solve the system of equations by graphing.y = x + 12y – 2x = 2

A. A
B. B
C. C
D. D
A. (1, 1)
B. (1, 2)
C. infinitely many solutions
D. no solution
B. Solve the system of equations by graphing.y = xy = x + 1

Solve by Substitution
Solve the system of equations by substitution.
y = 7y = 2x – 5
Replace y with 7 in the second equation.
y = 2x – 5 Write the second equation.
7 = 2x – 5 Replace y with 7.
12 = 2x Add 5 to each side.
6 = x Solve for x.
Answer: The solution of this system of equationsis (6, 7).

A. A
B. B
C. C
D. D
A. (4, 8)
B. (–4, 0)
C. (8, 4)
D. (2, 8)
Solve the system of equations by substitution.
y = 8y = x + 4


Related Documents


