Nat. Volatiles & Essent. Oils, 2021; 8(5): 10315-10331 10315 5 Fluorouracil Solid Lipid Nanoparticles (SLNs), Formulation and Evaluation for the treatment of Skin Disorders Rajesh Dodia 1 , Dr. Mrunal K. Shirsat 2 1,2 Faculty of Pharmaceutical Science, Madhav University, Pindwara Abstract The new generation submicron is SLNs (solid lipid nanoparticles). In which the lipid particles are in liquid lipid and solid lipid. These are safe, very much stable and it is biodegradable. These may have various topical applications and has an ability to deposit on skin. For the release of drugs, these reduce the local side effect and provide sustained release effect of drug. The current work is done for the formulation and evaluation of SLNs for the treatment of skin disorder. 5 Fluorouracil loaded SLNs are formed and were characterised by FTIR, DSC studies. Physiochemical and In-vitro study also investigated. The entrapment efficiency is range from 60±0.36% to 78±0.36%. Zeta potential ranges from-32±2.0 to -59±1.3. 5 Fluorouracil loaded SLNs have prolong release. This is followed zero order in vitro release kinetic. Keywords: 5 Fluorouracil, SLNs, Characterisation, In-vitro study INTRODUCTION The largest organ of the body ‘skin’. Skin provides protections against homeostasis. It also provides protection against UV light, physical and chemical pollutants, toxicity on skin can be manifested and it produces lots of skin disorders like actinic keratoses and melanogenesis. Now a day, actinic keratoses is the most serious illness. 1,2 Some physiological factors which may affect the diffusion of skin. It can influence the structure of skin. Environmental factors may affect the skin such as chemicals, solar radiations etc. some drugs may affect the skin such as aspirin, caffeine, nicotinates etc. as the skin is been aged the epidermis layer and corneocytes may be reduced and decreased. The melanocytes and Langerhans cells are been reduces in dermo epidermal interfaces. These layers may be vascular and cellular. 3,4,5 Solid lipid nanoparticle are the nanoparticles which contain colloidal drug carrier and alike to Nano emulsion. SLNs may contain solid lipid whereas emulsion may contain liquid lipids. 0.5 to 5 % of surfactant is used in the stabilizer of solid lipid nanoparticles. SLNs are used as a carrier system for water dissolving and dynamic medication. The particle size is from 10 to 1000nm. These may be manufacture by the use of polymers. 6,7,8 The new generation of nanoparticles are SLNs (Solid lipid nanoparticles). These are active vehicles. These may attract the colloidal drug carriers for topical use. SLN are range in submicron. It contains lipid components in solid state. SLNs are combined with polymeric, fat emulsion and liposomes. 9,10,11 These are biodegradable and biocompatible with controlled drug delivery and has a specific targeting. SLNs have no irritation on skin and it may protect the active compounds. SLNs drug easily administrated into the skin and reduces the irritation. These have better skin targeting effect. 12,13 MATERIAL AND METHODS 5 Fluorouracil was supplied as gift sample from Unicure India Pvt Ltd, Noida, Uttar Pradesh, India. All excipients (Compritol 888ATO, Sodium taurocholate, Glyceryl Monostearate,

Welcome message from author
This document is posted to help you gain knowledge. Please leave a comment to let me know what you think about it! Share it to your friends and learn new things together.
Transcript
Nat. Volatiles & Essent. Oils, 2021; 8(5): 10315-10331
10315
5 Fluorouracil Solid Lipid Nanoparticles (SLNs), Formulation
and Evaluation for the treatment of Skin Disorders
Rajesh Dodia1, Dr. Mrunal K. Shirsat2
1,2Faculty of Pharmaceutical Science, Madhav University, Pindwara
Abstract
The new generation submicron is SLNs (solid lipid nanoparticles). In which the lipid particles are in liquid lipid and solid lipid.
These are safe, very much stable and it is biodegradable. These may have various topical applications and has an ability to
deposit on skin. For the release of drugs, these reduce the local side effect and provide sustained release effect of drug. The
current work is done for the formulation and evaluation of SLNs for the treatment of skin disorder. 5 Fluorouracil loaded
SLNs are formed and were characterised by FTIR, DSC studies. Physiochemical and In-vitro study also investigated. The
entrapment efficiency is range from 60±0.36% to 78±0.36%. Zeta potential ranges from-32±2.0 to -59±1.3. 5 Fluorouracil
loaded SLNs have prolong release. This is followed zero order in vitro release kinetic.
Keywords: 5 Fluorouracil, SLNs, Characterisation, In-vitro study
INTRODUCTION
The largest organ of the body ‘skin’. Skin provides protections against homeostasis. It also provides
protection against UV light, physical and chemical pollutants, toxicity on skin can be manifested and
it produces lots of skin disorders like actinic keratoses and melanogenesis. Now a day, actinic
keratoses is the most serious illness.1,2 Some physiological factors which may affect the diffusion of
skin. It can influence the structure of skin. Environmental factors may affect the skin such as chemicals,
solar radiations etc. some drugs may affect the skin such as aspirin, caffeine, nicotinates etc. as the
skin is been aged the epidermis layer and corneocytes may be reduced and decreased. The
melanocytes and Langerhans cells are been reduces in dermo epidermal interfaces. These layers may
be vascular and cellular.3,4,5
Solid lipid nanoparticle are the nanoparticles which contain colloidal drug carrier and alike to Nano
emulsion. SLNs may contain solid lipid whereas emulsion may contain liquid lipids. 0.5 to 5 % of
surfactant is used in the stabilizer of solid lipid nanoparticles. SLNs are used as a carrier system for
water dissolving and dynamic medication. The particle size is from 10 to 1000nm. These may be
manufacture by the use of polymers.6,7,8
The new generation of nanoparticles are SLNs (Solid lipid nanoparticles). These are active vehicles.
These may attract the colloidal drug carriers for topical use. SLN are range in submicron. It contains
lipid components in solid state. SLNs are combined with polymeric, fat emulsion and liposomes.9,10,11
These are biodegradable and biocompatible with controlled drug delivery and has a specific targeting.
SLNs have no irritation on skin and it may protect the active compounds. SLNs drug easily
administrated into the skin and reduces the irritation. These have better skin targeting effect.12,13
MATERIAL AND METHODS
5 Fluorouracil was supplied as gift sample from Unicure India Pvt Ltd, Noida, Uttar
Pradesh, India. All excipients (Compritol 888ATO, Sodium taurocholate, Glyceryl Monostearate,
Nat. Volatiles & Essent. Oils, 2021; 8(5): 10315-10331
10316
Glyceryl Trimyristate, Chitosan and Carbopol 934P etc.) were supplied by Sigma-Aldrich, New Delhi,
India. All the other chemicals were used are analytical grade.
Identification of Drug
One of the major preliminary tests to be done for verification and assuring the purity of the drug
sample prior to formulation creation is identification of the procured medication. As a Compendial
test, an identification test is included to assist in establishing the identity of goods as purported. The
appearance, solubility, and melting point of the drug sample were used to identify it in the current
study, and this was confirmed by Fourier-transform infrared (FT-IR) spectroscopy assessment of
distinct functional groups and DSC study.
Appearance
The procured drug sample was visually observed for its color and was compared with the reported
appearance of the drug.
Solubility of drug
As a purity test, quantitative solubility tests are used. The drug's solubility in water and buffer solutions
of various pH levels was tested. In a clean dry test tube, 10 mg of sample was placed, and buffer
solution was gradually added in 1 ml aliquots with continuous shaking until it dissolved completely.
The amount of solvent required to dissolve the medication powder was recorded, and the solubility
was compared to previously published values.
Melting Point
The melting point is one of the methods for determining the purity of a medicine. As a result, the
melting point apparatus was used to determine it for the sample using the capillary method (VMP-D,
Veego). A small amount of the material was inserted in the melting point equipment in a capillary tube
(closed at one end). The temperature at which the substance began to turn into a liquid and the
temperature at which the solid vanished completely were both recorded.
FT-IR Analysis of Pure Drug
For the solid-state characterisation of pharmaceutical materials, Fourier Transform Infrared (FT-IR) is
an important supplementary method. The substance was identified utilising an Alpha Bruker FTIR
spectrophotometer and infrared spectroscopy. The disc method was used to prepare the sample. In a
mortar-pestle, the medication was triturated with potassium bromide (about 5 mg sample with 100
mg dry potassium bromide) to obtain a fine and homogenous mixture. The pellets were made by
compressing the powder with a potassium bromide press at 20 psi for 10 minutes. The sample disc
was prepared and inserted in the sample compartment. In the range of 4000-400 cm-1, the sample
was scanned in transmission mode. The acquired IR spectra were compared to a pure drug's standard
spectrum.
DSC Study
For determination of Thermal behaviour of 5 Fluorouracil, differential Scanning Calorimetry (DSC) was
performed. DSC Thermogram is been formed by the using of DSC instrument. In aluminium pans the
sample is been placed and pressed it to seal. At nitrogen atmospheric condition aluminium pan and
blank aluminium pan at 30°C to 300°C at a rate of 10°C/min. Indium is use for the calibration of
instrument.
Nat. Volatiles & Essent. Oils, 2021; 8(5): 10315-10331
10317
Method Validation
The developed analytical method was validated for various parameters like system suitability,
Specificity, linearity, Precision, accuracy and LOD & LOQ as per ICH guidelines and data obtained were
statistically analysed.
System Suitability
A system suitability test was performed for the validation of the analytical procedure. For SST selection
some parameter was used like Percent relative standard deviation (% RSD) of the area, RSD of
Retention Time (RT), USP tailing factor, theoretical plates, and resolution were used. For the
determination of these parameters, standard solutions were pushed or injected by 6 times.
Specificity
This method is used for the determination and establishment of SLNs dispersion for lipids and
surfactants. It did not interfere into the quantification of drugs. This method was evaluated by
comparing the chromatograms of 5 Fluorouracil extracted from the SLNs and the blank nano-particle
for the peak determination.
Linearity
For the determination of linearity, stock solution of 10 concentrations between 50 to 200μg/ml was
injected in triplicate. Calibration curve of 5 Fluorouracil was plotted by peak area versus percentage
of drug concentration. If the intercept is < 1% then the linearity was confirmed.
Precision
The analytical method's precision (repeatability) was determined by analysing six samples at 100%
test concentration and calculating standard deviation (SD) and percent relative Standard deviation
(RSD). The intra-day and inter-day precisions were calculated by analysing three samples at three
different times on the same day and on three successive days, calculating SD and percent RSD, and
analysing the results.
Accuracy
Accuracy was assessed at three concentration levels. Six replicates were analysed at 100%
concentration level and three replicates each at 50% and 150% concentrations. Assessment Of
accuracy was accomplished by evaluating the percent recovery of the analyst.
Limits of Detection and Lower Limit of Quantification
Limits of Detection and Lower Limit of Quantification is the lowest concentration of analyte and active
ingredient in the sample. This is used for the determination of precision and accuracy. According to
the ICH guidelines, this is based on the SD (standard deviation) and slope for the detection and
quantitation limits. LOD and LOQ is been calculated by
LOD = 3.3 (SD/m)
LOQ = 10 (SD/m)
Formulation of SLNs
Selection of formulation Technique
High shear homogenization and solvent evaporation technique, microemulsion based SLN preparation
technology, and others are some of the strategies for SLN formulation. The technique was chosen
based on the particle size, PDI, and entrapment effectiveness of the nanoparticles achieved utilising
the commonly used and reported to be dependable and powerful techniques with the trial batches.
Nat. Volatiles & Essent. Oils, 2021; 8(5): 10315-10331
10318
Lyophilization
30ml of SLNs were placed into a 50ml of wide mouth fast–freeze flask. Then these tubes were placed
into ultra-low temperature freezer at -200C for 12 to 15 hours. These frozen SLNs were lyophilized
using freeze dryer at temperature -800C with 20 to 30 m Torr pressure for 24 to 25hours.
Evaluation of SLNs
For the determination of evaluation parameters like Particle Size, PDI, Zeta Potential, % Encapsulation
Efficiency, % Drug Loading Capacity, Scanning Electron Microscopy (SEM) and Transmission Electron
Microscopy (TEM) also performed for optimized formulation. In Vitro Drug Release and drug release
kinetics were also studied.
Particle Size, PDI, Zeta Potential
Zetasizer Nanoseries Nano-ZS, Malvern Instruments, Malvern, UK, was used to assess the average
particle size, PDI, and zeta potential of solid lipid nanoparticles. Particle size and zeta potential were
determined using in-built dynamic light scattering, DLS, and Laser Doppler Electrophoresis. The
materials were placed in 'folded capillary cells,' and the size, PDI, and zeta-potential values obtained
were recorded. By using distilled water lyophilized SLNs were redispersed. These samples were taken
into a cuvette and analysed at 90C.
% Entrapment Efficiency and % Drug Loading Capacity
% Entrapment efficiency was determined by determining the amount of free drug
Spectrophotometrically at 265 nm in the supernatant after centrifugation of the known
Amount of nanoparticulate dispersion at 10000 RPM using freeze centrifuge (BL – 135 R).
% Entrapment efficiency
=
AAmount
of entrapped drug
X 100 AAmount
of total drug
=
Weight of drug added in the formulation –
Weight of free drug X 100
Weight of drug added in the formulation
= [(WT – WF)/WT] X 100
% Drug Loading Capacity =
W total drug detected
X 100 W Total solid lipid added
Nat. Volatiles & Essent. Oils, 2021; 8(5): 10315-10331
10319
Percentage (%) Yield
The yield of the final solid lipid nanoparticle of all ratios was calculated by using the final weight of
solid lipid nanoparticle after lyophilization and the initial weight of the drug and polymer used for the
preparation of SLN126.
Following formula is used for calculation of % yield:
% Yields =
Theoretical yield of SLN
X 100 Practical yield of SLN
In-vitro Drug Diffusion Profiles
This study was performed by bag diffusion method. This bag membrane should retain the nanoparticle
and allow the free drugs to the dissolution media with a cut off of 15000 molecular weights. Double
distilled water is been use for the soaking of this bag. It was remaining in this for 12 to 15 hours before
use. 3ml of PBS with pH 6.8 were used for the dispersion of 200mg of Lyophilization SLNs. Then this
solution was placed into the membrane bag with the two ends fixed by clips. Conical flask is use for
the bag placed with the addition of 60ml of PBS pH 6.8. Then this conical flask was fixed on
thermostatic magnetic stirrer with 380C at 100RPM. At a certain interval of time, 2 to 3 ml of media
was taken out and it was replaced by fresh medium volumes. 0.22 µm is used for the filtration and it
was injected by nylon syringe and assayed by HPLC method.
Scanning Electron Microscopy (SEM)
SEM (Scanning Electron Microscopy) is used for the morphology of SLNs. The samples for Scanning
Electron Microscopy were prepared by light sprinkling nanoparticles on a double adhesive carbon
tape, which was stuck to an aluminium stub. The stub was then coated with gold to a thickness of 200
to 500 Å under an argon atmosphere using gold sputter module in a high vacuum evaporator. The
samples were then scanned and photomicrographs were taken at 27000x magnifications.
Transmission Electron Microscopy (TEM)
TEM (Transmission Electron Microscopy) are used for the morphology of SLNs. Distilled water with
ratio of 1:10 was use for the dilution of SLNs. One drop of the diluted formulation was subsequently
taken and placed onto a carbon-coated copper grid. The excess liquid was removed with filter paper
and allowed to stand for 10 m. The grid was then stained with 1% phosphotungstic acid (PTA) and
allowed to air dry for 5 m. The sample was then viewed under Transmission Electron Microscope (TEM)
and photomicrographs were taken.
Drug Release Kinetics
In order to examine the release mechanism of 5 Fluorouracil SLNs, optimized Fluorouracil SLNs was
performed. Determination of mechanism and kinetics of drug release were obtained by correlation
coefficient (R2) values.
Zero Order Kinetics
% Cumulative drug released and time (h) graph was plotted for the Zero-Order Kinetic Model.
Concentration is not depending on the release drug.
Nat. Volatiles & Essent. Oils, 2021; 8(5): 10315-10331
10320
Q = K0 t
Where, Q = Amount of drug release at time t,
K0 = Zero order rate constant
t = Time (h).
The R2 value obtained from the plot of the amount of medication released (Q) vs time (t) reveals zero
order release, indicating that the release is concentration-independent.
First Order Kinetic Model
Log % cumulative drug released and time (h) graph was plotted for first order kinetic. Concentration
plays most important role.
ln (100-Q) = lnQ0-K1t
Where, Q = Amount of drug release at time t,
K1= First order release constant
t = Time (h).
The regression coefficient (R2) value obtained from the log % ARR (Amount Remaining to Release)
versus time, nearer to 1 indicates first order release signifying the release to be concentration-
dependent.
Higuchi Square Release Equation
Fick’s law is used for Higuchi model. This model describes the mechanism of drug release which is
been followed by diffusion dosage form due to the presence of polymer matrix. % Cumulative drug
released and the square root of time graph was plotted for Higuchi’s kinetic.
Q = Kht1/2
Where, Q= Amount of drug release at time t,
Kh= Higuchi square root of time release constant
t = Time (h).
Higuchi's drug release model, which has a regression co-efficient of percentage drug release vs square
root of time nearer to 1, implies Fickian diffusional release.
Korsmeyer and Peppas model
Qt / Q∞ = K x t λ
Log (Qt/Q∞) = Log K + Λ Log t
Where,
Q∞ = Total drug released after infinite time t,
Qt/Q ∞ = Fractional drug released at time t
K = Kinetic constant incorporating structural and geometrical
Characteristic of the drug/polymer system (devices).
Λ = Diffusion exponents that characterizes the mechanism of drug
release.
t =Release time
A plot of log (Qt/ Q∞) versus log t gives straight line of gradient λ and an intercept of log K.
Nat. Volatiles & Essent. Oils, 2021; 8(5): 10315-10331
10321
Values of exponent Λ and the corresponding release mechanism. When the value n ≤ 0.45 reveals that
Higuchi model or fickian diffusion the value 0.45 < n < 0.89. This value means the particular dosage
form anomalous diffusion and non-fickian diffusion.
RESULTS AND DISCUSSIONS
Physical parameters of drug
Before moving forward with formulation development, it is necessary to identify the purchased drug
sample and ensure its purity. Table 1 summarises the identification tests and inferences for the drug
sample based on its appearance, solubility, and melting point determination.
Table 1: Identification Test for Drug
Parameters Observations Reported Inferences
Appearance White powder White to almost white
powder
Complies
Melting Point 280-285 0C 282 – 283 0C Complies
Solubility solubility of 5-
Fluorouracil is 12.1
mg/ml in water
solubility of 5-
Fluorouracil is 12.2
mg/ml in water
Complies
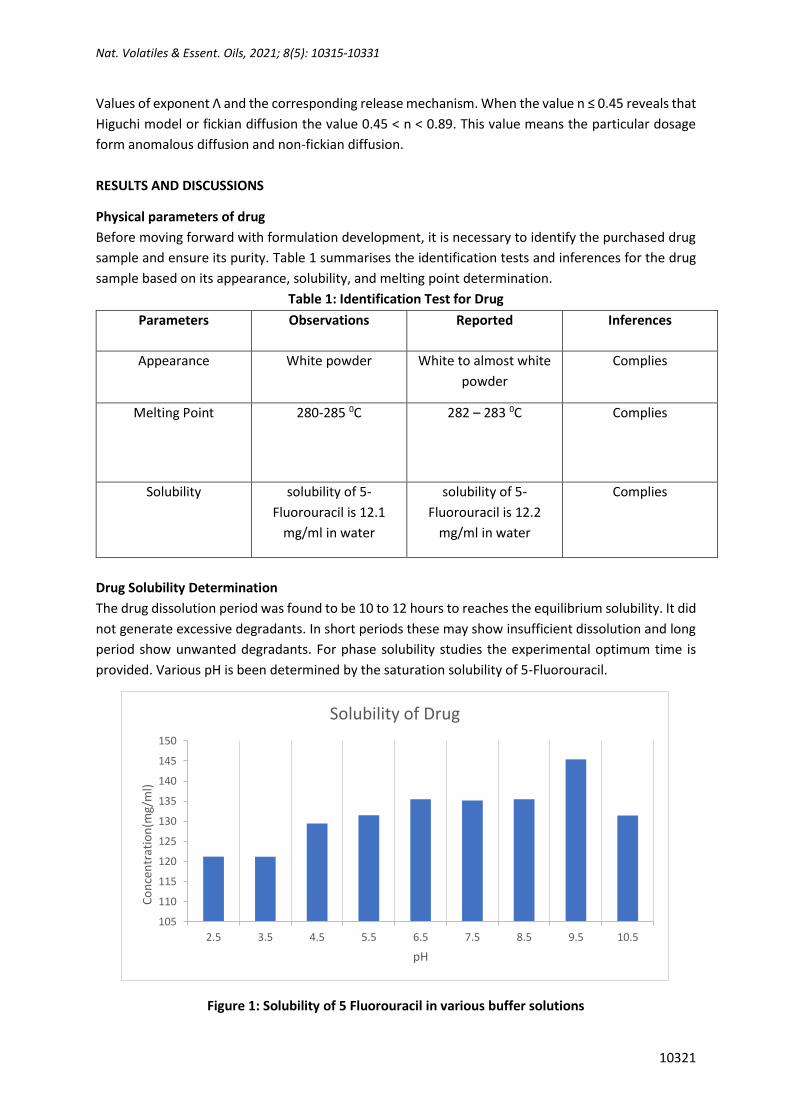
Drug Solubility Determination
The drug dissolution period was found to be 10 to 12 hours to reaches the equilibrium solubility. It did
not generate excessive degradants. In short periods these may show insufficient dissolution and long
period show unwanted degradants. For phase solubility studies the experimental optimum time is
provided. Various pH is been determined by the saturation solubility of 5-Fluorouracil.
Figure 1: Solubility of 5 Fluorouracil in various buffer solutions
105
110
115
120
125
130
135
140
145
150
2.5 3.5 4.5 5.5 6.5 7.5 8.5 9.5 10.5
Co
nce
ntr
atio
n(m
g/m
l)
pH
Solubility of Drug
Nat. Volatiles & Essent. Oils, 2021; 8(5): 10315-10331
10322
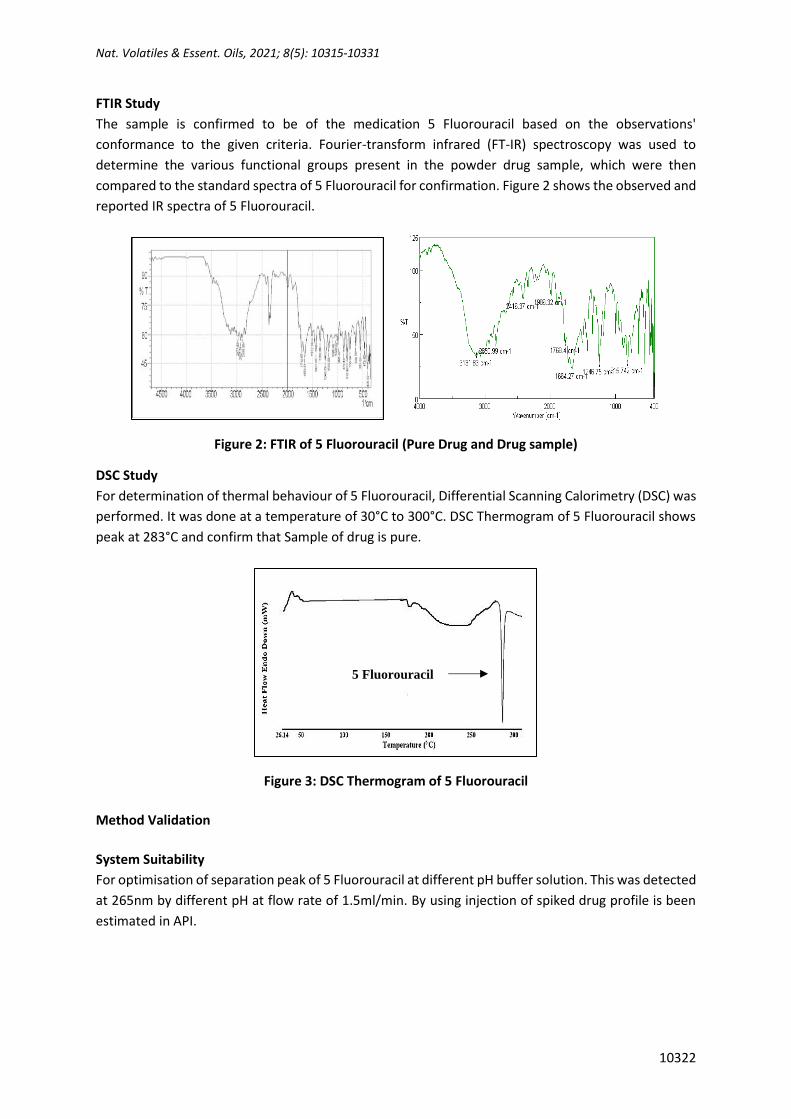
FTIR Study
The sample is confirmed to be of the medication 5 Fluorouracil based on the observations'
conformance to the given criteria. Fourier-transform infrared (FT-IR) spectroscopy was used to
determine the various functional groups present in the powder drug sample, which were then
compared to the standard spectra of 5 Fluorouracil for confirmation. Figure 2 shows the observed and
reported IR spectra of 5 Fluorouracil.
Figure 2: FTIR of 5 Fluorouracil (Pure Drug and Drug sample)
DSC Study
For determination of thermal behaviour of 5 Fluorouracil, Differential Scanning Calorimetry (DSC) was
performed. It was done at a temperature of 30°C to 300°C. DSC Thermogram of 5 Fluorouracil shows
peak at 283°C and confirm that Sample of drug is pure.
Figure 3: DSC Thermogram of 5 Fluorouracil
Method Validation
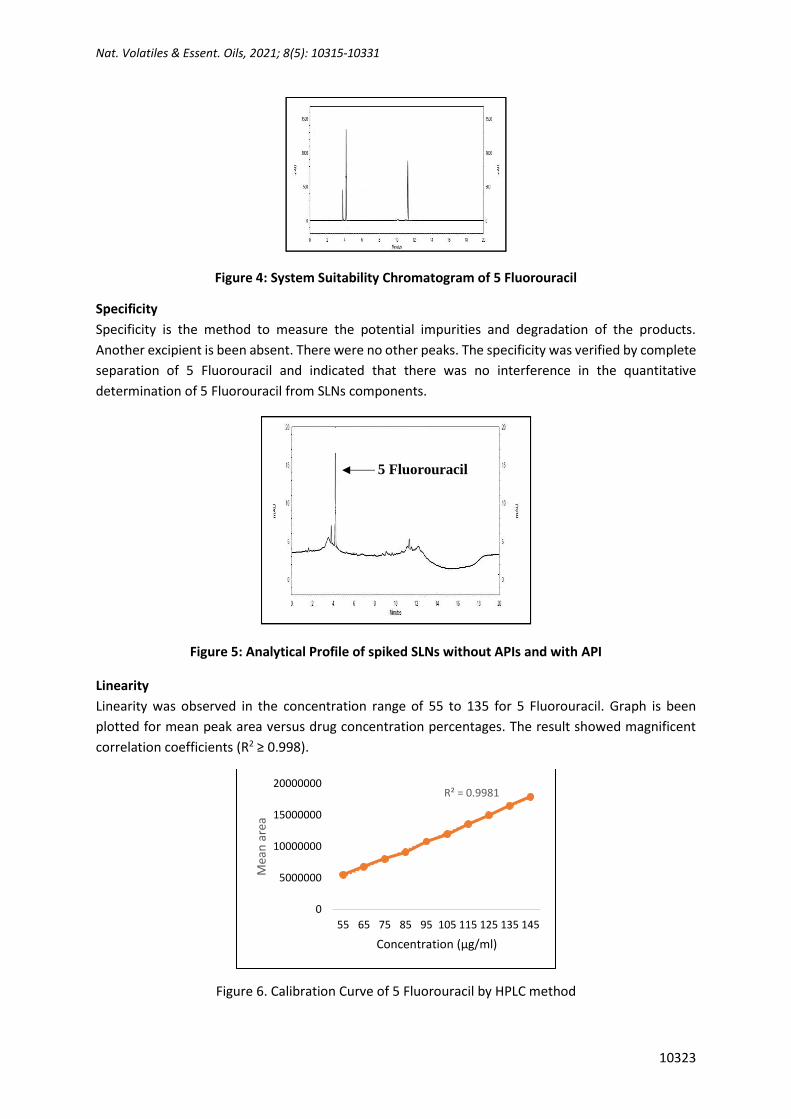
System Suitability
For optimisation of separation peak of 5 Fluorouracil at different pH buffer solution. This was detected
at 265nm by different pH at flow rate of 1.5ml/min. By using injection of spiked drug profile is been
estimated in API.
5 Fluorouracil
Nat. Volatiles & Essent. Oils, 2021; 8(5): 10315-10331
10323
Figure 4: System Suitability Chromatogram of 5 Fluorouracil
Specificity
Specificity is the method to measure the potential impurities and degradation of the products.
Another excipient is been absent. There were no other peaks. The specificity was verified by complete
separation of 5 Fluorouracil and indicated that there was no interference in the quantitative
determination of 5 Fluorouracil from SLNs components.
Figure 5: Analytical Profile of spiked SLNs without APIs and with API
Linearity
Linearity was observed in the concentration range of 55 to 135 for 5 Fluorouracil. Graph is been
plotted for mean peak area versus drug concentration percentages. The result showed magnificent
correlation coefficients (R2 ≥ 0.998).
Figure 6. Calibration Curve of 5 Fluorouracil by HPLC method
R² = 0.9981
0
5000000
10000000
15000000
20000000
55 65 75 85 95 105 115 125 135 145
Mea
n a
rea
Concentration (µg/ml)
5 Fluorouracil
Nat. Volatiles & Essent. Oils, 2021; 8(5): 10315-10331
10324
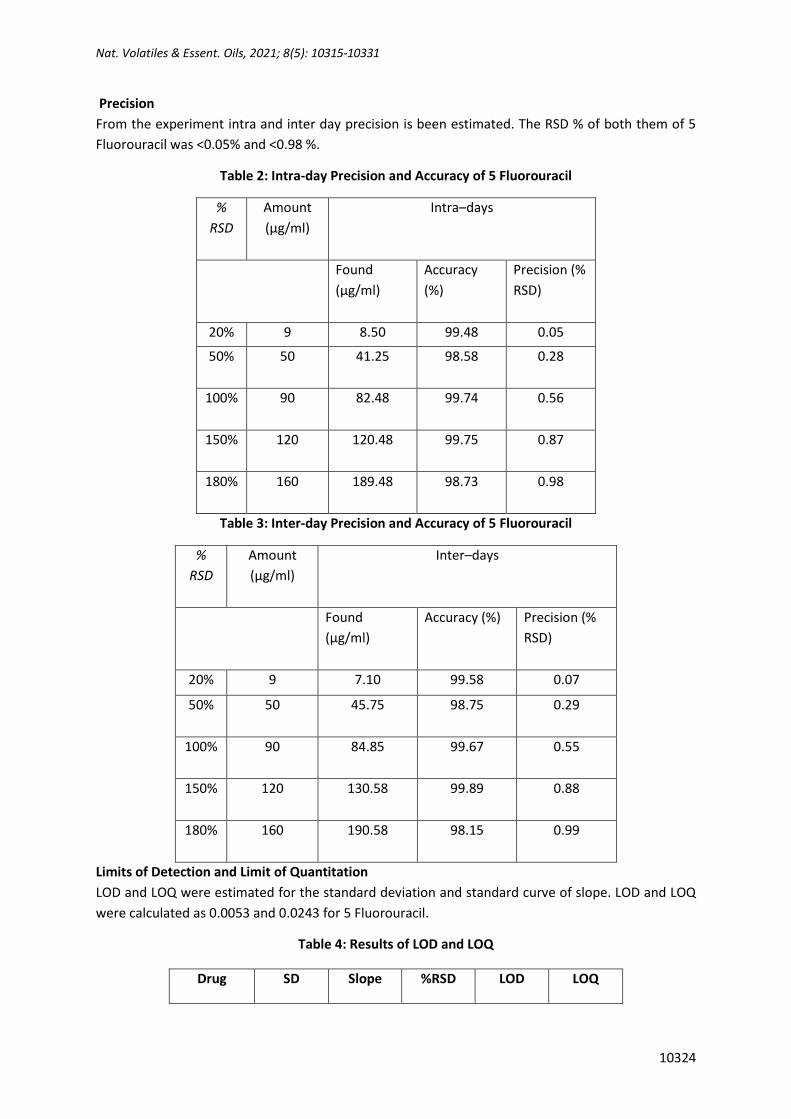
Precision
From the experiment intra and inter day precision is been estimated. The RSD % of both them of 5
Fluorouracil was <0.05% and <0.98 %.
Table 2: Intra-day Precision and Accuracy of 5 Fluorouracil
%
RSD
Amount
(µg/ml)
Intra–days
Found
(µg/ml)
Accuracy
(%)
Precision (%
RSD)
20% 9 8.50 99.48 0.05
50% 50 41.25
98.58 0.28
100% 90 82.48
99.74 0.56
150% 120 120.48
99.75 0.87
180% 160 189.48
98.73 0.98
Table 3: Inter-day Precision and Accuracy of 5 Fluorouracil
%
RSD
Amount
(µg/ml)
Inter–days
Found
(µg/ml)
Accuracy (%) Precision (%
RSD)
20% 9 7.10 99.58 0.07
50% 50 45.75
98.75 0.29
100% 90 84.85
99.67 0.55
150% 120 130.58
99.89 0.88
180% 160 190.58
98.15 0.99
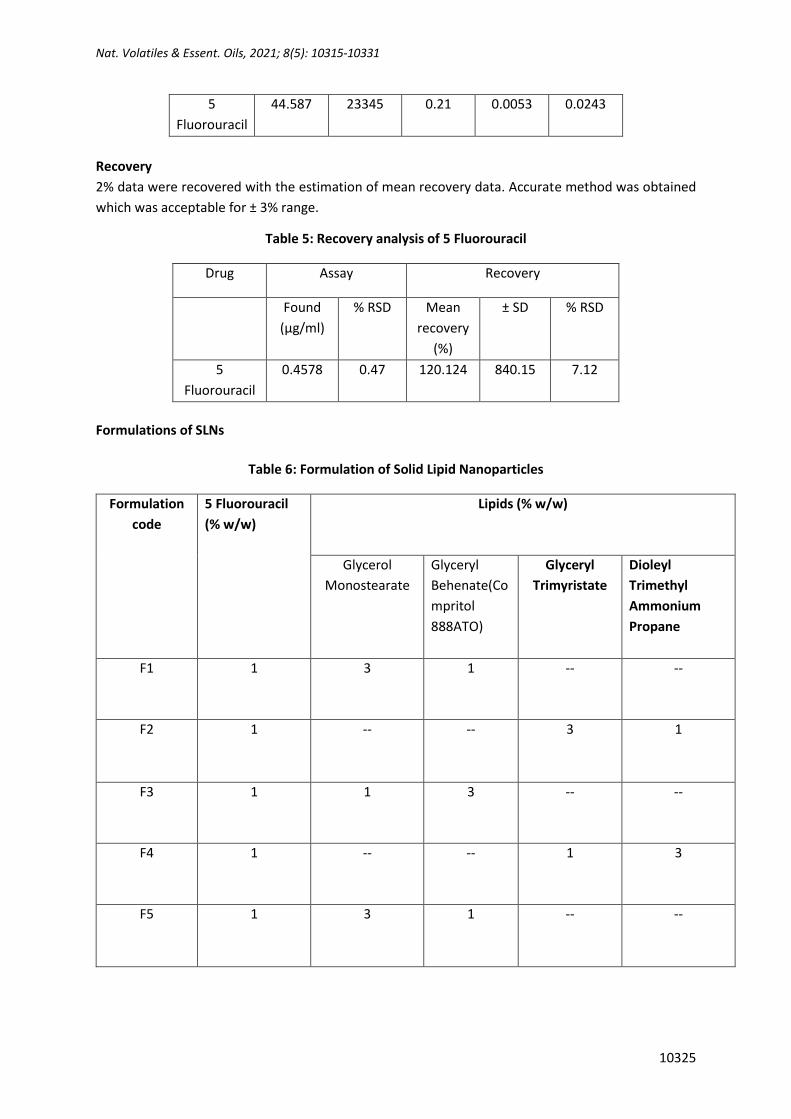
Limits of Detection and Limit of Quantitation
LOD and LOQ were estimated for the standard deviation and standard curve of slope. LOD and LOQ
were calculated as 0.0053 and 0.0243 for 5 Fluorouracil.
Table 4: Results of LOD and LOQ
Drug SD Slope %RSD LOD LOQ
Nat. Volatiles & Essent. Oils, 2021; 8(5): 10315-10331
10325
5
Fluorouracil
44.587 23345 0.21 0.0053 0.0243
Recovery
2% data were recovered with the estimation of mean recovery data. Accurate method was obtained
which was acceptable for ± 3% range.
Table 5: Recovery analysis of 5 Fluorouracil
Drug Assay Recovery
Found
(µg/ml)
% RSD
Mean
recovery
(%)
± SD
% RSD
5
Fluorouracil
0.4578 0.47
120.124
840.15 7.12
Formulations of SLNs
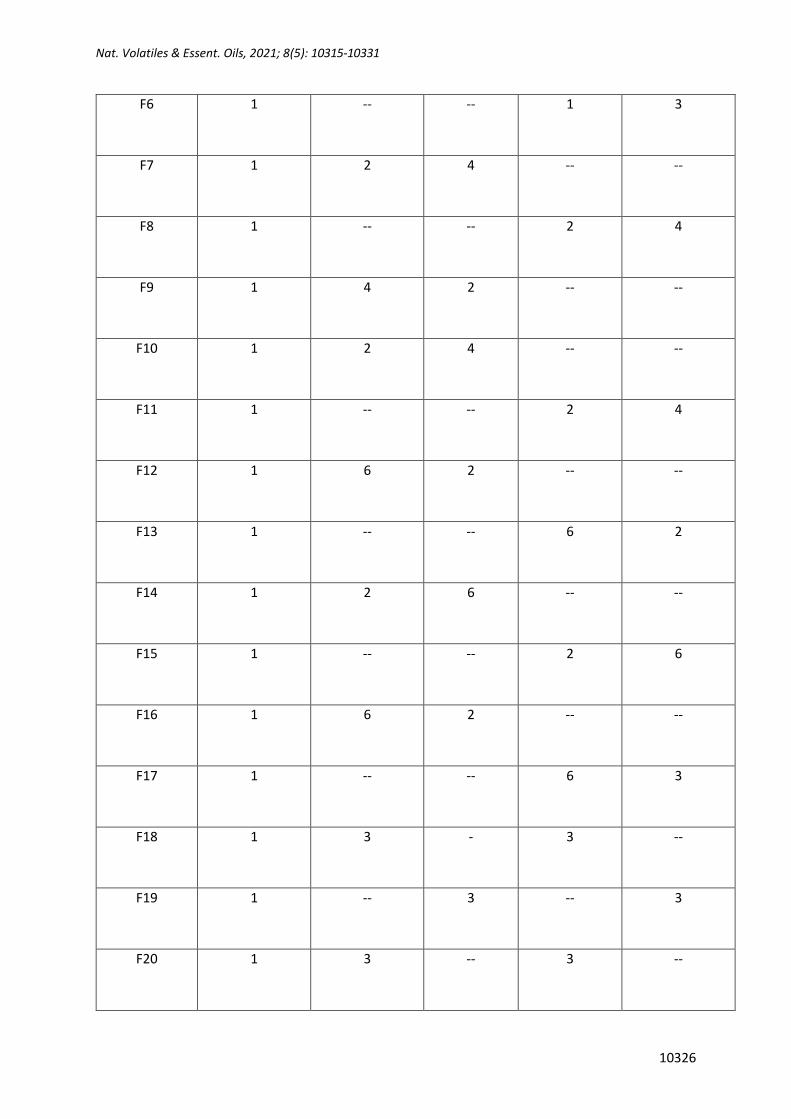
Table 6: Formulation of Solid Lipid Nanoparticles
Formulation
code
5 Fluorouracil
(% w/w)
Lipids (% w/w)
Glycerol
Monostearate
Glyceryl
Behenate(Co
mpritol
888ATO)
Glyceryl
Trimyristate
Dioleyl
Trimethyl
Ammonium
Propane
F1 1 3 1 -- --
F2 1 -- -- 3 1
F3 1 1 3 -- --
F4 1 -- -- 1 3
F5 1 3 1 -- --
Nat. Volatiles & Essent. Oils, 2021; 8(5): 10315-10331
10326
F6 1 -- -- 1 3
F7 1 2 4 -- --
F8 1 -- -- 2 4
F9 1 4 2 -- --
F10 1 2 4 -- --
F11 1 -- -- 2 4
F12 1 6 2 -- --
F13 1 -- -- 6 2
F14 1 2 6 -- --
F15 1 -- -- 2 6
F16 1 6 2 -- --
F17 1 -- -- 6 3
F18 1 3 - 3 --
F19 1 -- 3 -- 3
F20 1 3 -- 3 --
Nat. Volatiles & Essent. Oils, 2021; 8(5): 10315-10331
10327
Surfactant: Poloxamer 188, Sodium Taurocholate Cryoprotectant: Mannitol
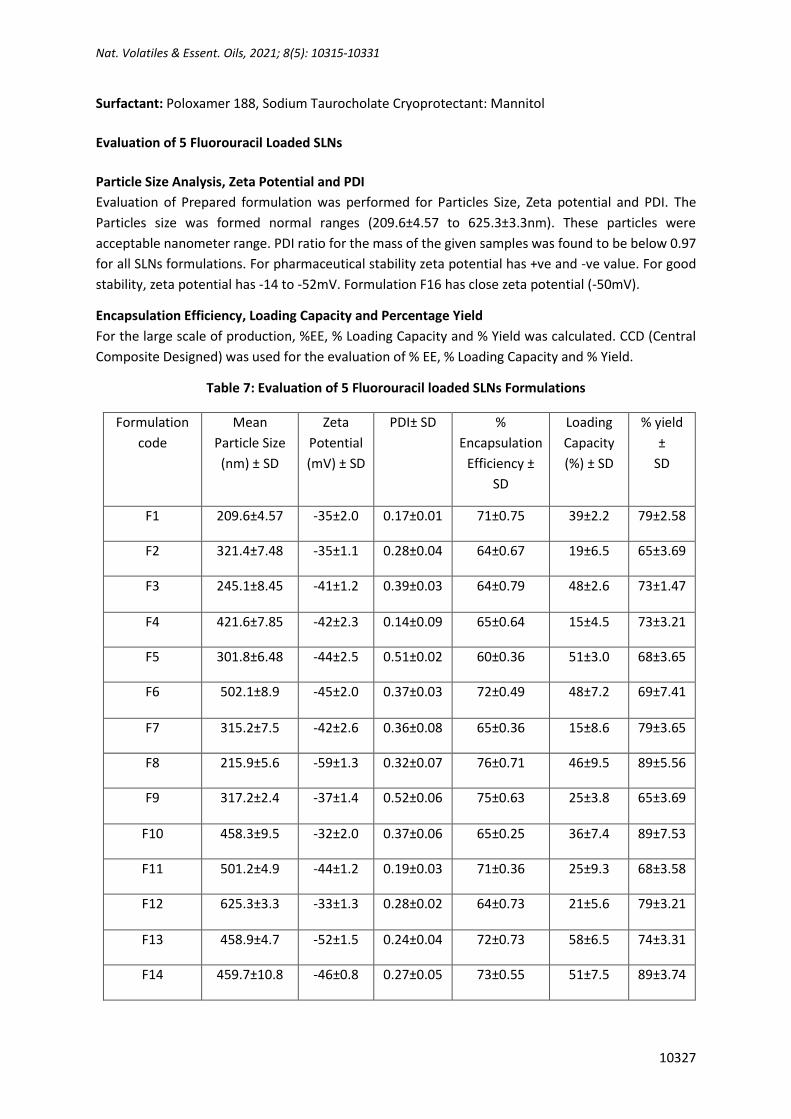
Evaluation of 5 Fluorouracil Loaded SLNs
Particle Size Analysis, Zeta Potential and PDI
Evaluation of Prepared formulation was performed for Particles Size, Zeta potential and PDI. The
Particles size was formed normal ranges (209.6±4.57 to 625.3±3.3nm). These particles were
acceptable nanometer range. PDI ratio for the mass of the given samples was found to be below 0.97
for all SLNs formulations. For pharmaceutical stability zeta potential has +ve and -ve value. For good
stability, zeta potential has -14 to -52mV. Formulation F16 has close zeta potential (-50mV).
Encapsulation Efficiency, Loading Capacity and Percentage Yield
For the large scale of production, %EE, % Loading Capacity and % Yield was calculated. CCD (Central
Composite Designed) was used for the evaluation of % EE, % Loading Capacity and % Yield.
Table 7: Evaluation of 5 Fluorouracil loaded SLNs Formulations
Formulation
code
Mean
Particle Size
(nm) ± SD
Zeta
Potential
(mV) ± SD
PDI± SD
%
Encapsulation
Efficiency ±
SD
Loading
Capacity
(%) ± SD
% yield
±
SD
F1 209.6±4.57 -35±2.0 0.17±0.01 71±0.75 39±2.2 79±2.58
F2 321.4±7.48 -35±1.1 0.28±0.04 64±0.67 19±6.5 65±3.69
F3 245.1±8.45 -41±1.2 0.39±0.03 64±0.79 48±2.6 73±1.47
F4 421.6±7.85 -42±2.3 0.14±0.09 65±0.64 15±4.5 73±3.21
F5 301.8±6.48 -44±2.5 0.51±0.02 60±0.36 51±3.0 68±3.65
F6 502.1±8.9 -45±2.0 0.37±0.03 72±0.49 48±7.2 69±7.41
F7 315.2±7.5 -42±2.6 0.36±0.08 65±0.36 15±8.6 79±3.65
F8 215.9±5.6 -59±1.3 0.32±0.07 76±0.71 46±9.5 89±5.56
F9 317.2±2.4 -37±1.4 0.52±0.06 75±0.63 25±3.8 65±3.69
F10 458.3±9.5 -32±2.0 0.37±0.06 65±0.25 36±7.4 89±7.53
F11 501.2±4.9 -44±1.2 0.19±0.03 71±0.36 25±9.3 68±3.58
F12 625.3±3.3 -33±1.3 0.28±0.02 64±0.73 21±5.6 79±3.21
F13 458.9±4.7 -52±1.5 0.24±0.04 72±0.73 58±6.5 74±3.31
F14 459.7±10.8 -46±0.8 0.27±0.05 73±0.55 51±7.5 89±3.74
Nat. Volatiles & Essent. Oils, 2021; 8(5): 10315-10331
10328
F15 357.19±9.7 -52±0.9 0.35±0.09 63±0.29 54±5.5 90±4.89
F16 328.14±2.5 -49±2.4 0.44±0.11 78±0.36 58±6.7 89±6.54
F17 457.18±6.8 -59±2.1 0.18±0.08 63±0.45 48±8.9 78±3.21
F18 369±11.5 -57±1.3 0.54±0.09 62±0.22 58±9.1 69±7.41
F19 478.8±2.8 -58±1.2 0.34±0.07 66±0.69 48±3.9 72±5.80
F20 391.5±4.5 -49±1.9 0.17±0.02 69±0.36 15±6.5 86±3.25
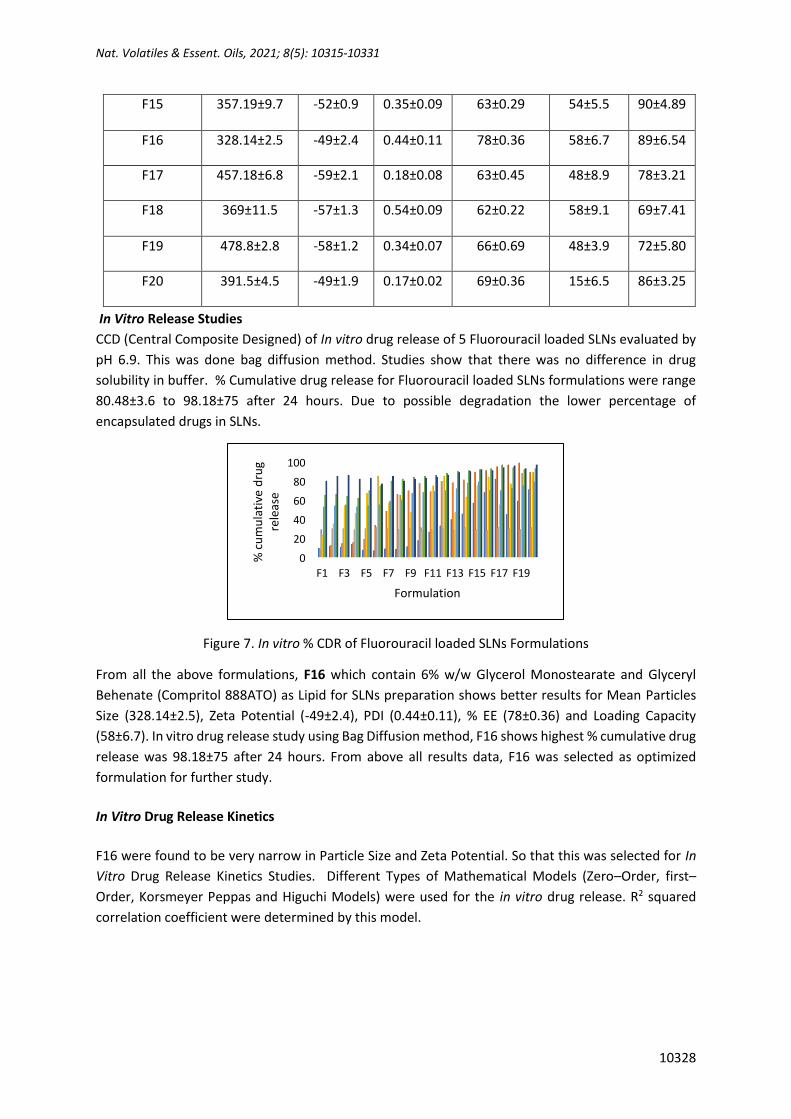
In Vitro Release Studies
CCD (Central Composite Designed) of In vitro drug release of 5 Fluorouracil loaded SLNs evaluated by
pH 6.9. This was done bag diffusion method. Studies show that there was no difference in drug
solubility in buffer. % Cumulative drug release for Fluorouracil loaded SLNs formulations were range
80.48±3.6 to 98.18±75 after 24 hours. Due to possible degradation the lower percentage of
encapsulated drugs in SLNs.
Figure 7. In vitro % CDR of Fluorouracil loaded SLNs Formulations
From all the above formulations, F16 which contain 6% w/w Glycerol Monostearate and Glyceryl
Behenate (Compritol 888ATO) as Lipid for SLNs preparation shows better results for Mean Particles
Size (328.14±2.5), Zeta Potential (-49±2.4), PDI (0.44±0.11), % EE (78±0.36) and Loading Capacity
(58±6.7). In vitro drug release study using Bag Diffusion method, F16 shows highest % cumulative drug
release was 98.18±75 after 24 hours. From above all results data, F16 was selected as optimized
formulation for further study.
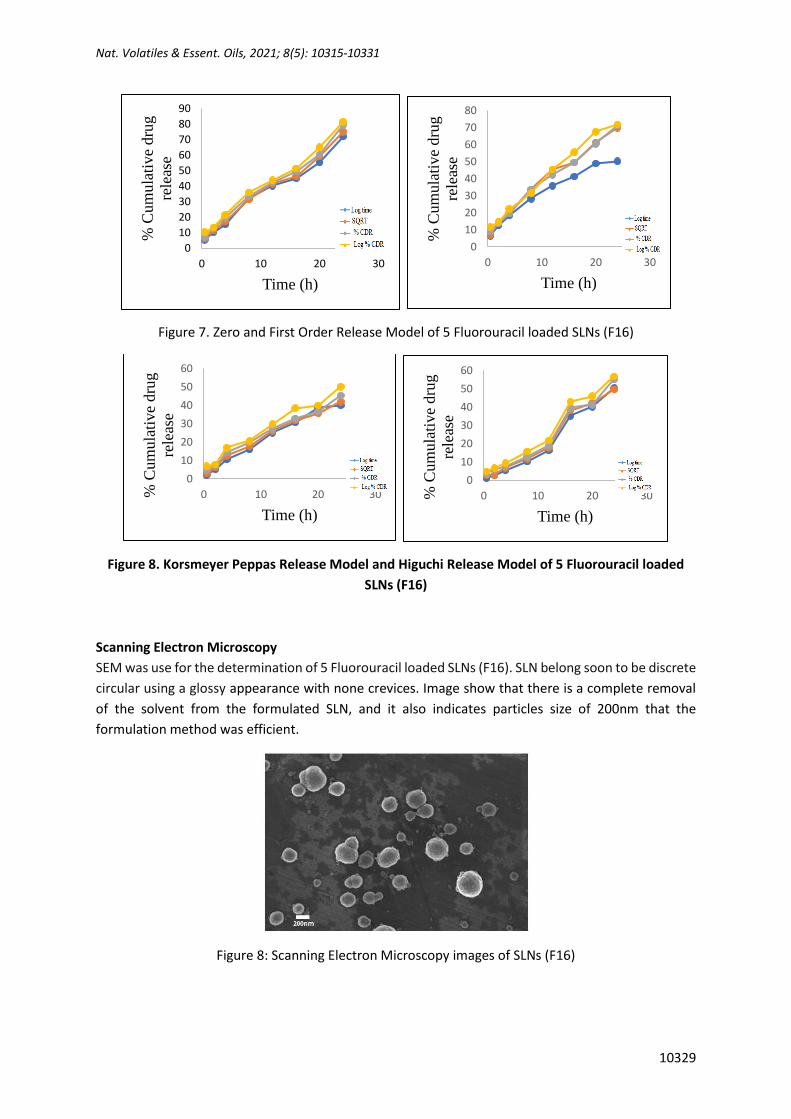
In Vitro Drug Release Kinetics
F16 were found to be very narrow in Particle Size and Zeta Potential. So that this was selected for In
Vitro Drug Release Kinetics Studies. Different Types of Mathematical Models (Zero–Order, first–
Order, Korsmeyer Peppas and Higuchi Models) were used for the in vitro drug release. R2 squared
correlation coefficient were determined by this model.
0
20
40
60
80
100
F1 F3 F5 F7 F9 F11 F13 F15 F17 F19
% c
um
ula
tive
dru
g re
leas
e
Formulation
Nat. Volatiles & Essent. Oils, 2021; 8(5): 10315-10331
10329
Figure 7. Zero and First Order Release Model of 5 Fluorouracil loaded SLNs (F16)
Figure 8. Korsmeyer Peppas Release Model and Higuchi Release Model of 5 Fluorouracil loaded
SLNs (F16)
Scanning Electron Microscopy
SEM was use for the determination of 5 Fluorouracil loaded SLNs (F16). SLN belong soon to be discrete
circular using a glossy appearance with none crevices. Image show that there is a complete removal
of the solvent from the formulated SLN, and it also indicates particles size of 200nm that the
formulation method was efficient.
Figure 8: Scanning Electron Microscopy images of SLNs (F16)
0
10
20
30
40
50
60
70
80
90
0 10 20 30
% C
um
ula
tive
dru
g
rele
ase
Time (h)
0
10
20
30
40
50
60
70
80
0 10 20 30
% C
um
ula
tive
dru
g
rele
ase
Time (h)
0
10
20
30
40
50
60
0 10 20 30% C
um
ula
tive
dru
g
rele
ase
Time (h)
0
10
20
30
40
50
60
0 10 20 30% C
um
ula
tive
dru
g
rele
ase
Time (h)
Nat. Volatiles & Essent. Oils, 2021; 8(5): 10315-10331
10330
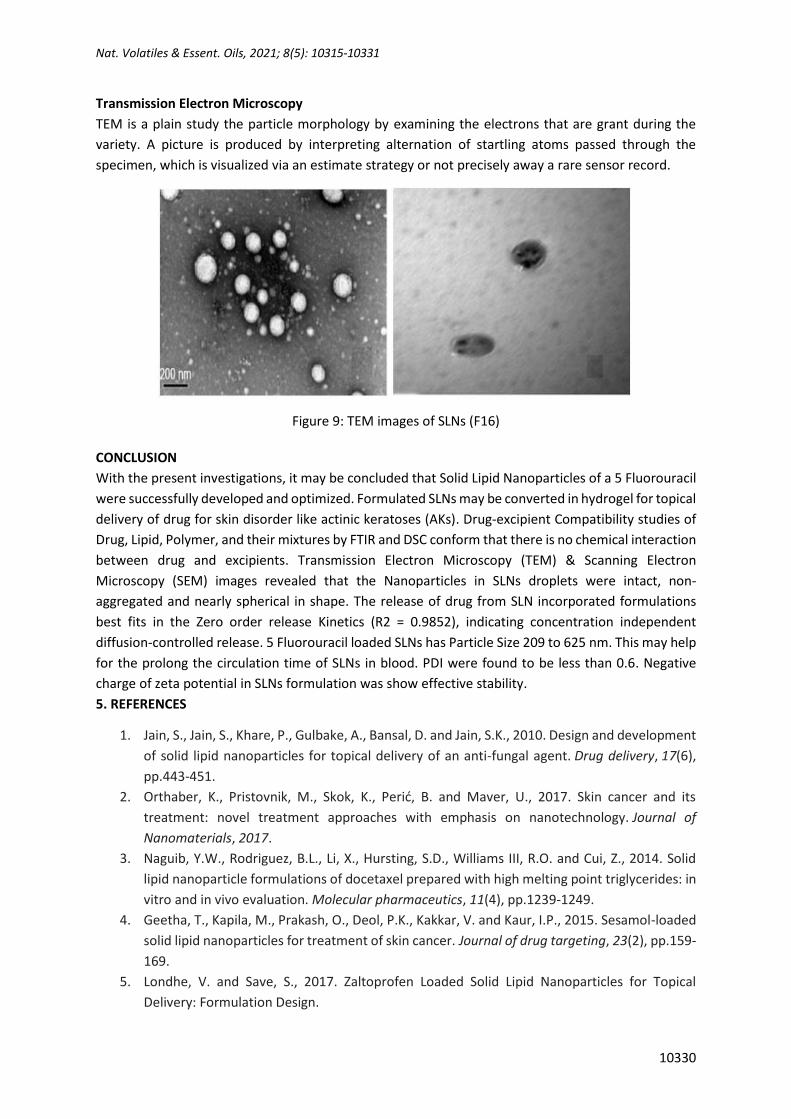
Transmission Electron Microscopy
TEM is a plain study the particle morphology by examining the electrons that are grant during the
variety. A picture is produced by interpreting alternation of startling atoms passed through the
specimen, which is visualized via an estimate strategy or not precisely away a rare sensor record.
Figure 9: TEM images of SLNs (F16)
CONCLUSION
With the present investigations, it may be concluded that Solid Lipid Nanoparticles of a 5 Fluorouracil
were successfully developed and optimized. Formulated SLNs may be converted in hydrogel for topical
delivery of drug for skin disorder like actinic keratoses (AKs). Drug-excipient Compatibility studies of
Drug, Lipid, Polymer, and their mixtures by FTIR and DSC conform that there is no chemical interaction
between drug and excipients. Transmission Electron Microscopy (TEM) & Scanning Electron
Microscopy (SEM) images revealed that the Nanoparticles in SLNs droplets were intact, non-
aggregated and nearly spherical in shape. The release of drug from SLN incorporated formulations
best fits in the Zero order release Kinetics (R2 = 0.9852), indicating concentration independent
diffusion-controlled release. 5 Fluorouracil loaded SLNs has Particle Size 209 to 625 nm. This may help
for the prolong the circulation time of SLNs in blood. PDI were found to be less than 0.6. Negative
charge of zeta potential in SLNs formulation was show effective stability.
5. REFERENCES
1. Jain, S., Jain, S., Khare, P., Gulbake, A., Bansal, D. and Jain, S.K., 2010. Design and development
of solid lipid nanoparticles for topical delivery of an anti-fungal agent. Drug delivery, 17(6),
pp.443-451.
2. Orthaber, K., Pristovnik, M., Skok, K., Perić, B. and Maver, U., 2017. Skin cancer and its
treatment: novel treatment approaches with emphasis on nanotechnology. Journal of
Nanomaterials, 2017.
3. Naguib, Y.W., Rodriguez, B.L., Li, X., Hursting, S.D., Williams III, R.O. and Cui, Z., 2014. Solid
lipid nanoparticle formulations of docetaxel prepared with high melting point triglycerides: in
vitro and in vivo evaluation. Molecular pharmaceutics, 11(4), pp.1239-1249.
4. Geetha, T., Kapila, M., Prakash, O., Deol, P.K., Kakkar, V. and Kaur, I.P., 2015. Sesamol-loaded
solid lipid nanoparticles for treatment of skin cancer. Journal of drug targeting, 23(2), pp.159-
169.
5. Londhe, V. and Save, S., 2017. Zaltoprofen Loaded Solid Lipid Nanoparticles for Topical
Delivery: Formulation Design.
Nat. Volatiles & Essent. Oils, 2021; 8(5): 10315-10331
10331
6. Tosta, F.V., Andrade, L.M., Mendes, L.P., Anjos, J.L.V., Alonso, A., Marreto, R.N., Lima, E.M.
and Taveira, S.F., 2014. Paclitaxel-loaded lipid nanoparticles for topical application: the
influence of oil content on lipid dynamic behavior, stability, and drug skin penetration. Journal
of nanoparticle research, 16(12), p.2782.
7. Kakadia, P.G. and Conway, B.R., 2014. Solid lipid nanoparticles: a potential approach for
dermal drug delivery. American Journal of Pharmacological Sciences, 2(5A).
8. Ekambaram, P., Sathali, A.A.H. and Priyanka, K., 2012. Solid lipid nanoparticles: a review. Sci
Rev Chem Commun, 2(1), pp.80-102.
9. Sonawane, R., Harde, H., Katariya, M., Agrawal, S. and Jain, S., 2014. Solid lipid nanoparticles-
loaded topical gel containing combination drugs: an approach to offset psoriasis. Expert
opinion on drug delivery, 11(12), pp.1833-1847.
10. Chen-yu, G., Chun-fen, Y., Qi-lu, L., Qi, T., Yan-wei, X., Wei-na, L., Guang-xi, Z. (2012).
Development of a quercetin-loaded nanostructured lipid carrier formulation for topical
delivery. Int J Pharm 430: 292–98.
11. Chow, K. T., Chan, L. W. and Heng, P. W. S. (2008). Characterization of spreadability of
nonaqueous ethylcellulose gel matrices using dynamic contact angle. J Pharm Sci 97: 3467–
82.
12. Cirri, M., Bragagni, M., Mennini, N. and Mura, P. (2012). Development of a new delivery
system consisting in ‘‘drug–in cyclodextrin–in nanostructured lipid carriers’’ for ketoprofen
topical delivery. Eur J Pharm Biopharm 80: 46–53.
13. Cohen-Avrahami, M., Libster, D., Aserin, A. and Garti, N. (2012). Penetratininduced
transdermal delivery from HII mesophases of sodium diclofenac. J Control Release 159: 419–
28.
Related Documents