Electronic copy available at: http://ssrn.com/abstract=1952199 How Important Is Capital Structure Policy to Firm Survival? Y. Peter Chung A. Gary Anderson Graduate School of Management University of California, Riverside [email protected] Hyun Seung Na College of Business City University of Hong Kong [email protected] Richard Smith* A. Gary Anderson Graduate School of Management University of California, Riverside [email protected] Current draft: February 20, 2013 Abstract If there is an economically important optimal capital structure, then firms that deviate too far from the optimum will face greater risk of failure or acquisition. Using data from the oil industry we find no significant evidence that capital structure policy affects acquisition or failure probability. Firms appear to increase leverage when they face attractive growth opportunities or when poor operating performance reduces equity value or compels borrowing. Firms are acquired when rapid growth has reduced financial slack. In a clinical examination, we address the question of how firms with persistently low leverage can operate and survive for many years without being targeted for acquisition. Our evidence supports the pecking‐order hypothesis including acquisition among potential financing sources. Keywords: Capital structure, Bankruptcy, Acquisition, Oil exploration and development JEL Codes: G32, G33, G34, L25, L71 * Corresponding author. We thank Warren Bailey, Harry DeAngelo, Jun‐Koo Kang, and David Mayers, for comments on prior drafts. Chung and Smith appreciate the financial support from the A. Gary Anderson Graduate School of Management for this research.

Welcome message from author
This document is posted to help you gain knowledge. Please leave a comment to let me know what you think about it! Share it to your friends and learn new things together.
Transcript
Electronic copy available at: http://ssrn.com/abstract=1952199
How Important Is Capital Structure Policy to Firm Survival?
Y. Peter Chung
A. Gary Anderson Graduate School of Management University of California, Riverside
Hyun Seung Na College of Business
City University of Hong Kong [email protected]
Richard Smith*
A. Gary Anderson Graduate School of Management University of California, Riverside
Current draft: February 20, 2013
Abstract
If there is an economically important optimal capital structure, then firms that deviate too far from the optimum will face greater risk of failure or acquisition. Using data from the oil industry we find no significant evidence that capital structure policy affects acquisition or failure probability. Firms appear to increase leverage when they face attractive growth opportunities or when poor operating performance reduces equity value or compels borrowing. Firms are acquired when rapid growth has reduced financial slack. In a clinical examination, we address the question of how firms with persistently low leverage can operate and survive for many years without being targeted for acquisition. Our evidence supports the pecking‐order hypothesis including acquisition among potential financing sources. Keywords: Capital structure, Bankruptcy, Acquisition, Oil exploration and development JEL Codes: G32, G33, G34, L25, L71
* Corresponding author. We thank Warren Bailey, Harry DeAngelo, Jun‐Koo Kang, and David Mayers, for comments on prior drafts. Chung and Smith appreciate the financial support from the A. Gary Anderson Graduate School of Management for this research.

Electronic copy available at: http://ssrn.com/abstract=1952199
How Important Is Capital Structure Policy to Firm Survival?
Current draft: February 20, 2013
Abstract If there is an economically important optimal capital structure, then firms that deviate too far from the optimum will face greater risk of failure or acquisition. Using data from the oil industry we find no significant evidence that capital structure policy affects acquisition or failure probability. Firms appear to increase leverage when they face attractive growth opportunities or when poor operating performance reduces equity value or compels borrowing. Firms are acquired when rapid growth has reduced financial slack. In a clinical examination, we address the question of how firms with persistently low leverage can operate and survive for many years without being targeted for acquisition. Our evidence supports the pecking‐order hypothesis including acquisition among potential financing sources. Keywords: Capital structure, Bankruptcy, Acquisition, Oil exploration and development JEL Codes: G32, G33, G34, L25, L71
How Important Is Capital Structure Policy to Firm Survival? 1. Introduction
The two predominant theories of corporate capital structure are the “optimal tradeoff” hypothesis
and the “pecking order” hypothesis. Under the tradeoff hypothesis, taxes, distress costs, and agency costs
combine to yield an optimal capital structure and firms are punished for deviating from that optimum
through lower risk‐adjusted returns, and potentially failure or acquisition. Under the pecking order
hypothesis, capital structure is a result of investment opportunities and capital retention policies in the
presence of asymmetric information. Firms confronted with new investment opportunities seek to
mitigate adverse selection costs by exploiting the least risky forms of financing first. Leverage increases
when investment opportunities are abundant and demand for investment capital is high. Leverage
decreases when free cash flow is high and investment opportunities are scarce. Under this hypothesis firms
are punished through the failure to maintain enough financial slack to take on investments without
incurring substantial adverse selection costs or by retaining more slack than is optimal.
The static version of the tradeoff hypothesis (Kraus and Litzenberger (1973), Jensen and Meckling
(1976), and Morellec (2004), among others) and the pure version of the pecking order hypothesis
(Donaldson (1961) and Myers and Majluf (1984)) are the simplest articulations of the competing theories.
Bridging these two are several hybrids. Fischer, Heinkel, and Zechner (1989) and others begin with the
tradeoff hypotheses and propose that empirical capital structure is dynamic. They recognize that
restructuring is subject to economies of scale so that firms can drift away from their targets. They return to
the targets, or even over‐shoot, using lumpy episodes of debt financing. From the other direction, Myers
(1984) introduces a modified pecking order, which provides that the firms face debt capacity limitations
and frictions associated with raising capital, and cannot strictly adhere to the pecking order predictions.
Synthesizing these two, DeAngelo and DeAngelo (2007) hypothesize, consistent with the tradeoff
hypothesis, that firms do have target capital structures, but that, consistent with the pecking‐order
hypothesis, they may depart from the targets by issuing debt to pursue attractive investment opportunities.

2
Moreover, the two main hypotheses are not mutually exclusive. Empirical capital structure could be
affected by considerations of both optimal tradeoff and adverse selection.
In this paper, we address the question of whether capital structure matters by examining what
happens to firms that operate with capital structures that are much different from industry norms and that
deviate materially from endogenous estimates of capital structure policy. Our empirical approach is most
directly a test of the optimal tradeoff hypothesis. If there is an economically important optimal capital
structure, firms with capital structures much different from industry norms and from endogenous estimates
of capital structure policy are most likely to be operating away from what is optimal and will be at
competitive disadvantage. Such firms are less likely to be able to sustain profitable operations and are
more likely to be attractive as acquisition targets by those who would seek to correct the capital structure.
Those that operate close to their optimums should be able to generate more net cash flow and be better
able to take on new investment opportunities, including by acquisition of firms that operate away from
their optimums or that fail because of having chosen an inappropriate capital structure.1 Accordingly, we
measure the effects of leverage on firm survival, acquisition, and failure. We also examine the effects of
leverage on (revenue) market share of firms, and we look specifically at a subsample of low‐leverage firms,
as they are the ones most likely to be acquired if the debt tax shelter is an important driver of firm value.
Our methodological framework reflects a return to basics. Alchian (1950) argues that the
deliberate pursuit of maximum profit (in our case, through choice of an optimal capital structure) is
unrealistic as a decision construct since the information necessary to ascertain the optimum is not
observable. Nonetheless, he reasons that even if managerial choices are random, the environment in
which firms compete will identify choices that have survival value. Stigler (1958) uses this reasoning to test
for the presence of scale economies in the steel, automobile, and oil refining industries. The underlying
1 Campello (2003) studies the relation between capital structure and operating performance. She finds that during recessions debt financing has a negative impact on firm sales growth in industries in which rivals are relatively unlevered. There is no similar effect during booms or in high debt industries. Campello (2006) finds a non‐monotonic relation between debt financing and competitive conduct. Moderate debt is associated with sales gains but high debt leads to product market underperformance.
3
logic of Stigler’s “survivorship” approach is that good strategies, in the context of a competitive market,
should survive and grow while others should diminish.2
We apply this approach to the U.S. oil industry: focusing specifically on crude oil exploration and
development. We selected the oil industry for three main reasons: First, there are enough participants to
make large‐scale empirical analysis feasible, but at the same time, the single‐industry focus enables us to
examine several companies on a micro level. Second, because the end product is a commodity, firms
compete mainly on cost and, except for differences in profitability and growth opportunities, the tradeoff
and pecking order hypotheses imply similarity of capital structure across firms. Third, it is the same
industry that was studied by Modigliani and Miller (1958) in their original study of capital structure
irrelevance.3 The narrow focus on oil exploration firms yields a large sample but still enables us to fully
investigate each of the firms in the sample for appropriate inclusion, to use a narrower classification than a
2‐, 3‐, or 4‐digit industry code, and to conduct a limited clinical analysis on firms with extreme capital
structures.
We use four approaches to test the optimal tradeoff hypothesis against the alternative pecking
order hypothesis. First, we use single‐stage probit and multinomial probit models to test whether firm
survival, acquisition, and failure probabilities are affected by capital structure. The single‐stage models
enable us to examine non‐monotonic relations between capital structure and these outcome variables but
are subject to challenge because they do not formally control for the endogeneity of observed leverage
ratios. Second, to confirm the single‐stage results, and to allow for cross‐sectional variation in optimal
capital structure, we endogenize capital structure in a two‐stage model. However, because of data
limitations, we are unable to investigate non‐monotonic relationships in this model. Third, we test for the
presence of a static or dynamic optimal capital structure by aggregating firms into leverage‐based deciles
2 It is the strategies that gain share, and not necessarily the individual firms. Stigler (1958) aggregates by size, and looks at aggregated share changes in size groupings. 3 Modigliani and Miller (1958) also study electric utilities. However, as Myers (1984) notes, regulated firms are normally able to pass through inefficiencies related to capital structure, and thus are not well suited for tests of the tradeoff hypothesis.
4
and testing whether aggregated market share changes are related to factors that could affect optimal
capital structure under the tradeoff hypothesis. Fourth, we undertake a brief clinical study of firms with
persistent low leverage to gain a better understanding of how low leverage can persist over many years.
Leverage measures vary across studies. At one extreme, Lemmon, Roberts, and Zender (2008),
DeAngelo and DeAngelo (2007), and others define leverage in a way that emphasizes the potential tax
advantage of debt financing. They measure leverage as the ratio of interest‐bearing debt to total assets.
Implicitly, spontaneous financing and non‐interest‐bearing liabilities are interpreted to reduce leverage. At
the other extreme, Baker and Wurgler (2002) and others define leverage in a way that emphasizes
information asymmetry. They include preferred equity in leverage and exclude convertible debt.4 Other
studies use intermediate measures. Fama and French (2005), for example, define leverage as total
liabilities to total assets. Welch (2011) also argues for this measure, noting that it has the advantage to
treating both financial and nonfinancial liabilities as prior claims to equity. In this study, we report results
for the two extreme measures, which, for convenience, we refer to as the LRZ and BW measures. We also
assess whether total liabilities to total assets (which we refer to as the W measure) produces materially
different results. The W measure results are discussed but not reported except in descriptive statistics
tables. Generally, the results are consistent, but somewhat stronger for the BW measure than for the LRZ
measure. The W measure results are similar to those for BW.
Using the BW leverage measure in the probit analysis, firms with high book or market leverage in
one year are significantly more likely than others to be delisted from Compustat in the next. Delisting can
be due to either acquisition or failure, both of which probabilities are significantly higher for firms with high
leverage in the prior year. The relationships to delisting and failure are nonlinear, with failure probability
increasing disproportionately with leverage. The relationship to acquisition probability is nonmonotonic, as
we also find that firms with extreme low leverage are significantly more likely to be acquired in the
subsequent year. Using the LRZ measure, the signs of these relationships are the same, but only the
4 Appendix B provides formal definitions of the leverage measures.
5
delisting and failure probabilities are significantly related to leverage in the prior year. The difference in
findings makes sense because the LRZ measure is a less comprehensive indicator of depletion of financial
slack but a potentially better measure of exposure to default risk.
While these results seem to support optimal tradeoff, leverage in the year before delisting is not a
reliable measure of capital structure policy. We find that leverage ratios increase materially in the years
just prior to delisting. Using leverage from three years prior as an indicator of capital structure policy, and
controlling for leverage in the year before delisting, we find no significant support for the optimal tradeoff
hypothesis. Rather, the evidence shows that leverage increases when firms are in trouble for more
fundamental reasons or when the firm is growing rapidly, a result more consistent with the pecking order
hypothesis.
In the two‐stage results with endogenous capital structure that use corporate tax rates, oil prices,
and/or lags of firm characteristics as instruments, we confirm the above finding, in that we find that capital
structure policy is not significantly related to survival probability. 5 This conclusion holds regardless of
which measure is used and whether leverage is expressed as book value or market value.
We also find that neither contemporaneous nor lagged leverage measures are significant in
explaining changes in revenue shares of leverage deciles over time. In the clinical portion of our analysis,
we find that firms can operate for many years with low leverage, high profitability, and a high effective tax
rate, suggesting that any disadvantages of very high leverage are not sufficient to trigger control events.
Thus, the firm’s tax‐based capital structure policy does not appear to be of much importance to
survival. Firms with attractive growth options and those that need cash to fund their continuing
5 Similarly, Wintoki, Linck, and Netter (2012) examine causal relation between board structure and firm performance and find no significant effect of board structure, a result inconsistent with earlier findings that do not take account of endogeneity. They apply a dynamic panel generalized method of moments (GMM) estimator that relies on internal instruments such as lagged variables that allows a dynamic relationship between performance and corporate governance. Our approach, which also relies on lagged variables, is somewhat different because our dependent variable is binary.

6
unprofitable operations turn to debt financing with little apparent regard to tax considerations.6 Those
with attractive growth opportunities may turn to acquisition as internal financial slack is depleted. Overall,
our capital structure policy results are consistent with the irrelevance arguments of Miller (1977) and
DeAngelo and Masulis (1980), and with the pecking order hypothesis of Myers (1984). The results suggest
that capital structure policy does not significantly matter to the survival of the firms in the oil industry.
The balance of the paper is organized as follows. Section 2 discusses the prior empirical evidence
on capital structure, while Section 3 develops our testable hypotheses based on the Stigler (1958)
survivorship approach. Section 4 describes the data and Section 5 presents the empirical analysis and
results. Section 6 concludes.
2. Prior Evidence on Capital Structure
For the most part, empirical researchers have sought to test the competing capital structure
hypotheses by observing what managers do. Do they appear to select capital structure in a manner more
consistent with optimal tradeoff or with pecking order? Despite decades of empirical research, there is
little agreement as to what the evidence means. Fama and French (2002) observe that many of the
predictions of the two theories agree and that evidence is generally consistent with the shared predictions
so that the results are not dispositive.
Leary and Roberts (2010) point to conflicting interpretations of the evidence. They note that
Shyam‐Sunder and Myers (1999) claim to find that financing patterns are consistent with pecking order but
that Frank and Goyal (2003) claim the opposite.7 Leary and Roberts also note that while Lemmon and
Zender (2008) conclude that their evidence supports the modified pecking order interpretation, Fama and
French (2005) find that pecking order cannot explain persistent low‐leverage policies.
6Under the tradeoff hypothesis, firms with positive income tax liabilities in a given year might be expected to rely more on convertible debt financing and other firms might be expected to rely more on preferred stock. In 40% of the firm years, observations in our sample relied on convertible debt, preferred stock, or both. We found no systematic relation between the choice of financing and the firm’s tax liability. In fact, financing choices that were inconsistent with the tradeoff hypothesis were somewhat more likely than those that were consistent with it. 7 These studies all use leverage measures similar to the LRZ measure.

7
There are, moreover, important regularities that do not appear to fit either theory. Minton
and Wruck (2002), for example, using the LRZ measure, find persistent “underleverage” relative to
the tradeoff hypothesis. However, Shivdasani and Stefanescu (2010) report that once pensions
are considered, firms are less conservative in their choices of leverage than previously thought,
and that they incorporate the magnitudes of pension liabilities in their capital structure decisions.
Among the Minton and Wruck findings are that low‐leverage firms have high market‐to‐book
value ratios, that the phenomenon is not specific to particular industries, and that the firms do not have
low tax rates, high non‐debt tax shelters, or severe information asymmetries. The evidence of low‐leverage
and no‐leverage firms seems to be particularly inconsistent with the tradeoff hypothesis. However, the
evidence that firms sometimes choose equity issues even when equity is not the last resort has led Fama
and French (2005) to conclude that pecking order, as a stand‐alone hypothesis, is dead.
Baker and Wurgler (2002) and Korajczyk and Levy (2003) find that firms issue equity when market
values are high.8 Attempted market timing affects capital structure because, Baker and Wurgler find, low
leverage firms are those that raised funds when their market valuations were high, while high leverage
firms are those that raised funds when their market valuations were low. Capital structure, then, is the
cumulative outcome of past attempts to time the market. In their view, attempted market timing is an
additional consideration in the real capital structure choices of firms.9
Of course, the validity of basing inferences about the economics of capital structure choice on
observation of managerial decisions is only valid if the choices actually matter. Adopting the terminology of
evolutionary biology, Miller (1977) refers to neutral mutation as adaptive or imitative behavior that serves
no useful purpose, but also does no harm. If managers believe there is an optimal capital structure, when,
in fact, there is none, their choices will appear to support optimal tradeoff. If they believe significant
adverse selection costs are associated with raising riskier forms of capital, their choices will appear to
8 The measure used by Korajczyk and Levy is similar to the LRZ measure. 9 Related to this, Welch (2004) finds that firms do not repurchase debt and equity to counteract mechanistic effects of stock market performance on market‐value capital structure.
8
support pecking order. And, if managers think they can time the market, the evidence will support
attempted market timing. The upshot is that while managerial choices can tell us what managers believe,
they cannot necessarily tell us what is true about the relationship between capital structure and value.
Only if capital structure really does matter can we make the logical leap from managerial choice to
hypothesis validity. If, in reality, there is no material cost of operating with a capital structure that is well
away from the “optimum”, then the choices simply reflect neutral mutation/imitation. The same is true if
managers incorrectly believe that adverse selection costs are material, or that they can time the market.
Several stylized facts support the notion of neutral mutation and capital structure irrelevance. For
example, leverage ratios vary cross‐sectionally but are quite stable over time. Lemmon, Roberts, and
Zender (2008) find that leverage ratios are characterized by both a transitory and a permanent component.
They find, further, that known determinants of capital structure do a poor job of explaining heterogeneity
in leverage ratios. They also find that leverage ratios converge over time, moving toward more moderate
levels but are quite stable over long periods. Therefore, they argue, any explanation of capital structure
must be reconciled with the converging, but long‐lived stability of leverage ratios. Persistence of extreme
leverage ratios is an aspect of our empirical analysis.
Graham and Leary (2011) review the literature and evidence on capital structure and question
whether capital structure effects are either (i) important but not detected in empirical studies or (ii) the
evidence is consistent with neutral mutation except in extreme cases. They find that most of the variation
in observed capital structures is within‐industry variation, as opposed to within‐firm over time or across
industries. However, they also find that standard variables used to explain observed capital structures have
little ability to explain within‐industry variation. They also observe that the value effects of capital structure
choices appear to be modest over a broad range. Our evidence is consistent in supporting neutral mutation
and the pecking order hypothesis.
3. Testable Hypotheses
9
No previous study, to our knowledge, has focused on the relationship between capital structure
choice and survival probability. If there is an economically important optimal capital structure, we presume
there is some commonality within an industry in terms of the important factors that influence the optimum.
Indeed, Frank and Goyal (2008) find that industry is one of the most reliable factors explaining the capital
structure choices and that industry subsumes a number of factors that are of lesser importance. On the
other hand, Minton and Wruck (2002) find that financial conservatism is not an industry‐based
phenomenon, so that capital structure extremes can exist within industries and Graham and Leary (2011)
observe that within‐industry variance of capital structure is high and hard to explain empirically.
In a spirit somewhat similar to our approach, Korteweg (2010) estimates the benefits of leverage by
assuming that asset betas are common within an industry. Leary and Roberts (2010) find that industry and
year fixed effects alone do a good job of explaining leverage choices. Lemmon, Roberts, and Zender (2008),
however, find that controlling for standard factors including industry leaves most of the variation in capital
structure unexplained and driven by unobservable effects that are time‐invariant.
We control for industry effects through sample construction and for other standard factors by
inclusion of control variables. It is not necessary that we fully account for the factors that determine
optimal capital structure. Rather, in one of our approaches, we rely on the Bayesian reasoning that, if an
economically important optimum exists, then firms with very low leverage relative to the average are more
likely to be under‐levered than over‐levered, and the converse for firms with very high leverage. In a
second approach, we endogenize capital structure policy and test whether the policy is significantly related
to survival probability. In the first approach, if the tradeoff theory is correct, we should find that firms
with extreme capital structures are (i) more likely to become targets or to fail and/or (ii) more likely to be
insulated from the control market and product market competition in various ways, and (iii) have a
tendency to regress toward the mean. If capital structure is irrelevant, we should find that capital structure
policy is not significantly related to survival probability. Regression toward the mean could occur even if
capital structure does not matter, if there are important frictions to raising capital or if managers believe,

10
incorrectly, that capital structure is important. In the second approach, if the tradeoff theory is incorrect
we should find little relation between endogenized capital structure and survival probability.
One might think that if capital structure is important we should find little within‐industry variation.
Yet, we do not see such evidence in the existing literature. Possible explanations are that capital structure
is not very important, that even within an industry there are substantial differences in what would be
optimal, or that firms with suboptimal capital structures are insulated from competition. To address this,
our panel data study includes some clinical study details as overlay.
4. Data and Summary Statistics
4.1 Data
In their original 1958 paper, Modigliani and Miller support their irrelevance proposition with
evidence from two industries, including oil companies. They present evidence that the after tax rate of
return is invariant to leverage. We follow their example, by also focusing on oil companies. The industry
has the advantage of including a large number of companies with publicly available data. Because the
industry includes an array of activities, we limit the study to crude oil exploration and development
(exploration firms).
To identify firms for inclusion in the sample, we first identify all Compustat firms classified in the oil
industry on the basis of current or historical SIC codes, current or historical NAICS codes, S&P Global
Industry codes, or the former S&P industry codes. Appendix A lists the codes we use to construct the initial
sample. A firm is tentatively included if, in any year from 1950 through 2007, it is classified into any of the
codes listed in the appendix. From this sample, we exclude all non‐US firms.
The industry codes sometimes identify firms that are not appropriately classified as being in the oil
industry. These include, for example, pipeline firms, chemical firms, ethanol producers, and firms involved
primarily in minerals mining. By inspection, we exclude these firms. We also exclude oil royalty trusts that
are included in the Compustat database. From the remaining sample, we exclude enterprises for which no

11
stock price information is available, such as divisions of public companies. Because some of the
observations are for small firms for which details of financial information often are not available, we
impose the screen that for inclusion in the final sample a firm must have at least $25 million (in real year‐
2000 dollars) of total assets in the year of its first market price observation.
Next, we use the business descriptions from Compustat, Factiva, and Internet searches to verify the
scope of activity of each firm. Based on these searches, we classify firms as either exploration firms or
refiners. When we cannot verify the activity of the firm, we drop it from the sample.
Because of concerns about survivorship bias in the early Compustat data, we further limit the
sample to firm‐years from 1970 on.10 Finally, we drop refiners because of the small sample size of that
group, their fundamental difference from exploration firms, the limited variation in their capital structures,
and the near absence (one observation) of “failures”.11 Thus, the final sample includes 218 exploration
firms comprising 2015 firm‐years.
4.2. Summary Statistics
An observation in our panel is a firm‐year. Table 1 provides descriptive statistics on sample firms.
Exploration firms have an average of 9.2 yearly observations. Of these firms, well over half are acquired or
fail during our sample period; 53.7% (117 firms) are acquired and 18.8% (41 firms) fail via bankruptcy,
liquidation, or other delisting from Compustat. Normally, firms are delisted when they no longer meet the
requirements for continued exchange listing and may eventually fail. While acquisition is more likely than
failure, a number of the acquisitions occur in the face of what appears to be imminent failure. In such
cases, we rely on the Compustat and CRSP deletion codes and where they are different we review Factiva
to determine the classification.
10 Kothari et al. (1995) discuss the potential survival bias issue in early year data of Compustat. 11 For some firms there was inconsistency in identity changes between CRSP and Compustat. We searched for information on these cases using Factiva and determined whether there had been a fundamental change in identity such as acquisition by another firm.
12
Table 2 shows the time‐series distribution of firm‐year observations. The number of exploration
firms rose sharply during the period around the first OPEC oil shock, and then the industry experienced a
wave of failures and consolidation during the 1980s. The table shows increasing numbers of firms through
the mid‐1990s, followed again by consolidation and attrition.
Figure 1 is a time‐series plot of market shares, aggregated into deciles based on BW book‐leverage
ratios with constant decile breakpoints determined over all observations. Because we find that book
leverage increases endogenously prior to delisting, the figure is based on book leverage measured three
years before the market share observation year.12 A decile can gain share if firms within the decile gain
share or if firms with high shares move into the decile and those with low shares move out. Patterns of
dynamically shifting market shares by decile are similar to those shown in Figure 1 if (i) decile breakpoints
are allowed to vary annually, (ii) leverage is measured in the same year as market share, or (iii) the LRZ
measure is used instead.
It is noteworthy that firms in the bottom leverage decile consistently account for a small fraction of
the total market and that in most years the highest‐levered firm in this decile has a leverage ratio of less
than 18.0%. From Figure 1, systematic shifting of market shares among deciles is apparent over time.
Firms in the bottom five deciles account for almost half of the total market during the first four years, up to
the point of the first OPEC oil price shock13. Following that, for most of the next three decades, firms in the
top few leverage deciles account for roughly 80% of the market. In later years, firms with low leverage
account for an increasingly large share of the market. Given these shifts, one might infer that managers of
larger firms act as if there is an optimal capital structure that varies over time. Alternatively, consistent
with the pecking‐order hypothesis, aggregate capital structure changes may be driven by changes in the
12 All accounting variables used in the analysis are defined in Appendix B. 13 The corresponding LRZ‐based figure shows low‐leverage firms with a small market share, except in the first few years (when the sample size is small); the highest levered firm in the low leverage decile having a LRZ book leverage ratio of 2.3%; and firms in the bottom five leverage deciles accounting for about 40% of the market during the first five years, before declining to a much lower percentage.
13
value of investment opportunities and net cash flow. It remains to be seen whether capital structure
choices are significantly related to survival probability.
5. Empirical Results and Discussions
5.1. Bivariate Tests of Differences
We hypothesize that, if there is an important optimal capital structure we should find that firms
located close to the optimum flourish while others subsist, fail, or are acquired. In Table 3, we report
summary statistics and difference test results for sample exploration firms. The table compares leverage
ratios and other firm characteristics among groups that survived (group A), were acquired (group B), and
failed (group C). In the table, we test whether firm‐year observations in the year prior to acquisition or
failure have different capital structures than firm‐years associated with survival. We also test whether
acquisition or failure is related to firm size, profitability, market‐to‐book, tangibility of assets, or cash flow
volatility. The p‐values in the table are reported first based on the standard errors for all observations, and
second with clustering by firm. Clustered tests generally have similar significance levels to those without
clustering, indicating that within‐firm variance is similar to overall variance.
There are important differences among the groups, particularly between failed firms and the rest of
the sample. Acquired and surviving firms are similar in most respects. Observation‐year leverage ratios are
not statistically different between surviving and acquired firms, regardless of the leverage measure and
three‐year lagged leverage ratios are significantly different only for the W measure. However, observation
year and lagged leverage ratios of failed firms are significantly higher than those of either surviving or
acquired firms, except for the lagged difference between the failed and the acquired by the LRZ measure
and the lagged difference between the failed and the surviving by the W measure. There is also little
difference between observation‐year leverage and three‐year lagged leverage ratios of surviving firms or of
acquired firms, whereas, by any measure, the three‐year increase in leverage is considerable for failed firms.
In addition, failed firms are significantly smaller than surviving or acquired firms and are significantly less

14
profitable. We find that acquired firms have significantly more tangible assets than failed firms. Finally,
cash flows are much more volatile during the preceding four years for failed than for surviving or acquired
firms. There is no significant difference in cash flow volatility between surviving and acquired firms.
Overall, Table 3 suggests that leverage and other firm characteristics are significantly different
between failed firms and surviving or acquired firms in the oil industry and that acquired firms are similar to
survivors in many respects. Also, while the optimal trade‐off hypothesis suggests that leverage that is
either too high or too low could increase the probability of failure or acquisition, the statistics in the table
suggest that the main empirical survivorship effect is more likely to be associated with contemporaneous
leverage ratios that are too high.
5.2. Comparison Statistics of Exploration Firms before Delisting
There are indications in Table 3 that, by any measure, leverage increases endogenously as a firm
approaches failure. Therefore, we need to distinguish between a firm’s capital structure policy and
leverage increases that are symptomatic of fundamental changes in firm performance. In the single‐stage
multivariate analysis, we include both leverage in the observation year (year 0) and the leverage measured
three years prior (year –3). From Table3, there is evidence that, even three years prior, leverage ratios of
failed firms are significantly higher than those of surviving firms, particularly for the BW and W leverage
measures. Thus, inclusion of a 3‐year lag may not be an entirely satisfactory way to assess the effect of
leverage policy for failed firms. To investigate further, in Table 4 we provide comparison statistics for
acquired and failed firms in the last year before delisting (year 0) and the three prior years, as well as
comparison statistics for all other firm years in the database (all survivor years and years before year ‐3 for
acquired and failed firms). Table 4 statistics are different from those in Table 3 because Table 4 is based on
only observations where at least four years of data are available, so that year to year differences are from a
consistent sample.
We find that acquired firms are smaller than the overall average, but are growing rapidly (at a
compound annual rate of 13.3%). Book leverage, by any measure, is increasing in this group because rapid
15
growth in the years before acquisition is financed disproportionately with debt. Market and book equity
are in approximately constant proportions to each other for acquired firms, so that the market‐to‐book
ratio is stable, and market leverage is increasing similarly to book leverage.
While sales revenue of failing firms is growing over the years before failure (at a compound annual
rate of 6.8%), operating cash flow (EBITDA/Total Assets) is declining, and is negative on average in the last
two years before they fail. Book equity also is declining and is negative on average in the year before
failure; in fact, 36% of the failing firms report negative book equity. In summary, the leverage increases of
failing firms are associated with poor operating performance. Leverage ratios are increasing because equity
is declining, and firms are covering operating needs by borrowing. These firms appear to be on a course to
failure.
For the question of whether lagged leverage ratios are reasonable indicators of capital structure
policy, Table 4 shows that both book and market leverage averages of failed exploration firms in year ‐3 are
still above the averages of other firm‐year observations. For example, BW book leverage of failed firms
averages 120.3% in the year before failure (i.e., in year 0), and 69.9% in year ‐3, whereas the average of
survivor observations is 48.6%. The similar trend in the 3‐year lag of book leverage suggests that 69.9% in
year ‐3 is above the capital structure policy choice of firms that fail within four years. In the failed firm
sample, the 3‐year lag of BW book leverage increases substantially, to 69.9% from 49.2% in year ‐3, which is
close to the average value of surviving firms.
We infer that the 3‐year lag values of leverage are also affected by the underlying phenomena that
drive these firms toward failure. Because lagging for more than three years would result in losing many
observations, we do not pursue this approach to assessing the effect of capital structure policy.
5.3. Leverage Effects on Firm Survival Probability
5.3.1. Monotonic probit analysis
Given the differences in means from Table 3, we first entertain the hypothesis that there is an
empirical monotonic relationship between capital structure and the probability of delisting, acquisition, or
16
failure. To investigate the effects of leverage on survival probability, we use probit models of firm‐year
observations in a panel, where the dependent variable is set to zero if the firm survives the next year and
one if it is delisted due to either acquisition or failure. To help distinguish between capital structure policy
and leverage increases that are symptomatic of more fundamental changes, we include both leverage in
the observation year and leverage measured three years prior.14
Because the distribution of leverage ratios is skewed and we are interested in both high and low
leverage extremes, we use the natural log of the ratio in the multivariate analysis. In the sample, 1.2%
(4.1%) of the observations have BW book leverage ratios less than 5% (10%) and 4.5% have ratios greater
than 100% (negative book equity). For the LRZ measure, which is almost always lower than the BW
measure, 10.3% have book leverage ratios below 5% and 9.8% have leverage ratios above 60%. The
percentages are similar for leverage ratios measured in year‐3.
In Table 5 probit models, we classify firm‐year observations as delisted after the observation year
or survived. We regress the binary outcome variables on the log of the firm’s book or market leverage ratio
in the observation year and the leverage ratio three years prior. The models include standard controls in
capital structure estimation in the literature: firm size (natural log of total assets), profitability (operating
income before depreciation/book total assets), market‐to‐book assets ratio, tangibility of firm’s assets, and
cash flow volatility over four years ending with the observation year.15 We also include an indicator
variable that is equal to one if the observation is from before 1978 because of the potential for survival
probabilities before then to be affected by look‐back bias in Compustat data.16 Estimates in Panel (a) are
based on BW book leverage; those in Panel (b) are based on LRZ book leverage, and those in Panel (c) are
14 We also estimated a hazard model relating failure to capital structure in earlier years. Because we find no significant relationships of failure probability to prior capital structures, and because many firms are only in our sample for a few years, results are similar to the probit results. Accordingly, we do not report results for the hazard model. 15 To the extent that these controls explain variations in capital structure in our sample, the partial effects of capital structure coefficients will reflect deviations from the optimum. However, regression models of capital structure on these controls have low explanatory power, as in earlier cited studies. 16 Shanken, Kothari, and Sloan (1995) document the potential for look‐back bias to affect Compustat data prior to 1978.

17
based on BW market leverage.17 All panels include the results of alternative specifications where we
replace the lagged leverage variable with the three‐year change in leverage and where we replace both
variables with the three‐year change and the lagged leverage variable. Coefficients on other variables are
identical to those reported and are suppressed in the table. The results in Table 5 enable us to assess the
adequacy of using the 3‐year lag to control for capital structure policy, and to contrast results for BW and
LRZ book leverage and for market leverage. Marginal effects are reported in the table to aid
interpretation.18 Standard errors are clustered by firm.19
In Panel (a), delisting (non‐survival) is positively and significantly related to BW book leverage in
year 0. The relationship to lagged leverage is marginally significant but negatively signed. In Panel (b), the
LRZ leverage measures have the same signs as those in Panel (a), but are not statistically significant. In
Panel (c), the market leverage measures using the BW definition yield results similar to those in Panel (a).
When we replace lagged leverage with the 3‐year change in any panel, the sign reverses, and the non‐
lagged coefficient is weaker. When we replace leverage in the observation year with the 3‐year lagged
value, both the level and change are positively signed and the BW measures are significant.
The BW delisting results support the endogeneity argument. Oil exploration firms are more likely
to be delisted when they are highly levered and when high leverage is a recent phenomenon. The LRZ
results indicate no significant relationship between capital structure and delisting, suggesting no
economically important relationship between leverage and firm survival. All delisting results are
inconsistent with the hypothesis that a policy of high leverage is positively related to delisting probability.
Rather, the evidence indicates that leverage ratios increase endogenously prior to delisting. The
differences between our BW and LRZ results indicate that the findings in some other studies may be
sensitive to how leverage is measured. We also find that delisting is more likely for smaller firms and those
with higher ratios of tangible to total assets.
17 The probit and multinomial probit results using the W measure are similar to the BW results in Panel (a). 18 The probit marginal effect estimates are similar to estimates obtained from linear probability models. 19 Significance levels are not materially different if robust standard errors are used without clustering.

18
The evidence in Table 5 is inconsistent with there being a relation between survival and capital
structure policy. When current leverage is included, lagged leverage, as a measure of capital structure
policy, is not positively related to delisting probability. To assess the robustness of this conclusion, we tried
including short‐ and long‐term interest rates as additional controls. Those controls were not statistically
significant at even low levels and the results for the other variables were not materially different from
those reported. We also tried adding annual fixed effects. Again, results were not materially different. In
the next subsection, we formally model and endogenize leverage policy as an alternative test of the
hypothesis.
In the last two columns of Table 5, we use multinomial probit to test separately for relationships
between capital structure and either acquisition or failure. Results based on BW book and market leverage
are, again, similar. The LRZ results are weaker but have the same signs. Based mainly on the BW models,
current high levels of debt financing are associated with higher probabilities of both acquisition and failure.
However, results for the 3‐year lagged leverage (or 3‐year change) are different. Acquisitions are more
likely when leverage has been increasing rapidly, whereas the relationships to failure probability are not
significant. For acquisitions, the evidence suggests that it is not so much the level as the rate of change in
leverage that affects acquisition probability. Results for the W measure (not reported) are similar.
Given the evidence in Table 4, that the total assets and sales revenue of acquired firms tend to be
growing rapidly, we infer that acquisition probability is consistent with the pecking‐order hypothesis ‐ firms
with good growth prospects first finance with low‐risk borrowing and then turn to other alternatives. Firms
with good growth prospects, and that have limited financial slack, appear to become prospects for
acquisition. This interpretation is reinforced by the closer alignment of the BW measure with financial slack,
coupled with the stronger results when the BW measure is used. The weaker results for the LRZ measure,
which is more closely aligned with the tradeoff hypothesis, reinforce the interpretation that acquisition
probability is not driven by suboptimal capital structure choices under the tradeoff hypothesis.

19
The evidence suggests a different interpretation for failed firms. Table 4 shows rapid increases in
leverage and decreasing profitability. Both the BW and LRZ results in Table 5 show that the current highly‐
levered capital structure is significant, but that the rate of increase is not. The evidence that lagged capital
structure is not significant and that the change is also not significant when year‐0 leverage is included
indicates that capital structure policy does not affect failure probability directly, but only does so if the firm
gets into trouble and responds by increasing leverage to unsustainable levels.
5.3.2. Monotonic probit with endogenized capital structure
To assess the robustness of our conclusion that capital structure policy does not significantly affect
survival probability, we estimate two‐stage probit models of endogenous capital structure and survival
probability.20 In the first stage, we regress capital structure on the same variables as in Table 5, but also
add the three year lags of those variables. The lagged variables are used to introduce capital structure
policy in a similar manner to the way lagged capital structure is used in Table 5. Thus, when we endogenize
capital structure and use it in a second‐stage model that includes contemporaneous variables but
instrument the lagged variables, the coefficient on capital structure serves as a test of whether capital
structure policy is significantly related to survival probability.
To capture the effects of generic shocks that might affect capital structure but are correlated with
survival probability only through capital structure, 21 we include the corporate tax rate and the three‐year
average of oil prices, ending in year 0.22 The tax rates are defined as a marginal corporate income tax rate
for the highest corporate tax bracket in the observation year. By instrumenting capital structure with these
variables, we allow for capital structure to vary with corporate tax rates and oil prices. If firms add leverage
when tax rates are high, the coefficient should be positive. The sign on oil prices is ambiguous. Firms might
reduce leverage if historically high oil prices enable them to pay down debt or they might increase leverage
20 Wooldridge (2002, 472‐477) provides a discussion on the probit model with endogenous explanatory variables. We also tried a linear probability model by 2SLS and confirmed that the results were unchanged. 21 See Roberts and Whited (2012) for discussions on the validity of instrumental variables. 22 Similar to our approach, Molina (2005) uses a firm’s marginal tax rate as an instrumental variable for leverage in order to estimate the effects of leverage on corporate credit ratings.

20
if they anticipate continuing high prices and see this as an investment opportunity. If changes in tax rates
and oil prices affect failure probability through capital structure changes, we should find that failure
probability is significantly related to endogenized capital structure.
Table 6 shows two‐stage instrumental variables (IV) results for both the BW and LRZ measures of
capital structure. In the first pair of models, both lagged firm‐specific variables and generic shock variables
are treated as instruments; in the second pair only the generic shock variables are treated as instruments.
These represent the extremes of a range of plausible assumptions. We also tried including the lagged
leverage variable in the second stage, where we obtained results similar to the first pair of models; and
excluding all of the lagged variables except lagged book value from both stages, where we obtained results
similar to the second pair of models. The estimates in Panel (a) are based on book value measures of
leverage; those in Panel (b) are based on market value measures. Because the first‐stage model results in
Panels (a) and (b) are similar, we report the first stage only for Panel (a). Models using the W measure of
leverage are not reported, but are similar to the reported results.
The results in Table 6 are consistent with our interpretation of the results in Table 5. Both of the
instruments are statistically significant in the first‐stage equations, satisfying the relevance requirement of
instrumental variables, but the endogenized leverage measures (either book or market leverage) are not
significant in the second‐stage survival models.23 That is, when we replace current‐year leverage with an
endogenous measure of capital structure policy based on firm‐specific factors and economy‐wide shocks,
contemporaneous leverage becomes non‐significant. The contrasting results for this variable in Tables 5
and 6 indicates that the significant coefficients in Table 5 arise because non‐surviving firms experience
leverage increases that are not reflective of the firm’s capital structure policy.
23 It is known that instruments only weakly correlated with the endogenous variables bias the instrumented coefficients. Stock, Wright, and Yogo (2002) suggest that the F‐statistic for the joint significance of instruments should exceed 10 for the estimates to be reliable when there is one endogenous variable. In Table 6, we estimate F‐statistics using linear probability models for each model and find that most of the F‐statistics are above 10, indicating that our results do not suffer from the weak instrument issues. We report Kleibergen‐Paap F‐statistics instead of Cragg‐Donald F‐statistics since our standard errors are clustered by firms and thus the i.i.d. assumption does not hold. In addition, according to the reported underidentification and overidentification test p‐values, our models are identified and the instruments are valid.

21
5.3.3. Nonmonotonic estimates
Because the prior analysis can only be used to test for a monotonic relationship between capital
structure and survival probability and we are agnostic as to the shape of the relationships between capital
structure and delisting, acquisition, or failure, we consider three different functional forms that allow
nonmonotonicity: (1) quadratic specifications to current and lagged capital structure; (2) a linear splined
model that allows capital structures above and below the sample mean to have different slopes; and (3)
linear splined models where the relationships of capital structure to outcomes are assumed to be linear
over a broad range, but allowed to be different in the upper and lower deciles and quintiles.
We report this analysis in Table 7. As in Table 5, we report multinomial probit estimates for
acquisition and failure outcomes. Because control variable coefficients are similar to those reported in
Table 5, we suppress them in Table 7. Because book value and market value results are similar, we report
only book value results. And because our strongest results in Table 5 are for the BW measure, we report
and discuss mainly those results. LRZ results are reported in Appendix C; W results are similar to the BW
results and are not reported.
(a) Quadratic specification
To test for a relationship between capital structure and outcome probability that is approximately
quadratic in the natural log of leverage, in Panel (a) we test three alternative specifications: squaring only
the current leverage ratio, only the lagged leverage ratio, and squaring both. The quadratic term for the
observation year is statistically significant for delisting probability. Solving the quadratic, however,
indicates a very low optimum of about 11.5% debt to total assets in year 0. The low optimum for current
leverage relative to the sample mean helps to explain the significant monotonic estimates in Table 5.
The relationship in Panel (a), while significant, is weak except in the extremes. Based on
investigation of the results, delisting probability increases substantially at year‐0 leverage ratios above
100%. From the minimum point to leverage ratios of either 1% or 100%, estimated delisting probability
increases by about 6.7 percentage points. We find no significant results for quadratic specifications of
22
lagged leverage. The coefficient on lagged leverage is similar to that in Table 5 and the quadratic term is
not significant. Results are not sensitive to inclusion of interest rate variables or annual fixed effects.
Delisting results for the LRZ measure of book leverage are similar, except that the lagged relationships are
never significant.
For acquired firms, results are not materially different from in Table 5, and introducing the
quadratic terms makes the observation year coefficient nonsignificant. The results again support the
inference that compelling growth opportunities that consume financial slack lead to acquisition. The
estimated observation‐year optimal capital structure in the failure model is again low, at about 10%
leverage. Failure probability increases by only about 2.2 percentage points as current leverage increases to
100% or decreases to 1%. Lagged capital structure is never statistically significant in the quadratic models,
consistent with our finding in Table 5 that capital structure policy is not significantly related to failure
probability; failure probability increases when underperformance leads to leverage ratios that are not
sustainable. LRZ results for acquisition are never significant and those for failure are consistent with results
reported in Table 5.
(b) High and low‐leverage differences
In Panel (b), we allow the slope of the leverage relationship to be different above and below the
sample mean. In each model, we include the log of book leverage and the lagged value of book leverage.
We also include, for observations above the sample mean, either a high‐leverage variable that measures
the difference between observed year‐0 leverage and the mean and is otherwise zero, or a similar lagged
high‐leverage difference variable, or both.
We again find positive relationships of delisting, acquisition, and failure probabilities to year‐0
leverage. The relationship is significantly greater for observations where leverage is above the mean. Both
the BW and LRZ results consistently indicate that the 3‐year lagged leverage interaction is not significant
and the base 3‐year lagged result is similar to that in Table 5, again supporting the view that acquisitions
occur in response to rapid growth that is financed with debt.

23
For delisting, the model in Table 7 indicates that failure probability is increasing in year‐0 leverage,
with the probability increasing by 16.3 percentage points as leverage increases from 1% to the sample
mean of 42%, and by another 9.7 percentage points as leverage increases to 100%. In the acquisition
model, the respective increases associated with year‐0 leverage are estimated to be 7.9 and 4.9 percentage
points. Similarly, in the failure model, the respective increases are 4.0 and 1.9 percentage points. For
neither acquisition nor failure probability is the 3‐year lagged interaction variable statistically significant.
Overall, these results support the inferences from Tables 5 and 6. There is no evidence that
delisting, failure, or acquisition probabilities increase for low‐leverage firms in year ‐3 and, based on Table
5, the negative coefficients on lagged book leverage are appropriately interpreted as indicating that the
rate of change in leverage is associated with higher acquisition probability due to the need to fund growth.
LRZ results appear to be weaker because the measure is less closely aligned with the pecking order
hypothesis.
(c) Models of leverage extremes
Neither the quadratic nor the high‐low models can reliably detect whether extreme leverage ratios
are associated with materially higher probabilities of delisting, acquisition, or failure. To capture the
extremes, we classify firms into book‐leverage deciles or quintiles each year. We extend the probit models
by including interactions of binary variables for the lowest and highest leverage deciles (quintiles) with the
difference between the leverage ratio and lowest observed value above the bottom quantile or between
the value and highest observed value below the top quantile. All differences are measured as observation
value minus critical value. These difference variables are constructed for both year 0 and year ‐3.
In Panel (c), the contemporaneous high leverage indicator variables are statistically significant and
positively related to delisting in both decile and quintile models. Low leverage indicators are not significant.
This is also true for the LRZ models. The results suggest that firms with very high year‐0 leverage ratios are
more likely to be acquired or fail. There is no significant evidence that firms are subject to greater risk of
non‐survival if they operate with capital structures well below the norms in year 0. However, acquisition
24
probability is significantly positive for the bottom decile; whereas failure probability is significantly negative
(both results for the bottom decile are not statistically significant in the LRZ models in Appendix C). The 3‐
year lagged variables for the highest and lowest leverage deciles and quintiles are never significant,
suggesting capital structure policy is not important for firm survival (also true in the LRZ models).
(d) Recap
Both the monotonic and non‐monotonic specifications indicate that delisting, acquisition, and
failure probabilities increase with year‐0 leverage and there is some evidence that the relationship is not
linear in the natural log of leverage. We find no evidence of an optimal capital structure based on the 3‐
year lag of leverage. The two‐stage results with endogenized capital structure confirm this conclusion in
that the endogenous leverage policy variable is not significantly related to survival. Overall, the results are
consistent with the pecking order hypothesis in that acquired firms first use debt capacity to fund growth
and then are more likely to become acquisition candidates. The positive relationship between year‐0
leverage and failure probability arises endogenously – firms with operational problems increase leverage in
the face of declining performance and are more likely to fail.
5.4. Leverage Effects on Revenue Shares
Researchers use revenue (market) share and change in revenue share as indicators of good choices.
As noted, Stigler (1958) argues that the competitive process will cause the aggregate share of firms with
good strategies to increase, and presents evidence from several industries. Appel, Worrall, and Butler
(1985) study survivorship of property and liability insurers in relation to firm size. Bring (1982) and Hibdon
and Muller (1990) study survivorship of petroleum refinery establishments by facility size. Gregory (2000)
uses the survivorship approach to assess scale economies in international liner shipping.24
We hypothesize that if there is an important optimal capital structure for exploration firms then we
should find that the aggregate revenue share of firms located close to the optimal capital structure
increases over time. To assess the relationship of capital structure to aggregate revenue share we group
24 See also Keeler (1989) regarding the US trucking industry, Danos and Eichenseher (1982) regarding the auditing industry, and Santerre and Pepper (2000) regarding US hospital services.
25
firms into deciles based on their book leverage ratios and sum the revenue shares of the firms within each
decile. The results of this aggregation for BW leverage in year ‐3 were presented earlier, in Figure 1.
It is apparent from Figure 1 that if there is an optimal capital structure, it is not stationary.
Conceivably, the optimum is affected by the main factors that would affect the tradeoff between the debt
tax shelter and bankruptcy cost. However, the data in Figure 1 provide no support for this explanation. In
various years, the top half of the observations account for anywhere from 9.2% to 95.2% of market revenue.
Based on investigation of the relations between decile market share changes and various macro‐factors, we
find that the period of high nominal interest rates from 1979 through 1985 is associated with a large
market share for highly levered firms, but the median leverage ratio measured in this way increases several
years before the interest rate spike and the leverage ratio does not decrease after 1985, when nominal
rates decline. Movement of the median leverage ratio also is not sensitive to implied short‐term real rates,
which are negative from 1974 through 1980 and unusually high from 1981 through 1986. The median
leverage ratio is high and stable over this 13‐year period. There is also no evidence that the median
leverage ratio is sensitive to corporate tax rates. When the maximum corporate rate was reduced from 46%
to 34% around the time of the Tax Reform Act of 1987, the change had no apparent effect on the median
leverage ratio.
In short, this evidence provides no support for the optimal tradeoff hypothesis, considering either a
static optimum or one that evolves over time in response to interest rates, inflation rates, and tax rates.
Moreover, we have already determined that delisting, acquisition, and failure probabilities are not
significantly related to interest rates.
Perhaps the shifting market shares in Figure 1 are attributable to the pecking order hypothesis. As
observed earlier, firms may increase leverage to pursue growth opportunities, and reduce it when their
operations generate free cash flow that is unneeded for investment. The data in the figure appear
generally to support this hypothesis. The median leverage ratio increased sharply in the year after the 1973
OPEC oil price shock, and remained high for many years. After reaching a real price of over $100 per barrel
26
in 1980, oil prices declined substantially. During this era of low prices, the median leverage ratio remained
high. As real prices began to increase around 2000, leverage ratios began to decline. While this makes a
plausible story, the data are too limited to enable us to provide rigorous empirical support. We tried
modeling the changes in the market shares of leverage deciles but were unable to find a stationary
relationship to oil prices. The only consistently significant explanatory variables were the lagged market
share of the decile and an ordinal decile rank variable. Prices or price changes interacted with binary decile
indicators were not significant. We obtained similar results using leverage quintiles and using the median
leverage ratio.25
It is not clear why increasing oil prices would trigger leverage‐increasing investment in the 1970,
but high prices in the 2000s would trigger leverage reduction. To be sure, the regulatory environment now
is different from what it was in the 1970s and may be discouraging exploration firms from investing.
5.5. Firms with Persistent Low Leverage: A Clinical Examination
The optimal tradeoff hypothesis implies that firms with persistently low leverage may be failing to
take optimal advantage of the tax deductibility of interest expense and, therefore, are likely to be
acquisition targets. Our statistical evidence does not support this, and indicates, rather, that firms are
acquired when their growth prospects have reduced financial slack, a finding more consistent with the
pecking‐order hypothesis. Still, persistent low‐leverage seems puzzling. Perhaps low‐leverage firms are
inefficient but are insulated from the take‐over market. To better assess this, we identified firms in our
sample that operated with persistent low leverage using the BW measure, and tracked their performance.
Five firms in our sample had book leverage ratios that were persistently below 20 percent.
General American Oil Company operated with low leverage from before 1970 through 1980 and
without convertible debt or preferred stock.26 During this period, company revenue was growing at a
25 We tested this at the firm level by regressing leverage on leads and lags of operating cash flow (EBITDA) and found that leverage changes are negatively related to contemporaneous and lagged cash flow, but not related to leads of cash flow. These firm‐level results are consistent with the pecking order interpretation. 26 We specifically indicate the use of convertible debt and preferred stock for these low‐leverage firms because these financing sources are important to the difference between the BW and LRZ measures.
27
compound annual rate of 17.6%, and with an unusually high average annual EBIT/sales ratio of 31.4 %. The
company carried a modest level of funded debt and increased its dividends at a compound annual rate of
11.1 %. Its average annual effective tax rate on income during the period was 33.2 %.
General American appears to have been well‐suited for takeover under the tradeoff hypothesis. It
did eventually become the target of a hostile takeover attempt, when, in one of the earliest corporate
raider actions, T. Boone Pickens made an offer in December 1982. Pickens was out‐bid by Phillips
Petroleum, which, acting as a white knight, acquired General American in 1983.27 While the outcome is
consistent with optimal tradeoff, it took more than 10 years of low‐leverage operation without apparent
challenge to precipitate the takeover attempt. Either the control market is not very effective at disciplining
inefficient capital structure choices, or the capital structure policy of the firm is not very important.
MSR Exploration operated with book leverage below 20% from 1982 through 1989 and no
convertible debt or preferred stock, but without revenue growth and with declining profitability. EBIT
turned negative in 1986 and remained negative into the mid‐1990s. After several years without interest‐
bearing debt, the company began borrowing in 1989 and continued into the 1990s, but the main reason for
increasing leverage was declining equity book value associated with operating losses. During this period,
MSR’s effective tax rate was consistently zero. The company was merged with Quicksilver Resources, Ltd.
in 1999, at which time it had a significant tax loss carry forward. In summary, MSR’s low leverage was not
indicative of an unexploited tax benefit of debt financing. In fact, the company actually increased its
borrowing for several years beginning in 1989, even though its tax liability was zero. The evidence suggests
that MSR was headed for failure, but that merger may have been preferable because it would preserve
value of assets such as its tax loss carry forward. In fact, MSR filed for bankruptcy in 1992 and was
reorganized, to extend the maturity of its outstanding debt. Restructuring just postponed failure. The
company’s use of debt financing and reorganization to support operations as performance declined is
27 Slater (1999) describes this early takeover attempt.
28
consistent with the pecking order hypothesis, as raising equity in the face of bankruptcy would not have
been feasible.
McFarland Energy operated with book leverage below 20% from 1976 through 1993.28 During this
period, except for two modest episodes of borrowing, including one convertible debt issue and small asset
sales, the company funded its operations internally, by reinvesting operating cash flows. Operating
performance during this period was modest and it lost money and had a negative tax liability most years
after the convertible debt issue. Book assets grew at a slow compounded annual rate of 1.2% and sales
grew at a rate of 2.4%. The company’s operating performance was poor, with a negative annual average
ratio of EBIT to total assets. Its average effective tax rate during the period was 5.6%. Overall, there is little
to make the company attractive as an acquisition target and performance is not bad enough to threaten its
survival. From 1993 through 1996, following a substantial acquisition that was largely debt financed, the
company’s performance improved sharply. Both revenue and profitability increased. In 1997, after
agreement with McFarland management, Monterey Resources acquired McFarland via tender offer.29
Statex Petroleum operated with book leverage below 20% in all years but one from 1974 through
1982, and without convertible debt or preferred stock. During most of this period, it operated with no
interest‐bearing debt and was majority owned by California Portland Cement Company (later renamed
CalMat). During the period, company assets grew at an annual rate of 15.6% and revenue grew at 19.7%.
Except for the last two years, the period of most rapid growth, Statex funded its growth through cash flows
from operations. In the last two, it turned to a significant increase in preferred equity (held by CalMat, on
which it paid a preferred dividend) and a modest funded debt issue to finance its growth. The company’s
average annual ratio of EBIT to total assets was 7.8% and its average effective tax rate was 7.9%. While
performance was modest, the company was insulated from the control market by virtue of the CalMat
block. In the face of declining oil prices beginning in 1983, CalMat sold its interest and PSA (formerly Pacific
28 Our sample period for the company begins in 1979 due to missing data required for complete earlier observations. 29 New York Times (1997) and U.S. Securities and Exchange Commission (1979).
29
Southwest Airlines) acquired Statex as part of its oil portfolio.30 Statex is another example of a low‐leverage
firm that, under the optimal tradeoff hypothesis, would not have attracted acquisition interest because of
its modest profitability and low effective corporate tax rate. CalMat only decided to sell when the company
became consistently unprofitable. PSA’s acquisition appears to be more of a hedging strategy than an
effort motivated by the perception that Statex was operating with an inefficient capital structure.
Wiser Oil operated with book leverage below 20% from at least 1970 through 1992 and without
convertible debt or preferred stock.31 During this 23‐year period, total assets grew at an annual rate of
6.1% and revenue grew at 7.6%. For 15 years, from 1972 through 1986, the company’s annual EBIT to
assets ratio averaged 17.4% and its effective tax rate averaged 42.9%. The company refrained from
borrowing during most of this period and distributed much of net income as dividends. Through 1986,
Wiser was a clear case of low leverage and high taxes, but the company issued no debt for most of the
period and there is no indication that it was targeted for acquisition. After 1986, oil prices began to decline
and Wiser’s net income turned negative. In 1992, the company relocated to Texas, restructured its
management team, and began to divest its underperforming assets and develop new reserves. Beginning
in 1992, the company’s leverage ratio increased considerably, even though it continued to generate
negative EBIT in most years, and its average effective annual tax rate was quite low. The evidence of years
of operation without interest‐bearing debt and high effective tax rates does not support the optimal
tradeoff hypothesis as an important driver of capital structure, whereas the increase in leverage to fund
growth when earnings are negative and taxes are low is consistent with the pecking order hypothesis. The
acquisition, in 2004, by Forest Oil, did transfer ownership to a highly profitable exploration firm, where the
attractiveness of the acquisition could have been partly tax related due to Wiser’s history of losses.
In summary, the evidence from these five cases provides little support for the optimal tradeoff
hypothesis. Some low‐leverage firms were operating with profit rates and effective tax rates that are
probably too low to motivate leverage‐increasing takeover or restructuring. One highly profitable firm,
30 Los Angeles Times (1985). 31 Because of missing data on some variables, the sample used in our analysis begins in 1972.

30
General American, did attract a hostile bid, but only after many years of low leverage operation. Consistent
with the pecking order hypothesis, Wiser Oil, operated for years with low leverage, and only changed when
continuing operations became unprofitable and it was compelled to undertake a growth strategy.
6. Summary and Conclusions
How important is capital structure policy to firm survival? This question has been the focus of a
great deal of finance research, but remains unresolved. In this paper, we exploit the notion that, in
competitive markets, firms with capital structures close to an economically important optimum should
perform better and be more likely to survive than those located further from it. Our evidence, based on a
panel data study of oil exploration firms, indicates that capital structure policy bears little relationship to
survival probability. This finding is robust to whether we employ a leverage measure that is closely aligned
with the tradeoff hypothesis, one that is closely aligned with the pecking order hypothesis, or an
intermediate measure. While firms with very high leverage in one year are somewhat more likely to fail or
be acquired in the next, the drivers of failure and acquisition are more fundamental, and also affect capital
structure. Firms that encounter operating problems appear to increase leverage to address cash needs or
else leverage increases because of poor performance so that the book and market values of equity declines.
While the leverage increase is a precursor of failure, the relationship does not appear to be causally related
to failure probability. A similar interpretation applies to high leverage prior to acquisition. For these firms,
the increase in leverage is often driven by attractive investment opportunities and acquisition may be a
means of gaining additional financial slack to support growth.
Importantly, for testing for an optimal capital structure, thee‐year lagged leverage ratios, as
indicators of capital structure policy, are not significant determinants of a firm’s survival probability.
Moreover, when we endogenized current capital structure in a two‐stage IV model, we find that the
endogenous estimate of capital structure policy is not significantly related to firm survival. Also,
contemporaneous and three‐year lagged leverage ratios are not significant in explaining aggregate changes

31
in revenue shares of firms grouped into leverage deciles. Thus our results from cross‐sectional tests on the
panel data of firms are consistent with other studies that find little evidence of an important optimal capital
structure. Instead, the evidence supports the capital structure irrelevance arguments of Miller (1977) and
DeAngelo and Masulis (1980), and the pecking order hypothesis of Myers (1984). Our use of the
survivorship principle, in the spirit of Stigler (1958); and our clinical examination of low‐leverage firms,
suggest a rethinking of the way capital structure tests are conducted.
While the specific empirical focus of our study is on oil exploration firms, we see no reason that our
findings would not apply more broadly to all industries.

References
Appel, David, John D. Worrall, and Richard J. Butler, 1985, Survivorship and the size distribution of the
property‐liability insurance industry, Journal of Risk and Insurance 52, 424‐440
Alchian, Armen A., 1950, Uncertainty, evolution, and economic theory, Journal of Political Economy 58,
211‐221.
Baker, Malcolm, and Jeffrey Wurgler, 2002, Market timing and capital structure, Journal of Finance 57, 1‐32.
Bring, Danny A., 1982, Survivorship and scale economies in the US petroleum refining industry, United
States American Petroleum Institute, Washington, DC.
Campello, Murillo, 2003, Capital structure and product markets interactions: evidence from business cycles,
Journal of Financial Economics 68, 353‐378.
Campello, Murillo, 2006, Debt financing: Does it boost or hurt firm performance in product markets?,
Journal of Financial Economics 82, 135‐172.
Danos, Paul, and John W. Eichenseher, 1982, Audit industry dynamics: Factors affecting changes in client‐
industry market shares, Journal of Accounting Research 20, 604‐616.
DeAngelo, Harry, and Linda DeAngelo, 2007, Capital structure, payout policy, and financial flexibility,
Marshall School of Business Working Paper FBE 02‐06.
DeAngelo, Harry, and Ronald Masulis, 1980, Optimal capital structure under corporate and personal
taxation, Journal of Financial Economics 8:1, 3‐27.
Donaldson, Gordon, 1961, Corporate debt capacity: a study of corporate debt policy and the determination
of corporate debt capacity, Boston, Harvard University Graduate School of Business Administration.
Fama, Eugene F., and Kenneth R. French, 2002, Testing tradeoff and pecking order predictions about
dividends and debt, Review of Financial Studies 15, 1‐37.
Fama, Eugene F., and Kenneth R. French, 2005, Financing decisions: who issues stock? Journal of Financial
Economics 76, 549‐582.

2
Fischer, Edwin O., Robert Heinkel, and Josef Zechner, 1989, Dynamic capital structure choice: theory and
tests, Journal of Finance 44, 19‐40.
Frank, Murray Z., and Vidhan K. Goyal, 2003, Testing the pecking order theory of capital structure, Journal
of Financial Economics 67, 217‐248.
Frank, Murray Z., and Vidhan K. Goyal, 2008, Tradeoff and pecking order theories of debt, Handbook of
Corporate Finance: empirical corporate finance, Volume 2, 135‐202 (Elsevier Science/North‐
Holland).
Graham, John R. and Mark T. Leary, 2011. A review of empirical capital structure research and directions for
the future, Working paper, Duke University.
Gregory, Karen V., 2000, Economies of Scale in International Liner Shipping and Ongoing Industry
Consolidation: An Application of Stigler’s Survivorship Principle, Dissertation, Virginia Polytechnic
Institute.
Hibdon, James E., and Michael J. Muller, 1990, Economies of scale in petroleum refining, 1947‐1984: a
survivor principle‐time series analysis, Review of Industrial Organization 5, 25‐43.
Jensen, Michael C., and William H. Meckling, 1976, Theory of the firm: managerial behavior, agency costs
and ownership structure, Journal of Financial Economics 3, 305‐360.
Keeler, Theodore E., 1989, Deregulation and scale economies in the U.S. trucking industry: An econometric
extension of the survivor principle, Journal of Law and Economics 32, 229‐253.
Korajczyk, Robert A., and Amnon Levy, 2003, Capital structure choice: Macroeconomic conditions and
financial constraints, Journal of Financial Economics 68, 75‐109.
Korteweg, Arthur, 2010, The net benefits to leverage, Journal of Finance 65, 2137‐2170.
Kraus, Alan, and Robert H. Litzenberger, 1973, A state preference model of optimal financial leverage,
Journal of Finance 28, 911‐922.
Leary, Mark T., and Michael R. Roberts, 2010, The pecking order, debt capacity, and information asymmetry,
Journal of Financial Economics 95, 332‐355.
3
Lemmon, Michael L., Michael R. Roberts, and Jamie F. Zender, 2008, Back to the beginning: persistence and
the cross‐section of corporate capital structure, Journal of Finance 63, 1575‐1608.
Lemmon, Michael L., and Jaime F. Zender, 2008, Debt capacity and tests of capital structure theories,
Working paper, University of Utah.
Los Angeles Times, PSA agreed to acquire control of Statex Petroleum. September 04, 1985
Miller, Merton H., 1977, Debt and taxes, Journal of Finance 32, 261‐275.
Miller, Merton H., and Franco Modigliani, 1958, The cost of capital, corporation finance and the theory of
investment, American Economic Review 48, 261‐297.
Minton, Bernadette A., and Karen H. Wruck, 2002, Is low leverage good for shareholders? Stock price
performance and the determinants of capital structure, Dice Center Working Paper, Ohio State
University.
Molina, Carlos A., 2005, Are firms underleveraged? An examination of the effect of leverage on default
probabilities, Journal of Finance 60, 1427‐1459.
Morellec, Erwan, 2004, Can managerial discretion explain observed leverage ratios?, Review of Financial
Studies 17, 257‐294.
Myers, Stewart C., 1984, The capital structure puzzle, Journal of Finance 39, 575‐592.
Myers, Stewart C., and Nicholas S. Majluf, 1984, Corporate finance and investment decisions when firms
have information that investors do not have, Journal of Financial Economics 13, 187‐221.
New York Times, Monterey Resources to Acquire McFarland Energy. June 18, 1997
Roberts, Michael R. and Toni M. Whited, 2012, Endogeneity in Empirical Corporate Finance, Simon School
Working Paper No. FR 11‐29.
Santerre, Rexford E. and Debra Pepper, 2000, Survivorship in the US hospital services industry, Managerial
and Decision Economics 21, 181–189
Shanken, Jay, S. P. Kothari, and Richard G. Sloan, 1995, Another look at the cross‐section of expected
returns, Journal of Finance 50, 185‐224.
4
Shivdasani, Anil, and Irina Stefanescu, 2010, How do pensions affect corporate capital structure decisions?,
Review of Financial Studies 23, 1287‐1323.
Shyam‐Sunder, Lakshmi, and Stewart C. Myers, 1999, Testing static tradeoff against pecking order models
of capital structure, Journal of Financial Economics 51, 219‐244.
Slater, Robert, 1999, The Titans of Takeover. Beard Books: Washington D. C.
Stigler, George J., 1958, The economies of scale, Journal of Law and Economics 1, 54‐71.
Stock, James H., Jonathan H. Wright, and Motohiro Yogo, 2002, A survey of weak instruments and weak
identification in generalized method of moments, Journal of Business and Economic Statistics 20,
518‐529.
U.S. Securities and Exchange Commission, SEC Info – Monterey Resources Inc., et al. – SC 14D1 – McFarland
Energy Inc. on 6/24/97. Ex‐99.A1. Available at www.secinfo.com/dsvRu.82Es.d.htm.
Welch, Ivo, 2004, Capital structure and stock returns, Journal of Political Economy 112, 106‐132.
Welch, Ivo, 2011, Two common problems in capital structure research: the financial‐debt‐to‐asset ratio and
issuing activity versus leverage changes, International Review of Finance 11, 1‐17.
Wintoki, M. Babajide, James S. Linck, and Jeffry M. Netter, 2012, Endogeneity and the dynamics of internal
corporate governance, Journal of Financial Economics 105, 581‐606.
Wooldridge, Jeffrey M., 2002, Econometric Analysis of Cross Section and Panel Data. (MIT Press: Cambridge).
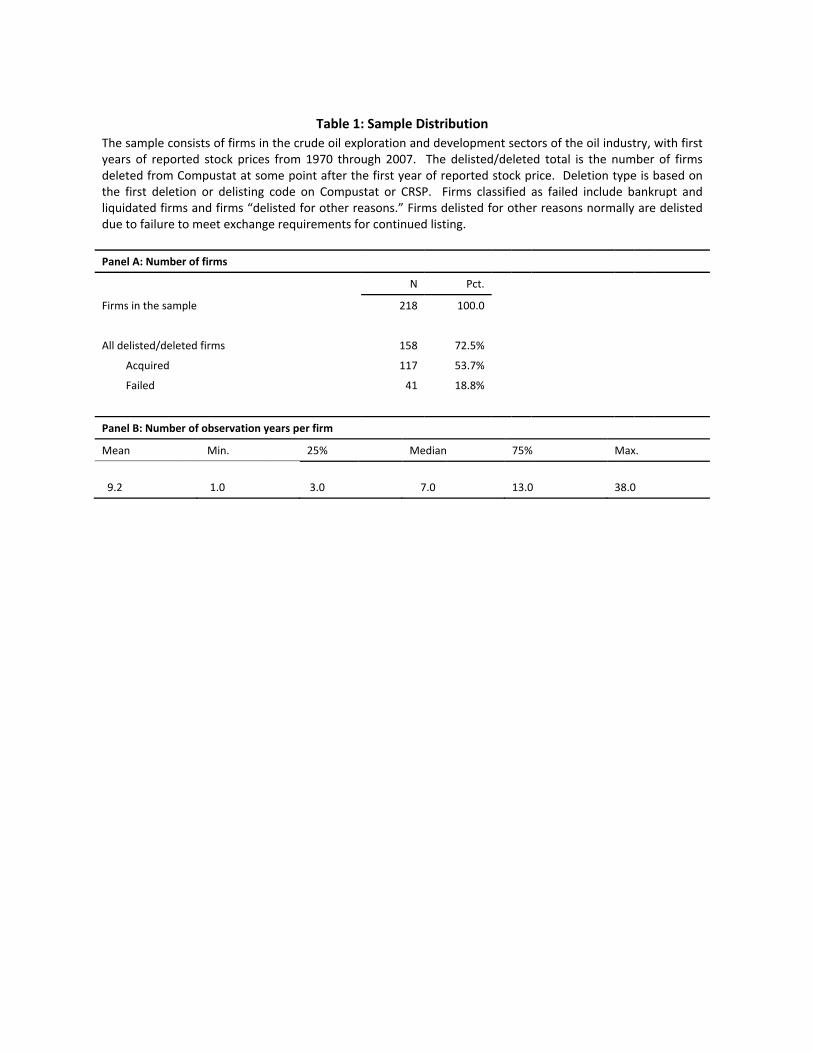
Table 1: Sample Distribution
The sample consists of firms in the crude oil exploration and development sectors of the oil industry, with first years of reported stock prices from 1970 through 2007. The delisted/deleted total is the number of firms deleted from Compustat at some point after the first year of reported stock price. Deletion type is based on the first deletion or delisting code on Compustat or CRSP. Firms classified as failed include bankrupt and liquidated firms and firms “delisted for other reasons.” Firms delisted for other reasons normally are delisted due to failure to meet exchange requirements for continued listing.
Panel A: Number of firms
N Pct.
Firms in the sample 218 100.0
All delisted/deleted firms 158 72.5%
Acquired 117 53.7%
Failed 41 18.8%
Panel B: Number of observation years per firm
Mean Min. 25% Median 75% Max.
9.2 1.0 3.0 7.0 13.0 38.0
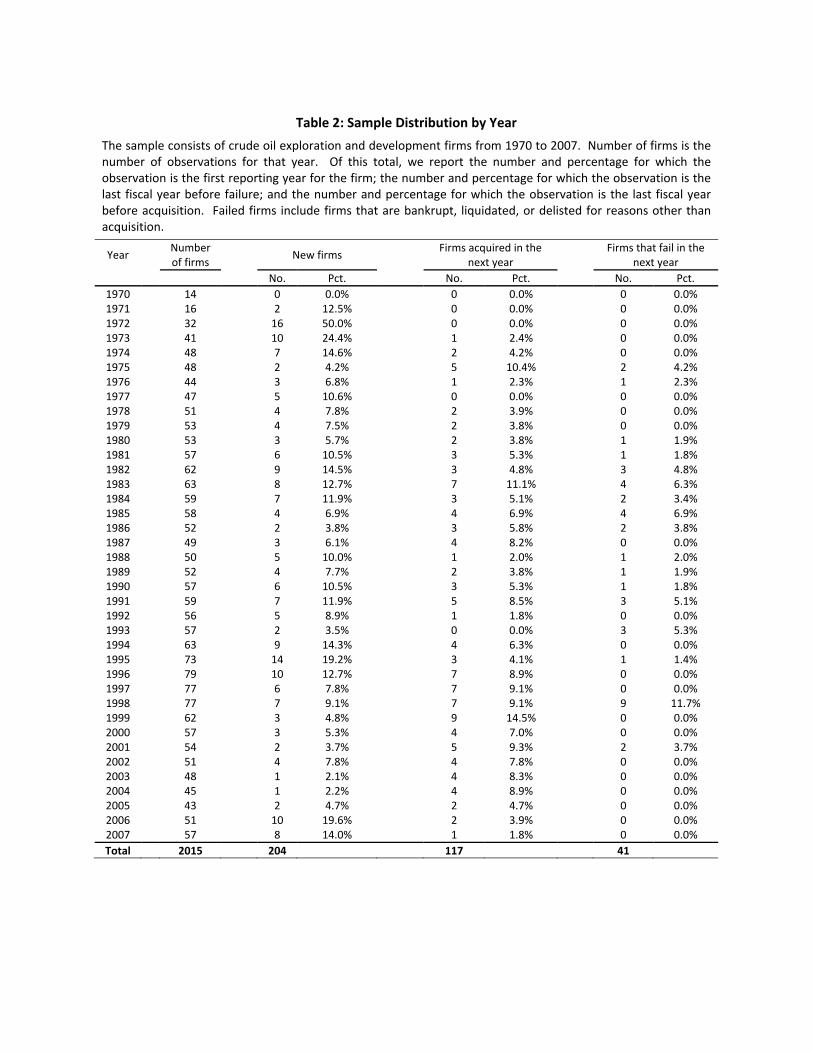
Table 2: Sample Distribution by Year
The sample consists of crude oil exploration and development firms from 1970 to 2007. Number of firms is the number of observations for that year. Of this total, we report the number and percentage for which the observation is the first reporting year for the firm; the number and percentage for which the observation is the last fiscal year before failure; and the number and percentage for which the observation is the last fiscal year before acquisition. Failed firms include firms that are bankrupt, liquidated, or delisted for reasons other than acquisition.
Year
Number of firms
New firms
Firms acquired in the next year
Firms that fail in the next year
No. Pct. No. Pct. No. Pct.
1970 14 0 0.0% 0 0.0% 0 0.0% 1971 16 2 12.5% 0 0.0% 0 0.0% 1972 32 16 50.0% 0 0.0% 0 0.0% 1973 41 10 24.4% 1 2.4% 0 0.0% 1974 48 7 14.6% 2 4.2% 0 0.0% 1975 48 2 4.2% 5 10.4% 2 4.2% 1976 44 3 6.8% 1 2.3% 1 2.3% 1977 47 5 10.6% 0 0.0% 0 0.0% 1978 51 4 7.8% 2 3.9% 0 0.0% 1979 53 4 7.5% 2 3.8% 0 0.0% 1980 53 3 5.7% 2 3.8% 1 1.9% 1981 57 6 10.5% 3 5.3% 1 1.8% 1982 62 9 14.5% 3 4.8% 3 4.8% 1983 63 8 12.7% 7 11.1% 4 6.3% 1984 59 7 11.9% 3 5.1% 2 3.4% 1985 58 4 6.9% 4 6.9% 4 6.9% 1986 52 2 3.8% 3 5.8% 2 3.8% 1987 49 3 6.1% 4 8.2% 0 0.0% 1988 50 5 10.0% 1 2.0% 1 2.0% 1989 52 4 7.7% 2 3.8% 1 1.9% 1990 57 6 10.5% 3 5.3% 1 1.8% 1991 59 7 11.9% 5 8.5% 3 5.1% 1992 56 5 8.9% 1 1.8% 0 0.0% 1993 57 2 3.5% 0 0.0% 3 5.3% 1994 63 9 14.3% 4 6.3% 0 0.0% 1995 73 14 19.2% 3 4.1% 1 1.4% 1996 79 10 12.7% 7 8.9% 0 0.0% 1997 77 6 7.8% 7 9.1% 0 0.0% 1998 77 7 9.1% 7 9.1% 9 11.7% 1999 62 3 4.8% 9 14.5% 0 0.0% 2000 57 3 5.3% 4 7.0% 0 0.0% 2001 54 2 3.7% 5 9.3% 2 3.7% 2002 51 4 7.8% 4 7.8% 0 0.0% 2003 48 1 2.1% 4 8.3% 0 0.0% 2004 45 1 2.2% 4 8.9% 0 0.0% 2005 43 2 4.7% 2 4.7% 0 0.0% 2006 51 10 19.6% 2 3.9% 0 0.0% 2007 57 8 14.0% 1 1.8% 0 0.0%
Total 2015 204 117 41
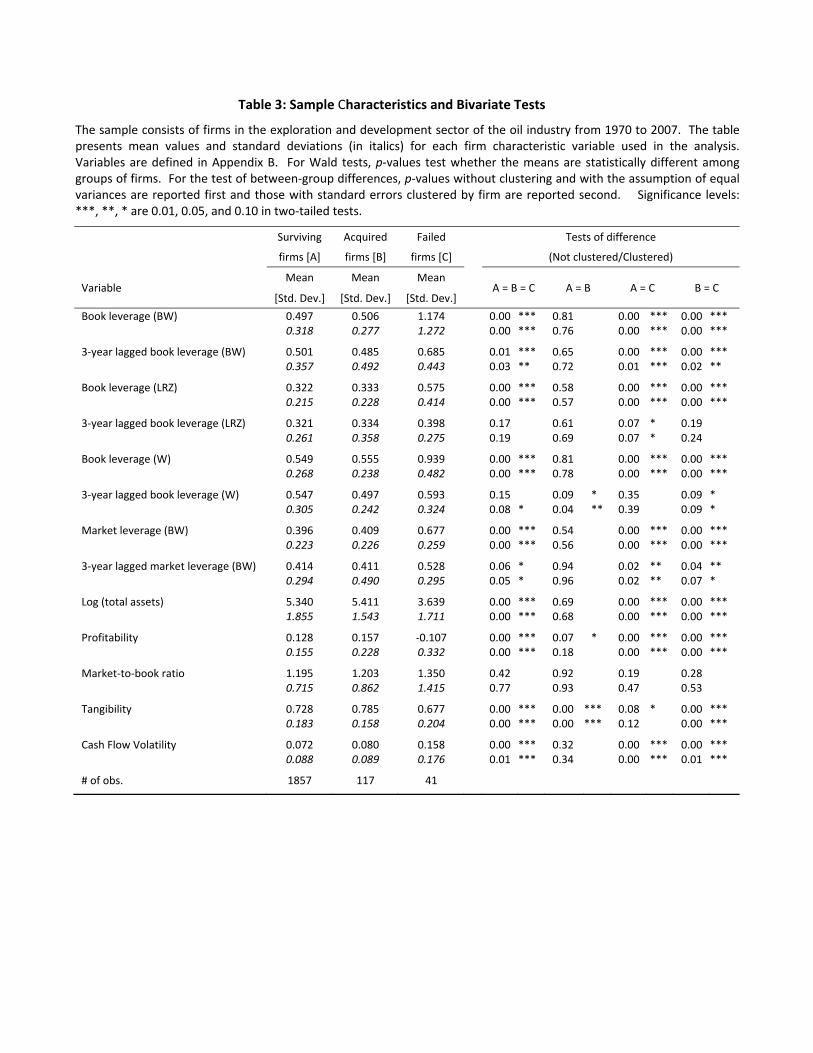
Table 3: Sample Characteristics and Bivariate Tests
The sample consists of firms in the exploration and development sector of the oil industry from 1970 to 2007. The tablepresents mean values and standard deviations (in italics) for each firm characteristic variable used in the analysis. Variables are defined in Appendix B. For Wald tests, p‐values test whether the means are statistically different amonggroups of firms. For the test of between‐group differences, p‐values without clustering and with the assumption of equal variances are reported first and those with standard errors clustered by firm are reported second. Significance levels:***, **, * are 0.01, 0.05, and 0.10 in two‐tailed tests.
Surviving Acquired Failed Tests of difference
firms [A] firms [B] firms [C] (Not clustered/Clustered)
Variable Mean Mean Mean
A = B = C A = B A = C B = C [Std. Dev.] [Std. Dev.] [Std. Dev.]
Book leverage (BW) 0.497 0.506 1.174 0.00 *** 0.81 0.00 *** 0.00 *** 0.318 0.277 1.272 0.00 *** 0.76 0.00 *** 0.00 ***
3‐year lagged book leverage (BW) 0.501 0.485 0.685 0.01 *** 0.65 0.00 *** 0.00 *** 0.357 0.492 0.443 0.03 ** 0.72 0.01 *** 0.02 **
Book leverage (LRZ) 0.322 0.333 0.575 0.00 *** 0.58 0.00 *** 0.00 *** 0.215 0.228 0.414 0.00 *** 0.57 0.00 *** 0.00 ***
3‐year lagged book leverage (LRZ) 0.321 0.334 0.398 0.17 0.61 0.07 * 0.19 0.261 0.358 0.275 0.19 0.69 0.07 * 0.24
Book leverage (W) 0.549 0.555 0.939 0.00 *** 0.81 0.00 *** 0.00 *** 0.268 0.238 0.482 0.00 *** 0.78 0.00 *** 0.00 ***
3‐year lagged book leverage (W) 0.547 0.497 0.593 0.15 0.09 * 0.35 0.09 * 0.305 0.242 0.324 0.08 * 0.04 ** 0.39 0.09 *
Market leverage (BW) 0.396 0.409 0.677 0.00 *** 0.54 0.00 *** 0.00 *** 0.223 0.226 0.259 0.00 *** 0.56 0.00 *** 0.00 ***
3‐year lagged market leverage (BW) 0.414 0.411 0.528 0.06 * 0.94 0.02 ** 0.04 ** 0.294 0.490 0.295 0.05 * 0.96 0.02 ** 0.07 *
Log (total assets) 5.340 5.411 3.639 0.00 *** 0.69 0.00 *** 0.00 *** 1.855 1.543 1.711 0.00 *** 0.68 0.00 *** 0.00 ***
Profitability 0.128 0.157 ‐0.107 0.00 *** 0.07 * 0.00 *** 0.00 *** 0.155 0.228 0.332 0.00 *** 0.18 0.00 *** 0.00 ***
Market‐to‐book ratio 1.195 1.203 1.350 0.42 0.92 0.19 0.28 0.715 0.862 1.415 0.77 0.93 0.47 0.53
Tangibility 0.728 0.785 0.677 0.00 *** 0.00 *** 0.08 * 0.00 *** 0.183 0.158 0.204 0.00 *** 0.00 *** 0.12 0.00 ***
Cash Flow Volatility 0.072 0.080 0.158 0.00 *** 0.32 0.00 *** 0.00 *** 0.088 0.089 0.176 0.01 *** 0.34 0.00 *** 0.01 ***
# of obs. 1857 117 41
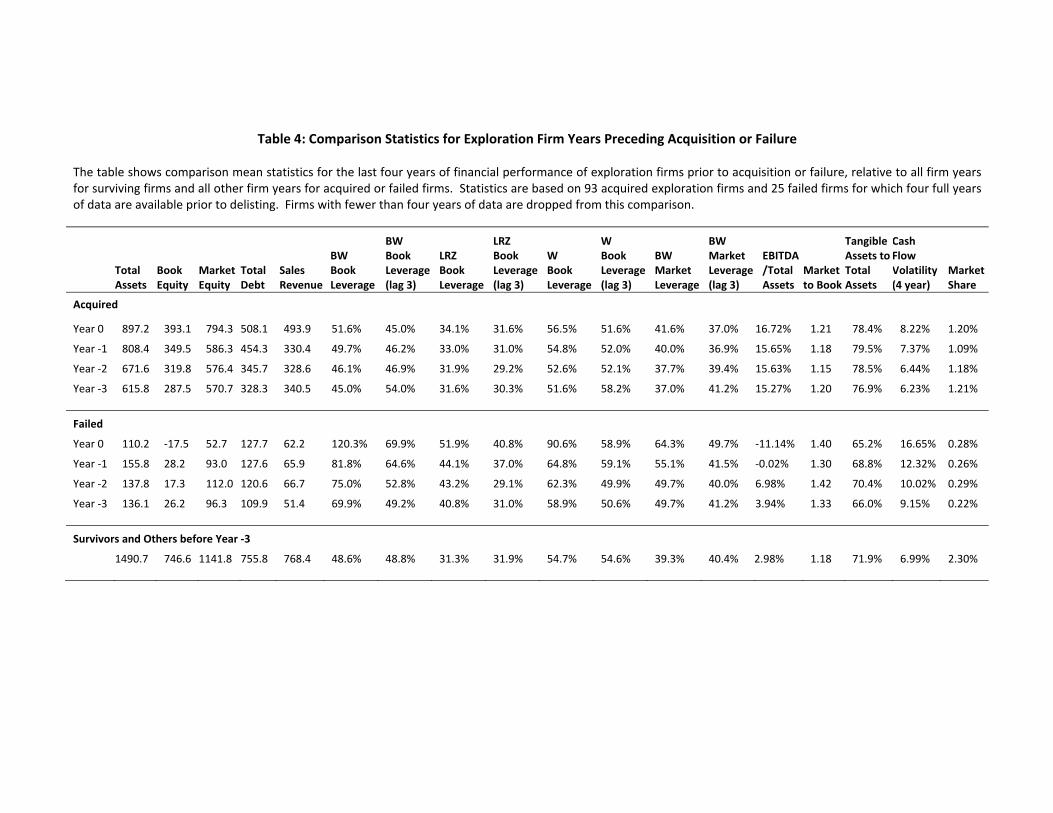
Table 4: Comparison Statistics for Exploration Firm Years Preceding Acquisition or Failure
The table shows comparison mean statistics for the last four years of financial performance of exploration firms prior to acquisition or failure, relative to all firm years for surviving firms and all other firm years for acquired or failed firms. Statistics are based on 93 acquired exploration firms and 25 failed firms for which four full years of data are available prior to delisting. Firms with fewer than four years of data are dropped from this comparison.
Total Assets
Book Equity
Market Equity
Total Debt
Sales Revenue
BW Book Leverage
BW Book Leverage (lag 3)
LRZ Book Leverage
LRZ Book Leverage (lag 3)
W Book Leverage
W Book Leverage (lag 3)
BW Market Leverage
BW Market Leverage (lag 3)
EBITDA/Total Assets
Market to Book
Tangible Assets to Total Assets
Cash Flow Volatility (4 year)
Market Share
Acquired
Year 0 897.2 393.1 794.3 508.1 493.9 51.6% 45.0% 34.1% 31.6% 56.5% 51.6% 41.6% 37.0% 16.72% 1.21 78.4% 8.22% 1.20%
Year ‐1 808.4 349.5 586.3 454.3 330.4 49.7% 46.2% 33.0% 31.0% 54.8% 52.0% 40.0% 36.9% 15.65% 1.18 79.5% 7.37% 1.09%
Year ‐2 671.6 319.8 576.4 345.7 328.6 46.1% 46.9% 31.9% 29.2% 52.6% 52.1% 37.7% 39.4% 15.63% 1.15 78.5% 6.44% 1.18%
Year ‐3 615.8 287.5 570.7 328.3 340.5 45.0% 54.0% 31.6% 30.3% 51.6% 58.2% 37.0% 41.2% 15.27% 1.20 76.9% 6.23% 1.21%
Failed
Year 0 110.2 ‐17.5 52.7 127.7 62.2 120.3% 69.9% 51.9% 40.8% 90.6% 58.9% 64.3% 49.7% ‐11.14% 1.40 65.2% 16.65% 0.28%
Year ‐1 155.8 28.2 93.0 127.6 65.9 81.8% 64.6% 44.1% 37.0% 64.8% 59.1% 55.1% 41.5% ‐0.02% 1.30 68.8% 12.32% 0.26%
Year ‐2 137.8 17.3 112.0 120.6 66.7 75.0% 52.8% 43.2% 29.1% 62.3% 49.9% 49.7% 40.0% 6.98% 1.42 70.4% 10.02% 0.29%
Year ‐3 136.1 26.2 96.3 109.9 51.4 69.9% 49.2% 40.8% 31.0% 58.9% 50.6% 49.7% 41.2% 3.94% 1.33 66.0% 9.15% 0.22%
Survivors and Others before Year ‐3
1490.7 746.6 1141.8 755.8 768.4 48.6% 48.8% 31.3% 31.9% 54.7% 54.6% 39.3% 40.4% 2.98% 1.18 71.9% 6.99% 2.30%

Table 5: Probit Models of Delisting and Multinomial Probit Models of Acquisition and Failure
Estimates are based on 218 exploration firms, including 2015 firm‐years with 117 acquired firms and 41 failed firms. Observations are coded as delisted, failed, or acquired if the observation year is the last year before delisting. Failed firms include bankrupt, liquidated, and delisted for reasons other than acquisition. Book value models in Panel (a) are based on the Baker and Wurgler (BW) measure. They include book value leverage measured three years prior to the observation year, and the change in book value from three years prior until the observation year. Book value models in Panel (b) are based on the Lemmon, Roberts, and Zender (LRZ) measure. Market value models in Panel (c) are based on BW and are structured analogously. Statistical significance is estimated with standard errors clustered by firms. Significance levels in two‐tailed tests are ***, **, and * for the 0.01, 0.05, and 0.10 levels, respectively.
Probit Models Multinomial Probit Models
Delisted Acquired Failed
Panel (a) BW Book Value Models Coef. p‐value Coef. p‐value Coef. p‐value
Ln Book Leverage 0.0398 0.000 *** 0.0162 0.077 * 0.0121 0.000 *** Lag 3 Ln Book Leverage ‐0.0171 0.076 * ‐0.0171 0.042 ** 0.0014 0.488 Ln Assets ‐0.0112 0.001 *** ‐0.0035 0.263 ‐0.0043 0.002 *** Profitability 0.0191 0.645 0.0859 0.038 ** ‐0.0191 0.038 ** Market‐to‐Book ‐0.0001 0.992 ‐0.0006 0.937 ‐0.0032 0.016 ** Tangible Assets 0.0855 0.034 ** 0.0973 0.012 ** 0.0016 0.842 Cash Flow Volatility 0.1070 0.125 0.0747 0.188 ‐0.0090 0.578 Prior to 1978 ‐0.0387 0.012 ** ‐0.0349 0.001 *** ‐0.0003 0.947
Ln Book Leverage 0.0227 0.020 ** ‐0.0008 0.926 0.0135 0.000 *** Change in Ln Book Leverage 0.0171 0.076 * 0.0171 0.042 ** ‐0.0014 0.488
Change in Ln Book Leverage 0.0398 0.000 *** 0.0162 0.077 * 0.0121 0.000 *** Lag 3 Ln Book Leverage 0.0227 0.020 ** ‐0.0008 0.926 0.0135 0.000 ***
Panel (b) LRZ Book Value Models Ln Book Leverage 0.0073 0.264 0.0013 0.814 0.0042 0.060 * Lag 3 Ln Book Leverage ‐0.0030 0.602 ‐0.0046 0.341 0.0024 0.169 Ln Assets ‐0.0105 0.002 *** ‐0.0029 0.371 ‐0.0059 0.000 *** Profitability ‐0.0050 0.907 0.0742 0.074 ** ‐0.0288 0.026 ** Market‐to‐Book 0.0019 0.797 ‐0.0007 0.929 ‐0.0011 0.440 Tangible Assets 0.0879 0.030 ** 0.1056 0.007 *** ‐0.0024 0.797 Cash Flow Volatility 0.1413 0.053 * 0.0815 0.147 0.0017 0.940 Prior to 1978 ‐0.0395 0.011 ** ‐0.0334 0.002 *** ‐0.0037 0.374
Ln Book Leverage 0.0043 0.499 ‐0.0033 0.543 0.0066 0.002 *** Change in Ln Book Leverage 0.0030 0.602 0.0046 0.341 ‐0.0024 0.169
Change in Ln Book Leverage 0.0073 0.264 0.0013 0.814 0.0042 0.060 * Lag 3 Ln Book Leverage 0.0043 0.499 ‐0.0033 0.543 0.0066 0.002 ***
Panel (c) BW Market Value Models Ln Market Leverage 0.0388 0.000 *** 0.0181 0.039 ** 0.0118 0.000 *** Lag 3 Ln Mkt Leverage ‐0.0125 0.123 ‐0.0133 0.055 * 0.0019 0.340 Ln Assets ‐0.0107 0.001 *** ‐0.0038 0.228 ‐0.0041 0.002 *** Profitability 0.0219 0.604 0.0894 0.036 ** ‐0.0187 0.040 ** Market‐to‐Book 0.0149 0.044 ** 0.0052 0.580 0.0022 0.257 Tangible Assets 0.0831 0.036 ** 0.0960 0.013 ** 0.0007 0.922 Cash Flow Volatility 0.1145 0.105 0.0728 0.202 ‐0.0050 0.748 Prior to 1978 ‐0.0398 0.010 *** ‐0.0358 0.001 *** ‐0.0001 0.987
Ln Market Leverage 0.0263 0.006 *** 0.0048 0.586 0.0137 0.000 *** Change in Ln Mkt Leverage 0.0125 0.123 0.0133 0.055 * ‐0.0019 0.339
Change in Ln Market Leverage 0.0388 0.000 *** 0.0181 0.039 ** 0.0118 0.000 *** Lag 3 Ln Market Leverage 0.0263 0.006 *** 0.0048 0.586 0.0137 0.000 ***

3

Table 7: Probit Models of Delisting and Multinomial Probit Models of Acquisition and Failure
Estimates are based on 218 exploration firms, including 2015 firm‐years with 117 acquired firms and 41 failed firms. Observations are coded as delisted, failed, or acquired if the observation year is the last year before delisting. Failed firms include bankrupt, liquidated, and delisted for reasons other than acquisition. Book value models are based on the Baker and Wurgler (BW) measure of leverage. They include book value leverage measured three years prior to the observation year, and the change in book value from three years prior until the observation year. Panel (a) shows quadratic specifications of leverage. Panel (b) shows linear spline specifications of high and low leverage. Panel (c) shows linear spline results for bottom and top deciles or quintiles. Statistical significance is estimated with standard errors clustered by firm. Significance levels in two‐tailed tests are ***, **, and * for the 0.01, 0.05, and 0.10 levels, respectively.
Probit Models Multinomial Probit Models
Delisted Acquired Failed
Panel (a) Quadratic Models Coef. p‐value Coef. p‐value Coef. p‐value
Ln Book Leverage 0.0622 0.000 *** ‐0.0058 0.754 0.0192 0.000 *** Lag 3 Ln Book Leverage ‐0.0170 0.079 * ‐0.0170 0.040 ** 0.0014 0.516 Ln Book Leverage^2 0.0104 0.089 * ‐0.0094 0.195 0.0041 0.016 **
Ln Book Leverage 0.0395 0.000 *** 0.0162 0.081 * 0.0121 0.000 *** Lag 3 Ln Book Leverage ‐0.0139 0.421 ‐0.0169 0.373 0.0018 0.525 Lag 3 Ln Book Leverage^2 0.0011 0.817 0.0001 0.991 0.0002 0.811
Ln Book Leverage 0.0627 0.000 *** ‐0.0072 0.710 0.0193 0.000 *** Lag 3 Ln Book Leverage ‐0.0189 0.305 ‐0.0134 0.461 0.0008 0.794 Ln Book Leverage^2 ‐0.0189 0.087 * ‐0.0099 0.189 0.0042 0.016 ** Lag 3 Ln Book Leverage^2 ‐0.0006 0.903 0.0013 0.807 ‐0.0003 0.788
Panel (b) Spline High‐Low Models
Ln Book Leverage 0.0421 0.000 *** 0.0204 0.027 ** 0.0104 0.002 *** Ln Book Leverage Above Mean 0.0762 0.000 *** 0.0390 0.016 ** 0.0128 0.019 ** Lag 3 Ln Book Leverage ‐0.0153 0.106 ‐0.0162 0.052 * 0.0016 0.445
Ln Book Leverage 0.0401 0.000 *** 0.0165 0.075 * 0.0117 0.000 *** Lag 3 Ln Book Leverage ‐0.0167 0.080 * ‐0.0165 0.048 ** 0.0016 0.462 Lag 3 Ln Book Leverage Above Mean 0.0055 0.766 0.0173 0.732 ‐0.0029 0.447
Ln Book Leverage 0.0418 0.000 *** 0.0205 0.027 ** 0.0097 0.002 *** Ln Book Leverage Above Mean 0.0773 0.000 *** 0.0389 0.016 ** 0.0134 0.014 ** Lag 3 Ln Book Leverage ‐0.0158 0.100 * ‐0.0162 0.054 * 0.0019 0.428 Lag 3 Ln Book Leverage Above Mean ‐0.0064 0.729 0.0008 0.965 ‐0.0051 0.239
Panel (c) Spline Models of Leverage Extremes
Ln Book Leverage 0.0118 0.439 ‐0.0019 0.883 0.0126 0.004 *** Lag 3 Ln Book Leverage ‐0.0158 0.099 * ‐0.0165 0.043 ** 0.0016 0.460 Top Decile ‐ No Lag 0.1225 0.021 ** 0.0233 0.658 0.0107 0.342 Bottom Decile ‐ No Lag 0.0580 0.208 0.0807 0.055 * ‐0.0193 0.033 **
Ln Book Leverage 0.0037 0.859 ‐0.0013 0.944 0.0111 0.062 * Lag 3 Ln Book Leverage ‐0.0156 0.106 ‐0.0166 0.046 * 0.0016 0.452 Top Quintile ‐ No Lag 0.1301 0.012 ** 0.0305 0.532 0.0146 0.235 Bottom Quintile ‐ No Lag 0.0336 0.339 0.0354 0.251 ‐0.0129 0.174
Ln Book Leverage 0.0419 0.000 *** 0.0182 0.056 * 0.0116 0.000 *** Lag 3 Ln Book Leverage ‐0.0298 0.057 * ‐0.0294 0.036 ** 0.0030 0.303 Top Decile ‐Lag 3 0.0553 0.154 0.0434 0.321 ‐0.0015 0.819 Bottom Decile ‐ Lag 3 0.0261 0.411 0.0301 0.304 ‐0.0058 0.233
Ln Book Leverage 0.0402 0.000 *** 0.0170 0.070 * 0.0113 0.000 *** Lag 3 Ln Book Leverage ‐0.0217 0.316 ‐0.0236 0.231 0.0057 0.221 Top Quintile ‐ Lag 3 0.0363 0.389 0.0277 0.542 ‐0.0048 0.531 Bottom Quintile ‐ Lag 3 ‐0.0003 0.993 0.0070 0.800 ‐0.0084 0.190
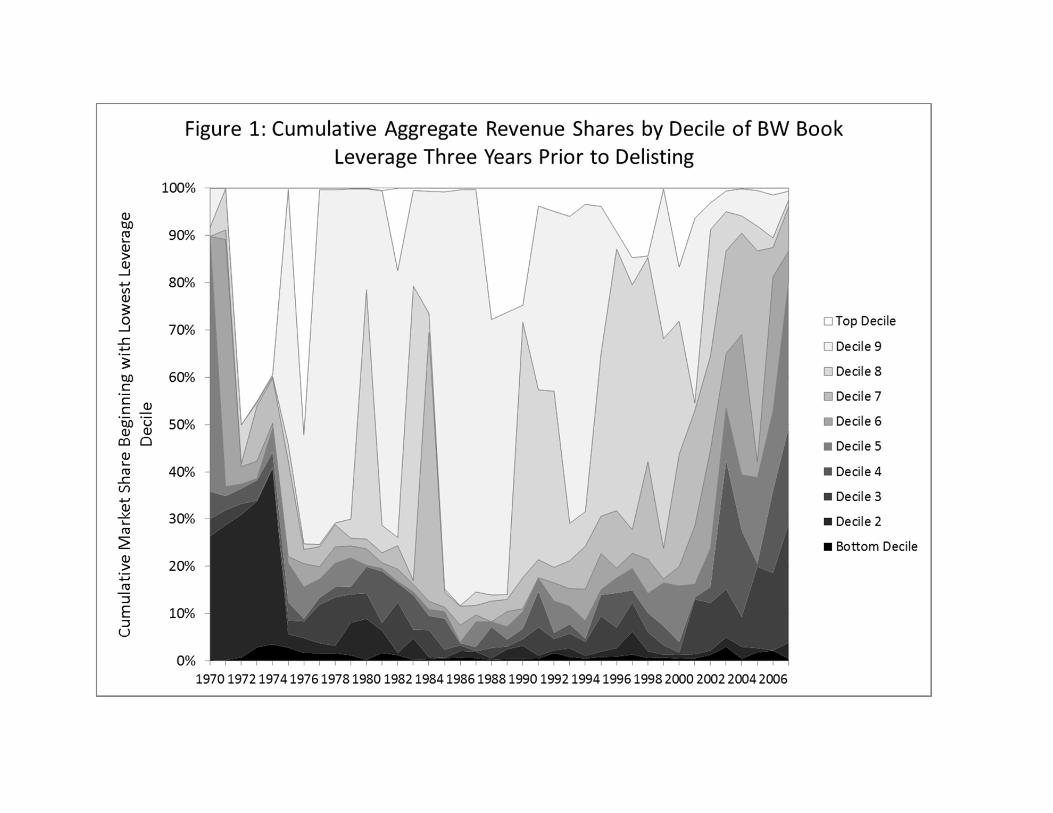

Appendix A: Classification Codes Used in Oil Industry Sample Selection
SIC and SICH: Standard Industrial Classification
1311 Crude Petroleum and Natural Gas
2911 Petroleum Refining
NAICS and NAICSH: North American Industry Classification System
211111 Crude Petroleum and Natural Gas Extraction
211112 Natural Gas Extraction
324110 Petroleum Refineries
422710 Petroleum Products Retailing and Wholesaling
422720 Crude Oil Marketing and Refining
424720 Petroleum Products Wholesaling
GSUBIND: Global Industries Classification Standard (S&P)
10102010 Integrated Oil and Gas
10102020 Oil and Gas Exploration and Production
10102030 Oil and Gas Refining and Marketing
S&P: S&P (Old) Industry Codes
380 Oil and Gas Exploration and Production
382 Oil and Gas Refining and Marketing
385 Oil and Gas Integrated Refining and Marketing
390 Oil and Gas International Integrated
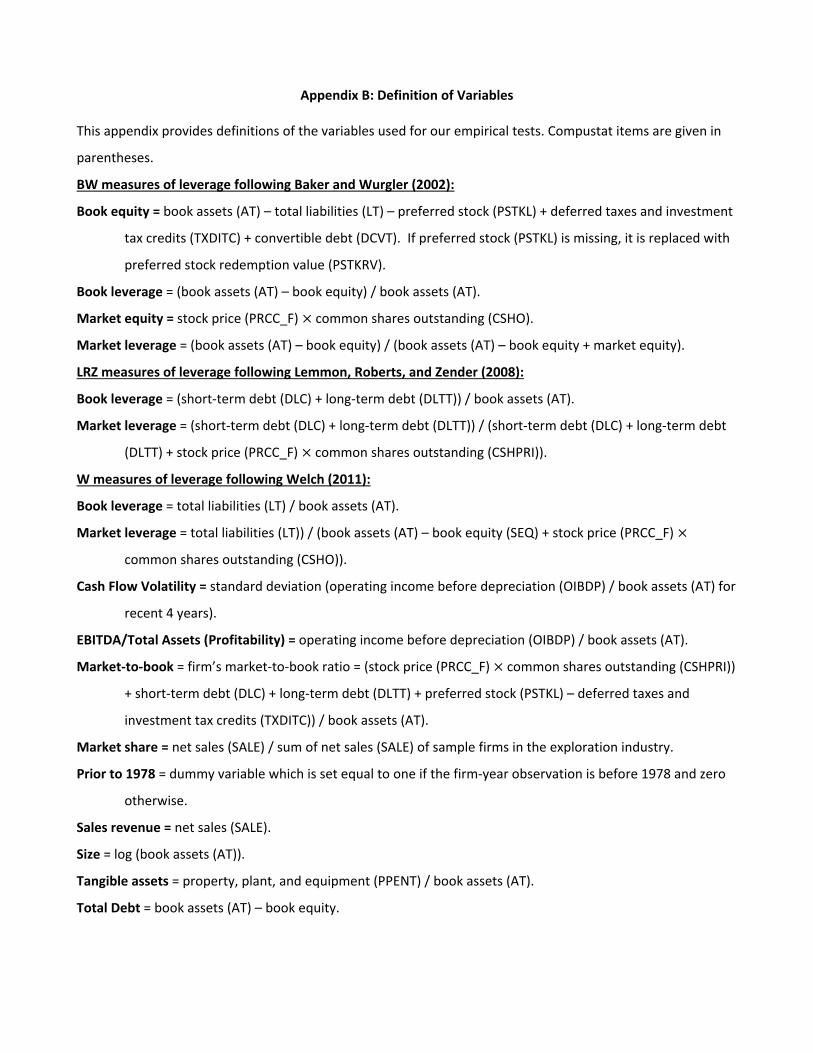
Appendix B: Definition of Variables
This appendix provides definitions of the variables used for our empirical tests. Compustat items are given in
parentheses.
BW measures of leverage following Baker and Wurgler (2002):
Book equity = book assets (AT) – total liabilities (LT) – preferred stock (PSTKL) + deferred taxes and investment
tax credits (TXDITC) + convertible debt (DCVT). If preferred stock (PSTKL) is missing, it is replaced with
preferred stock redemption value (PSTKRV).
Book leverage = (book assets (AT) – book equity) / book assets (AT).
Market equity = stock price (PRCC_F) common shares outstanding (CSHO).
Market leverage = (book assets (AT) – book equity) / (book assets (AT) – book equity + market equity).
LRZ measures of leverage following Lemmon, Roberts, and Zender (2008):
Book leverage = (short‐term debt (DLC) + long‐term debt (DLTT)) / book assets (AT).
Market leverage = (short‐term debt (DLC) + long‐term debt (DLTT)) / (short‐term debt (DLC) + long‐term debt
(DLTT) + stock price (PRCC_F) common shares outstanding (CSHPRI)).
W measures of leverage following Welch (2011):
Book leverage = total liabilities (LT) / book assets (AT).
Market leverage = total liabilities (LT)) / (book assets (AT) – book equity (SEQ) + stock price (PRCC_F)
common shares outstanding (CSHO)).
Cash Flow Volatility = standard deviation (operating income before depreciation (OIBDP) / book assets (AT) for
recent 4 years).
EBITDA/Total Assets (Profitability) = operating income before depreciation (OIBDP) / book assets (AT).
Market‐to‐book = firm’s market‐to‐book ratio = (stock price (PRCC_F) common shares outstanding (CSHPRI))
+ short‐term debt (DLC) + long‐term debt (DLTT) + preferred stock (PSTKL) – deferred taxes and
investment tax credits (TXDITC)) / book assets (AT).
Market share = net sales (SALE) / sum of net sales (SALE) of sample firms in the exploration industry.
Prior to 1978 = dummy variable which is set equal to one if the firm‐year observation is before 1978 and zero
otherwise.
Sales revenue = net sales (SALE).
Size = log (book assets (AT)).
Tangible assets = property, plant, and equipment (PPENT) / book assets (AT).
Total Debt = book assets (AT) – book equity.
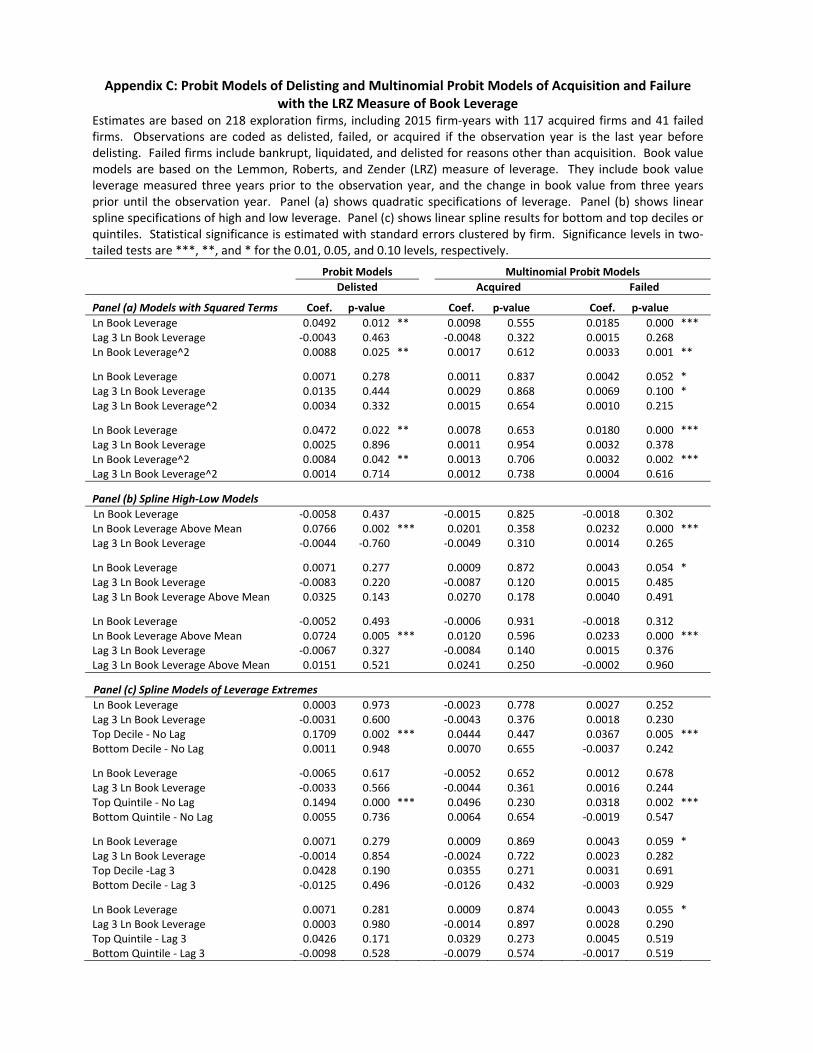
Appendix C: Probit Models of Delisting and Multinomial Probit Models of Acquisition and Failure with the LRZ Measure of Book Leverage
Estimates are based on 218 exploration firms, including 2015 firm‐years with 117 acquired firms and 41 failed firms. Observations are coded as delisted, failed, or acquired if the observation year is the last year before delisting. Failed firms include bankrupt, liquidated, and delisted for reasons other than acquisition. Book value models are based on the Lemmon, Roberts, and Zender (LRZ) measure of leverage. They include book value leverage measured three years prior to the observation year, and the change in book value from three years prior until the observation year. Panel (a) shows quadratic specifications of leverage. Panel (b) shows linear spline specifications of high and low leverage. Panel (c) shows linear spline results for bottom and top deciles or quintiles. Statistical significance is estimated with standard errors clustered by firm. Significance levels in two‐tailed tests are ***, **, and * for the 0.01, 0.05, and 0.10 levels, respectively.
Probit Models Multinomial Probit Models
Delisted Acquired Failed
Panel (a) Models with Squared Terms Coef. p‐value Coef. p‐value Coef. p‐value
Ln Book Leverage 0.0492 0.012 ** 0.0098 0.555 0.0185 0.000 *** Lag 3 Ln Book Leverage ‐0.0043 0.463 ‐0.0048 0.322 0.0015 0.268 Ln Book Leverage^2 0.0088 0.025 ** 0.0017 0.612 0.0033 0.001 **
Ln Book Leverage 0.0071 0.278 0.0011 0.837 0.0042 0.052 * Lag 3 Ln Book Leverage 0.0135 0.444 0.0029 0.868 0.0069 0.100 * Lag 3 Ln Book Leverage^2 0.0034 0.332 0.0015 0.654 0.0010 0.215
Ln Book Leverage 0.0472 0.022 ** 0.0078 0.653 0.0180 0.000 *** Lag 3 Ln Book Leverage 0.0025 0.896 0.0011 0.954 0.0032 0.378 Ln Book Leverage^2 0.0084 0.042 ** 0.0013 0.706 0.0032 0.002 *** Lag 3 Ln Book Leverage^2 0.0014 0.714 0.0012 0.738 0.0004 0.616
Panel (b) Spline High‐Low Models
Ln Book Leverage ‐0.0058 0.437 ‐0.0015 0.825 ‐0.0018 0.302 Ln Book Leverage Above Mean 0.0766 0.002 *** 0.0201 0.358 0.0232 0.000 *** Lag 3 Ln Book Leverage ‐0.0044 ‐0.760 ‐0.0049 0.310 0.0014 0.265
Ln Book Leverage 0.0071 0.277 0.0009 0.872 0.0043 0.054 * Lag 3 Ln Book Leverage ‐0.0083 0.220 ‐0.0087 0.120 0.0015 0.485 Lag 3 Ln Book Leverage Above Mean 0.0325 0.143 0.0270 0.178 0.0040 0.491
Ln Book Leverage ‐0.0052 0.493 ‐0.0006 0.931 ‐0.0018 0.312 Ln Book Leverage Above Mean 0.0724 0.005 *** 0.0120 0.596 0.0233 0.000 *** Lag 3 Ln Book Leverage ‐0.0067 0.327 ‐0.0084 0.140 0.0015 0.376 Lag 3 Ln Book Leverage Above Mean 0.0151 0.521 0.0241 0.250 ‐0.0002 0.960
Panel (c) Spline Models of Leverage Extremes Ln Book Leverage 0.0003 0.973 ‐0.0023 0.778 0.0027 0.252 Lag 3 Ln Book Leverage ‐0.0031 0.600 ‐0.0043 0.376 0.0018 0.230 Top Decile ‐ No Lag 0.1709 0.002 *** 0.0444 0.447 0.0367 0.005 *** Bottom Decile ‐ No Lag 0.0011 0.948 0.0070 0.655 ‐0.0037 0.242
Ln Book Leverage ‐0.0065 0.617 ‐0.0052 0.652 0.0012 0.678 Lag 3 Ln Book Leverage ‐0.0033 0.566 ‐0.0044 0.361 0.0016 0.244 Top Quintile ‐ No Lag 0.1494 0.000 *** 0.0496 0.230 0.0318 0.002 *** Bottom Quintile ‐ No Lag 0.0055 0.736 0.0064 0.654 ‐0.0019 0.547
Ln Book Leverage 0.0071 0.279 0.0009 0.869 0.0043 0.059 * Lag 3 Ln Book Leverage ‐0.0014 0.854 ‐0.0024 0.722 0.0023 0.282 Top Decile ‐Lag 3 0.0428 0.190 0.0355 0.271 0.0031 0.691 Bottom Decile ‐ Lag 3 ‐0.0125 0.496 ‐0.0126 0.432 ‐0.0003 0.929
Ln Book Leverage 0.0071 0.281 0.0009 0.874 0.0043 0.055 * Lag 3 Ln Book Leverage 0.0003 0.980 ‐0.0014 0.897 0.0028 0.290 Top Quintile ‐ Lag 3 0.0426 0.171 0.0329 0.273 0.0045 0.519 Bottom Quintile ‐ Lag 3 ‐0.0098 0.528 ‐0.0079 0.574 ‐0.0017 0.519
Related Documents