153 5 Concrete Mix Design 5.1 INTRODUCTION Generally, every site location has special characteristics, depending on the aggregate materials that are available near the site. The main task for designing the concrete mix is to obtain the required concrete characteristic strength after 28 days for stan- dard cubes or cylinders according to the project specifications. This is very impor- tant in designing the concrete mix; the second factor is the workability and the way of pouring must be known. When using a pump in the casting process a special concrete design mix is needed. On site, the quality control (QC) team has to accept the concrete mix on site; sometimes a third party can be hired to perform the quality control of the concrete. In any case, the quality control team should be well trained so that by visual inspec- tion only they can determine the quality. In addition, they should have the capability to perform a fast fresh concrete test and compare the results with the project speci- fications, so they are fully responsible for accepting or refusing the concrete that is delivered to the site from the mixer plant or mixed on site. The quality control team should understand the basics of concrete design mix in different specifications and have the capability to analyze the data easily by using essential statistical information, as will be clearly explained in this chapter, and com- pare data with the results and with the project specifications. 5.2 ESSENTIAL STATISTICAL INFORMATION Some statistics knowledge is essential to the engineer who is responsible for quality in general and specific for concrete quality control, that depends on studying the results of the concrete compressive strength tests. From these results one can define statistically the acceptance and refusal limits. Concrete design mixes in Egyptian, American, and British codes depend on the statistical information. The essential statistics criteria will be illustrated in the next section, such as the arithmetic mean, standard deviation, and coefficient of variation. 5.2.1 ARITHMETIC MEAN The arithmetic mean is the average of a group of results and is represented by this equation: © 2009 by Taylor and Francis Group, LLC

Welcome message from author
This document is posted to help you gain knowledge. Please leave a comment to let me know what you think about it! Share it to your friends and learn new things together.
Transcript
153
5 Concrete Mix Design
5.1 IntRoductIon
Generally, every site location has special characteristics, depending on the aggregate materials that are available near the site. The main task for designing the concrete mix is to obtain the required concrete characteristic strength after 28 days for stan-dard cubes or cylinders according to the project specifications. This is very impor-tant in designing the concrete mix; the second factor is the workability and the way of pouring must be known. When using a pump in the casting process a special concrete design mix is needed.
On site, the quality control (QC) team has to accept the concrete mix on site; sometimes a third party can be hired to perform the quality control of the concrete. In any case, the quality control team should be well trained so that by visual inspec-tion only they can determine the quality. In addition, they should have the capability to perform a fast fresh concrete test and compare the results with the project speci-fications, so they are fully responsible for accepting or refusing the concrete that is delivered to the site from the mixer plant or mixed on site.
The quality control team should understand the basics of concrete design mix in different specifications and have the capability to analyze the data easily by using essential statistical information, as will be clearly explained in this chapter, and com-pare data with the results and with the project specifications.
5.2 essentIal statIstIcal InfoRmatIon
Some statistics knowledge is essential to the engineer who is responsible for quality in general and specific for concrete quality control, that depends on studying the results of the concrete compressive strength tests. From these results one can define statistically the acceptance and refusal limits. Concrete design mixes in Egyptian, American, and British codes depend on the statistical information.
The essential statistics criteria will be illustrated in the next section, such as the arithmetic mean, standard deviation, and coefficient of variation.
5.2.1 aritHmetic mean
The arithmetic mean is the average of a group of results and is represented by this equation:
© 2009 by Taylor and Francis Group, LLC

154 Advanced Materials and Techniques for Reinforced Concrete Structures
X X Xn
Xn= + + +1 2 ............ (5.1)
wheren is the number of the results.X is the reading for each result.
As a practical example, assume that three samples were taken of standard cubes from the first mixing and a compressive strength test was performed after 28 days. The following results were obtained: 31 N/mm2, 30 N/mm2, and 29 N/mm2. When calcu-lating the arithmetic mean value from the above equation the mean is 30 N/mm2.
From the second mixing, three samples were taken of standard cubes and were crushed, also after 28 days under the same conditions as for the previous mixing, and the following results were obtained: 37 N/mm2, 30 N/mm2, and 23 N/mm2. The mean is 30 N/mm2.
It is clear that the two mixings provide the same mean value. Does this mean that the two mixings are the same quality? Can we accept the two mixings? From an engineering perspective there are differences, but the arithmetic mean is the same. Therefore, it is important to define another statistics criteria to compare the two mixings.
5.2.2 Standard deviation
The standard deviation is the second statistical parameter that expresses the distri-bution of the test results around the arithmetic mean and is based on the following equation:
S X X X X X Xn
n= − + − + + −( ) ( ) ......... ( )12
12 2
(5.2)
If we apply the above equation to the previous example for the first mixing, the standard deviation will be
S = − + − + −( ) ( ) ( )31 30 30 30 29 303
2 2 2
The standard deviation for the first mixing = 0.816 N/mm2. To calculate the standard deviation for the second mixing:
S = − + − + −( ) ( ) ( )37 30 30 30 23 303
2 2 2
The standard deviation for the second mixing = 5.7 N/mm2.
© 2009 by Taylor and Francis Group, LLC

Concrete Mix Design 155
The standard deviation of the second mixture has a higher value than the first mix-ture and the results of the cube’s concrete strength in the second mixture are far from the arithmetic mean than the first mixture. This represents a significant deviation from the arithmetic mean, which tells us that quality is very low.
Note that the standard deviation has units. Therefore, it must be conducted through a comparison with the same average value. The previous example presented two mixtures with the same required average concrete compressive strength at 28 days equal to 30 N/mm2.
On the other hand, if a comparison of two locations shows different concrete strength, then another factor is required. Assume that the first site required concrete strength 30 N/mm2 and the second site has concrete strength equal to 50 N/mm2. In that case, the standard deviation has no meaning as a comparison tool, so in this case we need another statistical tool, which is the coefficient of variation.
5.2.3 coeFFicient oF variation
The coefficient of variation (C.O.V.) is the true measure of quality control as it deter-mines the proportion of difference or the deviation of the readings from the arith-metic mean (Figure 5.6). This factor has no units, as it is the standard deviation divided by the mean. Therefore, C.O.V. is the main factor for the quality control degree measurement.
C O V SX
. . = (5.3)
As another example, a third mixture was designed at another site to give concrete compressive strength after 28 days values equal to 50 N/mm2. The three samples taken gave the compressive strength after 28 days of 51 N/mm2, 50 N/mm2, and 49 N/mm2. When calculating the arithmetic mean and standard deviation, we find that
Mean = 50 N/mm2
Standard deviation = 0.816 N/mm2
Note that in this site the arithmetic mean is identical with the requirements of the mixture design to have compressive strength after 28 days equal to 50 N/mm2. In the previous example, the mean compressive strength was 30 N/mm2 with the same value of the standard deviation. Therefore, making the comparison of two sites should be done through calculating the coefficient of variation for each.
C.O.V. for first site = 0.03
C.O.V. for second site = 0.02
Note that the second site has a lower C.O.V. than the first site, so the percentage of the standard deviation to arithmetic mean is lower in the second location than at
© 2009 by Taylor and Francis Group, LLC

156 Advanced Materials and Techniques for Reinforced Concrete Structures
the first site. Therefore, the second site concrete mixture is higher quality that the first site. Whenever C.O.V. is close to zero, quality control is excellent.
5.3 BasIcs of concRete mIx desIgn
The strength results for 46 cube samples from a particular class of concrete delivered to a project are shown in Table 5.1.
From the descending cumulative curve, one can see that 100% of the sampling results give compressive strength less than 45.9 N/mm2 (Figures 5.1–5.3). At the same time, one can see from the results of previous tests that the samples that give results equal to or less than 28 N/mm2 are about 2% of the total tested samples (Tables 5.2 and 5.3).
0270 290 310 330 350 370 390 410 430 450
2468
101214
Concrete Strength, kg/cm2
Freq
uenc
y
fIguRe 5.1 Frequency histogram.
taBle 5.1concrete strength Values after 28 days
305 340 298 422 340
267 297 320 382 356
349 366 312 340 355
404 382 306 368 311
350 448 350 322 326
303 365 384 346 358
344 339 306 298 398
360 360 282 320 378
352 325 341 326 367
384
© 2009 by Taylor and Francis Group, LLC

Concrete Mix Design 157
0
5
10
15
Concrete Strength, kg/cm2
Freq
uenc
y
270 290 310 330 350 370 390 410 430 450
fIguRe 5.2 Relation curve of frequency and concrete strength results.
0
20
40
60
80
100
120
460440420400380360340320300280260Concrete Strength, kg/cm2
Perc
enta
ge L
ess t
han
Com
pres
sive
Stre
ngth
fIguRe 5.3 Descending curve for concrete compressive strength.
taBle 5.2concrete strength frequency
sample no. cell Boundaries mid-cell Values frequency
1 260–280 270 1
2 280–300 290 4
3 300–320 310 6
4 320–340 330 7
5 340–360 350 13
6 360–380 370 7
7 380–400 390 5
8 400–420 410 1
9 420–440 430 1
10 440–460 450 1
Total 46
© 2009 by Taylor and Francis Group, LLC

158 Advanced Materials and Techniques for Reinforced Concrete Structures
5.3.1 normal diStriBution
Normal distribution is the most popoular probability distribution curve as it presents well the most natural phenomena. It is found from the experimental test results indi-cating that the compressive strength of a concrete cube as a standard test follows the normal distribution. The shape of the normal distribution is shown in Figure 5.4 and it has special characteristics, as follows:
Normal distribution is symmetrically distributed about the arithmetic •mean; on the other hand, the arithmetic mean divides the curve into two equal parts.The arithmetic mean, median, and mode are the most likely to coincide.•The area under the curve is unity since the sum for all probabilities must •equal unity.
Z = 1.64
Area = 5%
fIguRe 5.4 Normal distribution curve.
table 5.3descending frequency
sample no.
compressive strength (Kg/cm2)
no. of Readings With Values lower than the compressive
strength
Percentage of Readings less than lower level Value
10 460 46 100
10 440 45 98
9 420 41 90
8 400 35 76
7 380 28 61
6 360 15 33
5 340 8 17
4 320 3 6
3 300 2 4
2 280 1 2
1 260 0 0
© 2009 by Taylor and Francis Group, LLC

Concrete Mix Design 159
The variable representing cube crushing results can take the values from •∞ to –∞ so the curve presents all the probability values for the concrete compressive strength.
The equation for the probability distribution is as follows:
f x ex x
( )( )
=−1
2
2
22
σ πσ (5.4)
whereσ is the standrd deviation.x is the mean.
Therefore, as a result every distribution shape depends on the mean and the stan-dard deviation, and any variation in these two parameeters affects the shape of the probability distribution. So the standard normal distribution is used to define the area under the curve by knowing the standard deviation and the mean. From the fol-lowing equation can be obtained another parameter, which is Z:
z x x= −σ
(5.5)
Table 5.4 illustrates the values of the area under the curve by knowing Z as the values of Z in the first column. The first row defines the accuracy to two digital num-bers. From this table, one can see that the area under the curve at Z equal to 1.64 is 0.4495. So the area for values higher than Z is 0.5–0.4495, which is equal to 0.0505, which is around 5%. This means that the probability that the result values are less than Z is 5% and that will explain the basics of concrete mix design.
Figure 5.5 shows that the area from the mean to the first value of standard deviation is equal to 34.13% and the area for the two standard deviations is equal to 47.72%.
5.4 egyPtIan code
The characteristic strength of concrete is defined as the strength below which not more than a prescribed perecentage of the test results should fall. The Egyptian code adopts a percentage of 5%. Hence, by knowing the required concrete characteristic strength fcu, we can define the target strength (fm) to design the concrete mix, as in the following equation:
fm = fcu + M (5.6)
After designing the concrete mix based on the target strength, the probability of failing the results of the cube strength under the values of the characteristic strength must be less than 5%.
© 2009 by Taylor and Francis Group, LLC

160 Advanced Materials and Techniques for Reinforced Concrete Structures
taBle 5.4standard normal distribution
Z 0 0.01 0.02 0.03 0.04 0.05 0.06 0.07 0.08 0.09
0 0 0.004 0.008 0.012 0.016 0.0199 0.0239 0.0279 0.0319 0.0359
0.1 0.0398 0.0438 0.0478 0.0517 0.0557 0.0596 0.0636 0.0675 0.0714 0.0753
0.2 0.0793 0.0832 0.0871 0.091 0.0948 0.0987 0.1026 0.1064 0.1103 0.1141
0.3 0.1179 0.1217 0.1255 0.1293 0.1331 0.1368 0.1406 0.1443 0.148 0.1517
0.4 0.1554 0.1591 0.1628 0.1664 0.17 0.1736 0.1772 0.1808 0.1844 0.1879
0.5 0.1915 0.195 0.1985 0.2019 0.2054 0.2088 0.2123 0.2157 0.219 0.2224
0.6 0.2257 0.2291 0.2324 0.2357 0.2389 0.2422 0.2454 0.2486 0.2517 0.2549
0.7 0.258 0.2611 0.2642 0.2673 0.2704 0.2734 0.2764 0.2794 0.2823 0.2852
0.8 0.2881 0.291 0.2939 0.2967 0.2995 0.3023 0.3051 0.3078 0.3106 0.3133
0.9 0.3159 0.3186 0.3212 0.3238 0.3264 0.3289 0.3315 0.334 0.3365 0.3389
1 0.3413 0.3438 0.3461 0.3485 0.3508 0.3531 0.3554 0.3577 0.3599 0.3621
1.1 0.3643 0.3665 0.3686 0.3708 0.3729 0.3749 0.377 0.379 0.381 0.383
1.2 0.3849 0.3869 0.3888 0.3907 0.3925 0.3944 0.3962 0.398 0.3997 0.4015
1.3 0.4032 0.4049 0.4066 0.4082 0.4099 0.4115 0.4131 0.4147 0.4162 0.4177
1.4 0.4192 0.4207 0.4222 0.4236 0.4251 0.4265 0.4279 0.4292 0.4306 0.4319
1.5 0.4332 0.4345 0.4357 0.437 0.4382 0.4394 0.4406 0.4418 0.4429 0.4441
1.6 0.4452 0.4463 0.4474 0.4484 0.4495 0.4505 0.4515 0.4525 0.4535 0.4545
1.7 0.4554 0.4564 0.4573 0.4582 0.4591 0.4599 0.4608 0.4616 0.4625 0.4633
1.8 0.4641 0.4649 0.4656 0.4664 0.4671 0.4678 0.4686 0.4693 0.4699 0.4706
1.9 0.4713 0.4719 0.4726 0.4732 0.4738 0.4744 0.475 0.4756 0.4761 0.4767
2 0.4772 0.4778 0.4783 0.4788 0.4793 0.4798 0.4803 0.4808 0.4812 0.4817
2.1 0.4821 0.4826 0.483 0.4834 0.4838 0.4842 0.4846 0.485 0.4854 0.4857
2.2 0.4861 0.4864 0.4868 0.4871 0.4875 0.4878 0.4881 0.4884 0.4887 0.489
2.3 0.4893 0.4896 0.4898 0.4901 0.4904 0.4906 0.4909 0.4911 0.4913 0.4916
2.4 0.4918 0.492 0.4922 0.4925 0.4927 0.4929 0.4931 0.4932 0.4934 0.4936
2.5 0.4938 0.494 0.4941 0.4943 0.4945 0.4946 0.4948 0.4949 0.4951 0.4952
2.6 0.4953 0.4955 0.4956 0.4957 0.4959 0.496 0.4961 0.4962 0.4963 0.4964
2.7 0.4965 0.4966 0.4967 0.4968 0.4969 0.497 0.4971 0.4972 0.4973 0.4974
2.8 0.4974 0.4975 0.4976 0.4977 0.4977 0.4978 0.4979 0.4979 0.498 0.4981
2.9 0.4981 0.4982 0.4982 0.4983 0.4984 0.4984 0.4985 0.4985 0.4986 0.4986
3 0.4987 0.4987 0.4987 0.4988 0.4988 0.4989 0.4989 0.4989 0.499 0.499
© 2009 by Taylor and Francis Group, LLC

Concrete Mix Design 161
M is the safety factor to verify that the perecentage of the crushed cube’s strength values less than fcu will not be less than 5% (Table 5.5). This safety factor is a func-tion of the standard deviation, as shown in the following equation:
fm = fcu + 1.64 S (5.7)
Table 5.6 provides a guideline to predict the standard deviation of the concrete after knowing the QC of the site by visiting the site only; by performing a test and calculating the standard deviation one can audit and categorize the work and super-vising activities of the QC in this site.
This is also is a guide for the QC indicator for the ready mix batch plant that sup-plies the concrete to your site.
Table 5.7 is from ACI 214-77 and presents the overall standard deviation for con-crete in laboratory trial mixes and in the field for concrete strength 35 MPa.
σ 2σσ 2σ
0.3413
0.1359
0.3413
0.1359
0.0214 0.0214
fIguRe 5.5 Dividing area under normal distribution.
taBle 5.5safety margin factor for concrete design mix
availability of test Results
margin safety factor, m, for concrete compressive strength, fcu
fcu < 200 200 ≤ fcu < 400 600 ≥ fcu ≥ 400
1. Available 40 results or more with similar materials and condition
(1.64 S) and not less than 4 N/mm2
(1.64 S) and not less than 6 N/mm2
(1.64 S) and not less than 7.5 N/mm2
2. No available data or fewer than 40 testa results with similar materials and condition
Not less than 0.6 fcu Not less than 12 N/mm2 Not less than 15 N/mm2
a The test presents average of 3 standard cubes taken from same mix.
© 2009 by Taylor and Francis Group, LLC

162 Advanced Materials and Techniques for Reinforced Concrete Structures
taBle 5.6expected standard deviation Values
Quality control conditionstandard deviation
(n/mm2)
Good QC with continuous supervision 4–5
Moderate QC with occasional supervision 5–7
Poor QC with no supervision 7–9
taBle 5.7classification of standards of concrete Based on acI 214-77
standard of control
overall standard deviation (mPa)
In field laboratory trial mixes
Excellent <3 <1.5
Very good 3–3.5 1.5
Good 3.5–4 1.5–2
Fair 4–5 2–2.5
Poor >5 >2.5
V = 10
V = 15 V = 20
fcr = 24 N/mm2
fcr = 26 N/mm2
5
10
15
20
Perc
ent o
f Tes
t
Specifiedstrength = fc'
fcr = 28 N/mm2
Compressive Strength, N/mm2
fIguRe 5.6 Normal frequencies curve for C.O.V. 10, 15, 20.
© 2009 by Taylor and Francis Group, LLC

Concrete Mix Design 163
5.5 BRItIsH standaRd
The ECP has similar requirements to BS 5328:part 4:1990. The British practice cubes are also used. The British approach is to use a charactristic strength, defined as the value of strength below which 5% of all possible test results are expected to fall; the margin between the charactristic strength and the mean strength is selected to verify this probability. The following criteria must be applied to achieve this probability:
1. The average value of any four consecutive test results exceeds the specified charactristic strength by 3 MPa.
2. No test results fall below the specified characteristic strength by more than 3 MPa.
Similar requirements are prescribed for the flexural test: the values in criteria 1 and 2 are then 0.3 MPa.
5.6 ameRIcan sPecIfIcatIon (acI)
ACI code states that the concrete production facility has a record of at least 30 consecutive strength tests representing materials and conditions similar to those expected; the strength used as the basis for selecting concrete proportions must be the larger of
fcr = fc + 1.34 S (5.8)
or
fcr = fc + 2.33 S – 500 (5.9)
wherefcr is the required target strength in preparing the concrete mix.fc is the concrete strength after 28 days.
If the standard deviation is unknown, the required average strength fcr used as the basis for selecting concrete proportions must be determined from the following:
fcr = fc + 7 N/mm2 fc < 21 N/mm2
(fcr = fc + 1000 psi fc < 3000 psi)
fcr = fc + 8.4 N/mm2 fc = 21 – 35 N/mm2
(fcr = fc + 1200 psi fc = 3000 – 5000 psi )
fcr = fc + 9.8 N/mm2 fc > 35 N/mm2
(fcr = fc + 1400 psi fc > 5000 psi)
© 2009 by Taylor and Francis Group, LLC

164 Advanced Materials and Techniques for Reinforced Concrete Structures
Formulas for calculating the required target strengths are based on the follow-ing criteria:
1. A probability of 1% that an average of three consecutive strength tests will be below the specified strength, fc (fcr = fc + 1.34 S)
2. A probability of 1% that an individual strength test will be more than 3.5 N/mm2 (500 psi) below the specified strength fc(fcr = fc + 2.33 S – 500)
Criterion 1 will produce a higher required target strength than criterion 2 for low to moderate standard deviations, up to 500 psi. For higher standard deviations criterion 2 will govern.
5.6.1 accePtance and reFuSal For concrete mix
After a mix is approved for the proposed project, the concrete received on site will be acceptable if the results of the crushing standard cylinder tests after 28 days meet both of the following:
1. No single test strength or the average strengths of two cylinders from a batch shall be more than 3.5 N/mm2 (500 psi) below the specified compres-sive strength fc, i.e., 21.1 N/mm2 (3000 psi) for specified 24.6 N/mm2 (3500 psi) concrete.
2. The average of any three consecutive test strengths must equal or exceed the specified compressive strength, fc.
5.6.2 concrete mix Procedure
In summary, the mixing procedure is stated in ACI 211.1. Estimating the required batch weights for the concrete involves a sequence of logical, straightforward steps, which in effect fit the characteristics of the available materials into a mixture suitable for the work. The question of suitability is frequently not left to the individual select-ing the proportions. The job specifications may dictate some or all of the following:
Maximum water-cement or water-cementitious material ratio•Minimum cement content•Air content•Slump•Maximum size of aggregate•Strength•Other requirements relating to strength over design, admixtures, and spe-•cial types of cement, other cementitious materials, or aggregate
Regardless of whether the concrete characteristics are prescribed by the specifica-tions or left to the individual selecting the proportions, establishment of batch weights per cubic meter of concrete can be best accomplished in the following sequence:
© 2009 by Taylor and Francis Group, LLC

Concrete Mix Design 165
5.6.2.1 step 1: choice of slumpIf slump is not specified, a value appropriate for the work can be selected from Table 5.8. The slump ranges shown apply when vibration is used to consolidate the concrete. Mixes of the stiffest consistency that can be placed efficiently should be used. Note that the values of the slump listed in Table 5.8 can be increased when chemical admixtures are used.
5.6.2.2 step 2: choice of maximum size of aggregateLarge nominal maximum sizes of well-graded aggregates have fewer voids than smaller sizes. Hence, concretes with the larger-sized aggregates require less mortar per unit volume of concrete. Generally, the nominal maximum size of aggregate should be the largest that is economically available and consistent with dimensions of the structure. In no event should the nominal maximum size exceed one fifth of the narrowest dimension between sides of forms, one third the depth of slabs, nor three fourths of the minimum clear spacing between individual reinforcing bars, bundles of bars, or pre-tensioning strands. These limitations are sometimes waived if workability and methods of consolidation are such that the concrete can be placed without honeycomb or void.
In areas congested with reinforcing steel, post-tension ducts, or conduits, select a nominal maximum size of the aggregate so concrete can be placed without excessive segregation, pockets, or voids. When high strength concrete is desired, best results may be obtained with reduced nominal maximum sizes of aggregate since these produce higher strengths at a given water/cement (w/c) ratio.
5.6.2.3 step 3: estimation of mixing Water and air contentThe quantity of water per unit volume of concrete required to produce a given slump is dependent on the nominal maximum size, particle shape, and grading of the
taBle 5.8Recommended slumps for Various types of construction
types of construction
slump (mm)
maximuma minimum
Reinforced foundation, walls, and footings 75 25
Plain footings, caissons, and substructure walls 75 25
Beams and reinforced walls 100 25
Building columns 100 25
Pavement and slabs 75 25
Mass concrete 50 25
a Slump may be increased when chemical admixtures are used, provided that the admixture-treated concrete has the same or lower w/c ratio and does not exhibit segregation potential or excessive bleeding.
© 2009 by Taylor and Francis Group, LLC

166 Advanced Materials and Techniques for Reinforced Concrete Structures
aggregates; the concrete temperature; the amount of entrained air; and use of chemi-cal admixtures.
Slump is not greatly affected by the quantity of cement or cementitious materi-als within normal use levels (under favorable circumstances the use of some finely divided mineral admixtures may lower water requirements slightly).
Table 5.9 provides estimates of required mixing water for concrete made with various maximum sizes of aggregate, with and without air entrainment. Depending on aggregate texture and shape, mixing water requirements may be somewhat above or below the tabulated values, but they are sufficiently accurate for the first estimate. The differences in water demand are not necessarily reflected in strength since other compensating factors may be involved.
Rounded and angular coarse aggregates, both of which are similarly graded and of good quality, can be expected to produce concrete of about the same compressive strength for the same cement factor in spite of differences in w/c ratio resulting from the different mixing water requirements.
Particle shape is not necessarily an indicator that an aggregate will be either above or below its strength-producing capacity.
5.6.2.4 step 4: chemical admixturesChemical admixtures modify the properties of concrete to make it more workable, durable, and/or economical; increase or decrease the time of set; accelerate strength gain; and/or control temperature gain.
taBle 5.9approximate mixing Water (kg/m3) for different slumps and nominal maximum sizes of aggregate for non–air entrained concrete Based on acI
slump (mm)
nominal maximum aggregate size (mm)
10 12.5 19 25 37.5 50 75 152
25–50 206 198 186 177 162 153 130 112
75–100 227 215 201 192 177 168 145 124
152–178 242 227 212 201 185 177 159 —
approximate amount of entrapped air in non–air entrained concrete (%)
3 2.5 2 1.5 1 0.5 0.3 0.2
a Rounded aggregate will generally require 13.5 kg less water for non–air entrained.
b The use of water reducing chemical admixture, ASTM C494, may also reduce mixing water by 5% or more.
c The slump values of more than 178 mm are only obtained through the use of water-reducing chemical admixtures; they are for concrete containing nominal maximum size aggregate not larger than 25 mm.
© 2009 by Taylor and Francis Group, LLC

Concrete Mix Design 167
Chemical admixtures should be used only after an appropriate evaluation has been conducted to show that the desired effects have been accomplished under the conditions of intended use. Making sure that water reducing and/or set-controlling admixtures conform to the requirements of ASTM C494, when used singularly or in combination with other chemical admixtures, will significantly reduce the quantity of water per unit volume of concrete.
The use of some chemical admixtures, even at the same slump, will improve such qualities as workability, finish ability, pump-ability, durability, and compressive and flexural strength. Significant volume of liquid admixtures should be considered as part of the mixing water. The slumps shown in Table 5.8 from ACI may be increased when chemical admixtures are used, providing the admixture-treated concrete has the same or a lower water/cement ratio and does not exhibit segregation potential and excessive bleeding. When only used to increase slump, chemical admixtures may not improve any of the properties of the concrete.
Table 5.9 indicates the approximate amount of entrapped air to be expected in non–air-entrained concrete and the recommended average air content for air-entrained concrete. If air entrainment is desired, three levels of air content are given for each aggregate size, depending on the purpose of the entrained air and the sever-ity of exposure if entrained air is needed for durability.
5.6.2.4.1 Mild ExposureWhen air entrainment is desired for a beneficial effect other than durability, such as to improve both the workability and cohesion or in low-cement-factor concrete to improve strength, air contents lower than those needed for durability can be used. This exposure includes indoor or outdoor service in a climate where concrete will not be exposed to freezing or to de-icing agents.
5.6.2.4.2 Moderate ExposureThis refers to a climate where freezing is expected but where the concrete will not be continually exposed to moisture or free water for long periods prior to freezing and will not be exposed to de-icing agents or other aggressive chemicals. Examples include exterior beams, columns, walls, girders, or slabs that are not in contact with wet soil and are so located that they will not receive direct applica-tions of de-icing salts.
5.6.2.4.3 Severe ExposureConcrete that is exposed to de-icing chemicals or other aggressive agents or where the concrete may become highly saturated by continued contact with moisture or free water prior to freezing. For example, pavements, bridge decks, curbs, gutters, sidewalks, canal linings, or exterior water tanks or sumps.
The use of normal amounts of air entrainment in concrete with a specified strength around 35 N/mm2 (5000 psi) may not be possible due to the fact that each added percent of air lowers the maximum strength obtainable with a given combina-tion of materials. In these cases the exposure to water, de-icing salts, and freezing temperatures should be carefully evaluated. If a member is not continually wet and will not be exposed to de-icing salts, lower air-content values such as those given in
© 2009 by Taylor and Francis Group, LLC

168 Advanced Materials and Techniques for Reinforced Concrete Structures
Table 5.9 for moderate exposure are appropriate even though the concrete is exposed to freezing and thawing temperatures.
However, for an exposure condition where the member may be saturated prior to freezing, the use of air entrainment should not be sacrificed for strength. In certain applications, it may be found that the content of entrained air is lower than that speci-fied, despite the use of usually satisfactory levels of air-entraining admixture.
This happens occasionally, for example, when very high cement contents are involved. In such cases, the achievement of required durability may be demonstrated by satisfactory results of examination of air-void structure in the paste of the hard-ened concrete.
When trial batches are used to establish strength relationships or verify strength-producing capability of a mixture, the least favorable combination of mixing water and air content should be used. The air content should be the maximum permitted or likely to occur, and the concrete should be gagged to the highest permissible slump. This will avoid developing an overly optimistic estimate of strength on the assumption that average rather than extreme conditions will prevail in the field. If the concrete obtained in the field has a lower slump and/or air content, the proportions of ingredients should be adjusted to maintain required yield. For additional information on air content recommendations, see ACI 201.2R, 301, and 302.1R.
5.6.2.5 step 5: selection of Water/cement (w/c) RatioThe required w/c ratio is determined not only by strength requirements but also by factors such as durability. Since different aggregates, cements, and cementitious materials generally produce different strengths in the same amount of water, it is highly desirable to know the relationship between strength and w/c for the materi-als actually to be used. In the absence of such data, approximate and relatively conservative values for concrete containing Type I Portland cement can be taken from Table 5.10 with typical materials and the tabulated w/c ratio should produce the strengths shown, based on 28-day tests of specimens cured under standard laboratory conditions. The average strength selected must, of course, exceed the specific strength by a sufficient margin to keep the number of low tests within specific limits.
For severe conditions of exposure, the w/c ratio should be kept low even though strength requirements may be met with a higher value. Table 5.11 gives limiting val-ues. When natural pozzolans, fly ash, GGBF slag, and silica fume, hereafter referred to as pozzolanic materials, are used in concrete, a water/cement plus pozzolanic materials ratio (or water/cement plus other cementitious materials ratio) by weight must be considered in place of the traditional water/cement ratio by weight.
5.6.3 mix ProPortionS
The selection of the concrete mix depends on the available aggregate near the site. So the properties of these aggregate should be defined. The main factor in any engi-neering practice is the project economy so the selection of the mix proportion should verify the following:
© 2009 by Taylor and Francis Group, LLC

Concrete Mix Design 169
taBle 5.10Relation of w/c Ratio and concrete compressive strength
compressive strength at 28 days (n/mm2) non–air entrained concrete air entrained concrete
42 0.41 —
35 0.48 0.40
28 0.57 0.48
21 0.68 0.59
14 0.82 0.74
Notes: Values are estimated average strengths for concrete of not more than 2% air for non–air entrained concrete and 6% total air content for air entrained concrete. For a constant w/c, the strength of concrete is reduced as the air content is increased. Twenty-eight-day strength values may be conservative and may change when various cementitious materials are used. The rate at which the 28-day strength is developed may also change. Strength is based on 6 × 12 in cylinders moist-cured for 28 days in accordance with the sections on “Initial Curing” and “Curing of Cylinders for Checking the Adequacy of Laboratory Mixture Proportions for Strength or as the Basis for Acceptance or for Quality Control” of ASTM method C31 for Making and Curing Concrete Specimens in the Field. The relationship in this table assumes a nominal maximum aggregate size of about 3/4 to 1 in. For a given source of aggregate, strength produced at a given w/c will increase as nominal maximum size of aggregate decreases.
taBle 5.11maximum Permissible w/c Ratio for concrete in severe exposuresa
type of structure
structure Wet continuously or frequently and exposed to freezing and thawingb
structure exposed to sea Water or sulfates
Thin sections (railings, curbs, sills, ledges, ornamental work) and sections with less than 25 mm cover over steel
0.45 0.40b
All other structures 0.50 0.45b
a Based on report of ACI Committee 201. Cementitious materials other than cement should conform to ASTM C618 and C989.
b If sulfate resisting cement (Type II or Type V of ASTM C150) is used, water-cementitious materials ratio may be increased by 0.05.
© 2009 by Taylor and Francis Group, LLC

170 Advanced Materials and Techniques for Reinforced Concrete Structures
The required concrete characteristic compressive strength•The durability of concrete, which requires defining the w/c ratio and •cement contentThe optimization of availability of materials, performance, and economics•
The following equation defines the concrete mix:
C A Ag W
c
f
f g1000 1000 1000 10001
γ γ γ+ + + = (5.10)
where C = mass of cement. Af = mass of fine aggregate. Ag = mass of coarse aggregate. W = mass of water. W = (w/c) × C. γc = cement specific gravity. γf = fine aggregate specific gravity. γg = coarse aggregate specific gravity.
This equation calculates the quantities of ingredients to produce 1 cubic meter of concrete. Note that the cement content proposed is based on the environmental con-ditions, and the required concrete strength can define the water/cement ratio (w/c). From experience, the required mixing ratio can define the cement/aggregate ratio [C/(Af + Ag)], and also the coarse/fine aggregate ratio (Af/Ag).
Hence, from these ratios and the previous equation the mix proportions can be defined.
5.6.3.1 British standardThe British standard BS8110 provides a guide to suitable concrete mixtures based on the environmental conditions classified as shown in Table 5.12.
After defining the environmental conditions based on BS8110, described in Table 5.12, refer to Table 5.13, which provides the minimum concrete grade required with a minimum cement content based on the maximum aggregate size and the cor-responding maximum w/c ratio.
5.7 fResH concRete test
5.7.1 cylinder and cuBe teSt
Three types of compression test specimens are used: cubes, cylinders, and prisms. Cubes are used in Great Britain, Germany, and many other countries in Europe. Cylinders are the standard specimens in the United States, France, Canada, Australia, and New Zealand. In Scandinavia tests are done on both cubes and cylinders.
© 2009 by Taylor and Francis Group, LLC

Concrete Mix Design 171
The tendency nowadays, especially in research, is to use cylinders in preference to cubes, but before comparing the two types of specimens the various tests should be considered in detail.
5.7.1.1 cube testThe specimens are cast in steel or cast-steel molds, generally 150 mm cubes. The stan-dard practice prescribed by BS1881:Part 3:1970 is to fill the mold in three layers. Each layer of concrete is compacted by not less than 35 strokes of a 25 mm (1 in) square steel rod. Ramming should continue until sufficient compaction has been achieved, for it is essential that the concrete in the cube be fully compacted if the compressive test is to be representative of the properties of fully compacted concrete.
After the top surface of the cube has been finished by trowel, the cube is stored undisturbed for 24 hours at 18ºC to 22ºC and relative humidity of not less than 90%. At the end of this period the mold is stripped and the cube is further cured in water at 19ºC to 21ºC.
The test is generally performed at 28 days but additional tests are also performed at 3 and 7 days. In the compression test, the cube is placed with the cast faces in con-tact with the platens of the testing machine, i.e., the position of the cube when tested is at right angles to that as-cast. It is worth mentioning that according to BS1881:Part 4:1970 the load on the cube should be applied at a constant rate of stress equal to 15 MPa/min (2200 psi/min).
taBle 5.12classification of environmental conditions Based on Bs8110 Part 1-1985
environment exposure conditions
Mild Concrete surfaces protected against weather or aggressive conditions
Exposed concrete surfaces but sheltered from severe rain or freezing while wet
Concrete surfaces continuously under nonaggressive water
Concrete in contact with nonaggressive soil
Moderate Concrete subject to condensation
Severe Concrete surfaces exposed to severe rain, alternate wetting and drying, or occasional freezing or severe condensation
Concrete surfaces occasionally exposed to sea water spray or de-icing salts (directly or indirectly)
Very severe Concrete surfaces exposed to corrosive fumes or severe freezing conditions while wet
Concrete surfaces frequently exposed to sea water spray or de-icing salts (directly or indirectly)
Most severe Concrete in sea water tidal zone down to 1 m below lowest low water
Abrasivea Concrete surfaces exposed to abrasive action, e.g., machinery, metal tiered vehicles, or water carrying solids
Note: (1) For aggressive soil and water conditions see 5.3.4 of BS 5328-1:1997. (2) For marine condi-tions see also BS 6349.
a For flooring see BS 8204.
© 2009 by Taylor and Francis Group, LLC

172 Advanced Materials and Techniques for Reinforced Concrete Structures
The cube standard 150 mm is more common and there are some other sizes as in the Table 5.13.
5.7.1.2 cylinder testThe standard cylinder size is 150 mm diameter by 300 mm height or 100 mm diam-eter by 200 mm height and it is cast in a mold generally made of steel or cast steel. Use a cylinder 100 mm diameter in the case of maximum nominal aggregate size, and not higher than 20 mm and 40 mm in the case of 150 mm diameter. The cylin-der specimens are made in a similar way to the cubes but are compacted either in three layers using a 16 mm diameter rod or in two layers by means of an immersion vibrator. Details of the procedure are described in ASTM Standard C192-76. The preparation of the cylinder is as shown in Figure 5.7.
The top surface of the cylinder finished with a float is not smooth enough for test-ing and requires further preparation: this is the greatest disadvantage of this type of specimen as normally used.
The top surface can be prepared in two ways. The first method is by using mor-tar on the top by using a collar with handle and filling by cement mortar, and the second method prepares the surface top cover by adding sulfur and fine sand with small amount of carbon (1%–2%) and this composition is heated to 130°C–150°C and cools slightly.
taBle 5.13Requirements of Bs 8110: Part 1-1985 to ensure durability under specific conditions of exposure of Plain concrete
exposure conditions max. w/c
min. grade mPa
min. content of cement for max. nominal aggregate size (kg/m3)
40 mm 20 mm 14 mm 10 mm
Mild 0.80 20 150 180 200 220
Moderate 0.65 30 245 275 295 315
Severe 0.60 35 270 300 320 340
Very severe 0.55 35 295 325 345 365
Extreme 0.50 45 320 350 370 390
fIguRe 5.7 Cylinder preparation.
© 2009 by Taylor and Francis Group, LLC
Concrete Mix Design 173
The cylinder is placed on a layer of coverage as thin as possible to make sure that the vertical axis of the cylinder, and then cut the excess after several seconds and center of the surface of the cylinder. During the test you must make sure that the cylinder cover will not slide or break before the collapse of the sample.
This test relies on sampling of concrete during the pouring process and must be represented as much as possible by a sample of concrete cast into structural members.
The samples will be taken by a standard shovel manufactured from non-rust material with thickness 0.8 mm. The amount of concrete taken by shovel at a time is about 5 kg and the number of shovels is determined in accordance with the standard type of test. Take into account when sampling from the mixer on site or from the mixer truck of ready mix concrete to exclude the first and last part of the shipment and never take samples that are not good representatives of the whole batch.
In the case of putting concrete in a horizontal position before delivering it for cast-ing must sampling of places allocated to the surface and with depth as you can.
In the case of casting, samples must be taken out of the mixer or from the mixing truck using cranes or pumps.
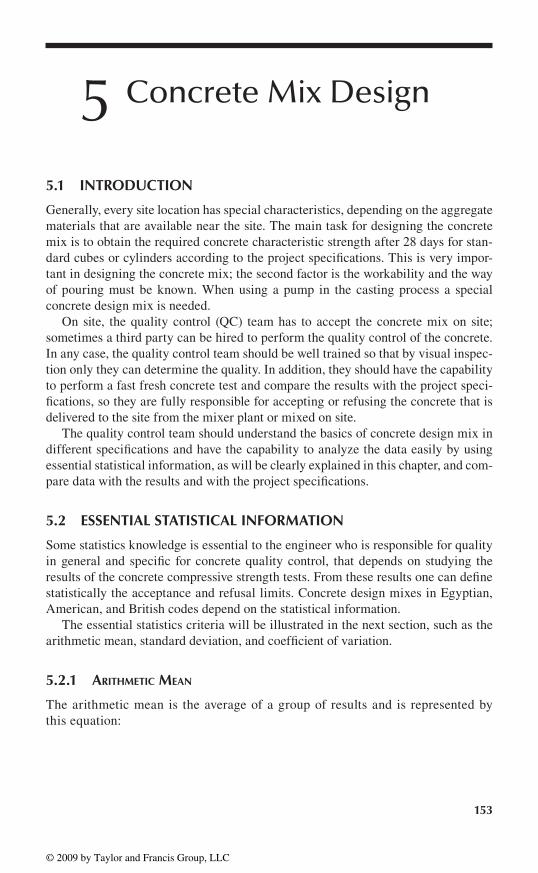
5.7.2 Predict concrete StrengtH
The number of samples taken is according to the prediction of the concrete strength and it is often done at 7 days and 28 days. As shown in Table 5.14, according to the Egyptian code, predicting the concrete strength at 28 days can be done by knowing the cube strength at 7 and 3 days. The number of cubes or cylinders tested at 3 and 7 days should be stated in the project specifications, which can also specify the mini-mum strength accepted at 3 or 7 days and define the reasonable time to remove the wood or the steel forms.
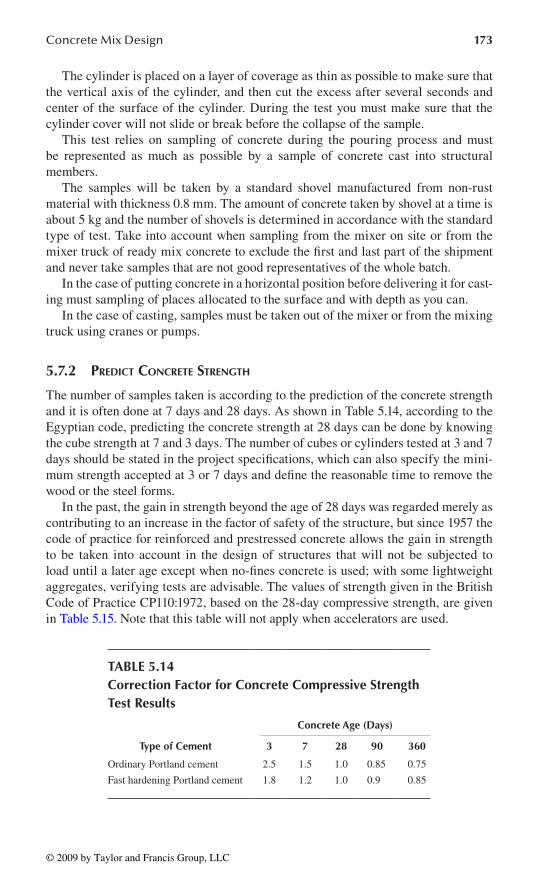
In the past, the gain in strength beyond the age of 28 days was regarded merely as contributing to an increase in the factor of safety of the structure, but since 1957 the code of practice for reinforced and prestressed concrete allows the gain in strength to be taken into account in the design of structures that will not be subjected to load until a later age except when no-fines concrete is used; with some lightweight aggregates, verifying tests are advisable. The values of strength given in the British Code of Practice CP110:1972, based on the 28-day compressive strength, are given in Table 5.15. Note that this table will not apply when accelerators are used.
taBle 5.14correction factor for concrete compressive strength test Results
type of cement
concrete age (days)
3 7 28 90 360
Ordinary Portland cement 2.5 1.5 1.0 0.85 0.75
Fast hardening Portland cement 1.8 1.2 1.0 0.9 0.85
© 2009 by Taylor and Francis Group, LLC
174 Advanced Materials and Techniques for Reinforced Concrete Structures
As mentioned before, the British standard and some countries use cubes, and in America and other countries the specifications say to use cylinders. Table 5.16 defines the relation between cube and cylinder test values so if you have the values of cylinder compressive strength it can be converted to cube value and vice versa.
5.8 defIne concRete densIty
Concrete density is an important factor for determining the dead loads for an accu-rate structure analysis (Figures 5.8 and 5.9). By knowing the concrete density one can predict the concrete compressive strength and the permeability.
taBle 5.15British code of Practice cP 110:1972 factors for Increase in compressive strength of concrete with age (average Values)
minimum age of member When full design load Is
applied (months)age factors for concrete with 28-day
strength (mPa)
1 1.00 1.00 1.00
2 1.10 1.09 1.07
3 1.16 1.12 1.09
6 1.20 1.17 1.13
12 1.24 1.23 1.17
taBle 5.16correction factors for concrete strengths for different molds
cubemold dimensions
(mm) correction factor
Cube 100 × 100 × 100 0.97
150 × 150 × 150 1.00
Cube 158 × 158 × 158
Cube 200 × 200 × 200 1.05
Cube 300 × 300 × 300 1.12
Cylinder 100 × 200 1.20
Cylinder 150 × 300 1.25
Cylinder 250 × 500 1.30
150 × 150 × 300 1.25
Prism 158 × 158 × 316
150 × 150 × 450 1.30
Prism 158 × 158 × 474
Prism 150 × 150 × 600 1.32
© 2009 by Taylor and Francis Group, LLC

Concrete Mix Design 175
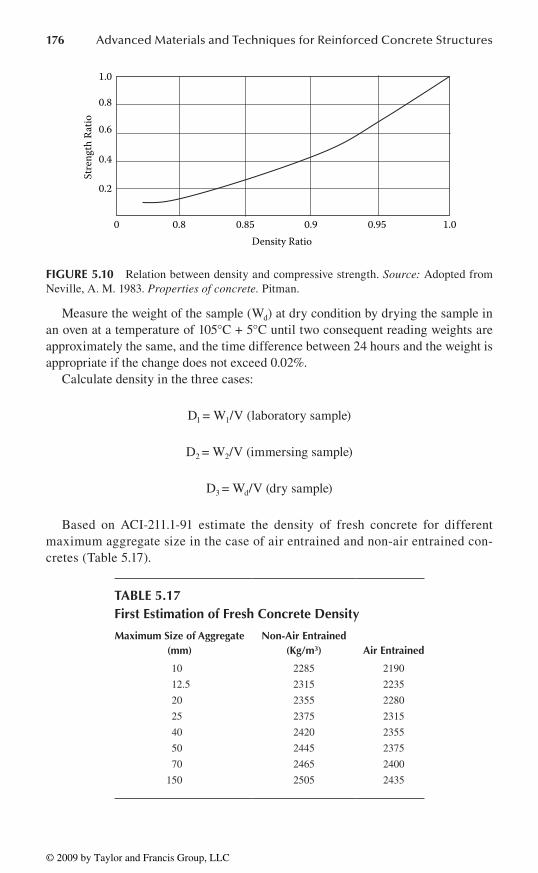
In some special structures the main factor in the structure is the concrete density and for a heavy concrete structure affected by floating force, producing dense con-crete is very critical. The relation between the density and compressive strength is shown in Figure 5.9.
Samples should be chosen so that the size is not less than 50 S3, where S is nomi-nal maximum aggregate size; sample size should not be less than 0.001 m3.
Often the sample is in the form of a cube or cylinder, for which volume (V) is accurately determined by the nearest millimeter dimensions.
The sample weight (w1) is taken upon arrival at the laboratory.Measure the weight of the sample after immersion in water at a temperature of
20°C + 2°C until the two consequent reading weights are approximately the same, and the time difference between 24 hours and the weight is appropriate if the change does not exceed 0.02% and the weight is W2.
fIguRe 5.8 Compressive strength and density machines test.
fIguRe 5.9 Vibration table.
© 2009 by Taylor and Francis Group, LLC
176 Advanced Materials and Techniques for Reinforced Concrete Structures
Measure the weight of the sample (Wd) at dry condition by drying the sample in an oven at a temperature of 105°C + 5°C until two consequent reading weights are approximately the same, and the time difference between 24 hours and the weight is appropriate if the change does not exceed 0.02%.
Calculate density in the three cases:
D1 = W1/V (laboratory sample)
D2 = W2/V (immersing sample)
D3 = Wd/V (dry sample)
Based on ACI-211.1-91 estimate the density of fresh concrete for different maximum aggregate size in the case of air entrained and non-air entrained con-cretes (Table 5.17).
0 0.8 0.85 0.9 0.95 1.0
0.2
0.4
0.6
0.8
1.0
Density Ratio
Stre
ngth
Rat
io
fIguRe 5.10 Relation between density and compressive strength. Source: Adopted from Neville, A. M. 1983. Properties of concrete. Pitman.
taBle 5.17first estimation of fresh concrete density
maximum size of aggregate (mm)
non-air entrained (Kg/m3) air entrained
10 2285 2190
12.5 2315 2235
20 2355 2280
25 2375 2315
40 2420 2355
50 2445 2375
70 2465 2400
150 2505 2435
© 2009 by Taylor and Francis Group, LLC
Concrete Mix Design 177
5.9 defIne settlement foR fResH concRete
The slump test is easy to carry out on concrete and gives good information on the concrete before casting; therefore, it is considered one of the key means to control the quality of concrete at the site. It is therefore widely used.
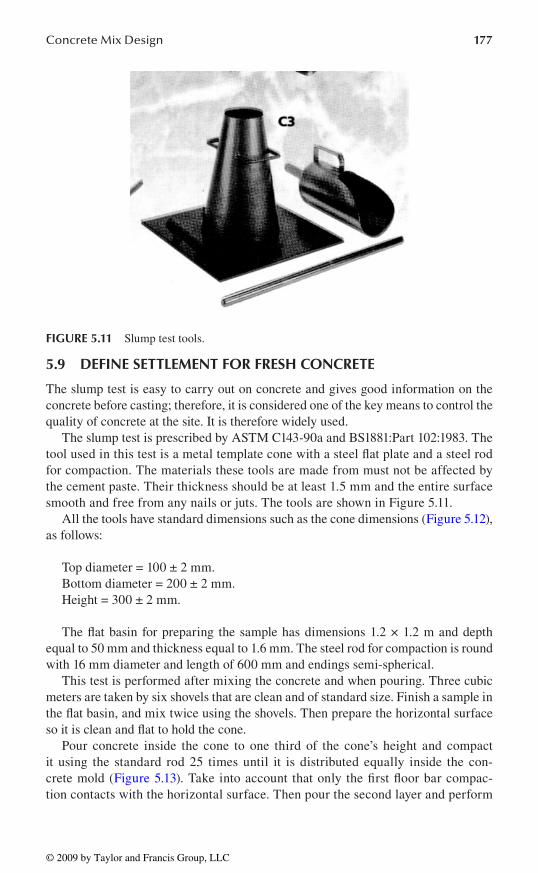
The slump test is prescribed by ASTM C143-90a and BS1881:Part 102:1983. The tool used in this test is a metal template cone with a steel flat plate and a steel rod for compaction. The materials these tools are made from must not be affected by the cement paste. Their thickness should be at least 1.5 mm and the entire surface smooth and free from any nails or juts. The tools are shown in Figure 5.11.
All the tools have standard dimensions such as the cone dimensions (Figure 5.12), as follows:
Top diameter = 100 ± 2 mm.Bottom diameter = 200 ± 2 mm.Height = 300 ± 2 mm.
The flat basin for preparing the sample has dimensions 1.2 × 1.2 m and depth equal to 50 mm and thickness equal to 1.6 mm. The steel rod for compaction is round with 16 mm diameter and length of 600 mm and endings semi-spherical.
This test is performed after mixing the concrete and when pouring. Three cubic meters are taken by six shovels that are clean and of standard size. Finish a sample in the flat basin, and mix twice using the shovels. Then prepare the horizontal surface so it is clean and flat to hold the cone.
Pour concrete inside the cone to one third of the cone’s height and compact it using the standard rod 25 times until it is distributed equally inside the con-crete mold (Figure 5.13). Take into account that only the first floor bar compac-tion contacts with the horizontal surface. Then pour the second layer and perform
fIguRe 5.11 Slump test tools.
© 2009 by Taylor and Francis Group, LLC

178 Advanced Materials and Techniques for Reinforced Concrete Structures
fIguRe 5.12 Slump cone dimensions.
100 ± 2 mm
200 ± 2 mm
300
± 2
mm
fIguRe 5.13 Pouring concrete in slump.
© 2009 by Taylor and Francis Group, LLC

Concrete Mix Design 179
compaction by the same way. Finally, pour the last third and perform compaction using the same precautions and the last surface will be finished by trolling.
Remove the mold vertically, slowly, and carefully after 5 to 10 seconds. Note that the entire process from the start of placing the concrete until full lifting of the tem-plate should require not more than about 150 seconds. If the collapse of the sample happens, repeat the test again.
Put the steel rod on the top horizontal to the converted cone and measure the settlement of the concrete, as shown in Figure 5.14, and compare to the project speci-fications. According to specifications set by the Egyptian code, allowable settle and allowable tolerance in the maximum allowable slump settlement must be stated in project specifications or defined as shown in Tables 5.18, 5.19 and 5.20.
The slump test is very useful on site for monitoring the concrete quality day by day and hour by hour due to variation in the materials fed into the mixer. Too much or too little slump gives immediate warning and enables the mixer operator to rem-edy the situation.
fIguRe 5.14 Measuring the slump settlement.
taBle 5.18Required slump Values for different concrete members
element typeslump (mm) type of compaction
Concrete blocks 0–25 Mechanical
Mechanical
Concrete foundation with light reinforcement and medium reinforcement and concrete section with light reinforcement
25–50 Mechanical
Concrete section with medium or high reinforcement 50–100 Manual
Concrete section with dense reinforcement 100–125 Light
Deep foundation and pumped concrete 125–200 Light
© 2009 by Taylor and Francis Group, LLC
180 Advanced Materials and Techniques for Reinforced Concrete Structures
5.10 deteRmInIng comPactIng factoR foR fResH concRete
The compacting factor test is described in BS1881:Part 103:1993 and in ACI 211.3-75 (revised 1987 and reapproved 1993).
This test will be done to determine a working compaction of concrete interopera-bility with a low or medium weight and will be applied to regular concrete manufac-tured with air entrained for aggregate with normal, light, or heavy weight. Therefore, any nominal maximum aggregate size is not larger than 40 mm and often this test is only performed in precast concrete or at large work sites.
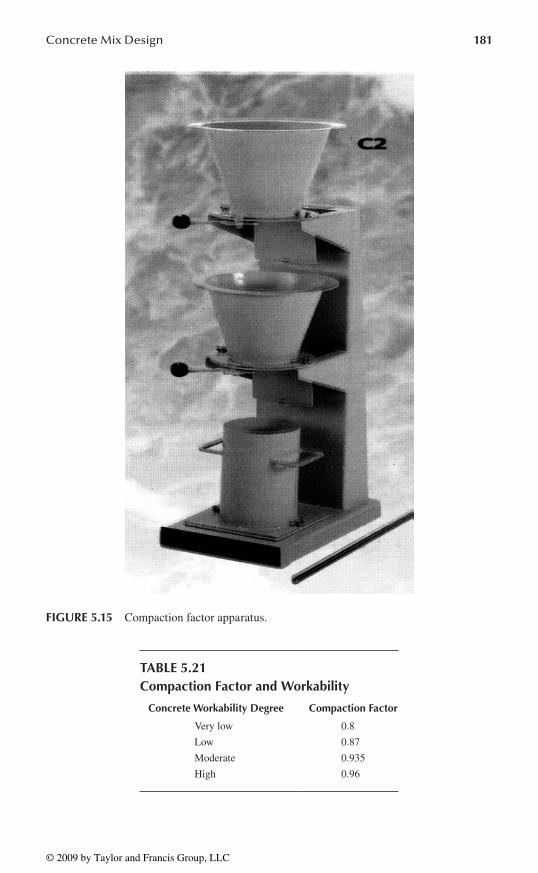
The apparatus is shown in Figure 5.15. It consists of two cones above a cylin-der fixed on a steel support. The dimensions of the cylinder, cone, and the distance between them are based on BS1881.
Gently place a sample of concrete in the upper cone to the level of the edge, then open the gate of the upper cone to let the concrete fall on the lower cone. Then open the gate of the lower cone to allow the concrete to fall down over the cylinder.
The ruler is measured in part by the weight of partially compacted concrete (W1) to the nearest 10 grams within 150 seconds of the start time of the test.
Then refill the cylinder with the same type of concrete to be fully compacted and weigh the concrete to be (W2) to the nearest 10 g. The workability of the concrete will be shown in Table 5.21.
Compaction factor = W1/W2
taBle 5.19allowable tolerance in defining maximum slump settlement
maximum amount of settlement (mm)
allowable tolerance (mm)
75 or less 35
>75 60
taBle 5.20allowable tolerance in defining Required slump settlement
Required settlement Value (mm)
allowable tolerance (mm)
50 or less ±10
50–100 ±20
>100 ±30
© 2009 by Taylor and Francis Group, LLC
Concrete Mix Design 181
fIguRe 5.15 Compaction factor apparatus.
taBle 5.21compaction factor and Workability
concrete Workability degree compaction factor
Very low 0.8
Low 0.87
Moderate 0.935
High 0.96
© 2009 by Taylor and Francis Group, LLC
182 Advanced Materials and Techniques for Reinforced Concrete Structures
5.11 HIgH PeRfoRmance concRete mIx
Based on ACI 211.4 (93), high-strength concrete has a specified compressive strength fc´ of 42 N/mm2 (6000 psi) or greater. This guide is intended to cover field strengths up to 84 N/mm2 (12,000 psi) as a practical working range, although greater strengths may be obtained. Recommendations are based on current practice and information from contractors, concrete suppliers, and engineers involved in projects dealing with high-strength concrete.
5.11.1 required StrengtH
ACI 318 allows concrete mixtures to be proportioned based on field experience or laboratory trial batches. To meet the specified strength requirements, the concrete must be proportioned in such a manner that the average compressive strength results of field tests exceed the specified design compressive strength fc´ by an amount sufficiently high to make the probability of low tests small. When the concrete pro-ducer chooses to select high-strength concrete mixture proportions based upon field experience, it is recommended that the required average strength fc´ used as the basis for selection of concrete proportions be taken as the larger value calculated from the following:
The average of all sets of three consecutive strength test results equals or •exceeds the required fc .́No individual strength test (average of two cylinders) falls below 0.90 fc .́ •Note that this different from the ACI 318 requirement.
The latter criterion differs from the 3.4 MPa (500 psi) under strength criterion in ACI 318, because a deficiency of 3.4 MPa (500 psi) may not be significant when high-strength concrete is used.
High-strength concretes may continue to gain significant strength after the accep-tance test especially if fly ash or ground granulated blast furnace slag is used.
Experience has shown that strength testing under ideal field conditions attains only 90% of the strength measured by tests performed under laboratory condi-tions. To assume that the average strength of field production concrete will equal the strength of a laboratory trial batch is not realistic, since many factors can influ-ence the variability of strengths and strength measurements in the field. Initial use of a high strength concrete mixture in the field may require some adjustments in proportions and proper selection of its components. Once sufficient data have been generated from the job, mixture proportions should be reevaluated using ACI 214 and adjusted accordingly.
For high-strength concrete or high performance concrete there are no standard or typical mix proportions so it is more beneficial to present results on several success-ful mixes as presented by Neville (1983) in Table 5.22. This table contains differ-ent high performance concrete mixing ratios for different countries. There are nine mixes: (A) and (D) are from the United States; (B), (C), (E), (F), and (I) are from Canada; (G) is from Morocco, and (H) is from France.
© 2009 by Taylor and Francis Group, LLC

Co
ncrete M
ix Design
183
taBle 5.22mix Proportions for some High Performance concrete
component (kg/m3)
mixture
a B c d e f g H I
Portland cement 534 500 315 513 163 228 425 450 460
Silica fume 40 30 36 43 54 46 40 45
Fly-ash 59 — — — — — — — —
GGBS — — 137 — 325 182 — — —
Fine aggregates 623 700 745 685 730 800 755 736 780
Coarse aggregates 1069 1100 1130 1080 1100 1110 1045 1118 1080
Total water 139 143 150 139 136 138 175a 143 138
w/c + b 0.22 0.27 0.31 0.25 0.25 0.30 0.38 0.29 0.30
Slump 255 — — — 200 220 230 230 110
cylinder strength (mPa)1 — — — — 13 19 — 35 36
2 — — — 65 — — — — —
7 — 67 91 72 62 — 68 —
28 — 93 83 119 114 105 95 111 83
56 124 — — — — — — —
91 — 107 93 145 126 121 105 — 89
365 — — — — 136 126 — — —
a It is suspected that the high water content was occasioned by a high ambient temperature in Morocco.
2009 by Taylor and Francis Group, LLC
184 Advanced Materials and Techniques for Reinforced Concrete Structures
5.12 PumPed concRete mIx
5.12.1 BaSic conSiderationS
Concrete pumping is so established in most areas that most ready-mixed concrete producers can supply a mixture that will pump readily if they are informed of the pump volume and pressure capability, pipeline diameter, and horizontal and vertical distance to be pumped.
The shape of the coarse aggregate, whether angular or rounded, has an influence on the required mixture proportions, although both shapes can be pumped satisfactorily.
The angular pieces have a greater surface area per unit volume as compared with rounded pieces and thus require more mortar to coat the surface for pump ability.
5.12.2 coarSe aggregate
The maximum size of angular or crushed coarse aggregate is limited to one third of the smallest inside diameter of the pump or pipeline. For well-rounded aggregate, the maximum size should be limited to two fifths of these diameters. The principles of proportioning are covered in ACI 211.1 and ACI 211.2.
Whereas the grading of sizes of coarse aggregate should meet the requirements of ASTM C33, it is important to recognize that the range between the upper and lower limits of this standard is broader than ACI 304 recommends for a pumpable concrete.
5.12.3 Fine aggregate
The properties of the fine aggregate have a much more prominent role in the propor-tioning of pumpable mixtures than do those of the coarse aggregate.
Together with the cement and water, the fine aggregate provides the mortar or fluid that conveys the coarse aggregates in suspension, thus rendering a mixture pumpable.
Particular attention should be given to those portions passing the finer screen sizes based on Anderson (1977). At least 15% to 30% should pass the no. 50 screen and 5% to 10% should pass the no. 100 screen. ACI 211.1 states that for more work-able concrete, which is sometimes required when placement is by pump, it may be desirable to reduce the estimated coarse aggregate content by up to 10% based on ACI 304R-30.
Exercise caution to ensure that the resulting slump, water-concrete mix-ture, and strength properties of the concrete meet applicable project specification requirements.
5.12.4 comBined normal weigHt aggregateS
The combined coarse and fine aggregates occupy about 67% to 77% of the mixture volume. For gradation purposes, the fine and coarse aggregates should be considered as one even though they are usually proportioned separately.
© 2009 by Taylor and Francis Group, LLC
Concrete Mix Design 185
ACI 304.2R includes an analysis worksheet for evaluating the pumpability of a concrete mixture by combining the fine and coarse aggregate with nominal max-imum-sized aggregate from 3/4 to 1-1/2 in (19 to 38 mm). The worksheet makes provision for additional coarse and fine aggregate that can be added to improve the overall gradation and recognizes possible overlap of some coarse and fine aggregate components. If a mixture is known to be pumpable it is evaluated and graphed first; the curve representing its proportions provides a useful reference for determining the pumpability of a questionable mixture.
Those pumps with powered valves exert higher pressure on the concrete, and the most gradual and smallest reduction from concrete tube diameter can pump the most difficult mixtures. Concrete containing lightweight fine and coarse aggregate can be pumped if the aggregate is properly saturated. You can refer to ACI 304.2R for more detailed information and procedures.
5.12.5 water
Water requirements and slump control for pumpable normal weight concrete mix-tures are interrelated and extremely important considerations. The amount of water used in a mixture will influence the strength and durability (for a given amount of cement) and will affect the slump or workability.
Mixing water requirements vary for different maximum sizes of aggregate as well as for different slumps. To establish the optimum slump resulting from water con-tent for a pump mixture and to maintain control of that particular slump through the course of a job are both extremely important factors. Slumps from 2 to 6 in (50 to 150 mm) are most suitable for pumping. In mixtures with higher slump, the coarse aggre-gate can separate from the mortar and paste and can cause pipeline blockage. Slumps obtained using superplasticizers, however, are usually pumped without difficulty.
There are several reasons why the slump of concrete can change between initial mixing and final placement. If the slump at the end of the discharge hose can be maintained within specification limitations, it may be satisfactory for the concrete to enter the pump at a higher slump to compensate for slump loss, if the change is due simply to aggregate absorption.
5.12.6 cementitiouS materialS
The determination of the cementitious materials content follows the same basic prin-ciples used for any concrete. In establishing the cement content, remember the need for over-strength proportioning in the laboratory to allow for field variations. The use of extra quantities of cementitious materials as the only means to correct pump-ing difficulties is shortsighted and uneconomical. Correcting any deficiencies in the aggregate gradation is more important.
5.12.7 admixtureS
Any admixture that increases workability in both normal and lightweight concretes will usually improve pumpability. Admixtures used to improve pumpability include
© 2009 by Taylor and Francis Group, LLC

186 Advanced Materials and Techniques for Reinforced Concrete Structures
regular and high-range, water-reducing admixtures, air-entraining admixtures, and finely divided mineral admixtures.
Increased awareness of the need to incorporate entrained air in concrete to mini-mize freezing and thawing damage to structures has coincided with increased use of concrete pumps, as well as the development of longer placement booms. Considerable research and testing has established that the effectiveness of the air-entraining agent (AEA) in producing a beneficial air-void system depends on many factors. The more important factors are:
The compatibility of the AEA and other admixtures and the order in which •they are introduced into the batchThe mixture proportions and aggregate gradation•Mixing equipment and procedures•Mixture temperatures•Slump•
AEA effectiveness and the resulting dosage depend on the cement fineness, cement factor, and water content, and the chemistry of cement and water, as well as that of other chemical and mineral admixtures used in the concrete. Refer to ACI 304.2R for more detailed information on air content and admixtures.
5.12.8 Field Practice
It is essential to perform preplanning for concrete pumping for successful place-ments, with increasing detail and coordination required as the size of the placement and the project increases.
This planning should provide for the correct amount and type of concrete for the pump used, provision for necessary pipeline, and agreement as to which personnel will provide the labor necessary to the complete placement operation.
Any trailer- or truck-mounted concrete pump can be used for pipeline concrete placement. The limiting factor in this method is the ability to spread the concrete as needed at the end of the pipeline. Generally, this is done by laborers using a rubber hose at the end of a rigid placement line.
The discharge of powered placement booms can be positioned at almost any point within the radius of the boom and at elevations achieved with the boom from near vertical (up or down) to horizontal. Boom use generally reduces the number of work-ers required for a given placement.
5.12.9 Field control
Pumped concrete does not require any compromise in quality. A high level of quality control, however, should be maintained to ensure uniformity.
Concrete has been pumped successfully during both hot and cold weather. Precautions may be necessary to provide adequate protection during extreme conditions.
The concrete to be pumped must be well mixed before feeding it into the pump. Slump between 50 to 150 mm is generally recommended.
© 2009 by Taylor and Francis Group, LLC

Concrete Mix Design 187
ACI 304.2R-91 recommends aggregate grading or pumping concrete as outlined in Table 5.23.
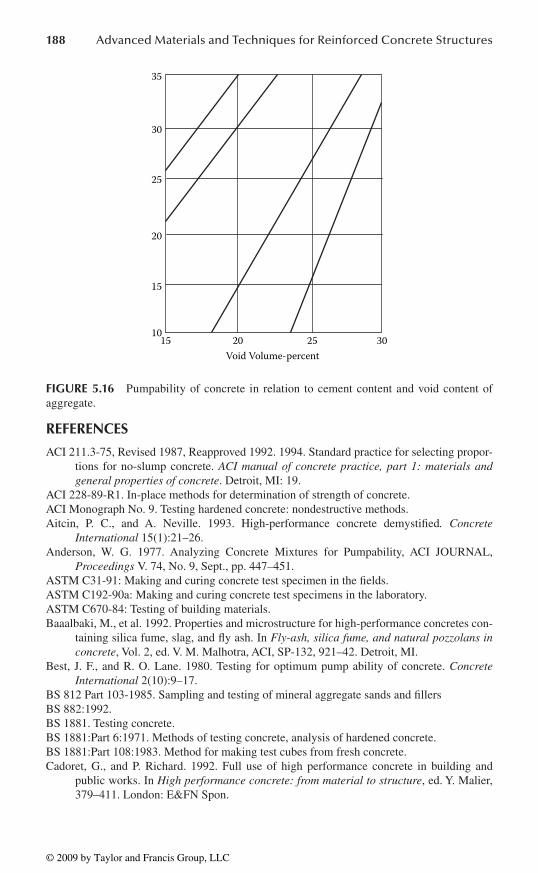
The research of Johansson and Tuutti in 1976 about pumping concrete revealed that the relation between the cement content and the void content determines suit-ability for pumping.
Generally, any mix selection of concrete to be pumped must be subjected to a test. Although laboratory pumps have been used to predict the pumpability of concrete, the performance of any given mix and the distance through which the concrete is to be pumped must be considered.
Figure 5.16 shows the relation between cement content and aggregate void content and effects of excessive frictional resistance on segregation and bleeding.
taBle 5.23Recommended aggregate grading
size (mm)
cumulative Percentage Passing
max. size 25 mm max. size 20 mm
25 100 —
20 80–88 100
13 64–75 75–82
9.50 55–70 61–72
4.75 40–58 40–58
2.36 28–47 28–47
1.18 18–35 18–35
0.6 12–25 12–25
0.3 7–14 7–14
0.15 3–8 3–8
0.075 0 0
© 2009 by Taylor and Francis Group, LLC
188 Advanced Materials and Techniques for Reinforced Concrete Structures
RefeRences
ACI 211.3-75, Revised 1987, Reapproved 1992. 1994. Standard practice for selecting propor-tions for no-slump concrete. ACI manual of concrete practice, part 1: materials and general properties of concrete. Detroit, MI: 19.
ACI 228-89-R1. In-place methods for determination of strength of concrete.ACI Monograph No. 9. Testing hardened concrete: nondestructive methods.Aitcin, P. C., and A. Neville. 1993. High-performance concrete demystified. Concrete
International 15(1):21–26.Anderson, W. G. 1977. Analyzing Concrete Mixtures for Pumpability, ACI JOURNAL,
Proceedings V. 74, No. 9, Sept., pp. 447–451.ASTM C31-91: Making and curing concrete test specimen in the fields.ASTM C192-90a: Making and curing concrete test specimens in the laboratory.ASTM C670-84: Testing of building materials.Baaalbaki, M., et al. 1992. Properties and microstructure for high-performance concretes con-
taining silica fume, slag, and fly ash. In Fly-ash, silica fume, and natural pozzolans in concrete, Vol. 2, ed. V. M. Malhotra, ACI, SP-132, 921–42. Detroit, MI.
Best, J. F., and R. O. Lane. 1980. Testing for optimum pump ability of concrete. Concrete International 2(10):9–17.
BS 812 Part 103-1985. Sampling and testing of mineral aggregate sands and fillersBS 882:1992.BS 1881. Testing concrete.BS 1881:Part 6:1971. Methods of testing concrete, analysis of hardened concrete.BS 1881:Part 108:1983. Method for making test cubes from fresh concrete.Cadoret, G., and P. Richard. 1992. Full use of high performance concrete in building and
public works. In High performance concrete: from material to structure, ed. Y. Malier, 379–411. London: E&FN Spon.
2520 301510
15
20
25
30
35
Void Volume-percent
fIguRe 5.16 Pumpability of concrete in relation to cement content and void content of aggregate.
© 2009 by Taylor and Francis Group, LLC
Concrete Mix Design 189
Causse, G., and S. Montents. 1992. The Roize Bridge. In High performance concrete: from material to structure, ed. Y. Malier, 525–36. London: E&FN Spon.
Johansson, A., and K. Tuutti. 1976. Pumped concrete and pumping of concrete, CBI research reports. Swedish Cement and Concrete Research Institute. 10:76.
Lessard, M., et al. 1994. High-performance concrete speeds reconstruction at McDonald’s. Concrete International 16(9):47–50.
Neville, A. M. 1983. Properties of concrete. Pitman.Part 5: Methods for testing hardened concrete for other than strength.
© 2009 by Taylor and Francis Group, LLC
Related Documents