PHARMSTANDARD – LEADING RUSSIAN PHARMACEUTICAL COMPANY 4Q/FY 2013 Sales Results Presentation OTCPharm Introduction Igor Krylov Olga Mednikova 1 Conference call: 4Q/FY 2013 Sales Results (18.02.14)

Welcome message from author
This document is posted to help you gain knowledge. Please leave a comment to let me know what you think about it! Share it to your friends and learn new things together.
Transcript
PHARMSTANDARD – LEADING RUSSIAN PHARMACEUTICAL COMPANY
4Q/FY 2013 Sales Results Presentation
OTCPharm Introduction
Igor Krylov
Olga Mednikova
1Conference call: 4Q/FY 2013 Sales Results (18.02.14)
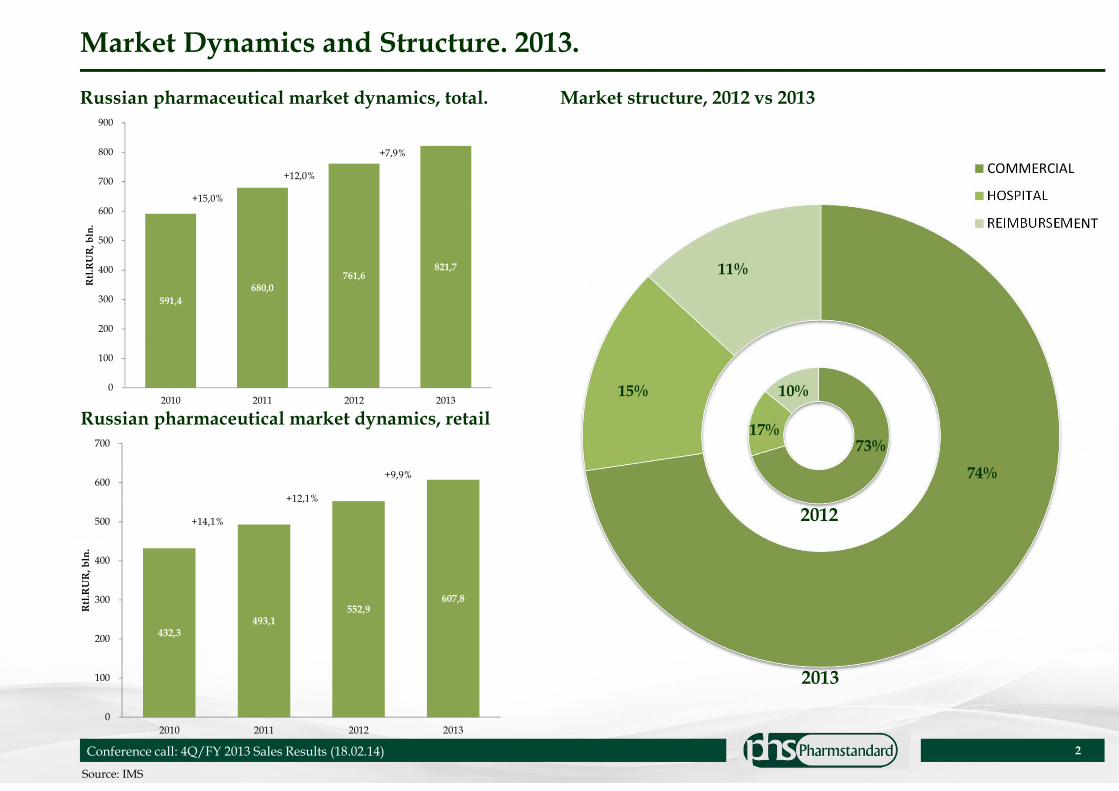
Market Dynamics and Structure. 2013.
2
Market structure, 2012 vs 2013
COMMERCIAL
HOSPITAL
REIMBURSEMENT
2012
2013
73%17%
10%
74%
15%
11%
Russian pharmaceutical market dynamics, total.
Russian pharmaceutical market dynamics, retail
Source: IMS
Conference call: 4Q/FY 2013 Sales Results (18.02.14)
591,4
680,0 761,6
821,7
+15,0%
+12,0%
+7,9%
0
100
200
300
400
500
600
700
800
900
2010 2011 2012 2013
Rtl
.RU
R, b
ln.
432,3 493,1
552,9 607,8
+14,1%
+12,1%
+9,9%
0
100
200
300
400
500
600
700
2010 2011 2012 2013
Rtl
.RU
R, b
ln.

Leading Pharmaceutical company in Russia
The only Russian pharmaceutical company among the top-10 largest players, one of the market leaders
3
Russian Pharmaceutical Market – Total (2013)
Source:IMS
2,7%
2,7%
2,8%
2,8%
2,9%
2,9%
3,2%
3,4%
3,7%
5,3%
JOHNSON & JOHNSON
SANDOZ GROUP
SERVIER
NOVARTIS
NYCOMED/TAKEDA
ROCHE
TEVA
BAYER HEALTHCARE
PHARMSTANDARD
SANOFI-AVENTIS

# 1 Local Company and a leader in retail segment with significant market shares on the Russian market
4
Russian Pharmaceutical Market – Local (2013)
Leading Pharmaceutical company in Russia (continued)
Source:IMS
Russian Pharmaceutical Market – Retail (2013)
SANOFI-AVENTIS5,1%
PHARMSTANDARD4,3%
BAYER HEALTHCARE4,0%
SANDOZ GROUP3,5%
SERVIER3,4%
NYCOMED/TAKEDA3,3%
MENARINI3,0%
TEVA3,0%
NOVARTIS2,9%
ABBOTT2,5%
Other (1790 comp)65,1%
PHARMSTANDARD4,3%PHARMSTANDARD
15,8%
STADA5,4%
VALENTA3,8%
EVALAR3,5%
MATERIA MEDICA2,9%
MICROGEN2,8%
VEROPHARM2,7%
OZON OOO2,6%
AKRIKHIN-PHARMA2,5%
NIARMEDIK PLUS RF2,1%
Other (1790 comp)55,9%
PHARMSTANDARD15,8%
5
Source: Company data
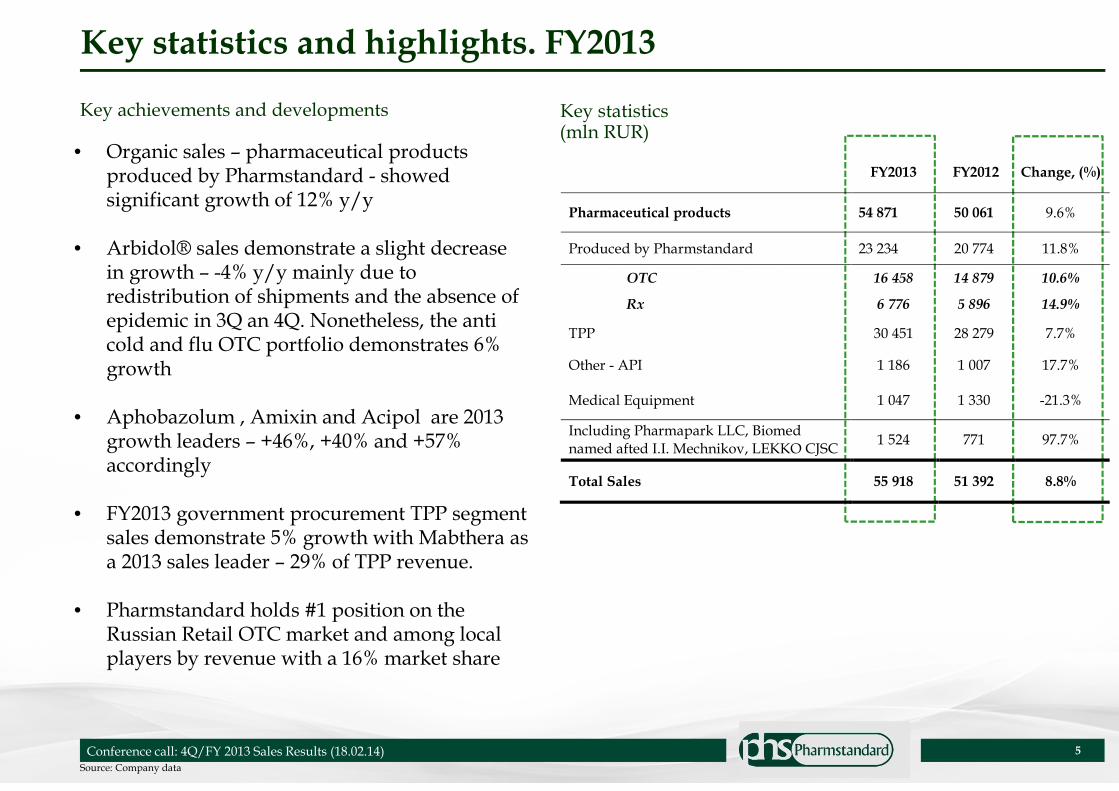
Key statistics and highlights. FY2013
Key statistics(mln RUR)
Key achievements and developments
• Organic sales – pharmaceutical products produced by Pharmstandard - showed significant growth of 12% y/y
• Arbidol® sales demonstrate a slight decrease in growth – -4% y/y mainly due to redistribution of shipments and the absence of epidemic in 3Q an 4Q. Nonetheless, the anti cold and flu OTC portfolio demonstrates 6% growth
• Aphobazolum , Amixin and Acipol are 2013 growth leaders – +46%, +40% and +57% accordingly
• FY2013 government procurement TPP segment sales demonstrate 5% growth with Mabthera as a 2013 sales leader – 29% of TPP revenue.
• Pharmstandard holds #1 position on the Russian Retail OTC market and among local players by revenue with a 16% market share
Conference call: 4Q/FY 2013 Sales Results (18.02.14)
FY2013 FY2012 Change, (%)
Pharmaceutical products 54 871 50 061 9.6%
Produced by Pharmstandard 23 234 20 774 11.8%
OTC 16 458 14 879 10.6%
Rx 6 776 5 896 14.9%
TPP 30 451 28 279 7.7%
Other - API 1 186 1 007 17.7%
Medical Equipment 1 047 1 330 -21.3%
Including Pharmapark LLC, Biomed named afted I.I. Mechnikov, LEKKO CJSC
1 524 771 97.7%
Total Sales 55 918 51 392 8.8%

Brand Therapeutic segment
FY2013 sales
FY2012 sales
Sales growth
% growth
OTC
Afobazol ® Tranquillizer 1 273 872 401 46,0%
Amixin ® Anti-viral 1 106 792 315 39,8%
Acipol® Anti-fungal 612 390 222 56,8%
Ingalypt ® Anti-viral 488 329 160 48,5%
Magnelis® Vitamins 322 196 126 64,3%
Next® Analgesics 169 46 123 270,2%
Noopept® Tranquillizer 130 15 115 794,9%
Rx
Phosphogliv Insulin 1 373 1 162 211 18,2%
Combilipen Vitamin B1 688 534 153 28,7%
Pentalgin Anti-viral 324 213 111 52,3%
Formetine Diabetes 227 125 102 81,8%
Altevir Interferon alfa-2b 165 68 96 140,8%
Artrosan Analgesics 215 137 78 57,4%
6
Source: Company data
Top Pharmaceutical Product Drivers, FY2013
ОТС FY2013 sales in went up to RUR16 458m (+11%).
Rx FY2013 sales demonstrated 15% growth and reached RUR6 776m. Key growth drivers were Phosphogliv, Combilipenand Pentalgin.
Conference call: 4Q/FY 2013 Sales Results (18.02.14)
7
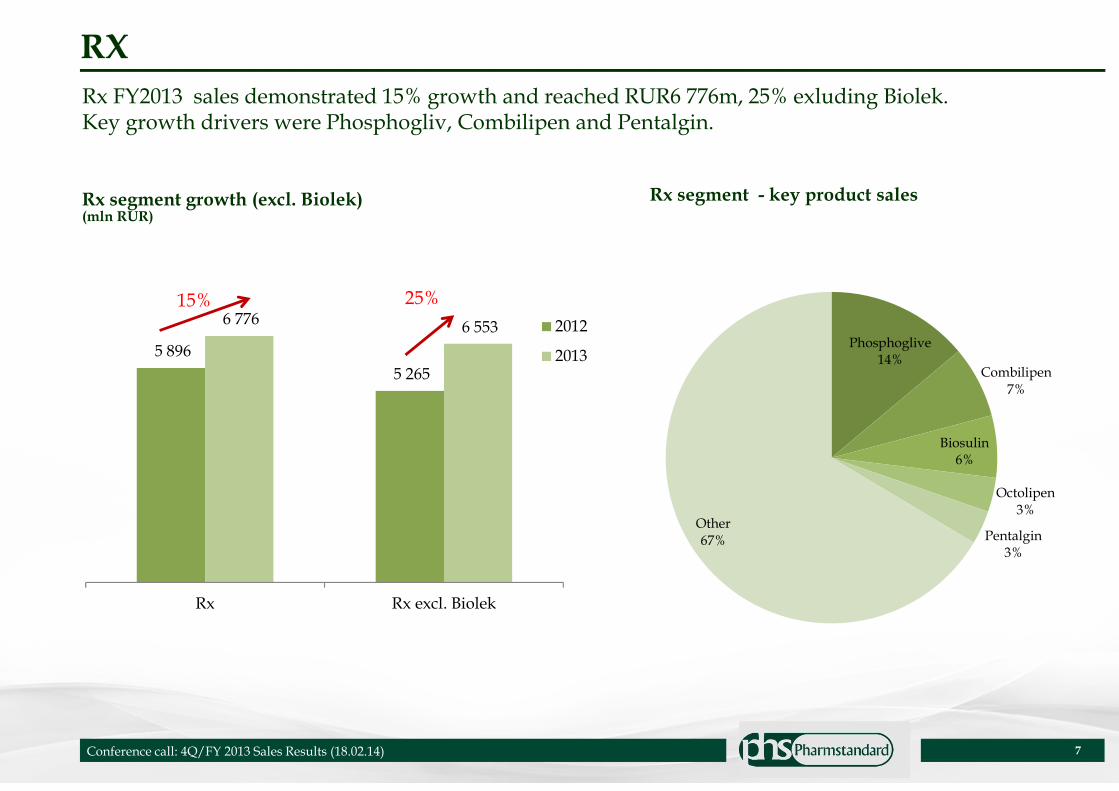
RX
Conference call: 4Q/FY 2013 Sales Results (18.02.14)
Rx FY2013 sales demonstrated 15% growth and reached RUR6 776m, 25% exluding Biolek.Key growth drivers were Phosphogliv, Combilipen and Pentalgin.
Rx segment growth (excl. Biolek)(mln RUR)
5 896
5 265
6 776 6 553
Rx Rx excl. Biolek
2012
2013
15% 25%
Phosphoglive14%
Combilipen7%
Biosulin6%
Octolipen3%
Pentalgin3%
Other67%
Rx segment - key product sales

Third Party Products. Close-up.
2012 2013
9
Source: Company data
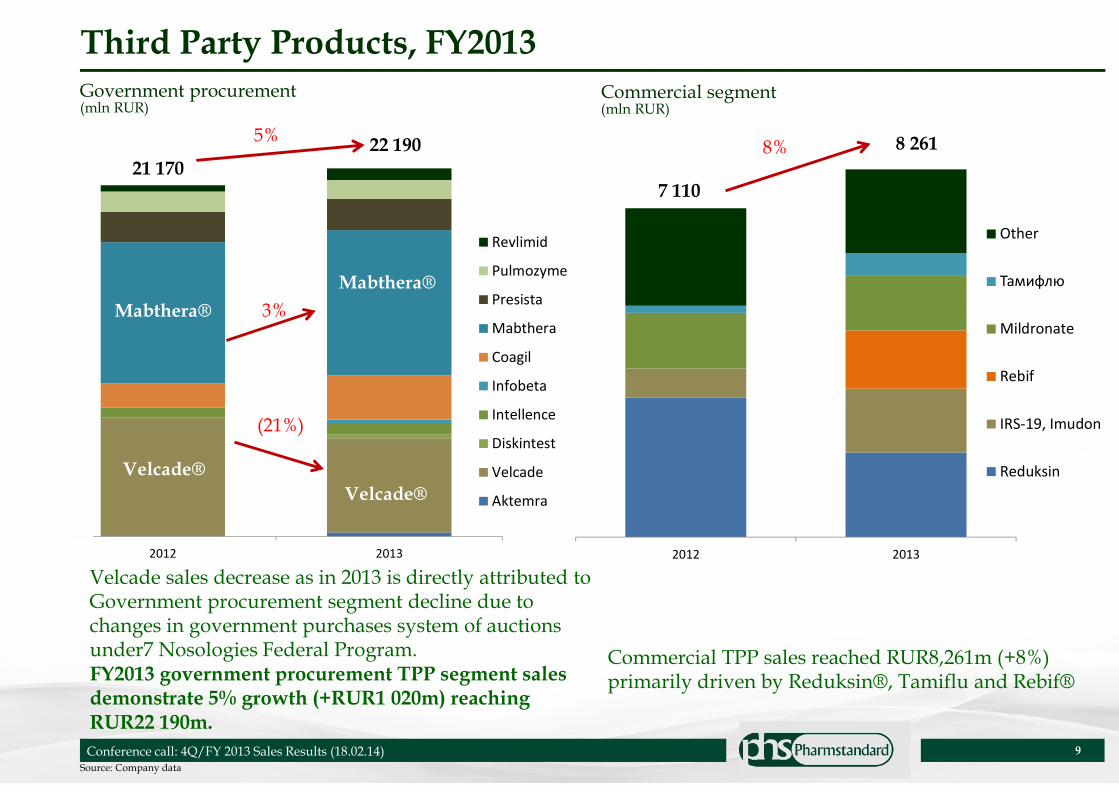
Third Party Products, FY2013
Government procurement(mln RUR)
Commercial segment (mln RUR)
Commercial TPP sales reached RUR8,261m (+8%)primarily driven by Reduksin®, Tamiflu and Rebif®
Velcade sales decrease as in 2013 is directly attributed toGovernment procurement segment decline due tochanges in government purchases system of auctionsunder7 Nosologies Federal Program.FY2013 government procurement TPP segment salesdemonstrate 5% growth (+RUR1 020m) reachingRUR22 190m.
8%
7 110
Conference call: 4Q/FY 2013 Sales Results (18.02.14)
Revlimid
Pulmozyme
Presista
Mabthera
Coagil
Infobeta
Intellence
Diskintest
Velcade
Aktemra
2012 2013
(21%)
22 190
21 170
Velcade®
Mabthera®
Mabthera®
Velcade®
5%
3%
Other
Тамифлю
Mildronate
Rebif
IRS-19, Imudon
Reduksin
8 261
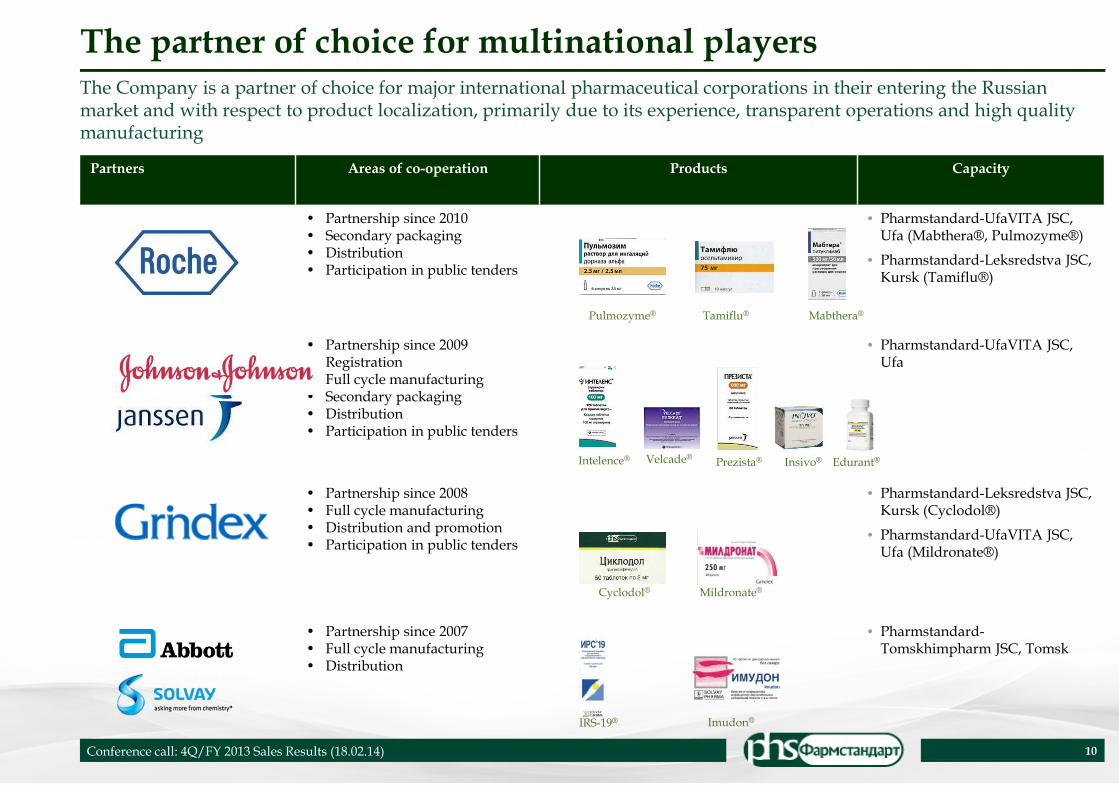
The partner of choice for multinational players
10
The Company is a partner of choice for major international pharmaceutical corporations in their entering the Russian market and with respect to product localization, primarily due to its experience, transparent operations and high quality manufacturing
Partners Areas of co-operation Products Capacity
• Partnership since 2010• Secondary packaging• Distribution• Participation in public tenders
• Pharmstandard-UfaVITA JSC, Ufa (Mabthera®, Pulmozyme®)
• Pharmstandard-Leksredstva JSC,Kursk (Tamiflu®)
• Partnership since 2009• Registration• Full cycle manufacturing• Secondary packaging• Distribution• Participation in public tenders
• Pharmstandard-UfaVITA JSC, Ufa
• Partnership since 2008• Full cycle manufacturing• Distribution and promotion• Participation in public tenders
• Pharmstandard-Leksredstva JSC, Kursk (Cyclodol®)
• Pharmstandard-UfaVITA JSC, Ufa (Mildronate®)
• Partnership since 2007• Full cycle manufacturing• Distribution
• Pharmstandard-Tomskhimpharm JSC, Tomsk
Pulmozyme® Tamiflu® Mabthera®
Intelence® Velcade® Prezista®
Cyclodol® Mildronate®
IRS-19® Imudon®
Insivo® Edurant®
Conference call: 4Q/FY 2013 Sales Results (18.02.14)

11
FY2013 Sales Structure
Pharmaceutical products
98.1%
OTC 70.8%
TPP
54.4%
Rx29.2%
Medical equipment
1.9%
Organic sales
41.5%
API
2.1%
Therapeutic focus:• Analgesics• Cough & cold • Vitamins • Anti-viral • Anti-fungal
Product portfolio includes:• Coronary Therapy• Acid pump inhibitors• Nitrites & nitrates• ACE inhibitors• Alimentary tract
metabolism
Product portfolio includes:• Mabtera®• Velcade®• Pulmozyme®• IRS-19® & Imudon®• Coagil VII• Presista®• Mildronate®• Other
Conference call: 4Q/FY 2013 Sales Results (18.02.14)
OTCPharm. Introduction.
Olga Mednikova

Overview of Branded OTC Spin-Off Structure
13
Current Structure
Pharmaceutical Products
Medical Equipment
Other
Rx OTCActive
PharmaceuticalIngredients
Third Party Products
Branded OTCNon-branded
OTC
Own Products
OTCPharm
Branded OTC Post Spin-Off
• 27 brands / 114 SKUs
• Key therapeutic categories
– Anti-cold and flu
– Non-narcotics and antipyretics
– Multivitamins with minerals
• 2012 sales volume: 153m packs
• 2012 net revenue: RUR12.7bn
• 2012 operating income: RUR4.5bn
• Supported by fully fledged marketing
Infrastructure
• Contract manufacturing with Pharmstandard
• Other contracts as necessary for operations
• FY2013 sales demonstrated 11% growth and
reached RUR14 bn y/y
2012 net revenue: RUR51.4bn2012 EBITDA: RUR13.5bn
25% of Pharmstandard 2012 net revenue
33% of Pharmstandard 2012 profitability
2012 net revenue: RUR50.1bn
2012 EBITDA: RUR13.2bn
2012 net revenue: RUR12.7bn
2012 EBITDA:RUR4.5bn
Conference call: 4Q/FY 2013 Sales Results (18.02.14)
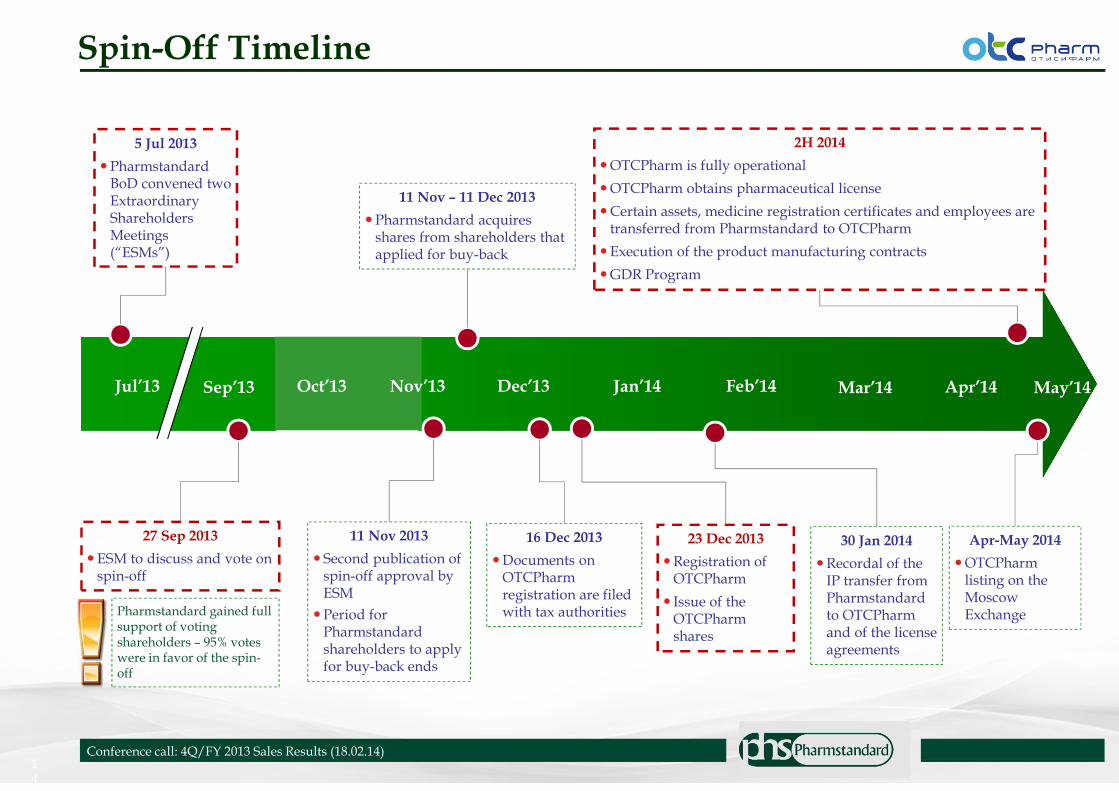
Spin-Off Timeline
14
27 Sep 2013
�ESM to discuss and vote on spin-off
Jul’13 Dec’13 Jan’14 Feb’14
11 Nov 2013
� Second publication of spin-off approval by ESM
�Period for Pharmstandard shareholders to apply for buy-back ends
11 Nov – 11 Dec 2013
�Pharmstandard acquires shares from shareholders that applied for buy-back
16 Dec 2013
�Documents on OTCPharmregistration are filed with tax authorities
23 Dec 2013
�Registration of OTCPharm
� Issue of the OTCPharmshares
30 Jan 2014
�Recordal of the IP transfer from Pharmstandard to OTCPharmand of the license agreements
2H 2014
�OTCPharm is fully operational
�OTCPharm obtains pharmaceutical license
�Certain assets, medicine registration certificates and employees are transferred from Pharmstandard to OTCPharm
�Execution of the product manufacturing contracts
�GDR Program
Sep’13
5 Jul 2013
�Pharmstandard BoD convened two Extraordinary Shareholders Meetings (“ESMs”)
Pharmstandard gained full support of voting shareholders – 95% votes were in favor of the spin-off
Conference call: 4Q/FY 2013 Sales Results (18.02.14)
Oct’13 Nov’13 Mar’14 Apr’14
Apr-May 2014
�OTCPharmlisting on the Moscow Exchange
May’14
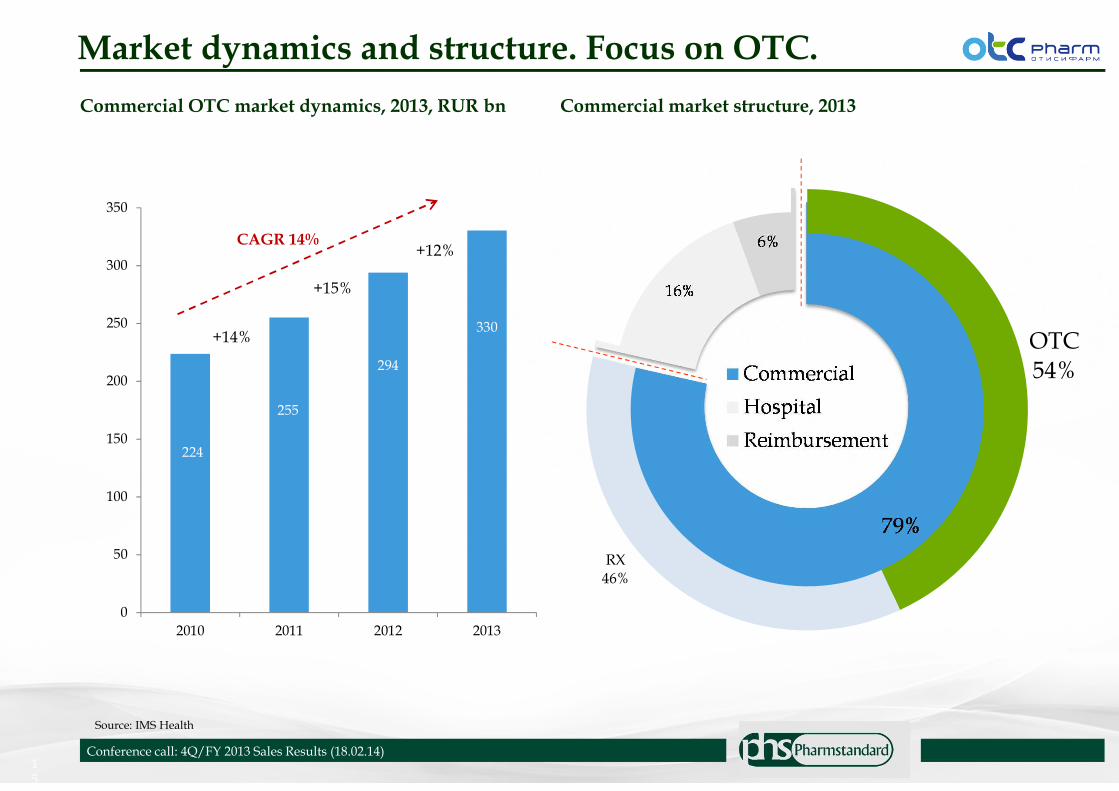
OTC54%
RX46%
Market dynamics and structure. Focus on OTC.
15
Commercial market structure, 2013
Conference call: 4Q/FY 2013 Sales Results (18.02.14)
224
255
294
330
0
50
100
150
200
250
300
350
2010 2011 2012 2013
Commercial OTC market dynamics, 2013, RUR bn
+14%
+15%
+12%CAGR 14%
Source: IMS Health
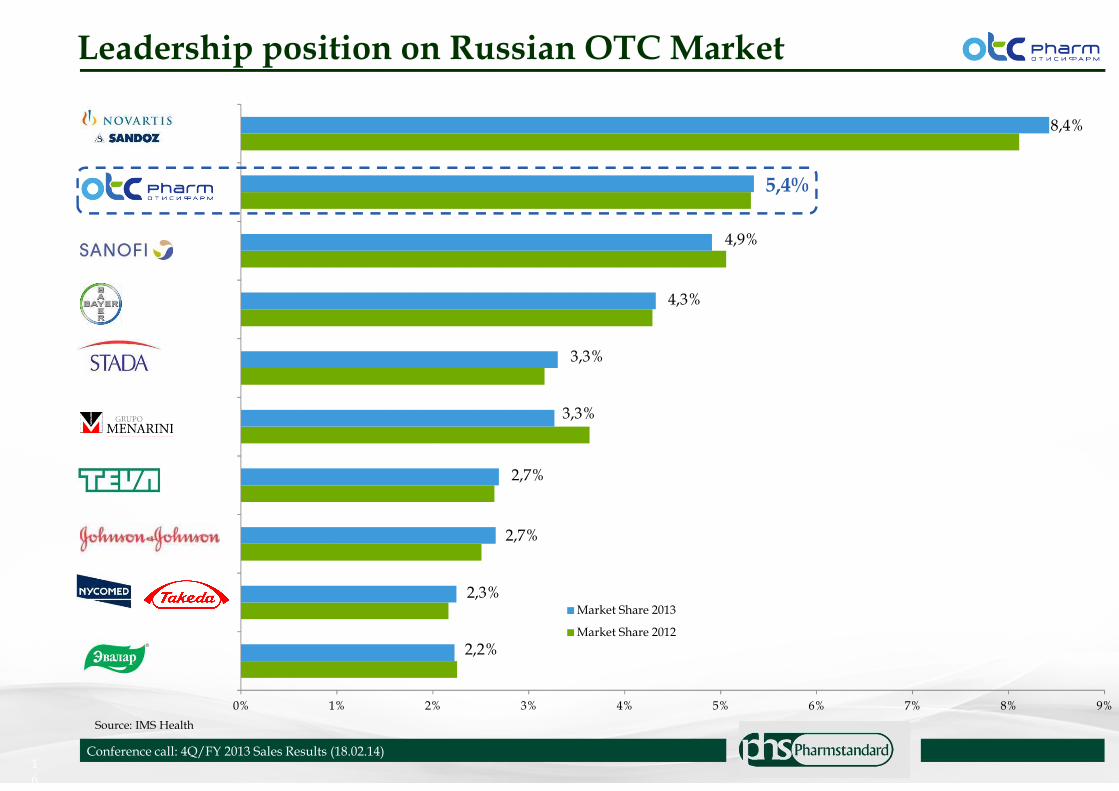
0% 1% 2% 3% 4% 5% 6% 7% 8% 9%
EVALAR
NYCOMED/TAKEDA
JOHNSON & JOHNSON*
TEVA*
MENARINI
STADA*
BAYER HEALTHCARE
SANOFI-AVENTIS
OTCPHARM
NOVARTIS/SANDOZ GROUP
Market Share 2013
Market Share 2012
Leadership position on Russian OTC Market
16
Conference call: 4Q/FY 2013 Sales Results (18.02.14)
8,4%
5,4%
4,9%
4,3%
3,3%
3,3%
2,7%
2,7%
2,3%
2,2%
Source: IMS Health
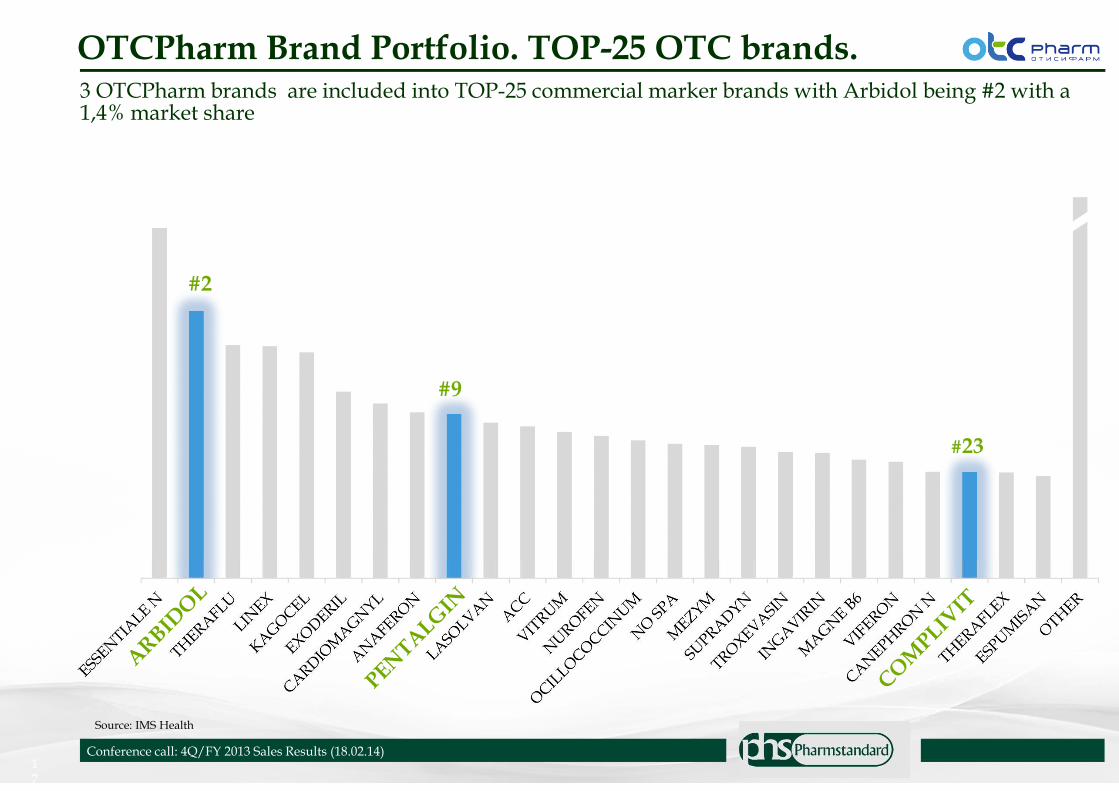
OTCPharm Brand Portfolio. TOP-25 OTC brands.
17
Conference call: 4Q/FY 2013 Sales Results (18.02.14)
#2
#9
#23
3 OTCPharm brands are included into TOP-25 commercial marker brands with Arbidol being #2 with a 1,4% market share
Source: IMS Health
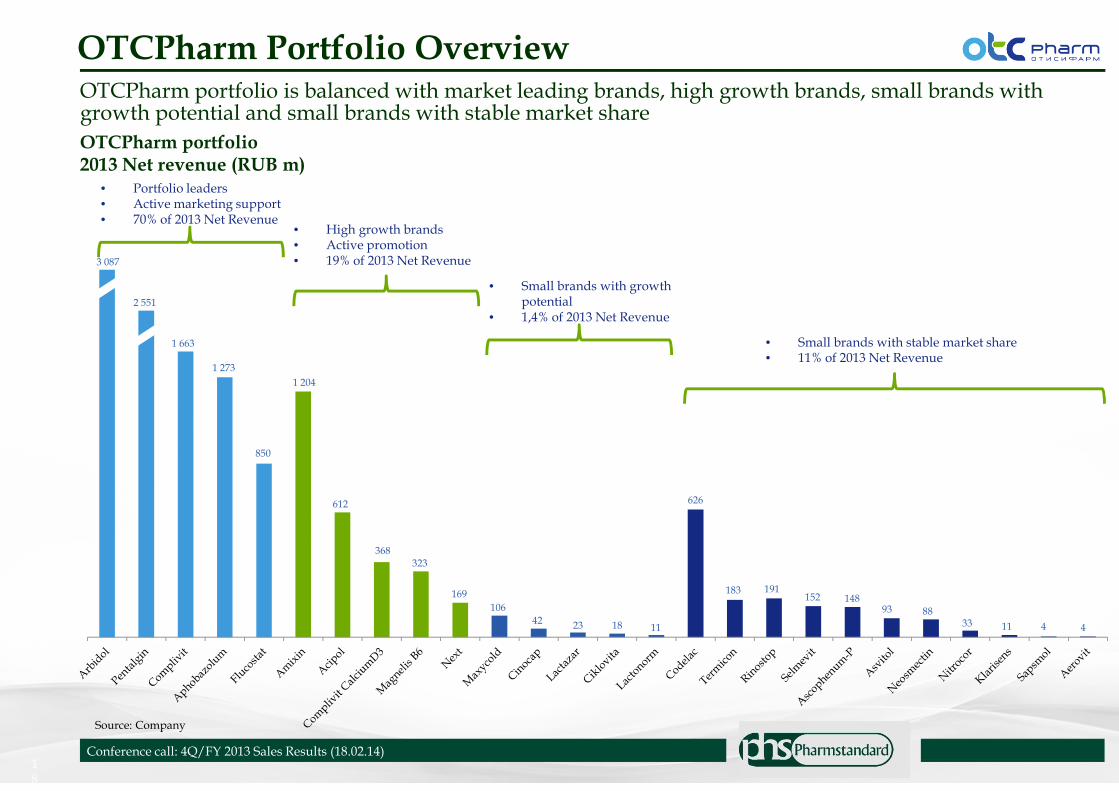
OTCPharm Portfolio Overview
18
Conference call: 4Q/FY 2013 Sales Results (18.02.14)
Source: Company
OTCPharm portfolio is balanced with market leading brands, high growth brands, small brands with growth potential and small brands with stable market share
OTCPharm portfolio2013 Net revenue (RUB m)
• Portfolio leaders• Active marketing support• 70% of 2013 Net Revenue
• High growth brands• Active promotion• 19% of 2013 Net Revenue
• Small brands with growth potential
• 1,4% of 2013 Net Revenue
• Small brands with stable market share• 11% of 2013 Net Revenue
3 087
2 551
1 663
1 273
850
1 204
612
368323
169
106
42 23 18 11
626
183 191152 148
93 8833 11 4 4
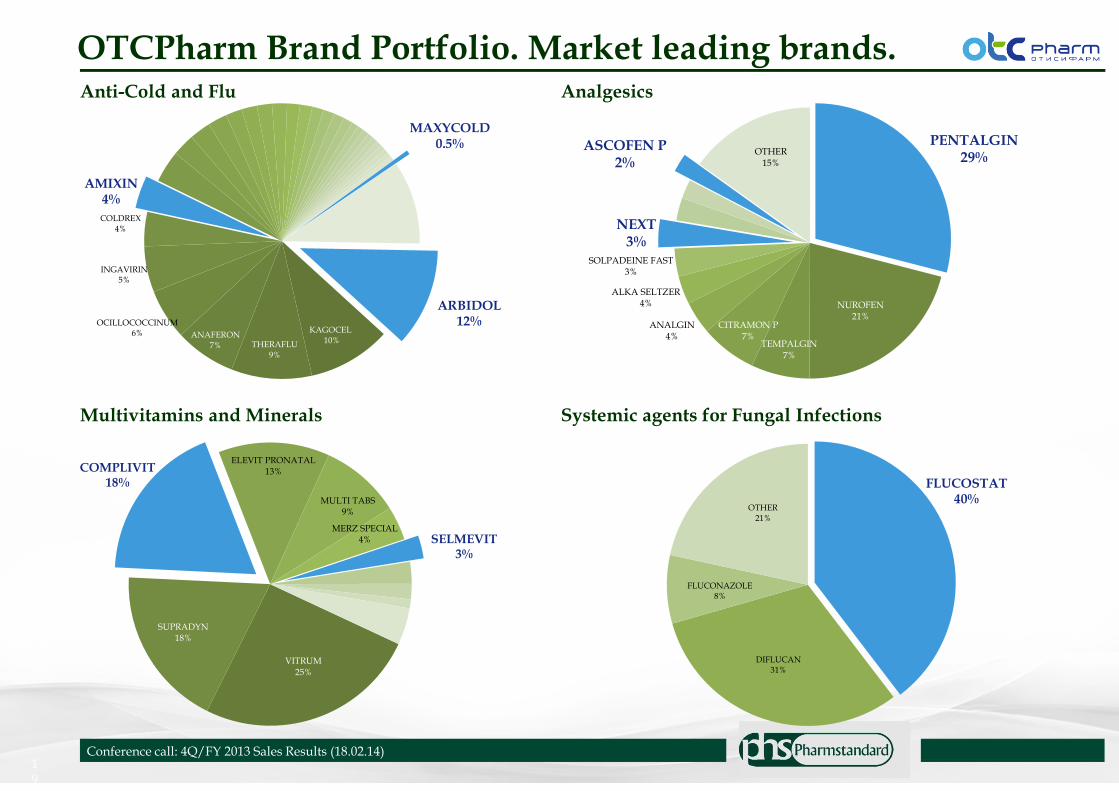
OTCPharm Brand Portfolio. Market leading brands.
19
Conference call: 4Q/FY 2013 Sales Results (18.02.14)
Anti-Cold and Flu Analgesics
Multivitamins and Minerals Systemic agents for Fungal Infections
ARBIDOL 12%
KAGOCEL10%THERAFLU
9%
ANAFERON7%
OCILLOCOCCINUM6%
INGAVIRIN5%
COLDREX4%
AMIXIN4%
MAXYCOLD0.5%
VITRUM
25%
SUPRADYN18%
COMPLIVIT18%
ELEVIT PRONATAL13%
MULTI TABS9%
MERZ SPECIAL4% SELMEVIT
3%
PENTALGIN29%
NUROFEN21%
TEMPALGIN7%
CITRAMON P7%
ANALGIN4%
ALKA SELTZER4%
SOLPADEINE FAST3%
NEXT3%
ASCOFEN P2%
OTHER15%
FLUCOSTAT40%
DIFLUCAN31%
FLUCONAZOLE8%
OTHER21%

CALCIUM D3NYCOMED
CALCEMIN COMPLIVITCALC.D3
2012
2013
+8%
COMPLIVITCALCIUM D3
MAGNE B6 MAGNEROT MAGNELIS B6
2012
2013
+31%
MAGNELIS B6
OTCPharm Brand Portfolio. High growth brands.
20
Conference call: 4Q/FY 2013 Sales Results (18.02.14)
Antidiarrheal microorganisms
Multivitamins and MineralsTranquillisers, Hypnotic/Sedatives
Mineral Supplements
Source: IMS Health
APHOBAZOL CORVALOL NOVO PASSIT PERSEN VALOCORDIN
2012
2013+31%
APHOBAZOLUM
2012
2013
LINEX BIFIFORM HYLAK FORTE ACIPOL BIFIDUMBACTERIN
2012
2013
+32%
ACIPOL
2012
2013
Category growth – 8%
Category growth – 9% Category growth – 16%
Category growth – 5%

OTCPharm FY 2013 revenue breakdown
21
Arbidol3 807
Pentalgin2 251
Complivit1 663
Aphobazolum1 273
Amixin1 204
Flucostat850
Codelac 626
Acipol 612
Magnelis B6 323 Rinostop 191
TOP-10 largest OTCPharm products comprise 91% of 2013 Net Revenue
TOP-10RUR12.8bn
OTHERRUR1.2bn
TOTALRUR14bn
Appendix I. Top Brands.
INNOVATIONS. AFFORDABILITY. QUALITY
Conference call: 4Q/FY 2013 Sales Results (18.02.14)

23
Source: Company data
FY2013 / 4Q2013 Best Selling BrandsFY2013 FY2013 FY2012
BrandVolume
(mln packs)Sales
(RURm)% of total
salesVolume
(mln packs)Sales
(RURm)% of total
salesChange
(mln RUR) %
Arbidol 19,108 3 807,0 16,4% 24,974 3 975,1 19,1% - 168,0 -4,2%
Pentalgin 29,419 2 251,0 9,7% 36,995 2 418,0 11,6% - 167,0 -6,9%
Complivit 16,830 1 663,6 7,2% 17,091 1 605,4 7,7% 58,2 3,6%
Phosphoglive 3,352 1 372,8 5,9% 3,077 1 161,6 5,6% 211,2 18,2%
Aphobazolum 7,021 1 273,1 5,5% 5,727 872,2 4,2% 400,9 46,0%
Amixin 2,594 1 203,6 5,2% 1,888 851,3 4,1% 352,4 41,4%
Flukostat 6,490 849,6 3,7% 6,316 772,6 3,7% 76,9 10,0%
Combilipen 6,263 687,6 3,0% 5,054 534,1 2,6% 153,5 28,7%
Codelac 7,628 625,8 2,7% 6,780 549,0 2,6% 76,8 14,0%
Acipol 3,573 612,1 2,6% 2,590 390,3 1,9% 221,8 56,8%
TOP 10 total 102,279 14 346,2 62% 110,492 13 129,5 63% 1 217 9%
Other brands 483,278 8 887,4 38% 442,035 7 645,4 37% 1 242 16%
TOTAL SALES 585,558 23 233,6 100% 553,668 20 774,9 100% 2 459 12%
4Q2013 4Q2013 4Q2012
BrandVolume
(mln packs)Sales
(mln RUR)% of total
salesVolume
(mln packs)Sales
(mln RUR)% of total
salesChange
(mln RUR) %
Arbidol 3,980 769,4 11,4% 9,215 1 435,0 20,6% - 665,6 -46,4%
Pentalgin 8,580 632,7 9,3% 8,297 573,7 8,2% 59,0 10,3%
Complivit 5,997 577,7 8,5% 7,159 666,8 9,6% - 89,2 -13,4%
Phosphoglive 1,443 561,9 8,3% 1,185 443,7 6,4% 118,1 26,6%
Aphobazolum 2,507 454,3 6,7% 1,927 281,2 4,0% 173,1 61,6%
Acipol 2,386 409,6 6,0% 1,775 266,0 3,8% 143,5 54,0%
Amixin 0,612 281,9 4,2% 0,588 265,5 3,8% 16,4 6,2%
Combilipen 2,321 256,8 3,8% 1,668 182,1 2,6% 74,7 41,0%
Flukostat 1,483 211,1 3,1% 1,720 211,1 3,0% 0,0 0,0%
Codelac 2,358 196,6 2,9% 2,256 178,0 2,6% 18,6 10,4%
TOP 10 total 31,667 4 351,9 64% 35,791 4 503,1 65% - 151 -3%
Other brands 142,163 2 419,0 36% 124,642 2 469,9 35% - 51 -2%
TOTAL SALES 173,830 6 770,9 100% 160,433 6 973,1 100% - 202 -3%
Conference call: 4Q/FY 2013 Sales Results (18.02.14)

24
Source: Company data
FY/4Q2013 TOP-10 OTC BrandsFY2013 FY2013 FY2012
BrandVolume
(mln packs)Sales
(mln RUR)% of total
salesVolume
(mln packs)Sales
(mln RUR)% of total
salesChange
(mln RUR) %
Arbidol 19,108 3 807,0 23,1% 24,974 3 975,1 26,7% - 168,0 -4,2%
Pentalgin 24,094 1 927,3 11,7% 32,789 2 205,4 14,8% - 278,1 -12,6%
Complivit 16,830 1 663,6 10,1% 17,091 1 605,4 10,8% 58,2 3,6%
Aphobazolum 7,021 1 273,1 7,7% 5,727 872,2 5,9% 400,9 46,0%
Amixin 2,318 1 106,4 6,7% 1,712 791,7 5,3% 314,8 39,8%
Flukostat 6,486 849,0 5,2% 6,272 765,2 5,1% 83,9 11,0%
Acipol 3,573 612,1 3,7% 2,590 390,3 2,6% 221,8 56,8%
Codelac 6,741 532,7 3,2% 5,997 476,8 3,2% 55,9 11,7%
Ingalypt 7,847 488,4 3,0% 7,526 328,8 2,2% 159,6 48,5%
Corvalol 48,895 350,4 2,1% 42,456 298,2 2,0% 52,2 17,5%
TOP 10 total 142,915 12 610,1 77% 147,135 11 709,1 79% 901 8%
Other brands 375,713 3 847,7 23% 319,836 3 170,2 21% 678 21%
TOTAL SALES 518,628 16 457,8 100% 466,970 14 879,3 100% 1 579 11%
4Q2013 4Q2013 4Q2012
BrandVolume
(mln packs)Sales
(mln RUR)% of total
salesVolume
(mln packs)Sales
(mln RUR)% of total
salesChange
(mln RUR) %
Arbidol 3,980 769,4 17,0% 9,215 1 435,0 30,4% - 665,6 -46,4%
Pentalgin 5,997 577,7 12,7% 7,159 666,8 14,1% - 89,2 -13,4%
Complivit 6,569 526,7 11,6% 6,606 493,9 10,5% 32,8 6,6%
Aphobazolum 2,507 454,3 10,0% 1,927 281,2 6,0% 173,1 61,6%
Amixin 0,547 226,2 5,0% 0,537 247,8 5,2% - 21,6 -8,7%
Flukostat 1,483 211,1 4,7% 1,708 209,0 4,4% 2,1 1,0%
Acipol 1,188 202,6 4,5% 0,815 124,3 2,6% 78,3 63,0%
Codelac 2,068 165,9 3,7% 1,927 146,5 3,1% 19,5 13,3%
Ingalypt 2,576 155,0 3,4% 7,526 328,8 7,0% - 173,8 -52,9%
Corvalol 15,466 110,0 2,4% 10,904 74,9 1,6% 35,1 46,9%
TOP 10 total 42,382 3 399,0 75% 48,323 4 008,2 85% - 609 -15%
Other brands 114,183 1 138,8 25% 81,741 712,8 15% 426 60%
TOTAL SALES 156,565 4 537,7 100% 130,064 4 721,0 100% - 183 -4%
Conference call: 4Q/FY 2013 Sales Results (18.02.14)

25
Source: Company data
FY2013 / 4Q2013 TOP-10 Rx BrandsFY2013 FY2013 FY2012
BrandVolume
(mln packs)Sales
(mln RUR)% of total
salesVolume
(mln packs)Sales
(mln RUR)% of total
salesChange
(mln RUR) %
Phosphoglive 3,352 1 372,8 20,3% 3,077 1 161,6 19,7% 211,2 18,2%
Combilipen 6,263 687,6 10,1% 5,054 534,1 9,1% 153,5 28,7%
Biosulin 0,900 597,6 8,8% 0,894 519,3 8,8% 78,3 15,1%
Octolipen 1,432 330,2 4,9% 1,324 278,4 4,7% 51,8 18,6%
Pentalgin 5,325 323,8 4,8% 4,205 212,6 3,6% 111,1 52,3%
Rastan 0,153 270,2 4,0% 0,089 279,3 4,7%- 9,0 -3,2%
Terpincodum 1,314 225,6 3,3% 0,934 150,5 2,6% 75,1 49,9%
Formetine 2,060 226,7 3,3% 1,192 124,7 2,1% 102,0 81,8%
Artrosan 1,351 215,2 3,2% 0,898 136,8 2,3% 78,4 57,4%
Picamilon 4,689 208,8 3,1% 4,121 175,7 3,0% 33,0 18,8%
TOP 10 total 26,839 4 458,4 66% 21,788 3 572,9 61% 885 25%
Other brands 40,091 2 317,4 34% 43,383 2 322,8 39% - 5 0%
TOTAL SALES 66,930 6 775,8 100% 86,698 5 895,7 100% 880 15%
4Q2013 4Q2013 4Q2012
BrandVolume
(mln packs)Sales
(mln RUR)% of total
salesVolume
(mln packs)Sales
(mln RUR)% of total
salesChange
(mln RUR) %
Phosphoglive 1,461 655,0 29,3% 1,185 443,7 19,7% 211,2 47,6%
Combilipen 2,321 256,8 11,5% 1,668 182,1 8,1% 74,7 41,0%
Rastan 0,115 191,7 8,6% 0,062 216,0 9,6%- 24,3 -11,3%
Biosulin 0,230 158,1 7,1% 0,258 151,1 6,7% 7,0 4,6%
Octolipen 0,497 120,0 5,4% 0,396 83,6 3,7% 36,4 43,6%
Pentalgin 2,010 106,0 4,7% 1,691 79,8 3,5% 26,2 32,8%
Artrosan 0,511 82,5 3,7% 0,296 47,4 2,1% 35,2 74,3%
Picamilon 1,620 73,0 3,3% 1,175 51,1 2,3% 21,9 42,9%
Terpincodum 0,376 64,9 2,9% 0,934 150,5 6,7%- 85,5 -56,9%
Formetine 0,490 58,5 2,6% 1,192 124,7 5,5%- 66,2 -53,1%
TOP 10 total 9,631 1 766,5 79% 8,859 1 530,0 68% 236 15%
Other brands 7,635 466,6 21% 21,510 722,0 32% - 255 -35%
TOTAL SALES 17,266 2 233,2 100% 30,369 2 252,0 100% - 19 -1%
Conference call: 4Q/FY 2013 Sales Results (18.02.14)
26
Disclaimer and Confidentiality RequirementsThis presentation does not constitute or form part of and should not be construed as, an offer to sell or issue or the solicitation of anoffer to buy or acquire securities of Pharmstandard JSC (the “Company”) or any of its affiliates in any jurisdiction or an inducementto enter into investment activity. No part of this presentation, nor the fact of its distribution, should form the basis of, or be relied onin connection with, any contract or commitment or investment decision whatsoever.
This presentation may contain 'forward-looking statements'. These statements may include the words "anticipate", "believe","intend", "estimate", "expect" and words of similar meaning. All statements other than statements of historical facts, possiblycontained in this presentation, including, without limitation, those regarding the Company’s financial position, business strategy,plans and objectives of management for future operations (including development plans and objectives relating to the Company'sprojects and services) are forward-looking statements. Such forward-looking statements involve known and unknown risks,uncertainties and other important factors that could cause the actual results, performance or achievements of the Company to bematerially different from results, performance or achievements expressed or implied by such forward-looking statements. Risks anduncertainties include, without limitation, general industry conditions and competition; economic conditions, such as interest rateand currency exchange rate fluctuations; technological advances and patents attained by competitors; challenges inherent in newproduct development, including obtaining regulatory approvals; domestic and foreign health care reforms and governmental lawsand regulations; and trends toward health care cost containment. Such forward-looking statements are based on numerousassumptions regarding the Company's present and future business strategies and the environment in which the Company willoperate in the future. These forward-looking statements speak only as at the date of this presentation.
The Company does not undertake to update any forward-looking statements as a result of new information or future events ordevelopments.
The Company will use reasonable efforts to include up-to-date and accurate information in this Internet site, but make norepresentations, warranties, or assurances as to the accuracy, currency, or completeness of the information provided. The Companyshall not be liable for any damages or injury resulting from your access to, or inability to access, this Internet site, or from yourreliance on any information provided at this Internet site.
The information and opinions contained in this document are provided as at the date of this presentation and are subject to changewithout notice.
All information, unless expressly specified herein, is from Company data.
1H2013 Sales Results (25.07.13)
Related Documents


