4Q FY21 Performance Review Feb 25, 2021

Welcome message from author
This document is posted to help you gain knowledge. Please leave a comment to let me know what you think about it! Share it to your friends and learn new things together.
Transcript
4Q FY21 Performance ReviewFeb 25, 2021
2 © Copyright 2021 Dell Inc.2
DisclaimerNON-GAAP FINANCIAL MEASURES
This presentation includes information about non-GAAP revenue, non-GAAP gross margin, non-GAAP
operating expenses, non-GAAP selling, general, and administrative expenses, non-GAAP research and
development expenses, non-GAAP operating income, non-GAAP interest and other, net, non-GAAP
income tax, non-GAAP net income, non-GAAP net income attributable to non-controlling interests, non-
GAAP net income attributable to Dell Technologies Inc. – basic, non-GAAP net income attributable to
Dell Technologies Inc. – diluted, non-GAAP earnings per share attributable to Dell Technologies Inc. –
basic, non-GAAP earnings per share attributable to Dell Technologies Inc. – diluted, EBITDA, adjusted
EBITDA, free cash flow, and free cash flow, excluding VMware, before impact from DFS related items
(collectively the “non-GAAP financial measures”), which are not measurements of financial performance
prepared in accordance with U.S. generally accepted accounting principles. We have provided a
reconciliation of the non-GAAP measures to the most directly comparable GAAP measures in the slides
captioned “Supplemental non-GAAP measures.”
SPECIAL NOTE ON FORWARD LOOKING STATEMENTS
Statements in this material that relate to future results and events are forward-looking statements and
are based on Dell Technologies' current expectations. In some cases, you can identify these statements
by such forward-looking words as “anticipate,” “believe,” “could,” “estimate,” “expect,” “intend,”
“confidence,” “may,” “plan,” “potential,” “should,” “will” and “would,” or similar expressions. Actual results
and events in future periods may differ materially from those expressed or implied by these forward-
looking statements because of a number of risks, uncertainties and other factors, including those
discussed in Dell Technologies’ periodic reports filed with the Securities and Exchange Commission.
Dell Technologies assumes no obligation to update its forward-looking statements.

3 © Copyright 2021 Dell Inc.
We are the essential technology companyDemonstrating our purpose and commitment to our stakeholders today and tomorrow
PURPOSE To create technologies that drive human progress.
VISION To become the most essential technology company for the data era.
STRATEGYUse our unique strengths to win in the consolidation of the markets in which we compete
and create differentiated Dell Technologies solutions.
Customers Shareholders Team Members Partners Community
4 © Copyright 2021 Dell Inc.4
OverviewFY21
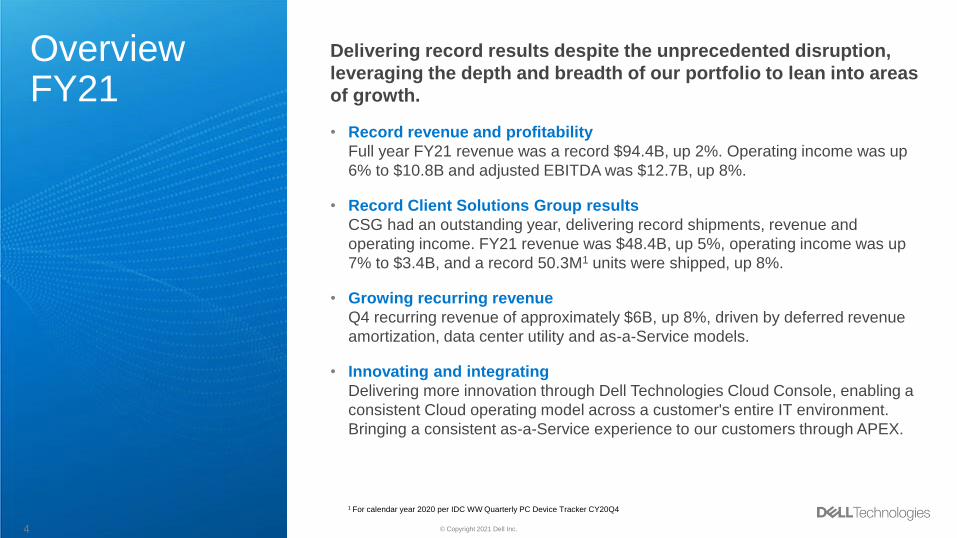
Delivering record results despite the unprecedented disruption,
leveraging the depth and breadth of our portfolio to lean into areas
of growth.
• Record revenue and profitability
Full year FY21 revenue was a record $94.4B, up 2%. Operating income was up
6% to $10.8B and adjusted EBITDA was $12.7B, up 8%.
• Record Client Solutions Group results
CSG had an outstanding year, delivering record shipments, revenue and
operating income. FY21 revenue was $48.4B, up 5%, operating income was up
7% to $3.4B, and a record 50.3M1 units were shipped, up 8%.
• Growing recurring revenue
Q4 recurring revenue of approximately $6B, up 8%, driven by deferred revenue
amortization, data center utility and as-a-Service models.
• Innovating and integrating
Delivering more innovation through Dell Technologies Cloud Console, enabling a
consistent Cloud operating model across a customer's entire IT environment.
Bringing a consistent as-a-Service experience to our customers through APEX.
1 For calendar year 2020 per IDC WW Quarterly PC Device Tracker CY20Q4

5 © Copyright 2021 Dell Inc.
Shaping our customers’ digital futureCustomers are increasingly turning to Dell Technologies as a strategic partner to look beyond the COVID
Era and leverage their investments as a springboard into the Data Era
Our Customers
University of Pisa in Italy
• Turned to PowerStore, PowerScale and PowerMax for core
storage infrastructure to enable remote learning and
accelerate their hybrid cloud and AI projects.
Swisscomm AG
• Using our as-a-Service and flexible consumption storage
solutions for affordable, on-demand access to extra capacity
when they need it.
Tech Mahindra and AlefEdge
• Dell Technologies is in the middle of the edge and telecom
transformation - most recently with Tech Mahindra and
AlefEdge in Brazil to offer edge computing as a service to
local telecommunication service providers.
Strategic Partner of Choice
Dell Technologies has never been stronger or more relevant
• Our unique direct sales engines touch more customers than
anyone in technology, giving us leading insights as we build
solutions.
• Our breadth from edge to core to cloud makes us relevant no
matter the customer challenge.
• Our unmatched global services allows us to simplify IT
complexity for our customers.
• Award winning products teams, a global supply chain with
world-class scale and reach, and financing capabilities that
make us trusted advisors to IT decisions makers at
companies of all sizes.

6 © Copyright 2021 Dell Inc.
FY21 ResultsDelivered record results despite the challenging environment; leveraging the depth and breath of our
portfolio; and executing with discipline, speed, and precision
50.3M Units
Shipped 50.3M PC units,
up 8% - the most ever in a
year1
+240 bps
Gained 240 bps of
worldwide share in servers
over the last three years2
#1
Have been #1 in
mainstream server revenue
over the last three years2
1 For calendar year 2020 per IDC WW Quarterly PC Device Tracker CY20Q42 Per IDC WW Quarterly Server Tracker CY20Q3, on a trailing twelve month basis
7% CAGR
CSG revenue has grown at
a 7% CAGR over the last
five fiscal years
$ in billions FY21 Y/Y
GAAP Revenue 94.2 2%
GAAP Operating Income 5.1 96%
Non-GAAP Revenue 94.4 2%
Non-GAAP Operating Income 10.8 6%
CSG Revenue 48.4 5%
Operating Income 3.4 7%
Commercial Revenue 35.4 3%
Consumer Revenue 13.0 12%
ISG Revenue 32.6 -4%
Operating Income 3.8 -6%
Servers & Networking Revenue 16.5 -4%
Storage Revenue 16.1 -4%
Revenue 11.9 9%
Operating Income 3.6 16%VMware BU
Infrastructure
Solutions
Group
Client
Solutions
Group
Dell
Technologies
7 © Copyright 2021 Dell Inc.
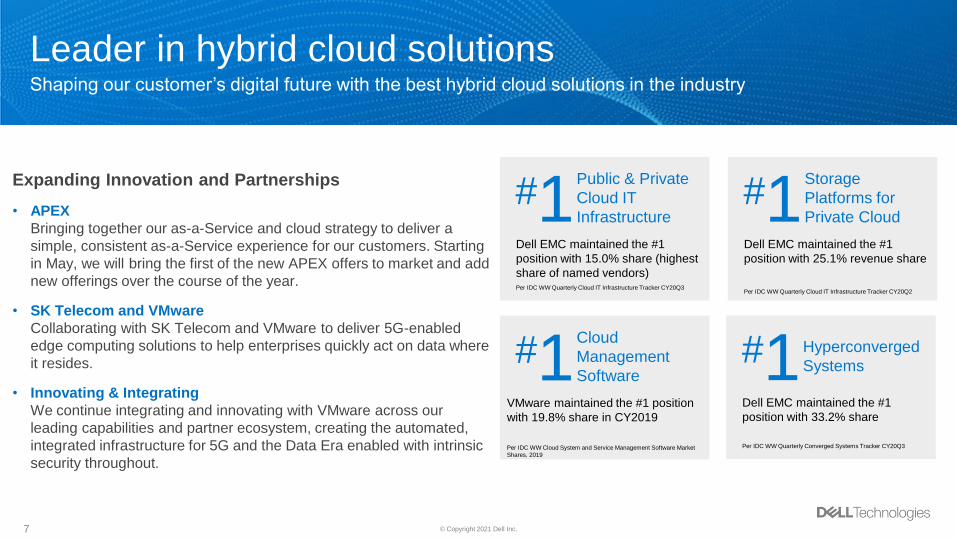
Expanding Innovation and Partnerships
• APEX
Bringing together our as-a-Service and cloud strategy to deliver a
simple, consistent as-a-Service experience for our customers. Starting
in May, we will bring the first of the new APEX offers to market and add
new offerings over the course of the year.
• SK Telecom and VMware
Collaborating with SK Telecom and VMware to deliver 5G-enabled
edge computing solutions to help enterprises quickly act on data where
it resides.
• Innovating & Integrating
We continue integrating and innovating with VMware across our
leading capabilities and partner ecosystem, creating the automated,
integrated infrastructure for 5G and the Data Era enabled with intrinsic
security throughout.
Leader in hybrid cloud solutionsShaping our customer’s digital future with the best hybrid cloud solutions in the industry
Public & Private
Cloud IT
Infrastructure #1Dell EMC maintained the #1
position with 15.0% share (highest
share of named vendors)Per IDC WW Quarterly Cloud IT Infrastructure Tracker CY20Q3
Hyperconverged
Systems#1Dell EMC maintained the #1
position with 33.2% share
Per IDC WW Quarterly Converged Systems Tracker CY20Q3
Storage
Platforms for
Private Cloud#1Dell EMC maintained the #1
position with 25.1% revenue share
Per IDC WW Quarterly Cloud IT Infrastructure Tracker CY20Q2
Cloud
Management
Software#1
VMware maintained the #1 position
with 19.8% share in CY2019
Per IDC WW Cloud System and Service Management Software Market
Shares, 2019

8 © Copyright 2021 Dell Inc.
All Flash
Array#1Dell EMC maintained the #1
position with 34.4% share
Per IDC WW Quarterly Enterprise Storage Systems Tracker CY20Q3
Storage
Software#1Dell EMC maintained the #1
position with 13.2% share
Per IDC WW Storage Software and Cloud Services QView CY20Q3
External
Enterprise
Storage#1Dell EMC maintained the #1
position with 28.8% share
Per IDC WW Quarterly Enterprise Storage Systems Tracker CY20Q3
Winning in the consolidationWe lead across the markets where we compete and continue to win in the consolidation
Purpose-Built
Backup
Appliance #1Dell EMC maintained the #1
position with 48.7% share
Per IDC WW Quarterly Purpose-Built Backup Appliance Tracker
CY20Q3
Flat Panel
Monitor#1Dell maintained the #1 position
with 16.9% share
Per IDC WW Quarterly PC Monitor Tracker CY20Q3
Client
Business#1
Server
Units and
Revenue#1Dell EMC is the leader in x86
server revenue and units
Per IDC WW Quarterly Server Tracker CY20Q3.
Converged
Systems#1Dell EMC maintained the #1
position with 42.2% share
Per IDC WW Quarterly Converged Systems Tracker CY20Q3
Leading Client Business by
revenue
Client statistic calculated by Dell Technologies utilizing other PC
OEMs’ financial public filings.
9 © Copyright 2021 Dell Inc.
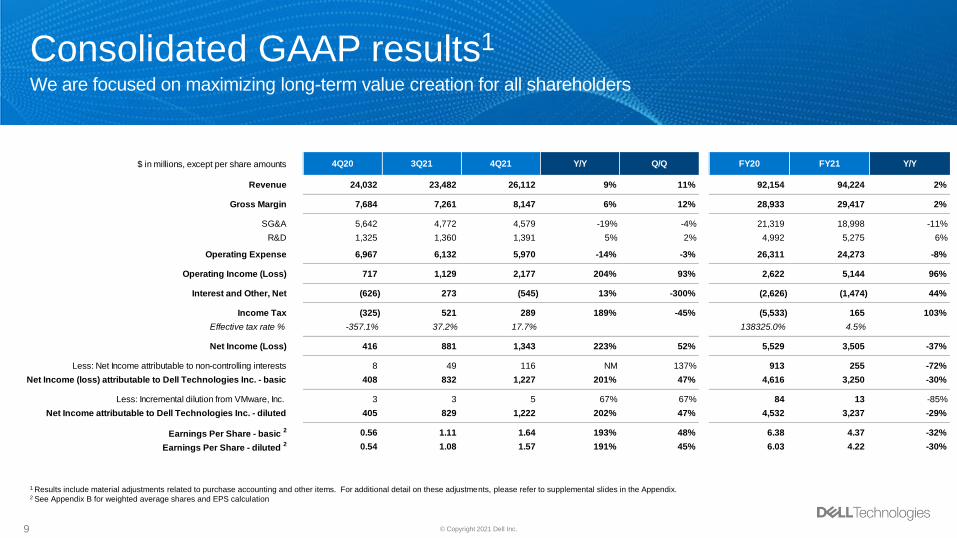
Consolidated GAAP results1
We are focused on maximizing long-term value creation for all shareholders
1 Results include material adjustments related to purchase accounting and other items. For additional detail on these adjustments, please refer to supplemental slides in the Appendix.2 See Appendix B for weighted average shares and EPS calculation
$ in millions, except per share amounts 4Q20 3Q21 4Q21 Y/Y Q/Q FY20 FY21 Y/Y
Revenue 24,032 23,482 26,112 9% 11% 92,154 94,224 2%
Gross Margin 7,684 7,261 8,147 6% 12% 28,933 29,417 2%
SG&A 5,642 4,772 4,579 -19% -4% 21,319 18,998 -11%
R&D 1,325 1,360 1,391 5% 2% 4,992 5,275 6%
Operating Expense 6,967 6,132 5,970 -14% -3% 26,311 24,273 -8%
Operating Income (Loss) 717 1,129 2,177 204% 93% 2,622 5,144 96%
Interest and Other, Net (626) 273 (545) 13% -300% (2,626) (1,474) 44%
Income Tax (325) 521 289 189% -45% (5,533) 165 103%
Effective tax rate % -357.1% 37.2% 17.7% 138325.0% 4.5%
Net Income (Loss) 416 881 1,343 223% 52% 5,529 3,505 -37%
Less: Net Income attributable to non-controlling interests 8 49 116 NM 137% 913 255 -72%
Net Income (loss) attributable to Dell Technologies Inc. - basic 408 832 1,227 201% 47% 4,616 3,250 -30%
Less: Incremental dilution from VMware, Inc. 3 3 5 67% 67% 84 13 -85%
Net Income attributable to Dell Technologies Inc. - diluted 405 829 1,222 202% 47% 4,532 3,237 -29%
Earnings Per Share - basic 2 0.56 1.11 1.64 193% 48% 6.38 4.37 -32%
Earnings Per Share - diluted 2 0.54 1.08 1.57 191% 45% 6.03 4.22 -30%
10 © Copyright 2021 Dell Inc.
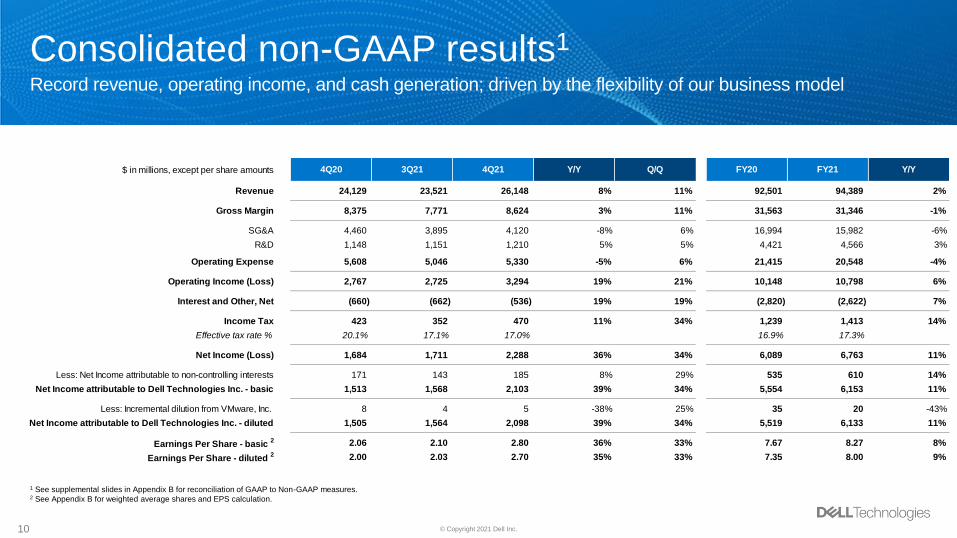
Consolidated non-GAAP results1
Record revenue, operating income, and cash generation; driven by the flexibility of our business model
1 See supplemental slides in Appendix B for reconciliation of GAAP to Non-GAAP measures.2 See Appendix B for weighted average shares and EPS calculation.
$ in millions, except per share amounts 4Q20 3Q21 4Q21 Y/Y Q/Q FY20 FY21 Y/Y
Revenue 24,129 23,521 26,148 8% 11% 92,501 94,389 2%
Gross Margin 8,375 7,771 8,624 3% 11% 31,563 31,346 -1%
SG&A 4,460 3,895 4,120 -8% 6% 16,994 15,982 -6%
R&D 1,148 1,151 1,210 5% 5% 4,421 4,566 3%
Operating Expense 5,608 5,046 5,330 -5% 6% 21,415 20,548 -4%
Operating Income (Loss) 2,767 2,725 3,294 19% 21% 10,148 10,798 6%
Interest and Other, Net (660) (662) (536) 19% 19% (2,820) (2,622) 7%
Income Tax 423 352 470 11% 34% 1,239 1,413 14%
Effective tax rate % 20.1% 17.1% 17.0% 16.9% 17.3%
Net Income (Loss) 1,684 1,711 2,288 36% 34% 6,089 6,763 11%
Less: Net Income attributable to non-controlling interests 171 143 185 8% 29% 535 610 14%
Net Income attributable to Dell Technologies Inc. - basic 1,513 1,568 2,103 39% 34% 5,554 6,153 11%
Less: Incremental dilution from VMware, Inc. 8 4 5 -38% 25% 35 20 -43%
Net Income attributable to Dell Technologies Inc. - diluted 1,505 1,564 2,098 39% 34% 5,519 6,133 11%
Earnings Per Share - basic 2 2.06 2.10 2.80 36% 33% 7.67 8.27 8%
Earnings Per Share - diluted 2 2.00 2.03 2.70 35% 33% 7.35 8.00 9%

11 © Copyright 2021 Dell Inc.
Client Solutions GroupRecord units, revenue, and profitability driven by ongoing strong demand for work and learn from home
solutions and gaming systems
REVENUE
$13.8B+17% Y/Y
+12% Q/Q
OPERATING
INCOME
$1.0B+67% Y/Y
+4% Q/Q
$8.6B, +10% Y/Y
$3.2B, +4% Y/Y
$8.6B, +4% Y/Y
$2.5B, -5% Y/Y
$8.0B, -11% Y/Y
$3.2B, +18% Y/Y
$8.8B, +5% Y/Y
$3.5B, +14% Y/Y
$9.9B, +16% Y/Y
$3.8B, +19% Y/Y
5.3%
+20 bps Y/Y
5.3%
-200 bps Y/Y
6.4%
-200 bps Y/Y
8.2%
+170 bps Y/Y
7.6%
+230 bps Y/Y
4Q20 1Q21 2Q21 3Q21 4Q21
$12.3B
+8% Y/Y
$13.8B
+17% Y/Y$11.8B
+8% Y/Y
$11.1B
+2% Y/Y
4Q20 1Q21 2Q21 3Q21 4Q21
$1,002M
+36% Y/Y
$1,043M
+67% Y/Y
$624M
+12% Y/Y
$592M
-25% Y/Y
$11.2B
-5% Y/Y
$715M
-27% Y/Y
7.6% of CSG revenue
+230 bps Y/Y
Commercial
Consumer
Record-high
Commercial revenue
driven by strong
growth in Latitude and
Precision notebooks,
and Commercial
Chromebooks.
Record-high
Consumer revenue
driven by strength
across all of our
consumer notebooks
and gaming systems.
Only big 3 vendor to
gain Commercial PC
share in calendar year
20201.
Strong profitability
driven by record
shipments, favorable
component costs,
improved profitability
in Consumer, and
operating expense
controls.
1 Results Market Sources: Per IDC WW Personal Computing Device Tracker CY20Q4, WW commercial PC, on a Y/Y basis.
12 © Copyright 2021 Dell Inc.
$4.3B,
$4.5B,
$3.8B,
$3.8B,
$4.2B,
$4.0B,
$4.2B,
$3.9B,
$4.4B,
$4.4B,
-19% Y/Y
-3% Y/Y
-10% Y/Y
-5% Y/Y
-5% Y/Y
-4% Y/Y
-2% Y/Y
-7% Y/Y
+3% Y/Y
-2% Y/Y
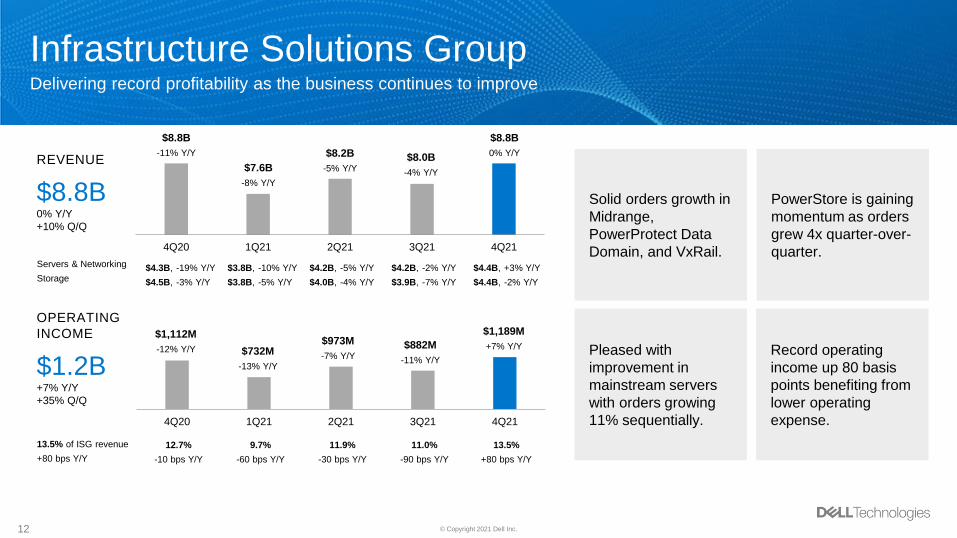
REVENUE
$8.8B0% Y/Y
+10% Q/Q
OPERATING
INCOME
$1.2B+7% Y/Y
+35% Q/Q
Infrastructure Solutions GroupDelivering record profitability as the business continues to improve
13.5% of ISG revenue
+80 bps Y/Y
Servers & Networking
Storage
Solid orders growth in
Midrange,
PowerProtect Data
Domain, and VxRail.
PowerStore is gaining
momentum as orders
grew 4x quarter-over-
quarter.
Pleased with
improvement in
mainstream servers
with orders growing
11% sequentially.
Record operating
income up 80 basis
points benefiting from
lower operating
expense.
4Q20 1Q21 2Q21 3Q21 4Q21
$8.0B
-4% Y/Y
$8.8B
0% Y/Y
$8.8B
-11% Y/Y
$7.6B
-8% Y/Y
$8.2B
-5% Y/Y
4Q20 1Q21 2Q21 3Q21 4Q21
$882M
-11% Y/Y
$1,189M
+7% Y/Y
$1,112M
-12% Y/Y $732M
-13% Y/Y
$973M
-7% Y/Y
12.7%
-10 bps Y/Y
9.7%
-60 bps Y/Y
11.9%
-30 bps Y/Y
11.0%
-90 bps Y/Y
13.5%
+80 bps Y/Y

13 © Copyright 2021 Dell Inc.
VMwareVMware business unit record quarter, delivering $3.3B of revenue, up 6% Y/Y, driven by broad-based
strength
REVENUE
$3.3B+6% Y/Y
+15% Q/Q
OPERATING
INCOME
$1.1B+4% Y/Y
+27% Q/Q
32.2% of VMware revenue
-60 bps Y/Y
Subscription and
SaaS revenue grew
27% Y/Y1.
Strong growth in the
VMware Cloud
Provider Program,
EUC, Carbon Black,
and VMware Cloud on
AWS1.
VMware Cloud on
AWS once again had
a great quarter with
both workloads and
revenue nearly
doubling Y/Y1.
Strong operating
income of $1.1B, or
32.2% of revenue.
4Q20 1Q21 2Q21 3Q21 4Q21
$2.9B
+8% Y/Y
$3.3B
+6% Y/Y
$3.1B
+12% Y/Y
$2.9B
+10% Y/Y
32.8%
+240 bps
Y/Y
28.1%
+390 bps
Y/Y
30.7%
+240 bps
Y/Y
28.9%
+240 bps
Y/Y
32.2%
-60 bps Y/Y
4Q20 1Q21 2Q21 3Q21 4Q21
$837M
+18% Y/Y
$1,067M
+4% Y/Y
$1,026M
+21% Y/Y$894M
+19% Y/Y
$2.8B
+12% Y/Y
$773M
+30% Y/Y
1 Based on VMware’s stand-alone results.

14 © Copyright 2021 Dell Inc.
CASH FLOW FROM
OPERATIONS
$5.9B+68% Y/Y
ADJUSTED EBITDA1
$3.8B+19% Y/Y
14.6% of non-GAAP revenue
DEFERRED REVENUE2
$30.8B+11% Y/Y
+7% Q/Q
$3.5B
-$0.8B
$3.3B $3.0B
$5.9B
$9.3B$7.8B $7.9B $9.0B
$11.4B
4Q20 1Q21 2Q21 3Q21 4Q21
Select financial metricsRecord year and a record fourth quarter for cash flow from operations
Fiscal quarter
TTM
Record cash flow from
operations driven by
strong profitability,
sequential growth, and
diligent working capital
management.
Strong liquidity
position with $15.8B
C&I and approximately
$10.6B at core Dell.
Delivered on FY21
core debt pay-down of
$5.5B.
Deferred revenue up
11% Y/Y, adding
revenue stability2.
Recurring revenue is
approximately $6B for
the quarter, up 8%
Y/Y3.
Adjusted free cash flow
was $5.5B up 46%, full
year adjusted free cash
flow was $10.5B4.
1 See supplemental slides in Appendix B for reconciliation of Net Income to Adjusted EBITDA.2Total deferred revenue as of quarter-end includes purchase accounting adjustments.3 Recurring revenue includes deferred revenue amortization, data center utility and as-a-service models.4 See supplemental slides in Appendix B for reconciliation of cash flow from operations to adjusted free cash flow.
$3.2B $2.6B $3.1B $3.2B $3.8B
$11.8B $11.8B $11.8B $12.1B $12.7B
4Q20 1Q21 2Q21 3Q21 4Q2113.3% 11.9% 13.6% 13.7% 14.6%
$27.8B $27.6B
$28.8B $28.7B
$30.8B
4Q20 1Q21 2Q21 3Q21 4Q21
15 © Copyright 2021 Dell Inc.
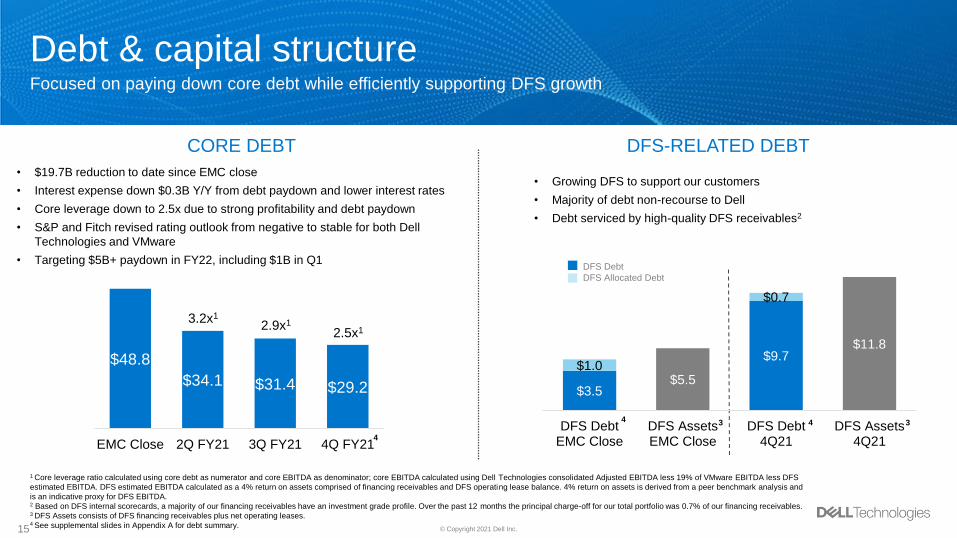
Debt & capital structureFocused on paying down core debt while efficiently supporting DFS growth
1 Core leverage ratio calculated using core debt as numerator and core EBITDA as denominator; core EBITDA calculated using Dell Technologies consolidated Adjusted EBITDA less 19% of VMware EBITDA less DFS
estimated EBITDA. DFS estimated EBITDA calculated as a 4% return on assets comprised of financing receivables and DFS operating lease balance. 4% return on assets is derived from a peer benchmark analysis and
is an indicative proxy for DFS EBITDA.2 Based on DFS internal scorecards, a majority of our financing receivables have an investment grade profile. Over the past 12 months the principal charge-off for our total portfolio was 0.7% of our financing receivables.3 DFS Assets consists of DFS financing receivables plus net operating leases.4 See supplemental slides in Appendix A for debt summary.
CORE DEBT DFS-RELATED DEBT
• Growing DFS to support our customers
• Majority of debt non-recourse to Dell
• Debt serviced by high-quality DFS receivables2
• $19.7B reduction to date since EMC close
• Interest expense down $0.3B Y/Y from debt paydown and lower interest rates
• Core leverage down to 2.5x due to strong profitability and debt paydown
• S&P and Fitch revised rating outlook from negative to stable for both Dell
Technologies and VMware
• Targeting $5B+ paydown in FY22, including $1B in Q1
$48.8
$34.1 $31.4 $29.2
EMC Close 2Q FY21 3Q FY21 4Q FY21
DFS Debt
DFS Allocated Debt
3.2x1
$3.5$5.5
$9.7$11.8
$1.0
$0.7
DFS DebtEMC Close
DFS AssetsEMC Close
DFS Debt4Q21
DFS Assets4Q21
3 3
2.9x1
2.5x1
44
4

16 © Copyright 2021 Dell Inc.
Value CreationMaximizing Dell Technologies’ equity value for all aligned shareholders through five distinct levers
Outperform in a
consolidating
environment through
ongoing share gains
- - -
Improve margins with
scale optimization and
product mix shift
CURRENT
OPERATIONS
SYNERGIES
Tightly integrated
software and solutions
- - -
Cross-sell and go-to-
market opportunities
NEW
OPPORTUNITIES
R&D investments in
emerging areas of
technology
- - -
M&A
- - -
Partnerships, including
public cloud providers
and telecommunications
CORPORATE
STRUCTURE
Intellectual property
realignment
- - -
Simplification of
operations
- - -
Asset divestitures
CAPITAL
STRUCTURE
Reduce core leverage
and interest expense
- - -
Refinancing to smooth
maturity stacks
- - -
Aligned shareholder
interests

17 © Copyright 2021 Dell Inc.17
For FY22, while the exact timing is still fluid, we expect the global economy to improve as we move through the
year, which should benefit ISG and VMware as the year progresses.
FY22 Guidance
Revenue: Expect CSG strength to continue through the first half with tougher compares in the second half.
Factoring in VMware standalone guidance, the divestiture of RSA and ongoing risks associated with the
macro environment, we currently expect revenue to grow in the low to mid-single-digit range.
OPEX: Expect to see costs come back into the P&L, though not fully back to pre-pandemic OPEX levels.
We have reinstated a number of employee-related benefits: most notably merit; promotions and 401k; and
VMware and Dell core businesses are investing for long-term growth.
Operating Income: These expense additions and their full-year impact, combined with VMware guidance
for operating income of 28% for their standalone P&L, should be factored in. Remember Dell Technologies
VMware BU results include additional OPEX that we recognize related to combined solutions selling
expenses.
F&O and Tax: We will benefit from lower interest expenses and a stable tax rate of 18% +/- 100bps.
Share count: Expect a higher weighted average share count driven by the absence of an active share
repurchase program.
Debt paydown: Expect to pay down at least $5B paydown in FY22, including $1B in Q1.
Q1 FY22 Guidance
Revenue: For CSG, expect continued solid industry demand in Q1 with industry demand potentially
outpacing supply. As a result, we currently expect strong CSG revenue growth in the mid-teens year-over-
year. For VMware, factor in VMware standalone revenue guidance, which is in line with normal seasonality.
We also expect typical revenue seasonality for ISG. Given this, we expect Q1 YoY revenue growth in
the mid-single-digit range.
Operating Income: The full-year operating expense and operating income dynamics shared for FY22
should also be contemplated for Q1, we expect operating income dollars to be down slightly year-over-year.
Guidance
18 © Copyright 2021 Dell Inc.18
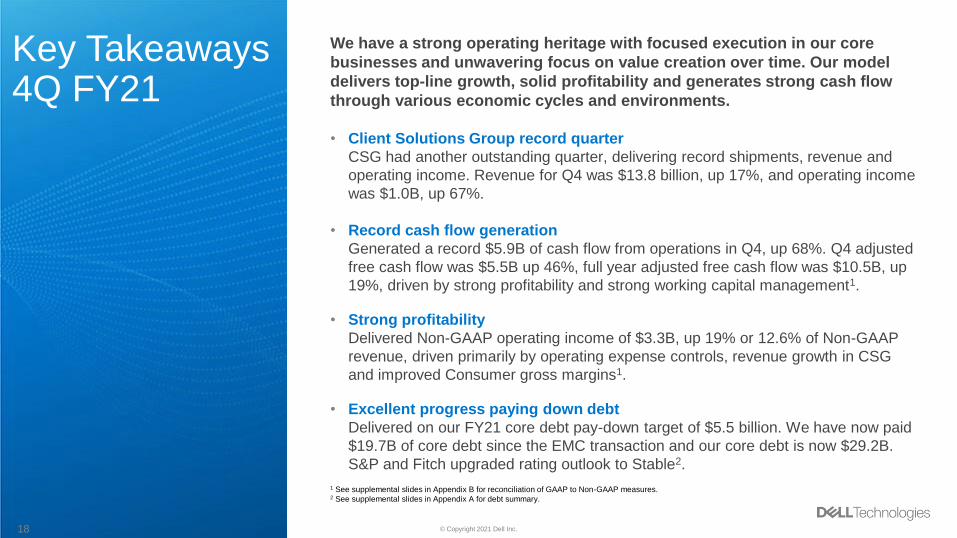
We have a strong operating heritage with focused execution in our core
businesses and unwavering focus on value creation over time. Our model
delivers top-line growth, solid profitability and generates strong cash flow
through various economic cycles and environments.
• Client Solutions Group record quarter
CSG had another outstanding quarter, delivering record shipments, revenue and
operating income. Revenue for Q4 was $13.8 billion, up 17%, and operating income
was $1.0B, up 67%.
• Record cash flow generation
Generated a record $5.9B of cash flow from operations in Q4, up 68%. Q4 adjusted
free cash flow was $5.5B up 46%, full year adjusted free cash flow was $10.5B, up
19%, driven by strong profitability and strong working capital management1.
• Strong profitability
Delivered Non-GAAP operating income of $3.3B, up 19% or 12.6% of Non-GAAP
revenue, driven primarily by operating expense controls, revenue growth in CSG
and improved Consumer gross margins1.
• Excellent progress paying down debt
Delivered on our FY21 core debt pay-down target of $5.5 billion. We have now paid
$19.7B of core debt since the EMC transaction and our core debt is now $29.2B.
S&P and Fitch upgraded rating outlook to Stable2.
Key Takeaways4Q FY21
1 See supplemental slides in Appendix B for reconciliation of GAAP to Non-GAAP measures.2 See supplemental slides in Appendix A for debt summary.
19 © Copyright 2021 Dell Inc.
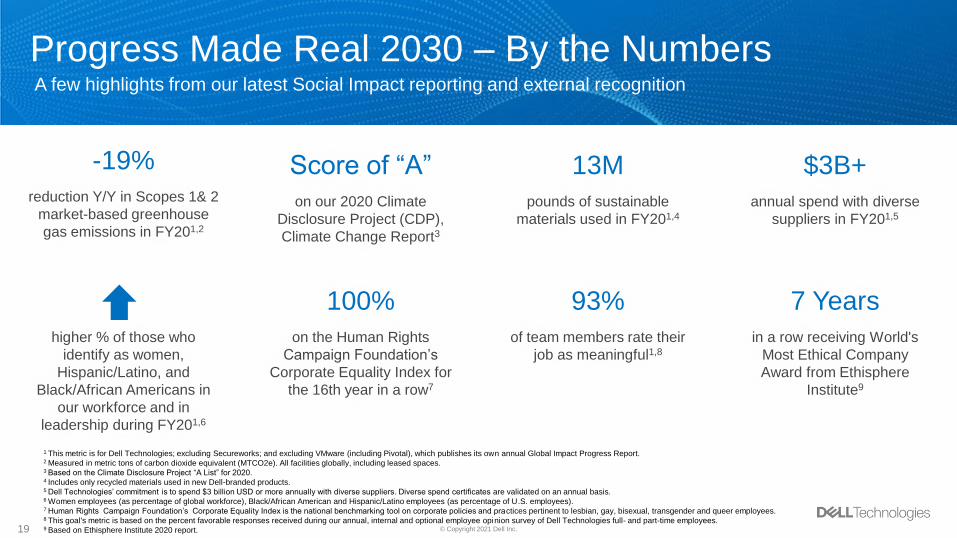
Progress Made Real 2030 – By the NumbersA few highlights from our latest Social Impact reporting and external recognition
-19%
reduction Y/Y in Scopes 1& 2
market-based greenhouse
gas emissions in FY201,2
Score of “A”
on our 2020 Climate
Disclosure Project (CDP),
Climate Change Report3
13M
pounds of sustainable
materials used in FY201,4
$3B+
annual spend with diverse
suppliers in FY201,5
higher % of those who
identify as women,
Hispanic/Latino, and
Black/African Americans in
our workforce and in
leadership during FY201,6
100%
on the Human Rights
Campaign Foundation’s
Corporate Equality Index for
the 16th year in a row7
93%
of team members rate their
job as meaningful1,8
7 Years
in a row receiving World's
Most Ethical Company
Award from Ethisphere
Institute9
1 This metric is for Dell Technologies; excluding Secureworks; and excluding VMware (including Pivotal), which publishes its own annual Global Impact Progress Report.2 Measured in metric tons of carbon dioxide equivalent (MTCO2e). All facilities globally, including leased spaces.3 Based on the Climate Disclosure Project “A List” for 2020.4 Includes only recycled materials used in new Dell-branded products.5 Dell Technologies’ commitment is to spend $3 billion USD or more annually with diverse suppliers. Diverse spend certificates are validated on an annual basis. 6 Women employees (as percentage of global workforce), Black/African American and Hispanic/Latino employees (as percentage of U.S. employees).7 Human Rights Campaign Foundation’s Corporate Equality Index is the national benchmarking tool on corporate policies and practices pertinent to lesbian, gay, bisexual, transgender and queer employees.8 This goal's metric is based on the percent favorable responses received during our annual, internal and optional employee opinion survey of Dell Technologies full- and part-time employees.9 Based on Ethisphere Institute 2020 report.

20 © Copyright 2021 Dell Inc.
Appendix ADebt and DFS summary

21 © Copyright 2021 Dell Inc.
Debt summary
1 Amounts are based on underlying data and may not visually foot due to rounding.2 Principal Face Value.3 Core Secured Debt represents secured term loans, investment grade notes, and revolver. It excludes DFS allocated debt based on a 7:1 leverage ratio of DFS financing receivables and fixed assets supporting operating leases.4 Core Debt represents the total amount of our debt, less: (a) unrestricted subsidiary debt, (b) DFS related debt, and (c) other debt. 5 VMware and its respective subsidiaries are considered unrestricted subsidiaries for purposes of the existing debt of Dell Technologies.
$ in billions 1, 2 EMC Close 4Q20 1Q21 2Q21 3Q21 4Q21
Revolver 2.0 - - - - -
Term Loan A 9.4 4.2 4.1 4.0 4.0 3.1
Term Loan B 5.0 4.7 4.7 4.7 4.7 3.1
Investment Grade Notes 20.0 20.8 23.0 21.6 18.5 18.5
DFS Allocated Debt (1.0) (1.5) (0.9) (1.2) (0.9) (0.7)
Total Core Secured Debt 3 35.4 28.2 31.0 29.1 26.3 24.1
High Yield Notes 3.3 2.7 2.7 2.7 2.7 2.7
Asset Sale Bridge 2.2 - - - - -
Legacy Dell Unsecured Notes 2.5 1.4 1.4 1.4 1.4 1.4
Legacy EMC Unsecured Notes 5.5 1.6 1.6 1.0 1.0 1.0
Total Unsecured Core Debt 13.4 5.7 5.7 5.1 5.1 5.1
Total Core Debt 4 48.8 33.8 36.6 34.1 31.4 29.2
Margin Loan and Other 4.0 4.0 4.0 4.1 4.2 4.2
DFS Debt 3.5 7.8 8.3 8.8 9.2 9.7
DFS Allocated Debt 1.0 1.5 0.9 1.2 0.9 0.7
Total DFS Related Debt 4.5 9.3 9.1 10.0 10.1 10.3
Total Debt, Excluding Public Subsidiaries 5 57.3 47.1 49.8 48.2 45.6 43.7
Total Public Subsidiary Debt - 5.6 7.6 6.3 4.8 4.8
Total Debt, Including Public Subsidiaries 5 57.3 52.7 57.3 54.5 50.4 48.5
22 © Copyright 2021 Dell Inc.
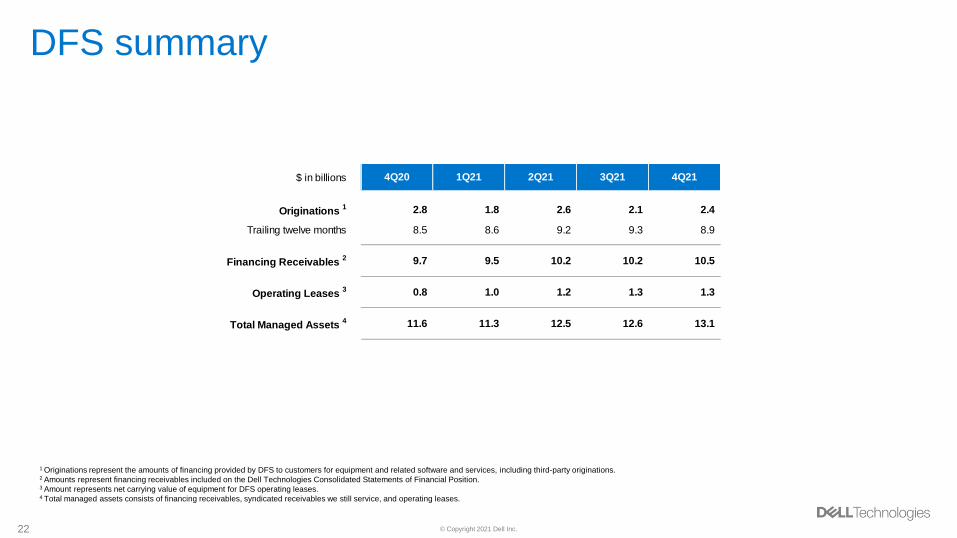
DFS summary
1 Originations represent the amounts of financing provided by DFS to customers for equipment and related software and services, including third-party originations.2 Amounts represent financing receivables included on the Dell Technologies Consolidated Statements of Financial Position.3 Amount represents net carrying value of equipment for DFS operating leases.4 Total managed assets consists of financing receivables, syndicated receivables we still service, and operating leases.
$ in billions 4Q20 1Q21 2Q21 3Q21 4Q21
Originations 1 2.8 1.8 2.6 2.1 2.4
Trailing twelve months 8.5 8.6 9.2 9.3 8.9
Financing Receivables 2 9.7 9.5 10.2 10.2 10.5
Operating Leases 3 0.8 1.0 1.2 1.3 1.3
Total Managed Assets 4 11.6 11.3 12.5 12.6 13.1

23 © Copyright 2021 Dell Inc.
Appendix BSupplemental non-GAAP measures

24 © Copyright 2021 Dell Inc.
Supplemental non-GAAP measuresRevenue and gross margin
1 This amount includes non-cash purchase accounting adjustments primarily related to the EMC merger transaction.2 Consists of severance, facility action, and other costs. 4Q21 includes derecognition of a $237 million previously accrued litigation loss as a result of a jury verdict in January 2020 against VMware, Inc. in a patent
litigation matter. On December 21, 2020, the United States District Court of the District of Delaware set aside the jury verdict and ordered a new trial.
$ in millions 4Q20 1Q21 2Q21 3Q21 4Q21 FY20 FY21
GAAP revenue 24,032 21,897 22,733 23,482 26,112 92,154 94,224
Impact of purchase accounting 1 97 48 42 39 36 347 165
Non-GAAP revenue 24,129 21,945 22,775 23,521 26,148 92,501 94,389
GAAP gross margin 7,684 6,853 7,156 7,261 8,147 28,933 29,417
Amortization of intangibles 526 372 375 375 380 2,081 1,502
Impact of purchase accounting 1 98 51 43 40 37 353 171
Stock-based compensation 38 40 50 51 53 129 194
Other corporate expenses 2 29 9 2 44 7 72 62
Total adjustments to gross margin 691 472 470 510 477 2,630 1,929
Non-GAAP gross margin 8,375 7,325 7,626 7,771 8,624 31,563 31,346
GM % of non-GAAP revenue 34.7% 33.4% 33.5% 33.0% 33.0% 34.1% 33.2%
25 © Copyright 2021 Dell Inc.
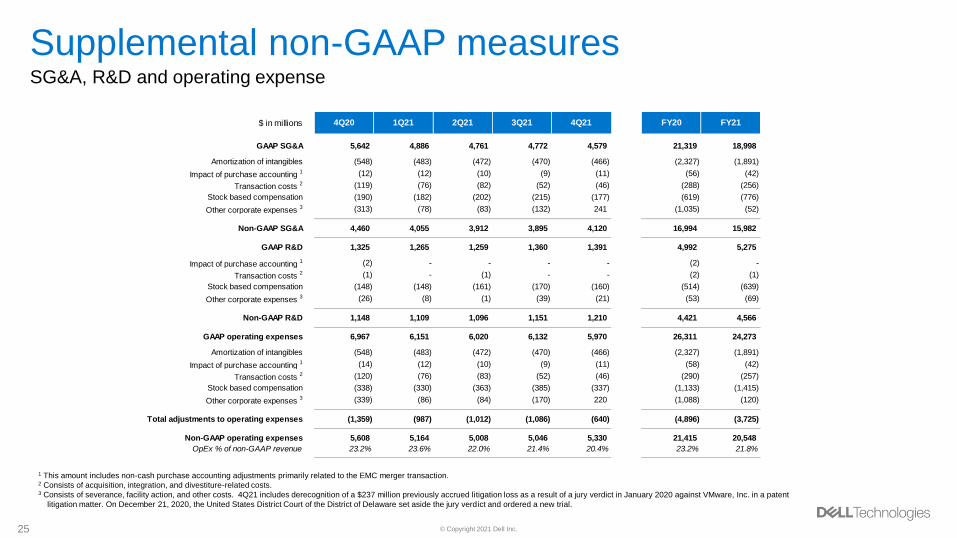
Supplemental non-GAAP measuresSG&A, R&D and operating expense
1 This amount includes non-cash purchase accounting adjustments primarily related to the EMC merger transaction.2 Consists of acquisition, integration, and divestiture-related costs.3 Consists of severance, facility action, and other costs. 4Q21 includes derecognition of a $237 million previously accrued litigation loss as a result of a jury verdict in January 2020 against VMware, Inc. in a patent
litigation matter. On December 21, 2020, the United States District Court of the District of Delaware set aside the jury verdict and ordered a new trial.
$ in millions 4Q20 1Q21 2Q21 3Q21 4Q21 FY20 FY21
GAAP SG&A 5,642 4,886 4,761 4,772 4,579 21,319 18,998
Amortization of intangibles (548) (483) (472) (470) (466) (2,327) (1,891)
Impact of purchase accounting 1 (12) (12) (10) (9) (11) (56) (42)
Transaction costs 2 (119) (76) (82) (52) (46) (288) (256)
Stock based compensation (190) (182) (202) (215) (177) (619) (776)
Other corporate expenses 3 (313) (78) (83) (132) 241 (1,035) (52)
Non-GAAP SG&A 4,460 4,055 3,912 3,895 4,120 16,994 15,982
GAAP R&D 1,325 1,265 1,259 1,360 1,391 4,992 5,275
Impact of purchase accounting 1 (2) - - - - (2) -
Transaction costs 2 (1) - (1) - - (2) (1)
Stock based compensation (148) (148) (161) (170) (160) (514) (639)
Other corporate expenses 3 (26) (8) (1) (39) (21) (53) (69)
Non-GAAP R&D 1,148 1,109 1,096 1,151 1,210 4,421 4,566
GAAP operating expenses 6,967 6,151 6,020 6,132 5,970 26,311 24,273
Amortization of intangibles (548) (483) (472) (470) (466) (2,327) (1,891)
Impact of purchase accounting 1 (14) (12) (10) (9) (11) (58) (42)
Transaction costs 2 (120) (76) (83) (52) (46) (290) (257)
Stock based compensation (338) (330) (363) (385) (337) (1,133) (1,415)
Other corporate expenses 3 (339) (86) (84) (170) 220 (1,088) (120)
Total adjustments to operating expenses (1,359) (987) (1,012) (1,086) (640) (4,896) (3,725)
Non-GAAP operating expenses 5,608 5,164 5,008 5,046 5,330 21,415 20,548
OpEx % of non-GAAP revenue 23.2% 23.6% 22.0% 21.4% 20.4% 23.2% 21.8%
26 © Copyright 2021 Dell Inc.
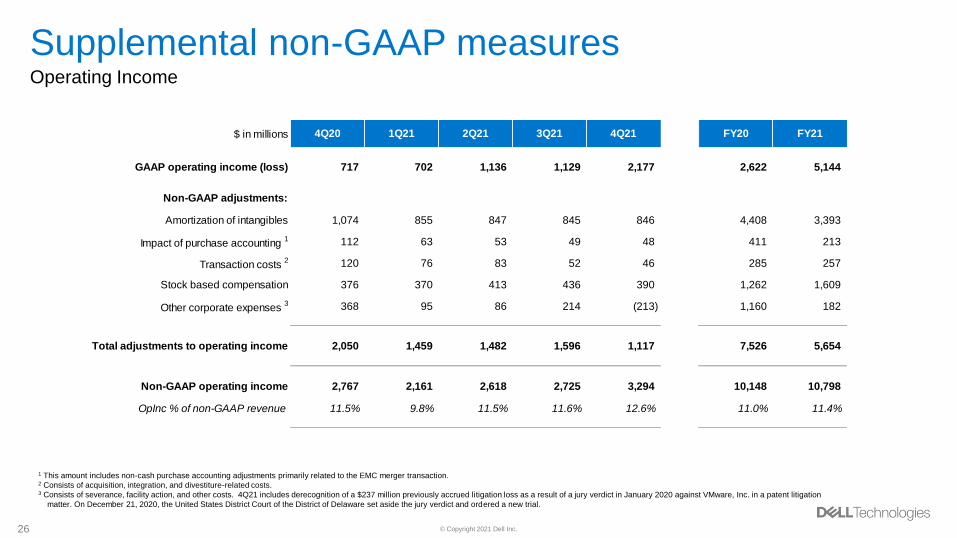
Supplemental non-GAAP measuresOperating Income
1 This amount includes non-cash purchase accounting adjustments primarily related to the EMC merger transaction.2 Consists of acquisition, integration, and divestiture-related costs.3 Consists of severance, facility action, and other costs. 4Q21 includes derecognition of a $237 million previously accrued litigation loss as a result of a jury verdict in January 2020 against VMware, Inc. in a patent litigation
matter. On December 21, 2020, the United States District Court of the District of Delaware set aside the jury verdict and ordered a new trial.
$ in millions 4Q20 1Q21 2Q21 3Q21 4Q21 FY20 FY21
GAAP operating income (loss) 717 702 1,136 1,129 2,177 2,622 5,144
Non-GAAP adjustments:
Amortization of intangibles 1,074 855 847 845 846 4,408 3,393
Impact of purchase accounting 1 112 63 53 49 48 411 213
Transaction costs 2 120 76 83 52 46 285 257
Stock based compensation 376 370 413 436 390 1,262 1,609
Other corporate expenses 3 368 95 86 214 (213) 1,160 182
Total adjustments to operating income 2,050 1,459 1,482 1,596 1,117 7,526 5,654
Non-GAAP operating income 2,767 2,161 2,618 2,725 3,294 10,148 10,798
OpInc % of non-GAAP revenue 11.5% 9.8% 11.5% 11.6% 12.6% 11.0% 11.4%

27 © Copyright 2021 Dell Inc.
Supplemental non-GAAP measuresInterest and other
1 Primarily consists of the fair value adjustments on strategic equity investments as well as a gain on the sale of Virtustream assets in 1Q2021 and RSA in 3Q2021.
$ in millions 4Q20 1Q21 2Q21 3Q21 4Q21 FY20 FY21
GAAP interest and other, net:
Investment income, primarily interest 33 24 12 11 7 160 54
Gain on investments, net 34 94 8 489 (9) 194 582
Interest expense (630) (672) (617) (566) (534) (2,675) (2,389)
Foreign exchange (39) (99) - (31) 3 (162) (127)
Other (24) 87 (39) 370 (12) (143) 406
GAAP interest and other, net (626) (566) (636) 273 (545) (2,626) (1,474)
Adjustments:
Non-GAAP adjustments 1 34 214 8 935 (9) 194 1,148
Non-GAAP interest and other, net (660) (780) (644) (662) (536) (2,820) (2,622)
I&O as a % of non-GAAP revenue -2.7% -3.5% -2.8% -2.8% -2.1% -3.0% -2.7%
28 © Copyright 2021 Dell Inc.
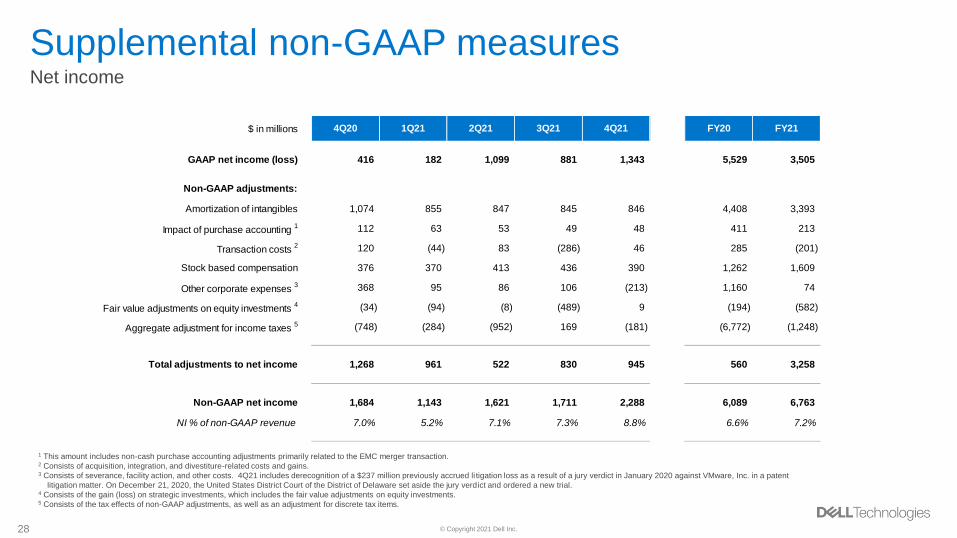
Supplemental non-GAAP measuresNet income
28
1 This amount includes non-cash purchase accounting adjustments primarily related to the EMC merger transaction.2 Consists of acquisition, integration, and divestiture-related costs and gains.3 Consists of severance, facility action, and other costs. 4Q21 includes derecognition of a $237 million previously accrued li tigation loss as a result of a jury verdict in January 2020 against VMware, Inc. in a patent
litigation matter. On December 21, 2020, the United States District Court of the District of Delaware set aside the jury verdict and ordered a new trial.4 Consists of the gain (loss) on strategic investments, which includes the fair value adjustments on equity investments.5 Consists of the tax effects of non-GAAP adjustments, as well as an adjustment for discrete tax items.
$ in millions 4Q20 1Q21 2Q21 3Q21 4Q21 FY20 FY21
GAAP net income (loss) 416 182 1,099 881 1,343 5,529 3,505
Non-GAAP adjustments:
Amortization of intangibles 1,074 855 847 845 846 4,408 3,393
Impact of purchase accounting 1 112 63 53 49 48 411 213
Transaction costs 2 120 (44) 83 (286) 46 285 (201)
Stock based compensation 376 370 413 436 390 1,262 1,609
Other corporate expenses 3 368 95 86 106 (213) 1,160 74
Fair value adjustments on equity investments 4 (34) (94) (8) (489) 9 (194) (582)
Aggregate adjustment for income taxes 5 (748) (284) (952) 169 (181) (6,772) (1,248)
Total adjustments to net income 1,268 961 522 830 945 560 3,258
Non-GAAP net income 1,684 1,143 1,621 1,711 2,288 6,089 6,763
NI % of non-GAAP revenue 7.0% 5.2% 7.1% 7.3% 8.8% 6.6% 7.2%

29 © Copyright 2021 Dell Inc.
Supplemental non-GAAP measuresNet income attributable to non-controlling interests
29
1 Amortization of intangibles reflects Dell Technologies Inc. basis.2 This amount includes non-cash purchase accounting adjustments primarily related to the EMC merger transaction.3 Consists of acquisition, integration and divestiture-related costs.4 Consists of severance, facility action, and other costs. 4Q21 includes derecognition of a $237 million previously accrued li tigation loss as a result of a jury verdict in January 2020 against VMware, Inc. in a patent
litigation matter. On December 21, 2020, the United States District Court of the District of Delaware set aside the jury verdict and ordered a new trial.5 Consists of the gain (loss) on strategic investments, which includes the fair value adjustments on equity investments.6 Consists of the tax effects of non-GAAP adjustments, as well as an adjustment for discrete tax items.
$ in millions 4Q20 1Q21 2Q21 3Q21 4Q21 FY20 FY21
GAAP net income attributable to non-controlling interests 8 39 51 49 116 913 255
Amortization of intangibles 1 76 60 64 63 62 295 249
Impact of purchase accounting 2 6 3 4 3 3 23 13
Transaction costs 3 32 7 8 5 6 50 26
Stock based compensation 65 54 57 61 51 217 223
Other corporate expenses 4 45 - - 9 (47) 45 (38)
Fair value adjustments on equity investments 5 - (1) - (34) 4 24 (31)
Aggregate adjustment for income taxes 6 (61) (35) (29) (13) (10) (1,032) (87)
Total adjustments to net income attributable to non-controlling interests 163 88 104 94 69 (378) 355
Non-GAAP net income attributable to non-controlling interests 171 127 155 143 185 535 610

30 © Copyright 2021 Dell Inc.
Supplemental non-GAAP measuresNet income attributable to Dell Technologies Inc.
30
1 This amount includes non-cash purchase accounting adjustments primarily related to the EMC merger transaction.2 Consists of acquisition, integration and divestiture-related costs and gains.3 Consists of severance, facility action, and other costs. 4Q21 includes derecognition of a $237 million previously accrued li tigation loss as a result of a jury verdict in January 2020 against VMware, Inc. in a patent
litigation matter. On December 21, 2020, the United States District Court of the District of Delaware set aside the jury verdict and ordered a new trial.4 Consists of the gain (loss) on strategic investments, which includes the fair value adjustments on equity investments.5 Consists of the tax effects of non-GAAP adjustments, as well as an adjustment for discrete tax items.6 The incremental dilution from VMware attributable to Dell Technologies Inc. represents the impact of VMware Inc.’s dilutive securities on the diluted earnings per share of Dell Technologies and is calculated by
multiplying the difference between VMware’s basic and diluted earnings per share by the number of shares of VMware common stock held by Dell Technologies.
$ in millions 4Q20 1Q21 2Q21 3Q21 4Q21 FY20 FY21
GAAP net income (loss) attributable to Dell Technologies Inc. 408 143 1,048 832 1,227 4,616 3,250
Amortization of intangibles 1,074 855 847 845 846 4,408 3,393
Impact of purchase accounting 1 112 63 53 49 48 411 213
Transaction costs 2 120 (44) 83 (286) 46 285 (201)
Stock based compensation 376 370 413 436 390 1,262 1,609
Other corporate expenses 3 368 95 86 106 (213) 1,160 74
Fair value adjustments on equity investments 4 (34) (94) (8) (489) 9 (194) (582)
Aggregate adjustment for income taxes 5 (748) (284) (952) 169 (181) (6,772) (1,248)
Total non-GAAP adjustments attributable to non-controlling interests (163) (88) (104) (94) (69) 378 (355)
Total adjustments to net income attributable to Dell Technologies Inc. 1,105 873 418 736 876 938 2,903
Non-GAAP net income attributable to Dell Technologies Inc. - basic 1,513 1,016 1,466 1,568 2,103 5,554 6,153
Incremental dilution from VMware, Inc. 6 (8) (4) (5) (4) (5) (35) (20)
Non-GAAP net income attributable to Dell Technologies Inc. - diluted 1,505 1,012 1,461 1,564 2,098 5,519 6,133

31 © Copyright 2021 Dell Inc.
Supplemental non-GAAP measuresEarnings per share - basic and diluted
1 The incremental dilution from VMware attributable to Dell Technologies Inc. represents the impact of VMware Inc.’s dilutive securities on the diluted earnings per share of Dell Technologies and is calculated by
multiplying the difference between VMware’s basic and diluted earnings per share by the number of shares of VMware common stock held by Dell Technologies.
$ in millions, except per share figures 4Q20 1Q21 2Q21 3Q21 4Q21 FY20 FY21
GAAP net income attributable to Dell Technologies Inc. 408 143 1,048 832 1,227 4,616 3,250
Weighted-average shares outstanding - basic 734 740 741 747 750 724 744
GAAP EPS attributable to Dell Technolgies Inc. - basic 0.56 0.19 1.41 1.11 1.64 6.38 4.37
Incremental dilution from VMware Inc. 1 (3) (2) (3) (3) (5) (84) (13)
GAAP net income attributable to Dell Technolgies Inc. - diluted 405 141 1,045 829 1,222 4,532 3,237
Weighted-average shares outstanding - diluted 754 755 761 771 776 751 767
GAAP EPS attributable to Dell Technolgies Inc. - diluted 0.54 0.19 1.37 1.08 1.57 6.03 4.22
Non-GAAP net income attributable to Dell Technologies Inc. 1,513 1,016 1,466 1,568 2,103 5,554 6,153
Weighted-average shares outstanding - basic 734 740 741 747 750 724 744
Non-GAAP EPS attributable to Dell Technolgies Inc. - basic 2.06 1.37 1.98 2.10 2.80 7.67 8.27
Incremental dilution from VMware Inc. 1 (8) (4) (5) (4) (5) (35) (20)
Non-GAAP net income attributable to Dell Technolgies Inc. - diluted 1,505 1,012 1,461 1,564 2,098 5,519 6,133
Weighted-average shares outstanding - diluted 754 755 761 771 776 751 767
Non-GAAP EPS attributable to Dell Technolgies Inc. - diluted 2.00 1.34 1.92 2.03 2.70 7.35 8.00
32 © Copyright 2021 Dell Inc.
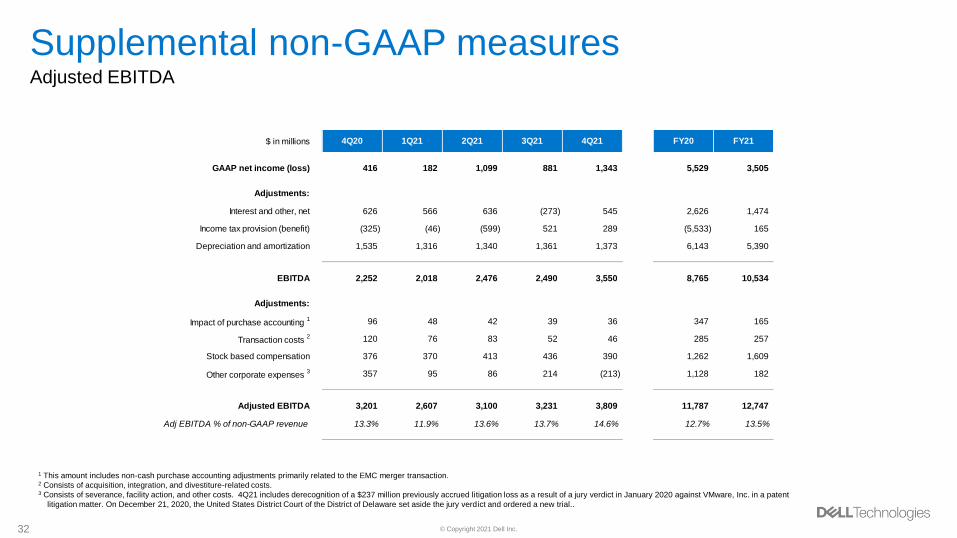
Supplemental non-GAAP measuresAdjusted EBITDA
1 This amount includes non-cash purchase accounting adjustments primarily related to the EMC merger transaction.2 Consists of acquisition, integration, and divestiture-related costs.3 Consists of severance, facility action, and other costs. 4Q21 includes derecognition of a $237 million previously accrued litigation loss as a result of a jury verdict in January 2020 against VMware, Inc. in a patent
litigation matter. On December 21, 2020, the United States District Court of the District of Delaware set aside the jury verdict and ordered a new trial..
$ in millions 4Q20 1Q21 2Q21 3Q21 4Q21 FY20 FY21
GAAP net income (loss) 416 182 1,099 881 1,343 5,529 3,505
Adjustments:
Interest and other, net 626 566 636 (273) 545 2,626 1,474
Income tax provision (benefit) (325) (46) (599) 521 289 (5,533) 165
Depreciation and amortization 1,535 1,316 1,340 1,361 1,373 6,143 5,390
EBITDA 2,252 2,018 2,476 2,490 3,550 8,765 10,534
Adjustments:
Impact of purchase accounting 1 96 48 42 39 36 347 165
Transaction costs 2 120 76 83 52 46 285 257
Stock based compensation 376 370 413 436 390 1,262 1,609
Other corporate expenses 3 357 95 86 214 (213) 1,128 182
Adjusted EBITDA 3,201 2,607 3,100 3,231 3,809 11,787 12,747
Adj EBITDA % of non-GAAP revenue 13.3% 11.9% 13.6% 13.7% 14.6% 12.7% 13.5%

33 © Copyright 2021 Dell Inc.
Supplemental non-GAAP measuresFree cash flow
1 Amount represents change in net carrying value of equipment for DFS operating leases.
$ in millions 4Q20 1Q21 2Q21 3Q21 4Q21 FY20 FY21
Cash flow from operations 3,508 (796) 3,332 2,994 5,877 9,291 11,407
Adjustments:
Capital expenditures and capitalized software development costs, net (689) (552) (544) (468) (498) (2,553) (2,062)
Free cash flow 2,819 (1,348) 2,788 2,526 5,379 6,738 9,345
Adjustments:
DFS financing receivables 737 14 530 80 104 1,329 728
DFS operating leases 1 223 135 245 44 50 819 474
Free cash flow before impact from DFS related items 3,779 (1,199) 3,563 2,650 5,533 8,886 10,547
VMware cash flow from operations 1,085 1,374 719 992 1,324 3,872 4,409
Adjustments:
VMware capital expenditures (64) (87) (76) (84) (82) (279) (329)
VMware free cash flow 1,021 1,287 643 908 1,242 3,593 4,080
Free cash flow, excluding VMware, before impact from DFS related items 2,758 (2,486) 2,920 1,742 4,291 5,293 6,467

Related Documents