4Q FY 2019-20 FINANCIAL RESULTS 30 April 2020

Welcome message from author
This document is posted to help you gain knowledge. Please leave a comment to let me know what you think about it! Share it to your friends and learn new things together.
Transcript

4Q FY 2019-20FINANCIAL RESULTS
30 April 2020

2

RF set up India’s first COVID-19 Hospital in Record Time
3
• Partnering with BMC, Reliance Foundation set up India’s
first dedicated 100-bed COVID-19 hospital in Mumbai
in just two weeks
• Negative pressure rooms
• All beds equipped with ventilators, pacemakers,
dialysis machine and patient monitoring devices
• This hospital capacity is currently being expanded to 250
beds. Already completed 222 beds.
Providing Top-notch Medical Care to Indians in Record Time

4
• RF launched Mission Anna Seva to support
marginalized communities and frontline warriors across
the nation
• Daily-wage earners
• Slum dwellers
• Migrant workers
• Urban service providers and factory workers
• Residents of old-age homes and orphanages, and
more…
• The mission has already provided nearly 5 crore meals
across 70 districts in 16 states and 1 Union Territory
Largest meal distribution programme by a corporate foundation globally
Mission Anna Seva: Our service to those in need

5
• India’s Frontline Warriors need millions of PPEs to win the battle
against COVID-19.
• Reliance Industries Ltd swiftly established a unit in Silvassa to mass
produce high-quality PPEs. The production is being ramped up to
1 lakh PPEs per day
• In a parallel efforts, Reliance has embarked on a multi-sortie airlift
mission to expedite delivery of PPEs from other countries to India
• Reliance has airlifted:
✓ 1 million surgical masks
✓ 3 lakh PPE suits
✓ 3.5 lakh PPE goggles
✓ 3.5 lakh N95 masks
✓ 50,000 isolation gowns
Arming India’s Frontline Warriors with PPEs
Reliance is the largest producer of high-quality PPEs in India

6
• The important of testing more to stay ahead of
the spread of COVID-19 cannot be overstated
• In an effort to expand India’s testing capabilities,
Reliance Life Sciences has started testing
since the last five weeks.
• From zero per day, it is currently doing over
2,000 tests every day.
Reliance Life Sciences is among India’s largest testing facility
Rapidly Augmenting India’s Testing Capabilities

Symptom checker Video Guidance
7
❑ Nationwide emergency response infrastructure - 24 hrs
❑ Daily COVID-19 Symptoms Checker to monitor health of
employees and family members
❑ JioHealthHub for free virtual video consults with RFH doctors in
specialty care as well as general care
❑ Developed Guidance Resources on Mental Health and
Emotional
❑ Yoga wellness series – easy-to-follow at home Yoga series
❑ Nutrition and Healthy Recipes
❑ Psychological Guidance sessions with Reliance
psychiatrists
Health Initiatives for Employees and Families
JioHealthHub video consultation
COVID-19: Employee and Family Welfare Initiatives
Poster and Whatsapp Shareable
Ensuring employees and family members are safe and protected through this crisis
Yoga Wellness Series

Consumer Businesses

Highlights – Digital Services
Best in class customer engagement endorsed by a global tech leader9
1. Jio is now the Digital Lifeline of 388 million Indians
▪ Net addition of 17.5 million wireless subscribers during the quarter; churn retraces to
0.57% in 4QFY20
2. Customer engagement up significantly during lockdown with strong network performance
▪ Average per capita monthly data and voice usage at 11.3GB and 771 mins
▪ Data traffic up > 50% post lockdown
3. Robust financial performance with strong double digit revenue and EBITDA growth
▪ Standalone revenues of ₹ 14,835 crore up 27% YoY; EBITDA up 43% YoY to Rs 6,201 crores
▪ ARPU at Rs 130.6, further impact of Dec-19 tariff hike to flow through in coming months
3. Jio Platforms Limited signs strategic partnership with Facebook
▪ Facebook to invest Rs 43,574 crores for 9.99% equity stake
1
2
3
4

Highlights – Retail
Sustaining strong track record of performance, fastest growing retailer 10
1. Reliance Retail delivers yet another year of highest ever revenue and EBITDA
2. Growth well ahead of the market and competitive set across categories
3. Revenue and margin growth in tandem; Operating leverage and efficiencies drive
strong EBITDA growth
4. Broad based performance across categories - Electronics, Fashion & Lifestyle and
Grocery
5. Now operate 11,784 stores with over 1,500 stores opened in the year, 30% space
added
6. Footfalls at 640 million, up 17% Y-o-Y with 125 million registered / loyal customer base,
up 40% Y-o-Y
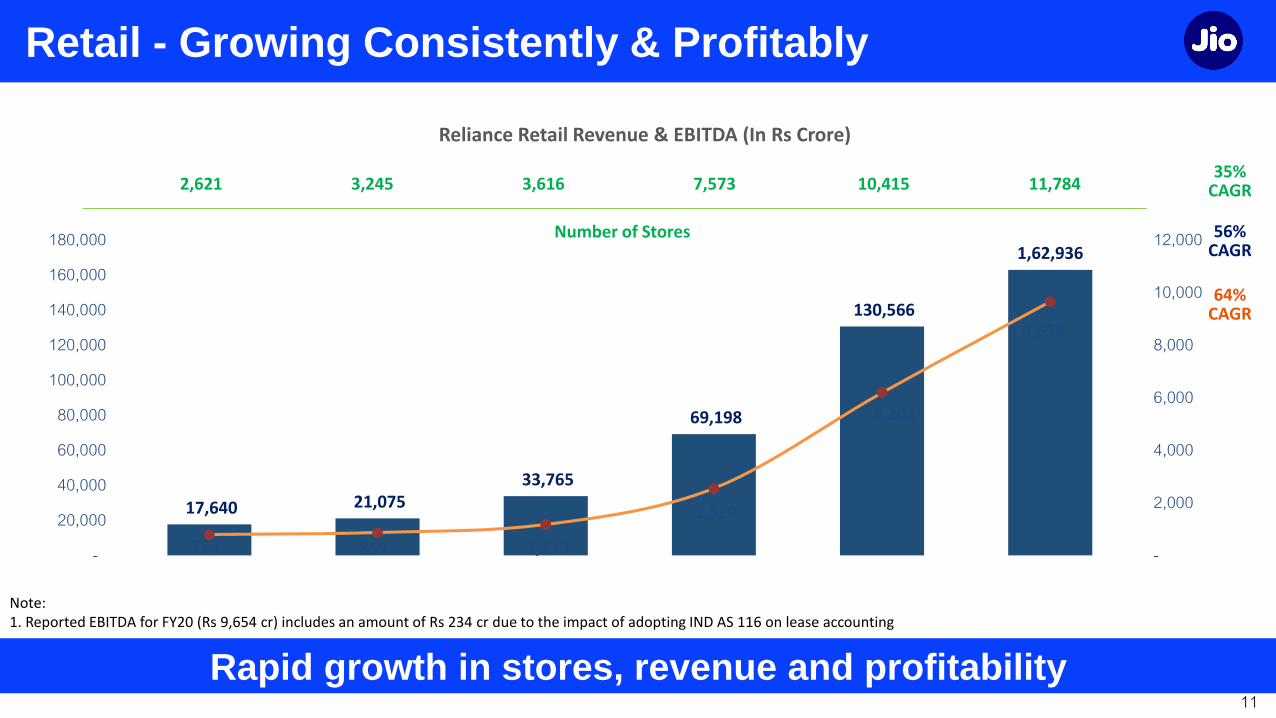
Retail - Growing Consistently & Profitably
Rapid growth in stores, revenue and profitability11
17,640 21,075 33,765
69,198
130,566
1,62,936
784 857 1,179
2,529
6,201
9,654
-
20,000
40,000
60,000
80,000
100,000
120,000
140,000
160,000
180,000
FY15 FY16 FY17 FY18 FY19 FY20
-
2,000
4,000
6,000
8,000
10,000
12,000Number of Stores
7x growth
14x growth
35% CAGR2,621 3,245 3,616 7,573 10,415 11,784
Reliance Retail Revenue & EBITDA (In Rs Crore)
56% CAGR
64% CAGR
Note: 1. Reported EBITDA for FY20 (Rs 9,654 cr) includes an amount of Rs 234 cr due to the impact of adopting IND AS 116 on lease accounting

Three Pillars for Consumer Business Growth
Safety
First
Customer
First
Platforms
for the
future
Superior Experience for customer while ensuring safety for all12

Digital Services

Safety First
➢ Social Distancing practiced and
observed across various teams,
businesses and communities
➢ Enabled teams for working round the
clock to ensure connectivity needs while
practicing and following all protocols
➢ Ensuring all employees take the RF
Covid tool symptom checker test every
day
Corona Harega, India Jeetega14

Network Performance Sustains At Scale
Traffic surge handled with network elasticity due to combination of
capacity and technology
100% Network Service Availability
➢ Capacity management remains a priority as traffic surged upto 17 cr GB per day
➢ RF Capacity optimization
➢ Backhaul IP link augmentation
➢ Caching & Peering links upgradation
➢ Network automation as advantage as physical movement is restricted in majority areas
➢ Content Delivery Networks (CDNs) pushed to the edge to achieve Scalability
➢ Zero impact on Network Operating Centre despite minimum staff due to high degree of virtualization
➢ Real-time network monitoring enablement for field team through in-house automation tools
15

High User Engagement
Unmatchable Core Foundation of our Digital Connectivity Platform
> 70%Data Traffic Used for
Video
770 MinsVoLTE Voice
Consumption / User /
Month
~5 HoursDaily Time Spent / User
11.3 GBData / User / Month
428 CrGB/ Month Data
TrafficCombined for smartphone
and JioPhone users
16

Relentless Customer Focus
17
Jio remains committed to serve a billion Indians
➢ Customer Offers
➢ Enabling Work From Home, Learn From Home & Health at Home for all
➢ Microsoft's collaboration platform – Work, Learn, Health with Microsoft Teams
➢ Double data & additional offnet minutes provided to all mobility add-on pack users
➢ JioFiber subscribers get double data
➢ Complimentary 10 Mbps JioFiber Plan
➢ “Stay Connected” program for keeping customer recharged
➢ “Jio Associate” program on JioPOS lite initiated – 1 million agents onboarded
➢ Enabling migration from physical to digital recharge
➢ Customer Care
➢ Virtual Call centers to handle voice, chat and social interactions

Innovation: Jio POS-lite
Innovating to create entrepreneurs….18
Creating a completely new pool of entrepreneurs who can serve their micro-communities as
Jio channel partners, for recharges & new acquisitions

100% migration of Central Call Center agents to distributed Work From Home
Innovation: Mobile-based remote Call Centers
19

Virtual Meet from Home
❖Use JioMeet App on any device or OS
❖Multimedia collaboration
❖Connect with Colleagues…for meetings, collaborative work, design sessions…
❖Connect with Family & Friends
20

Virtual Learn from Home
❖ JioMeet as an integrated component within Jio eEducation Platform
❖ Students & Teachers attend virtual classroom
❖ Recorded class sessions and notes
❖ Assign and submit Homework and assignments
❖ Time-bound tests
❖Multimedia elearning content for teachers to use in virtual class and students to self-learn
21

Virtual Health from Home
❖ JioMeet as an integrated component within Jio eHealth Platform
❖ Consult Doctor virtually
❖ Digital waiting rooms for doctor productivity
❖ Get prescriptions online
❖ Order medicines online
❖ Order lab tests online
22
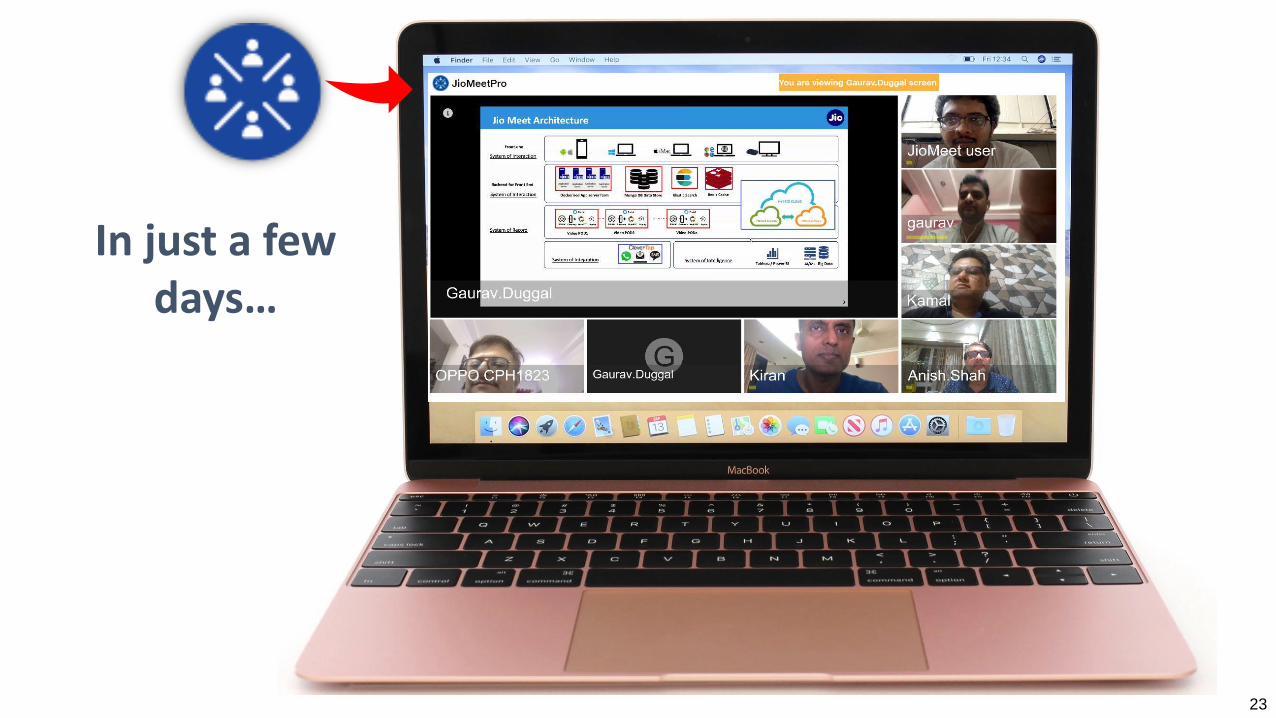
23
In just a few days…
23

Retail

4Q FY20 - Operating Context
NCOVID19 disrupts business operations25
➢ Emergence of NCOVID19 situation significantly impacts business this quarter
➢ Closure of stores from 14th March particularly malls
➢ Full closure of non-grocery stores and e-tailing from 22nd March
➢ Grocery stores continued operations with limitations and logistical challenges
➢ Restrictions on operating hours, manpower in-store and sale of only essential items
➢ Choking of supply chain restricting free flow and availability of supplies
➢ Witnessed softness in discretionary spends and lower footfalls from February
➢ Supply disruption on imports for devices, impacting electronics sales

Key Enablers: Retail
26
Safety First
➢ Enhancing Safety & Hygiene standards and workplace practices for offices, stores and operations
Customer First
➢ Ramp-up Customer Reach by leveraging Jio and Reliance Retail customer ecosystem
➢ Build Own Brand Portfolio in emerging (post COVID) categories
Platforms
➢ Strengthen Digital Platforms, Marketplace and omni-commerce capabilities across the business
➢ Explore and scale-up alternate ways of engaging customers in shopping such as pop-up stores, mobile vans etc.
➢ Grocery
➢ Electronics
➢ Fashion & Lifestyle (Ajio including Ajio Luxe for the premium brand portfolio)
➢ Develop capacity for 10X Home Delivery to customers
➢ Rapid scale-up of Physical Stores –> Smart Point and Pharma outlets
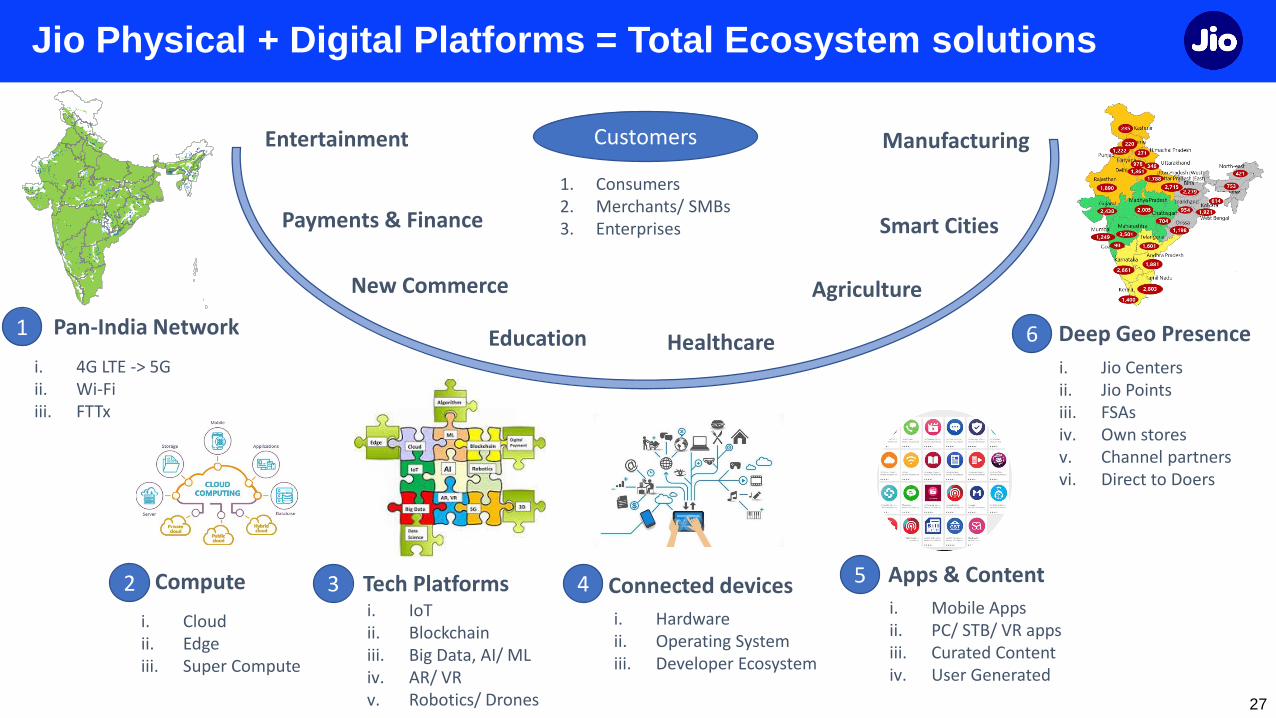
Pan-India Network Deep Geo Presence
i. 4G LTE -> 5Gii. Wi-Fiiii. FTTx
Compute
1. Consumers2. Merchants/ SMBs3. Enterprises
Tech Platformsi. IoTii. Blockchainiii. Big Data, AI/ MLiv. AR/ VRv. Robotics/ Drones
Connected devices
i. Hardwareii. Operating Systemiii. Developer Ecosystem
i. Jio Centersii. Jio Pointsiii. FSAsiv. Own storesv. Channel partnersvi. Direct to Doers
Apps & Content
i. Mobile Appsii. PC/ STB/ VR appsiii. Curated Contentiv. User Generated
Entertainment
Education
Payments & Finance
Healthcare
AgricultureNew Commerce
Manufacturing
Smart Cities
Customers
i. Cloudii. Edgeiii. Super Compute
1
2 3 4 5
6
Jio Physical + Digital Platforms = Total Ecosystem solutions
27
Financials – Digital Services

Robust Financial Performance
Wireline and Digital services to drive the next leg of growth29
➢ Strong customer traction and partial impact of recent tariff hike drives double-digit
revenue and EBITDA growth
➢ Operating leverage and improving traffic mix reflected in margins
Operating Revenue (in Rs crore) EBITDA (in Rs crore)
11,715 12,383 13,130
13,968 14,835
Mar-19 Jun-19 Sep-19 Dec-19 Mar-20
4,329 4,686
5,166 5,601
6,201
Mar-19 Jun-19 Sep-19 Dec-19 Mar-20

Full Year Performance
Rapid increase in Revenues and Profitability30
➢ Revenue CAGR of 64% and Ebitda CAGR of 78% during FY18 to FY20
➢ Net profit has increased from Rs 2,964 crore in FY 19 to Rs 5,562 crore in FY 20,
annual increase of 88%
Revenue and profitability trends
20,154
40,663
54,316
6,765
15,102 21,654
33.6%
37.1%
39.9%
32%
34%
36%
38%
40%
42%
0
20,000
40,000
60,000
FY18 FY19 FY20
Op Revenue EBITDA EBITDA Margin (%) RHS
Rs crore

Key Operating Metrics – RJIL Standalone
31
➢ Net subscriber addition at 17.5 million
➢ Churn retraces to 0.57% after a spike in
3QFY20 led by elimination of heavy voice
users
➢ Per capita usage healthy at 11.3 GB and
771 mins per month; 20-25% increase in
wireless data traffic post lockdown
Customer First mindset drives overwhelming response to Jio services

Key Financial Metrics – RJIL Standalone
32
➢ Sequential revenue growth led by
continued subscriber addition and partial
impact of tariff hike
➢ EBITDA improves further with operating
leverage, higher ARPU and improving
traffic mix
➢ Quarterly net profit up 178% YoY to Rs
2,331 crore
*Gross Revenue is value of Services
Standalone Results
figures in Rs crore, unless otherwise stated
Healthy financial performance across key metrics

Financials – Retail

Growing Consistently & Profitably
Rapid growth in stores, revenue and profitability
17,640 21,075 33,765
69,198
130,566
1,62,936
784 857 1,179
2,529
6,201
9,654
-
20,000
40,000
60,000
80,000
100,000
120,000
140,000
160,000
180,000
FY15 FY16 FY17 FY18 FY19 FY20
-
2,000
4,000
6,000
8,000
10,000
12,000
Revenue PBDIT
Number of Stores7x
growth14x
growth
35% CAGR2,621 3,245 3,616 7,573 10,415 11,784
Reliance Retail Revenue & EBITDA (In Rs Crore)
56% CAGR
64% CAGR
Note: 1. Reported EBITDA for FY20 (Rs 9,654 cr) includes an amount of Rs 234 cr due to the impact of adopting IND AS 116 on lease accounting
34

FY20 - Revenue Performance
Consumption Basket FY20 % MixChange Y-o-Y
% Growth Y-o-Y
Consumer Electronics 44,625 27% 5,440 14%
Fashion & Lifestyle 13,552 9% 2,624 24%
Grocery 34,601 21% 11,187 48%
Connectivity 55,944 34% 12,208 28%
Petro Retail 14,215 9% 912 7%
Total 162,936 100% 32,370 25%
Broad based growth
In Rs Crore
35

FY20 - EBITDA Performance
Robust profit growth across consumption baskets
In Rs Crore
Consumption Basket FY20 % MixChange Y-o-Y
% Growth Y-o-Y
Consumer Electronics 2,785 29% 930 47%
Fashion & Lifestyle 3,242 33% 1,059 52%
Grocery 2,253 23% 1,116 98%
Connectivity 1,237 13% 346 39%
Petro Retail 136 2% 1 1%
Total 9,654 100% 3,453 56%
Note: Positive impact of Rs. 234 cr for full year on EBITDA due to IND AS 116 (lease accounting), contributed to 4% of EBITDA growth
36

Reliance Retail – Indian Retailer with Global Scale
Only Indian Retailer to feature in the Global Top 100 Retailers
Fastest Growing Retailer in the World (2020)
# 189
# 94
# 56
Reliance Retail Ranking – Global Powers of Retailing
2018
2019
2020
* Global Powers of Retailing, Deloitte 2020
1
37

Results Highlights
4QFY20 4QFY19% Change wrt
4QFY19Metric FY20 FY19
% Change wrtFY19
38,211 36,663 4% Segment Gross Revenue 162,936 1,30,566 25%
34,402 32,619 5% Segment Net Revenue 146,272 116,357 26%
2,556 1,923 33% Segment EBITDA 9,654 6,201 56%
7.4% 5.9% +150 bps Segment EBITDA Margin (%) 6.6% 5.3% +130 bps
➢ 4% revenue growth despite store closures, lockdown and weak consumer sentiment
➢ Strong performance in Jan + Feb (33% excluding Devices, LFL 13%) offset by NCOVID19 situation in March
➢ Drag in Electronics and Fashion & Lifestyle due to closure of store and digital commerce sites; Grocery does very well
➢ 33% EBITDA growth in 4Q
➢ Driven by strong growth in Grocery; more B2C sales and higher productivity
➢ Positive impact of Rs. 234 cr on EBITDA due to IND AS 116 (lease accounting), contributed to 12% in EBITDA growth and 70 bps in margin
➢ Expansion continued with 496 new stores opened across consumption baskets
All Figures in Rs Crore
Performance in quarter led by Grocery business38

4Q FY20 - Revenue Performance
Consumption Basket 4Q FY20 % MixChange Y-o-Y
% Growth Y-o-Y
Consumer Electronics 6,198 16% -4,655 -43%
Fashion & Lifestyle 3,292 9% -10 0%
Grocery 10,043 26% 3,058 44%
Connectivity 15,193 40% 3,182 26%
Petro Retail 3,486 9% -26 -1%
Total 38,211 100% 1,548 4%
Strong growth in Grocery & Connectivity driving overall revenue
In Rs Crore
% Growth Y-o-Y
(Jan – Feb)
41%*
42%
35%
32%
10%
33%*
* Excluding devices
39

4Q FY20 - EBITDA Performance
Robust performance in Grocery delivers strong profit growth
In Rs Crore
Consumption Basket 4Q FY20 % MixChange Y-o-Y
% Growth Y-o-Y
Consumer Electronics 431 17% -111 -21%
Fashion & Lifestyle 975 38% 280 40%
Grocery 783 31% 404 107%
Connectivity 337 13% 73 28%
Petro Retail 30 1% -13 -30%
Total 2,556 100% 633 33%
Note: Positive impact of Rs. 234 cr on EBITDA due to IND AS 116 (lease accounting), contributed to 12% of EBITDA growth
40

Future Readying the Business for a Post NCOVID19 world
Enhancing safety & hygiene standards and workplace practices for offices, stores and operations
Re-imagining the store in a post NCOVID19 world
Strengthening Digital Commerce and Omnichannel capabilities
Bolstering supply chain/fulfilment capacity to handle home delivery
Accelerating roll-out of Jio Mart New Commerce
Developing Own Brands portfolio in keeping with the emerging consumer trends
1
2
3
4
5
6
41

JPL + Facebook
Strategic partnership

Transaction Summary
43
Definitive documentation finalized for:
Strategic investment of ₹ 43,574 crore by Facebook into Jio Platforms Limited
for a 9.99% stake
Partnership between WhatsApp Inc, Jio Platforms Limited and Reliance Retail
Limited
Pre-money Enterprise Valuation of Jio Platforms Limited at ₹ 461,632 crore
makes JPL one of the most valuable companies in India
Largest minority investment by any technology company globally
1
2
3
Reaffirmation of Jio’s positioning as a leading technology company
a
b

44
• Jio Platforms valued at
₹ 4.36 lakh crore equity value,
following the transaction; pre-
money equity value of ₹ 4.21
lakh crore
• Investment Amount: ₹ 43,574
Cr
− Retained at Jio Platforms:
₹ 14,976 Cr
− Redemption of OCPS held
by RIL: ₹ 28,598 Cr
• 1 Board Seat (in 15 member
Board)
Strategic Investment Overview
Largest FDI In ₹ Terms For Minority Investment In India
Jio Platforms Limited
Investments / AcquisitionsReliance Jio Infocomm Limited
MyJio Jio TV Jio TV+ Jio News Jio Cloud Jio Call Jio Chat Jio Security
Jio Health Hub Jio Switch Jio Browser Jio Prime
Jio
Games
Jio
Advertising
100%
Wireless
Broadband
Home
Broadband
Enterprise
and SMB
Broadband
Embibe
Jio Saavn
Jio Estonia
OU
~90%
9.99%

O2C and Upstream Businesses
45

46
R & M – Operating Environment 4Q FY20
Covid-19 related demand destruction and inability of OPEC+ to agree, impacted oil prices
➢ Covid-19 negatively impacted economic growth and oil demand
▪ World GDP growth (2020) @-3%, India @1.9%
▪ Oil demand(Apr-May’20): estimated to fall by 25-30 mb/d
➢ Crude price fell 73% through the quarter (end-to-end)
▪ Brent averaged $50.3/bbl in 4QFY20, down 21% QoQ
➢ Demand destruction impacted transportation fuel cracks
➢ Light - Heavy differential widened due to excess crude supply and
IMO impact
12.915.4
13.9
-2.2
-19.7
6.7
11.9
8.5
-2.9
-8.4
-25
-20
-15
-10
-5
0
5
10
15
20
Gasoline Gasoil Jet Kero Naphtha Fuel Oil
3Q FY 2020 4Q FY 2020

47
R & M Segment Performance – 4Q FY20
5,239
6,808 6,614
8.2
9.2 8.9
0
5
10
-
2,000
4,000
6,000
8,000
10,000
4Q FY19 3Q FY20 4Q FY20
EBITDA (` crore) GRM ($/bbl)
➢ Stable QoQ performance led by favourable crude differentials,
lower fuel cost
▪ Optimized crude basket cost by sourcing competitive
feedstock taking advantage of processing flexibility
▪ Product switch to better performing Diesel cracks
▪ Benefited from petrochemical integration
➢ Crude throughput at 18.3 MMT
➢ Premium over Singapore margins at $ 7.7/bbl
High asset quality and agile performance sustains competitive edge

48
R & M Segment Performance – FY20
➢ EBITDA down 6% YoY
▪ Weak light / middle distillate cracks, demand
compression
▪ Limited impact of IMO 2020 on middle distillate cracks
➢ Premium over Singapore at $ 5.7/bbl
➢ Crude throughput maximized at 70.6 MMT
➢ 1,398 retail outlets operational, added 29 outlets during the
year
26,050 24,461
9.2 8.9
0
5
10
-
10,000
20,000
30,000
40,000
FY19 FY20
EBITDA (` crore) GRM ($/bbl)
Strong performance in a challenging crude and product market environment

49
Petrochemicals – Operating Environment 4Q FY20
Players with feedstock flexibility benefited by switching feedstocks to optimize margins
➢ China affected severely by Covid in Jan and Feb’20
▪ Impacted feedstock and product prices negatively by 25-30% and margins
➢ Integrated Polyester Chain margin improved QoQ by $70 to $529/ MT – trending back
towards 5-year average
➢ Margins expanded in PE, PET and Rubber Chain (20-25%)
➢ With the fall in crude price from March, Ethane advantage reduced sharply improving
performance of Naphtha crackers
➢ 4Q FY20 domestic demand for polymer and polyester weak at (-5%) YoY

50
Petrochemicals Segment Performance – 4Q FY20
➢ EBITDA down 18% QoQ with significant price volatility
and demand collapse
➢ Production volumes at 9.8 MMT, near record levels
➢ Optimized feedstock flexibility across locations to benefit
from cracking economics
➢ Integrated chain margins benefitted with margins
moving down the chain
➢ Product mix changes to cater to – food & milk
packaging, medical, health and hygiene and agricultural
sectors
9,346
7,239
5,938
22.020.0
18.0
0
6
12
18
24
-
3,000
6,000
9,000
12,000
4Q FY19 3Q FY20 4Q FY20
EBITDA (` crore) EBITDA Margin (%)
Integration and feedstock flexibility help reduce impact of weak margin environment

51
Petrochemicals Segment Performance – FY20
➢ FY20 EBITDA down 18% YoY with low margin across key
products
▪ Significant supplies in weak demand environment (PE,
PP, PX, PTA, MEG)
➢ Segment performance was supported by
▪ Feedstock flexibility, cost competitiveness and strong
domestic position
➢ Strong YoY demand growth for polyester at 9%,
Polymers up 4%
37,866
30,933
22.0 21.0
0
6
12
18
24
-
10,000
20,000
30,000
40,000
50,000
FY19 FY20
EBITDA (` crore) EBITDA Margin (%)
Well-supplied markets in a weak demand environment impacted profitability

52
Oil & Gas Segment – KG D6 Development Update
➢ Priorities
▪ Safety of people
▪ Cost and cash outflow reduction
▪ Augmenting production through projects
➢ KG D6: Monetization of 3 TCFE resources
▪ 3 Projects- First Gas from R-Cluster Field expected by June 2020 subject to lifting of lockdown
▪ Achieve Peak of ~28 MMSCMD by FY24
Efforts ongoing to start production from R-Cluster on time

53
Oil & Gas Segment Performance – 4Q FY20
➢ 4Q FY20 domestic production 4.05 BCFe, down 64% QoQ
▪ KG D6 production 0.9 MMSCMD
➢ CBM production 0.97 MMSCMD
▪ 250+ wells are flowing with steady production
➢ Unit realisation at $ 6.1/MCFe, down 14% QoQ
➢ US Shale production 26.3 BCFe, up 10% QoQ
▪ Unit realization $ 2.39/MCFe, down 21.6% QoQ
Lower domestic production and soft prices impacted upstream business
258
64
-46 -100
-
100
200
300
400
4Q FY19 3Q FY20 4Q FY20
EBITDA (` crore)

54
Oil & Gas Segment Performance – FY20
➢ EBITDA down 78% YoY
▪ Continuing weakness in realisation and declining volumes
▪ US Shale production 87.8 BCFe, up 4%
▪ Domestic production 38.8 BCFe, down 34%
➢ D1-D3 field ceased production from 3rd Feb’20 due to natural
cessation
▪ D1-D3 field life was extended by 6 months
➢ CBM: Phase-II development in progress
▪ 67 wells under implementation
▪ Ramp-up from existing and new wells being planned
Domestic upstream business set for a turnaround in FY21
1,642
353
-
300
600
900
1,200
1,500
1,800
FY19 FY20
EBITDA (` crore)

55
Consolidated Financial Results
55

56
Consolidated EBITDA : 4Q FY20
YoY Consumer businesses growth more than offset weakness in energy businesses
(₹ crore) 4Q FY20 4Q FY19
Change
YoY
O2C & Upstream
R & M 6,614 5,239 26.2%
Petrochemicals 5,938 9,346 -36.5%
Oil & Gas -46 258 -
Sub Total 12,506 14,843 -15.7%
Consumer
Retail 2,556 1,923 32.9%
Digital Services 6,452 4,515 42.9%
Sub Total 9,008 6,438 39.9%
Others 4,352 2,765 57.4%
Total 25,866 24,046 7.6%
➢ Consumer businesses EBITDA grew by
₹ 2,570 crore, up 40%
➢ O2C business EBITDA lower by ₹ 2,337
crore, down 16%

57
Consolidated Financial Results : 4Q FY20
Strong performance despite challenging macro environment
➢ YoY Revenue decline led by weak commodity
prices
▪ Offset by robust growth in retail
▪ Subscriber additions and surge in data usage
in Digital Services
➢ YoY EBITDA supported by growth in consumer
businessesNote: Exceptional Item of ₹ 4,267 crore is non-cash inventory holding
losses
(₹ crore) 4Q FY20 3Q FY20 4Q FY19
Change
QoQ
Change
YoY
Revenue 151,209 169,098 155,151 -10.6% -2.5%
EBITDA 25,886 26,088 24,047 -0.8% 7.6%
Net Profit (Excl. Exceptional) 10,813 12,018 10,427 -10.0% 3.7%
Net Profit (Incl. Exceptional) 6,546 11,841 10,427 -44.7% -37.2%

58
Exceptional Item
➢ Inventory is valued at Cost or Market Value whichever is lower
➢ Oil prices dropped dramatically during the quarter – 73% fall through the quarter
➢ This resulted in non-cash inventory holding loss of ₹ 4,267 crore (net of taxes) across O2C business
➢ Crude price fall has been accompanied by demand destruction caused by Covid-19
➢ Hence this non-cash inventory holding loss is a non-recurring item and has been reflected as an
Exceptional Item
➢ Net Profit (incl. exceptional) for the quarter at ₹ 6,546 crore, down 37% YoY
➢ Net Profit (excl. exceptional) for the quarter at ₹ 10,813 crore, up 3.7% YoY
Consolidated profit at ₹ 39,880 crore, stable YoY despite Exceptional Item

59
Consolidated EBITDA : FY20
Consolidated EBITDA crosses ₹ 100,000 crore mark, first Indian Company
➢ Consumer businesses grew by 49% YoY
▪ Retail up 56% - New store roll-out and
high LFL growth
▪ Digital services up 47% - Strong
subscriber and ARPU growth
➢ O2C business impacted by
▪ Crude volatility and demand slowdown
▪ Weak petrochemical price and margin
environment
(₹ crore) FY20 FY19 % change
O2C & Upstream
R & M 24,461 26,050 -6.1%
Petrochemicals 30,933 37,866 -18.3%
Oil & Gas 353 1,642 -78.5%
Sub Total 55,747 65,558 -15.0%
Consumer
Retail 9,654 6,201 55.7%
Digital Services 22,517 15,341 46.8%
Sub Total 32,171 21,542 49.3%
Others 14,363 5,556 158.5%
Total 102,281 92,656 10.4%

60
Financial Results : FY20 vs FY19
Robust performance led by consumer businesses
➢ Turnover growth of 5% YoY led by
▪ Strong growth in Retail - up 25% YoY to
₹ 162,936 crore
▪ Digital services up 41% YoY to ₹ 68,462 crore
▪ Lower oil price led revenue contraction in
energy businesses
➢ Covid-19 linked collapse in demand and
commodity prices impacted O2C performance
Note: Exceptional Item of ₹ 4,444 crore is primarily due to non-cash
inventory holding losses
(₹ crore) FY20 FY19 % change
Revenue 659,205 625,212 5.4%
EBITDA 102,280 92,656 10.4%
Net Profit (Excl. Exceptional) 44,324 39,837 11.3%
Net Profit (Incl. Exceptional) 39,880 39,837 0.1%

61
EBITDA Mix
Consumer businesses now contribute 35.1% of consolidated segment EBITDA (vs. 24.2%)
26.3%
33.3%
0.4%
10.4%
24.2%
0.5%4.9%
R&M Petchem E&P
Organized retail Digital services Financial Services
Others
FY2020
28.9%
42.0%
1.8%
6.9%
17.0%
0.3% 3.1%
R&M Petchem E&P
Organized retail Digital services Financial Services
Others
FY2019

62
Strategic Direction
62

63
Strategic Direction : Positioned for Strong Value Creation (1/2)
High visibility on inflows of nearly ₹ 104,000 crore – to make balance sheet cast-iron strong
➢ Proposed Rights Issue of equity shares
➢ Maintained dividend at ₹ 6.50 per share for FY20 despite Covid-19 challenges
➢ Facebook-Jio Platforms transaction to be closed by end of this quarter
▪ Achieved 50% of the targeted value unlocking
▪ Jio Platforms also receives interest from other global investors for similar sized
additional stake
➢ Fuel retailing JV with BP on track – expected to achieve closure this quarter
➢ ₹ 53,125 crore
➢ ₹ 43,574 crore
➢ ₹ 7,000 crore

64
Strategic Direction : Positioned for Strong Value Creation (2/2)
Partnerships to unlock value and lead growth in post Covid-19 world
In addition
➢ Saudi Aramco due diligence is progressing well
▪ O2C filing with NCLT is underway
➢ Retail to scale up rapidly led by new commerce and pharmacy platform
▪ Significant interest from strategic and financial investors
65
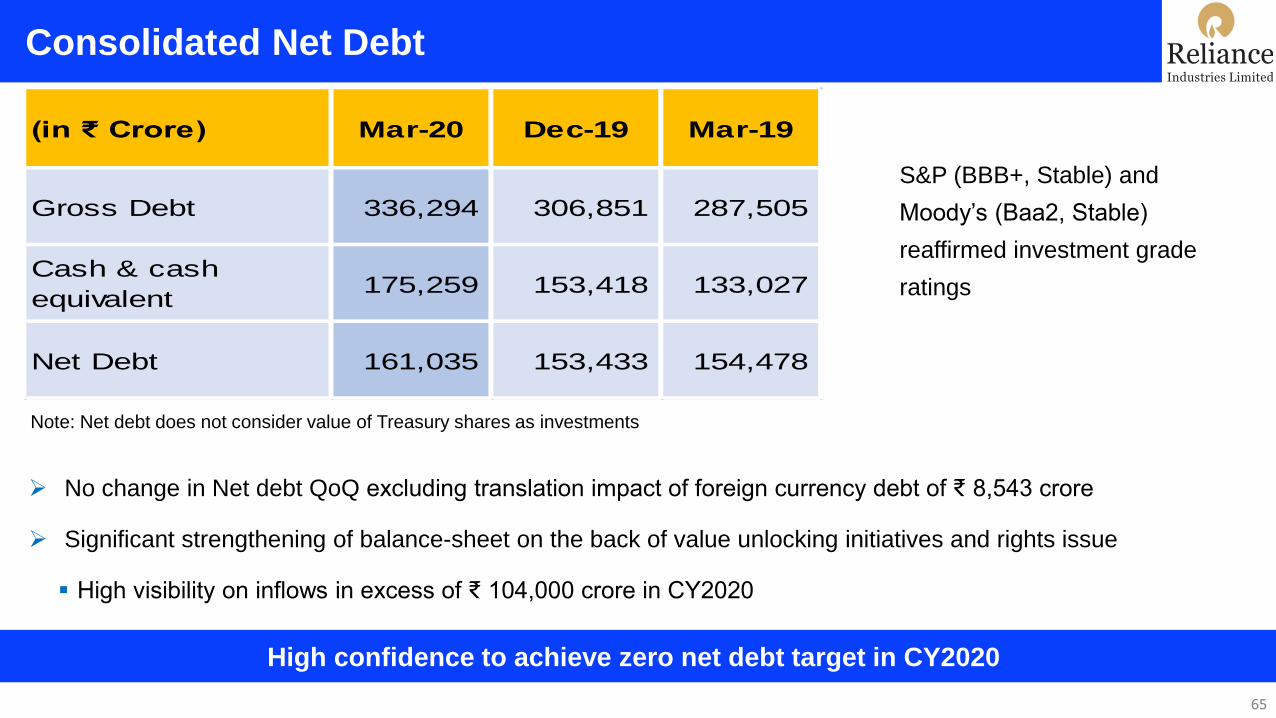
Consolidated Net Debt
High confidence to achieve zero net debt target in CY2020
(in ₹ Crore) Mar-20 Dec-19 Mar-19
Gross Debt 336,294 306,851 287,505
Cash & cash
equivalent 175,259 153,418 133,027
Net Debt 161,035 153,433 154,478
➢ No change in Net debt QoQ excluding translation impact of foreign currency debt of ₹ 8,543 crore
➢ Significant strengthening of balance-sheet on the back of value unlocking initiatives and rights issue
▪ High visibility on inflows in excess of ₹ 104,000 crore in CY2020
S&P (BBB+, Stable) and
Moody’s (Baa2, Stable)
reaffirmed investment grade
ratings
Note: Net debt does not consider value of Treasury shares as investments

66
Proposed Rights Issue
66

67
Terms of Rights Issue
➢ Rights Issue priced at 1,257 per share with share ratio at 1:15.
▪ Issue amount Rs 53,125 crore
▪ 25% on application and balance in one or more calls
68
RIL - Well-positioned to Navigate Macro Headwinds
Diversified earning streams with conservative gearing
➢ Robust and resilient business model
▪ Diversified earnings streams – 35% of EBITDA from Consumer businesses
▪ Investment cycle completed – Stronger cost positions across products, reduced capex intensity
➢ Conservative Balance Sheet
▪ BBB+ rating, two notches over Sovereign, reaffirmed by S&P

69
New business models create disproportionate value
Golden Decade of Value Creation Ahead
➢ Asset-light technology companies created more value over the last decade than aggregate market capital of
energy companies in the S&P
➢ Strategic investments in Digital Services and Organized Retail platforms underpin RIL’s participation in next leg of
value creation in India
10951029 1021
651582
0
200
400
600
800
1000
1200
Amazon Apple Microsoft Google Agg. CurrentMcap of S&PEnergy Peers
US$
Bill
ion
10 Year Market Cap Growth in Technology Stocks v/s Aggregate Energy Sector Market Cap (S&P)
Source: Bloomberg

70
RIL Valuation Multiples – Reflecting Transition in Model…
Source: Bloomberg Estimates, S&P CapitalIQ
Re-rating to continue with increasing share of Consumer Businesses in earnings
➢ Significant re-rating of stock with launch of Jio in Sep-16 with growth in Consumer business visibility
P/BP/E EV/EBITDA
11.411.0
14.5
17.1
19.7 20.4
0
5
10
15
20
FY15 FY16 FY17 FY18 FY19 FY20(est.)
P/E 5 Year Avg
1.2
1.2
1.7
2.1
2.2
2.1
0.5
0.7
0.9
1.1
1.3
1.5
1.7
1.9
2.1
2.3
FY15 FY16 FY17 FY18 FY19 FY20(est.)
P/B 5 Year Avg
9.3
9.2
11.311.6 11.6
12.5
6
7
8
9
10
11
12
13
14
15
FY15 FY16 FY17 FY18 FY19FY20 (est.)
EV/EBITDA 5 Year Avg
Jio LaunchJio Launch
Jio Launch

71
Rationale for Rights Issue
Rights issue ensures minority shareholders participate in next wave of value creation
➢ Global pandemic is reshaping the way the world lives and works
▪ Visible acceleration in Digital Services, heightened need for robust supply chain led New Commerce model
➢ Strong repositioning of company as Consumer/Technology company with Jio and Retail Platforms
▪ As new strategic investors participate in growth engines, rights issue to reward existing shareholders enabling
them to participate in Consumer/Technology business value creation

72
Value accretive Rights Issue
Rare opportunity for existing shareholders to participate in new issuance by Reliance
➢ First Rights Issue by RIL in 3 decades
▪ Rights issue to ensure all investors get to participate at same level as promoters in upcoming opportunities
➢ Promoters to take-up their entitlement and all of the unsubscribed portion
▪ Promoter contribution demonstrates deep conviction in Reliance’s future

73
Timing is Right
Stock is around 12% lower than 52 week high reflecting market confidence in Reliance
➢ On average Nifty 50
stocks are 35% below
their 52 week high
➢ Only 5 stocks are within
10% of their 52 week
high
➢ Sharp recovery in stock
as investors reassess
growth prospects post
pandemic panic 0
20,000,000
40,000,000
60,000,000
80,000,000
100,000,000
120,000,000
140,000,000
160,000,000
850
950
1,050
1,150
1,250
1,350
1,450
1,550
1,650
24/Apr/19 17/Jun/19 05/Aug/19 27/Sep/19 21/Nov/19 10/Jan/20 28/Feb/20 29/Apr/20
Volume (BSE + NSE) Reliance Industries Limited 3% Sensex -16%
Average Target Price: Rs 1,527 per share
Buy84%
Hold 8%
Sell8%
Street View
24 Mar, 2020 (Price – Rs.943.4):
Announcement of Lockdown by PM
Modi
20 Apr, 2020 (Price – Rs. 1,243.8): Oil prices
crash and go negative for the first time ever
Covid-19
Period
22 Apr, 2020 (Price – Rs.
1,237.4): Announcement of
Facebook-Jio Deal
27 Apr, 2020 (Price – Rs. 1,429.8):
Announcement of Board Meeting for Rights
Issue

74
Rights issue accretive for RIL shareholders
Accretive from FY21 with potential for significant investor returns in medium term
Sr. (in Rs. crore) 19-20 Assumptions
1 PAT (with exceptional) 39,880 1 Rights Issues say, 1 share for every 15 shares of RIL
2 Exceptional Items -4,444 2 Cost of Borrowing (fully hedged) @ 8.50%
3 PAT (without exceptional) 44,324 3 Tax Rate @ 24%
4 No. of Equity Shares (in crore) 633.94 Sr. Particulars Case 1 Case 2 Case 3
1 % Discount to Current Price for Right Issue % 8% 10% 12%
5 EPS (with exceptional items) 62.91 2 Current Share Price of RIL Rs. / share 1427 1427 1427
6 EPS (without exceptional items) 69.92 3 Issue Price for Right Rs. / share 1314 1284 1257
4 EPS of Incremental Shares issues as Right Rs. / share 85.28 83.33 81.58
7 Price of "Right" Shares to maintain EPS 1,077 5 Incremental EPS on Right Shares % 22% 19% 17%
6 Accretion to overall EPS (post Rights Issue) % 1.4% 1.2% 1.0%
7 Total Issue Size Rs. crore 55,533 54,265 53,124
RIL P&L and EPS Rights Issue: Working for Issue Size and EPS Accretion

75
EPS Sensitivity to Issue Price
Value Accretive even at attractive issue terms
8% 10% 12% 15% 20%
15 55,533 54,265 53,124 51,222 48,306
16 52,062 50,873 49,804 48,021 45,287
17 48,999 47,881 46,874 45,196 42,623
18 46,277 45,221 44,270 42,685 40,255
19 43,842 42,841 41,940 40,438 38,136
20 41,650 40,699 39,843 38,416 36,229
Issue Size (in Rs. Crore)
Shares per 1
share of RIL
% Discount
8% 10% 12% 15% 20%
15 1.37% 1.20% 1.04% 0.78% 0.38%
16 1.29% 1.13% 0.98% 0.74% 0.36%
17 1.22% 1.07% 0.93% 0.69% 0.34%
18 1.16% 1.01% 0.88% 0.66% 0.32%
19 1.10% 0.96% 0.83% 0.63% 0.30%
20 1.05% 0.91% 0.79% 0.60% 0.29%
EPS Accretion (%)
Shares per 1
share of RIL
% Discount
% Discount to
Current Price
8% 10% 12% 15% 20%
Issue Price 1314 1284 1257 1212 1143

76
Growth is Life . . . .
Related Documents


