4G/LTE Channel ality Reference Signal Trace Data Set Britta Meixner Centrum Wiskunde & Informatica, Tiledmedia B.V. Amsterdam, The Netherlands [email protected] Jan Willem Kleinrouweler Centrum Wiskunde & Informatica Amsterdam, The Netherlands [email protected] Pablo Cesar Centrum Wiskunde & Informatica, TU Delft Amsterdam, The Netherlands [email protected] ABSTRACT Mobile networks, especially LTE networks, are used more and more for high-bandwidth services like multimedia or video streams. The quality of the data connection plays a major role in the perceived quality of a service. Videos may be presented in a low quality or experience a lot of stalling events, when the connection is too slow to buffer the next frames for playback. So far, no publicly available data set exists that has a larger number of LTE network traces and can be used for deeper analysis. In this data set, we provide 546 traces of 5 minutes each with a sample rate of 100 ms. Thereof 377 traces are pure LTE data. We furthermore provide an Android app to gather further traces as well as R scripts to clean, sort, and analyze the data. CCS CONCEPTS • Networks → Network measurement; KEYWORDS LTE data, RSRP, RSRQ, ASU, DBM, Speed, mobile phone ACM Reference Format: Britta Meixner, Jan Willem Kleinrouweler, and Pablo Cesar. 2018. 4G/LTE Channel Quality Reference Signal Trace Data Set. In MMSys’18: 9th ACM Multimedia Systems Conference, June 12–15, 2018, Amsterdam, Netherlands. ACM, New York, NY, USA, 6 pages. https://doi.org/10.1145/3204949.3208132 1 INTRODUCTION Many people use mobile networks for their internet access. Most of them rely on mobile internet when on the go, but also the number of people relying on their mobile device for internet access using high data volume contracts increases [17][19]. Data intensive ser- vices, such as video streaming or other multimedia applications [18][5], have found their way to mobile devices. However, mobile networks pose a much more challenging networking environment compared to their wired counterparts. Throughput from base sta- tion to end-user device is a function of radio channel conditions and the current load of the cell. As a result, mobile connections show large throughput variations that have to be dealt with to pro- vide a smooth networking experience. The availability of mobile Permission to make digital or hard copies of all or part of this work for personal or classroom use is granted without fee provided that copies are not made or distributed for profit or commercial advantage and that copies bear this notice and the full citation on the first page. Copyrights for components of this work owned by others than the author(s) must be honored. Abstracting with credit is permitted. To copy otherwise, or republish, to post on servers or to redistribute to lists, requires prior specific permission and/or a fee. Request permissions from [email protected]. MMSys’18, June 12–15, 2018, Amsterdam, Netherlands © 2018 Copyright held by the owner/author(s). Publication rights licensed to Associa- tion for Computing Machinery. ACM ISBN 978-1-4503-5192-8/18/06. . . $15.00 https://doi.org/10.1145/3204949.3208132 network traces can be of great value when developing new mobile applications or running experiments in a mobile context. In this data set, we present a large set of traces that describe the radio channel conditions between base station and end-user device. The traces can be used to realistically model and simulate a mobile networking environment. We measured LTE signal strength values, including Signal Strength, Reference Signal Received Power (RSRP) and Reference Signal Received Quality (RSRQ). These indicators provide a detailed insight into the channel quality between LTE eNodeB and User Equipment (UE). By measuring signal strength indicators instead of throughput, we provide the users of our data set the flexibility to evaluate solutions ranging from single node applications to quality of service/scheduling algorithms in LTE base stations. The LTE traces consist of signal strength indicators that we collected using two LG Nexus 5Xs 1 . Our data set and its related materials provide the following contributions: • A data set consisting of 377 LTE traces, summing up to 1125919 data samples. Additional 169 traces with mixed LTE and non-LTE signal strength indicators. Each trace has a duration of 5 minutes and a sample-rate of 100 ms. • Annotated traces of different environments and at different speeds. • Traces for two network providers and in three countries. • R scripts for cleaning, sorting, data analysis, and data visual- ization. To the best of our knowledge, such an extensive data set does not exist for LTE networks. The proportions of this data set open doors for analysis of frequently occurring patterns. Such patterns can be used to improve network predictions. This makes our data set useful for both application developers and networking researchers. The remainder of this work is structured as follows: First, we give an overview of related work, especially similar data sets in the area of LTE networks, in Section 2. We then describe the software that was used for recording the data consisting of an Android app and a Server app (Section 3). In Section 4, we describe how the data was recorded. After that, we provide details about our data set in Section 5. We provide three example use cases of our data set in Section 6. The work ends with a conclusion (Section 7). 2 RELATED WORK A search for a mobile network data set, especially for cellular net- works, reveals data sets for varying use cases. One area are wireless antennas, where data sets are used for performance improvements, as for example described by Amiri Sani et al. [1][15] and Anderson et al. [2][3]. Another area are measurements in WiMAX networks, 1 http://www.lg.com/in/lg-nexus-5x/specification.jsp (accessed March 3, 2018) 387

Welcome message from author
This document is posted to help you gain knowledge. Please leave a comment to let me know what you think about it! Share it to your friends and learn new things together.
Transcript
4G/LTE Channel Quality Reference Signal Trace Data SetBritta Meixner
Centrum Wiskunde & Informatica,Tiledmedia B.V.
Amsterdam, The [email protected]
Jan Willem KleinrouwelerCentrum Wiskunde & InformaticaAmsterdam, The [email protected]
Pablo CesarCentrum Wiskunde & Informatica,
TU DelftAmsterdam, The Netherlands
ABSTRACTMobile networks, especially LTE networks, are used more and morefor high-bandwidth services like multimedia or video streams. Thequality of the data connection plays a major role in the perceivedquality of a service. Videos may be presented in a low quality orexperience a lot of stalling events, when the connection is too slowto buffer the next frames for playback. So far, no publicly availabledata set exists that has a larger number of LTE network traces andcan be used for deeper analysis. In this data set, we provide 546traces of 5 minutes each with a sample rate of 100 ms. Thereof377 traces are pure LTE data. We furthermore provide an Androidapp to gather further traces as well as R scripts to clean, sort, andanalyze the data.
CCS CONCEPTS• Networks → Network measurement;
KEYWORDSLTE data, RSRP, RSRQ, ASU, DBM, Speed, mobile phoneACM Reference Format:Britta Meixner, Jan Willem Kleinrouweler, and Pablo Cesar. 2018. 4G/LTEChannel Quality Reference Signal Trace Data Set. In MMSys’18: 9th ACMMultimedia Systems Conference, June 12–15, 2018, Amsterdam, Netherlands.ACM, New York, NY, USA, 6 pages. https://doi.org/10.1145/3204949.3208132
1 INTRODUCTIONMany people use mobile networks for their internet access. Most ofthem rely on mobile internet when on the go, but also the numberof people relying on their mobile device for internet access usinghigh data volume contracts increases [17][19]. Data intensive ser-vices, such as video streaming or other multimedia applications[18][5], have found their way to mobile devices. However, mobilenetworks pose a much more challenging networking environmentcompared to their wired counterparts. Throughput from base sta-tion to end-user device is a function of radio channel conditionsand the current load of the cell. As a result, mobile connectionsshow large throughput variations that have to be dealt with to pro-vide a smooth networking experience. The availability of mobile
Permission to make digital or hard copies of all or part of this work for personal orclassroom use is granted without fee provided that copies are not made or distributedfor profit or commercial advantage and that copies bear this notice and the full citationon the first page. Copyrights for components of this work owned by others than theauthor(s) must be honored. Abstracting with credit is permitted. To copy otherwise, orrepublish, to post on servers or to redistribute to lists, requires prior specific permissionand/or a fee. Request permissions from [email protected]’18, June 12–15, 2018, Amsterdam, Netherlands© 2018 Copyright held by the owner/author(s). Publication rights licensed to Associa-tion for Computing Machinery.ACM ISBN 978-1-4503-5192-8/18/06. . . $15.00https://doi.org/10.1145/3204949.3208132
network traces can be of great value when developing new mobileapplications or running experiments in a mobile context.
In this data set, we present a large set of traces that describe theradio channel conditions between base station and end-user device.The traces can be used to realistically model and simulate a mobilenetworking environment. We measured LTE signal strength values,including Signal Strength, Reference Signal Received Power (RSRP)and Reference Signal Received Quality (RSRQ). These indicatorsprovide a detailed insight into the channel quality between LTEeNodeB and User Equipment (UE). By measuring signal strengthindicators instead of throughput, we provide the users of our dataset the flexibility to evaluate solutions ranging from single nodeapplications to quality of service/scheduling algorithms in LTE basestations.
The LTE traces consist of signal strength indicators that wecollected using two LG Nexus 5Xs1. Our data set and its relatedmaterials provide the following contributions:
• A data set consisting of 377 LTE traces, summing up to1125919 data samples. Additional 169 traces with mixed LTEand non-LTE signal strength indicators. Each trace has aduration of 5 minutes and a sample-rate of 100 ms.
• Annotated traces of different environments and at differentspeeds.
• Traces for two network providers and in three countries.• R scripts for cleaning, sorting, data analysis, and data visual-ization.
To the best of our knowledge, such an extensive data set does notexist for LTE networks. The proportions of this data set open doorsfor analysis of frequently occurring patterns. Such patterns canbe used to improve network predictions. This makes our data setuseful for both application developers and networking researchers.
The remainder of this work is structured as follows: First, wegive an overview of related work, especially similar data sets in thearea of LTE networks, in Section 2. We then describe the softwarethat was used for recording the data consisting of an Android appand a Server app (Section 3). In Section 4, we describe how the datawas recorded. After that, we provide details about our data set inSection 5. We provide three example use cases of our data set inSection 6. The work ends with a conclusion (Section 7).
2 RELATEDWORKA search for a mobile network data set, especially for cellular net-works, reveals data sets for varying use cases. One area are wirelessantennas, where data sets are used for performance improvements,as for example described by Amiri Sani et al. [1][15] and Andersonet al. [2][3]. Another area are measurements in WiMAX networks,1http://www.lg.com/in/lg-nexus-5x/specification.jsp (accessed March 3, 2018)
387
MMSys’18, June 12–15, 2018, Amsterdam, Netherlands Britta Meixner, Jan Willem Kleinrouweler, and Pablo Cesar
especially for video streaming applications. Fund et al. collect mea-surements from DASH and WebRTC implementations while mov-ing at walking speeds through an 802.16e WiMAX network [10][9].Besides information about the transmitted videos (DASH and We-bRTC), the received signal strength indicator (RSSI), carrier to in-terference plus noise ratio (CINR), and frequency are collected bya WiMAX logger. Furthermore, latitude, longitude, altitude, speed,time, and fix mode (2D or 3D) are recorded via a GPS logger. Thispaper gives hints on useful data which was taken into considerationwhile designing our recording tool.
Several data sets and tools can be found for 3G networks. Yoon etal. introduce WiScape, which captures data to provide an accurateperformance characterization of the 3G networks [23][16][22]. DiFrancesco et al. gathered a data set containing census information,cellular infrastructure deployment, and cellular data demand [8].They differentiate between urban and rural areas. For the networks,they collect coordinates, power class, technology (2G/3G) and mo-bile phone operator. They furthermore look into specifics of datatransfers. Vallina-Rodriguez et al. describe an open source tool forperforming 3G network analysis on mobile phones, they howeverdo not provide a data set with it [20]. We carefully analyzed thesetools for collected data and recording techniques, and implementedthe lessons learned into our tool.
Taking a look at existing data sets and tools for 4G/LTE data,only data sets for very limited use cases could be found. Two datasets were found for multi-path TCP analysis which mainly focuseson the analysis of routing information. De Coninck et al. investigatemulti-path TCP traffic from smartphones for wireless and cellularnetworks [7][6]. Their methodology is based on the detection ofhandovers. Nikravesh et al. perform multi-path TCP measurementsonWiFi and cellular networks by performing three tasks: active andpassive measurements, and data upload [14]. They collect TCP/IPheader data as well as other performance data from the individualtests. These data are too limited for our purpose as we are interestedin network performance, not on routing. Huang et al. look into up-and down-link throughput as well as power usage of LTE networkscompared to 3G and WiFi networks [12]. While the tools used fordata collection are publicly available, the extensive data used fortheir analysis could not be found. Bergal et al. performed pointmeasurements of LTE signals on a university campus. Devices areplaced on pre-determined given spots, then, LTE signal measure-ments were taken [4]. This results in a data set for a very limitedgeographical area. Furthermore, devices did not move during mea-surements. Hosseini et al. look into the bandwidth fluctuation forconnection speeds from low speed satellite links to 4G networks onpaths between two hospitals in Illinois [11]. They collect data fromfour major mobile carriers in the US. Their data set consists of datagathered by continuous sampling of communication bandwidths(download and upload rates), GPS coordinates, GPS accuracy, alti-tude, and vehicle velocity and bearing. This data set is also limitedto a small geographical area. However, all data sets that we couldfind looked into down- and upload rates. None of them providesdata on the channel quality reference signals, which are neededfor deeper analysis of the network and modeling of applicationbehavior.
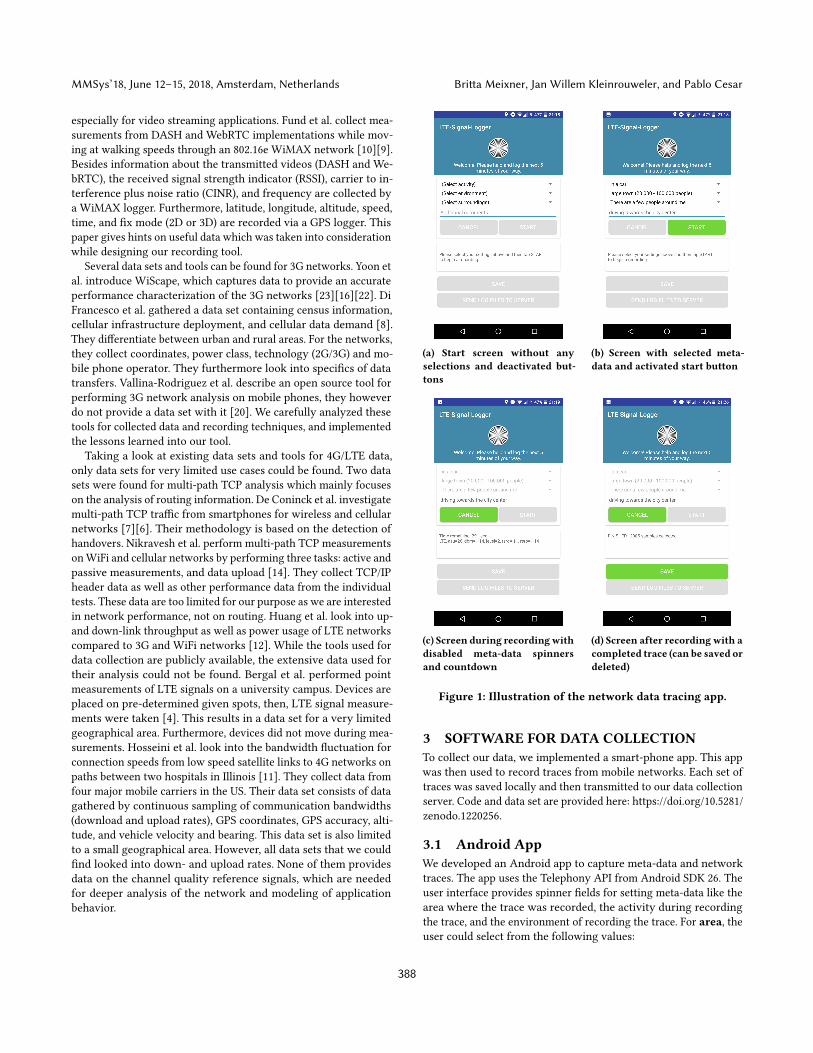
(a) Start screen without anyselections and deactivated but-tons
(b) Screen with selected meta-data and activated start button
(c) Screen during recordingwithdisabled meta-data spinnersand countdown
(d) Screen after recording with acompleted trace (can be saved ordeleted)
Figure 1: Illustration of the network data tracing app.
3 SOFTWARE FOR DATA COLLECTIONTo collect our data, we implemented a smart-phone app. This appwas then used to record traces from mobile networks. Each set oftraces was saved locally and then transmitted to our data collectionserver. Code and data set are provided here: https://doi.org/10.5281/zenodo.1220256.
3.1 Android AppWe developed an Android app to capture meta-data and networktraces. The app uses the Telephony API from Android SDK 26. Theuser interface provides spinner fields for setting meta-data like thearea where the trace was recorded, the activity during recordingthe trace, and the environment of recording the trace. For area, theuser could select from the following values:
388

4G/LTE Channel Quality Reference Signal Trace Data Set MMSys’18, June 12–15, 2018, Amsterdam, Netherlands
• I am (almost) alone• There are a few people around me• I am in a small crowd (city center, etc.)• I am in a big crowd (stadion, etc.)
To allow an easier decision on the environment, we use the defi-nitions close to [21] and added numbers for clarification. Users canpick between the following environments:
• middle of nowhere• village (1.000 people or less)• town (1.000 - 20.000 people)• large town (20.000 - 100.000 people)• city (100.000 - 300.000 people)• large city (300.000 - 1.000.000 people)• metropolis (more than 1.000.000 people)
We furthermore wanted to get an estimation of the moving speedand moving pattern. In addition to area and environment, we askduring which activity the trace is recorded:
• sitting/standing• walking• running• biking• biking (fast)• in a car• in a bus• in a train• on a plane
We furthermore provide a free text field, which allows the user toadd additional comments or circumstances which cannot be coveredby the three spinners. Before recording a trace can be started, area,activity, and environment have to be set, otherwise the start buttonis disabled (see Figure 1a). Once area, activity, and environmentare set, the start button is enabled (see Figure 1b) and recording atrace can be started. During recording a trace, the counter countsdownwards to zero (see Figure 1c). At the end of recording, the usercan chose to save or discard the recorded data (see Figure 1d).
To allow recording traces in the background, we implemented thedata collection as a service (extends Service). However, Androidswitches into power saving mode when the screen is turned off,which means, that less updates on the signal strength (onSignal-StrengthsChanged(SignalStrength sStrength)) are provided.For that reason, the screen has to be kept on during recording atrace.
3.2 ServerAfter recording a trace, the user has the ability to upload tracefiles to a server, either as a single trace or as a batch of traces on alater moment. Our server provides a simple HTTP end-point thatour application uses for uploading the traces. The server storesthe traces files on disk, but also comes with the option to uploadthe trace to a Dropbox folder. The source code of both, the mobileapplication and the server, are provided with the data set.
4 DATA RECORDINGWe used 4G LTE SIM Cards from the following cellular carriers:T-Mobile (US), T-Mobile (Germany), and Vodafone (Netherlands).
We recorded data mainly in California (USA), in Bavaria and Berlin(Germany), and all over the Netherlands. For each trace, meta-datawas selected in the app. Then, recording the trace was started andit was made sure that the screen did not turn off by setting thescreen-off-timer to 10 minutes. After the data was collected, thetrace was saved locally and then uploaded to the server.
Traces were recorded during all activities mentioned in the pre-vious section. However, stops due to traffic (for example in a car at ared light) or due to the type of transport (for example bus/train stopsto pick up people) could not be avoided. Nevertheless, this meansthat the traces represent realistic conditions. While we were inter-ested in LTE data for our research, in some cases the network typedropped out of 4G to lower bandwidths. We recorded values for 3Gdata as well as basic values for slower networks. Depending on thephone and chip or because of malfunctions during recording, theAPI may not provide all values. In this case, Integer.MIN_VALUEis recorded in the corresponding field.
5 DATA SET STRUCTUREWe describe our data set from two points of view - on the one handwe show how a single file is structured, on the other hand we showhow traces are distributed over different settings.
5.1 File StructureEach file consists of a header and a data section. The header containsmeta-data for the whole trace. A list of saved variables, their sourceof input (app/user), and their data-type and format are listed inTable 1. For each file, the start and end of the trace, the locationwhere the trace was started, as well as phone model and networkprovider are queried from the Android-API. In addition to that, theactivity while recording the trace, the area, and the environment,as well as a note are saved from user input via the GUI.
The data section consists of on average 2987 data rows repre-senting a 5 minute trace in 100 millisecond steps. Slight variationsin the number of data rows are a result of background processes onthe Android phones which could not be avoided. However, thesecan also be observed in real use cases while watching videos onsmart-phones. As can be seen in Table 2, the standard deviation
Table 1: Header data of a trace file
Variable input datatype/formatju fromrecordingStart app time (mm:ss.SSS)recordingEnd app datetime (format:
(yyyy-mm-dd hh:mm:ss.SSS))recordingActivity user stringrecordingArea user stringrecordingEnvironment user stringnote user stringcity app stringregion app stringcountry app stringphoneModel app stringnetworkProvider app string
389

MMSys’18, June 12–15, 2018, Amsterdam, Netherlands Britta Meixner, Jan Willem Kleinrouweler, and Pablo Cesar
Table 2: Data section of a trace file
Variable datatype min max mean median sdrow int 1 2993 2986.523 2987 1.8013currentTime datetime format: YYYY-MM-DD HH:MM:SS.mmmlongitude double -122.4154 13.46374 -7.6503 12.05898 44.8977latitude double 37.34431 52.55427 48.4865 48.91395 4.6065speed double 0 44.64 13.9471 10.37255 13.1583networkType string networkType ∈ {HSPA, HSPAP, LTE, UNKNOWN, NONE, EDGE, UMTS, GPRS}mcc int see Table 3mnc int see Table 3asu int 0 88 44.8105 44 12.2644power double 4.940656e-324 1e-08 0 1e-12 0dbm dbm -140 -52 -95.1895 -96 12.2644level int 1 4 3.2363 3 0.8775rsrq int -20 -3 -9.2718 -9 2.9777rsrp int -140 -52 -95.1895 -96 12.2644tac int 265 65535 21295.4 22006 14994.07enb int 60 16777215 106827 100125 450037.8eci int -1 230424321 24273109 25632011 15055960pci int 0 501 246.3232 250 134.0798earfcn int 1025 6400 3716.491 2300 2291.609
the number of rows is 1.8013, which makes the files comparable.Table 2 furthermore gives an overview of the recorded values. Welist all relevant fields for the LTE standard with their data-type.However, not all values are provided by the Android-API using aNexus 5X. In our case, these were band, rssnr, rssi, nid, cqi, lcid, ta,snr, and signalStrength2. We provide recorded minimum, maximum,mean, median, and standard deviation for each provided value (af-ter removing errors resulting in Integer.MIN_VALUE falsifying theresults).
5.2 Trace MetadataWe collected 377 traces with only LTE data, those are used in theremainder of this paper. Non-LTE tracesweremoved to extra foldersand are provided for the sake of completeness. Accordingly, thedata set contains overall 546 traces.
We did traces in mainly three countries and for two networkproviders. From the 377 traces, 120 were done in the Netherlands, 2in Italy, 205 in Germany, and 50 in the US. We used three differentSIM cards. One was a German T-Mobile SIM card, this was usedfor recording 210 traces. A Dutch Vodafone SIM card was usedfor recording 117 traces, and a US T-Mobile SIM card was usedfor recording 50 traces. An overview of countries and networkproviders can be found in Table 3 (as listed in [13]).
For the LTE traces, the following area settings were selected: I am(almost) alone (152). There are a few people around me (204). I am ina small crowd (city center, etc.) (7). I am in a big crowd (stadion, etc.)(14). For the environment settings we gathered: middle of nowhere(131), village (17), town (23), large town (92), city (21), large city (90),and metropolis (3). Taking a look at the activities indicating the
2What values are provided depends on the chip used in the phone, it may also varyfrom phone model to phone model and between API levels. In case more traces arerecorded, some of the values may become available.
Table 3: Traces by country (MMC) and network provider(MNC)
MCC country MNC network provider #samples #rec.204 NL 4 Vodafone Libertel 143278 48204 NL 16 T-Mobile B.V. 214764 72222 IT 10 Vodafone 5970 2262 DE 1 T-mobile/Telekom 411755 138262 DE 2 Vodafone D2 200127 67310 US 260 T-Mobile 149218 50
speed of movement, we have the following results: sitting/standing(37), walking (50), running (2), biking (2), in a car (261), in a bus(19), in a train (6), and none for biking (fast) and on a plane.
Figure 2 shows a summary of the data by area, activity, andenvironment. To give a better overview, traces with low numbersof samples are not displayed and related factors are shown as one(eg. village and middle of nowhere are summarized as rural). Itcan be noticed that most of the traces are recorded in a car orwhile walking. While traces during standing were recorded in mostenvironments, only few (valid) traces were recorded in buses.
5.3 Trace DataAs our data set contains a huge number of variables, we hereaftertake a closer look at two examplary distinct ones, RSRQ and speed.Taking a look at the RSRQ values, it can be noticed, that the data isnot normally distributed (see Figure 3d). The data shows a negativeskew which in case of RSRQ means that the signal quality wasbetter than average (-3 is very high quality, -20 very low quality).Figures 3a, 3b, and 3c show box-plots with the lower and upper
390

4G/LTE Channel Quality Reference Signal Trace Data Set MMSys’18, June 12–15, 2018, Amsterdam, Netherlands
Figure 2: Distribution of the traces by area, activity, and en-vironment.
quartile at 25% and 75% percent. It can be noticed that only slightdifferences exist between the factors in different groupings.
(a) RSRQ distribution by activities (b) RSRQ distribu-tion by areas
(c) RSRQ distribution by environments (d) Histogram for allRSRQ values
Figure 3: Visualization of RSRQ data by activities, areas, andenvironments.
Figure 4 shows the speed distributions that were measured whilerecording a trace. It can be noticed that the bus has a comparablylow speed, where the low quartile is at zero resulting from stops atbus stops. The median for driving a car is around 80 km/h. Whilewe tried to keep the phone as steady as possible, quick movementscaused some outliers. Those could be avoided in buses and cars,where recording a trace was done sitting.
Figure 4: Distribution of the traces by speed (in m/s) and en-vironment.
6 USE CASES FOR THE DATA SETWith this data set, we aim to support realistic simulations of theLTE channel conditions between base station and client device. Inthis section, we provide three use cases how our data set can beapplied.
QoS for video streaming. We use this data set ourselves to im-plement a Quality of Service (QoS) solution for adaptive videostreaming. Depending on the channel conditions, a modulationscheme with more or less data redundancy is used. The cost (as innetwork LTE resource blocks) to guarantee a certain throughput toa video client therefore strongly depends on the quality of the LTEsignal. When channel conditions are good, we allow video clientsto grow their buffer. When channel quality decreases, clients canrely on their buffer. We use the RSRQ values to estimate channelconditions between base station and client. We used the RSRQ val-ues in this data set to predict how channel conditions will evolve.Figure 5 shows how often the reference signal changes from onelevel to another. Using these predictions, we were able to computethe optimal buffering strategy. With this strategy we are also ableto reduce the overall network costs for video streaming.
Figure 5: Counting RSRQ level changes.
Correlations and Trends. We used the data for a first deeper anal-ysis towards trend prediction and correlation analysis. On the onehand, we tried to predict future trends in the RSRQ values usingsmoothing curves and their first and second deviations. With the
391

MMSys’18, June 12–15, 2018, Amsterdam, Netherlands Britta Meixner, Jan Willem Kleinrouweler, and Pablo Cesar
deviations we could calculate upward and downward trends. Onthe other hand, we tried to find correlations in our data set. We ex-pected a correlation between speed and LTE signal quality, but thecorrelation analysis did not confirm this assumption. This shows,that at this point in time, speed as reported by the mobile devicecannot be used to further improve the QoS for video streaming asdescribed in the previous paragraph.
Mobile Edge Cloud handovers. Mobile Edge Clouds (MEC) cur-rently receive a lot of attention in research. MEC provides com-puting resources close to the client, and thus greatly reducing thelatency between client and cloud. Users are often on the move whenusing mobile networks. As such, clients will roam between basestations. For MEC to be effective, the computing resources have totravel with the client. Our data set includes to which base station(eNodeB identifier in the enb field, and cell identifier in eci) theclient was connected. Combined with GPS locations, our data setcan be used to evaluate the flexibility of MEC computing and MEChandovers in many different scenarios.
7 CONCLUSIONS AND FUTUREWORKIn this paper, we present a toolkit for recording LTE channel qual-ity reference signals. We furthermore provide a data set with 377LTE traces containing 1125919 data samples. We collected data inthree countries and for two different network providers. With thedata set, we show first applications and analysis for our collecteddata. Our software as well as the data set are publicly available. Inorder to allow further and deeper analysis of the data, more tracesin additional countries and with SIM cards from further networkproviders are desirable. Due to the fact that we only had a Nexus 5Xfor recording our traces, we recommend to also use phones fromother manufacturers using a wider range of chips. In addition tothat, the traces are not evenly distributed over activities, areas, andenvironment. Accordingly, missing traces should be added to allowmore balanced analysis and comparisons.
REFERENCES[1] Ardalan Amiri Sani, Lin Zhong, and Ashutosh Sabharwal. 2010. Directional
Antenna Diversity for Mobile Devices: Characterizations and Solutions. InProceedings of the Sixteenth Annual International Conference on Mobile Com-puting and Networking (MobiCom ’10). ACM, New York, NY, USA, 221–232.https://doi.org/10.1145/1859995.1860021
[2] Eric Anderson, Caleb Phillips, Douglas Sicker, andDirk Grunwald. 2009. ModelingEnvironmental Effects on Directionality in Wireless Networks. In Proceedings ofthe 7th International Conference on Modeling and Optimization in Mobile, Ad Hoc,and Wireless Networks (WiOPT’09). IEEE Press, Piscataway, NJ, USA, 564–570.http://dl.acm.org/citation.cfm?id=1715782.1715868
[3] Eric W. Anderson and Caleb Phillips. 2009. CRAWDAD dataset cu/antenna (v.2009-05-08). Downloaded from https://crawdad.org/cu/antenna/20090508. (May2009). https://doi.org/10.15783/C7VC7V
[4] Eric Bergal, Caleb Philips, and Chingpu Wu. 2012. CRAWDAD dataset cu/lte (v.2012-05-04). Downloaded from https://crawdad.org/cu/lte/20120504. (May 2012).https://doi.org/10.15783/C7KW2N
[5] Cisco Systems, Inc. 2017. Cisco Visual Networking Index: Fore-cast and Methodology, 2016âĂŞ2021. https://www.cisco.com/c/en/us/solutions/collateral/service-provider/visual-networking-index-vni/complete-white-paper-c11-481360.html (accessed February 27, 2018). (2017).
[6] Quentin De Coninck, Matthieu Baerts, Benjamin Hesmans, and Olivier Bonaven-ture. 2016. CRAWDAD dataset uclouvain/mptcp_smartphone (v. 2016-03-04).Downloaded from https://crawdad.org/uclouvain/mptcp_smartphone/20160304.(March 2016). https://doi.org/10.15783/C7VG6H
[7] Quentin De Coninck, Matthieu Baerts, Benjamin Hesmans, and Olivier Bonaven-ture. 2016. A First Analysis of Multipath TCP on Smartphones. In 17th Interna-tional Passive and Active Measurements Conference, Vol. 17. Springer.
[8] P. Di Francesco, F. Malandrino, and L. A. DaSilva. 2017. Assembling and Using aCellular Dataset for Mobile Network Analysis and Planning. IEEE Transactionson Big Data PP, 99 (2017), 1–1. https://doi.org/10.1109/TBDATA.2017.2734100
[9] Fraida Fund, Cong Wang, Yong Liu, Thanasis Korakis, Michael Zink, and Shiv-endra Panwar. 2014. CRAWDAD dataset nyupoly/video (v. 2014-05-09). Down-loaded from https://crawdad.org/nyupoly/video/20140509. (May 2014). https://doi.org/10.15783/C7W30R
[10] F. Fund, C. Wang, Y. Liu, T. Korakis, M. Zink, and S. S. Panwar. 2013. Performanceof DASH andWebRTC Video Services for Mobile Users. In 2013 20th InternationalPacket Video Workshop. IEEE, 1–8. https://doi.org/10.1109/PV.2013.6691455
[11] Mohammad Hosseini, Yu Jiang, Ali Yekkehkhany, Richard R. Berlin, and LuiSha. 2017. A Mobile Geo-Communication Dataset for Physiology-Aware DASHin Rural Ambulance Transport. In Proceedings of the 8th ACM on MultimediaSystems Conference (MMSys’17). ACM, New York, NY, USA, 158–163. https://doi.org/10.1145/3083187.3083211
[12] Junxian Huang, Feng Qian, Alexandre Gerber, Z. Morley Mao, Subhabrata Sen,and Oliver Spatscheck. 2012. A Close Examination of Performance and PowerCharacteristics of 4G LTE Networks. In Proceedings of the 10th InternationalConference on Mobile Systems, Applications, and Services (MobiSys ’12). ACM, NewYork, NY, USA, 225–238. https://doi.org/10.1145/2307636.2307658
[13] interactive digital media GmbH. 2013. Mobile Country Codes (MCC) and MobileNetwork Codes (MNC). http://www.mcc-mnc.com/ (accessed February 27, 2018).(2013).
[14] Ashkan Nikravesh, Yihua Guo, Feng Qian, Z. Morley Mao, and Subhabrata Sen.2016. An In-depth Understanding of Multipath TCP on Mobile Devices: Mea-surement and System Design. In Proceedings of the 22Nd Annual InternationalConference on Mobile Computing and Networking (MobiCom ’16). ACM, New York,NY, USA, 189–201. https://doi.org/10.1145/2973750.2973769
[15] Ardalan Amiri Sani, Lin Zhong, and Ashutosh Sabharwal. 2010. CRAWDADdataset rice/midas (v. 2010-01-21). Downloaded from https://crawdad.org/rice/midas/20100121. (Jan. 2010). https://doi.org/10.15783/C7V30F
[16] Sayandeep Sen, Jongwon Yoon, Joshua Hare, Justin Ormont, and Suman Banerjee.2011. Can They Hear Me Now?: A Case for a Client-assisted Approach to Moni-toring Wide-area Wireless Networks. In Proceedings of the 2011 ACM SIGCOMMConference on Internet Measurement Conference (IMC ’11). ACM, New York, NY,USA, 99–116. https://doi.org/10.1145/2068816.2068827
[17] Smart Insights (Marketing Intelligence) Ltd. 2015. Mobile Marketing Sta-tistics compilation - Time Spent per Adult User per Day with Digital Me-dia - USA 2008 - 2015. https://www.smartinsights.com/mobile-marketing/mobile-marketing-analytics/mobile-marketing-statistics/ (accessed February 27,2018). (2015).
[18] Statista, Inc. 2014. Online Video Boom Leads to Surge in Data Traffic. https://www.statista.com/chart/2349/consumer-data-traffic-2013-to-2018/ (accessedFebruary 27, 2018). (2014).
[19] Statista, Inc. 2018. Mobile share of total digital minutes in leading on-line markets as of May 2017. https://www.statista.com/statistics/266379/mobile-share-of-digital-minutes-countries/ (accessed February 27, 2018). (2018).
[20] Narseo Vallina-Rodriguez, Andrius Auçinas, Mario Almeida, Yan Grunenberger,Konstantina Papagiannaki, and Jon Crowcroft. 2013. RILAnalyzer: A Compre-hensive 3G Monitor on Your Phone. In Proceedings of the 2013 Conference onInternet Measurement Conference (IMC ’13). ACM, New York, NY, USA, 257–264.https://doi.org/10.1145/2504730.2504764
[21] Wikipedia, The Free Encyclopedia. 2017. Settlement hierarchy. (2017). https://en.wikipedia.org/wiki/Settlement_hierarchy (accessed December 1, 2017).
[22] Jongwon Yoon, Sayandeep Sen, and Joshua Hare. 2012. CRAWDAD datasetwisc/wiscape (v. 2012-08-03). Downloaded from https://crawdad.org/wisc/wiscape/20120803. (Aug. 2012). https://doi.org/10.15783/C71C7D
[23] J. Yoon, S. Sen, J. Hare, and S. Banerjee. 2015. WiScape: A Framework for Mea-suring the Performance of Wide-Area Wireless Networks. IEEE Transactions onMobile Computing 14, 8 (Aug 2015), 1751–1764. https://doi.org/10.1109/TMC.2014.2360391
392
Related Documents