Document from the collections of the AAMC Not to be reproduced without permission 4 c ASSCCIATION OF AMERICAN MEDICAL COLLEGES 2450 N STREET NW WASHINGTON, DC 200371127 PHONE 202-828-0400 FAX 202-828-1125 HTTPWWWW.AAMC.ORG Impact of BBA on COTH-Member, General, Acute, Non -Federal Hospitals Accompanied by slide citations What would have happened to the total margins of COTH-member hospitals in 1996 if all Medicare indirect medical education (IME) and disproportionate share (DSH) payments had been removed? In fiscal year 1996, the median total margin for COTH-member hospitals was 4%. However, when entire DSH and IME payments are removed from revenue the median total margin of these hospitals would have been —2%. While the impact of removing DSH and IME payments from the revenue of other teaching and non -teaching hospitals would have been noticeable, it would have been far less significant (Slide 8). Similarly, 59% of COTH-member hospitals would have experienced negative margins if DSH and IME payments were removed from revenue in 1996 compared to 37% for other teaching hospitals and 25% for the non -teaching hospitals (Slide 9). How much revenue will a typical COTH-member hospital lose when the BBA is in full effect? When estimated BBA Medicare payments are compared to estimates of what Medicare payments would have been had the BBA not been enacted ("status quo"), the result is a cumulative loss of $45.8 million in Medicare support for a typical COTH hospital between 1998 and 2002. Other teaching hospitals are projected to lose $16.5 million and non -teaching hospitals are projected to lose a cumulative $8.8 million (Slide 12). * Year-to-year comparisons of the BBA versus the "status quo" show that a typical COTH hospital will lose increasing amounts of Medicare support each year from 1998 to 2002 (Slide 11). In the year 2002 alone, the estimated losses for a typical COTH hospital will total $12.6 million over and above the impact of prior years. While BBA reductions in Prospective Payment System (PPS) payments will be significant, the greatest source of funding losses will come from combined reductions in IME and DSH payments (Slide 11). For other hospitals, the reduction in PPS payments is the greatest source of reduced funding. What is the combined impact of all currently projected BBA provisions on the financial status of a typical COTH-member, other teaching and non -teaching hospital from 1996 to 2002? The AAMC projects that Medicare reductions resulting from the BBA could result in the total margin for a typical COTH hospital falling by as much as half or more by 2002. In

Welcome message from author
This document is posted to help you gain knowledge. Please leave a comment to let me know what you think about it! Share it to your friends and learn new things together.
Transcript
Document from the
collections of th
e AAMC Not to be reproduced without permission
4c ASSCCIATION OFAMERICANMEDICAL COLLEGES
2450 N STREET NW WASHINGTON, DC 200371127PHONE 202-828-0400 FAX 202-828-1125HTTPWWWW.AAMC.ORG
Impact of BBA on COTH-Member, General, Acute, Non-Federal HospitalsAccompanied by slide citations
What would have happened to the total margins of COTH-member hospitals in1996 if all Medicare indirect medical education (IME) and disproportionate share(DSH) payments had been removed?
In fiscal year 1996, the median total margin for COTH-member hospitals was 4%.However, when entire DSH and IME payments are removed from revenue the mediantotal margin of these hospitals would have been —2%. While the impact of removingDSH and IME payments from the revenue of other teaching and non-teaching hospitalswould have been noticeable, it would have been far less significant (Slide 8).
Similarly, 59% of COTH-member hospitals would have experienced negative margins ifDSH and IME payments were removed from revenue in 1996 compared to 37% for otherteaching hospitals and 25% for the non-teaching hospitals (Slide 9).
How much revenue will a typical COTH-member hospital lose when the BBA is infull effect?
When estimated BBA Medicare payments are compared to estimates of what Medicarepayments would have been had the BBA not been enacted ("status quo"), the result is acumulative loss of $45.8 million in Medicare support for a typical COTH hospitalbetween 1998 and 2002. Other teaching hospitals are projected to lose $16.5 million andnon-teaching hospitals are projected to lose a cumulative $8.8 million (Slide 12). *
Year-to-year comparisons of the BBA versus the "status quo" show that a typical COTHhospital will lose increasing amounts of Medicare support each year from 1998 to 2002(Slide 11). In the year 2002 alone, the estimated losses for a typical COTH hospital willtotal $12.6 million over and above the impact of prior years.
While BBA reductions in Prospective Payment System (PPS) payments will besignificant, the greatest source of funding losses will come from combined reductions inIME and DSH payments (Slide 11). For other hospitals, the reduction in PPS paymentsis the greatest source of reduced funding.
What is the combined impact of all currently projected BBA provisions on thefinancial status of a typical COTH-member, other teaching and non-teachinghospital from 1996 to 2002?
The AAMC projects that Medicare reductions resulting from the BBA could result in thetotal margin for a typical COTH hospital falling by as much as half or more by 2002. In

Document from the
collections of th
e AAMC Not to be reproduced without permission
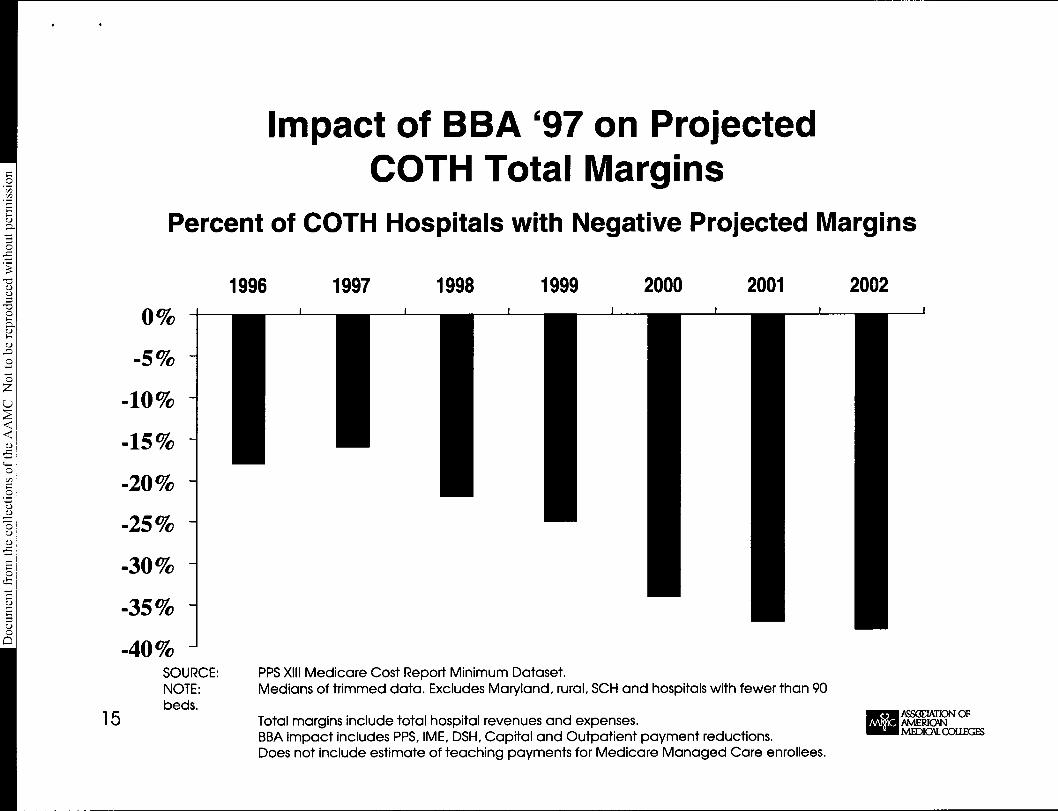
1996 -- a year prior to full BBA implementation -- the COTH teaching hospital mediantotal margin was 4%. In 2002, the median total margin is expected to drop to 1.6% (Slide14). In addition, 38% of COTH-member hospitals, almost 100 institutions, could facenegative total margins by 2002 (Slide 15).
In contrast, the median total margins of other teaching hospitals and non-teachinghospitals would drop by 1.5% between 1996 and 2002 (Slide 17). In 2002, roughly 25%of other teaching hospitals and non-teaching hospitals are projected to have negativemargins (Slide 18).
What is the combined impact of all currently projected BBA provisions on thefinancial status of a typical major teaching hospital from 1996 to 2002?
The median total margins of institutions with an intern and resident to bed ratio (IRB) of.25 or greater could fall from 3% in 1996 to 0.3% by 2002. Total margins for hospitalswith IRB ratios of less than .25 could fall from 5.5% in 1996 to 3.9% in 2002 (Slide 20).Forty-seven percent of the hospitals with IRB ratios of .25 or greater could face negativetotal margins by 2002 or sooner (Slide 21).
*The AAMC analysis of the impact of the BBA included inpatient and outpatient PPS, disproportionateshare, IME, capital payments, transfer changes, and formula-driven overpayment. The analysis did notinclude provisions affecting PPS-exempt units, skilled nursing facilities, home health care agencies, or themedical education payments returned to teaching hospitals by Medicare managed care.
2

4c
roduced without p
ASSCEIATION OFAMERICANMEDICAL COLLEGES
Assessing the Impact of theBalanced Budget Act of 1997 (BBA '97)
on the Financial Statusof COTH Member Hospitals
Ernest Valente, Ph.D.00 Karen Fisher, J.D.8
Robert D'Antuono
Division of Health Care Affairs
Association of American Medical Colleges
April, 1999
4c
roduced without p
he collections of th
e AAMC Not to be r
1W3(_:2_c_tLment from
ASSMATION OFAMERICANMEDICAL COLLEGES
Assessing the Impact of theBalanced Budget Act of 1997 (BBA '97)
on the Financial Statusof COTH Member Hospitals
METHODOLOGICAL DETAILS:
What was the analytical approach?
What data were used?
What assumptions were made for the analysis?

roduced without permission
he collections of th
e AAMC Not to be r
Impact of BBA '97 Provisions on FinancialStatus of COTH Member Hospitals:
Analysis Plan
BBA PROVISIONS ANALYTICAL APPROACH
• INPATIENT • MARGIN ANALYSIS— PPS Update Reductions — Margins less all IME and DSH
— DSH Reductions — Projected Margins Under BBA
— IME Multiplier Reductions • REVENUE REDUCTION— Capital Payment Reductions PROJECTIONS— Change in Transfer — Project Status Quo and BBA
Definition PPS Standardized Operating
• OUTPATIENT Amounts
— FDO Elimination — Project IME and DSH
— Outpatient PPSReductions
— Project Other BBA Provisionsas Possible
3 4c AASSmKel OF

roduced without p
he collections of th
e AAMC Not to be r
4
Impact of BBA '97 Provisions on FinancialStatus of COTH Member Hospitals:BBA Provisions Included in Analysis
BBA Provision Fully Provisionally Not IncludedProjected Projected
PPS Update X
DSH X
IME X
Transfers X
Outliers
Medicare Mgd. Care
Capital X
FDO X
Outpatient X
Bad Debt
PPS Excluded Subprov(Psych., Rehab.)SNF UnitsHospital-Based HHAs
X
X
X
X
X
AC ASSGEIATION OFAMERICANMEDICAL (XXLEGES
roduced without permission
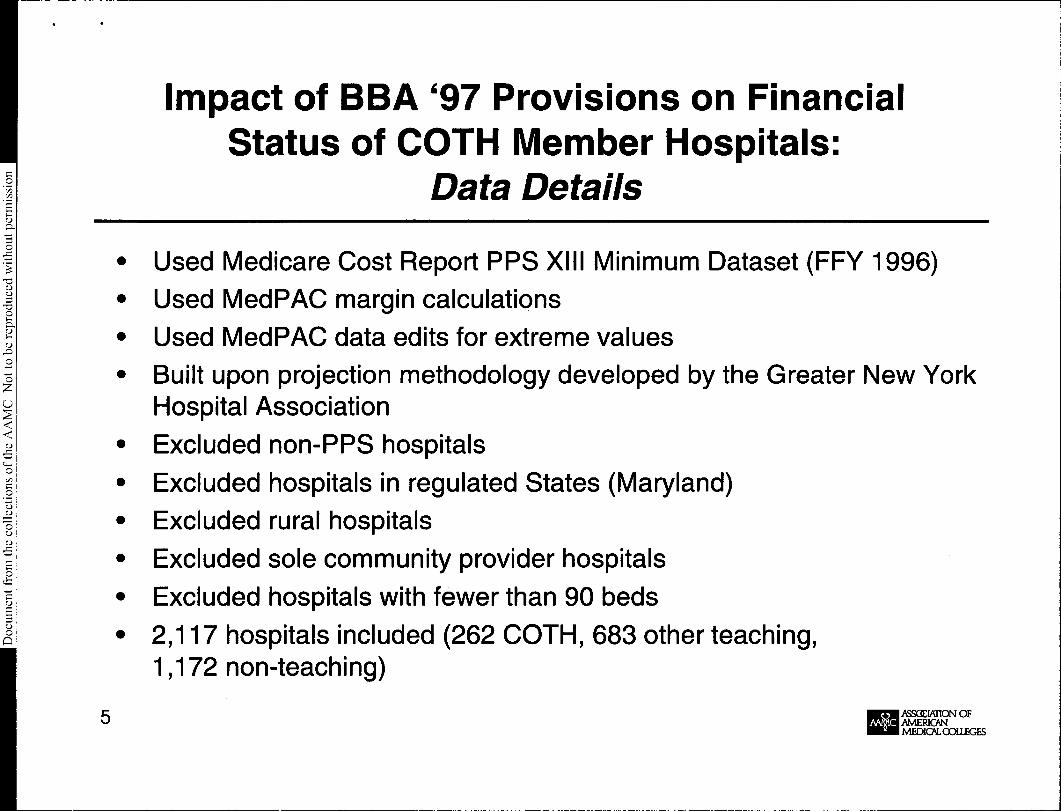
Impact of BBA '97 Provisions on FinancialStatus of COTH Member Hospitals:
Data Details
5
• Used Medicare Cost Report PPS XIII Minimum Dataset (FFY 1996)
• Used MedPAC margin calculations
• Used MedPAC data edits for extreme values
• Built upon projection methodology developed by the Greater New YorkHospital Association
• Excluded non-PPS hospitals
• Excluded hospitals in regulated States (Maryland)
• Excluded rural hospitals
• Excluded sole community provider hospitals
• Excluded hospitals with fewer than 90 beds
• 2,117 hospitals included (262 COTH, 683 other teaching,1,172 non-teaching)
4c ASSUEIATION OFAMERICANMEDICAL COUEGES

roduced without p
he collections of th
e AAMC Not to be r
Impact of BBA '97 Provisions on FinancialStatus of COTH Member Hospitals:
Assumptions
• Assumed Constant 1996 - 2002:
6
— Non-Medicare Market Conditions
— Casemix Index (used FFY1 1999)
— Area Wage Index (used FFY 1999)
— IRB Ratio (used FFY 1996)
— Outlier Payments as a Percent ofOther Than Outlier Payments (usedCRY2 1996)
— IME Payments as a Percent of PPSDRG Payments (used CRY1996)
— DSH Payments as a Percent of PPSDRG Payments (used CRY 1996)
1Federal Fiscal Year2Cost Report Year (Hospital Fiscal Year)
• Assumed to Increase at HCFAProjected Market Basket Rate:— Status Quo Inpatient Revenues and
Expenses (PPS and Total)
— Non-Medicare Inpatient Revenue
— Medicare and non-Medicare Costs
— Status Quo Outpatient Payments
• Other Assumptions:— Medicare Admissions Increase by
HCFA Projections
iSmS ON OFERIGEIA1c2N
MEDICAL COLLEGES

ASSMATION OFAMERICANMEDICAL COLLEGES
Assessing the Impact of theBalanced Budget Act of 1997 (BBA '97)
on the Financial Statusof COTH Member Hospitals
BACKGROUND:
What would have happened to 1996 TotalMargins if ALL Medicare Indirect Medical
Education (IME) and Disproportionate Share8 (DSH) payments were excluded from revenue?

roduced without p
he collections of th
e AAMC Not to be r
Median FY 1996 Total MarginsCOTH, Other Teaching, Non-Teaching
Margins when entire DSH and IME payments are removed
E9 1996 Actual
DSH removed
• IME removed
El DSH & IME
Other Teaching Non-Teaching
SOURCE: PPS XIII Medicare Cost Report Minimum Dataset.NOTE: Medians of trimmed data. Excludes Maryland, rural, SCH and hospitals with fewer than 90beds.
Total margins include total hospital revenues and expenses.
4c ASSGEJATION OFAMERICANMEDICAL COUEGES

roduced without permission
he collections of th
e AAMC Not to be r
Median FY 1996 Total MarginsCOTH, Other Teaching, Non-Teaching
Percent of Hospitals with Positive and Negative Marginswhen entire DSH and IME payments are removed
100%
75%
50%
25%
0%
-25%
-50%
-75%
-100%
Actual
M•••••I•••IM•MIM•MI•••1•••I•••1
111 DSH Removed IME Removed
OMNIMEMME•IME•1MEWME•I
•••I•••I•••IOMNI•••1
DSH + IME
COTH=grid/vertical, other teaching=squares/diagonal, non-teaching=gray/blacl
SOURCE: PPS XIII Medicare Cost Report Minimum Dataset.
9 NOTE: Medians of trimmed data. Excludes Maryland, rural, SCH and hospitals with fewer than 90beds.
Total margins include total hospital revenues and expenses.
4c ASSGEIATION OFAMERICANMEDICAL COLLEGES

4c, ASSOEIATION OFAMERICANMEDICAL COLLEGES
Assessing the Impact of theBalanced Budget Act of 1997 (BBA '97)
on the Financial Statusof COTH Member Hospitals
BBA IMPACT:
How much revenue will the typical hospital losewhen BBA 1997 is in full effect?
8

roduced without p
he collections of th
e AAMC Not to be r
11
Impact of BBA '97 on Hospital Financial Status
Cumulative Financial Impact of BBA '97 on Typical COTH Hospital1998-2002
Millions
$0
-$5 --$10 -
-$15 -
-$20 -
-$25 -
-$30 -
-$35 -
-$40 -
-$45 -
-$50 -
1998 1999 2000 2001 2002
SOURCE: PPS XIII Medicare Cost Report Minimum Dataset. .NOTE: Difference between projected payments under "status quo" and "BBA" scenarios.
ALL includes PPS, IME, DSH, Capital and Outpatient payment reductions.
2: DSH
m IMEE2 PPS
• ALL
MCASSGEATION OFAMERICANMEDICAL COLLEGES
,

roduced without p
he collections of th
e AAMC Not to be r
12
Impact of BBA '97 on Hospital Financial StatusCOTH, Other Teaching, Non-Teaching
Cumulative Financial Impact on Typical Hospital, 1998-2002
Millions$0
410 -
-$20 -
-$30 -
-$40 -
-$50
-i-
COTH
B3 PPS -$16.4
✓ I ME -$15.0
O DSH -$2.7
• ALL -$45.8
OTHER NON-TEACHING
-$8.2 -$5.0
-$1.5 $0.0
-$0.5 -$0.2
-$16.5 -$8.8
SOURCE: PPS XIII Medicare Cost Report Minimum Dataset.NOTE: Difference between projected payments under "status quo" and "BBA" scenarios.
ALL includes PPS, IME, DSH, Capital and Outpatient payment reductions. 4cMI NON OF
MEDICAL COLLEGES

4c
roduced without p
ASSUEIATION OFAMERICANMEDICAL COLLEGES
Assessing the Impact of theBalanced Budget Act of 1997 (BBA '97)
on the Financial Statusof COTH Member Hospitals
BBA IMPACT ON COTH HOSPITALS:
What is the combined impact of all currentlyprojected BBA '97 provisions on the financialstatus of a typical COTH member hospital
81996 -2002?

roduced without p
he collections of th
e AAMC Not to be r
Impact of BBA '97 on Projected MedianCOTH Total Margins
5% -
4%
3% -
2% -
1% -
0%
1996
i
1997 1998 1999 2000 2001 2002
SOURCE: PPS XIII Medicare Cost Report Minimum Dataset.NOTE: Medians of trimmed data. Excludes Maryland, rural, SCH and hospitals with fewer than 90beds.
14 Total margins include total hospital revenues and expenses.BBA impact includes PPS, IME, DSH, Capital and Outpatient payment reductions.Does not include estimate of teaching payments for Medicare Managed Care enrollees.
4CASSGEIATION OFAMERICANMEDICAL COLLEGES
roduced without permission
he collections of th
e AAMC Not to be r
Impact of BBA '97 on ProjectedCOTH Total Margins
Percent of COTH Hospitals with Negative Projected Margins
0%
-5%
-10%
-15%
-20%
-25%
-30%
-35%
-40%
1996 1997 1998 1999 2000 2001 2002
SOURCE: PPS XIII Medicare Cost Report Minimum Dataset.NOTE: Medians of trimmed data. Excludes Maryland, rural, SCH and hospitals with fewer than 90beds.
Total margins include total hospital revenues and expenses.BBA impact includes PPS, IME, DSH, Capital and Outpatient payment reductions.Does not include estimate of teaching payments for Medicare Managed Care enrollees.
4CASSGBIATION OFAMERIOVNIMEDICAL COLLEGES

4c
roduced without p
ASSMATION OFAMERICANMEDICAL COLLEGES
Assessing the Impact of theBalanced Budget Act of 1997 (BBA '97)
on the Financial Statusof COTH Member Hospitals
BBA IMPACT ON COTH, OTHER TEACHING,AND NON-TEACHING HOSPITALS:
Does BBA '97 differentially affect the financialstatus of COTH hospitals, other teaching
8 hospitals, and non-teaching hospitals?

roduced without permission
he collections of th
e AAMC Not to be r
1 % -
0%
Impact of BBA '97 on ProjectedMedian Total Margins, 1996-2002
COTH, Other Teaching, Non-Teaching
NON-TEACHING
COTH OTHER
1996 1997 1998 1999 2000 2001 2002
SOURCE: PPS XIII Medicare Cost Report Minimum Dataset.NOTE: Medians of trimmed data. Excludes Maryland, rural, SCH and hospitals with fewer than 90beds.
Total margins include total hospital revenues and expenses.BBA impact includes PPS, IME, DSH, Capital and Outpatient payment reductions.Does not include estimate of teaching payments for Medicare Managed Care enrollees.
4CASSGUAT' ION OFAMERICANMEDICAL COLLEGES

roduced without p
he collections of th
e AAMC Not to be r
Impact of BBA '97 on ProjectedTotal Margins, 1996-2002
COTH, Other Teaching, Non-Teaching
Percent of Hospitals with Positive and Negative Projected Margins
100%
25%
50%
0%
.••••• •• ..•• •• .••• .• •••• .• .•••
.11 111 11 11 1 1:•••••••••••••.•••••N •a •••• .. ••••
I I
••
••••••••EN••••••••
•• •••• •••• E•
I I
M•MNM•••EN•O••••
••
11
75%
-50%
-75% 1996 1997 1998 1999 2000 2001 2002
-100% . „ . . , 1COTH=grid/vertical, other teaching=squares/diagonal, non-teaching=gray/blac
SOURCE: PPS XIII Medicare Cost Report Minimum Dataset.NOTE: Medians of trimmed data. Excludes Maryland, rural, SCH and hospitals with fewer than 90beds.
Total margins include total hospital revenues and expenses.BBA impact includes PPS, IME, DSH, Capital and Outpatient payment reductions.Dniqs nnt inc.11 JC1 nstimntn nf tpcinhinn nnvmAntg fnr MAciinnrp MnnnnAri CnrA AnrnlIAAs
ASSGEIATION OFAMERICANMEDICAL COLLEGES

4c
roduced without p
ASSOEIATION OFAMERICANMEDICAL COLLEGES
Assessing the Impact of theBalanced Budget Act of 1997 (BBA '97)
on the Financial Statusof COTH Member Hospitals
BBA IMPACT ON COTH AND OTHERTEACHING HOSPITALS:
What is the combined impact of all currentlyprojected BBA '97 provisions on the financial
status of a typical hospita1,1996 -2002?8
HOSPITALS WITH IRB RATIO GREATER OR LESS THAN .25

roduced without p
he collections of th
e AAMC Not to be r
Impact of BBA '97 on Projected MedianTotal Margins
Hospitals with IRB Ratios Greater than or Less Than .25
1% -
0%
<.25 IRB RATIO
>.25 IRB RATIO
1996 1997 1998 1999 2000 2001 2002SOURCE: PPS XIII Medicare Cost Report Minimum Dataset.NOTE: Medians of trimmed data. Excludes Maryland, rural, SCH and hospitals with fewer than 90beds.
Total margins include total hospital revenues and expenses.BBA impact includes PPS, IME, DSH, Capital and Outpatient payment reductions.Does not include estimate of teaching payments for Medicare Managed Care enrollees.
4CA&SGEIATION OFAMERICANMEDICAL COLLEGES

roduced without p
he collections of th
e AAMC Not to be r
21
0%
-10%
-20%
-30%
-40%
-50%
Impact of BBA '97 on ProjectedTotal Margins
Percent of Hospitals with Negative Projected MarginsHospitals with IRB Ratios Greater than or Less Than .25
1996 1997 1998 1999 2000 2001 2002
• IRB Ratio >.25 IRB Ratio <15
SOURCE: PPS XIII Medicare Cost Report Minimum Dataset.NOTE:beds.
Medians of trimmed data. Excludes Maryland, rural, SCH and hospitals with fewer than 90
Total margins include total hospital revenues and expenses.BBA impact includes PPS, IME, DSH, Capital and Outpatient payment reductions.Does not include estimate of teaching payments for Medicare Managed Care enrollees.
ASSGEIATION OFAMF-RICANMEDICAL COLLEGES
Related Documents