EXHIBIT A5 BEFORE THE PUBLIC UTILITIES COMMISSION OF THE STATE OF SOUTH DAKOTA IN THE MATTER OF THE APPLICATION BY PREVAILING WIND PARK, LLC FOR A PERMIT FOR A WIND ENERGY FACILITY IN BON HOMME, CHARLES MIX, AND HUTCHINSON COUNTIES, SOUTH DAKOTA, FOR PREVAILING WIND PARK ENERGY FACILITY SD PUC DOCKET EL-18-026 PREFILED REBUTTAL TESTIMONY OF DR. MARK ROBERTS ON BEHALF OF PREVAILING WIND PARK, LLC September 26, 2018 004941

Welcome message from author
This document is posted to help you gain knowledge. Please leave a comment to let me know what you think about it! Share it to your friends and learn new things together.
Transcript

EXHIBIT A5
BEFORE THE PUBLIC UTILITIES COMMISSION OF THE STATE OF SOUTH DAKOTA
IN THE MATTER OF THE APPLICATION BY PREVAILING WIND PARK, LLC FOR A PERMIT FOR A WIND ENERGY FACILITY IN BON HOMME, CHARLES MIX,
AND HUTCHINSON COUNTIES, SOUTH DAKOTA, FOR PREVAILING WIND PARK ENERGY FACILITY
SD PUC DOCKET EL-18-026
PREFILED REBUTTAL TESTIMONY OF DR. MARK ROBERTS
ON BEHALF OF PREVAILING WIND PARK, LLC
September 26, 2018
004941

1
I. INTRODUCTION 1
2
Q. Please state your name. 3
A. My name is Dr. Mark Roberts. 4
5
Q. Did you provide Supplemental Direct Testimony in this Docket? 6
A. Yes. I submitted Supplemental Direct Testimony in this docket on August 10, 2018. 7
8
Q. What is the purpose of your Rebuttal Testimony? 9
A. The purpose of my Rebuttal Testimony is to respond to the testimony of Professor 10
Mariana Alves-Pereira, Jerry Punch, Ph.D., and Richard James, each of whom 11
submitted testimony on behalf of Intervenors in this docket. 12
13
Q. Are there any exhibits attached to your Rebuttal Testimony? 14
A. The following exhibits are attached to my Rebuttal Testimony: 15
• Exhibit 1: Ministry for the Environment, Climate and Energy of the Federal 16
State of Baden-Wuerttemberg, Germany (2016). Low-frequency Noise Incl. 17
Infrasound from Wind Turbines and Other Sources. LUBW Landesanstalt fur 18
Umwelt, Messungen and Naturschutz Baden-Wuerttemberg. 19
• Exhibit 2: Akira Shimada and Mimi Nameki (2017). Evaluation of Wind 20
Turbine Noise in Japan. Ministry of the Environment of Japan. 21
• Exhibit 3: Danish Energy Agency (2009). Wind Turbines in Denmark. 22
• Exhibit 4: Frits van den Berg, Public Health Service Amsterdam, and Irene 23
van Kamp, National Institute for Public Health and the Environment (2017). 24
Health effects related to wind turbine sound. Swiss Federal Office for the 25
Environment. 26
• Exhibit 5: Stephen Chiles (2010). A new wind farm noise standard for New 27
Zealand, NZS 6808:2010. Proceedings of 20th International Congress on 28
Acoustics, ICA 2010. 29
004942

2
• Exhibit 6: Eja Pedersen, Högskolan i Halmstad (2003). Noise Annoyance 116 30
from Wind Turbines: A Review. Swedish Environmental Protection Agency. 31
• Exhibit 7: Hitomi Kimura, Yoshinori Momose, Hiroya Deguchi, and Nameki, 32
Mimi (2016). Investigation, Prediction, and Evaluation of Wind Turbine Noise 33
in Japan. Ministry of the Environment of Japan. 34
• Exhibit 8: C. Yan, K. Fu and W. Xu. On Cuba, diplomats, ultrasound, and 35
intermodulation distortion. University of Michigan Tech Report. March 1, 36
2018. 37
• Exhibit 9: Crichton, F., et al. (2014). The link between health complaints and 38
wind turbines: Support for the nocebo expectations hypothesis. Frontiers in 39
Public Health 2:220. 40
• Exhibit 10: Enck, P., et al. “New Insights Into the Placebo and Nocebo 41
Responses,” Neuron (July 31, 2008): Vol. 59, No. 2, pp. 195–206. 42
• Exhibit 11: Colloca, L. (2017). Nocebo effects can make you feel pain: 43
Negative expectancies derived from features of commercial drugs elicit 44
nocebo effects. Science, 358(6359): 44. 45
46
II. RESPONSE TO TESTIMONY OF PROFESSOR MARIANA ALVES-PEREIRA 47
48
A. Overview. 49
50
Q. Have you reviewed the Prefiled Testimony of Prof. Mariana Alves-Pereira, 51
submitted on behalf of Intervenors in this proceeding? 52
A. Yes. I reviewed Prof. Alves-Pereira’s testimony, as well as the exhibits attached to 53
her testimony. 54
55
004943
3
Q. Please summarize your response to Prof. Alves-Pereira’s testimony. 56
A. As I discussed in my Supplemental Direct Testimony, I am aware of Prof. Alves-57
Pereira’s assertions regarding vibroacoustic disease. A majority of the work 58
involving vibroacoustic disease has originated from Dr. Castelo Bronca’s research 59
group in Portugal, of which Prof. Alves-Pereira is a member. A majority of the 60
research group’s efforts have focused on low frequency sound at high levels (e.g., 61
120 decibels and above, well above the sound levels of wind turbines). Their work 62
has not been replicated by other research groups to the point where vibroacoustic 63
disease has been accepted as a medical diagnosis. As I discussed previously, 64
based on my work and review of reliable scientific literature, I am not aware of any 65
link between wind turbines and what Prof. Alves-Pereira describes as vibroacoustic 66
disease. 67
68
B. Scientific Method. 69
70
Q. Professor Alves-Pereira references the scientific method and evidence-based 71
medicine in her testimony. (Alves-Pereira Direct, lines 63-66.) Please describe 72
these concepts. 73
A. I previously discussed the scientific method in detail in my Supplemental Direct 74
Testimony. To summarize, during a clinical encounter between a patient and a 75
physician, medical information is collected and analyzed. First, the physician will 76
note the patient’s report of symptoms and concerns. That consists of what the 77
patient says he or she is experiencing. This may include the patient’s attribution of 78
their symptoms (headache, dizziness, upset stomach, etc.) to some event or activity. 79
This is often referred to as the “subjective” information and refers to what the patient 80
reports. Next, the physician attempts to obtain information that will verify or clarify 81
the patient’s reported symptoms or concern (objective information). This verification 82
consists of probing questions to clarify the information and includes assessment of 83
past medical history (previous injury or illness), collection of information during the 84
physical examination, and testing (laboratory and or imaging). Next, the physician 85
assesses the subjective information and the objective evidence and compares this 86
004944

4
information with the physician’s clinical experience, training, and other medical 87
knowledge to arrive at a diagnosis and a plan for treatment. In common conditions 88
(flu, high blood pressure, gastrointestinal conditions, etc.), the physician will usually 89
have sufficient experience to make the diagnosis without going into the published 90
literature. In other cases, the physician may need to gather additional information or 91
refer the patient on to a specialist. 92
93
For an example of this process: Patient comes to the doctor with severe headache 94
and is concerned that he might have a brain tumor. The doctor does not 95
immediately schedule the patient for brain surgery but instead evaluates the patient 96
in an orderly process that rules in or rules out the presence of a brain tumor. The 97
physician evaluates what the patient reports, the outcome of the physical 98
examination and tests or imaging, then assesses this information, makes a 99
diagnosis, and develops a treatment plan. 100
101
Q. Prof. Alves-Pereira asserts that “[w]hen it comes to studying the health effects 102
of ILFN exposure, however, these fundamental axioms of the Scientific Method 103
and Evidence-based Medicine are somehow forgotten, or deemed not 104
applicable.” (Alves-Pereira Direct, lines 68-70.) What is your response? 105
A. I do not agree. The publications attached to my Supplemental Direct Testimony and 106
this Rebuttal Testimony utilize the scientific method. Despite Prof. Alves-Pereira’s 107
assertions otherwise, it is not sufficient to take the patient’s reported health concerns 108
and immediately draw a conclusion regarding causation without including an 109
evaluation of objective evidence and appropriate peer-reviewed, published literature. 110
The key point is to look at the “evidence” – that is, objective findings from a clinical 111
evaluation conducted by a physician that bases opinions based on data that has 112
passed review. 113
114
Q. Prof. Alves-Pereira states that “[a]nnoyance is not an objective parameter and 115
hence, in accordance with the axioms of Evidence-based Medicine, cannot be 116
004945

5
used to ascertain de facto health effects.” (Alves-Pereira Direct, lines 77-78.) 117
What is your response? 118
A. I agree. This statement is consistent with my prior testimony and the fact that 119
“annoyance” is the most commonly recognized “effect” in the applicable peer-120
reviewed published literature and the reviews by scientific committees that I have 121
previously identified. Annoyance in and of itself is not a health effect but instead is a 122
normal physiological response to one’s surroundings. As I have testified many times 123
before, one person’s music can be perceived as an annoying noise by another 124
person. It is the perception of the noise that often makes it annoying - not the noise 125
itself. I note, however, that Prof. Alves-Pereira’s statement here seems inconsistent 126
with the remainder of her testimony. She appears to transform complaints of 127
annoyance into objective health issues solely because the complaints were 128
described to a doctor. 129
130
Q. Prof. Alves-Pereira states that, “[i]n accordance with the axioms of Evidence-131
based Medicine and, even more fundamentally, the Scientific Method, 132
psychosomatic illnesses must also be clinically corroborated; their proposed 133
existence based on mere assertions is not scientifically valid.” (Alves-Pereira 134
Direct, lines 83-86.) What is your response? 135
A. Again, I agree. This statement is entirely consistent with my testimony and well-136
accepted peer-reviewed literature. However, it is not consistent with the remainder 137
of Prof. Alves-Pereira’s testimony, where she indicates that a person’s report of 138
illness is sufficient for there to be the documented occurrence of a health issue 139
related to wind turbines. 140
141
Q. Prof. Alves-Pereira discusses the scientific validity of self-reported health 142
complaints in lines 134-50 of her testimony. Do you have a response? 143
A. Yes. Prof. Alves-Pereira’s discussion is not consistent with the normal clinical 144
process I have previously described in this testimony. Self-reported health 145
complaints are certainly part of the clinical process, but they do not become 146
scientifically valid simply because they are reported to a physician. Rather, as I 147
004946

6
discussed previously, a patient’s self-reported health complaints are subjective 148
information – they are one part of the clinical evaluation process, but a patient’s 149
recitation of a series of subjective symptoms to a physician does not make those 150
symptoms objective evidence. Prof. Alves-Pereira uses the term anamnesis to 151
bolster her argument. Although a medical term, the term anamnesis simply refers 152
to the patient history as described by the patient. It does not confer special 153
verification. Again, in the normal clinical process, the physician takes what the 154
patient reports, what is identified from the physical examination along with any 155
laboratory testing or imaging results, and compares this information to his or her 156
clinical experience, training, and current medical information to make a diagnosis, if 157
possible, and set out a treatment plan, or refers the patient on to a specialist for 158
further assessment. 159
160
C. Infrasound and Wind Turbines. 161
162
Q. Prof. Alves-Pereira discusses infrasound and low-frequency noise, or “IFLN.” 163
What is infrasound? 164
A. As I described in my Supplemental Direct Testimony, infrasound is sometimes 165
referred to as “low frequency” sound and is sound that is between 0 hertz (“Hz”) and 166
20 Hz. A level of 20 Hz is commonly considered to be the low end of the range of 167
human hearing. It is very important to specify the sound because the human ear 168
responds differently to different frequencies. 169
170
Q. What are sources of infrasound? 171
A. As I noted in my Supplemental Direct Testimony, human organs produce infrasound. 172
For example, heart sounds are in the range of 27 to 35 dBA at 20-40 Hz, and lung 173
sounds are reported in the range of 5-35 dBA at 150-600 Hz; these sources are in 174
the range of sound produced by wind turbines. In addition, infrasound comes from 175
numerous natural and man-made sources. With respect to natural sources, waves, 176
thunder, and waterfalls are natural sources of infrasound. With respect to man-177
004947

7
made sources, common household objects such as washing machines, fans and 178
heating and refrigeration systems are also sources of infrasound. 179
180
Q. Professor Alves-Pereira discusses infrasound, particularly that from wind 181
turbines, and its potential impacts on human health. Are you aware of any 182
recent studies on this topic? 183
A. Yes. Researchers in the United States (Massachusetts) (2012) (Roberts 184
Supplemental Direct Testimony, Exhibit 7), Germany (2016) (Exhibit 1), Japan 185
(2017) (Exhibit 2), France (2017) (Roberts Supplemental Direct Testimony, Exhibit 186
3), Denmark (2009) (Exhibit 3), Switzerland (2017) (Exhibit 4), New Zealand (2010) 187
(Exhibit 5), Sweden (2003) (Exhibit 6), and Australia (2015) (Roberts Supplemental 188
Direct Testimony, Exhibit 2c) have reviewed the literature regarding infrasound from 189
wind turbines. Each study, using recognized scientific methods, concluded that 190
infrasound levels are multiple orders of magnitude below the threshold of human 191
hearing. For example, the 2016 German study concluded that “[t]he infrasound 192
levels generated by [wind turbines] lie clearly below the limits of human perception. 193
There is no scientifically proven evidence of adverse effects in this level range.” 194
(Exhibit 1, at 12.) Similarly, the Ministry of the Environment of Japan’s 2016 study 195
Investigation, Prediction, and Evaluation of Wind Turbine Noise in Japan states that, 196
“Super-low (below 20 Hz) frequency range components of wind turbine noise are at 197
imperceptible levels. Therefore, wind turbine noise is not an issue caused by super-198
low frequency range.” (Exhibit 7, at 5760.) These are just a few of the reports of 199
expert panels at state, national, and international levels that have not found a 200
specific health condition associated with wind turbines. 201
202
An independent review of the literature relative to wind turbines and health was 203
commissioned by the National Health and Medical Research Council (“NHMRC”) 204
with the goal of determining whether there was an association between exposure to 205
wind farms and human health effects. The document is approximately 300 pages 206
and covers peer-reviewed, published literature, government reports, and some lay 207
publications. The overall conclusions of this extensive review were: 208
004948

8
“[t]here is no consistent evidence that noise from wind 209 turbines―whether estimated in models or using distance as 210 a proxy―is associated with self-reported human health 211 effects. Isolated associations may be due to confounding, 212 bias or chance.” (Roberts Supplemental Direct Testimony, 213 Exhibit 2c.) 214 215
Most recently, the March 2017 French National Agency for Food Safety, 216
Environment and Labor (“ANSES”) carried out measurement campaigns near three 217
wind farms. A summary of this study is included as Exhibit 3 of my Supplemental 218
Direct Testimony (the original study is in French). The summary notes that the study 219
concluded: 220
• “the results of these campaigns confirm that wind turbines are sources of 221
infrasound and low sound frequencies, but no exceedance of the audibility 222
thresholds in the areas of infrasound and low frequencies up to 50 Hz has 223
been found”;1 and 224
• “all the experimental and epidemiological data available today do not show 225
any health effects related to exposure to noise from wind turbines, other than 226
noise-related annoyance.” 227
(Roberts Supplemental Direct Testimony, Exhibit 3.) 228
229
Q. Do you agree with the ANSES conclusions? 230
A. Yes. They are consistent with the peer-reviewed literature on wind turbine noise. 231
232
Q. In response to the question, “[w]hy are some people affected and others not 233
within the same household” regarding infrasound, Prof. Alves-Pereira 234
1 French Agency for Food, Environmental and Occupational Health & Safety, Exposure to low-frequency sound and infrasounds from wind farms: improving information for local residents and monitoring noise exposure (Mar. 30, 2017), https://www.anses.fr/en/content/exposure-low-frequency-sound-and-infrasounds-wind-farms-improving-information-local; see also Roberts Supplemental Direct Testimony, Exhibit 3.
004949

9
discusses “two exposure-linked factors.” (Alves-Pereira Direct, lines 180-88.) 235
Do you have a response? 236
A. Yes. First, without evidence, Prof. Alves-Pereira asserts that individuals are 237
negatively affected by infrasound. Second, Prof. Alves-Pereira makes the assertion 238
that two “exposure-linked factors” “profoundly condition the onset of symptoms 239
among families living in ILFN-contaminated homes.” She identifies these factors as 240
“prior ILFN exposure histories” and “residential time exposure patterns.” Although 241
these phrases may sound official and technical, they are not. Prof. Alves-Pereira 242
provides no scientific support for her assertions, and I am not aware of any. We are 243
all exposed to all sorts of sounds all the time. None of the reviews by governmental 244
organizations and other groups of scientists impaneled to review the material relative 245
to wind turbine sound and health effects have referenced the process of “exposure-246
linked processes” that Prof. Alves-Pereira has used. 247
248
Q. In response to the same question, Prof. Alves-Pereira then discusses 249
“individual susceptibility factors.” (Alves-Pereira Direct, line 189.) Do you 250
agree? 251
A. No. As with her assertions regarding “exposure-linked factors,” Prof. Alves-Pereira 252
provides no scientific support for her statements, and I am not aware of any. 253
254
Q. Prof. Alves-Pereira states that she and her group are collecting data regarding 255
wind turbines, including “conducting extensive interviews among the 256
complaining populations.” (Alves-Pereira Direct, line 214.) What are your 257
thoughts on these statements? 258
A. Prof. Alves-Pereira’s statements demonstrate the serious flaws of her described 259
“study.” It is hard to evaluate the study without reading it, but Prof. Alves-Pereira’s 260
reliance on “complaining populations” without comparison to noise exposure 261
measurements and her evaluation of common everyday health issues has been 262
repeated by many researchers opposed to wind energy, starting with Prof. Nina 263
Pierpont. This method of research is fraught with bias that cannot be overcome. 264
Prof. Alves-Pereira appears to have already concluded that her research is going to 265
004950
10
find adverse health impacts from wind turbines. As such, she is only conducting 266
interviews with complaining persons. However, the research she describes collects, 267
at best, anecdotal information. As I have stated time and again, interviewing 268
complaining populations is not an epidemiological study and does not follow the 269
scientific method that must be followed to move from an observation, to correlation, 270
and ultimately to causal proof. 271
272
Q. Prof. Alves-Pereira asserts that “[s]afe distances have not yet been 273
established for the IFLN generated by wind turbines.” Do you agree with this 274
conclusion? 275
A. No. Again, Prof. Alves-Pereira implies that there are adverse health effects from 276
wind turbines, but she fails to back up these claims with scientific data. Put simply, 277
adverse health effects have not been linked to infrasound generally or to infrasound 278
generated by wind turbines, more specifically. 279
280
D. Prof. Alves-Pereira’s Statements Regarding My Supplemental Direct 281
Testimony. 282
283
Q. Prof. Alves-Pereira asserts that your testimony treats wind turbines, rather 284
than infrasound, as “agents of disease.” Do you agree? 285
A. No. Prof. Alves-Pereira misunderstands my testimony and my opinions. What I 286
have clearly stated is that the peer-reviewed, published literature and the results of 287
numerous reviews of that literature do not indicate that infrasound at the levels 288
generated by a wind turbine is an “agent of disease.” I certainly have not confused 289
these concepts, as Prof. Alves-Pereira appears to believe. However, the literature 290
also clearly identifies the presence of wind turbines as a point of annoyance for 291
some individuals. 292
293
Q. Prof. Alves-Pereira asserts that “studies comparing people who live near wind 294
turbines with those who do not” are not scientifically valid. (Alves-Pereira 295
Direct, lines 314-15.) Do you agree? 296
004951
11
A. No, not at all. The cornerstone of an epidemiological study – and the scientific 297
method – is the fact that there is a comparison group. It is critical to have a 298
comparison group to determine whether there is an increase in health factors – 299
subjective or objective. This is especially important with respect to issues like wind 300
turbine effects, where there are subjective complaints with the overlay of annoyance. 301
302
Q. Professor Alves-Pereira asserts that “receiving 10 chest x-rays per day for a 303
year, might indeed begin to pose a problem in terms of health effects. It is the 304
same with IFLN.” (Alves-Pereira Direct, lines 363-64.) Do you agree? 305
A. This is not a valid comparison. There is a significant body of reliable, published, 306
peer-reviewed literature regarding the adverse effects of x-rays, starting with 307
Madame Curie. By contrast, there is no evidence that the sound levels generated by 308
wind turbines cause specific health effects, let alone any health effects separate and 309
distinct from the infrasound we are exposed to in our environment 24 hours a day. 310
311
E. Discussion of Certain Exhibits to Professor Alves-Pereira’s 312
Testimony. 313
314
Q. Prof. Alves-Pereira attaches a document titled Neurological Manifestations 315
Among US Government Personnel Reporting Directional Audible and Sensory 316
Phenomena in Havana, Cuba as Exhibit 3 to her testimony (“Havana Paper”). 317
Are you familiar with the Havana Paper? 318
A. Yes. The “Havana Paper” is a brief description of health investigations of U.S. 319
government personnel serving on diplomatic assignment in Havana, Cuba, that they 320
experienced “neurological symptoms” thought to be associated with exposure to 321
auditory and sensory phenomena in 2016 and 2017. 322
323
Q. In your opinion, does the Havana Paper provide the Commission with helpful 324
information related to this Project? 325
A. No. Prof. Alves-Pereira asserts that the symptoms reported by the Cuban diplomats 326
“are very similar to those made by families living in ILFN-contaminated homes.” 327
004952
12
This assertion is not well-founded. Diplomatic staff complained of a high-pitched 328
noise. Researchers at the University of Michigan analyzed audio records provided 329
by the United States Department of State. The researchers’ analysis indicated that 330
the sound recording in the Cuba Embassy was a mixture of high frequency sound 331
(ultrasound) in the thousands of Hz range. The sound identified as potentially 332
affecting Cuban diplomats was thousands of times higher than the frequencies 333
generated by wind turbines. (Yan, et al. 2018, Exhibit 8.) Prof. Alves-Pereira’s 334
comparison of the Cuban Embassy investigation is misguided and inapt. 335
336
Q. Prof. Alves-Pereira attaches a document titled Occupational and Residential 337
Exposures to Infrasound and Low Frequency Noise in Aerospace 338
Professionals: Flawed Assumptions, Inappropriate Quantification of Acoustic 339
Environments, and the Inability to Determine Dose-Response Values as 340
Exhibit 4 to her testimony (“Aerospace Paper”). Are you familiar with the 341
Aerospace Paper? 342
A. Yes. The Aerospace Paper is co-authored by Prof. Alves-Pereira and asserts, as 343
Prof. Alves-Pereira does in her testimony, that the dBA metric is not adequate to 344
protect against excessive infrasound exposure. 345
346
Q. In your opinion, does the Aerospace Paper provide the Commission with 347
helpful information related to this Project? 348
A. No. This paper focuses on the noise levels associated with the aerospace industry, 349
which are orders of magnitude greater that the noise levels measured at wind farms. 350
The graphs shown in that paper are illustrating levels of 70+ decibels. In addition, 351
under the disclaimer on page 96 of the paper, the authors state that they “[a]re not 352
producing an environmental noise assessment report focused on wind turbines.” 353
354
004953

13
Q. Prof. Alves-Pereira attaches a document titled Infrasound and Low Frequency 355
Noise: Shall we Measure it Properly? as Exhibit 5 to her testimony (“ILFN 356
Paper”). Are you familiar with the ILFN Paper? 357
A. Yes. As Prof. Alves-Pereira notes, it is a “more informal paper” that described her 358
fieldwork in Ireland. 359
360
Q. In your opinion, does the ILFN Paper provide the Commission with helpful 361
information related to this Project? 362
A. No. The paper lacks significant information needed to assess it. First, the testing 363
does not report background levels of low frequency sound in the homes. Secondly, 364
there is no indication of the type of wind turbine or power output that could give the 365
reader an indication of the contribution of these factors. The report uses a set of 366
observations that are not adequately described to bolster Prof. Alves-Pereira’s 367
claims regarding low frequency noise measurements. In addition, the report does 368
not appear to have been published, which would have subjected it to peer review. 369
370
Q. Prof. Alves-Pereira attaches a document titled An Evaluation of 371
Environmental, Biological, and Health Data from the Island of Vieques, Puerto 372
Rico as Exhibit 6 to her testimony (“Vieques Paper”). Are you familiar with the 373
Vieques Paper? 374
A. Yes. 375
376
Q. In your opinion, does the Vieques Paper provide the Commission with helpful 377
information related to this Project? 378
A. No. The Vieques Paper highlights how the investigation of public health events can 379
be performed but sheds no light on the questions regarding wind turbines and 380
health. It does, however, highlight the fact that the claim made by the Portuguese 381
reseach group that there was a high level of vibroacoustic disease among Vieques 382
fisherman was not confirmed by an independent review panel. Rather, the 383
independent review panel determined, after conducting blind-coding and repetition of 384
004954

14
that analysis by Mayo Clinic, that there was no evidence to indicate clinically 385
significant heart disease. (Alves-Pereira Direct, Exhibit 6 at A-52.) 386
387
Q. Prof. Alves-Pereira attaches a document titled Vibroacoustic Disease: 388
Biological effects of infrasound and low-frequency noise explained by 389
mechanotransduction cellular signalling as Exhibit 7 to her testimony (“2006 390
VAD Paper”). Are you familiar with the 2006 VAD Paper? 391
A. Yes. 392
393
Q. In your opinion, does the 2006 VAD Paper provide the Commission with 394
helpful information related to this Project? 395
A. No. As noted by the researchers in the 2006 VAD Paper, there has been “much 396
controversy and acrimonious debate over whether or not acoustical phenomena can 397
cause extra-auditory effects on living organisms.” In addition, it is not evident from a 398
review of the published literature that the findings, referred to as vibroacoustic 399
disease or “VAD” by these researchers, has been confirmed by others or generally 400
accepted by medical or acoustical professions. There are no epidemiologically-401
sound studies that have found what these researchers refer to as vibroacoustic 402
disease associated with wind turbines. The fact that there is not widespread 403
acceptance is evidenced by the fact that the International Classification of Disease 404
10th Edition (“ICD-10”) does not list vibroacoustic disease. The ICD-10 is the tenth 405
revision of the codes for recognized diseases, health complaints, and causes for 406
disease and injury listed by the World Health Organization and is used by the 407
National Center for Health Statistics to code and classify illness and deaths in the 408
United States. The ICD-10 classification lists over 14,000 major diseases and 409
injuries but can be expanded to 70,000 codes when the major categories are 410
expanded. 411
412
004955
15
Q. Prof. Alves-Pereira attaches a document titled Vibroacoustic Disease I: The 413
Personal Experience of a Motorman as Exhibit 8 to her testimony (“Motorman 414
Paper”). Are you familiar with the Motorman Article? 415
A. Yes. This is a layperson’s account of a presumed occupational exposure to low-416
frequency sound. 417
418
Q. In your opinion, does the Motorman Article provide the Commission with 419
helpful information related to this Project? 420
A. No. The Motorman Article is a layperson’s opinion and has no scientific data to 421
contribute to a discussion about wind turbines. 422
423
Q. Prof. Alves-Pereira attaches a document titled Vibroacoustic Disease and 424
Respiratory Pathology III – Tracheal and Bronchial Lesions as Exhibit 9 to her 425
testimony (“VAD Respiratory Paper”). Are you familiar with the VAD 426
Respiratory Paper? 427
A. Yes. This is a case series published by Prof. Alves-Pereira’s research group. It is a 428
report of the results of biopsies of the respiratory tract of four individuals (two of 429
whom were smokers), three of whom were employed in occupations involving 430
aviation, and all of whom had been diagnosed with what Prof. Alves-Pereira terms 431
vibroacoustic disease. As pointed out earlier, case series are not epidemiological 432
studies. 433
434
Q. In your opinion, does the VAD Respiratory Paper provide the Commission with 435
helpful information related to this Project? 436
A. No. This paper has nothing to do with wind turbines. It also does not follow the 437
scientific method of risk evaluation – there is no objective assessment of intensity, 438
duration, or frequency of low-frequency noise exposure that would identify whether 439
any of the individuals experienced low-frequency noise above normal background 440
levels. In addition, there is no assessment of the individuals’ occupational history, 441
which could have included chemical exposures that adversely affect the upper 442
004956

16
respiratory system and potentially produce cell damage similar to that described in 443
the case series. 444
445
Q. Prof. Alves-Pereira attaches a document titled Vibroacoustic Disease in a Ten 446
Year Old Male as Exhibit 10 to her testimony (“2004 VAD Paper”). Are you 447
familiar with the 2004 VAD Paper? 448
A. Yes. 449
450
Q. In your opinion, does the 2004 VAD Paper provide the Commission with 451
helpful information related to this Project? 452
A. No. This is a case report of claimed low-frequency noise exposure, but it is not clear 453
that the source was identified, nor was the sound level quantified sufficiently to 454
support the claimed effect. Once again, a “diagnosis” of what Prof. Alves-Pereira 455
describes as vibroacoustic disease is made when, in fact, this is not a clinically 456
recognized medical condition beyond the Portuguese researchers. 457
458
F. Conclusion Regarding Prof. Alves-Pereira’s Testimony. 459
460
Q. What is your overall impression of Prof. Alves-Pereira’s Testimony? 461
A. Prof. Alves-Pereira has not established that the peer-reviewed, published literature 462
has documented a health problem associated with low-frequency sound at the levels 463
generated by wind turbines, let alone that low-frequency sound from any source 464
causes such health problems. 465
466
III. RESPONSE TO TESTIMONY OF JERRY PUNCH, Ph.D. 467
468
Q. Have you reviewed the Prefiled Testimony of Jerry L. Punch submitted on 469
behalf of Intervenors in this matter? 470
A. Yes. I reviewed the testimony submitted by Dr. Punch, as well as the exhibits 471
attached to that testimony. 472
473
004957

17
A. 2016 Punch and James Paper. 474
475
Q. On page 4 of his testimony, Dr. Punch references an article he authored titled 476
Wind turbine noise and human health: a four-decade history of evidence that 477
wind turbines pose risks, which he attaches as Exhibit 2 to his testimony (the 478
“2016 Punch and James Paper”). Are you familiar with the 2016 Punch and 479
James Paper? 480
A. Yes. I have observed this article on a number of anti-wind websites and seen it 481
produced at various hearings. It is not consistent with the opinions of local, state, 482
national, and international panels of experts who have reviewed the peer-reviewed, 483
scientific publications related to wind turbines and health effects. 484
485
Q. Dr. Punch states that the 2016 Punch and James Paper was peer reviewed. Do 486
you agree? 487
A. No. A summary of the 2016 Punch and James Paper describes the purported “peer 488
review” of this paper as follows: 489
This paper has been reviewed both by the anonymous Noise 490 & Health reviewer and by three other reviewers who have 491 substantial professional experience in the area of wind 492 turbine noise. We gratefully acknowledge the helpful 493 contributions of Keith Johnson, Esq., Michael Nissenbaum, 494 MD, and Daniel Shepherd, PhD. 495 496 Mr. Johnson provided a review from the perspective of an 497 attorney who represents interveners in wind turbine siting 498 cases. Dr. Nissenbaum provided a review from the 499 perspective of a medical professional and expert in how 500 ionizing and non-ionizing radiation affects humans. Dr. 501 Shepherd provided a review from the perspective of a 502 psychoacoustician with experience in how wind turbine 503 sound affects people. Each of these reviewers’ comments on 504 earlier versions of our manuscript led to the final document. 505 The opinions or assertions contained herein, however, are 506 the personal views of the authors and are not to be 507
004958

18
construed as reflecting the views of Michigan State 508 University or Central Michigan University.2 509
510
This does not describe the typical level of rigorous peer review I would expect before 511
labeling a report “peer reviewed.” A law degree is not recognized as a science 512
degree and, notably, Mr. Johnson is described as representing opponents to wind 513
projects. It is also notable that Dr. Nissenbaum is on the Board of Directors of “The 514
Society for Wind Vigilance,” which is a well-known and decidedly anti-wind group.3 515
Similarly, Dr. Shepherd is one of that group’s “Scientific Advisors.”4 As such, these 516
“reviewers” may have been predisposed to agreeing with Dr. Punch and with groups 517
opposed to wind energy. 518
519
Q. In your opinion, does the 2016 Punch and James Paper provide the 520
Commission with helpful information with respect to this Project? 521
A. No. The stated goal of the article is to “provide a systematic review of legitimate 522
sources that bear directly and indirectly on the question of the extent to which WT 523
noise leads to the many health complaints that are being attributed to it.” The 524
authors state that they used Google, Google Scholar, and PubMed for this 525
information. I note that a Google search regarding wind turbines and health effects 526
returns millions of results, which are not consistently reviewed or otherwise fact-527
checked. The scientific alternative is the U.S. National Library of Medicine, National 528
Institute of Medicine’s PubMed, which comprises more than 28 million citations for 529
biomedical literature from MEDLINE, life science journals, and online books. My 530
PubMed search of “wind turbines health effects” on September 23, 2018, returned 531
only 54 articles in the scientific literature. In my experience, there is a lot of 532
2 See National Wind Watch: Presenting the Facts about Industrial Wind Power website link, available at https://www.wind-watch.org/documents/wind-turbine-noise-and-human-health-a-four-decade-history-of-evidence-that-wind-turbines-pose-risks/ (last accessed Sept. 19, 2018). 3 Dr. Punch’s co-author, Richard James, is also on this Board of Directors. Similarly, Drs. Phillips, Salt, and Thorne, each of whom are quoted in the 2016 Punch and James Paper, are “Scientific Advisors” to The Society of Wind Vigilance and have each written opinion pieces against wind turbines. 4 See http://www.windvigilance.com/home/advisory-group (last accessed Sept. 19, 2018).
004959
19
“information” in the lay press, internet, or word of mouth, but very little of it is 533
objective scientific evidence. 534
535
Q. Dr. Punch states: “I believe that a substantial proportion of people living in the 536
vicinity of the proposed Project can be expected to experience not only 537
annoyance, but also a variety of adverse health effects.” Do you agree? 538
A. No. Dr. Punch’s “belief” is not a scientifically-validated conclusion. His “belief” is 539
also not supported by the published, peer-reviewed literature on this topic, as I 540
discussed in my Supplemental Direct Testimony. Annoyance is not a health effect 541
but a normal, everyday psychological and physiological response often manifested 542
when a person does not like or does not agree with something occurring in his or her 543
life. For example, a baby crying may be reassuring to a mother that the baby is 544
breathing, is hungry, or needs its diaper changed, but a crying baby on an airplane 545
may be annoying to some fellow passengers. 546
547
Q. Dr. Punch asserts that the 2016 Punch and James Paper “indicate[s] that there 548
is a strong association between exposure to wind turbines and the health 549
complaints, and they strongly suggest that the link is causative.” (Punch 550
Direct, lines 150-52.) Do you agree? 551
A. No. Based on Dr. Punch’s testimony, he is not relying upon evidence from 552
epidemiological studies conducted using the scientific method. To the extent Dr. 553
Punch is referring to the process of asking individuals if they experienced health 554
conditions before wind turbines were installed, this is not a reliable study method, as 555
I have previously discussed (e.g., recall bias). 556
557
Q. Dr. Punch states that “general causation and specific causation . . . differ 558
based on the targets of interest: the general population versus targeted 559
individuals, respectively.” (Punch Direct, lines 159-60.) Do you agree with this 560
characterization? 561
A. No, Dr. Punch is not correct. General causation refers to the science that identifies 562
the cause of disease - the risk factors or characteristics generally associated with 563
004960

20
the development of a disease. Specific causation refers to the determination that an 564
individual has the risk factors or characteristics associated with the disease or health 565
condition at a sufficient level to reasonably conclude the cause of an individual’s 566
disease or health condition. 567
568
B. Dr. Punch’s Statements Regarding My Supplemental Direct 569
Testimony. 570
571
Q. Dr. Punch states that your “testimony rests primarily on [your] credentials in 572
epidemiology and apparently not on [your] first-hand experience with people 573
who have been exposed to wind turbine noise over long periods of time.” 574
(Punch Direct, lines 175-77.) Do you have a response? 575
A. Dr. Punch appears to misunderstand what qualifies someone to evaluate an 576
exposure situation based on the scientific method. I spent 17 years in the Oklahoma 577
State Department of Health. During most of that time, I evaluated health concerns 578
involving communicable and environmentally-related disease for Oklahoma 579
residents. I use the same scientific method to evaluate health concerns anytime I 580
am asked to evaluate a potential exposure situation, regardless of the purported 581
cause. 582
583
Q. Dr. Punch also states that you “essentially dismiss[ ] most of the nine 584
[Bradford Hill] criteria by naming them, without discussing their implications.” 585
(Punch Direct, lines 180-81.) What are the Bradford Hill criteria? 586
A. The “Bradford Hill” criteria were proposed by Sir Austin Bradford Hill in 1965. They 587
are a set of nine criteria to provide epidemiologic evidence of a causal relationship 588
between a presumed cause and an observed effect when the association of cause 589
and effect are sufficiently identified. In other words, the criteria are used to evaluate 590
the strength of an association between a disease and its supposed causative agent. 591
Sir Bradford Hill made it clear in his 1965 Presidential Address at the Royal Society 592
of Medicine where he stated “Disregarding then any such problem in semantics we 593
have this situation. Our observations reveal an association between two variables, 594
004961

21
perfectly clear-cut and beyond what we would care to attribute to the play of chance. 595
What aspect of that association should we especially consider before deciding that 596
the most likely interpretation of it is causation?” Sir Bradford Hill then went on to list 597
his nine criteria. 598
599
Q. What is your response to Dr. Punch’s assertion that you “dismissed” the 600
Bradford Hill criteria? 601
A. I disagree. My assessment methods are consistent with the Bradford Hill criteria. It 602
is apparent from the peer-reviewed, published research that specific health effects 603
have not been proven to be associated with sounds produced by wind turbines. 604
605
Q. Dr. Punch cites a paper prepared by Dr. Carl Phillips. Are you familiar with Dr. 606
Phillips? 607
A. Yes. Despite Dr. Punch’s statement otherwise, Dr. Phillips is not an epidemiologist. 608
Instead, he holds a Ph.D. in public policy and is a “Scientific Advisor” to the Society 609
for Wind Vigilance.5 As I noted earlier, this is a well-known anti-wind group. 610
611
Dr. Phillips’ arguments center on the opinion that there is sufficient “scientific 612
evidence” that wind turbines cause a multitude of symptoms and disease for 613
residents living nearby. The basis of his opinion is that “people can observe that the 614
noise from the turbines seems to be bothering them, and can surmise that what they 615
are noticing may be causing their disease.” While this sort of information provides 616
impetus to explore what might be the underlying health issues and concerns, it does 617
not confirm a causal pathway. It is, at most, an association that requires careful 618
evaluation and hypothesis testing. An observation of noise that one concludes is 619
bothersome does not necessarily translate into a cause of disease without objective 620
measurements. As I have discussed previously, others who have done these kinds 621
of objective measurements have, in fact, not found any causal relationship between 622
wind turbines and adverse health effects. 623
5 See http://www.windvigilance.com/home/advisory-group/bio_phillips, last accessed Sept. 19, 2018.
004962

22
624
C. The Nocebo Effect. 625
626
Q. Dr. Punch attempts to critique your discussion of the “nocebo effect.” What is 627
the nocebo effect? 628
A. The nocebo effect is the recognized human response to a negative belief or 629
impression. For example, if a patient does not think that a medication will be 630
effective, there is a high probability that the medication will not be effective. Nocebo 631
is the opposite of placebo, which is the normal response observed where, when a 632
person thinks a medication will be effective, it is more likely to be effective. The 633
nocebo effect has been described as follows: “When individuals expect a feature of 634
their environment or medical treatment to produce illness or symptoms, then this 635
may start a process where the individual looks for symptoms or signs of illness to 636
confirm these negative expectations.” (Crichton, et al. 2014, Exhibit 9.) 637
638
Q. What is the relevance of the nocebo effect to this proceeding? 639
A. There is clear evidence in the medical literature regarding both the placebo effect 640
and nocebo effect. (Meissner 2011.) It is real, and it is key to understanding health 641
complaints about phenomena that occur around us. Research going back decades 642
indicates that one’s perception dictates the physical and emotional response. The 643
development of social media and the internet has only intensified this focus. 644
Research into recent events such as the Boston Marathon bombing and Sandy 645
Hook shootings have shown that media coverage has broadened the extent of the 646
psychological effect. (Holman 2014.) One has to look no farther than the internet to 647
find a litany of health complaints attributed to wind turbines with little or no scientific 648
bases. When you are “told” that you are going to get sick, you become more 649
cognizant of everyday occurrences. (Fasse 2012.) A quick search of the internet 650
produces stressful and often unfounded negative assertions about wind turbines. 651
652
Q. Dr. Punch states that, in the 2016 Punch and James Paper, he and his co-653
author concluded that it is most plausible that “a variety of adverse reactions 654
004963

23
are physiological effects caused directly or indirectly from exposure to low-655
frequency sound and infrasound from wind turbines.” (Punch Direct, lines 656
259-61 (emphasis in original).) Do you agree? 657
A. No. Neither Dr. Punch nor Mr. James is a physician. I do not find it convincing that 658
they can determine the cause of a health complaint simply by evaluating an 659
individual’s claim. As I have discussed multiple times herein, there is an 660
established, well-recognized scientific method for conducting this type of research. 661
Dr. Punch has not followed that scientific method. 662
663
Q. Dr. Punch states that, “[w]hile psychological expectations and the power of 664
suggestion can influence perceptions of the effects of wind turbine noise on 665
health status, no scientifically valid studies have yet convincingly shown that 666
psychological forces are the major driver of such perceptions.” (Punch Direct, 667
lines 261-64.) What is your response? 668
A. Dr. Punch’s statement is not true and demonstrates a lack of basic understanding 669
about the psychological factors associated with human response. Even a cursory 670
review of the literature negates this argument. For example, in a paper published by 671
Enck, et al. 2008 (Exhibit 10), the authors state: “The latest scientific evidence has 672
demonstrated, however, that the placebo effect and the nocebo effect, the negative 673
effects of placebo, stem from highly active processes in the brain that are mediated 674
by psychological mechanisms such as expectation and conditioning.”6 More 675
recently, a paper was published in 2017 exploring the concept that negative 676
expectations result in nocebo (perceived negative) effects.7 In this paper, the author 677
describes the nocebo effect as the effect of negative expectations. 678
679
Q. Dr. Punch states, “I believe that most of these adverse reactions are mediated 680
by disturbances of the hearing and balance mechanisms of the inner ear 681
6 Enck P, et al. “New Insights Into the Placebo and Nocebo Responses,” Neuron (July 31, 2008): Vol. 59, No. 2, pp. 195–206. (Exhibit 10.) 7 Colloca, L. 2017. Nocebo effects can make you feel pain: Negative expectancies derived from features of commercial drugs elicit nocebo effects. Science, 358(6359): 44. (Exhibit 11.)
004964

24
resulting from the low-frequency noise emitted by industrial wind turbines.” 682
(Punch Direct, lines 276-78.) Do you agree? 683
A. No. Dr. Punch provides no scientific support for his belief. I am not aware of any 684
human data showing that wind turbines have a biological effect on the inner ear. 685
686
D. Conclusion Regarding Testimony of Dr. Punch. 687
688
Q. What is your overall impression of Dr. Punch’s testimony? 689
A. A review of the peer-reviewed, published data does not support Dr. Punch’s general 690
statement about health effects being attributed to the noise of wind turbines. In 691
addition, his attempts to support his opinions about specific mechanisms of adverse 692
health effects that he attributes to wind turbine noise are not reflected in the science 693
related to noise and human hearing or in the numerous reviews of the published 694
scientific works by local, state, national, and international health organizations. 695
696
IV. RESPONSE TO TESTIMONY OF RICHARD JAMES 697
698
Q. Mr. James references Steven Cooper’s Cape Bridgewater study. Are you 699
familiar with this study? 700
A. Yes. I believe Mr. James is referring to a study performed in Australia in 2014. It 701
was an evaluation of three households (six adults) who had previously lodged 702
multiple complaints with the wind turbine operator relative to noise levels of the Cap 703
Bridgewater Wind Farm. The individuals had reported subjective complaints relative 704
to the wind farm for more than six years prior to participating in the evaluation. 705
706
Q. Do you believe that the Cape Bridgewater study supports any conclusion 707
regarding the potential health effects of low frequency sound from wind 708
turbines? 709
A. No. The Cape Bridgewater study has not been peer-reviewed, and its methodology 710
flaws make the evaluation’s results suspect and unreliable: 711
004965

25
• Because Mr. Cooper evaluated individuals who have already made 712
complaints about the wind farm, there was a selection bias in who 713
participated in the study. With respect to selection bias, the selection of 714
six individuals who had previously complained about wind turbine 715
operations would have added the effects of recall bias into the study, 716
meaning that the study individuals had already formed an opinion, which 717
would have a direct effect on their reporting of subjective sensations. 718
More simply, individuals who have already reported complaints are more 719
likely to continue to do so. 720
• The evaluation includes no reference group (or “control group”) to 721
compare the results of the six individuals’ subjective reports. A reference 722
group is the hallmark of an epidemiological study. A researcher cannot 723
reliably evaluate a complaint about turbine operations, or any other stimuli, 724
without having both a group that is exposed to the operations and one that 725
is not to determine if there is a difference in effects that could be attributed 726
to the stimuli. 727
• In an appropriately designed epidemiological study, the subjects would be 728
“blinded” to the status of the turbines, meaning that they would not know 729
whether the turbines were operational. This did not occur in the Cape 730
Bridgewater study. 731
• As pointed out by the author of the Cape Bridgewater study, their sample 732
was limited to six individuals who had previously complained – that is, the 733
study was assessing the subjective “sensations” reported by six 734
individuals who feel they have been adversely affected in one way or the 735
other as a result of the wind farm. (Cape Bridgewater study at p. 212.) 736
• Notably, the correlations reported by the author have not been repeated 737
using a valid epidemiological study design. 738
739
004966

26
Q. Mr. James attaches a document titled Noise: Windfarms as Exhibit 2 to his 740
testimony (the “Shepherd Paper”). Are you familiar with the Shepherd Paper? 741
A. Yes. I note that its authors are all affiliated with the anti-wind group, Society for 742
Wind Vigilance. Specifically, Dr. Hanning is on that group’s Board of Directors, and 743
Drs. Shepherd and Thorne are each a “Scientific Advisor.”8 744
745
Q. In your opinion, does the Shepherd Paper provide the Commission with 746
helpful information concerning the Project? 747
A. No, in the sense that this is a recitation of opinions of individuals who are affiliated 748
with anti-wind groups. As I noted, Drs. Shepherd and Thorne are “Scientific 749
Advisors” for the Society of Wind Vigilance, and Dr. Hanning and Mr. James are on 750
its Board of Directors. That said, there are some thoughtful comments regarding the 751
psychological aspects of annoyance and reported health concerns. However, the 752
term epidemiology and its attribution to a number of reports or opinion pieces is 753
misleading. For example, Dr. Nina Pierpont’s work is not a scientific study, and the 754
Shepherd Paper fails to make that clear. The Shepherd Paper’s reliance on pieces 755
written by Harry, Pierpont, Krogh, Hanning, Alves-Pereira, and Nissenbaum clearly 756
indicate the slant of the article toward the views of the Society for Wind Vigilance. 757
758
Q. The Shepherd Paper states that annoyance is an adverse health effect, relying 759
on the World Health Organization (“WHO”). What is your response? 760
A. Annoyance is not an adverse health effect, it is a normal physiological response 761
which is deeply rooted in the beliefs, culture, and psychological makeup of the 762
individual. The prevention of annoyance is a worthy but unachievable goal. It is 763
important to recognize that the WHO document that the Shepherd Paper relies upon 764
is from 1999 and does not address wind turbines. Overall, it is an outdated, single 765
reference that does not reflect the current state of the research on this topic. There 766
is peer-reviewed, published research since that time, much of which I have identified 767
8 See http://www.windvigilance.com/home/advisory-group (last accessed Sept. 24, 2018).
004967

27
in my testimony, that provides more reliable and relevant information for the 768
Commission. 769
770
In addition, importantly, the WHO document that the Shepherd Paper relies upon 771
defines annoyance broadly as “a feeling of displeasure associated with any agent or 772
condition, known or believed by an individual or group to adversely affect them.”9 I 773
further note that the WHO document discussed annoyance in terms of a 774
social/behavioral effect and states: “it should be recognized that equal levels of 775
different traffic and industrial noises cause different magnitudes of annoyance. This 776
is because annoyance in populations varies not only with the characteristics of the 777
noise, including the noise source, but also depends to a large degree on many non-778
acoustical factors of a social, psychological, or economic nature.”10 779
780
Q. The Shepherd Paper notes that some individuals describe themselves as 781
“noise sensitive.” What is your response? 782
A. That phrase, as used in the Shepherd Paper, is not a recognized specific health 783
condition in medical literature. It is neither an illness nor a disease but more likely a 784
conditioned response. In lay terms, this might be described as a state of mind. As I 785
discussed previously regarding the nocebo effect, if a person does not like 786
something, he or she is more likely to have a negative response to any situation 787
reflective of the stimulating event. 788
789
Q. Are you familiar with the Shirley Wind Project study by Dr. Schomer referred 790
to by Mr. James? 791
A. Yes. 792
793
9 WHO, Guidelines for Community Noise, at 32 (1999). 10 Id. at xi; see also id. at 33 and 42 (“[A]nnoyance reactions are sensitive to many non-acoustical factors of social, psychological or economic nature, and there are also considerable differences in individual reactions to the same noise.”).
004968
28
Q. Do you believe that Dr. Schomer’s study provides helpful information to the 794
Commission with respect to this Project? 795
A. No. The study did not use study methods such that specific conclusions could be 796
scientifically supported. It also did not demonstrate a causal relationship between 797
the wind farm and the health complaints reported by some residents. 798
799
Q. Mr. James asserts that you are “not qualified to speak to the issue of 800
acoustics or human response to wind turbine noise.” (James Direct, lines 801
398-99.) What is your response? 802
A. I will be the first to admit that I am not an acoustician. I am, however, a graduate 803
trained epidemiologist with 30 years of experience working in public health and 20 of 804
those years working in the areas of occupational and environmental medicine as a 805
Board Certified Physician. I am using this experience and training to assess the 806
health and exposure claims made by persons who are attributing various health 807
conditions to wind turbine noise. 808
809
V. CONCLUSION 810
811
Q. After reviewing the testimonies of Prof. Alves-Pereira, Dr. Punch, and Mr. 812
James, do you still hold the opinions offered in your Supplemental Direct 813
Testimony? 814
A. Yes. My opinions are based on peer-reviewed, published literature, and Dr. Alves-815
Pereira, Dr. Punch, and Mr. James did not present any testimony based on similarly 816
reliable research. It is important to acknowledge that there have been more than 817
400 gigawatts of wind power generation installed around the world,11 and Prof. 818
Alves-Pereira, Dr. Punch, and Mr. James base their opinions largely only on a small 819
number of self-reported complaints. As such, my opinions remain unchanged. 820
821
11 See https://www.worldenergy.org/data/resources/resource/wind/ (last accessed Sept. 24, 2018).
004969

29
Q. Does this conclude your Rebuttal Testimony? 822
A. Yes. 823
004970

30
Dated this 26th day of September, 2018. 824
825
826 Dr. Mark Roberts 827 828 64899496 829
004971

Landesanstalt für Umwelt, Messungen und Naturschutz Baden-Württemberg
Low-frequency noise incl. infrasound from wind turbines and other sources
L Report on results of the measurement project 2013-2015
EXHIBIT A5-1
Page 1 of 104
LU:W • Ill
I Baden-Wiirttemberg
004972

EXHIBIT A5-1
Page 2 of 104 004973

Landesanstalt für Umwelt, Messungen und Naturschutz Baden-Württemberg
Low-frequency noise incl. infrasound
from wind turbines and other sources
L Report on results of the measurement project 2013-2015
EXHIBIT A5-1
Page 3 of 104
LU:W • Ill
I Baden-Wiirttemberg
004974
Reports and appendices may be passed on only in unaltered form. Publication of excerpts is not permitted without writ-
ten permission by LUBW.
D-138-00063
Ministerium für Umwelt, Klima und Energiewirtschaft Baden-Württemberg
(Ministry for the Environment, Climate and Energy of the
Federal State of Baden-Wuerttemberg)
Department 46 (formerly Department 42)
Internet: um.baden-wuerttemberg.de
LUBW Landesanstalt für Umwelt, Messungen und Naturschutz Baden-Württemberg
(State Office for the Environment, Measurement and Nature Conservation
of the Federal State of Baden-Wuerttemberg)
P. O. Box 10 01 63, 76231 Karlsruhe
Internet: www.lubw.baden-wuerttemberg.de
U. Ratzel, O. Bayer, P. Brachat, M. Hoffmann, K. Jänke,
K.-J. Kiesel, C. Mehnert, Dr. C. Scheck
LUBW Department 34 – Technischer Arbeitsschutz, Lärmschutz
(Technical Occupational Safety, Noise Protection)
Contact: [email protected]
Dr. C. Westerhausen, Dr. K.-G. Krapf, L. Herrmann, J. Blaul
Wölfel Engineering GmbH + Co. KG, Höchberg
CL-Communication GmbH, 41199 Mönchengladbach
Title page: Fotolia (large photo), LUBW (three small images)
In the report the respective source is given together with the picture.
September 2016
PRINCIPAL
PUBLISHER
EDITORS
ENGLISH TRANSLATION
PICTURE CREDITS
ISSUE
IMPRINT
EXHIBIT A5-1
Page 4 of 104
• Ill
GEPR0FTES UMWELTMANAGEMENT
004975
1 BACKGROUND AND INTRODUCTION 7
2 SUMMARY 9
3 SCOPE OF ANALYSIS 15
4 WIND TURBINES 17
4.1 Measurements and evaluations 19
4.2 Noise at wind turbine 1: REpower MM92 – 2.0 MW 19
4.3 Noise at wind turbine 2: Enercon E-66 – 1.8 MW 25
4.4 Noise at wind turbine 3: Enercon E-82 – 2.0 MW 29
4.5 Noise at wind turbine 4: REpower 3.2M114 – 3.2 MW 34
4.6 Noise at wind turbine 5: Nordex N117 – 2.4 MW 40
4.7 Noise at wind turbine 6: Enercon E-101– 3.05 MW 45
4.8 Vibrations at wind turbine 5: Nordex N117 – 2.4 MW 50
4.9 Measurement results from literature 54
4.10 Conclusion of the measurements at wind turbines 57
5 ROAD TRAFFIC 59
5.1 Inner-city roads – measurement in Würzburg 59
5.2 Inner-city roads – permanent measuring stations Karlsruhe and Reutlingen 64
5.3 Motorway – measurement near Malsch 65
5.4 Noise inside car while driving 67
5.5 Conclusion of the road traffic measurements 67
6 URBAN BACKGROUND 69
7 SOURCES OF NOISE IN RESIDENTIAL BUILDINGS 75
7.1 Washing machine 75
7.2 Heating and refrigerator 76
8 NATURAL SOURCES 79
8.1 Rural environment 79
8.2 Sea surf 84
9 DESIGN OF A LONG-TERM MEASURING STATION FOR LOW-FREQUENCY NOISE 85
9.1 Task 85
9.2 Concept 85
9.3 Individual modules for data acquisition 85
9.4 Central data evaluation 87
9.5 Applicability and benefits 88
TABLE OF CONTENTS
EXHIBIT A5-1
Page 5 of 104
• Ill
004976

APPENDIX A1 – GENERAL INFORMATION 89
A1.1 Low-frequency noise and infrasound 89
A1.2 Spread 89
A1.3 Incidence and occurance 90
A1.4 Evaluation 90
A1.5 Perception 90
APPENDIX A2 – SOURCES AND LITERATURE 93
APPENDIX A3 – EXPLANATION OF TERMS AND PARAMETERS 95
APPENDIX A4 – MEASURING SYSTEMS USED 101
TABLE OF CONTENTS
EXHIBIT A5-1
Page 6 of 104
• Ill
004977
© LUBW Low-frequency noise incl. infrasound – Report on the measurement project 7
1 BackgroundandintroductionThere are currently (as of 31.12.2015) 445 wind turbines in
operation in Baden-Wuerttemberg and 100 more under
construction 1). In the coming years many more will be ad-
ded to that number. When it comes to the expansion of
wind energy, the effects on humans and the environment
need to be taken into account. Wind turbines make noise.
In addition to the usual audible sound, they also generate
low-frequency sounds or infrasound, i.e. extremely low to-
nes.
Infrasound is described as the frequency range below
20 hertz (for explanations of important technical terms,
please refer to Appendix A3). From a physical point of
view, these noises are generated particularly through aero-
dynamic and mechanical processes, e.g. the flow around
rotor blades, machine noise or the vibration of equipment
components. Our hearing is very insensitive to low-fre-
quency noise components. The wind energy decree of Ba-
den-Wuerttemberg [1] includes, among other things, regu-
lations and statements to protect the population against
low-frequency noise and infrasound. However, within the
scope of wind energy development, fears are commonly
expressed that this infrasound may affect people or jeopar-
dize their health.
In September 2012, the LUBW Landesanstalt für Umwelt,
Messungen und Naturschutz Baden-Wuerttemberg presen-
ted the concept for a measuring project, with which cur-
rent data on low-frequency noise incl. infrasound from
wind turbines and other sources was to be collected. As a
result, the LUBW was entrusted with the implementation
of the project by the Ministry of Environment, Climate and
Energy Baden-Wuerttemberg. The company Wölfel Engi-
neering GmbH + Co. KG was taken on board as a sup-
porting measuring institute. The detailed planning and
work was thus begun together at the beginning of 2013.
Within the project, numerous measurements near wind
turbines and other sources as well as the associated analy-
ses and evaluations were carried out. The results obtained
are summarized in this measurement report. The LUBW
wishes to use it as a contribution towards providing objec-
tivity to the discussion. The report is aimed at the interes-
ted public as well as administrative bodies and professio-
nals.
At this point we would like to thank all participants for
enabling the measurements as well as the friendly support
during the implementation, in particular the operators of
wind turbines, the involved administrative authorities in
Baden-Wuerttemberg and Rhineland-Palatinate, the State
Museum of Natural History Karlsruhe and the Education
Authority of Karlsruhe. The Bavarian State Office for the
Environment and the State Office for the Environment,
Nature Conservation and Geology Mecklenburg-Western
Pomerania were kind enough to provide a number of pic-
tures.
1) The terms "wind power plant" and "wind turbine" are synonymous. For our measurement project we have used the term "wind turbine" in the title. The German term is embedded in immissions law (fourth regulation on the implementation of the Federal Immission Control Act – Regulation on licensing requirements Appendices – 4. BImSchV, Appendix 1 no. 1.6.1 [2] [3]). In the text of this report the common term "wind power plant" may also be used.
EXHIBIT A5-1
Page 7 of 104 004978

8 Low-frequency noise incl. infrasound – Report on the measurement project © LUBW
EXHIBIT A5-1
Page 8 of 104 004979
© LUBW Low-frequency noise incl. infrasound – Report on the measurement project 9
2 SummaryIn cooperation with Wölfel Engineering GmbH + Co. KG,
the LUBW carried out the measurement project "Low-fre-
quency noise incl. infrasound from wind turbines and
other sources", which began in 2013. This report provides
information on the results of the measurement project.
The aim of the project is to collect current data on the
occurrence of infrasound (from 1 Hz) and low-frequency
noise in the area of wind turbines and other sources. For
this purpose, measurements were taken up to the end of
2015 in the areas around six wind turbines by different ma-
nufacturers and with different sizes, covering a power range
from 1.8 to 3.2 megawatts (MW). Depending on local con-
ditions, the distances to the wind turbines were approx.
150 m, 300 m and 700 m. The results of the measurements
at the wind turbines are described and illustrated by means
of graphs in Chapter 4. In addition to the acoustical analy-
ses, vibration measurements were performed in the vicinity
of a wind power plant in order to determine possible vibra-
tion emissions of the power plant on the environment. The
procedure and the difficulties encountered are explained
accordingly.
Since road traffic is also considered to be a source of infra-
sound and low-frequency noise, it stood to reason to ex-
tend the measurement project to cover that too. Chapter 5
provides results of measurements at an urban road, which
took place both outside as well as inside a residential buil-
ding. In addition, the data from the LUBW measurement
stations for road traffic noise in Karlsruhe and Reutlingen
were analysed and illustrated with respect to low-frequen-
cy noise and infrasound. Furthermore, results of own mea-
surements at a motorway are also illustrated. This is sup-
plemented by data from sound level measurements inside
a moving car.
Measurements without reference sources during the day
and at night took place in the centre of Karlsruhe on the
Friedrichsplatz. At the same time, measurements were also
taken on the roof of the natural history museum and in an
interior room of the education authority (Chapter 6). Typi-
cal noise occurring in residential buildings through wides-
pread technical equipment, such as washing machines,
refri gerators or heating equipment, was also recorded and
is presented in Chapter 7. In order to enable statements
about natural sources of infrasound, measurements were
taken on an open field, near a forest and in a forest. The
measurement of low-frequency sound through sea surf is
also introduced based on literature (Chapter 8). In Chap-
ter 9, considerations are made for a monitoring station for
the continuous monitoring of low-frequency noise incl. in-
frasound. Such an independently operating permanent
measuring station could possibly be used when it comes to
complaint cases.
The report at hand extends the previous interim report
through further findings and contains a multiplicity of
measurement results. It is aimed at both professionals as
well as the interested general public. Great interest for our
analyses was shown by the public and administrative bo-
dies during the entire duration of the project. SWR TV
even aired a report about the measurements. The LUBW
will continue to pursue the issue in the future.
In addition to general information about infrasound, the
appendices provide extensive explanations of technical
terms and the technology used, as well as information on
the sources.
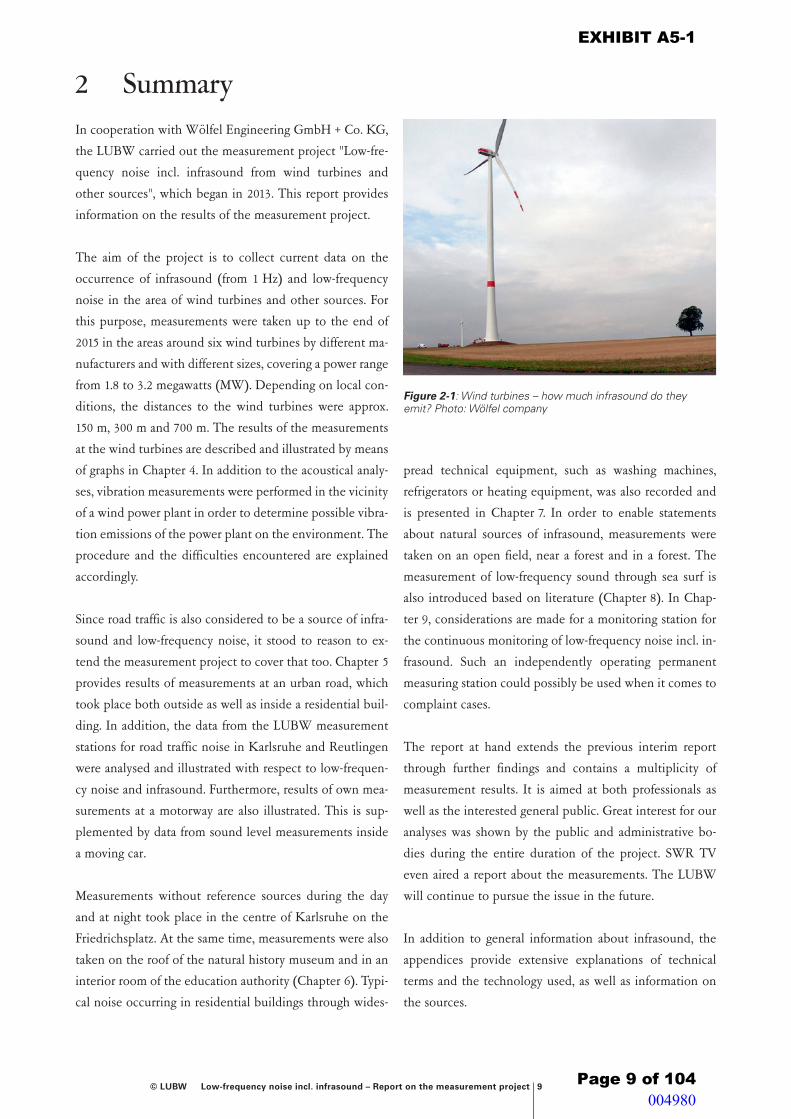
Figure 2-1: Wind turbines – how much infrasound do they emit? Photo: Wölfel company
EXHIBIT A5-1
Page 9 of 104
\
\
004980

10 Low-frequency noise incl. infrasound – Report on the measurement project © LUBW
RESULTS
In summary, the measurements lead to the following fin-
dings:
� The infrasound being emanated from the wind turbines
can generally be measured well in the direct vicinity.
Discrete lines occur below 8 Hz in the frequency spect-
rum, which are attributed to the uniform movement of
the individual rotor blades.
� For the measurements carried out even at close range,
the infrasound level in the vicinity of wind turbines is
– at distances between 120 m and 300 m – well below
the threshold of what humans perceive in accordance
with DIN 45680 (2013 Draft) [5] or Table A3-1.
� At a distance of 700 m from the wind turbines, it was
observed by means of measurements that when the
turbine is switched on, the measured infrasound level
did not increase or only increase to a limited extent.
The infrasound was generated mainly by the wind and
not by the turbines.
� The determined G-weighted levels 2) at distances bet-
ween 120 m and 190 m were between 55 dB(G) and
80 dB(G) with the turbine switched on, and between
50 dB(G) and 75 dB(G) with the turbine switched off.
At distances of 650 m and 700 m, the G-levels were bet-
ween 50 dB(G) and 75 dB(G) for both turbines switched
2) The G-level – expressed as dB(G) – represents a frequency-weigh-ted single value of the noise in the low-frequency and infrasound range. The human ear is insensitive to any influences in this fre-quency range (for definition and measurement curve see Appen-dix A3).
a
c
b
d
Figure 2-2: Impressions of the measurements during the execution of the measurement project. a) Construction of a wind measu-ring mast (top left) and b) of a measurement point (top right) during measurement at a wind turbine. c) and d) Setup of measurement points in the city centre of Karlsruhe (bottom). Photos: LUBW
EXHIBIT A5-1
Page 10 of 104
' /
004981

© LUBW Low-frequency noise incl. infrasound – Report on the measurement project 11
on as well as off, see Table 2-1. The large fluctuations are
caused, among other things, by the strongly varying noi-
se components due to the wind, as well as various diffe-
rent surrounding conditions.
� The infrasound and low-frequency noise measured in
the vicinity of operating wind turbines consists of a pro-
portion that is generated by the wind turbine, a propor-
tion that occurs by itself in the vicinity due to the wind,
and a proportion that is induced by the wind at the mi-
crophone. In this case the wind itself is thus always an
"interference factor" when determining the wind turbi-
ne noise. The measured values are therefore subject to a
wide spread.
� The vibrations caused by the wind turbine being exami-
ned were already minimal at a distance of less than
300 m. At distances provided for residential areas alone
due to noise protection issues, no relevant effects are to
be expected for residential buildings.
� It was possible to carry out the measurements for the
low-frequency noise incl. infrasound resulting from road
traffic during times without interfering wind noise. Con-
trary to the case with wind turbines, the measured levels
also occur directly in areas with adjacent residential
buildings. As expected, it was observed that the infra-
sound and low-frequency noise levels fell at night. Clear
correlations with the amount of traffic were also ascer-
tained. The higher the amount of traffic, the higher the
low-frequency noise and infrasound levels.
� The infrasound noise levels of road traffic in the area of
residential buildings in the vicinity in the individual
third octave bands were a maximum of approx. 70 dB
(unweighted), while the G-weighted level was in the
range between 55 dB(G) and 80 dB(G).
� When it comes to the immission measurements of road
traffic noise, increased levels in the area between ap-
prox. 30 Hz and 80 Hz were ascertained in the frequen-
cy spectra. The low-frequency noise in this area lies well
above the perception threshold according to Table A3-1
and is therefore more relevant with regards to its effect
than the subliminal infrasound levels below 20 Hz. The
levels of low-frequency noise in the observed situations
of road traffic are significantly higher than in the vicinity
of wind turbines (Table 2-1).
� The measurements in the city centre of Karlsruhe
(Friedrichsplatz) showed that the G-weighted levels
dropped from 65 dB(G) during the day to levels of
around 50 dB(G) at night. Wind noise played no role for
these measurements. Relatively high third octave levels
up to 60 dB (unweighted) could be observed between
25 Hz and 80 Hz, probably deriving from traffic noise,
even though the Friedrichsplatz is not located directly
on a busy road.
� The highest levels in the context of the measurement
project were measured in the interior of a mid-range car
travelling at 130 km/h. Even though these are not immis-
sion levels that occur in a free environment, they are an
everyday situation that many people are frequently sub-
jected to for a longer period of time. The measured va-
lues for both the infrasound as well as the other
Figure 2-3: Comparison of road noise inside and outside of mo-tor vehicles with the level range of wind turbines at a distance of approx. 300 m as well as the perception threshold according to Table A3-1 regarding infrasound and low-frequency noise. For measuring corrections, see Section 4.1.
Linear third octave level in dB
Frequency in Hz
0
10
20
30
50
80
120
40
60
100
70
110
90
100
1.61 80635040
31.5252016
12.5108
6.354
2.52
1.25
3.15
Car interior, windows closedPerception threshold
Level range of the measured wind turbines, distance approx. 300 mRoad traffic, traffic volume of 2000 cars/h
EXHIBIT A5-1
Page 11 of 104
UJ:W
004982

12 Low-frequency noise incl. infrasound – Report on the measurement project © LUBW
low-frequency areas are higher by several orders of
magni tude than the values measured in road traffic or at
the wind turbines.
� The measurement of appliances in a residential building
showed the highest infrasound levels during the spin
cycle of washing machines. In individual third octaves
the levels reached the perception threshold according
to Table A3-1. As expected, it turned out that building
components deaden higher-frequency noise significant-
ly better than the low frequencies below 20 Hz.
� In a rural area, the spectral distribution of noise on an
open field, the edge of a forest, in a forest with wind is
in principle similar to in the vicinity of a wind turbine
(Figure 2-5). For open fields, linear levels that are up to
30 dB higher than in a forest can be seen in the narrow-
band spectrum. Above 16 Hz, the differences are no lon-
ger as pronounced. Higher levels occur for A-weighted
audible sound in the forest, which is attributable to the
rustling of leaves.
CONCLUSION
Infrasound is caused by a large number of different natural
and technical sources. It is an everyday part of our environ-
ment that can be found everywhere. Wind turbines make
no considerable contribution to it. The infrasound levels
generated by them lie clearly below the limits of human
perception. There is no scientifically proven evidence of
adverse effects in this level range.
The measurement results of wind turbines also show no
acoustic abnormalities for the frequency range of audible
sound. Wind turbines can thus be assessed like other ins-
tallations according to the specifications of the TA Lärm
(noise prevention regulations). It can be concluded that,
given the respective compliance with legal and professional
technical requirements for planning and approval, harmful
effects of noise from wind turbines cannot be deduced.Figure 2-5: Comparison of noise situation in an open field (with-out source reference) with the level range of wind turbines at a distance of approx. 300 m as well as the perception threshold according to Table A3-1 regarding infrasound and low-frequency noise. For measuring corrections for wind turbines, see sec-tion 4.1.
Linear third octave level in dB
Frequency in Hz
0
10
20
30
50
80
120
40
60
100
70
110
90
100
1.61 80635040
31.5252016
12.5108
6.354
2.52
1.25
3.15
Level range of the measured wind turbines, distance approx. 300 mMeadow wind 10 m/sMeadow wind 6 m/sPerception threshold
Firgure 2-4: Comparison of noise of technical appliances in resi-dential buildings with the level range of wind turbines at a dis-tance of approx. 300 m as well as the perception threshold ac-cording to Table A3-1 regarding infrasound and low-frequency noise. For measuring corrections, see Section 4.1.
Linear third octave level in dB
Frequency in Hz
0
10
20
30
50
80
120
40
60
100
70
110
90
100
1.61 80635040
31.5252016
12.5108
6.354
2.52
1.25
3.15
Washing machine 1 totalPerception threshold
Level range of the measured wind turbines, distance approx. 300 m
Gas heating Oil heating
EXHIBIT A5-1
Page 12 of 104
w:w I •~~ --
I •==---___ w,w
004983

© LUBW Low-frequency noise incl. infrasound – Report on the measurement project 13
Table 2-1: Comparative overview of results. The readings were often subject to considerable fluctuations. Here they were rounded to the nearest 5 dB, some are based on different averaging times. More information can be found in the relevant sections of the report. To enable a comparison of the results (measurements with/without reverberant plate) a correction was carried out; for more information see Section 4.1.
Source/situation
Section
G-weighted levelin dB(G)
Infrasound third octave level ≤ 20 Hz in dB 1)
Low-frequency third octave levels 25-80 Hz in dB 1)
Wind turbines 2)
– WT 1
4.2
WT on / off
700 m: 55-75 / 50-75 150 m: 65-75 / 50-70
WT on –
150 m: 55-70
WT off –
150 m: 50-55
– WT 2 4.3 240 m: 60-75 / 60-75 120 m: 60-80 / 60-75
– 120 m: 60-75
– 120 m: 50-55
– WT 3 4.4 300 m: 55-80 / 50-75 180 m: 55-75 / 50-75
– 180 m: 50-70
– 180 m: 45-50
– WT 4 4.5 650 m: 50-65 / 50-65 180 m: 55-65 / 50-65
– 180 m: 45-55
– 180 m: 40-45
– WT 5 4.6 650 m: 60-70 / 55-65 185 m: 60-70 / 55-65
– 185 m: 50-65
– 185 m: 45-50
– WT 6 4.7 705 m: 55-65 / 55-60 192 m: 60-75 / 55-65
– 192 m: 55-65
– 192 m: 45-50
Road traffic – Würzburg inner city, balcony 3) – Würzburg inner city, living quarter 3)
5.1
50-75 40-65
35-65 20-55
55-75 35-55
– Karlsruhe, noise measurement station 3) 5.2 65-75 45-65 55-70
– Reutlingen, noise measurement station 3) 5.2 70-80 50-70 55-75
– Motorway A5 near Malsch, 80 m 4) – Motorway A5 near Malsch, 260 m 4) 5.3 75
7055-60 55-60
60-70 55-60
– Interior noise in passenger car 130 km/h 4) – interior noise in minibus at 130 km/h 4) 5.4 105
10090-95 85-90
75-95 80-90
Urban background, Karlsruhe 3)
– roof of natural history museum – Friedrichsplatz – Interior
6
50-65 50-65 45-60
35-55 35-50 20-45
up to 60 up to 60 up to 55
Noise sources in residential buildings 5) – Washing machine (all operating modes)
7.1
50-85
25-75
10-75
– Heating (oil and gas, full load) 7.2 60-70 40-70 25-60
– Refrigerator (full load) 7.2 60 30-50 15-35
Rural environment 6) – open field, 130 m from forest
8.1
Wind 6 / 10 m/s
50-65 / 55-65
Wind 6 / 10 m/s
40-70 / 45-75
Wind 6 / 10 m/s
35-40 / 40-45
– Edge of forest 8.1 50-60 / 50-60 35-50 / 45-75 35-40 / 40-45
– Forest 8.1 50-60 / 50-60 35-40 / 40-45 35-50 / 35-40
Sea surf – Beach, 25 m away
8.2
75
55-70
not reported
– Rock cliff, 250 m away 8.2 70 55-65 not reported
1) Linear third octave level (unweighted)2) For wind turbines: From 10-second values (see illustrations of the G-level depending on the wind speed)3) For road traffic (Würzburg) and urban background (Karlsruhe): From averaging levels over an hour4) For federal motorway and car interior level: From averaging over several minutes5) For noise sources in residential building: From averaging levels of typical operating cycles6) The wind measurement was always carried out at the measurement point MP1 (open field).
EXHIBIT A5-1
Page 13 of 104
LU:W
004984

14 Low-frequency noise incl. infrasound – Report on the measurement project © LUBW
EXHIBIT A5-1
Page 14 of 104 004985

© LUBW Low-frequency noise incl. infrasound – Report on the measurement project 15
3 ScopeofanalysisThe scope of analysis includes the following measurements
and examinations:
� Measurement of low-frequency noise, including infra-
sound, from 1 Hz at a total of six different wind turbines
at a distance of approx. 150 m, 300 m and 700 m respec-
tively (if possible). In the process, the turbines were
each turned on and off. The distances roughly corres-
pond to the set reference intervals for emission measu-
rements at close range (approx. 150 m), a roughly doub-
le distance in the immediate vicinity (approx. 300 m)
and a distance that can occur for real noise immis sions
(700 m, see also planning information in the wind ener-
gy statute of Baden Wuerttemberg [1]).
� Comparative measurement of the noise immission in
the sphere of influence of a road both outside as well as
inside a residential building.
� Determination of low-frequency effects from 6.3 Hz of
road traffic on the permanent monitoring stations in
Karlsruhe and Reutlingen as well as at the A5 motorway
near Malsch at different distances.
� Measuring of the infrasound levels within a passenger
car travelling at 130 km/h.
� Determination of the urban background through a com-
parative measurement of the noise situation in Karlsru-
he (Friedrichsplatz) without specific source refe rence
both outside as well as inside a building.
� Comparative measurement of the noise situation in a
rural area without a concrete source reference.
� Measurement of oscillations (vibrations) in the ground
in the vicinity of a wind turbine.
� Elaboration of a feasibility concept for the conception
of a self-sufficient permanent measuring station for low
frequency noise incl. infrasound, in order to possibly
measure the effects over a longer period of time (e.g.
several weeks).
The following planned steps of the project have not yet
been completed:
� Measurement of the direction dependency in the low-
frequency frequency range based on four measurement
points around a wind turbine. – This is where technical
problems occurred during the measurement. They
therefore have to be repeated.
� Measurement of low-frequency noise, including infra-
sound, from 1 Hz at a wind farm, incl. indoor measure-
ment in a residential building at a distance of approx.
700 m to the nearest turbine. The wind turbines are
switched on and off in the process. – The necessary me-
teorological conditions did not occur at the planned
measuring location since commissioning in August 2014.
It was therefore not possible to carry out a standard-
compliant measurement. The measurement is to be car-
ried out at a later date.
EXHIBIT A5-1
Page 15 of 104 004986

16 Low-frequency noise incl. infrasound – Report on the measurement project © LUBW
EXHIBIT A5-1
Page 16 of 104 004987

© LUBW Low-frequency noise incl. infrasound – Report on the measurement project 17
4 WindturbinesThe results of the six measurements that took place in the
context of this project at wind turbines in Baden-Wuert-
temberg, Rhineland-Palatinate and Bavaria are presented
in the following (Table 4-1). The measurements were car-
ried out by Wölfel Engineering GmbH + Co. KG, Höch-
berg, on behalf of the LUBW. The graphical representa-
tions of the emissions and immissions in the low-frequency
range, both with the turbines switched on and off, are an
integral part. The third octave levels enable a comparison
with the human perception threshold. The A and G-weigh-
ted sound pressure levels are represented depending on
the wind velocity for three different distances from the tur-
bine. The A-weighted sound level – specified as dB(A) –
simulates the human hearing sensitivity. The G-level – spe-
cified as dB(G) – represents a singular value, which rates
only infrasound and parts of the low-frequency frequency
range. The human ear is very insensitive to these frequency
ranges (for more info please refer to Figure A3-1 in Appen-
dix A3). Additionally recorded narrow band spectra, all
specified with a resolution of 0.1 Hz, are able to depict mo-
re clearly specific features of the noise characteristics of
wind turbines. The level values in a spectrum depend on
the selected resolution. Therefore, narrow band levels can-
not be compared with third octave levels. Only third octa-
ve levels are suitable for comparisons with the hearing
threshold, as it also corresponds to third octave levels.
All the following results of measurements on operating
wind turbines also include the noise caused by the wind
itself in the vicinity. In addition, in the case of strong wind,
noise will inevitably be induced at the microphones despi-
te the use of double wind screens. Therefore, the results of
a measurement cannot be attributed to the respective wind
turbine alone. The differences shown by the comparison of
situations with the turbine switched on and off are therefo-
re all the more important. When it comes to the noise
measurements at roads (Chapter 5) and in the city centre
(Chapter 6), the effects related to the wind are irrelevant.
Thus, the measuring results for wind turbines and roads
designate different situations, which cannot be directly
compared with one another.
The selection of the wind turbines that were to be measu-
red proved to be rather difficult. The initial contacts with
operators were kindly set up by the Baden-Wuerttemberg
approval authorities (district offices) after the LUBW had
carried out a corresponding query. The participation of the
turbine operators was on a voluntary basis. Some operators
had concerns about participating in the project.
First, the locations were qualified from an acoustic perspec-
tive. Sites near busy roads, or other disruptive noise sour-
ces – including forests – were deemed unsuitable and thus
rejected. Regarding more powerful turbines, the site search
had to be extended by the LUBW to include Rhineland-
Palatinate. In this case constructive support was also provi-
ded several times by the authorities. Not only weather-re-
lated restrictions had to be coped with (matching wind
directions and wind speeds; strong winds resulting in ter-
mination of measuring due to automatic shutdown; snow-
fall in the vicinity) during the project. One wind power
plant broke down shortly before the measurement and was
Table 4-1: Overview of the wind power plants where measurements were carried out in the context of this project. The individual power plants and the associated results are described in more detail in Sections 4.2 to 4.7.
Wind turbine (WT) WT 1 WT 2 WT 3 WT 4 WT 5 WT 6
Manufacturer Model
REpower* MM92 Enercon E-66 Enercon E-82 REpower*
3.2M114Nordex
N117/2400 Enercon E-101
Nominal capacity 2.0 MW 1.8 MW 2.0 MW 3.2 MW 2.4 MW 3.05 MW
Rotor diameter 92 m 70 m 82 m 114 m 117 m 101 m
Hub height 100 m 86 m 138 m 143 m 140.6 m 135.4 m
* Senvion since 2014
EXHIBIT A5-1
Page 17 of 104 004988

18 Low-frequency noise incl. infrasound – Report on the measurement project © LUBW
the measurement of the turbine noise impossible. This is
just to show some of the challenges that had to be over-
come during the project. The delays that were thus incur-
red were not foreseeable from the start.
inoperable for a longer period of time. One operator with-
drew his consent to the measurement as the proposed tur-
bine had difficulties with the acceptance inspection. A
construction site was set up in the vicinity of another wind
turbine, which caused background noise and thus made
Figure 4-1: Model type WT 1, REpower MM92 Figure 4-2: Model type WT 2, Enercon E-66
Figure 4-3: Model type WT 3, Enercon E-82
Figure 4-5: Model type WT 5, Nordex N117/2400
These images convey an impression of the examined wind power plants, covering the common power range between 1.8 MW and 3.2 MW. The hub height varies between 86 m and 143 m, the rotor diameter varies between 70 m and 117 m. Photos: batcam.de (left column), LUBW (Fig. 4-2 and 4-4), Lucas Bauer wind-turbine-models.com (Fig. 4-6)
Figure 4-4: Model type WT 4, REpower 3.2M114
Figure 4-6: Model type WT 6, Enercon E-101
EXHIBIT A5-1
Page 18 of 104 004989
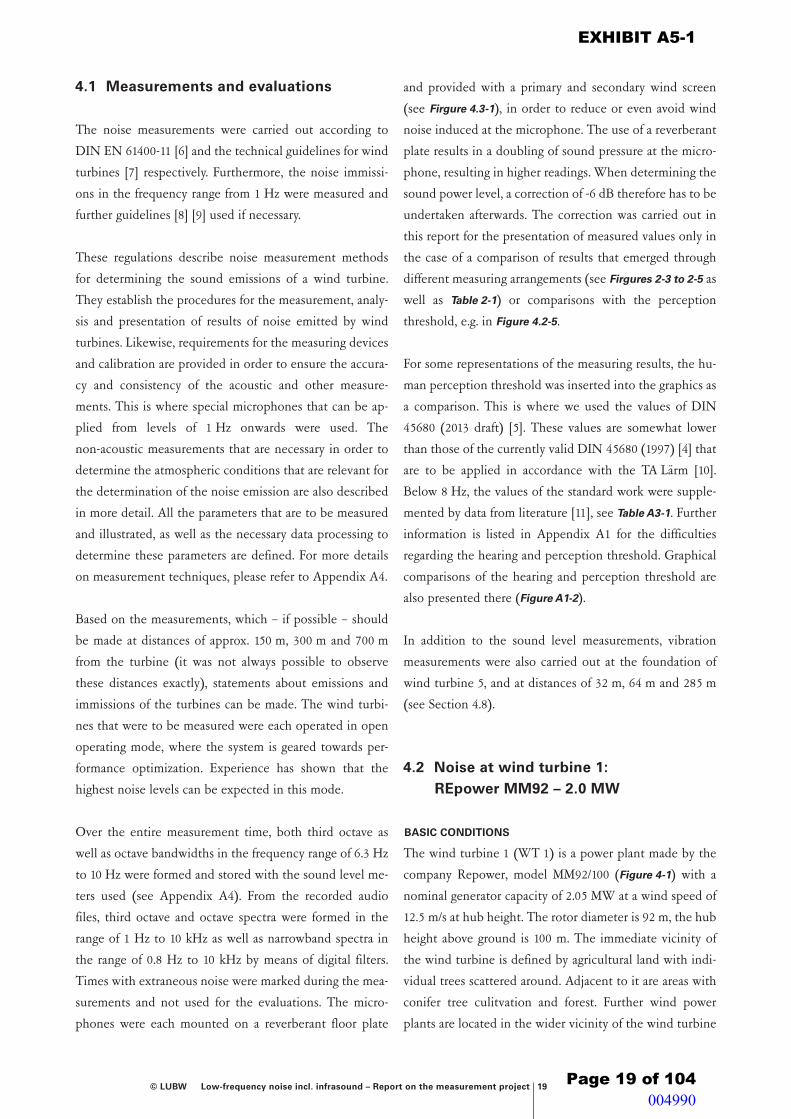
© LUBW Low-frequency noise incl. infrasound – Report on the measurement project 19
4.1 Measurements and evaluations
The noise measurements were carried out according to
DIN EN 61400-11 [6] and the technical guidelines for wind
turbines [7] respectively. Furthermore, the noise immissi-
ons in the frequency range from 1 Hz were measured and
further guidelines [8] [9] used if necessary.
These regulations describe noise measurement methods
for determining the sound emissions of a wind turbine.
They establish the procedures for the measurement, analy-
sis and presentation of results of noise emitted by wind
turbines. Likewise, requirements for the measuring devices
and calibration are provided in order to ensure the accura-
cy and consistency of the acoustic and other measure-
ments. This is where special microphones that can be ap-
plied from levels of 1 Hz onwards were used. The
non-acoustic measurements that are necessary in order to
determine the atmospheric conditions that are relevant for
the determination of the noise emission are also described
in more detail. All the parameters that are to be measured
and illustrated, as well as the necessary data processing to
determine these parameters are defined. For more details
on measurement techniques, please refer to Appendix A4.
Based on the measurements, which – if possible – should
be made at distances of approx. 150 m, 300 m and 700 m
from the turbine (it was not always possible to observe
these distances exactly), statements about emissions and
immissions of the turbines can be made. The wind turbi-
nes that were to be measured were each operated in open
operating mode, where the system is geared towards per-
formance optimization. Experience has shown that the
highest noise levels can be expected in this mode.
Over the entire measurement time, both third octave as
well as octave bandwidths in the frequency range of 6.3 Hz
to 10 Hz were formed and stored with the sound level me-
ters used (see Appendix A4). From the recorded audio
files, third octave and octave spectra were formed in the
range of 1 Hz to 10 kHz as well as narrowband spectra in
the range of 0.8 Hz to 10 kHz by means of digital filters.
Times with extraneous noise were marked during the mea-
surements and not used for the evaluations. The micro-
phones were each mounted on a reverberant floor plate
and provided with a primary and secondary wind screen
(see Firgure 4.3-1), in order to reduce or even avoid wind
noise induced at the microphone. The use of a reverberant
plate results in a doubling of sound pressure at the micro-
phone, resulting in higher readings. When determining the
sound power level, a correction of -6 dB therefore has to be
undertaken afterwards. The correction was carried out in
this report for the presentation of measured values only in
the case of a comparison of results that emerged through
different measuring arrangements (see Firgures 2-3 to 2-5 as
well as Table 2-1) or comparisons with the perception
threshold, e.g. in Figure 4.2-5.
For some representations of the measuring results, the hu-
man perception threshold was inserted into the graphics as
a comparison. This is where we used the values of DIN
45680 (2013 draft) [5]. These values are somewhat lower
than those of the currently valid DIN 45680 (1997) [4] that
are to be applied in accordance with the TA Lärm [10].
Below 8 Hz, the values of the standard work were supple-
mented by data from literature [11], see Table A3-1. Further
information is listed in Appendix A1 for the difficulties
regarding the hearing and perception threshold. Graphical
comparisons of the hearing and perception threshold are
also presented there (Figure A1-2).
In addition to the sound level measurements, vibration
measurements were also carried out at the foundation of
wind turbine 5, and at distances of 32 m, 64 m and 285 m
(see Section 4.8).
4.2 Noise at wind turbine 1: REpower MM92 – 2.0 MW
BASIC CONDITIONS
The wind turbine 1 (WT 1) is a power plant made by the
company Repower, model MM92/100 (Figure 4-1) with a
nominal generator capacity of 2.05 MW at a wind speed of
12.5 m/s at hub height. The rotor diameter is 92 m, the hub
height above ground is 100 m. The immediate vicinity of
the wind turbine is defined by agricultural land with indi-
vidual trees scattered around. Adjacent to it are areas with
conifer tree culitvation and forest. Further wind power
plants are located in the wider vicinity of the wind turbine
EXHIBIT A5-1
Page 19 of 104 004990

20 Low-frequency noise incl. infrasound – Report on the measurement project © LUBW
being measured. These were switched off during the mea-
surement period. A path in close proximity is allowed to be
used only by agricultural traffic and is used only seldom.
The measurements were carried out on 11.04.2013 between
8:00 a.m. and 4:00 p.m. The position of the microphone at
the measurement point MP1 was at a distance of 150 m to
the power plant in a downwind direction. This was in or-
der to take into account the worst case scenario (support of
sound propagation through the wind). Further measure-
ment points MP2 and MP3 were located at intervals of 300
and 700 m in a downwind direction. Figure 4.2-1 provides
an impression. The measurement was carried out in a wind
speed range of 5 to 14 m/s, a temperature range of 10 to
12 °C and an atmospheric pressure range of 946 to 951 hPa.
The entire power range of the power plant was covered up
to the nominal power. The turbulence intensity, which is
basically a measure of the gustiness of the wind (see Ap-
pendix A3), was 18 %.
RESULTS: NARROW BAND LEVEL
Figure 4.2-2 shows the narrow band spectra of background
noise and overall noise at the measurement point MP1 at a
distance of 150 m with a resolution of 0.1 Hz. The wind
speed was 6.5 m/s. With the power plant switched on, six
discrete maxima can be clearly seen in the infrasound range
between 1 Hz and 5.5 Hz. This concerns infrasound gene-
rated by the rotor due to its motion. The measured fre-
quencies correspond to the passage frequency of a rotor
blade of approximately 0.75 Hz, which corresponds with a
frequency of the rotor of 15 rpm and the harmonic overto-
nes at 1.5 Hz, 2.2 Hz, 3.0 Hz, 3.7 Hz, 4.5 Hz and 5.2 Hz
(Figure 4.2-2). Further maxima were measured at 25 Hz and
Figure 4.2-1: Wind measurement mast with view in direction of the wind power plant being measured. Photo: Wölfel company
Figure 4.2-2: Narrow band spectra of background noise and total noise in the vicinity of the wind turbine WT 1 for the frequency range of infrasound
Figure 4.2-3: Narrow band spectra of background noise and total noise at a far range from the wind turbine WT 1 for the frequency range of infrasound
Linear sound level in dB
Frequency in Hz
6420 18161412108 242220
0
10
20
30
50
80
70
40
60
Total noise
MP1 / 150 m
Background noise
Linear sound level in dB
Frequency in Hz
6420 18161412108 242220
0
10
20
30
50
80
70
40
60
Total noiseBackground noise
MP3 / 700 m
EXHIBIT A5-1
Page 20 of 104
) >,
I - LU:W I I - LU:W I ~--------~ ~--------~
004991
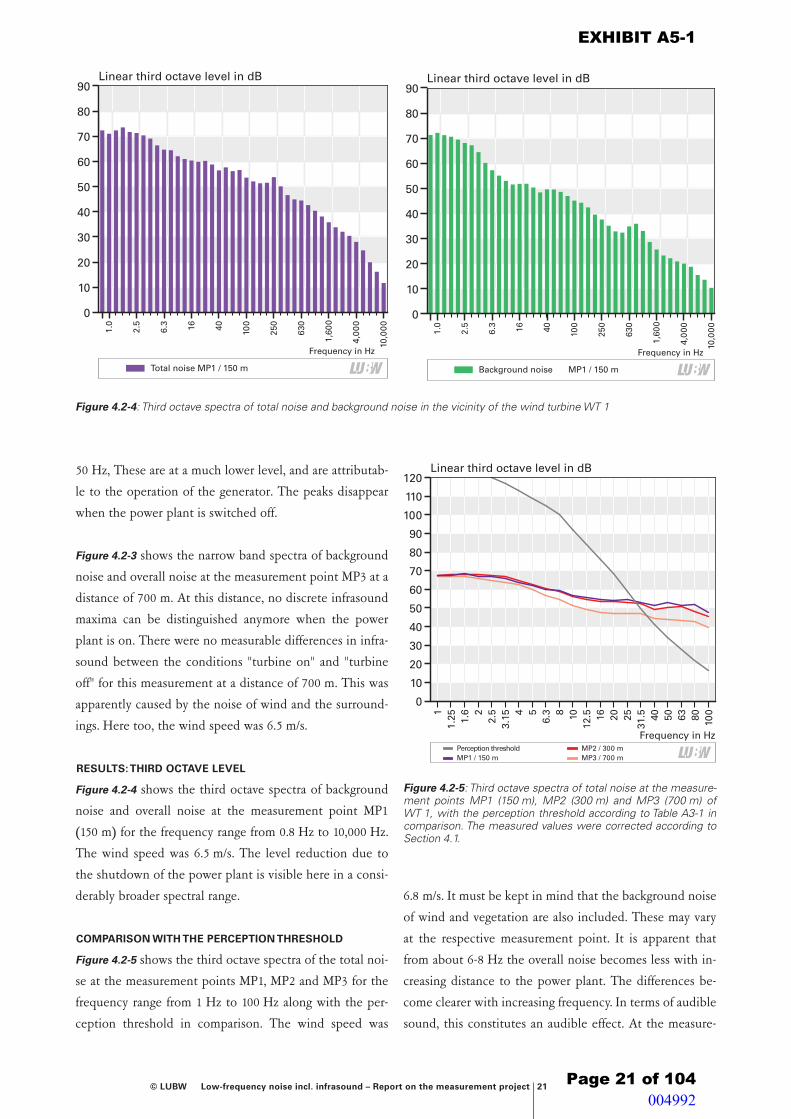
© LUBW Low-frequency noise incl. infrasound – Report on the measurement project 21
50 Hz, These are at a much lower level, and are attributab-
le to the operation of the generator. The peaks disappear
when the power plant is switched off.
Figure 4.2-3 shows the narrow band spectra of background
noise and overall noise at the measurement point MP3 at a
distance of 700 m. At this distance, no discrete infrasound
maxima can be distinguished anymore when the power
plant is on. There were no measurable differences in infra-
sound between the conditions "turbine on" and "turbine
off" for this measurement at a distance of 700 m. This was
apparently caused by the noise of wind and the surround-
ings. Here too, the wind speed was 6.5 m/s.
RESULTS: THIRD OCTAVE LEVEL
Figure 4.2-4 shows the third octave spectra of background
noise and overall noise at the measurement point MP1
(150 m) for the frequency range from 0.8 Hz to 10,000 Hz.
The wind speed was 6.5 m/s. The level reduction due to
the shutdown of the power plant is visible here in a consi-
derably broader spectral range.
COMPARISON WITH THE PERCEPTION THRESHOLD
Figure 4.2-5 shows the third octave spectra of the total noi-
se at the measurement points MP1, MP2 and MP3 for the
frequency range from 1 Hz to 100 Hz along with the per-
ception threshold in comparison. The wind speed was
6.8 m/s. It must be kept in mind that the background noise
of wind and vegetation are also included. These may vary
at the respective measurement point. It is apparent that
from about 6-8 Hz the overall noise becomes less with in-
creasing distance to the power plant. The differences be-
come clearer with increasing frequency. In terms of audible
sound, this constitutes an audible effect. At the measure-
Figure 4.2-4: Third octave spectra of total noise and background noise in the vicinity of the wind turbine WT 1
Linear third octave level in dB
0
10
20
30
50
70
90
40
60
80
10,0
00
4,00
0
1,60
0
630
250
10040166.3
2.5
1.0
Frequency in Hz
Total noise MP1 / 150 m
Linear third octave level in dB
0
10
20
30
50
70
90
40
60
80
10,0
00
4,00
0
1,60
0
630
250
10040166.3
2.5
1.0
Frequency in Hz
Background noise MP1 / 150 m
Linear third octave level in dB
Frequency in Hz
0
10
20
30
50
80
120
40
60
100
70
110
90
10080635040
31.5252016
12.5108
6.354
3.152.52
1.6
1.251
MP3 / 700 mMP2 / 300 m
MP1 / 150 mPerception threshold
Figure 4.2-5: Third octave spectra of total noise at the measure-ment points MP1 (150 m), MP2 (300 m) and MP3 (700 m) of WT 1, with the perception threshold according to Table A3-1 in comparison. The measured values were corrected according to Section 4.1.
EXHIBIT A5-1
Page 21 of 104
- -
- -
- -- -- -- -- --
II -
11 I
I - Lf/:W I I - Lf/:W I
I = -- Lf/:W I
004992
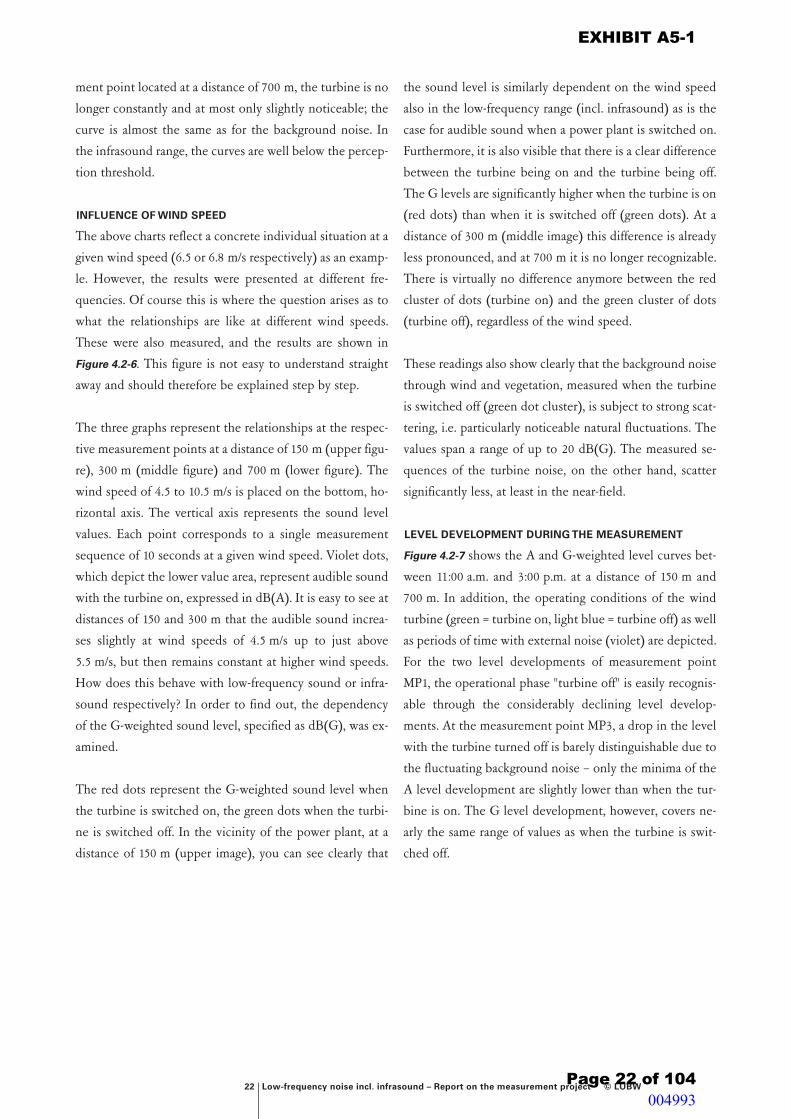
22 Low-frequency noise incl. infrasound – Report on the measurement project © LUBW
ment point located at a distance of 700 m, the turbine is no
longer constantly and at most only slightly noticeable; the
curve is almost the same as for the background noise. In
the infrasound range, the curves are well below the percep-
tion threshold.
INFLUENCE OF WIND SPEED
The above charts reflect a concrete individual situation at a
given wind speed (6.5 or 6.8 m/s respectively) as an examp-
le. However, the results were presented at different fre-
quencies. Of course this is where the question arises as to
what the relationships are like at different wind speeds.
These were also measured, and the results are shown in
Figure 4.2-6. This figure is not easy to understand straight
away and should therefore be explained step by step.
The three graphs represent the relationships at the respec-
tive measurement points at a distance of 150 m (upper figu-
re), 300 m (middle figure) and 700 m (lower figure). The
wind speed of 4.5 to 10.5 m/s is placed on the bottom, ho-
rizontal axis. The vertical axis represents the sound level
values. Each point corresponds to a single measurement
sequence of 10 seconds at a given wind speed. Violet dots,
which depict the lower value area, represent audible sound
with the turbine on, expressed in dB(A). It is easy to see at
distances of 150 and 300 m that the audible sound increa-
ses slightly at wind speeds of 4.5 m/s up to just above
5.5 m/s, but then remains constant at higher wind speeds.
How does this behave with low-frequency sound or infra-
sound respectively? In order to find out, the dependency
of the G-weighted sound level, specified as dB(G), was ex-
amined.
The red dots represent the G-weighted sound level when
the turbine is switched on, the green dots when the turbi-
ne is switched off. In the vicinity of the power plant, at a
distance of 150 m (upper image), you can see clearly that
the sound level is similarly dependent on the wind speed
also in the low-frequency range (incl. infrasound) as is the
case for audible sound when a power plant is switched on.
Furthermore, it is also visible that there is a clear difference
between the turbine being on and the turbine being off.
The G levels are significantly higher when the turbine is on
(red dots) than when it is switched off (green dots). At a
distance of 300 m (middle image) this difference is already
less pronounced, and at 700 m it is no longer recognizable.
There is virtually no difference anymore between the red
cluster of dots (turbine on) and the green cluster of dots
(turbine off), regardless of the wind speed.
These readings also show clearly that the background noise
through wind and vegetation, measured when the turbine
is switched off (green dot cluster), is subject to strong scat-
tering, i.e. particularly noticeable natural fluctuations. The
values span a range of up to 20 dB(G). The measured se-
quences of the turbine noise, on the other hand, scatter
significantly less, at least in the near-field.
LEVEL DEVELOPMENT DURING THE MEASUREMENT
Figure 4.2-7 shows the A and G-weighted level curves bet-
ween 11:00 a.m. and 3:00 p.m. at a distance of 150 m and
700 m. In addition, the operating conditions of the wind
turbine (green = turbine on, light blue = turbine off) as well
as periods of time with external noise (violet) are depicted.
For the two level developments of measurement point
MP1, the operational phase "turbine off" is easily recognis-
able through the considerably declining level develop-
ments. At the measurement point MP3, a drop in the level
with the turbine turned off is barely distinguishable due to
the fluctuating background noise – only the minima of the
A level development are slightly lower than when the tur-
bine is on. The G level development, however, covers ne-
arly the same range of values as when the turbine is swit-
ched off.
EXHIBIT A5-1
Page 22 of 104 004993
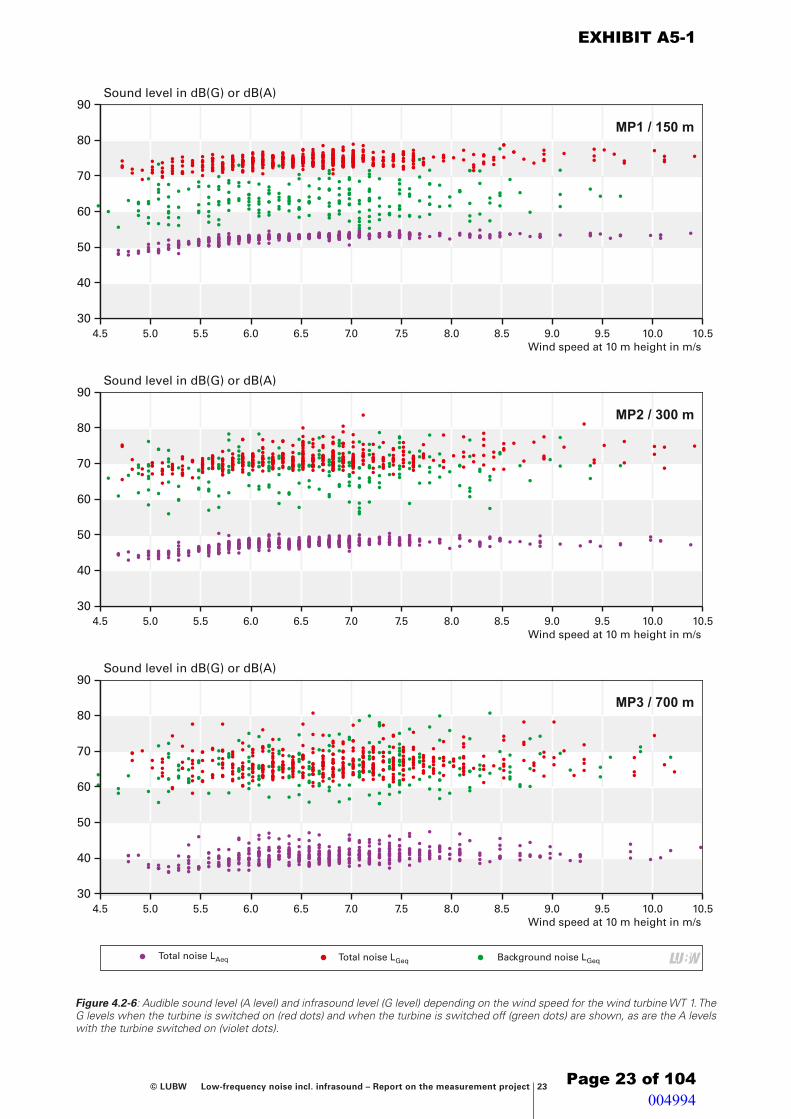
© LUBW Low-frequency noise incl. infrasound – Report on the measurement project 23
Y1
Y1
Y1
Y1
Y1
Y1
MP4 BG LAeq
MP4 HG
MP4 BG
Wind speed at 10 m height in m/s4.5 5.0 5.5 6.0 6.5 7.0 7.5 8.0 8.5 9.0 9.5 10.0 10.5
Sound level in dB(G) or dB(A)
30
40
50
60
70
80
90
Y1
Y1
Y1
Y1
Y1
Y1
MP2 BG LAeq
MP2 HG
MP2 BG
Wind speed at 10 m height in m/s4.5 5.0 5.5 6.0 6.5 7.0 7.5 8.0 8.5 9.0 9.5 10.0 10.5
Sound level in dB(G) or dB(A)
30
40
50
60
70
80
90
Y1
Y1
Y1
Y1
Y1
Y1
MP1 BG LAeq
MP1 HG
MP1 BG
Wind speed at 10 m height in m/s4.5 5.0 5.5 6.0 6.5 7.0 7.5 8.0 8.5 9.0 9.5 10.0 10.5
Sound level in dB(G) or dB(A)
30
40
50
60
70
80
90
MP3 / 700 m
MP1 / 150 m
MP2 / 300 m
Background noise LGeqTotal noise LAeq Total noise LGeq
Figure 4.2-6: Audible sound level (A level) and infrasound level (G level) depending on the wind speed for the wind turbine WT 1. The G levels when the turbine is switched on (red dots) and when the turbine is switched off (green dots) are shown, as are the A levels with the turbine switched on (violet dots).
EXHIBIT A5-1
Page 23 of 104
-
' - .
-
-
-
-
-
-
-
-
' J
-
-
•
:
:,:J]l!!}~~!~ )J.1J!}!j~!)!J}1} 1~~:·=~t~: •••
.. . . ii •. .I I :• • .•• .. ··•·· . 1-:•,,:1•• • . . ·' . • I I • • • I I I • • I •••• I • • • • • •• •:.:: :: •• I .1::••••• :•.
I I I I I I I ! I I I I I I I ! I i I I I I I • I • I I : I I • • • I
I I I I I I I I
. . • • • • : =. :: ... . ·1· ·i ·: i .: : •••• :. :: .- • • • :
; ~ ~ ; ~ ~ : J j~J~ .~ ~ d j J ; ~ ~ ~ H ~ J ~ J ~J~~~ ~ - ~~ : • I • • • • 1• • • • • 1 • • I • •
•• -- •• •: • •11 •:. ,1:I: ••• •1 I • • • I I
. . : •'
. . . . . I
. . •
I
,. • •
• : I I I I I I I I i i I I I I i I I I I I I I I I I I I I I • I • ! . I : I • • • i
. . •• .
.. .
•
I I
.. : . . • I •• •1 •• . . . ...
• · • I 1: •: . •
I I • I
: I I I
I I
I I I 7 I
• • • • • . . · . . . . . . . .. . . .. . .. . . .. . .. . .. . .. . . : • :: II • · ' I J"" ·= ., : .. .. .. I I ·' .. :· I! I • I • ··• 1 1· , , . • I • • 1· •· =•1u·1" 1·• •·· • •· , , :,:1:1 11.:1-i!I,, 1f ,il-l.•1 ·=· 1·,: ···l•·==: •I:
I • • 11 • •• • • I , .. • • • • • • • • I • • • • • I I • • I • • • I • . ·· ... ·:·· .·
i i i ! i i i i ! i I i i I i i ; ! i i • : ! • I
I I I I I
• •
I
I • • .. . . . . . -! •
I •
. . I • •
. . . . I
.. . . .
I • • •
I
.•
. . .
: . . •
I . .
I
I
..
. .
I
• I
I
.. . •
I •
I
. . I
'
004994

24 Low-frequency noise incl. infrasound – Report on the measurement project © LUBW
Figure 4.2-7: Chronological sequence of audible sound level (A level), infrasound level (G level), as well as the wind speed during the measurements of the wind turbine WT 1
Y1
Y1
Y1
Y1
Y1
Y1
Y1
Y1
Störung
Anlage aus
Anlage an
LAeq,10 secLGeq,10 sec
20
40
50
60
70
80
90
Time
11:0
0
11:3
0
12:0
0
12:3
0
13:0
0
13:3
0
14:0
0
14:3
0
13:1
5
13:4
5
14:1
5
14:4
5
11:1
5
11:4
5
12:1
5
12:4
5
15:0
0
100Sound level in dB(G) or dB(A)
Y1
Y1
Y1
Y1
Y1
Y1
Y1
Windgeschwindigkeit in 10 m Höhe in m/sLAeq,10 secLGeq,10 sec
Windgeschwindigkeit in 10 m Höhe in m/s
0
5
10
15
Wind speed at 10 m height in m/s20
Y1
Y1
Y1
Y1
Y1
Y1
Y1
Y1
Störgeräusch
Anlage aus
Anlage an
LAeq,10 secLGeq,10 sec
Time
11:0
0
11:3
0
12:0
0
12:3
0
13:0
0
13:3
0
14:0
0
14:3
0
13:1
5
13:4
5
14:1
5
14:4
5
11:1
5
11:4
5
12:1
5
12:4
5
15:0
0
20
40
50
60
70
80
90
100Sound level in dB(G) or dB(A)
MP3 / 700 m
MP1 / 150 m
MP1 / 150 m Level LA eq
MP1 / 150 m Level LG eqMP3 / 700 m Level LA eq
MP3 / 700 m Level LG eq Extraneous noise or disturbance
Turbine on Turbine off
EXHIBIT A5-1
Page 24 of 104
-
I = I = -
004995

© LUBW Low-frequency noise incl. infrasound – Report on the measurement project 25
4.3 Noise at wind turbine 2: Enercon E-66 – 1.8 MW
BASIC CONDITIONS
The wind turbine 2 (WT 2) is a gearless unit by the com-
pany Enercon, Model E-66 18/70 (Figure 4-2) with a nomi-
nal generator capacity of 1.8 MW. The rotor diameter is
70 m, the hub height above ground is 86 m. The immedia-
te vicinity of the turbine consists of agricultural land, with
forest partly adjacent to it. Further wind turbines are loca-
ted in the vicinity. These were completely turned off du-
ring the measurement period in order to prevent extrane-
ous noise. A further wind power plant is located at a
distance of about 1.5 km; this was in operation during the
measurement period. A path in close proximity is allowed
to be used only by agricultural traffic and is used very sel-
dom. The measurements were carried out on 02.11.2013
between 10:00 a.m. and 6:00 p.m. The position of the mi-
crophone at the measurement point MP1 was at a distance
of 120 m from the power plant, measurement point MP2 at
a distance of 240 m, both in a downwind direction (in or-
der to take into account the propagation of sound through
the wind). The microphone at the measurement point
MP3 was positioned at a distance of 300 m from the tower
axis and deviated by 30° from the prevailing wind di rection.
A measurement point at a distance of 700 meters was not
possible at this site. Figure 4.3-1 provides an impression.
The measurement was performed in a wind speed range of
5 to 15 m/s (measured at 10 m height), a temperature range
of 11 to 12.5 °C, an air pressure range of 926 to 927 hPa and
in a power range of 0 to 1,800 kW. The turbulence intensi-
ty (see Appendix A3) during the measurement was 28 %
and thus relatively high.
RESULTS: NARROW BAND LEVEL
Figure 4.3-2 shows the narrow band spectra of background
noise and overall noise at the measurement point MP1 at a
distance of 120 m with a resolution of 0.1 Hz. The wind
speed was 9 m/s. With the turbine turned on, several
discrete maxima can be observed in the infrasound range
below 8 Hz. This concerns infrasound generated by the ro-
tor due to its motion. The measured frequencies are in ac-
cordance with the passage frequency of a rotor blade and
its harmonic overtones. At 22.5 rpm, the speed at which
the turbine was running, one can mathematically determi-
ne the peaks at 2.2 Hz, 3.4 Hz, 4.5 Hz, 5.6 Hz, 6.8 Hz and
7.9 Hz with good conformance. They disappear when the
turbine is turned off; at a distance of 300 m they occur
Figure 4.3-1: Measurement point MP1 with microphone, rever-berant plate and dual wind screen. In the background: wind tur-bine WT 2 at a distance of 120 m. Photo: Wölfel company.
Figure 4.3-2 Narrow band spectra of background noise and total noise in the vicinity of the wind turbine WT 2 for the frequency range of infrasound
Linear sound level in dB
Frequency in Hz
6420 18161412108 242220
0
10
20
30
50
80
70
40
60
Total noise
MP1 / 120 m
Background noise
EXHIBIT A5-1
Page 25 of 104
I - Lf/:N I
004996

26 Low-frequency noise incl. infrasound – Report on the measurement project © LUBW
only faintly (not shown). The level peak at approx. 17 Hz
that is clearly visible in the background is probably due to
extraneous noise.
RESULTS: THIRD OCTAVE LEVEL
Figure 4.3-3 shows the third octave spectra of background
noise and overall noise at the measurement point MP1 at a
distance of 120 m for the frequency range from 0.8 Hz to
10,000 Hz. The wind speed was 9 m/s. The level reduction
through switching off the turbine is recognizable in a much
broader spectral range here.
COMPARISON WITH THE PERCEPTION THRESHOLD
Figure 4.3-4 shows the third octave spectra of the total noi-
se at the measurement points MP1, MP2 and MP3 for the
frequency range from 1 Hz to 100 Hz along with the per-
ception threshold in comparison. The wind speed was
9 m/s. The background noise of wind and vegetation are
also included. These may vary at the respective measure-
ment point. The measurement points MP2 and MP3 are
further away from the turbine than measurement point
MP1 (240 m and 300 m compared to 120 m). This is where
somewhat lower values are also measured, which becomes
more apparent with increasing frequency. In the range of
infrasound, the curves are well below the perception
threshold.
INFLUENCE OF WIND SPEED
In order to investigate the dependency of low-frequency
emissions on wind speed, numerous readings were taken
and are depicted in Figure 4.3-5. The three charts represent
the conditions at distances of 120 m (MP1, upper figure),
240 m (MP2, middle figure) and 300 m with a lateral dis-
placement by 30° to the wind direction (MP3, lower figu-
re). The violet dots in the lower range of values represent
audible sound, expressed in dB(A). In the upper image it
Linear third octave level in dB
0
10
20
30
50
70
90
40
60
80
10,0
00
4,00
0
1,60
0
630
250
10040166.3
2.5
1.0
Frequency in Hz
Total noise MP1 / 120 m
Linear third octave level in dB
0
10
20
30
50
70
90
40
60
80
10,0
00
4,00
0
1,60
0
630
250
10040166.3
2.5
1.0
Frequency in Hz
Background noise MP1 / 120 m
Figure 4.3-3: Third octave spectra of total noise and background noise in the vicinity of the wind turbine WT 2
Linear third octave level in dB
Frequency in Hz
0
10
20
30
50
80
120
40
60
100
70
110
90
10080635040
31.5252016
12.5108
6.354
3.152.52
1.6
1.251
MP3 / 300 mMP2 / 240 m
MP1 / 120 mPerception threshold
Figure 4.3-4: Third octave spectra of total noise at the measure-ment points MP1 (120 m), MP2 (240 m) and MP3 (300 m) of WT 2, with the perception threshold according to Table A3-1 in comparison. The measured values were corrected according to Section 4.1.
EXHIBIT A5-1
Page 26 of 104
~I _ _________ Lfl_:w~I ~I _ _________ Lfl_:w~I
I = --- Lf/:W I
004997
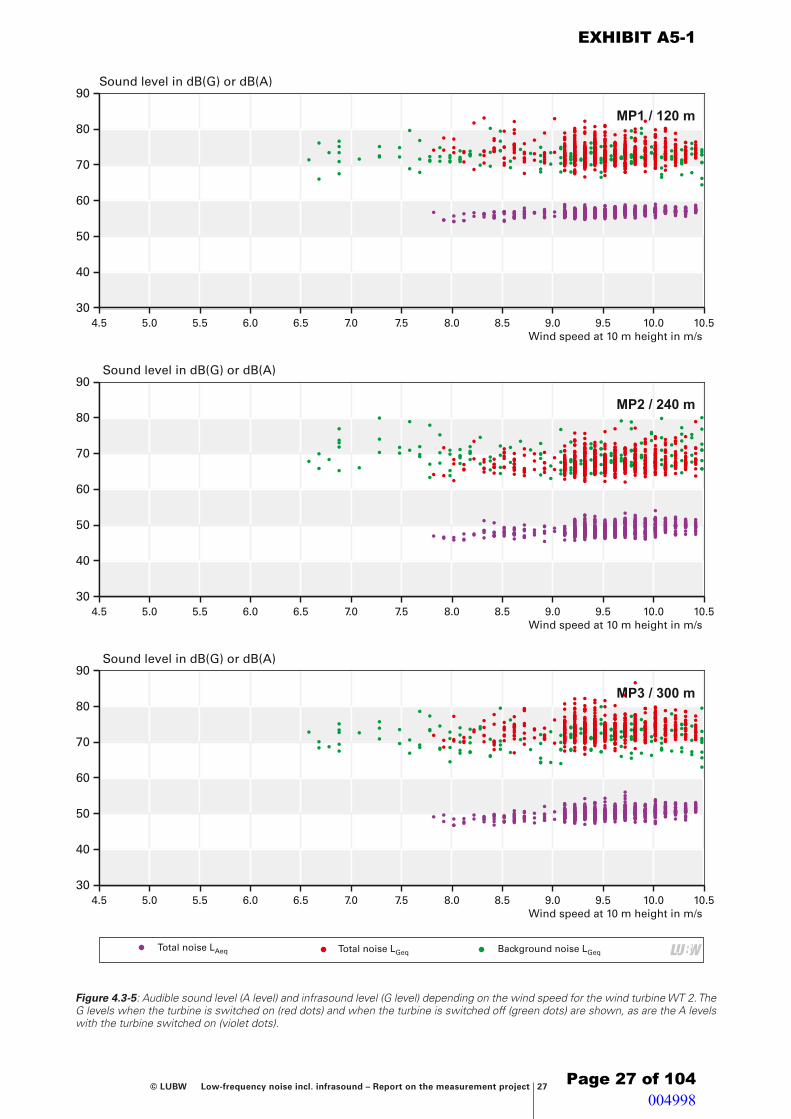
© LUBW Low-frequency noise incl. infrasound – Report on the measurement project 27
Y1
Y1
Y1
Y1
Y1
Y1
MP3 BG LAeq
MP3 HG
MP3 BG
Wind speed at 10 m height in m/s4.5 5.0 5.5 6.0 6.5 7.0 7.5 8.0 8.5 9.0 9.5 10.0 10.5
Sound level in dB(G) or dB(A)
30
40
50
60
70
80
90
Y1
Y1
Y1
Y1
Y1
Y1
MP2 BG LAeq
MP2 HG
MP2 BG
Wind speed at 10 m height in m/s4.5 5.0 5.5 6.0 6.5 7.0 7.5 8.0 8.5 9.0 9.5 10.0 10.5
Sound level in dB(G) or dB(A)
30
40
50
60
70
80
90
Y1
Y1
Y1
Y1
Y1
Y1
MP1 BG LAeq
MP1 HG
MP1 BG
Wind speed at 10 m height in m/s4.5 5.0 5.5 6.0 6.5 7.0 7.5 8.0 8.5 9.0 9.5 10.0 10.5
Sound level in dB(G) or dB(A)
30
40
50
60
70
80
90
MP3 / 300 m
MP1 / 120 m
MP2 / 240 m
Background noise LGeqTotal noise LAeq Total noise LGeq
Figure 4.3-5: Audible sound level (A level) and infrasound level (G level) depending on the wind speed for the wind turbine WT 2. The G levels when the turbine is switched on (red dots) and when the turbine is switched off (green dots) are shown, as are the A levels with the turbine switched on (violet dots).
EXHIBIT A5-1
Page 27 of 104
-
-
-
-
-
I I I I
-
-
-
-
-
I I I I
-
-
-
-
-
I I I I
•
. • .
.
• . .
• . • • • •
I
. . .
I
. . • . . . . . .
I
•
. •
. • .
. . . . . . • • • - I • •J ;~• 1• • • •I : • I •
• • • • • I 1••1'J :_. ;~f~~~~~~i~~ ~ ~ ~ ;~·d1=l.~~q! • • I •• .. • • • •• • •• I • • • .
• • : : I I I : I I • I : I I I I I I I I I I I I I I
I I I I I I
• • • : • ; ; I I : I : I ! I I I I I i I I i I I I I
I I I I I I
. . . • :~=i~•.:.· ·1 . . .. · .. • . . .. ... · •·: .
• •••••• ••• I • I • • • • . .. . . • . ::·=•= =··== I.: ·:•·.:I ·I ·lil=l:li: :1-1=1.l i • 1 I • • • •• • •• el I I • • I • • • I • • : • • • • • • • • I . . . . . .
• : : I : I I I I I : i : I I i I I I I I I I I I I I
I I I I I I
• Lfl:NI
004998

28 Low-frequency noise incl. infrasound – Report on the measurement project © LUBW
can be seen clearly that the measured A levels are higher at
a distance of 120 m than at the measurement points at a
distance of 240 m and 300 m from the power plant. The
turbine was perceived to be louder at a distance of 120 m
than at a distance of 240 m.
The red dots represent the G-weighted sound level when
the turbine is switched on, the green dots when the turbi-
ne is switched off. The upper image shows that at the mea-
surement point MP1, i.e. in the near field at a distance of
120 m from the power plant, the G-weighted sound pressu-
re level during operation of the wind power plant is appro-
ximately constant and minimally higher than that of the
background noise when the turbine is not running. A simi-
lar situation is given at the measurement points MP2 and
MP3. Hardly any differences can be seen between the mea-
sured values, as the red and green dot clusters pretty-much
overlap each other.
Y1
Y1
Y1
Y1
Y1
Y1
Y1
Y1
Störung
Anlage aus
Anlage an
LAeq,10 secLGeq,10 sec
20
40
50
60
70
80
90
Time
10:3
0
11:3
0
12:0
0
12:3
0
13:0
0
13:4
5
14:4
5
16:0
0
13:1
5
14:1
5
15:1
5
16:3
0
13:3
0
14:3
0
15:3
0
14:0
0
15:0
0
16:1
5
11:0
0
10:4
5
11:1
5
11:4
5
12:1
5
12:4
5
16:4
5
15:4
5
100Sound level in dB(G) or dB(A)
Y1
Y1
Y1
Y1
Y1
Y1
Y1
Windgeschwindigkeit in 10 m Höhe in m/sLAeq,10 secLGeq,10 sec
Windgeschwindigkeit in 10 m Höhe in m/s
0
5
10
15
Wind speed at 10 m height in m/s20
Y1
Y1
Y1
Y1
Y1
Y1
Y1
Y1
Störgeräusch
Anlage aus
Anlage an
LAeq,10 secLGeq,10 sec
Time
10:3
0
11:3
0
12:0
0
12:3
0
13:0
0
13:4
5
14:4
5
16:0
0
13:1
5
14:1
5
15:1
5
16:3
0
13:3
0
14:3
0
15:3
0
14:0
0
15:0
0
16:1
5
11:0
0
10:4
5
11:1
5
11:4
5
12:1
5
12:4
5
16:4
5
15:4
5
20
40
50
60
70
80
90
100Sound level in dB(G) or dB(A)
MP2 / 240 m
MP1 / 120 m
MP1 / 120 m Level LA eq
MP1 / 120 m Level LG eqMP2 / 240 m Level LA eq
MP2 / 240 m Level LG eq Turbine onTurbine off
Extraneous noiseor disturbance
Figure 4.3-6: Chronological sequence of audible sound level (A level), infrasound level (G level), as well as the wind speed during the measurements at the wind turbine WT 2
EXHIBIT A5-1
Page 28 of 104
I = I = - Lfl:wl
004999
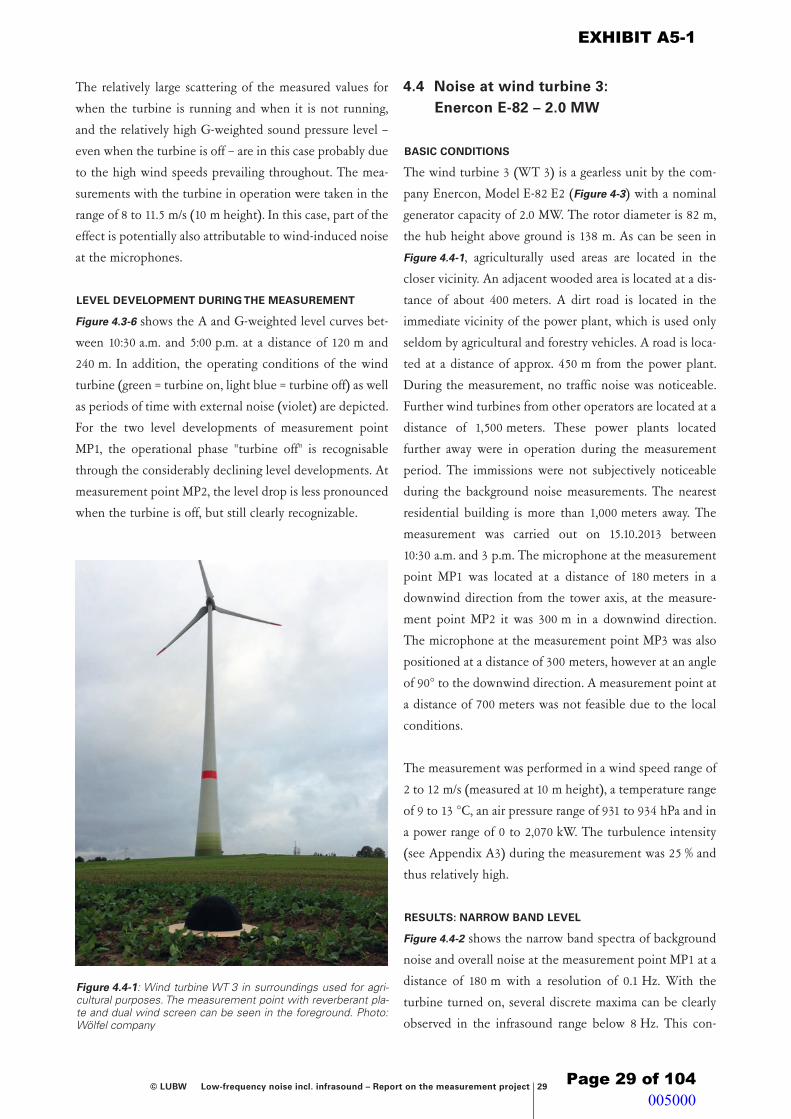
© LUBW Low-frequency noise incl. infrasound – Report on the measurement project 29
The relatively large scattering of the measured values for
when the turbine is running and when it is not running,
and the relatively high G-weighted sound pressure level –
even when the turbine is off – are in this case probably due
to the high wind speeds prevailing throughout. The mea-
surements with the turbine in operation were taken in the
range of 8 to 11.5 m/s (10 m height). In this case, part of the
effect is potentially also attributable to wind-induced noise
at the microphones.
LEVEL DEVELOPMENT DURING THE MEASUREMENT
Figure 4.3-6 shows the A and G-weighted level curves bet-
ween 10:30 a.m. and 5:00 p.m. at a distance of 120 m and
240 m. In addition, the operating conditions of the wind
turbine (green = turbine on, light blue = turbine off) as well
as periods of time with external noise (violet) are depicted.
For the two level developments of measurement point
MP1, the operational phase "turbine off" is recognisable
through the considerably declining level developments. At
measurement point MP2, the level drop is less pronounced
when the turbine is off, but still clearly recognizable.
4.4 Noise at wind turbine 3: Enercon E-82 – 2.0 MW
BASIC CONDITIONS
The wind turbine 3 (WT 3) is a gearless unit by the com-
pany Enercon, Model E-82 E2 (Figure 4-3) with a nominal
generator capacity of 2.0 MW. The rotor diameter is 82 m,
the hub height above ground is 138 m. As can be seen in
Figure 4.4-1, agriculturally used areas are located in the
closer vicinity. An adjacent wooded area is located at a dis-
tance of about 400 meters. A dirt road is located in the
immediate vicinity of the power plant, which is used only
seldom by agricultural and forestry vehicles. A road is loca-
ted at a distance of approx. 450 m from the power plant.
During the measurement, no traffic noise was noticeable.
Further wind turbines from other operators are located at a
distance of 1,500 meters. These power plants located
further away were in operation during the measurement
period. The immissions were not subjectively noticeable
during the background noise measurements. The nearest
residential building is more than 1,000 meters away. The
measurement was carried out on 15.10.2013 between
10:30 a.m. and 3 p.m. The microphone at the measurement
point MP1 was located at a distance of 180 meters in a
downwind direction from the tower axis, at the measure-
ment point MP2 it was 300 m in a downwind direction.
The microphone at the measurement point MP3 was also
positioned at a distance of 300 meters, however at an angle
of 90° to the downwind direction. A measurement point at
a distance of 700 meters was not feasible due to the local
conditions.
The measurement was performed in a wind speed range of
2 to 12 m/s (measured at 10 m height), a temperature range
of 9 to 13 °C, an air pressure range of 931 to 934 hPa and in
a power range of 0 to 2,070 kW. The turbulence intensity
(see Appendix A3) during the measurement was 25 % and
thus relatively high.
RESULTS: NARROW BAND LEVEL
Figure 4.4-2 shows the narrow band spectra of background
noise and overall noise at the measurement point MP1 at a
distance of 180 m with a resolution of 0.1 Hz. With the
turbine turned on, several discrete maxima can be clearly
observed in the infrasound range below 8 Hz. This con-
Figure 4.4-1: Wind turbine WT 3 in surroundings used for agri-cultural purposes. The measurement point with reverberant pla-te and dual wind screen can be seen in the foreground. Photo: Wölfel company
EXHIBIT A5-1
Page 29 of 104 005000

30 Low-frequency noise incl. infrasound – Report on the measurement project © LUBW
cerns infrasound generated by the rotor due to its motion.
The measured frequencies correspond to the passage fre-
quency of a rotor blade (here about 0.83 Hz) and the asso-
ciated harmonic overtones (2.5 Hz, 3.3 Hz, 4.1 Hz, 5 Hz,
5.8 Hz). The peaks disappear when the power plant is swit-
ched off, and occur only slightly at a distance of 300 m
(Figure 4.4-3). The wind speed was 6 m/s during both mea-
surements.
RESULTS: THIRD OCTAVE LEVEL
Figure 4.4-4 shows the third octave spectra of background
noise and overall noise at the measurement point MP1 at a
distance of 180 m for the frequency range from 0.8 Hz to
10,000 Hz. The wind speed was 6 m/s. Here the level re-
duction through switching off the turbine is recognizable
in a much broader spectral range.
Linear sound level in dB
Frequency in Hz
6420 18161412108 242220
0
10
20
30
50
80
70
40
60
Total noise
MP1 / 180 m
Background noise
Figure 4.4-2: Narrow band spectra of background noise and total noise in the vicinity of the wind turbine WT 3 for the frequency range of infrasound
Linear sound level in dB
Frequency in Hz
6420 18161412108 242220
0
10
20
30
50
80
70
40
60
Total noiseBackground noise
MP3 / 300 m
Figure 4.4-3: Narrow band spectra of background noise and total noise in the far range of the wind turbine WT 3 for the frequency range of infrasound
Linear third octave level in dB
0
10
20
30
50
70
90
40
60
80
10,0
00
4,00
0
1,60
0
630
250
10040166.3
2.5
1.0
Frequency in Hz
Total noise MP1 / 180 m
Linear third octave level in dB
0
10
20
30
50
70
90
40
60
80
10,0
00
4,00
0
1,60
0
630
250
10040166.3
2.5
1.0
Frequency in Hz
Background noise MP1 / 180 m
Figure 4.4-4: Third octave spectra of total noise and background noise in the vicinity of the wind turbine WT 3
EXHIBIT A5-1
Page 30 of 104
I - Lf/:N I I - Lf/:N I ~------~ ~------~
- -- -- -- -- -- -- -- h1 -
1111 I I
I - Lf/:N I I - Lf/:N I
005001
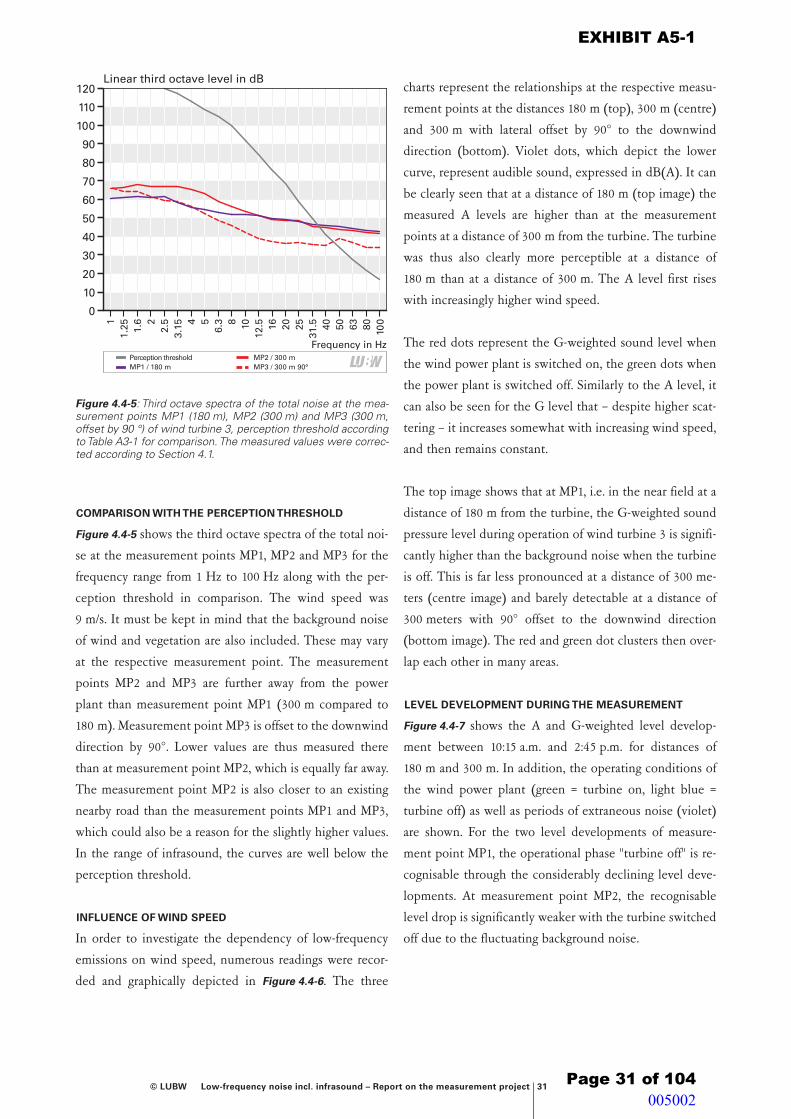
© LUBW Low-frequency noise incl. infrasound – Report on the measurement project 31
COMPARISON WITH THE PERCEPTION THRESHOLD
Figure 4.4-5 shows the third octave spectra of the total noi-
se at the measurement points MP1, MP2 and MP3 for the
frequency range from 1 Hz to 100 Hz along with the per-
ception threshold in comparison. The wind speed was
9 m/s. It must be kept in mind that the background noise
of wind and vegetation are also included. These may vary
at the respective measurement point. The measurement
points MP2 and MP3 are further away from the power
plant than measurement point MP1 (300 m compared to
180 m). Measurement point MP3 is offset to the downwind
direction by 90°. Lower values are thus measured there
than at measurement point MP2, which is equally far away.
The measurement point MP2 is also closer to an existing
nearby road than the measurement points MP1 and MP3,
which could also be a reason for the slightly higher values.
In the range of infrasound, the curves are well below the
perception threshold.
INFLUENCE OF WIND SPEED
In order to investigate the dependency of low-frequency
emissions on wind speed, numerous readings were recor-
ded and graphically depicted in Figure 4.4-6. The three
charts represent the relationships at the respective measu-
rement points at the distances 180 m (top), 300 m (centre)
and 300 m with lateral offset by 90° to the downwind
direction (bottom). Violet dots, which depict the lower
curve, represent audible sound, expressed in dB(A). It can
be clearly seen that at a distance of 180 m (top image) the
measured A levels are higher than at the measurement
points at a distance of 300 m from the turbine. The turbine
was thus also clearly more perceptible at a distance of
180 m than at a distance of 300 m. The A level first rises
with increasingly higher wind speed.
The red dots represent the G-weighted sound level when
the wind power plant is switched on, the green dots when
the power plant is switched off. Similarly to the A level, it
can also be seen for the G level that – despite higher scat-
tering – it increases somewhat with increasing wind speed,
and then remains constant.
The top image shows that at MP1, i.e. in the near field at a
distance of 180 m from the turbine, the G-weighted sound
pressure level during operation of wind turbine 3 is signifi-
cantly higher than the background noise when the turbine
is off. This is far less pronounced at a distance of 300 me-
ters (centre image) and barely detectable at a distance of
300 meters with 90° offset to the downwind direction
(bottom image). The red and green dot clusters then over-
lap each other in many areas.
LEVEL DEVELOPMENT DURING THE MEASUREMENT
Figure 4.4-7 shows the A and G-weighted level develop-
ment between 10:15 a.m. and 2:45 p.m. for distances of
180 m and 300 m. In addition, the operating conditions of
the wind power plant (green = turbine on, light blue =
turbine off) as well as periods of extraneous noise (violet)
are shown. For the two level developments of measure-
ment point MP1, the operational phase "turbine off" is re-
cognisable through the considerably declining level deve-
lopments. At measurement point MP2, the recognisable
level drop is significantly weaker with the turbine switched
off due to the fluctuating background noise.
Linear third octave level in dB
Frequency in Hz
0
10
20
30
50
80
120
40
60
100
70
110
90
10080635040
31.5252016
12.5108
6.354
3.152.52
1.6
1.251
MP3 / 300 m 90°MP2 / 300 m
MP1 / 180 mPerception threshold
Figure 4.4-5: Third octave spectra of the total noise at the mea-surement points MP1 (180 m), MP2 (300 m) and MP3 (300 m, offset by 90 °) of wind turbine 3, perception threshold according to Table A3-1 for comparison. The measured values were correc-ted according to Section 4.1.
EXHIBIT A5-1
Page 31 of 104
Lfl:W I
005002

32 Low-frequency noise incl. infrasound – Report on the measurement project © LUBW
Y1
Y1
Y1
Y1
Y1
Y1
MP3 BG LAeq
MP3 HG
MP3 BG
Wind speed at 10 m height in m/s4.5 5.0 5.5 6.0 6.5 7.0 7.5 8.0 8.5 9.0 9.5 10.0 10.5
Sound level in dB(G) or dB(A)
30
40
50
60
70
80
90
Y1
Y1
Y1
Y1
Y1
Y1
MP2 BG LAeq
MP2 HG
MP2 BG
Wind speed at 10 m height in m/s4.5 5.0 5.5 6.0 6.5 7.0 7.5 8.0 8.5 9.0 9.5 10.0 10.5
Sound level in dB(G) or dB(A)
30
40
50
60
70
80
90
Y1
Y1
Y1
Y1
Y1
Y1
MP1 BG LAeq
MP1 HG
MP1 BG
Wind speed at 10 m height in m/s4.5 5.0 5.5 6.0 6.5 7.0 7.5 8.0 8.5 9.0 9.5 10.0 10.5
Sound level in dB(G) or dB(A)
30
40
50
60
70
80
90
MP3 / 300 m / 90°
MP1 / 180 m
MP2 / 300 m
Background noise LGeqTotal noise LAeq Total noise LGeq
Figure 4.4-6: Audible sound level (A level) and infrasound level (G level) depending on the wind speed for the wind turbine WT 3. The G levels when the turbine is switched on (red dots) and when the turbine is switched off (green dots) are shown, as are the A levels with the turbine switched on (violet dots).
EXHIBIT A5-1
Page 32 of 104
-• • • •; ••'I• I•• •• 1 • 1 ii • • I • -1•11,il• •·11·1 ;1 .• = ·•.·•=•.·1·•······ .:· ,l•••·•.1::·•····• . ·•• .· . ..
- 1 _' • •• • : 1 ., : •• • • : •• i I ! .i I 11 •1111 r1 I.I i. • : . ', •• • : • : I • • • • I • • : . . . . . . . . . . . i i 11 j ii 1 ·, j i I 11~ ! 11 1 •' ! ! !i 1 ~ 11 i • .
• -
. -
-
I
. .
I I I I
•• . -·· I : I I • . -; sai•
. . . . . . : . . . • • •1 ••• I • • •, : : •• • . I =~ i i : I I .: ·, I ! =: i J ! I : I • ! ·:
: • •• • i ... : · ·•.: .· - . . ... •1!.•···=·· .. ·.· ..... •: .. . . . . . .
-
-
-
-
I
. •
I
, .
I
• I • • • • : • • •••
I
I I . ... •
. I • .
I • .
I
. . ... •
. : .
I
1• I • I •I I • •• • • ••= =··· ···i= •... ·•I· ...
• • • • • I . . : ..
••: : .· • • • - ... ..... ··•·1·•·· . I • I • I •• I I·= • • •• I ••
ii . • I I • • • I I • • I . . .. . . .. . . . . . -
. . .. . . • .... .
• • • I I I ! i ! I I ! I • I I : .
• • • • I • I • • I I : • I : • I I • I • • I • • • I • . . . . - . . I I I I I I
• •
• • • •
I
. . ... ...
• • I
.
I
. . . • • •
•
• • • I •
I
•
. . . •
• • • I
I
. . :•
I I •
I
.. .. . ..
I
.... •:: . . .. . ..
. . . . • • • I I I • • •
I
I I .
... .. • • • I :
I
• . . : . . .
I
. . • •
• I . .
. . .
I
. . . . .
• I • : • I • • • • . ..
I I
• I :
. : . .
I
I I : ..
. : . • • •
I
. . . ... .
• •
I
005003

© LUBW Low-frequency noise incl. infrasound – Report on the measurement project 33
Y1
Y1
Y1
Y1
Y1
Y1
Y1
Y1
Störgeräusch
Anlage aus
Anlage an
LAeq,10 secLGeq,10 sec
20
40
50
60
70
80
90
Time
10:1
5
10:3
0
10:4
5
11:0
0
11:3
0
12:0
0
12:3
0
13:0
0
13:3
0
14:0
0
14:3
0
13:1
5
13:4
5
14:1
5
11:1
5
11:4
5
12:1
5
12:4
5
14:4
5
100Sound level in dB(G) or dB(A)
Y1
Y1
Y1
Y1
Y1
Y1
Y1
Windgeschwindigkeit in 10 m Höhe in m/sLAeq,10 secLGeq,10 sec
Windgeschwindigkeit in 10 m Höhe in m/s
0
5
10
15
Wind speed at 10 m height in m/s20
Y1
Y1
Y1
Y1
Y1
Y1
Y1
Y1
Störgeräusch
Anlage aus
Anlage an
LAeq,10 secLGeq,10 sec
Time
10:1
5
10:3
0
10:4
5
11:0
0
11:3
0
12:0
0
12:3
0
13:0
0
13:3
0
14:0
0
14:3
0
13:1
5
13:4
5
14:1
5
11:1
5
11:4
5
12:1
5
12:4
5
14:4
5
20
40
50
60
70
80
90
100Sound level in dB(G) or dB(A)
MP2 / 300 m
MP1 / 180 m
MP1 / 150 m Level LA eq
MP1 / 150 m Level LG eqMP3 / 700 m Level LA eq
MP3 / 700 m Level LG eq Turbine onTurbine off
Extraneous noiseor disturbance
Figure 4.4-7: Chronological sequence of audible sound level (A level), infrasound level (G level), as well as the wind speed during the measurements of the wind turbine WT 3
EXHIBIT A5-1
Page 33 of 104 005004

34 Low-frequency noise incl. infrasound – Report on the measurement project © LUBW
4.5 Noise at wind turbine 4: REpower 3.2M114 – 3.2 MW
BASIC CONDITIONS
The wind turbine 4 (WT 4) is a unit by the company RE-
power, type 3.2M114 (Figure 4-4) with a nominal generator
capacity of 3.2 MW. The rotor diameter is 114 m, the hub
height 143 m.
The measured wind turbine is part of a wind farm with
several other wind turbines. The adjacent turbines were
completely turned off during the measurement period in
order to prevent extraneous noise. The vicinity of the tur-
bine consists of agricultural land. A dirt road in the imme-
diate vicinity of the measured turbine is rarely used by ag-
ricultural traffic. A forest is located further away. Further
wind turbines were in operation at distances of 0.7 km and
2 km, in the opposite direction to the measurement points.
Their noise could not be subjectively perceived at any
time. The measurements were carried out on 20.03.2014
between 10:00 a.m. and 9:30 p.m. The position of the mi-
crophone at the measurement point MP1 was at a distance
of 180 m from the turbine, measurement point MP2 and
MP3 at a distance of 300 m and measurement point MP4 at
a distance of 650 m, in a downwind direction respectively,
in order to take into account the most adverse case (pro-
motion of sound propagation through the wind). The mea-
surement point MP2, located directly next to measurement
point MP3, served as a comparative measurement point. Its
microphone was provided with a primary wind screen and
placed into an approx. 50 cm deep hole that was dug espe-
cially for that purpose. A secondary wind screen covered
the hole flush. The parallel measurements were taken at
the measurement points MP2 and MP3 in order to enable
a comparison of the measurement values and enable con-
clusions to be made regarding wind-induced sound com-
ponents arising at the microphone. The two measurement
points MP2 and MP3, as well as the measured turbine, can
be seen in Figure 4.5-1. Figures 4.5-2 to 4.5-5 provide an im-
pression of the conditions on site and the measurement
technology used.
The measurement was performed in a wind speed range of
3 to 7 m/s (measured at 10 m height), a temperature range
Figure 4.5-3: Reverberant plate with mounted microphone and dual wind screen. The type DUO measurement device is moun-ted on a tripod next to it and is connected to the microphone via a measuring cable. Photo: LUBW
Figure 4.5-2: View inside the power plant with 143 m hub height. Photo: LUBW
Figure 4.5-1 (right): Measurement points MP2 and MP3 at a dis-tance of 300 m from the tower axis. Reverberant plate and dou-ble wind screen (left), spanned hole in the ground (right). Photo: Wölfel company
EXHIBIT A5-1
Page 34 of 104 005005

© LUBW Low-frequency noise incl. infrasound – Report on the measurement project 35
of 15 to 19 °C, an air pressure range of 979 to 981 hPa and
in a power range of 0 to 3,170 kW. The turbulence intensity
(see Appendix A3) during the measurement was 15 %.
RESULTS: NARROW BAND LEVEL
Figure 4.5-6 shows the narrow band spectra of background
noise and overall noise at the measurement point MP1 at a
distance of 180 m with a resolution of 0.1 Hz. With the
turbine turned on, clearly visible maxima can be seen in
the infrasound range. The measured frequencies corres-
pond to the passage frequency of a rotor blade (here appro-
ximately 0.6 Hz) and its harmonic overtones at 1.2 Hz,
1.8 Hz, 2.4 Hz, 3 Hz, etc. This concerns infrasound genera-
ted by the rotor due to its motion. The peaks disappear
when the turbine is switched off. Figure 4.5-7 shows the
narrowband spectra of background noise and total noise at
the measurement point MP4 at a distance of 650 m. At this
location the discrete infrasound maxima (see measurement
point MP1) are still detectable with the wind power plant
turned on. The recognizable slightly higher levels at mea-
surement point MP4, with frequencies lower than 5 Hz,
cannot be attributed to turbine operation. The cause for
Figure 4.5-4: Anemometer mast for measuring wind speed and wind direction, air pressure, humidity and temperature. The mast is extended to 10 m (not yet extended in the image). Photo: LUBW
Figure 4.5-5: Data is constantly collected inside the system du-ring the measurement and transmitted by radio (left). Photo: LUBW
Linear sound level in dB
Frequency in Hz
6420 18161412108 242220
0
10
20
30
50
80
70
40
60
Total noise
MP1 / 180 m
Background noise
Linear sound level in dB
Frequency in Hz
6420 18161412108 242220
0
10
20
30
50
80
70
40
60
Total noiseBackground noise
MP4 / 650 m
Figure 4.5-6: Narrow band spectra of background noise and total noise in the vicinity of the wind turbine WT 4 for the frequency range of infrasound
Figure 4.5-7: Narrow band spectra of background noise and total noise in the far range of the wind turbine WT 4 for the frequency range of infrasound
EXHIBIT A5-1
Page 35 of 104
~I -_________ Lu_:w~I l~-_________ Lu_:w~I
005006

36 Low-frequency noise incl. infrasound – Report on the measurement project © LUBW
the up to 10 dB higher values is another background noise
at the measurement point MP4 compared to the measure-
ment point MP1. The wind speed was 5.5 m/s for both
measurements.
The comparison of narrowband spectra for the two measu-
rement points MP2 and MP3 in Figures 4.5-8 to 4.5-9 shows
that there is no significant difference between the two
measurement points for the range of infrasound. The wind
speed was 5.5 m/s respectively. It can therefore be assumed
that below 20 Hz neither the absorption of the secondary
wind screen nor the ground influences play a role. The in-
crease in level towards lower frequencies was present in
this measurement to an equal extent both with and wit-
hout a hole in the ground. The expected reduction in the
wind-induced background noise in the infrasound range
cannot be observed in a direct comparison between the
two measurement points. Further investigations regarding
the issue of noise at the microphone induced by the wind
were thus not deemed necessary.
Linear third octave level in dB
0
10
20
30
50
70
90
40
60
80
10,0
00
4,00
0
1,60
0
630
250
10040166.3
2.5
1.0
Frequency in Hz
Total noise MP1 / 180 m
Linear third octave level in dB
0
10
20
30
50
70
90
40
60
80
10,0
00
4,00
0
1,60
0
630
250
10040166.3
2.5
1.0
Frequency in Hz
Background noise MP1 / 180 m
Figure 4.5-10: Third octave spectra of total noise and background noise in the vicinity of the wind turbine WT 4
Linear sound level in dB
Frequency in Hz
6420 18161412108 242220
0
10
20
30
50
80
70
40
60
MP3 - hole in the ground
Total noise
MP2 - reverberant plate
Linear sound level in dB
Frequency in Hz
6420 18161412108 242220
0
10
20
30
50
80
70
40
60
MP3 - hole in the ground
Background noise
MP2 - reverberant plate
Figure 4.5-8: Narrowband spectra of the total noise at the mea-surement points MP2 (reverberant plate) and MP3 (hole in the ground) of the wind turbine WT 4 for the range of infrasound. The distance from the turbine was 300 m
Figure 4.5-9: Narrowband spectra of the background noise at the measurement points MP2 (reverberant plate) and MP3 (hole in the ground) of the wind turbine WT 4 for the range of infra-sound. The distance from the turbine was 300 m.
EXHIBIT A5-1
Page 36 of 104
I - Lfl:W I I - Lfl:W I ~-------~ ~-------~
- -- -- -- -- -- -- -II
- -Ill 1111
I I
I - Lfl:W I I - Lfl:W I
005007

© LUBW Low-frequency noise incl. infrasound – Report on the measurement project 37
RESULTS: THIRD OCTAVE LEVEL
Figure 4.5-10 shows the third octave spectra of background
noise and overall noise at the measurement point MP1 at a
distance of 180 m for the frequency range from 0.8 Hz to
10,000 Hz. The wind speed was 5.5 m/s. Here the level re-
duction through switching off the turbine is recognizable
in a much broader spectral range.
COMPARISON WITH THE PERCEPTION THRESHOLD
Figure 4.5-11 shows the third octave spectra of the total
noise at the measurement points MP1, MP2 and MP4 for
the frequency range from 1 Hz to 100 Hz along with the
perception threshold in comparison. The wind speed was
5.5 m/s. It must be kept in mind that the background noise
of wind and vegetation are also included. These may vary
at the respective measurement point. The measurement
points MP2 and MP4 are further away from the turbine
than MP1 (300 m and 650 m compared to 180 m). This is
where somewhat lower values are also measured, which
becomes more apparent with increasing frequency. In the
range of infrasound, the curves are well below the percep-
tion threshold.
INFLUENCE OF WIND SPEED
In order to investigate the dependency of low-frequency
emissions on wind speed, numerous readings were recor-
ded and graphically depicted in Figure 4.5-12. The three
charts represent the relationships at the respective measu-
rement points at the distances 180 m (top), 300 m (centre)
and 650 m (bottom). Violet dots, which depict the lower
value area, represent audible sound, expressed in dB(A). It
can be seen clearly that the measured A levels are higher at
a distance of 180 m (upper image) than at the measure-
ment points at a distance of 300 m and 650 m from the
turbine.
The red dots represent the G-weighted sound level when
the wind turbine is switched on, the green dots when the
turbine is switched off. The data shows that the G-weigh-
ted sound pressure level of the tested measurement points
increases slightly during operation of the wind turbine
with increasing wind speed. For the G-weighted sound
pressure level of the background noise, no connection can
be ascertained with the wind speed for the main part of the
measuring period. However, the readings are also in a simi-
lar order with the turbine switched off due to strongly fluc-
tuating wind conditions (gusts, turbulence). Lower levels
were observed for the background noise merely for a late,
roughly 30-minute measurement period from 8:50 p.m. on-
wards. During this period, the mean normalized wind
speed was relatively constant at 5.5 m/s.
LEVEL DEVELOPMENT DURING THE MEASUREMENT
Figure 4.5-13 shows the A and G-weighted level develop-
ment between 4:00 p.m. and 9.00 p.m. for the distances of
180 m and 650 m. In addition, the operating conditions of
the wind power plant (green = turbine on, light blue =
turbine off) as well as periods of extraneous noise (violet)
are shown. For the two level developments of measure-
ment point MP1, the operational phase "turbine off" is re-
cognisable through the considerably declining level deve-
lopments. A level drop is also evident with the turbine
switched off at measurement point MP3.
Linear third octave level in dB
Frequency in Hz
0
10
20
30
50
80
120
40
60
100
70
110
90
10080635040
31.5252016
12.5108
6.354
3.152.52
1.6
1.251
MP4 / 650 mMP2 / 300 m
MP1 / 180 mPerception threshold
Figure 4.5-11: Third octave spectra of total noise at the measure-ment points MP1 (180 m), MP2 (300 m) and MP4 (650 m) of WT 4, with the perception threshold according to Table A3-1 in comparison. The measured values were corrected according to Section 4.1.
EXHIBIT A5-1
Page 37 of 104
I = -- Lf/:W I
005008

38 Low-frequency noise incl. infrasound – Report on the measurement project © LUBW
Y1
Y1
Y1
Y1
Y1
Y1
MP4 BG LAeq
MP4 HG
MP4 BG
Wind speed at 10 m height in m/s4.5 5.0 5.5 6.0 6.5 7.0 7.5 8.0 8.5 9.0 9.5 10.0 10.5
Sound level in dB(G) or dB(A)
30
40
50
60
70
80
90
Y1
Y1
Y1
Y1
Y1
Y1
MP2 BG LAeq
MP2 HG
MP2 BG
Wind speed at 10 m height in m/s4.5 5.0 5.5 6.0 6.5 7.0 7.5 8.0 8.5 9.0 9.5 10.0 10.5
Sound level in dB(G) or dB(A)
30
40
50
60
70
80
90
Y1
Y1
Y1
Y1
Y1
Y1
MP1 BG LAeq
MP1 HG
MP1 BG
Wind speed at 10 m height in m/s4.5 5.0 5.5 6.0 6.5 7.0 7.5 8.0 8.5 9.0 9.5 10.0 10.5
Sound level in dB(G) or dB(A)
30
40
50
60
70
80
90
MP4 / 650 m
MP1 / 180 m
MP2 / 300 m
Background noise LGeqTotal noise LAeq Total noise LGeq
Figure 4.5-12: Audible sound level (A level) and infrasound level (G level) depending on the wind speed for the wind turbine WT 4. The G levels when the turbine is switched on (red dots) and when the turbine is switched off (green dots) are shown, as are the A levels with the turbine switched on (violet dots).
EXHIBIT A5-1
Page 38 of 104
-
-
. .. . .. . . . . . -- ~~•~J~}1~J) i~~~~~~JJ1a~~~~:;·.:s; : • ,1111,1•. •·. •• 1
•• ' ··=·· - • • • I • • • • I I • • • I • I I I I I I • • I I I
-
I I I I I I I I I
-
-
-: • ·. 1· :· · • .- ·.=1• ill I I· 1•1•rl 1·• 1 • • • . . •. 1:1:IJ:' 1·1: l -1=-=l:I' : . : .,:. ·,.!: : ··=·• ! . . ·11· J , .. . ·•··· •..
• • • • I I I I a " • "
-I • I I I I • I I I I I I I I I i I I I I I I I I I I I • • I
-
I I I I I I I I I I I
-
- • I 1 • • I • • • • • • . .. ··J·1·1·1··111. · ··•.1 1:1•1 1 IJ i1=1·h=I =1. ·1 , .• =rl: .,;.~ -!.· = •••• I I I I I I I • • • I I • I • • •
- . -
I I I I I I I I I I I i I I I I I i I I : I I I i ! ! : ; I I T I ' I I I I I I I
• • •
005009

© LUBW Low-frequency noise incl. infrasound – Report on the measurement project 39
Y1
Y1
Y1
Y1
Y1
Y1
Y1
Y1
Störgeräusch
Anlage aus
Anlage an
LAeq,10 secLGeq,10 sec
20
40
50
60
70
80
90
Time
16:0
0
16:3
0
17:0
0
17:3
0
18:0
0
18:3
0
19:0
0
20:0
0
18:1
5
18:4
5
19:3
0
20:3
0
16:1
5
16:4
5
17:1
5
17:4
5
21:0
0
19:4
5
19:1
5
20:1
5
20:4
5
100Sound level in dB(G) or dB(A)
Y1
Y1
Y1
Y1
Y1
Y1
Y1
Windgeschwindigkeit in 10 m Höhe in m/sLAeq,10 secLGeq,10 sec
Windgeschwindigkeit in 10 m Höhe in m/s
0
5
10
15
Wind speed at 10 m height in m/s20
Y1
Y1
Y1
Y1
Y1
Y1
Y1
Y1
Störgeräusch
Anlage aus
Anlage an
LAeq,10 secLGeq,10 sec
Time
16:0
0
16:3
0
17:0
0
17:3
0
18:0
0
18:3
0
19:0
0
20:0
0
18:1
5
18:4
5
19:3
0
20:3
0
16:1
5
16:4
5
17:1
5
17:4
5
21:0
0
19:4
5
19:1
5
20:1
5
20:4
5
20
40
50
60
70
80
90
100Sound level in dB(G) or dB(A)
MP4 / 650 m
MP1 / 180 m
MP1 / 180 m Level LA eq
MP1 / 180 m Level LG eqMP4 / 650 m Level LA eq
MP4 / 650 m Level LG eq Turbine onTurbine off
Extraneous noiseor disturbance
Figure 4.5-13: Chronological sequence of audible sound level (A level), infrasound level (G level), as well as the wind speed during the measurements at wind turbine WT 4
EXHIBIT A5-1
Page 39 of 104
Lf/:NI
005010

40 Low-frequency noise incl. infrasound – Report on the measurement project © LUBW
4.6 Noise at wind turbine 5: Nordex N117 – 2.4 MW
BASIC CONDITIONS
The wind turbine 5 (WT 5) is a unit by the company Nor-
dex, type N117/2400, with a nominal generator capacity of
2.4 MW (Figure 4-3 and 4.6-1). The rotor diameter is 117 m,
the hub height above ground is 140.6 m.
The measured turbine is part of a wind farm with several
wind turbines. The adjacent turbines were completely tur-
ned off during the measurement period in order to prevent
extraneous noise. The vicinity of the turbine consists of
agricultural land. A dirt road is located in the immediate
vicinity of the turbine, which is used only very seldom by
agricultural and forestry vehicles. A district road is located
about 400 meters south of the investigated wind power
plant, and another road roughly 1,000 m east. During the
measurement, no traffic noise was subjectively perceptible.
A forest is located further away. The measurements were
carried out on 13.01.2015 between 11:00 a.m. and 4:00 p.m.
The microphone position of the measurement point MP1
was 185 meters from the turbine, the measurement point
MP2 300 m and the measurement points MP3 and MP4
each 650 m from the turbine. All measurement points were
located in a downwind direction in order to take into ac-
count a generally unfavourable situation (promotion of
sound propagation through the wind). The measurement
points MP3 and MP4 were immediately next to one ano-
ther and served as a comparison. The microphone MP3 was
provided with a primary wind screen and placed into an
approx. 50 cm deep hole that was dug especially for that
purpose. A secondary wind screen covered the hole flush.
The parallel measurements were taken at the measurement
points MP3 and MP4 in order to enable a comparison of
the levels and allow conclusions to be made regarding
wind-induced sound components arising at the micropho-
ne.
The measurement was performed in a wind speed range of
5 to 12 m/s (measured at 10 m height), a temperature range
of 10 to 13 °C, an air pressure range of 975 to 979 hPa and
in a power range of 0 to 2,400 kW. The turbulence intensi-
ty (see Appendix A3) during the measurement was 13 %.
RESULTS: NARROW BAND LEVEL
Figures 4.6-2 to 4.6-5 show narrow band spectra of back-
ground noise and total noise for different measurement
locations with a resolution of 0.1 Hz. The wind speed was
7.6 m/s during the measurement of the total noise and
6.9 m/s during the measurement of the background noise.
Figure 4.6-2 shows the results of measurement point MP1
at a distance of 185 m. With the turbine turned on, several
discrete maxima can be seen in the infrasound range below
6 Hz. This concerns infrasound generated by the rotor due
to its motion. The measured frequencies correspond to the
passage frequency of a rotor blade of about 0.6 Hz and its
harmonized overtones at 1.2 Hz, 1.7 Hz, 2.3 Hz, 2.9 Hz,
3.5 Hz, 3.9 Hz, etc. The peaks disappear when the turbine
is switched off.
Figure 4.6-3 shows the narrow band spectra of background
noise and overall noise at the measurement point MP4 at a
distance of 650 m. At this distance, the infrasound maxima Figure 4.6-1: Wind turbine WT 5 in surroundings used for agri-cultural purposes. In the foreground you can see the 10 m high wind measurement mast. Photo: Wölfel company
EXHIBIT A5-1
Page 40 of 104 005011
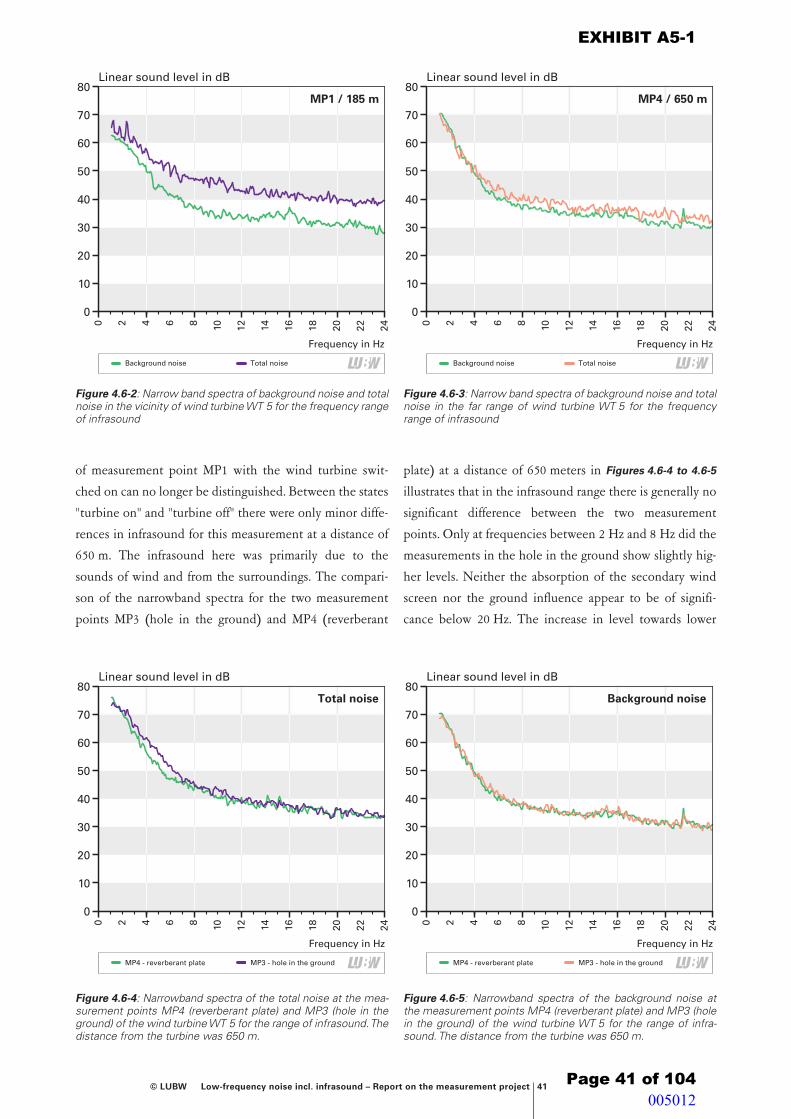
© LUBW Low-frequency noise incl. infrasound – Report on the measurement project 41
of measurement point MP1 with the wind turbine swit-
ched on can no longer be distinguished. Between the states
"turbine on" and "turbine off" there were only minor diffe-
rences in infrasound for this measurement at a distance of
650 m. The infrasound here was primarily due to the
sounds of wind and from the surroundings. The compari-
son of the narrowband spectra for the two measurement
points MP3 (hole in the ground) and MP4 (reverberant
plate) at a distance of 650 meters in Figures 4.6-4 to 4.6-5
illustrates that in the infrasound range there is generally no
significant difference between the two measurement
points. Only at frequencies between 2 Hz and 8 Hz did the
measurements in the hole in the ground show slightly hig-
her levels. Neither the absorption of the secondary wind
screen nor the ground influence appear to be of signifi-
cance below 20 Hz. The increase in level towards lower
Linear sound level in dB
Frequency in Hz
6420 18161412108 242220
0
10
20
30
50
80
70
40
60
Total noise
MP1 / 185 m
Background noise
Linear sound level in dB
Frequency in Hz
6420 18161412108 242220
0
10
20
30
50
80
70
40
60
MP3 - hole in the ground
Total noise
MP4 - reverberant plate
Linear sound level in dB
Frequency in Hz
6420 18161412108 242220
0
10
20
30
50
80
70
40
60
Total noiseBackground noise
MP4 / 650 m
Linear sound level in dB
Frequency in Hz
6420 18161412108 242220
0
10
20
30
50
80
70
40
60
MP3 - hole in the ground
Background noise
MP4 - reverberant plate
Figure 4.6-2: Narrow band spectra of background noise and total noise in the vicinity of wind turbine WT 5 for the frequency range of infrasound
Figure 4.6-4: Narrowband spectra of the total noise at the mea-surement points MP4 (reverberant plate) and MP3 (hole in the ground) of the wind turbine WT 5 for the range of infrasound. The distance from the turbine was 650 m.
Figure 4.6-3: Narrow band spectra of background noise and total noise in the far range of wind turbine WT 5 for the frequency range of infrasound
Figure 4.6-5: Narrowband spectra of the background noise at the measurement points MP4 (reverberant plate) and MP3 (hole in the ground) of the wind turbine WT 5 for the range of infra-sound. The distance from the turbine was 650 m.
EXHIBIT A5-1
Page 41 of 104
I - Lfl:W I I - Lfl:W I ~--------~ ~--------~
~I -_________ Lu_:w~I l~-_________ Lu_:w~I
005012
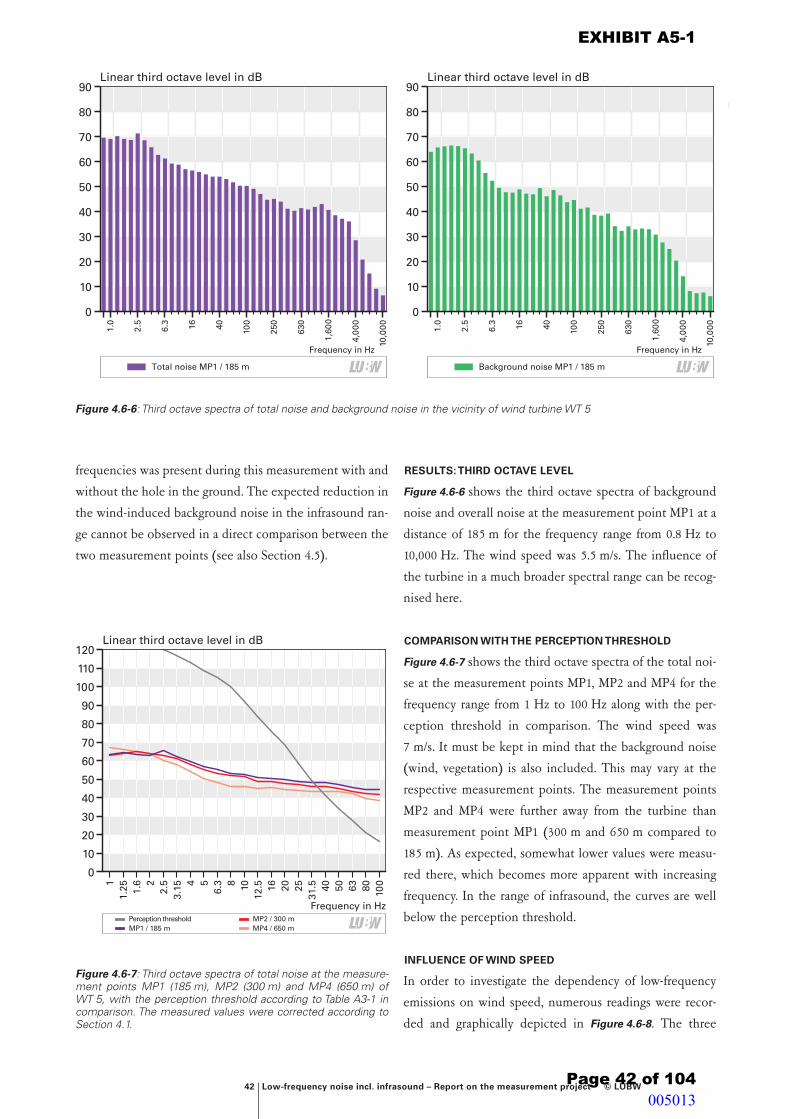
42 Low-frequency noise incl. infrasound – Report on the measurement project © LUBW
frequencies was present during this measurement with and
without the hole in the ground. The expected reduction in
the wind-induced background noise in the infrasound ran-
ge cannot be observed in a direct comparison between the
two measurement points (see also Section 4.5).
RESULTS: THIRD OCTAVE LEVEL
Figure 4.6-6 shows the third octave spectra of background
noise and overall noise at the measurement point MP1 at a
distance of 185 m for the frequency range from 0.8 Hz to
10,000 Hz. The wind speed was 5.5 m/s. The influence of
the turbine in a much broader spectral range can be recog-
nised here.
COMPARISON WITH THE PERCEPTION THRESHOLD
Figure 4.6-7 shows the third octave spectra of the total noi-
se at the measurement points MP1, MP2 and MP4 for the
frequency range from 1 Hz to 100 Hz along with the per-
ception threshold in comparison. The wind speed was
7 m/s. It must be kept in mind that the background noise
(wind, vegetation) is also included. This may vary at the
respective measurement points. The measurement points
MP2 and MP4 were further away from the turbine than
measurement point MP1 (300 m and 650 m compared to
185 m). As expected, somewhat lower values were measu-
red there, which becomes more apparent with increasing
frequency. In the range of infrasound, the curves are well
below the perception threshold.
INFLUENCE OF WIND SPEED
In order to investigate the dependency of low-frequency
emissions on wind speed, numerous readings were recor-
ded and graphically depicted in Figure 4.6-8. The three
Linear third octave level in dB
Frequency in Hz
0
10
20
30
50
80
120
40
60
100
70
110
90
10080635040
31.5252016
12.5108
6.354
3.152.52
1.6
1.251
MP4 / 650 mMP2 / 300 m
MP1 / 185 mPerception threshold
Figure 4.6-7: Third octave spectra of total noise at the measure-ment points MP1 (185 m), MP2 (300 m) and MP4 (650 m) of WT 5, with the perception threshold according to Table A3-1 in comparison. The measured values were corrected according to Section 4.1.
Linear third octave level in dB
0
10
20
30
50
70
90
40
60
80
10,0
00
4,00
0
1,60
0
630
250
10040166.3
2.5
1.0
Frequency in Hz
Total noise MP1 / 185 m
Linear third octave level in dB
0
10
20
30
50
70
90
40
60
80
10,0
00
4,00
0
1,60
0
630
250
10040166.3
2.5
1.0
Frequency in Hz
Background noise MP1 / 185 m
Figure 4.6-6: Third octave spectra of total noise and background noise in the vicinity of wind turbine WT 5
EXHIBIT A5-1
Page 42 of 104
- -
- -
- -
- -
- -
- -
- -
- -II 11111
I I
I - Lf/:W I I - Lf/:W I
-
I = -- Lf/:W I
005013

© LUBW Low-frequency noise incl. infrasound – Report on the measurement project 43
Y1
Y1
Y1
Y1
Y1
Y1
MP4 BG LAeq. db(A)
MP4 HG LGeq. db(G)
MP4 BG LGeq. db(G)
Wind speed at 10 m height in m/s4.5 5.0 5.5 6.0 6.5 7.0 7.5 8.0 8.5 9.0 9.5 10.0 10.5
Sound level in dB(G) or dB(A)
30
40
50
60
70
80
90
Y1
Y1
Y1
Y1
Y1
Y1
MP2 BG LAeq. db(A)
MP2 HG LGeq. db(G)
MP2 BG LGeq. db(G)
Wind speed at 10 m height in m/s4.5 5.0 5.5 6.0 6.5 7.0 7.5 8.0 8.5 9.0 9.5 10.0 10.5
Sound level in dB(G) or dB(A)
30
40
50
60
70
80
90
Y1
Y1
Y1
Y1
Y1
Y1
MP1 BG LAeq. db(A)
MP1 HG LGeq. db(G)
MP1 BG LGeq. db(G)
Wind speed at 10 m height in m/s4.5 5.0 5.5 6.0 6.5 7.0 7.5 8.0 8.5 9.0 9.5 10.0 10.5
Sound level in dB(G) or dB(A)
30
40
50
60
70
80
90
MP4 / 650 m
MP1 / 185 m
MP2 / 300 m
Background noise LGeqTotal noise LAeq Total noise LGeq
Figure 4.6-8: Audible sound level (A level) and infrasound level (G level) depending on the wind speed for the wind turbine WT 5. The G levels when the turbine is switched on (red dots) and when the turbine is switched off (green dots) are shown, as are the A levels with the turbine switched on (violet dots).
EXHIBIT A5-1
Page 43 of 104
-
-
-
-
-
-
-
-
-
-
-
-
-
• • i : 1 , • 1 1111 I ! 1 11111 i i i 111 i 111 i J .I_: i°! .i Ii: • , .i : 1 : •• •• • • • • • • • .. : : • I • • • • • I : I ••••
• • I • • ; I I I I I i I : I I • I ! : I I I • : • I • • : • • • • . .
• . . . • • • I
• • I • • I • 1 I I I I I I I I I I I I I I I I I I I I I I I I I I I I I I I I • I • 1 • • • . . . .
I I I I I I I I I I I
• • 1 ! · : ! • 1J.i • .i i i I i 1.i I i_i l•i.1-11-i i i:if l I ::1~=1 l,i:i ! · ·, 1·1 • ·== ... . ...... =···· . .. .. ·:. ..... . . • 1111 ·• I • •• • • • • • • I I I O I • • • • I • I • •
• • • I • • ! • I I I I I I I I I I I I I I I I I I I I I I I I I I I I I I I I I I • I I I • :
I I I I I I I I I I
• I I • • • 11••1 •1 • •• •• I • • • .- : : : I I !,i,1:111:1 I 11,I ..• 1.1. ·11: .1111 i I.I !J 1-1 1:,:i 1;: : • I • i ·::
•• • • I •I r 1 1• • ••• •:• 1• • • • •
••• ••••• I 1•11 1••••1 ••la• ••=••: • • • • • i ! I : I I i • I I I I I I I I i I I I i I I I I I I ! I I I : I . ~ . : • .
I I I I I I I I I I
• • •
. . • •
I
. . . .
. . . I
• • .
005014
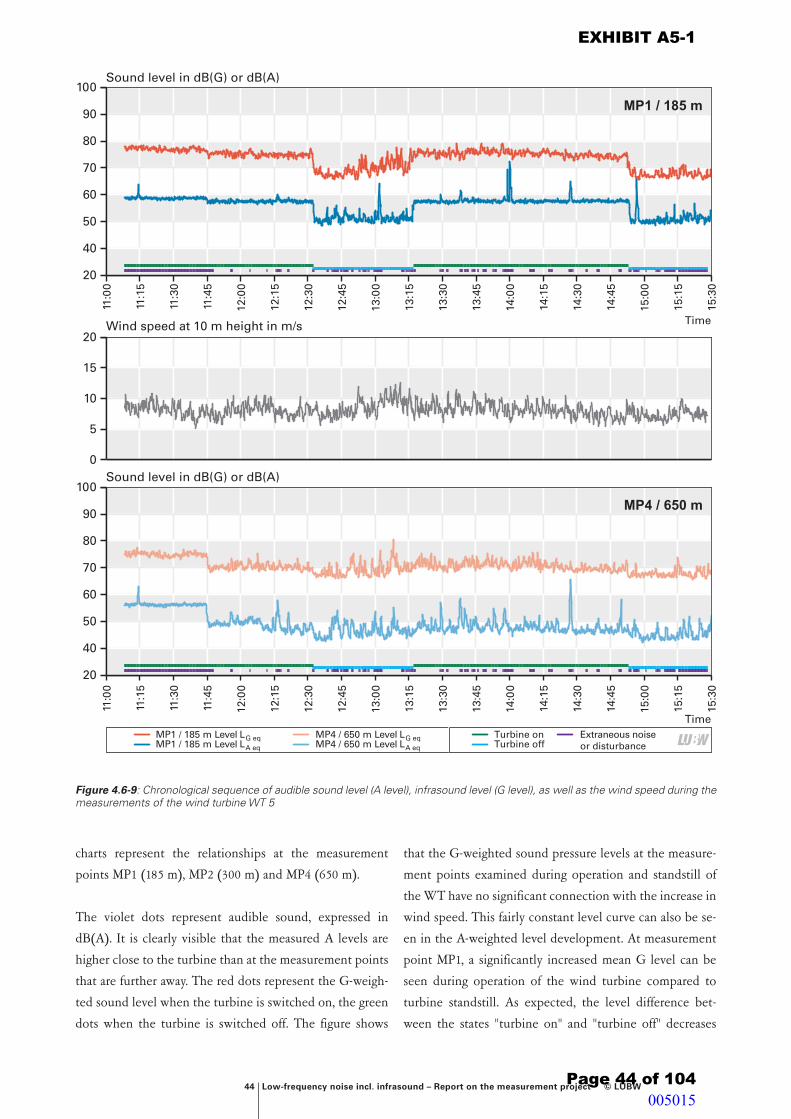
44 Low-frequency noise incl. infrasound – Report on the measurement project © LUBW
charts represent the relationships at the measurement
points MP1 (185 m), MP2 (300 m) and MP4 (650 m).
The violet dots represent audible sound, expressed in
dB(A). It is clearly visible that the measured A levels are
higher close to the turbine than at the measurement points
that are further away. The red dots represent the G-weigh-
ted sound level when the turbine is switched on, the green
dots when the turbine is switched off. The figure shows
that the G-weighted sound pressure levels at the measure-
ment points examined during operation and standstill of
the WT have no significant connection with the increase in
wind speed. This fairly constant level curve can also be se-
en in the A-weighted level development. At measurement
point MP1, a significantly increased mean G level can be
seen during operation of the wind turbine compared to
turbine standstill. As expected, the level difference bet-
ween the states "turbine on" and "turbine off" decreases
Y1
Y1
Y1
Y1
Y1
Y1
Y1
Y1
Störgeräusch
Anlage aus
Anlage an
LAeq,10 secLGeq,10 sec
20
40
50
60
70
80
90
Time
11:0
0
11:3
0
12:0
0
12:3
0
13:0
0
13:3
0
14:0
0
14:3
0
13:1
5
13:4
5
14:1
5
14:4
5
11:1
5
11:4
5
12:1
5
12:4
5
15:3
0
15:1
5
15:0
0
100Sound level in dB(G) or dB(A)
Y1
Y1
Y1
Y1
Y1
Y1
Y1
Windgeschwindigkeit in 10 m Höhe in m/sLAeq,10 secLGeq,10 sec
Windgeschwindigkeit in 10 m Höhe in m/s
0
5
10
15
Wind speed at 10 m height in m/s20
Y1
Y1
Y1
Y1
Y1
Y1
Y1
Y1
Störgeräusch
Anlage aus
Anlage an
LAeq,10 secLGeq,10 sec
Time
11:0
0
11:3
0
12:0
0
12:3
0
13:0
0
13:3
0
14:0
0
14:3
0
13:1
5
13:4
5
14:1
5
14:4
5
11:1
5
11:4
5
12:1
5
12:4
5
15:3
0
15:1
5
15:0
0
20
40
50
60
70
80
90
100Sound level in dB(G) or dB(A)
MP4 / 650 m
MP1 / 185 m
MP1 / 185 m Level LA eq
MP1 / 185 m Level LG eqMP4 / 650 m Level LA eq
MP4 / 650 m Level LG eq Turbine onTurbine off
Extraneous noiseor disturbance
Figure 4.6-9: Chronological sequence of audible sound level (A level), infrasound level (G level), as well as the wind speed during the measurements of the wind turbine WT 5
EXHIBIT A5-1
Page 44 of 104
LELLI EEL L ,,_ • --
•=
LELLI EEL L ,,_ • --
•=
005015
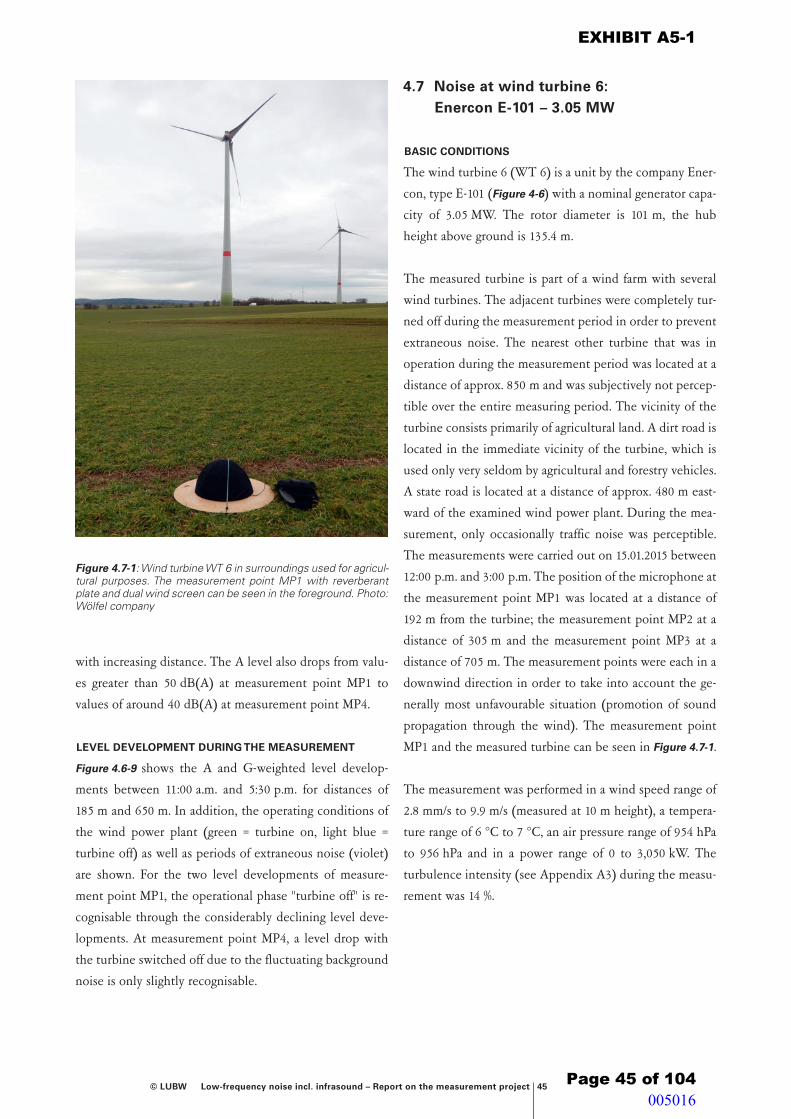
© LUBW Low-frequency noise incl. infrasound – Report on the measurement project 45
with increasing distance. The A level also drops from valu-
es greater than 50 dB(A) at measurement point MP1 to
values of around 40 dB(A) at measurement point MP4.
LEVEL DEVELOPMENT DURING THE MEASUREMENT
Figure 4.6-9 shows the A and G-weighted level develop-
ments between 11:00 a.m. and 5:30 p.m. for distances of
185 m and 650 m. In addition, the operating conditions of
the wind power plant (green = turbine on, light blue =
turbine off) as well as periods of extraneous noise (violet)
are shown. For the two level developments of measure-
ment point MP1, the operational phase "turbine off" is re-
cognisable through the considerably declining level deve-
lopments. At measurement point MP4, a level drop with
the turbine switched off due to the fluctuating background
noise is only slightly recognisable.
4.7 Noise at wind turbine 6: Enercon E-101 – 3.05 MW
BASIC CONDITIONS
The wind turbine 6 (WT 6) is a unit by the company Ener-
con, type E-101 (Figure 4-6) with a nominal generator capa-
city of 3.05 MW. The rotor diameter is 101 m, the hub
height above ground is 135.4 m.
The measured turbine is part of a wind farm with several
wind turbines. The adjacent turbines were completely tur-
ned off during the measurement period in order to prevent
extraneous noise. The nearest other turbine that was in
operation during the measurement period was located at a
distance of approx. 850 m and was subjectively not percep-
tible over the entire measuring period. The vicinity of the
turbine consists primarily of agricultural land. A dirt road is
located in the immediate vicinity of the turbine, which is
used only very seldom by agricultural and forestry vehicles.
A state road is located at a distance of approx. 480 m east-
ward of the examined wind power plant. During the mea-
surement, only occasionally traffic noise was perceptible.
The measurements were carried out on 15.01.2015 between
12:00 p.m. and 3:00 p.m. The position of the microphone at
the measurement point MP1 was located at a distance of
192 m from the turbine; the measurement point MP2 at a
distance of 305 m and the measurement point MP3 at a
distance of 705 m. The measurement points were each in a
downwind direction in order to take into account the ge-
nerally most unfavourable situation (promotion of sound
propagation through the wind). The measurement point
MP1 and the measured turbine can be seen in Figure 4.7-1.
The measurement was performed in a wind speed range of
2.8 mm/s to 9.9 m/s (measured at 10 m height), a tempera-
ture range of 6 °C to 7 °C, an air pressure range of 954 hPa
to 956 hPa and in a power range of 0 to 3,050 kW. The
turbulence intensity (see Appendix A3) during the measu-
rement was 14 %.
Figure 4.7-1: Wind turbine WT 6 in surroundings used for agricul-tural purposes. The measurement point MP1 with reverberant plate and dual wind screen can be seen in the foreground. Photo: Wölfel company
EXHIBIT A5-1
Page 45 of 104 005016
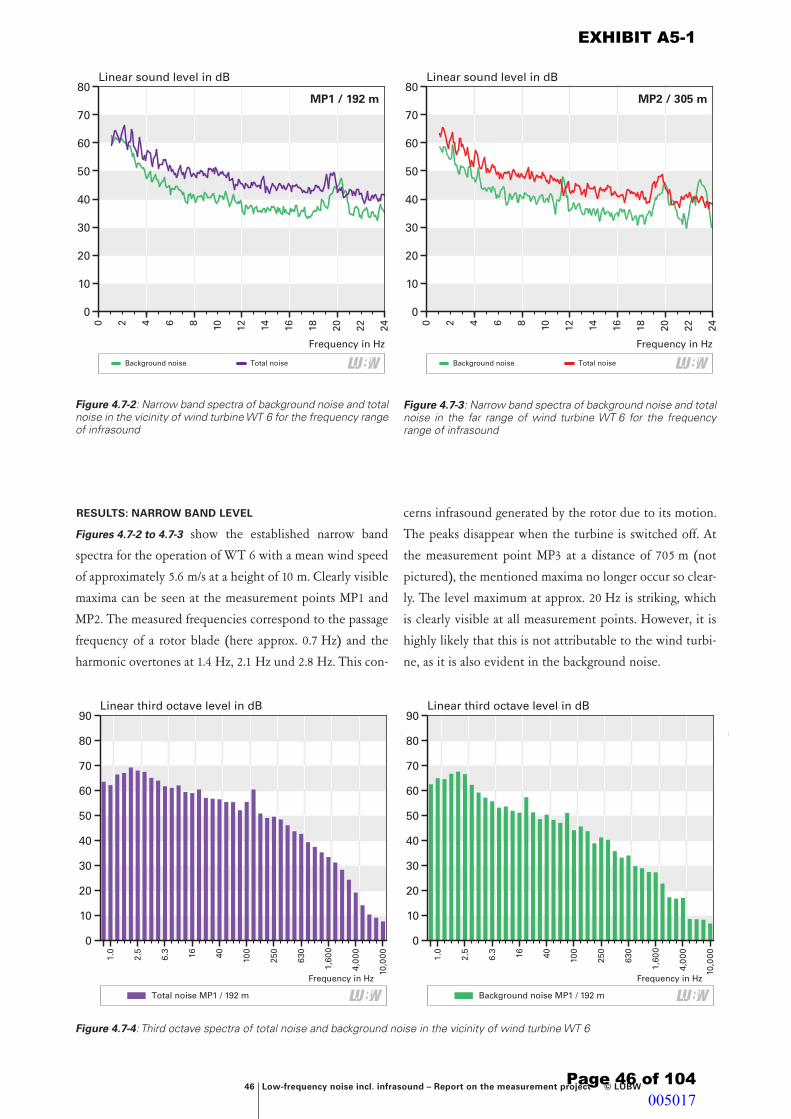
46 Low-frequency noise incl. infrasound – Report on the measurement project © LUBW
RESULTS: NARROW BAND LEVEL
Figures 4.7-2 to 4.7-3 show the established narrow band
spectra for the operation of WT 6 with a mean wind speed
of approximately 5.6 m/s at a height of 10 m. Clearly visible
maxima can be seen at the measurement points MP1 and
MP2. The measured frequencies correspond to the passage
frequency of a rotor blade (here approx. 0.7 Hz) and the
harmonic overtones at 1.4 Hz, 2.1 Hz und 2.8 Hz. This con-
cerns infrasound generated by the rotor due to its motion.
The peaks disappear when the turbine is switched off. At
the measurement point MP3 at a distance of 705 m (not
pictured), the mentioned maxima no longer occur so clear-
ly. The level maximum at approx. 20 Hz is striking, which
is clearly visible at all measurement points. However, it is
highly likely that this is not attributable to the wind turbi-
ne, as it is also evident in the background noise.
Linear sound level in dB
Frequency in Hz
6420 18161412108 242220
0
10
20
30
50
80
70
40
60
Total noise
MP1 / 192 m
Background noise
Linear sound level in dB
Frequency in Hz
6420 18161412108 242220
0
10
20
30
50
80
70
40
60
Total noiseBackground noise
MP2 / 305 m
Figure 4.7-2: Narrow band spectra of background noise and total noise in the vicinity of wind turbine WT 6 for the frequency range of infrasound
Figure 4.7-3: Narrow band spectra of background noise and total noise in the far range of wind turbine WT 6 for the frequency range of infrasound
Linear third octave level in dB
0
10
20
30
50
70
90
40
60
80
10,0
00
4,00
0
1,60
0
630
250
10040166.3
2.5
1.0
Frequency in Hz
Total noise MP1 / 192 m
Linear third octave level in dB
0
10
20
30
50
70
90
40
60
80
10,0
00
4,00
0
1,60
0
630
250
10040166.3
2.5
1.0
Frequency in Hz
Background noise MP1 / 192 m
Figure 4.7-4: Third octave spectra of total noise and background noise in the vicinity of wind turbine WT 6
EXHIBIT A5-1
Page 46 of 104
I - Lfl:W I I - Lfl:W I ~-------~ ~-------~
- -
- -
- -
- -
- -II - -
- -
-h11
-1111
I I
I - Lfl:W I I - Lfl:W I
005017

© LUBW Low-frequency noise incl. infrasound – Report on the measurement project 47
RESULTS: THIRD OCTAVE LEVEL
Figure 4.7-4 shows the third octave spectra of background
noise and overall noise at the measurement point MP1 at a
distance of 192 m for the frequency range from 0.8 Hz to
10,000 Hz. The wind speed was 5.6 m/s. The level reduc-
tion through switching off the turbine in a clearly broader
spectral range can be seen.
COMPARISON WITH THE PERCEPTION THRESHOLD
Figure 4.7-5 shows a comparison of the three measurement
points for the low-frequency range from 1 Hz to 100 Hz. It
must be noted that the background noise (wind, vegetati-
on) is also included. This may vary at the respective measu-
rement point. The wind speed at 10 m height during the
averaging period was on average 5.6 m/s. At all measure-
ment points, the ascertained levels were below the percep-
tion threshold at frequencies lower than 30 Hz. The levels
in the area of infrasound fell clearly below the perception
threshold.
INFLUENCE OF WIND SPEED
In order to investigate the dependency of low-frequency
emissions on wind speed, numerous readings were recor-
ded and graphically depicted in Figure 4.7-6. The three
charts represent the relationships at the measurement
points at the distances 192 m, 305 m and 705 m.
The violet dots, which depict the lower value area, repre-
sent audible sound, expressed in dB(A). It can be seen
clearly that the measured A levels are higher at a distance
of 192 m (upper image) than at the measurement points
further away. The A level at first increases with increasing
wind speed.
The red dots represent the G-weighted sound level when
the wind turbine is switched on, the green dots when the
turbine is switched off. Similarly to the A level, it can also
be seen for the G level that – despite higher scattering – it
somewhat increases with increasing wind speed, and then
remains constant (measurement point MP1).
The image above shows that at MP1, i.e. in the near field at
a distance of 192 m from the turbine, the G-weighted
sound pressure level during operation of WT 6 is signifi-
cantly higher than the background noise when the turbine
is off. This is much less pronounced at a distance of 305 m
(centre image).
LEVEL DEVELOPMENT DURING THE MEASUREMENT
Figure 4.7-7 shows the A and G-weighted level develop-
ment between 12:40 p.m. and 2:40 p.m. for the distances of
192 m and 705 m. In addition, the operating conditions of
the wind power plant (green = turbine on, light blue =
turbine off) as well as periods of extraneous noise (violet)
are shown. For the two level developments of measure-
ment point MP1, the operational phase "turbine off" is ea-
sily recognisable through the considerably declining level
developments. At measurement point MP3, a level drop
with the turbine switched off due to the fluctuating back-
ground noise is hardly recognisable.
Linear third octave level in dB
Frequency in Hz
0
10
20
30
50
80
120
40
60
100
70
110
90
10080635040
31.5252016
12.5108
6.354
3.152.52
1.6
1.251
MP3 / 705 mMP2 / 305 m
MP1 / 192 mPerception threshold
Figure 4.7-5: Third octave spectra of total noise at the measure-ment points MP1 (192 m), MP2 (305 m) and MP3 (705 m) of WT 6, with the perception threshold according to Table A3-1 in comparison. The measured values were corrected according to Section 4.1.
EXHIBIT A5-1
Page 47 of 104
Lf/:N I
005018

48 Low-frequency noise incl. infrasound – Report on the measurement project © LUBW
Y1
Y1
Y1
Y1
Y1
Y1
MP3 BG LAeq. db(A)
MP3 HG LGeq. db(G)
MP3 BG LGeq. db(G)
Wind speed at 10 m height in m/s4.5 5.0 5.5 6.0 6.5 7.0 7.5 8.0 8.5 9.0 9.5 10.0 10.5
Sound level in dB(G) or dB(A)
30
40
50
60
70
80
90
Y1
Y1
Y1
Y1
Y1
Y1
MP2 BG LAeq. db(A)
MP2 HG LGeq. db(G)
MP2 BG LGeq. db(G)
Wind speed at 10 m height in m/s4.5 5.0 5.5 6.0 6.5 7.0 7.5 8.0 8.5 9.0 9.5 10.0 10.5
Sound level in dB(G) or dB(A)
30
40
50
60
70
80
90
Y1
Y1
Y1
Y1
Y1
Y1
MP1 BG LAeq. db(A)
MP1 HG LGeq. db(G)
MP1 BG LGeq. db(G)
Wind speed at 10 m height in m/s4.5 5.0 5.5 6.0 6.5 7.0 7.5 8.0 8.5 9.0 9.5 10.0 10.5
Sound level in dB(G) or dB(A)
30
40
50
60
70
80
90
MP3 / 705 m
MP1 / 192 m
MP2 / 305 m
Background noise LGeqTotal noise LAeq Total noise LGeq
Figure 4.7-6: Audible sound level (A level) and infrasound level (G level) depending on the wind speed for the wind turbine WT 6. The G levels when the turbine is switched on (red dots) and when the turbine is switched off (green dots) are shown, as are the A levels with the turbine switched on (violet dots).
EXHIBIT A5-1
Page 48 of 104
. : ... ~~;~~WWJJJJJ _!.I J i ! i I; ; • • • I
O :
0 I I I O I • •
0 o
I I . . ·: ..... :• .
. . • • • I I I I I I I I I I I I I I I I I I I I I ' ' ' •
• I •
..
. . .
• • • • • .
I I I • •
. .
I •
.r--------. •· .. : .-:·iJ l!l·l II-PI II al ai 1 =
1 • • • • •• • • • • II • i' : :• i• • • • . • • I • • • • •• • • I • • • • • • • • •
I • • I • : • •
-
: • : I I I I I I ' I I I I I I I I I I • ' I • •
.
I I I I I I 7 7
. . . .•,·I: i ! i ! I I I I I I I.: I I:. I :
• • • •
• • I I I I I I I I I I I I i i i ; I I • I
• • •
005019
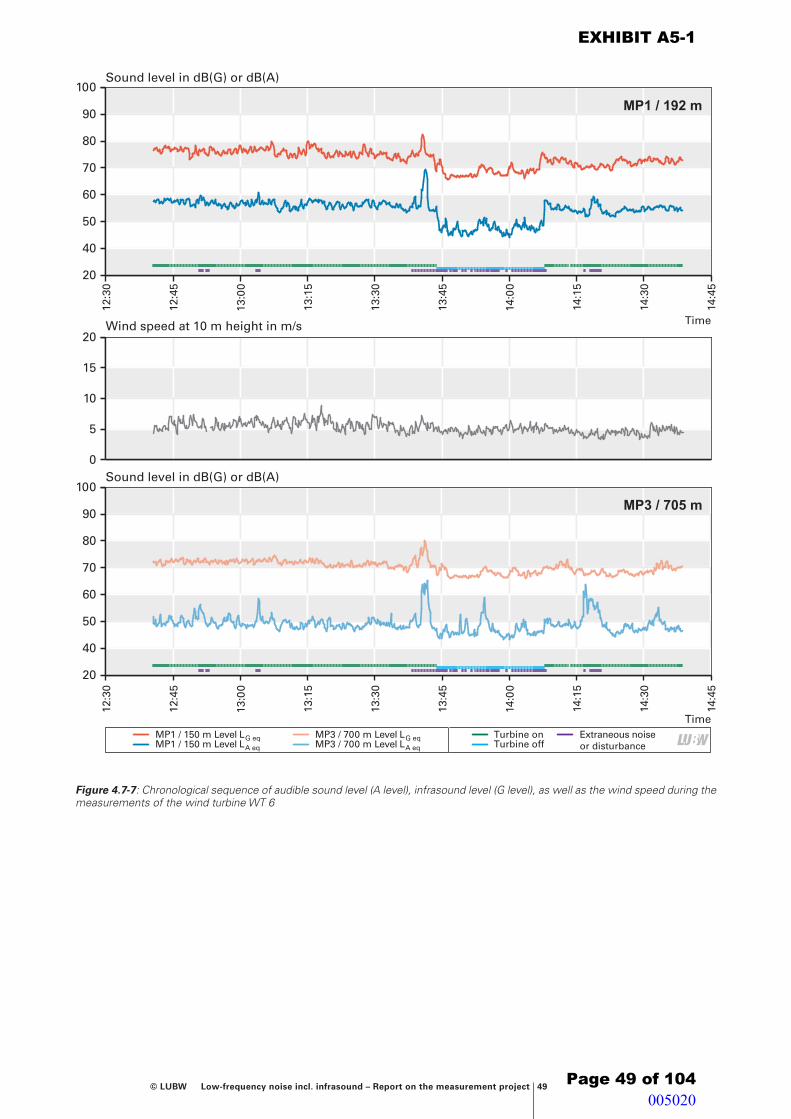
© LUBW Low-frequency noise incl. infrasound – Report on the measurement project 49
Y1
Y1
Y1
Y1
Y1
Y1
Y1
Y1
Störgeräusch
Anlage aus
Anlage an
LAeq,10 secLGeq,10 sec
20
40
50
60
70
80
90
Time
12:3
0
13:0
0
13:3
0
14:0
0
14:3
0
13:1
5
13:4
5
14:1
5
12:4
5
14:4
5
100Sound level in dB(G) or dB(A)
Y1
Y1
Y1
Y1
Y1
Y1
Y1
Windgeschwindigkeit in 10 m Höhe in m/sLAeq,10 secLGeq,10 sec
Windgeschwindigkeit in 10 m Höhe in m/s
0
5
10
15
Wind speed at 10 m height in m/s20
Y1
Y1
Y1
Y1
Y1
Y1
Y1
Y1
Störgeräusch
Anlage aus
Anlage an
LAeq,10 secLGeq,10 sec
Time
12:3
0
13:0
0
13:3
0
14:0
0
14:3
0
13:1
5
13:4
5
14:1
5
12:4
5
14:4
5
20
40
50
60
70
80
90
100Sound level in dB(G) or dB(A)
MP3 / 705 m
MP1 / 192 m
MP1 / 150 m Level LA eq
MP1 / 150 m Level LG eqMP3 / 700 m Level LA eq
MP3 / 700 m Level LG eq Turbine onTurbine off
Extraneous noiseor disturbance
Figure 4.7-7: Chronological sequence of audible sound level (A level), infrasound level (G level), as well as the wind speed during the measurements of the wind turbine WT 6
EXHIBIT A5-1
Page 49 of 104 005020

50 Low-frequency noise incl. infrasound – Report on the measurement project © LUBW
4.8 Vibrations at wind turbine 5: Nordex N117 – 2.4 MW
In order to determine a possible influence of the wind po-
wer plant on the surrounding area through vibration emis-
sions, tremor measurements were carried out in addition to
the sound assessments in the surrounding areas of wind
turbine 5 (WT 5). The execution and analysis of the mea-
surements was carried out in accordance with DIN 45669
[12] and DIN 4150 [13].
BASIC CONDITIONS
Wind turbine 5 (WT 5) is a unit by the company Nordex,
type N117/2400, with a nominal generator capacity of 2.4
MW (see Figure 4.6-1). The rotor diameter is 117 m, the
hub height above ground is 140.6 m. The following is
known about the building ground of the power plant: Up
to a depth of 7 m there is cohesive ground (loam, weathe-
ring clay), which is judged to be not stable enough for the
foundation of the power plant. Only after a depth of ap-
prox. 7 m is there Keuper rock, meaning that the foundati-
on of the building structure or the load transfer has to be
in this layer. It is not known whether this was accomplis-
hed with a pile foundation or a different procedure.
The vibration measurement was carried out in all three
spatial directions with the help of vibration sensors. The x
axis was radially aligned to the tower, the y axis tangentially
and z axis vertically aligned. Measurements were taken at
the same time at the following locations:
– MP A directly at the tower near the outer wall of the
wind turbine on concrete, see Figure 4.8-1
– MP B at a distance of 32 m from the WT’s exterior wall
on a ground spike
– MP C at a distance of 64 m from the WT’s exterior wall
on a ground spike
– MP D at a distance of approx. 285 m from the WT’s
exterior wall on a ground spike, see Figure 4.8-2
For the connection of the sensors by means of ground
spikes to the ground, holes with a diameter of approxi-
mately 50 cm and a depth of 20 cm to 40 cm were dug into
the ground.
The following operational states were registered during the
measuring time:
– Operation of a wind turbine at wind speeds between
approx. 6 and 12 m/s at a height of 10 m
– Switching off and subsequent restarting of the turbine
– Standstill of all wind power plants in the wind farm
During the measurement the wind turbine reached the
maximum possible speeds starting from wind speeds of
6.6 m/s. Even at higher wind speeds no higher rotational
speeds of the turbine are to be expected.
RESULTS
During the operation of the wind turbine, fluctuations in
the signals were repeatedly seen, in particular at measure-
ment point MP A directly by the tower. These can be attri-
buted to individual gusts of wind. At the measurement
points located farther away, these effects are less pro-
nounced. A direct link between the changes in wind speed
in the range of 6 to a maximum of 12 m/s and the vibrations
in the ground cannot be seen. Table 4.8-1 shows the ascer-
Figure 4.8-2: Vibration measurement point MP D on ground spike at a distance of 285 m from WT 5. Photo: Wölfel company
Figure 4.8-1: Vibration measurement point MP A at the tower foundation of WT 5. Photo: Wölfel company
EXHIBIT A5-1
Page 50 of 104 005021

© LUBW Low-frequency noise incl. infrasound – Report on the measurement project 51
tained maximum values of the unweighted vibration velo-
cities v in mm/s for the different measurement points with
uniform full load operation of the turbine. In the horizon-
tal measurement directions the one with the highest value
is stated; this was usually the x direction (radial, towards
the tower).
Decreasing vibration velocity over the distance is shown
graphically in Figure 4.8-3. At the measurement point
MP D at a distance of 285 m, the influence of the wind
turbines is barely perceptible. For comparison, the spread
calculated in accordance with [13] is also shown. When
shutting down or restarting the turbine, the vibration level
changes only slightly, see Figure 4.8-4.
The evaluation of vibrational immissions with respect to
possible exposure of people in buildings is carried out on
the basis of DIN 4150 Part 2 [13]. The essential base para-
meter of this standard is the weighted vibration severity
KBF(t). This is also an indication of the ability to sense
vibrational effects. The perception threshold for most peo-
ple lies in the area between KBF = 0.1 and KBF = 0.2. The
KBF value of 0.1 corresponds to an unweighted vibration
velocity of approx. 0.15 to 0.30 mm/s. During the transition
of tremors from the ground to building foundations there
is usually a reduction of the vibration amplitudes. Accor-
ding to DIN 4150 Part 1, a factor of 0.5 should be taken. In
the building itself, there may be an amplification, particu-
larly if the excitation frequency is in the range of the
ceiling’s natural frequency. However, it is not expected that
the effects established at the measurement point MP D
could actually reach the level of the reference values accor-
ding to DIN 4150 Part 2 in a building, since this would re-
quire an amplification by more than a factor of 20 within
the building. At measurement point MP D at a distance of
285 m, mainly frequencies below 10 Hz were established,
as shown in Figure 4.8-5. In contrast, the natural frequenci-
es for concrete ceilings in residential buildings are normally
approx. 15 Hz to 35 Hz. For beamed ceilings, the natural
frequencies are lower and can drop to approx. 10 Hz. Reso-
nance excitation of the building ceilings can therefore not
be expected.
CONCLUSION
The ground vibrations emanating from wind turbines can
be detected by measurement. Already at a distance of less
than 300 m from the turbine, they have dropped so far that
they can no longer be differentiated from the permanently
present background noise. No relevant vibrational effects
can be expected at residential buildings.
Figure 4.8-3: Comparison of prediction formula for [13] with the measured values
Table 4.8-1: Maximum values of the unweighted vibration velocities v in mm/s at the measurement points. The wind speeds mea-sured at 10 m above ground level were between about 6 and 12 m/s.
MP A, at the tower MP B, 32 m distance MP C, 64 m distance MP D, 285 m distance
z x, y z x, y z x, y z x, y
Turbine on 0.5 - 1.0 0.30 0.03 0.08 0.02 0.04 < 0.01 0.01
Turbine off 0.04 0.03 < 0.01 < 0.01 < 0.01 < 0.01 < 0.01 < 0.01
Vibration velocity in mm/s
Distance in m
100755025 150
125
200
175
250
225
300
275
0.00
0.01
0.02
0.03
0.05
0.10
0.08
0.04
0.06
0.09
0.07
z directionCalculated propagation curve x direction
EXHIBIT A5-1
Page 51 of 104
Lfl:N
I- LU:W I
005022

52 Low-frequency noise incl. infrasound – Report on the measurement project © LUBW
Figure 4.8-4: Representation of the decreasing vibration after shutdown of the wind turbine 5 for all measurement points and direc-tions. From top to bottom: Measurement points MP A to MP D; left to right: Spatial directions z, x and y. The shutdown of the turbine followed at 12:32 p.m. – Note the different scale of the vibration velocity at the measurement point MP A (foundation, top row).
Vibration velocity in mm/s
Time in s
-1.0
-0.8
-0.6
-0.4
0.0
1.0
0.8
-0.2
0.4
0.6
0.2
300 80 130
MP A z directionFoundation WT
Vibration velocity in mm/s
Time in s
-1.0
-0.8
-0.6
-0.4
0.0
1.0
0.8
-0.2
0.4
0.6
0.2
300 80 130
MP A x directionFoundation WT
Vibration velocity in mm/s
Time in s
-1.0
-0.8
-0.6
-0.4
0.0
1.0
0.8
-0.2
0.4
0.6
0.2
300 80 130
MP A y directionFoundation WT
Vibration velocity in mm/s
Time in s
-0.10
-0.08
-0.06
-0.04
0.00
0.10
0.08
-0.02
0.04
0.06
0.02
300 80 130
MP B z directionDistance 32 m
Vibration velocity in mm/s
Time in s
-0.10
-0.08
-0.06
-0.04
0.00
0.10
0.08
-0.02
0.04
0.06
0.02
300 80 130
MP B x directionDistance 32 m
Vibration velocity in mm/s
Time in s
-0.10
-0.08
-0.06
-0.04
0.00
0.10
0.08
-0.02
0.04
0.06
0.02
300 80 130
MP B y directionDistance 32 m
Vibration velocity in mm/s
Time in s
-0.10
-0.08
-0.06
-0.04
0.00
0.10
0.08
-0.02
0.04
0.06
0.02
300 80 130
MP C z directionDistance 64 m
Vibration velocity in mm/s
Time in s
-0.10
-0.08
-0.06
-0.04
0.00
0.10
0.08
-0.02
0.04
0.06
0.02
300 80 130
MP C x directionDistance 64 m
Vibration velocity in mm/s
Time in s
-0.10
-0.08
-0.06
-0.04
0.00
0.10
0.08
-0.02
0.04
0.06
0.02
300 80 130
MP C y directionDistance 64 m
Vibration velocity in mm/s
Time in s
-0.10
-0.08
-0.06
-0.04
0.00
0.10
0.08
-0.02
0.04
0.06
0.02
300 80 130
MP D z directionDistance 285 m
Vibration velocity in mm/s
Time in s
-0.10
-0.08
-0.06
-0.04
0.00
0.10
0.08
-0.02
0.04
0.06
0.02
300 80 130
MP D x directionDistance 285 m
Vibration velocity in mm/s
Time in s
-0.10
-0.08
-0.06
-0.04
0.00
0.10
0.08
-0.02
0.04
0.06
0.02
300 80 130
MP D y directionDistance 285 m
EXHIBIT A5-1
Page 52 of 104
I ...•....
LU:JN
005023
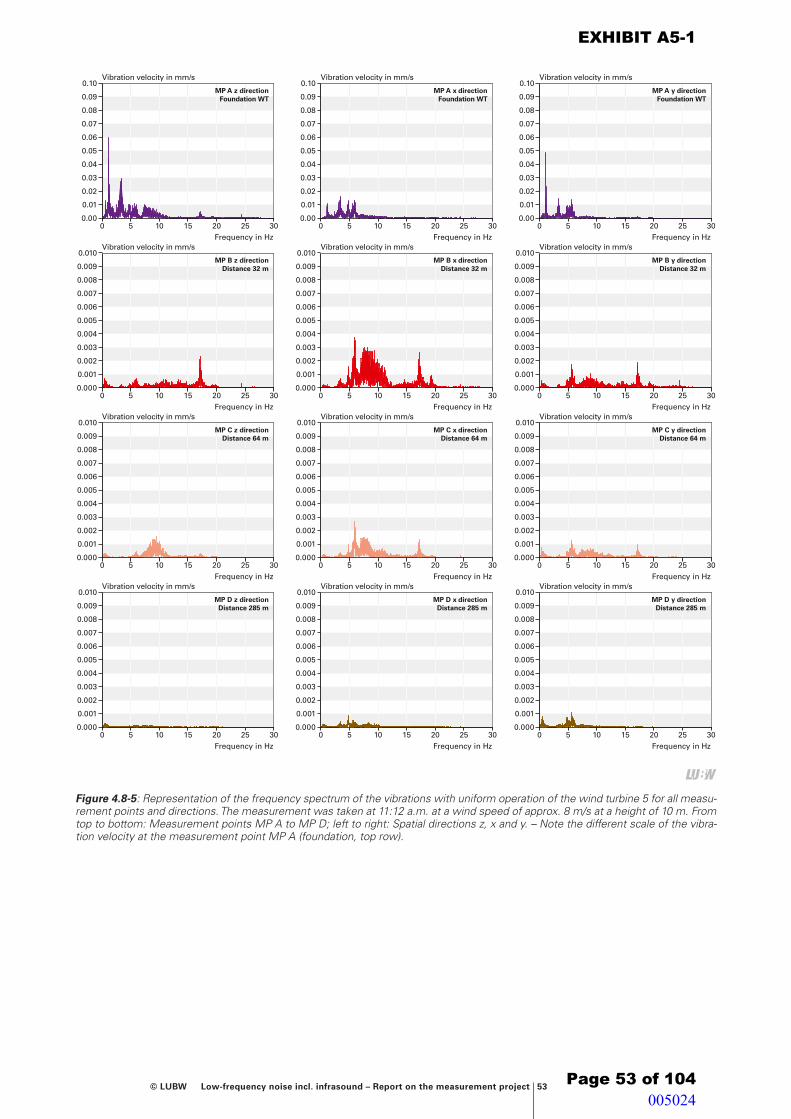
© LUBW Low-frequency noise incl. infrasound – Report on the measurement project 53
Figure 4.8-5: Representation of the frequency spectrum of the vibrations with uniform operation of the wind turbine 5 for all measu-rement points and directions. The measurement was taken at 11:12 a.m. at a wind speed of approx. 8 m/s at a height of 10 m. From top to bottom: Measurement points MP A to MP D; left to right: Spatial directions z, x and y. – Note the different scale of the vibra-tion velocity at the measurement point MP A (foundation, top row).
Vibration velocity in mm/s
Frequency in Hz
0.00
0.01
0.02
0.03
0.05
0.10
0.09
0.04
0.07
0.08
0.06
151050 2520 30
MP A z directionFoundation WT
Vibration velocity in mm/s
Frequency in Hz
0.00
0.01
0.02
0.03
0.05
0.10
0.09
0.04
0.07
0.08
0.06
151050 2520 30
MP A x directionFoundation WT
Vibration velocity in mm/s
Frequency in Hz
0.00
0.01
0.02
0.03
0.05
0.10
0.09
0.04
0.07
0.08
0.06
151050 2520 30
MP A y directionFoundation WT
Vibration velocity in mm/s
Frequency in Hz151050 2520 30
0.000
0.001
0.002
0.003
0.005
0.010
0.009
0.004
0.007
0.008
0.006
MP B z directionDistance 32 m
Vibration velocity in mm/s
Frequency in Hz151050 2520 30
0.000
0.001
0.002
0.003
0.005
0.010
0.009
0.004
0.007
0.008
0.006
MP B x directionDistance 32 m
Vibration velocity in mm/s
Frequency in Hz151050 2520 30
0.000
0.001
0.002
0.003
0.005
0.010
0.009
0.004
0.007
0.008
0.006
MP B y directionDistance 32 m
Vibration velocity in mm/s
Frequency in Hz151050 2520 30
0.000
0.001
0.002
0.003
0.005
0.010
0.009
0.004
0.007
0.008
0.006
MP C z directionDistance 64 m
Vibration velocity in mm/s
Frequency in Hz151050 2520 30
0.000
0.001
0.002
0.003
0.005
0.010
0.009
0.004
0.007
0.008
0.006
MP C x directionDistance 64 m
Vibration velocity in mm/s
Frequency in Hz151050 2520 30
0.000
0.001
0.002
0.003
0.005
0.010
0.009
0.004
0.007
0.008
0.006
MP C y directionDistance 64 m
Vibration velocity in mm/s
Frequency in Hz151050 2520 30
0.000
0.001
0.002
0.003
0.005
0.010
0.009
0.004
0.007
0.008
0.006
MP D z directionDistance 285 m
Vibration velocity in mm/s
Frequency in Hz151050 2520 30
0.000
0.001
0.002
0.003
0.005
0.010
0.009
0.004
0.007
0.008
0.006
MP D x directionDistance 285 m
Vibration velocity in mm/s
Frequency in Hz151050 2520 30
0.000
0.001
0.002
0.003
0.005
0.010
0.009
0.004
0.007
0.008
0.006
MP D y directionDistance 285 m
EXHIBIT A5-1
Page 53 of 104
LU:JN
005024

54 Low-frequency noise incl. infrasound – Report on the measurement project © LUBW
4.9 Measurement results from literature
In the following a few previously available, publicly acces-
sible measurement results about infrasound and low-fre-
quency noise at wind turbines shall be briefly discussed.
Overall, the amount of available worldwide publications
on this issue is modest but not low. The publications pre-
sented here partially refer to many other references. In this
selection we have aimed to introduce German-speaking
publications (Mecklenburg-Western Pomerania, Bavaria) as
well as important European (Denmark) and international
(Australia) studies and measurement programmes. Howe-
ver, the report at hand is no literature study, meaning that
a restriction is necessary.
MECKLENBURG-WESTERN POMERANIA
The company Kötter Consulting, Rheine, carried out emis-
sions and immissions measurements in 2005 and 2009 on
behalf of the Federal State of Mecklenburg-Western Pome-
rania, State Office for the Environment, Nature Conserva-
tion and Geotechnology (LUNG) at a wind farm that con-
tained a total of 14 turbines. The report is publicly
available [14]. In summary, the authors come to the fol-
lowing conclusions:
� "The results of the emission measurement [...] show
that at frequencies in the infrasound range at f < 10 Hz,
the individual operating states cannot be distinguished
from one another. Moreover, the dispersion of the
sound pressure level is high." See Figure 4.9-1.
� "In terms of emissions, however, the different operating
states in the low-frequency range (16 Hz < f < 60 Hz)
are metrologically detectable, whereas at the immission
location, the turbine noise is indistingui shable from
background noise."
� "The results of immission measurements show [...] that
the reference values for the evaluation of low-frequen-
cy noise according to Supplement 1 of DIN 45680 [4]
[...] are also complied with."
� "In terms of immissions, no noteworthy difference is
perceivable between the operating state ‚all WT on‘
and background noise. The readings are clearly below
the hearing threshold level curve in the infrasound
range." See Figure 4.9-2.
Figure 4.9-1: Chronological sequence of level at the emission location (outside) near the turbine. The lower, magenta curve re-presents the sequence of the A-weighted audible noise level. The clearly identifiable gradual decrease in the sound level corre-lates with the various operating states (far left all turbines on, then two turbines off, then all turbines off). At the end, the A-weighted sound level increases again when all turbines are turned on (far right). Remarkably, the 8 Hz infrasound level hardly changes at all (blue, greater scattering of dots). The measure-ment report also includes illustrations for 20 Hz and 63 Hz; with these low frequencies, the operating conditions could be regis-tered in the near field. Source: [14], Figure 9, page 24, details added.
Figure 4.9-2: Immission: Display of lower frequency levels sub-ject to third octave frequency within a residential building at a distance of 600 m. No significant difference can be seen bet-ween the operating states "all WT on" and the background noise. The readings are clearly below the hearing threshold curve in the infrasound range. Source: [14], Figure 21, page 33
Linear third octave level in dBSound level in dB or dB(A)
EXHIBIT A5-1
Page 54 of 104
100 ~ ---------------------------7
70
60
40+-----~---~----~----~---~-----12:28 12:57 13:26 13:55
Tome 14:24 14:52 15:21
120
100 -
eo
60
40 -
20
0 - "' "l N ~ m 2 ; ~ ~ ~ ~ ~ ~ ra g ~ f t Frequenc.y in Hz. 0 <:
005025

© LUBW Low-frequency noise incl. infrasound – Report on the measurement project 55
BAVARIA
The Bavarian State Office for the Environment (LfU) car-
ried out a long-term noise immission measurement from
1998 to 1999 at a 1 MW wind turbine of the type Nordex
N54 in Wiggensbach near Kempten. Table 4.9-1 and
Figure 4.9-3 show the main results. The study concludes
that "the noise emissions of the wind turbine in the infra-
sound range are well below the perception threshold of
humans and therefore lead to no burden". Furthermore, it
was found that the infrasound caused by the wind is signi-
ficantly stronger than the infrasound generated by the
wind turbine alone [15] [16].
DENMARK
A Danish study from 2010 [17], in which data from almost
50 wind turbines with outputs between 80 kW and
3.6 MW was evaluated, comes to the following conclusion:
"Wind power plants do certainly emit infrasound, but the
levels are low when taking into account the human sensiti-
vity to such frequencies. Even close up to the wind power
plants, the sound pressure level is far below the normal
auditory threshold, and the infrasound is therefore not se-
en as a problem for wind power plants of the same type
and size as the ones examined" [15]. Further international
publications on the issue are quoted in the study.
AUSTRALIA
In 2013 the Enviroment Protection Authorithy South Aus-
tralia and the engineering company Resonate Acoustics
published the study "Infrasound levels near windfarms and
in other environments" [18]. The study includes results of
measurements taken both outside as well as indoors. The
measurement points were in close proximity to windparks
and in regions without wind power plants.
In summary, it was stated that the measured infrasound
expositions, which were measured in close proximity to
windfarms in residential buildings, correspond to the levels
determined in comparable regions without wind power
plants. The lowest infrasound levels determined in the
measuring project were registered in a house standing in
the proximity of a wind park.
The infrasound levels in close proximity to wind power
plants are not higher than in other urban and rural regions,
in which the contribution of wind power plants is negligi-
ble, compared to the background level of infrasound in
those areas.
Table 4.9-1: Infrasound level at a distance of 250 m from a 1 MW wind turbine with different wind velocities. Source: [15]
Wind velocity
Linear third octave level in dB with a third octave centre frequency of
8 Hz 10 Hz 12.5 Hz 16 Hz 20 Hz
6 m/s Breeze, the measured sound comes primarily from the wind turbine 58 55 54 52 53
15 m/s Strong to stormy wind, the measured sound comes primarily from the wind 75 74 73 72 70
Figure 4.9-3: The examined wind turbine causes sound waves that can be heard only above 40 Hz by a person standing on a balcony at a distance of 250 m. The infrasound range is not per-ceptible, since it lies clearly below the perception threshold. Source: [15]
Linear third octave level in dB
Frequency in Hz
0
10
20
30
50
80
120
40
60
100
70
110
90
10080635040
31.5252016
12.5108
6.354
3.152.52
1.6
1.251
Auditory threshold according to DIN 45680
Measured values on 28.04.1999 with easterly wind at 6 m/s Perception threshold according to draft DIN 45680
EXHIBIT A5-1
Page 55 of 104
Lfl:lfl
005026

56 Low-frequency noise incl. infrasound – Report on the measurement project © LUBW
Quotation: "It is clear from the results that the infrasound
levels measured at the two residential locations near wind
farms (Location 8 near the Bluff Wind Farm and Loca-
tion 9 near Clements Gap Wind Farm) are within the ran-
ge of infrasound levels measured at comparable locations
away from wind farms. Of particular note, the results at one
of the houses near a wind farm (Location 8) are the lowest
infrasound levels measured at any of the 11 locations
included in this study. This study concludes that the level
of infrasound at houses near the wind turbines assessed is
no greater than that experienced in other urban and rural
environments, and that the contribution of wind turbines
to the measured infrasound levels is insignificant in compa-
rison with the background level of infrasound in the envi-
ronment". [18]
EXHIBIT A5-1
Page 56 of 104 005027

© LUBW Low-frequency noise incl. infrasound – Report on the measurement project 57
4.10 Conclusion of the measurements at wind turbines
� The low-frequency noise including infrasound measu-
red in the vicinity of wind turbines consists of three
parts: 1. Turbine noise; 2. Noise that results from the
wind in the surrounding area; 3. Noise that is induced at
the microphone by the wind. Wind always has to be
considered as an interference factor (extraneous noise)
when determining the turbine noise. The measured va-
lues are subject to a wide spread.
� The infrasound being emanated from wind turbines can
generally be measured well in the direct vicinity. Below
8 Hz discrete lines appear in the frequency spectrum as
expected, which are attributable to the constant move-
ment of the individual rotor blades.
� At a distance of 700 m from the wind turbines, it was
observed that when the turbine is switched on, the mea-
sured infrasound level did not increase notably or only
increase to a limited extent. The infrasound was genera-
ted mainly by the wind and not by the wind turbines.
� The measured infrasound levels (G levels) at a distance
of approx. 150 m from the turbine were between 55 and
80 dB(G) with the turbine running. With the turbine
switched off, they were between 50 and 75 dB(G). At
distances of 650 to 700 m, the G levels were between 55
and 75 dB(G) with the turbine switched on as well as
off. A cause for the spread of the values is the strongly
varying proportions of noise, which are caused by the
wind (Table 2-1).
� For the measurements carried out even at close range,
the infrasound levels in the vicinity of wind turbines –
at distances between 150 and 300 m – were well below
the threshold of what humans can perceive in ac-
cordance with DIN 45680 (2013 Draft) [5] or Table A3-1.
� The vibrations caused by the wind turbine being exami-
ned were already minimal at a distance of less than
300 m. At distances as prescribed for reasons of noise
pollution protection, no exposures that exceed the per-
vasive background noise are to be expected at residenti-
al buildings.
� The results of this measurement project comply with
the results of similar investigations on a national and
international level.
Table 4-11: Tabular representation summing up the first measured values (infrasound and low-frequency noise) at wind turbines. The measured values were frequently subject to substantial fluctuations and always also contain wind noises. Since the measurements were carried out with a reverberant plate, a correction took place (see. Section 4.1).
Wind turbine (WT)
Section
G-weighted levelin dB(G)
WT on / off
Infrasound third octave level ≤ 20 Hz in dB *
WT on
Low-frequency third octave level 25-80 Hz in dB *
WT on
WT 1 – 700 m – 150 m 4.2 55-75 / 50-75
65-75 / 50-70–
55-70–
50-55
WT 2 – 240 m – 120 m 4.3 60-75 / 60-75
60-80 / 60-75–
60-75–
50-55
WT 3 – 300 m – 180 m 4.4 55-80 / 50-75
55-75 / 50-75–
50-70–
45-50
WT 4 – 650 m – 180 m 4.5 50-65 / 50-65
55-65 / 50-65–
45-55–
40-45
WT 5 – 650 m – 185 m 4.6 60-70 / 55-65
60-70 / 55-65–
50-65–
45-50
WT 6 – 705 m – 192 m 4.7 55-65 / 55-60
60-75 / 55-65–
55-65–
45-50
* Linear third octave level in dB(Z)
EXHIBIT A5-1
Page 57 of 104 005028

58 Low-frequency noise incl. infrasound – Report on the measurement project © LUBW
EXHIBIT A5-1
Page 58 of 104 005029

© LUBW Low-frequency noise incl. infrasound – Report on the measurement project 59
5 TrafficWithin the context of the measurement project, not only
wind turbines but also other sources of low-frequency
sound incl. infrasound were to be examined. An obvious
choice was to investigate the pretty-much ubiquitous road
traffic. For this purpose, measurements was carried out at a
road in Würzburg (by the company Wölfel) as well as at
the federal motorway A5 south of Karlsruhe (by the
LUBW). In addition, data from the inner-city continuous
traffic noise measuring stations of the LUBW in Karlsruhe
and Reutlingen was used, in order to assess the recorded
data with respect to low-frequency noise incl. infrasound.
The conditions were selected in such a way that neither
wind noises in the vicinity nor wind-induced noises at the
microphones arose, which can cause problems during the
measurements at the wind turbines (see Section 4). The
results represented in the following are therefore to be cau-
sally attributed to road traffic.
5.1 Inner-city roads – measurement in Würzburg
At the immission location of Rottendorfer Strasse in Würz-
burg it was possible to carry out the noise level measure-
ments with a special focus on low-frequency noise and inf-
rasound inside as well as outside of a residential building.
The measurement point is predominantly in the direct
sphere of influence of Rottendorfer Strasse, but also within
the sphere of the federal road B 19, which leads from Bad
Mergentheim to Würzburg, as well as the railway line
Würzburg-Lauda (Figure 5.1-1). However, at the immission
location, the noise from the road traffic on the Rottendor-
fer Strasse dominates (Figure 5.1-2), with an average traffic
volume of 13,971 motor vehicles in 24 hours with a propor-
tion of heavy goods traffic of approx. 3 % (data from the
2012 traffic survey).
Figure 5.1-1: Layout plan showing the immission location at Rottendorfer Strasse, Würzburg. Source: www.openstreetmap.org
EXHIBIT A5-1
Page 59 of 104 005030

60 Low-frequency noise incl. infrasound – Report on the measurement project © LUBW
A situation as can be found in many places was specifically
selected. At measurement points with very high volumes
of traffic and the thus associated traffic noise, the audible
noise level is prioritised; this can already lead to situations
that are a nuisance and possibly also harmful environmen-
tal effects. The low-frequency noise, incl. its share of infra-
sound, eminating from the road traffic could be measured
without any disturbing wind noises. The measured levels
are characteristic for the noise situation in the residential
area.
The sound pressure level up to a lower threshold frequen-
cy of 1 Hz was measured at one measurement point in the
open and one measurement point in a residential building.
For the evaluation of the low-frequency effects, evaluations
according to DIN 45680 (2013 draft) [5] were carried out
for the measurement point within the building.
The execution of the measurement took place at two
measuring locations. Measurement point MP1 was selected
in accordance with DIN 45645 (1996) [8] and – in the same
manner as the measurements at the wind turbines – with
reverberant plate on the ground of the balcony facing the
road. A second measurement point MP2 was located within
the building in accordance with DIN 45680 (March 1997)
[4]. The measurement was carried out as an observed mea-
surement. The fully furnished and inhabited flat was not
used during the measuring time. The size of the room was
approx. 7.6 m x 4.3 m x 2.5 m. An informatively comparati-
ve measurement was carried out at a third measurement
point located directly on the façade at the height of the
windows. The third octave levels on the façade in the range
below 25 Hz are between 0 and 3 dB lower than the third
octave level on the floor of the balcony. Within the range
between 25 Hz and 80 Hz, the third octave levels directly
at the façade are up to 6 dB lower than the third octave
levels on the floor of the balcony. In the frequency range
above 100 Hz, on the other hand, they are 0 to 3 dB higher
than the third octave levels on the floor of the balcony. The
measuring data presented here for the floor of the balcony
was not subjected to level corrections according to
Section 4.1.
The measurement period extended from Thursday after-
noon, 04.07.2013, 3:00 p.m., to the early morning of the fol-
lowing Friday, 05.07.2013, 6:00 a.m. The measuring period
Figure 5.1-2 a/b: View along Rottendorfer Strasse in Würzburg. Photo: Wölfel company
EXHIBIT A5-1
Page 60 of 104 005031
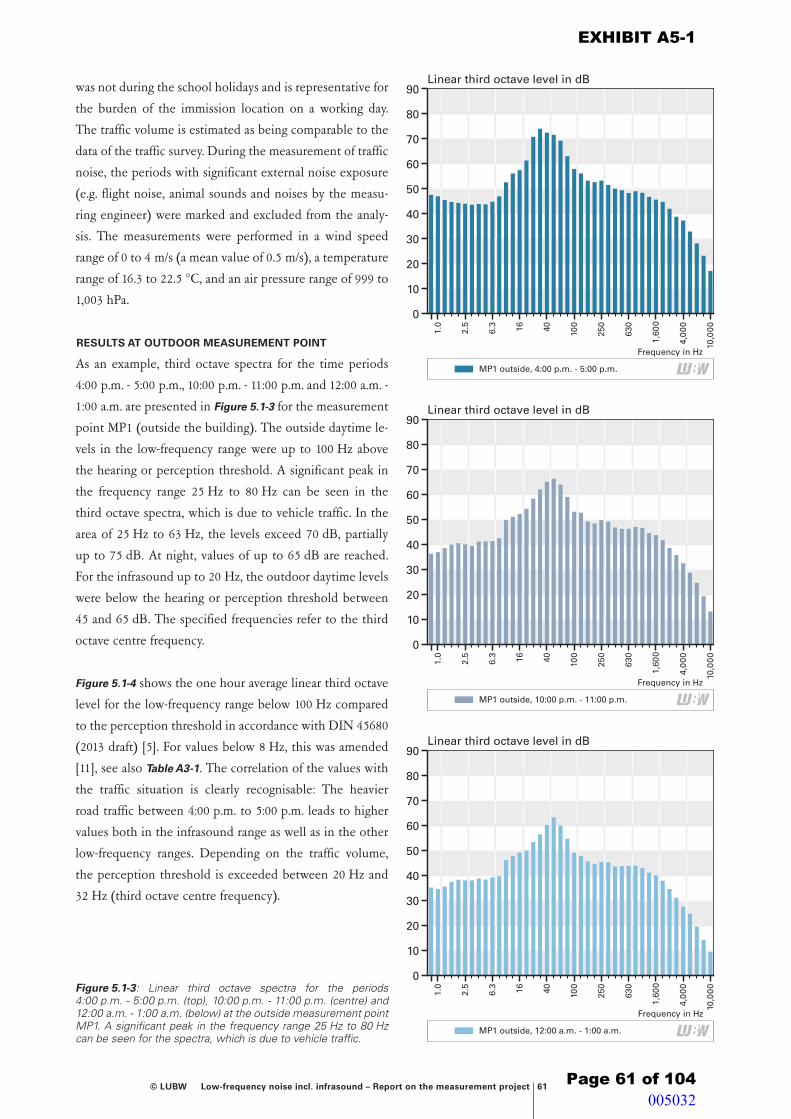
© LUBW Low-frequency noise incl. infrasound – Report on the measurement project 61
was not during the school holidays and is representative for
the burden of the immission location on a working day.
The traffic volume is estimated as being comparable to the
data of the traffic survey. During the measurement of traffic
noise, the periods with significant external noise exposure
(e.g. flight noise, animal sounds and noises by the measu-
ring engineer) were marked and excluded from the analy-
sis. The measurements were performed in a wind speed
range of 0 to 4 m/s (a mean value of 0.5 m/s), a temperature
range of 16.3 to 22.5 °C, and an air pressure range of 999 to
1,003 hPa.
RESULTS AT OUTDOOR MEASUREMENT POINT
As an example, third octave spectra for the time periods
4:00 p.m. - 5:00 p.m., 10:00 p.m. - 11:00 p.m. and 12:00 a.m. -
1:00 a.m. are presented in Figure 5.1-3 for the measurement
point MP1 (outside the building). The outside daytime le-
vels in the low-frequency range were up to 100 Hz above
the hearing or perception threshold. A significant peak in
the frequency range 25 Hz to 80 Hz can be seen in the
third octave spectra, which is due to vehicle traffic. In the
area of 25 Hz to 63 Hz, the levels exceed 70 dB, partially
up to 75 dB. At night, values of up to 65 dB are reached.
For the infrasound up to 20 Hz, the outdoor daytime levels
were below the hearing or perception threshold between
45 and 65 dB. The specified frequencies refer to the third
octave centre frequency.
Figure 5.1-4 shows the one hour average linear third octave
level for the low-frequency range below 100 Hz compared
to the perception threshold in accordance with DIN 45680
(2013 draft) [5]. For values below 8 Hz, this was amended
[11], see also Table A3-1. The correlation of the values with
the traffic situation is clearly recognisable: The heavier
road traffic between 4:00 p.m. to 5:00 p.m. leads to higher
values both in the infrasound range as well as in the other
low-frequency ranges. Depending on the traffic volume,
the perception threshold is exceeded between 20 Hz and
32 Hz (third octave centre frequency).
Linear third octave level in dB
0
10
20
30
50
70
90
40
60
80
10,0
00
4,00
0
1,60
0
630
250
10040166.3
2.5
1.0
Frequency in Hz
MP1 outside, 12:00 a.m. - 1:00 a.m.
Linear third octave level in dB
0
10
20
30
50
70
90
40
60
80
10,0
00
4,00
0
1,60
0
630
250
10040166.3
2.5
1.0
Frequency in Hz
MP1 outside, 4:00 p.m. - 5:00 p.m.
Linear third octave level in dB
0
10
20
30
50
70
90
40
60
80
10,0
00
4,00
0
1,60
0
630
250
10040166.3
2.5
1.0
Frequency in Hz
MP1 outside, 10:00 p.m. - 11:00 p.m.
Figure 5.1-3: Linear third octave spectra for the periods 4:00 p.m. - 5:00 p.m. (top), 10:00 p.m. - 11:00 p.m. (centre) and 12:00 a.m. - 1:00 a.m. (below) at the outside measurement point MP1. A significant peak in the frequency range 25 Hz to 80 Hz can be seen for the spectra, which is due to vehicle traffic.
EXHIBIT A5-1
Page 61 of 104
--
-
-
-
-
-
-
111 -
I I
- Lf/:W I
-
-
-
-
-
-
-
- ~, I I I I I I I I I I I I
1 - Lf/:W I
005032

62 Low-frequency noise incl. infrasound – Report on the measurement project © LUBW
The A and G-weighted sum level LAeq(t) and LGeq(t) re-
corded during the entire measuring period are shown in
Figure 5.1-5. While the A-weighting shows the audible
sound as a single number value, the valuation focus of the
G level is in the infrasound range. The curves show a signi-
ficant bandwidth that is created by the variations of the
sound influences. These variations are less pronounced for
the G level. The relationship of the courses of the A and G
levels can also be clearly seen. Both levels are significantly
reduced at night, when there is less traffic. The G level
reaches values of up to 80 dB (G) at daytime and minimum
values of around 55 dB (G) at night, with strong fluctua-
tions.
RESULTS AT INDOOR MEASUREMENT POINT
The third octave spectra for the time periods 4:00 p.m. -
5:00 p.m., 10:00 p.m. - 11:00 p.m. and 12:00 a.m. - 1:00 a.m.
are presented in Figure 5.1-6 for the measurement point
MP2 inside the building. The interior levels for infrasound
up to 20 Hz are below the hearing or perception threshold
(< 55 dB) at day and night. Above 32 Hz to 40 Hz (third
octave centre frequency), the values of the linear third oc-
tave level are above the hearing or perception threshold
(up to 55 dB). In narrowband spectra (not shown here) a
number of discrete, prominent maxima were detected,
which were attributable to natural frequencies of the room
and excited natural frequencies of the building.
Figure 5.1-7 shows the one hour average linear third octave
level for the low-frequency range below 100 Hz compared
to the perception threshold in accordance with DIN 45680
[5]. This was amended for values below 8 Hz [11]. In gene-
ral, a decrease in the level can be seen the later it gets. Why
Figure 5.1-4: Comparison of the corrected linear third octave le-vels, determined at the measurement point MP1 (outside the building) for the averaging periods 4:00 - 5:00 p.m., 10:00 - 11:00 p.m., and 12:00 - 1:00 a.m. Furthermore, the perception thres-hold is also shown (see Section 4.1).
Figure 5.1-5: Distribution of the A-weighted sum level LAeq(t) (blue) and the G-weighted sum level LGeq(t) (red) over the entire measu-rement period at the outdoor measurement point MP1
Linear third octave level in dB
Frequency in Hz
0
10
20
30
50
80
120
40
60
100
70
110
90
10080635040
31.5252016
12.5108
6.354
3.152.52
1.6
1.251
MP1 outside, 12:00 - 1:00 a.m. MP1 outside, 10:00 - 11:00 p.m.
MP1 outside, 4:00 - 5:00 p.m. Perception threshold
Y1
Y1
Y1
Y1
Y1
Y1
Y1
Y1
Y1
Verkehrsgeräusch LAeq,1 MinVerkehrsgeräusch LGeq,1 Min
Sound level in dB(G) or dB(A)
0
10
20
30
50
70
90
40
60
80
02:0
0
24:0
0
06:0
0
05:0
0
22:0
0
04:0
0
03:0
0
18:0
0
20:0
0
16:0
0
01:0
0
23:0
0
21:0
0
17:0
0
19:0
0
15:0
0
Time
Traffic noise LAeq,1 minTraffic noise LGeq,1 minMP1, outdoors
EXHIBIT A5-1
Page 62 of 104
I= -- Lfl:W I
- - Lfl:WI
005033

© LUBW Low-frequency noise incl. infrasound – Report on the measurement project 63
the infrasound levels between 2 Hz and 8 Hz are higher at
night is unclear. The G-weighted level during the time
elapsed was between 40 dB(G) at night and 65 dB(G) at
day.
Linear third octave level in dB
0
10
20
30
50
70
90
40
60
80
10,0
00
4,00
0
1,60
0
630
250
10040166.3
2.5
1.0
Frequency in Hz
MP2 inside, 12:00 a.m. - 1:00 a.m.
Linear third octave level in dB
0
10
20
30
50
70
90
40
60
80
10,0
00
4,00
0
1,60
0
630
250
10040166.3
2.5
1.0
Frequency in Hz
MP2 inside, 10:00 p.m. - 11:00 p.m.
Linear third octave level in dB
0
10
20
30
50
70
90
40
60
80
10,0
00
4,00
0
1,60
0
630
250
10040166.3
2.5
1.0
Frequency in Hz
MP2 inside, 4:00 p.m. - 5:00 p.m.
Figure 5.1-6 (left column): Linear third octave spectra for the time periods 4:00 - 5:00 p.m. (top), 10:00 - 11:00 p.m. (centre) and 12:00 - 1:00 a.m. (bottom) at the indoor measurement point MP2.
Figure 5.1-7 (top): Comparison of the third octave levels at the measurement point MP2 (indoors) for the averaging periods 4:00 - 5:00 p.m., 10:00 - 11:00 p.m. and 12:00 - 1:00 a.m. The perception threshold according to Table A3-1 is also shown.
Linear third octave level in dB
Frequency in Hz
0
10
20
30
50
80
120
40
60
100
70
110
90
10080635040
31.5252016
12.5108
6.354
3.152.52
1.6
1.251
MP2 inside, 12:00 - 1:00 a.m.MP2 inside, 10:00 - 11:00 p.m.
MP2 inside, 4:00 - 5:00 p.m.Perception threshold
EXHIBIT A5-1
Page 63 of 104
--
--
-
-
-11111111
--. l
I -Lfl:W I
I L__I -- -------==-Lu___:__:___J:w l ~I=---= ___ Lu_:w l
I II I - Lfl:W I
005034

64 Low-frequency noise incl. infrasound – Report on the measurement project © LUBW
5.2 Inner-city roads – permanent measu-ring stations Karlsruhe and Reutlingen
Since November 2012, the LUBW has been running a sta-
tionary road traffic noise monitoring station in Karlsruhe
(Reinhold-Frank Strasse), and a further one in Reutlingen
(Lederstrasse-Ost) since March 2013. This is where average
and maximum levels of total noise are measured with the
use of high-quality sound level measurement devices, as
well as meteorological parameters such as temperature,
wind speed and precipitation. In addition, the traffic data
(vehicle type, quantity and speed) are recorded. Both sta-
tions are in areas with relatively high volumes of traffic: In
Karlsruhe, approximately 24,000 vehicles/24h, however
with a partial standstill of traffic, and in Reutlingen appro-
ximately 50,000 vehicles/24h (as of 2011).
In Karlsruhe, the microphone is positioned close to the
road, meaning that the recorded levels do not directly de-
pict the concerns of the population living somewhat
further away. The distance to residential buildings is less
than 10 m (Figure 5.2-1). The location of the measuring sta-
tion in Reutlingen allows immediate statements to be ma-
de about the noise pollution for the people affected
(Figure 5.2-2). Further information is available on the web-
site www.lubw.de/aktuelle-messwerte (home page). The
annual reports by the LUBW for the traffic noise monito-
ring stations can be found under the heading "Auswertun-
gen" (Reports).
Based on the measurement data of the road traffic noise
measuring stations in Karlsruhe and Reutlingen, evalua-
tions were made by us with regards to low-frequency noise
(incl. infrasound). In the following Figures 5.2-3 and 5.2-4
frequency-selective representations of the noise level from
6.3 Hz to 125 Hz (third octave centre frequency) can be
found for the two stations. Averaging was carried out over
30 minutes and summarized. Here only those time periods
have been considered in which the wind speeds were less
than one meter per second. These were approx. 2,000 half-
hour averages for Karlsruhe and about 1,900 for Reutlin-
gen, including many night hours. This avoided the occur-
rence and subsequent measurement of noise in the vicinity
caused by the wind, and also ensured that no sound indu-
ced by the wind occurred directly at the microphone. Both
Figure 5.2-1: LUBW measuring station for detecting road traffic noise in Karlsruhe, Reinhold-Frank-Strasse. The arrow shows the location of the microphone. Residential buildings visible in the background. Photo: LUBW
Figure 5.2-2: LUBW measuring station for detecting road traffic noise in Reutlingen, Lederstrasse. The arrow shows the location of the microphone. Photo: LUBW
EXHIBIT A5-1
Page 64 of 104 005035
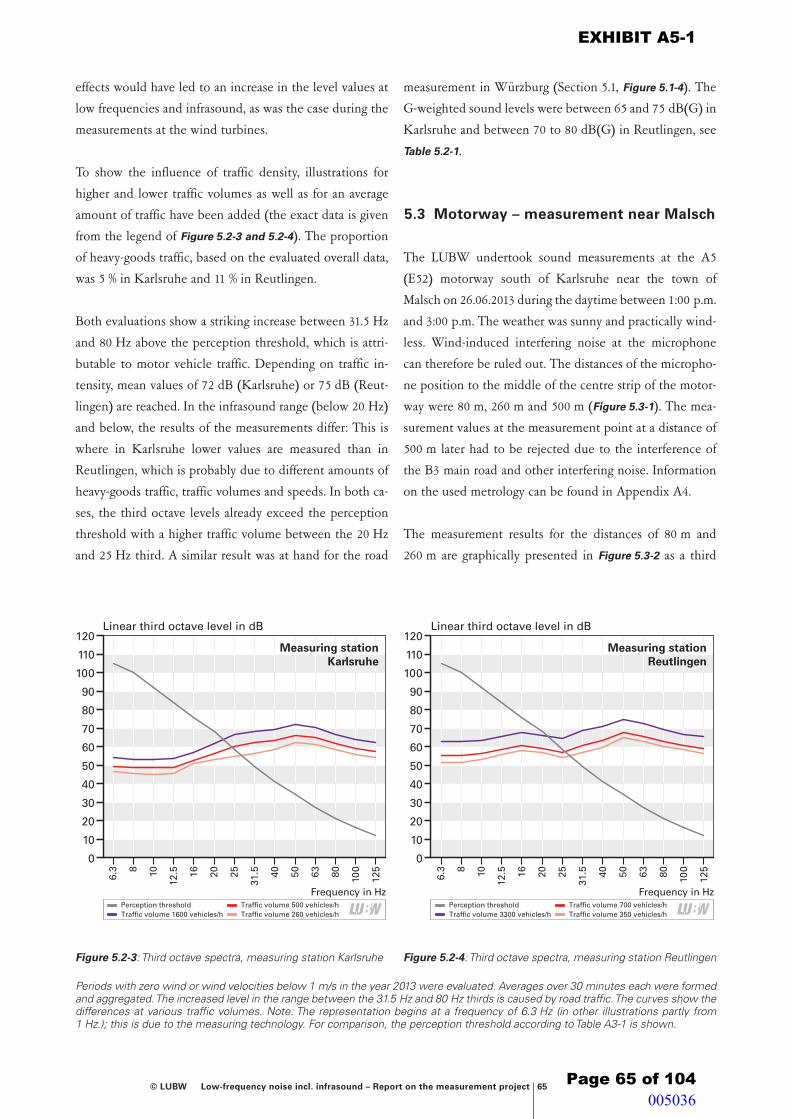
© LUBW Low-frequency noise incl. infrasound – Report on the measurement project 65
effects would have led to an increase in the level values at
low frequencies and infrasound, as was the case during the
measurements at the wind turbines.
To show the influence of traffic density, illustrations for
higher and lower traffic volumes as well as for an average
amount of traffic have been added (the exact data is given
from the legend of Figure 5.2-3 and 5.2-4). The proportion
of heavy-goods traffic, based on the evaluated overall data,
was 5 % in Karlsruhe and 11 % in Reutlingen.
Both evaluations show a striking increase between 31.5 Hz
and 80 Hz above the perception threshold, which is attri-
butable to motor vehicle traffic. Depending on traffic in-
tensity, mean values of 72 dB (Karlsruhe) or 75 dB (Reut-
lingen) are reached. In the infrasound range (below 20 Hz)
and below, the results of the measurements differ: This is
where in Karlsruhe lower values are measured than in
Reutlingen, which is probably due to different amounts of
heavy-goods traffic, traffic volumes and speeds. In both ca-
ses, the third octave levels already exceed the perception
threshold with a higher traffic volume between the 20 Hz
and 25 Hz third. A similar result was at hand for the road
measurement in Würzburg (Section 5.1, Figure 5.1-4). The
G-weighted sound levels were between 65 and 75 dB(G) in
Karlsruhe and between 70 to 80 dB(G) in Reutlingen, see
Table 5.2-1.
5.3 Motorway – measurement near Malsch
The LUBW undertook sound measurements at the A5
(E52) motorway south of Karlsruhe near the town of
Malsch on 26.06.2013 during the daytime between 1:00 p.m.
and 3:00 p.m. The weather was sunny and practically wind-
less. Wind-induced interfering noise at the microphone
can therefore be ruled out. The distances of the micropho-
ne position to the middle of the centre strip of the motor-
way were 80 m, 260 m and 500 m (Figure 5.3-1). The mea-
surement values at the measurement point at a distance of
500 m later had to be rejected due to the interference of
the B3 main road and other interfering noise. Information
on the used metrology can be found in Appendix A4.
The measurement results for the distances of 80 m and
260 m are graphically presented in Figure 5.3-2 as a third
Figure 5.2-3: Third octave spectra, measuring station Karlsruhe Figure 5.2-4: Third octave spectra, measuring station Reutlingen
Periods with zero wind or wind velocities below 1 m/s in the year 2013 were evaluated. Averages over 30 minutes each were formed and aggregated. The increased level in the range between the 31.5 Hz and 80 Hz thirds is caused by road traffic. The curves show the differences at various traffic volumes. Note: The representation begins at a frequency of 6.3 Hz (in other illustrations partly from 1 Hz.); this is due to the measuring technology. For comparison, the perception threshold according to Table A3-1 is shown.
Linear third octave level in dB
Frequency in Hz
0
10
20
30
50
80
120
40
60
100
70
110
9012
580635040
31.5252016
12.5108
100
6.3
Traffic volume 350 vehicles/hTraffic volume 700 vehicles/h
Traffic volume 3300 vehicles/hPerception threshold
Measuring stationReutlingen
Linear third octave level in dB
Frequency in Hz
0
10
20
30
50
80
120
40
60
100
70
110
90
12580635040
31.5252016
12.5108
100
6.3
Traffic volume 260 vehicles/hTraffic volume 500 vehicles/h
Traffic volume 1600 vehicles/hPerception threshold
Measuring stationKarlsruhe
EXHIBIT A5-1
Page 65 of 104
I= -- LU:W I I= -- LU:W I
005036

66 Low-frequency noise incl. infrasound – Report on the measurement project © LUBW
Table 5.2-1: Summary of the measurement results for low-frequency noise (including parts of infrasound) at the traffic noise moni-toring stations Reutlingen and Karlsruhe
Source/situation G-weighted levelin dB(G)
Infrasound third octave level
≤ 20 Hz in dB *
Low-frequency third octave levels 25-80 Hz
in dB *
Traffic noise measuring station Karlsruhe traffic volume >1600 vehicles/h 75 53 to 62 67 to 72
Traffic noise measuring station Karlsruhe average traffic volume: 500 vehicles/h 65 48 to 57 60 to 67
Traffic noise measuring station Karlsruhe traffic volume < 260 vehicles/h 69 45 to 54 55 to 63
Traffic noise measuring station Reutlingen traffic volume > 3300 vehicles/h 80 63 to 68 64 to 75
Traffic noise measuring station Reutlingen average traffic volume: 700 vehicles/h 70 55 to 61 57 to 68
Traffic noise measuring station Reutlingen traffic volume < 350 vehicles/h 73 52 to 57 54 to 61
* Linear third octave level in dB(Z)
80 m
260 m
500 m
Figure 5.3-1: Location of the measurement points at the A5 motorway south of Karlsruhe near Malsch, indicating the distances between the microphone positions and the centre of the motorway. The town of Malsch is located outside of the picture at the bot-tom left. The B3 main road is located above the picture. Picture source: LUBW, LGL
0 50 100 m
EXHIBIT A5-1
Page 66 of 104
LU:W
005037

© LUBW Low-frequency noise incl. infrasound – Report on the measurement project 67
octave representation. The third octave levels in the infra-
sound range are at levels of around 60 dB and slightly
below. In the low-frequency range, approximately between
40 Hz and 80 Hz, a slight peak can be seen. Here the mea-
sured values are significantly above the hearing threshold.
The average traffic intensity is approximately 3,000
vehicles/h with a share of heavy-goods traffic of around
15 %. The G-weighted infrasound levels were around
75 dB(G) at a distance of 80 m and around 71 dB(G) at a
distance of 260 m. Additional information concerning the
G level can be found in Appendix A3.
5.4 Noise inside car while driving
Below are the results of noise measurements carried out by
the LUBW inside a moving car and a minibus on 06.09.2012.
This is in fact no sound that occurs in the vicinity, i.e. no
ambient noise or environmental noise in the strict sense.
However, a lot of people are exposed to these sounds often
and for longer periods of time, meaning that it surely ma-
kes sense to include such measurement values here. It be-
came evident that relatively high levels in the infrasound
range up to 20 Hz, as well as in the other low-frequency
frequency range above 20 Hz occurred (Firgure 5.4,
Table 5.4). It must be noted that, with windows open, the
levels that arise in the area of low frequencies incl. infra-
sound are so high that they are subjectively perceived as
being painful. The values measured by us correspond to
the respective specifications in literature (e.g. [19] [20]).
5.5 Conclusion of the road traffic measurements
� It was possible to carry out the measurements for the
low-frequency noise incl. infrasound resulting from road
traffic without interfering wind noise. Unlike in the case
of wind turbines, the recorded levels occur in the direct
vicinity of residential buildings.
� As expected, it could be observed that the level of low-
frequency noise including infrasound dropped at night.
A good correlation with the traffic volume was also de-
termined: The more the traffic, the higher the sound
levels of low-frequency noise including infrasound.
� The Infrasound levels of traffic reach a maximum of 70
dB (unweighted) in individual thirds with respect to re-
sidential buildings in the vicinity. The G-weighted level
Firgure 5.3-2: Frequency-dependent representation (linear third octave level) of a measurement at the motorway A5. As a com-parison, the perception threshold according to Table A3-1 was also included. Note: The representation begins at a frequency of 3.15 Hz (in other illustrations partly from 1 Hz or 6.3 Hz). This is due to the measuring technology used.
Firgure 5.4: Low-frequency sound (averaging level) in the inside of car and minibus driving at approx. 130 km/h in comparison to the perception threshold according to Table A3-1
Linear third octave level in dB
Frequency in Hz
0
10
20
30
50
80
120
40
60
100
70
110
90
500
400
315
250
200
160
125
10080635040
31.5252016
12.5108
6.354
3.15
MP2 / 260 mMP1 / 80 mPerception threshold
Linear third octave level in dB
Frequency in Hz
0102030
50
80
140
40
60
100
70
120130
110
90
200
160
125
10080635040
31.5252016
12.5108
6.354
3.15
Minibus, front windows openCar, front windows openCar, all windows open
Minibus, all windows closed Car, rear window openCar, windows closed
Perception threshold
EXHIBIT A5-1
Page 67 of 104
~I = _______ Lfl-~•• I ~I ~----=---Lfl-~•·1
005038

68 Low-frequency noise incl. infrasound – Report on the measurement project © LUBW
is in the range between 55 and 80 dB(G). This roughly
corresponds to values found in literature for sea surf
(Table 2-1).
� For road traffic, increased levels were detected in the
frequency spectra in the range of between roughly
30 Hz and 80 Hz. Low-frequency noise in this area lies
significantly above the hearing threshold and seems to
be more relevant for an assessment than the infrasound
level up to 20 Hz. The values in this low-frequency fre-
quency range are significantly higher for the observed
situations of road traffic than in the areas surrounding
wind turbines (Table 2-1).
� The highest levels in the context of the measurement
project were measured in the interior of a car travelling
at 130 km/h. Even though these are not immission levels
that occur in the free environment, they are an everyday
situation that many people are frequently subjected to
for a longer period of time. The measured values for
both the infrasound as well as the other low-frequency
areas are higher by several orders of magnitude than the
values usually measured in road traffic or at wind turbi-
nes.
Table 5.4: Infrasound level inside a passenger car or minibus while driving at 130 km/h
Source G-weighted level in dB(G)
Infrasound third octave level between 3.2 und 20 Hz
in dB *
Interior noise in passenger car, all windows closed 105 88 to 94
Interior noise in passenger car, rear window open 139 87 to 127
Interior noise in minibus, all windows closed 100 85 to 93
Interior noise in minibus, side windows open 122 98 to 113
* Linear third octave level in dB(Z)
EXHIBIT A5-1
Page 68 of 104 005039

© LUBW Low-frequency noise incl. infrasound – Report on the measurement project 69
6 UrbanbackgroundThe Friedrichsplatz in Karlsruhe was chose for the measu-
rement of infrasound and low-frequency noise at day and
night in an urban background. It is located in the heart of
the city. The Friedrichsplatz is a rather quiet square located
directly by the natural history museum. Benches, lands-
caped flower beds and a fountain invite passersby to linger
and stop for a short break (Figure 6-1). The square extends
for about 125 m from north to south and 100 m from east
to west. The Erbprinzenstrasse crosses the Friedrichsplatz
as a bicycle road. In a westerly and easterly direction are
the Ritterstrasse and Lammstrasse respectively, with very
slowly driving traffic. In the south, the square is limited by
the natural history museum of Karlsruhe. To the west lies
the Church of St. Stephan with forecourt. Apart from that,
the Friedrichsplatz is surrounded by offices and commer-
cial buildings, as well as a number of individual apartments.
The next somewhat busier road is situated about 250 m to
the south, shielded behind the natural history museum
and the Nymphengarten (Kriegstrasse, B 10). Tram lines
are located at a distance of several hundred metres, parti-
ally behind several blocks of buildings (Figure 6-2), and a
construction site is located in a north-westerly direction.
The measurements were carried out simultaneously at
three measurement points. The location of the measure-
ment points is shown in the aerial view in Figure 6-3. Mea-
surement point MP1 was chosen in the inside of a building
adjacent to the Friedrichsplatz (meeting room of the edu-
cation authority of Karlsruhe). A second measurement
point MP2 was placed on the ground of the Friedrichsplatz,
a third measurement point MP3 on the roof of the muse-
um of natural history (Figures 6-4 to 6-6). MP2 and MP3
were positioned on a reverberant plate.
The measurements were carried out from Friday, 20.09.2013,
3:00 p.m. to Saturday, 21.09.2013, 2:00 a.m. Preliminary
Figure 6-1: Friedrichsplatz in Karlsruhe, looking south at the natural history museum. Photo: LUBW
EXHIBIT A5-1
Page 69 of 104 005040

70 Low-frequency noise incl. infrasound – Report on the measurement project © LUBW
Figure 6-2: City map of Karlsruhe with Friedrichsplatz (red circle) and the tram lines in the vicinity (dark and dashed lines). Source: www.OpenStreetMap.org
Figure 6-3: Oriented aerial view of Karlsruhe Friedrichsplatz. Location of the three measurement points MP1 (meeting room of edu-cation authority), MP2 (on Friedrichsplatz) and MP3 (roof of museum of natural history). Source: LUBW, LGL
MP 2
MP 3
MP 1
EXHIBIT A5-1
Page 70 of 104 005041
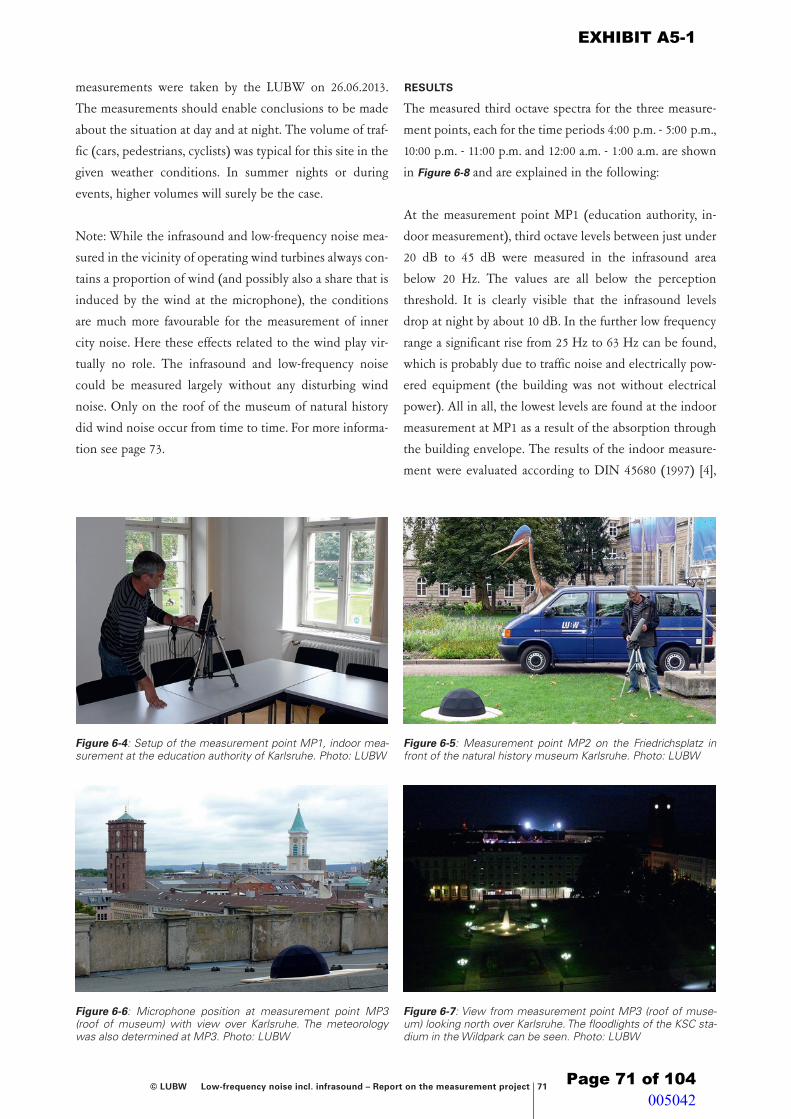
© LUBW Low-frequency noise incl. infrasound – Report on the measurement project 71
measurements were taken by the LUBW on 26.06.2013.
The measurements should enable conclusions to be made
about the situation at day and at night. The volume of traf-
fic (cars, pedestrians, cyclists) was typical for this site in the
given weather conditions. In summer nights or during
events, higher volumes will surely be the case.
Note: While the infrasound and low-frequency noise mea-
sured in the vicinity of operating wind turbines always con-
tains a proportion of wind (and possibly also a share that is
induced by the wind at the microphone), the conditions
are much more favourable for the measurement of inner
city noise. Here these effects related to the wind play vir-
tually no role. The infrasound and low-frequency noise
could be measured largely without any disturbing wind
noise. Only on the roof of the museum of natural history
did wind noise occur from time to time. For more informa-
tion see page 73.
RESULTS
The measured third octave spectra for the three measure-
ment points, each for the time periods 4:00 p.m. - 5:00 p.m.,
10:00 p.m. - 11:00 p.m. and 12:00 a.m. - 1:00 a.m. are shown
in Figure 6-8 and are explained in the following:
At the measurement point MP1 (education authority, in-
door measurement), third octave levels between just under
20 dB to 45 dB were measured in the infrasound area
below 20 Hz. The values are all below the perception
threshold. It is clearly visible that the infrasound levels
drop at night by about 10 dB. In the further low frequency
range a significant rise from 25 Hz to 63 Hz can be found,
which is probably due to traffic noise and electrically pow-
ered equipment (the building was not without electrical
power). All in all, the lowest levels are found at the indoor
measurement at MP1 as a result of the absorption through
the building envelope. The results of the indoor measure-
ment were evaluated according to DIN 45680 (1997) [4],
Figure 6-4: Setup of the measurement point MP1, indoor mea-surement at the education authority of Karlsruhe. Photo: LUBW
Figure 6-6: Microphone position at measurement point MP3 (roof of museum) with view over Karlsruhe. The meteorology was also determined at MP3. Photo: LUBW
Figure 6-5: Measurement point MP2 on the Friedrichsplatz in front of the natural history museum Karlsruhe. Photo: LUBW
Figure 6-7: View from measurement point MP3 (roof of muse-um) looking north over Karlsruhe. The floodlights of the KSC sta-dium in the Wildpark can be seen. Photo: LUBW
EXHIBIT A5-1
Page 71 of 104 005042
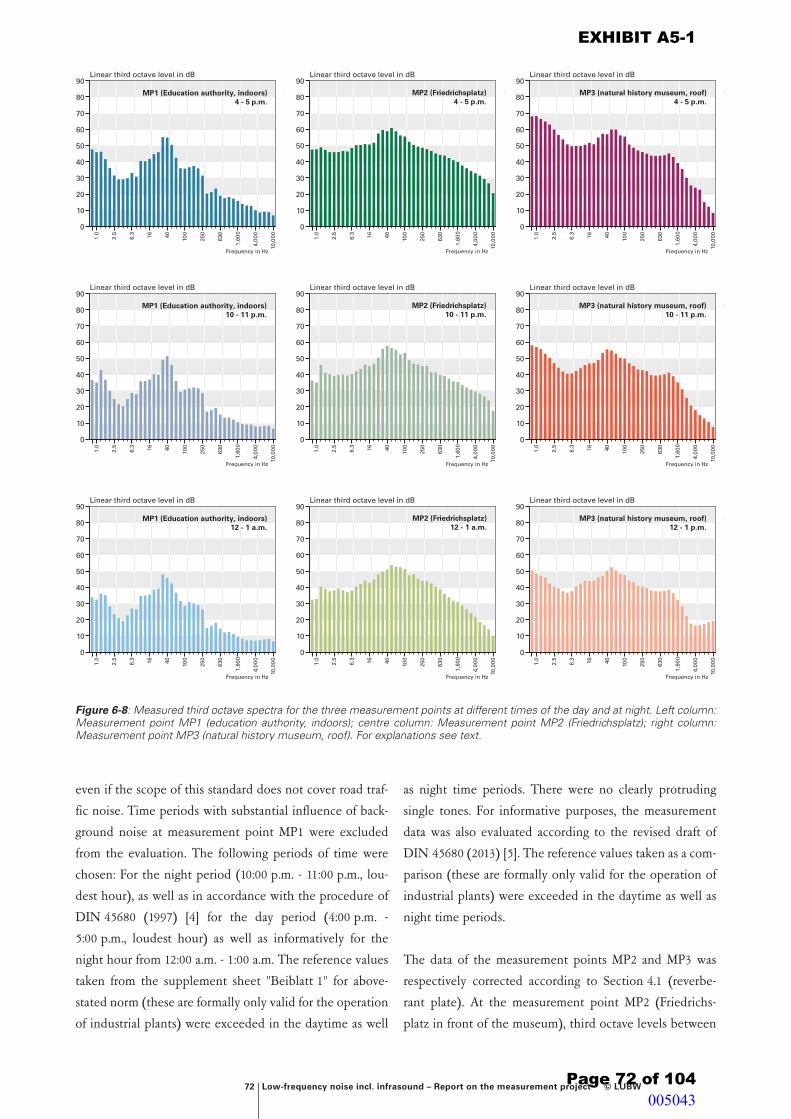
72 Low-frequency noise incl. infrasound – Report on the measurement project © LUBW
even if the scope of this standard does not cover road traf-
fic noise. Time periods with substantial influence of back-
ground noise at measurement point MP1 were excluded
from the evaluation. The following periods of time were
chosen: For the night period (10:00 p.m. - 11:00 p.m., lou-
dest hour), as well as in accordance with the procedure of
DIN 45680 (1997) [4] for the day period (4:00 p.m. -
5:00 p.m., loudest hour) as well as informatively for the
night hour from 12:00 a.m. - 1:00 a.m. The reference values
taken from the supplement sheet "Beiblatt 1" for above-
stated norm (these are formally only valid for the operation
of industrial plants) were exceeded in the daytime as well
as night time periods. There were no clearly protruding
single tones. For informative purposes, the measurement
data was also evaluated according to the revised draft of
DIN 45680 (2013) [5]. The reference values taken as a com-
parison (these are formally only valid for the operation of
industrial plants) were exceeded in the daytime as well as
night time periods.
The data of the measurement points MP2 and MP3 was
respectively corrected according to Section 4.1 (reverbe-
rant plate). At the measurement point MP2 (Friedrichs-
platz in front of the museum), third octave levels between
Linear third octave level in dB
0
10
20
30
50
70
90
40
60
80
10,0
00
4,00
0
1,60
0
630
250
10040166.3
2.5
1.0
Frequency in Hz
MP2 (Friedrichsplatz)4 - 5 p.m.
Linear third octave level in dB
0
10
20
30
50
70
90
40
60
80
10,0
00
4,00
0
1,60
0
630
250
10040166.3
2.5
1.0
Frequency in Hz
MP3 (natural history museum, roof)4 - 5 p.m.
Linear third octave level in dB
0
10
20
30
50
70
90
40
60
80
10,0
00
4,00
0
1,60
0
630
250
10040166.3
2.5
1.0
Frequency in Hz
MP1 (Education authority, indoors)4 - 5 p.m.
Linear third octave level in dB
0
10
20
30
50
70
90
40
60
80
10,0
00
4,00
0
1,60
0
630
250
10040166.3
2.5
1.0
Frequency in Hz
MP1 (Education authority, indoors)10 - 11 p.m.
Linear third octave level in dB
0
10
20
30
50
70
90
40
60
80
10,0
00
4,00
0
1,60
0
630
250
10040166.3
2.5
1.0
Frequency in Hz
MP2 (Friedrichsplatz)10 - 11 p.m.
Linear third octave level in dB
0
10
20
30
50
70
90
40
60
80
10,0
00
4,00
0
1,60
0
630
250
10040166.3
2.5
1.0
Frequency in Hz
MP3 (natural history museum, roof)10 - 11 p.m.
Linear third octave level in dB
0
10
20
30
50
70
90
40
60
80
10,0
00
4,00
0
1,60
0
630
250
10040166.3
2.5
1.0
Frequency in Hz
MP1 (Education authority, indoors)12 - 1 a.m.
Linear third octave level in dB
0
10
20
30
50
70
90
40
60
80
10,0
00
4,00
0
1,60
0
630
250
10040166.3
2.5
1.0
Frequency in Hz
MP2 (Friedrichsplatz)12 - 1 a.m.
Linear third octave level in dB
0
10
20
30
50
70
90
40
60
80
10,0
00
4,00
0
1,60
0
630
250
10040166.3
2.5
1.0
Frequency in Hz
MP3 (natural history museum, roof)12 - 1 p.m.
Figure 6-8: Measured third octave spectra for the three measurement points at different times of the day and at night. Left column: Measurement point MP1 (education authority, indoors); centre column: Measurement point MP2 (Friedrichsplatz); right column: Measurement point MP3 (natural history museum, roof). For explanations see text.
EXHIBIT A5-1
Page 72 of 104
Ill 1111
005043

© LUBW Low-frequency noise incl. infrasound – Report on the measurement project 73
just under 35 dB and a little over 50 dB were measured in
the infrasound range up to 20 Hz. Here too, a decrease of
the infrasound can be recognised later at night. In the low-
frequency range, an excessive increase can also be seen,
which can be attributed to the road traffic. This is where
levels above 55 dB are also reached at night in the range of
32 Hz to 80 Hz, which is above the perception or hearing
threshold. An interesting effect can be seen for the 1.25 Hz
third, which, for example, clearly stands out in the third
octave spectrum for MP2 between 10:00 p.m. and 11:00 p.m.
This concerns a natural frequency of the Friedrichsplatz,
which is largely surrounded by buildings (half a wavelength
corresponds to merely the extent of the square). This effect
can be analysed further in the narrow band spectrum (not
shown here).
At the measurement point MP3 (museum roof), similar
conditions as for MP2 can be seen – with two differences:
For the infrasound below 5 Hz, an excessive increase can
be seen, which here is attributed to the somewhat increa-
sed wind speed on the roof and the corresponding wind
effects. An increase arising in the range above 500 Hz can
at least partially be attributed to the rolling noises of cars
on roads located further away, such as the B 10 (Kriegstras-
se). These were noticeable on the roof, but were otherwise
screened off. In the evening, it was possible to get a direct
view of the KSC football club’s Wildpark stadium, where a
match was taking place (Figure 6-7).
In a further analysis of the narrow band spectra (not listed
here), some individually protruding lines could be detec-
ted at some frequencies. However, these could not all be
associated with specific sources.
In Figure 6-9 the developments of the linear third octave
levels in the range from 1 Hz to 100 Hz are presented for
the measurement points MP1 to MP3 in comparison to the
perception threshold (according to draft of DIN 45 680 [5];
below 8 Hz supplemented by literature values [11]). See
also Table A3-1. The results for MP2 and MP3 were correc-
ted, as shown in Section 4.1, due to the use of a reverberant
plate.
Figure 6-10 shows the course of the A-weighted and G-
weighted sound level during the measurement at the mea-
surement point MP2 (Friedrichsplatz). It can be clearly se-
en that the G level, which represents the low-frequency
noise including infrasound, slowly and steadily decreases in
the evening hours. The G levels at the measurement point
MP1 (indoors) were mostly between 45 dB(G) and
60 dB(G) during the measuring period, and at times even
above that. At the measurement points MP2 (Friedrichs-
platz) and MP3 (roof), the values were mostly between
55 dB(G) and 65 dB(G), and partially reached levels above
70 dB(G).
Linear third octave level in dB
Frequency in Hz
0
10
20
30
50
80
120
40
60
100
70
110
90
10080635040
31.5252016
12.5108
6.354
3.152.52
1.6
1.251
MP1 (educationauthority, indoors)
12 - 1 a.m.4 - 5 p.m.10 - 11 p.m.Perception threshold
Linear third octave level in dB
Frequency in Hz
0
10
20
30
50
80
120
40
60
100
70
110
90
10080635040
31.5252016
12.5108
6.354
3.152.52
1.6
1.251
MP2(Friedrichsplatz)
Perception threshold4 - 5 p.m. 12 - 1 a.m.
10 - 11 p.m.
Linear third octave level in dB
Frequency in Hz
0
10
20
30
50
80
120
40
60
100
70
110
90
10080635040
31.5252016
12.5108
6.354
3.152.52
1.6
1.251
MP3 (natural historymuseum, roof)
Perception threshold12 - 1 a.m.10 - 11 p.m.
4 - 5 p.m.
Figure 6-9: Comparative frequency-dependent representation of the third octave sound level for the three measurement points at different times of the day and at night. The results for MP2 and MP3 have been corrected (reverberant plate, see Section 4.1). The perception threshold was also shown as a means of orientation. Left: measurement point MP1 (education authority, indoors); Centre: measurement point MP2 (Friedrichsplatz); right: measurement point MP3 (natural history museum, roof).
EXHIBIT A5-1
Page 73 of 104
I : UJ;JN I : UJ;JN
005044

74 Low-frequency noise incl. infrasound – Report on the measurement project © LUBW
LAeq, 1 minLGeq, 1 min
Sound level in dB(G) or dB(A)
0
10
20
30
40
60
90
80
50
70
Time
15:0
0
14:3
0
16:0
0
15:3
0
17:0
0
16:3
0
19:0
0
18:3
0
18:0
0
17:3
0
22:0
0
21:3
0
21:0
0
20:3
0
20:0
0
19:3
0
23:3
0
23:0
0
22:3
0
01:3
0
01:0
0
00:3
0
00:0
0
MP2 / Friedrichsplatz
MP2 / total noise LAeq, 1 minMP2 / total noise LGeq, 1 min
Figure 6-10: Course of the A and G-weighted sum level LAeq(t) und LGeq(t) at the measurement point MP2 (Friedrichsplatz) in the time period 20.09.2013, approx. 2:30 p.m. to 21.09.2013, 1:30 a.m.
EXHIBIT A5-1
Page 74 of 104 005045

© LUBW Low-frequency noise incl. infrasound – Report on the measurement project 75
7 SourcesofnoiseinresidentialbuildingsLife in the modern household is characterized by the use of
technical devices, which are used to facilitate everyday life.
The locations of the devices are normally chosen on the
basis of the existing supply connections for electricity, wa-
ter or gas. When doing so, people also generally pay atten-
tion to ensuring a preferably trouble-free use of the living
quarters. Devices such as fridges or ventilation systems are
permanently or intermittently in operation, while other
devices such as vacuum cleaners or electronic tools are
used only briefly. During operation, every technical device
emits characteristic sounds. Depending on the source, dif-
ferent sound patterns can also be caused by different ope-
rating modes.
With the help of manufacturer‘s instructions, buyers can
inform themselves about the expected noise levels prior to
the acquisition of technical devices. However, the data
sheets often only specify the A-weighted levels. These pro-
vide no indications of how the sound spreads across diffe-
rent frequencies.
In order to also be able to present low-frequency noise that
may occur in a living environment in a comparative man-
ner, the LUBW carried out sound level measurements in a
residential building in the city centre of Tübingen. The
apartment building in half-timbered construction style
dates from the second half of the 19th century. The com-
partments of the walls are made of sandstone and the
wood-beamed ceilings are filled with clay. The ceilings and
walls are additionally covered with a 3-4 cm thick layer of
lime plaster. In the course of renovation work during the
last few years, the worksite sandstone slabs or tiles were
moved onto a layer of reinforced cement screed in some
areas, such as in the bathrooms. The building is located in
a restricted traffic area; the next multilane roads are about
150 m away. Any traffic noise emanating from there is large-
ly shielded by the building density of Tübingen city centre.
The acoustic situation around the building is significantly
characterized by the communication noise of passers-by.
The measurements on 04.08.2015 registered two washing
machines from various manufacturers, one refrigerator, one
oil heating and one gas heating. For detailed information
on the used measuring instrumentation please refer to Ap-
pendix A4.
7.1 Washing machine
The washing machines were located in two apartments on
the 1st and 2nd floor of the house. The measurements we-
re each taken at a measurement point MP1 at close range
within the room of the installation itself, as well as at a
measurement point MP2 in a separate room. When measu-
ring washing machine 1 on the 1st floor, the measurement
point MP1 in the middle of the room was approx. 0.5 m
from the washing machine. Measurement point MP2 was
located approx. 3 m vertically above MP1 on the 2nd floor.
Washing machine 2 was located on the 2nd floor. Here
measurement point MP1 was also positioned in the middle
of the room approx. 0.5 m from the washing machine,
while measurement point MP2 in the adjoining room – se-
parated by a wall – was positioned approx. 5 m away.
RESULTS
The measurements of the two washing machines took
place in the period from 10:50 a.m. to 11:30 a.m. Periods
with extraneous noise effects were excluded from the eva-
luation.
With washing machine 1 in operation, third octave levels
between 44 dB and 76 dB in the infrasound range under
20 Hz were measured at measurement point MP1 (Figu-
re 7.1-1). The highest levels occurred during the spin cycle
and the lowest ones during the wash cycle. At measure-
ment point MP2, third octave levels of 29 dB to 60 dB oc-
curred below 20 Hz during the measurement of washing
machine 1. Here, too, the higher levels were registered du-
ring the spin cycle.
At washing machine 2, the third octave levels at measure-
ment point MP1 in the infrasound range below 20 Hz were
between 35 dB and 70 dB (Figure 7.1-2). Here too, the
highest third octave levels were registered in the spin cycle.
The measurements at measurement point MP2 showed
third octave levels between 26 dB and 71 dB in the same
frequency range.
EXHIBIT A5-1
Page 75 of 104 005046

76 Low-frequency noise incl. infrasound – Report on the measurement project © LUBW
The curves for the individual modes of operation of the
two measured washing machines are almost parallel for the
measurement points MP1 and MP2 in the infrasound range
below 20 Hz. In contrast, it can be seen that above 20 Hz
the difference between the third octave levels measured at
both measurement points increases with increasing fre-
quency. This can be attributed to the sound insulation ef-
fect of the building components (ceiling or wall). The buil-
ding components reduce the higher-frequency sound to a
significantly higher degree than is the case in the infra-
sound range.
The single tone at 16 Hz (washing machine 1) as well as
20 Hz (washing machine 2) are caused by the respective
rotational speed during the spin cycle. The 16 Hz third oc-
tave correlates with 960 rpm, the 20 Hz third octave with
1,200 rpm. The additionally emerging single tone at wa-
shing machine 1 at about 31.5 Hz is a harmonic overtone of
the 16 Hz third octave. Depending on the operating mode,
single third octave levels can reach the perception threshold
according to Table A3-1 between roughly 16 Hz and 20 Hz;
above 50 Hz the third octave levels are generally in the
audible range.
7.2 Heating and refrigerator
The two heating units measured were an oil boiler in the
basement with pressurised atomiser burner on the one
hand, and a gas water heater installed on a wall in the ba-
throom of the 2nd floor on the other. The fridge was loca-
ted on the 2nd floor in a corner of the kitchen. The measu-
rements of these noise sources were each carried out at a
measurement point at a distance of about 0.5 m.
RESULTS
The third octave spectra during operation of the two hea-
ting systems as well as the refrigerator in the period from
11:40 a.m. to 1:30 p.m. were measured using technical
measuring equipment. The results of the measurements are
shown in Figure 7.2-1. As was the case for the other measu-
rements, extraneous noise, e.g. caused by measuring staff or
passers-by outside, was excluded from the assessment.
Levels of approx. 55 dB to 70 dB were measured at the oil
heating in the infrasound range below the 20 Hz third oc-
tave. In the low-frequency range between 20 Hz and 80 Hz,
the third octave levels are between 55 dB and 60 dB. A
single tone with a third level of 74 dB is recognisable at
100 Hz. Levels between 40 dB and 50 dB were measured at
the gas water heater in the infrasound range below 20 Hz.
In the low-frequency range between 20 Hz and 80 Hz, the
Figure 7.1-1: Third octave noise level of washing machine 1 at measurement points MP1 and MP2 for different operating sta-tes, with perception threshold according to Table A3-1 for com-parison. "Total": Average level over the entire wash cycle.
Figure 7.1-2: Third octave noise level of washing machine 2 at measurement points MP1 and MP2 for different operating sta-tes, with perception threshold according to Table A3-1 for com-parison. "Total": Average level over the entire wash cycle.
Linear third octave level in dB
Frequency in Hz
0
10
20
30
50
80
120
40
60
100
70
110
90
500
400
315
250
200
160
125
10080635040
31.5252016
12.5108
6.354
3.15
Perception thresholdMP1 Spin cycleMP1 Washing cycleMP1 Total
MP2 Total MP2 Spin cycleMP2 Washing cycle
Washing machine 1
Linear third octave level in dB
Frequency in Hz
0
10
20
30
50
80
120
40
60
100
70
110
90
500
400
315
250
200
160
125
10080635040
31.5252016
12.5108
6.354
3.15
Washing machine 2
MP1 Spin cycleMP1 Washing cycleMP1 TotalMP2 Total MP2 Spin cycleMP2 Washing cycle
Perception threshold
EXHIBIT A5-1
Page 76 of 104
- -- -
- -- -
005047
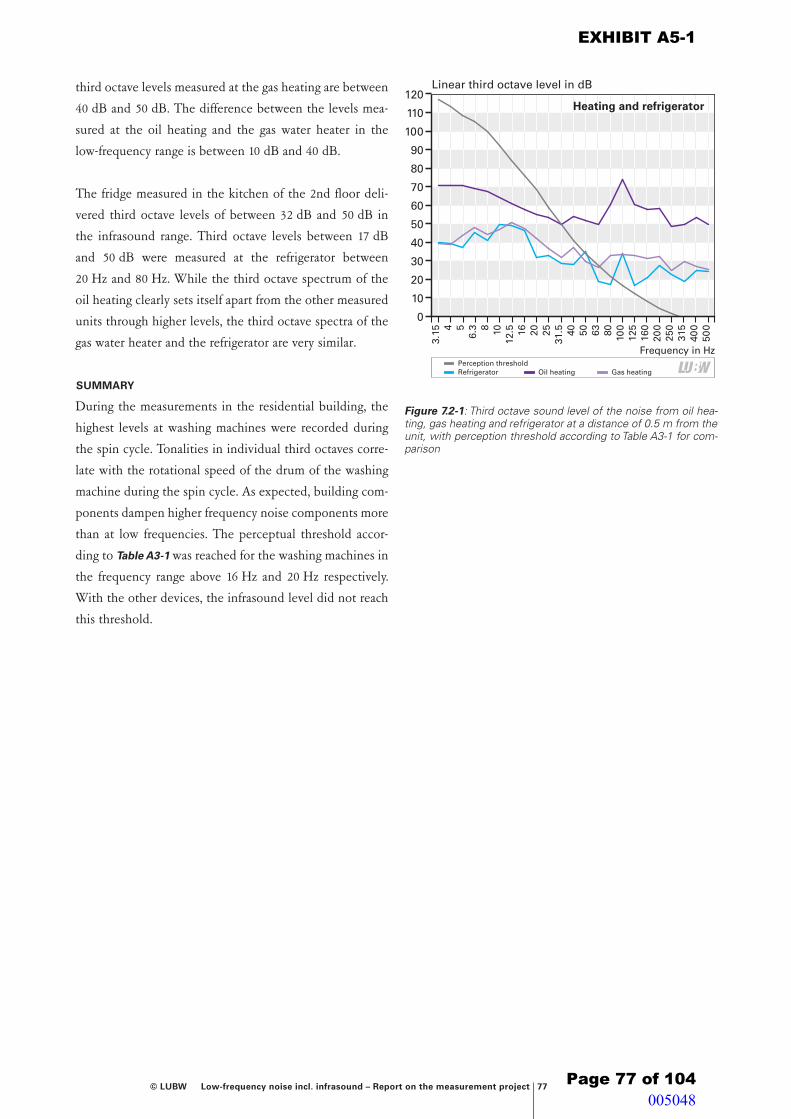
© LUBW Low-frequency noise incl. infrasound – Report on the measurement project 77
third octave levels measured at the gas heating are between
40 dB and 50 dB. The difference between the levels mea-
sured at the oil heating and the gas water heater in the
low-frequency range is between 10 dB and 40 dB.
The fridge measured in the kitchen of the 2nd floor deli-
vered third octave levels of between 32 dB and 50 dB in
the infrasound range. Third octave levels between 17 dB
and 50 dB were measured at the refrigerator between
20 Hz and 80 Hz. While the third octave spectrum of the
oil heating clearly sets itself apart from the other measured
units through higher levels, the third octave spectra of the
gas water heater and the refrigerator are very similar.
SUMMARY
During the measurements in the residential building, the
highest levels at washing machines were recorded during
the spin cycle. Tonalities in individual third octaves corre-
late with the rotational speed of the drum of the washing
machine during the spin cycle. As expected, building com-
ponents dampen higher frequency noise components more
than at low frequencies. The perceptual threshold accor-
ding to Table A3-1 was reached for the washing machines in
the frequency range above 16 Hz and 20 Hz respectively.
With the other devices, the infrasound level did not reach
this threshold.
Figure 7.2-1: Third octave sound level of the noise from oil hea-ting, gas heating and refrigerator at a distance of 0.5 m from the unit, with perception threshold according to Table A3-1 for com-parison
Linear third octave level in dB
Frequency in Hz
0
10
20
30
50
80
120
40
60
100
70
110
90
500
400
315
250
200
160
125
10080635040
31.5252016
12.5108
6.354
3.15
Perception thresholdGas heatingOil heatingRefrigerator
Heating and refrigerator
EXHIBIT A5-1
Page 77 of 104
I = Lfl:W I
005048

78 Low-frequency noise incl. infrasound – Report on the measurement project © LUBW
EXHIBIT A5-1
Page 78 of 104 005049
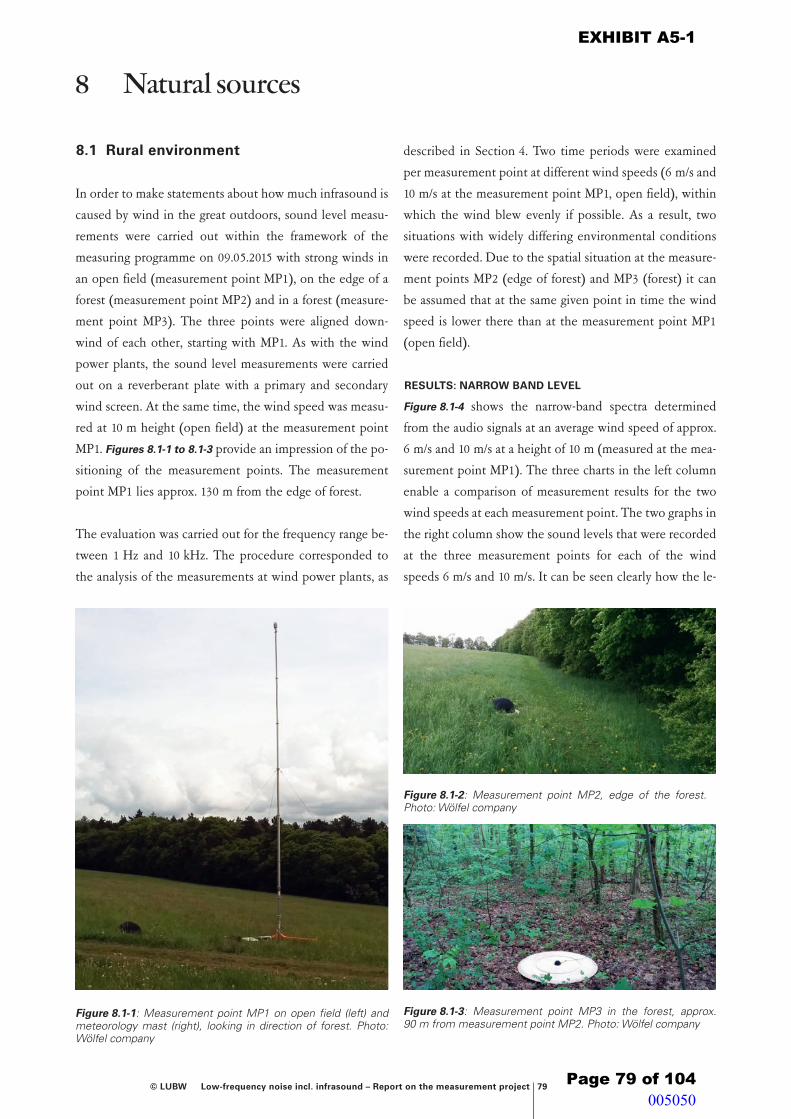
© LUBW Low-frequency noise incl. infrasound – Report on the measurement project 79
8 Naturalsources
8.1 Rural environment
In order to make statements about how much infrasound is
caused by wind in the great outdoors, sound level measu
rements were carried out within the framework of the
measuring programme on 09.05.2015 with strong winds in
an open field (measurement point MP1), on the edge of a
forest (measurement point MP2) and in a forest (measure
ment point MP3). The three points were aligned down
wind of each other, starting with MP1. As with the wind
power plants, the sound level measurements were carried
out on a reverberant plate with a primary and secondary
wind screen. At the same time, the wind speed was measu
red at 10 m height (open field) at the measurement point
MP1. Figures 8.1-1 to 8.1-3 provide an impression of the po
sitioning of the measurement points. The measurement
point MP1 lies approx. 130 m from the edge of forest.
The evaluation was carried out for the frequency range be
tween 1 Hz and 10 kHz. The procedure corresponded to
the analysis of the measurements at wind power plants, as
described in Section 4. Two time periods were examined
per measurement point at different wind speeds (6 m/s and
10 m/s at the measurement point MP1, open field), within
which the wind blew evenly if possible. As a result, two
situations with widely differing environmental conditions
were recorded. Due to the spatial situation at the measure
ment points MP2 (edge of forest) and MP3 (forest) it can
be assumed that at the same given point in time the wind
speed is lower there than at the measurement point MP1
(open field).
RESULTS: NARROW BAND LEVEL
Figure 8.1-4 shows the narrowband spectra determined
from the audio signals at an average wind speed of approx.
6 m/s and 10 m/s at a height of 10 m (measured at the mea
surement point MP1). The three charts in the left column
enable a comparison of measurement results for the two
wind speeds at each measurement point. The two graphs in
the right column show the sound levels that were recorded
at the three measurement points for each of the wind
speeds 6 m/s and 10 m/s. It can be seen clearly how the le
Figure 8.1-1: Measurement point MP1 on open field (left) and meteorology mast (right), looking in direction of forest. Photo: Wölfel company
Figure 8.1-2: Measurement point MP2, edge of the forest. Photo: Wölfel company
Figure 8.1-3: Measurement point MP3 in the forest, approx. 90 m from measurement point MP2. Photo: Wölfel company
EXHIBIT A5-1
Page 79 of 104 005050

80 Low-frequency noise incl. infrasound – Report on the measurement project © LUBW
Linear sound level in dB
Frequency in Hz
6420 18161412108
24
22
20
0
10
20
30
50
80
70
40
60
MP1 open field6 m/s
10 m/s
Figure 8.1-4: Narrow band spectra of noise at the measurement point MP1 (open field), MP2 (edge of forest) and MP3 (forest) for the frequency range of infrasound at different wind speeds. The wind measurement was always carried out at the measurement point MP1 (open field).
Left column: Comparison of narrow band levels for the various wind speeds, separately presented for the measurement points MP1 (open field), MP2 (edge of forest) and MP3 (forest).
Right column: Comparison of the narrow band level at the three measurement points, represented separately for the wind speed 6 m/s (above) and 10 m/s (below)
Linear sound level in dB
Frequency in Hz
6420 18161412108 242220
0
10
20
30
50
80
70
40
60
MP2 edge of forest6 m/s
10 m/s
Linear sound level in dB
Frequency in Hz
6420 18161412108 242220
0
10
20
30
50
80
70
40
60
MP3 forest6 m/s
10 m/s
Linear sound level in dB
Frequency in Hz
6420 18161412108
24
22
20
0
10
20
30
50
80
70
40
60
MP1 open field
MP2 edge of forest
MP3 forest
Wind 6 m/s
Linear sound level in dB
Frequency in Hz
6420 18161412108 2422200
10
20
30
50
80
70
40
60
MP1 open field
MP2 edge of forest
MP3 forest
Wind 10 m/s
EXHIBIT A5-1
Page 80 of 104
EJ
I= I EJ
Lfl:W
D
005051

© LUBW Low-frequency noise incl. infrasound – Report on the measurement project 81
Linear third octave level in dB
0
10
20
30
50
70
90
40
60
80
10,0
00
4,00
0
1,60
0
630
250
10040166.3
2.5
1.0
Frequency in Hz
MP1 – 6 m/s
Linear third octave level in dB
0
10
20
30
50
70
90
40
60
80
10,0
00
4,00
0
1,60
0
630
250
10040166.3
2.5
1.0
Frequency in Hz
MP1 – 10 m/s
Linear third octave level in dB
0
10
20
30
50
70
90
40
60
80
10,0
00
4,00
0
1,60
0
630
250
10040166.3
2.5
1.0
Frequency in Hz
MP2 – 6 m/s
Linear third octave level in dB
0
10
20
30
50
70
90
40
60
80
10,0
00
4,00
0
1,60
0
630
250
10040166.3
2.5
1.0
Frequency in Hz
MP2 – 10 m/s
Linear third octave level in dB
0
10
20
30
50
70
90
40
60
80
10,0
00
4,00
0
1,60
0
630
250
10040166.3
2.5
1.0
Frequency in Hz
MP3 – 6 m/s
Linear third octave level in dB
0
10
20
30
50
70
90
40
60
8010,0
00
4,00
0
1,60
0
630
250
10040166.3
2.5
1.0
Frequency in Hz
MP3 – 10 m/s
Figure 8.1-5: Third octave spectra of the background noise at the measurement point MP1 (open field), MP2 (edge of forest), and MP3 (forest). Left column: Wind speed 6 m/s; right column: Wind speed 10 m/s. The wind measurement was always carried out at the measurement point MP1 (open field).
EXHIBIT A5-1
Page 81 of 104
I II
-------
_- ___ I --,
005052
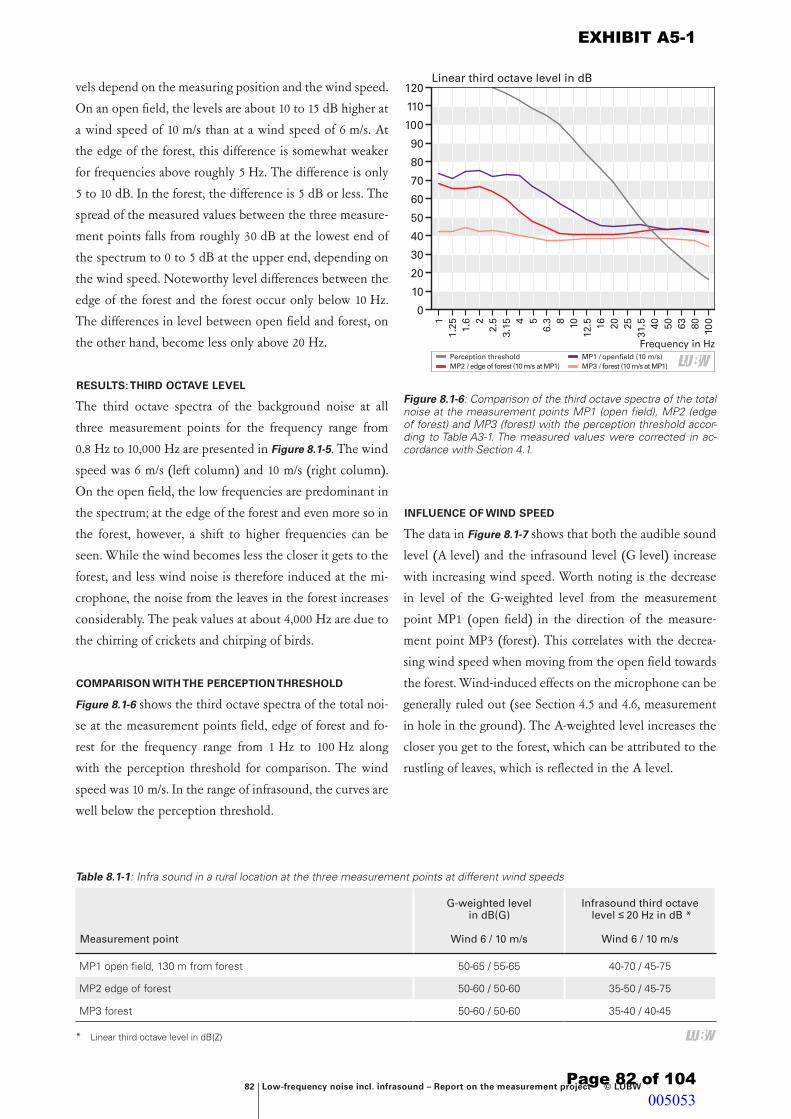
82 Low-frequency noise incl. infrasound – Report on the measurement project © LUBW
vels depend on the measuring position and the wind speed.
On an open field, the levels are about 10 to 15 dB higher at
a wind speed of 10 m/s than at a wind speed of 6 m/s. At
the edge of the forest, this difference is somewhat weaker
for frequencies above roughly 5 Hz. The difference is only
5 to 10 dB. In the forest, the difference is 5 dB or less. The
spread of the measured values between the three measure
ment points falls from roughly 30 dB at the lowest end of
the spectrum to 0 to 5 dB at the upper end, depending on
the wind speed. Noteworthy level differences between the
edge of the forest and the forest occur only below 10 Hz.
The differences in level between open field and forest, on
the other hand, become less only above 20 Hz.
RESULTS: THIRD OCTAVE LEVEL
The third octave spectra of the background noise at all
three measurement points for the frequency range from
0.8 Hz to 10,000 Hz are presented in Figure 8.1-5. The wind
speed was 6 m/s (left column) and 10 m/s (right column).
On the open field, the low frequencies are predominant in
the spectrum; at the edge of the forest and even more so in
the forest, however, a shift to higher frequencies can be
seen. While the wind becomes less the closer it gets to the
forest, and less wind noise is therefore induced at the mi
crophone, the noise from the leaves in the forest increases
considerably. The peak values at about 4,000 Hz are due to
the chirring of crickets and chirping of birds.
COMPARISON WITH THE PERCEPTION THRESHOLD
Figure 8.1-6 shows the third octave spectra of the total noi
se at the measurement points field, edge of forest and fo
rest for the frequency range from 1 Hz to 100 Hz along
with the perception threshold for comparison. The wind
speed was 10 m/s. In the range of infrasound, the curves are
well below the perception threshold.
INFLUENCE OF WIND SPEED
The data in Figure 8.1-7 shows that both the audible sound
level (A level) and the infrasound level (G level) increase
with increasing wind speed. Worth noting is the decrease
in level of the Gweighted level from the measurement
point MP1 (open field) in the direction of the measure
ment point MP3 (forest). This correlates with the decrea
sing wind speed when moving from the open field towards
the forest. Windinduced effects on the microphone can be
generally ruled out (see Section 4.5 and 4.6, measurement
in hole in the ground). The Aweighted level increases the
closer you get to the forest, which can be attributed to the
rustling of leaves, which is reflected in the A level.
Table 8.1-1: Infra sound in a rural location at the three measurement points at different wind speeds
Measurement point
G-weighted level in dB(G)
Wind 6 / 10 m/s
Infrasound third octave level ≤ 20 Hz in dB *
Wind 6 / 10 m/s
MP1 open field, 130 m from forest 50-65 / 55-65 40-70 / 45-75
MP2 edge of forest 50-60 / 50-60 35-50 / 45-75
MP3 forest 50-60 / 50-60 35-40 / 40-45
* Linear third octave level in dB(Z)
Linear third octave level in dB
Frequency in Hz
0
10
20
30
50
80
120
40
60
100
70
110
90
10080635040
31.5252016
12.5108
6.354
3.152.52
1.6
1.251
MP3 / forest (10 m/s at MP1)MP2 / edge of forest (10 m/s at MP1)MP1 / openfield (10 m/s)Perception threshold
Figure 8.1-6: Comparison of the third octave spectra of the total noise at the measurement points MP1 (open field), MP2 (edge of forest) and MP3 (forest) with the perception threshold accor-ding to Table A3-1. The measured values were corrected in ac-cordance with Section 4.1.
EXHIBIT A5-1
Page 82 of 104
I= Lf/:W I
LU:W
005053

© LUBW Low-frequency noise incl. infrasound – Report on the measurement project 83
Figure 8.1-7: Audible sound level (A level) and infrasound level (G level) depending on the wind speed for the three measurement points MP1 (open field), MP2 (edge of forest) and MP3 (forest). The G levels (red dots) and the A levels (violet dots) are shown. The wind measurement was always carried out at the measurement point MP1 (open field).
Y1
Y1
Y1
Y1
Y1
Y1
MP3 BG LAeq
MP3 HG
MP3 BG
Wind speed at MP1 at height of 10 m in m/s
Sound level in dB(G) or dB(A)
30
40
50
60
70
80
90
3.5 4.54.0 5.0 5.5 6.0 6.5 7.0 7.5 8.0 8.5 9.0 9.5 10.0 10.5
Y1
Y1
Y1
Y1
Y1
Y1
MP2 BG LAeq
MP2 HG
MP2 BG
Wind speed at MP1 at height of 10 m in m/s
Sound level in dB(G) or dB(A)
30
40
50
60
70
80
90
3.5 4.54.0 5.0 5.5 6.0 6.5 7.0 7.5 8.0 8.5 9.0 9.5 10.0 10.5
Y1
Y1
Y1
Y1
Y1
Y1
MP1 BG LAeq
MP1 HG
MP1 BG
Wind speed at height of 10 m in m/s
3.5 4.54.0 5.0 5.5 6.0 6.5 7.0 7.5 8.0 8.5 9.0 9.5 10.0 10.5
Sound level in dB(G) or dB(A)
30
40
50
60
70
80
90
MP3 forest
MP1 open field
MP2 edge of forest
Background noise LGeqBackground noise LAeq
EXHIBIT A5-1
Page 83 of 104
-
-
-
-
-
-
-
-
-
. . . . . . . . . . . .. . . . . . . . . . :., :.: .... . :. . .... . . .. . . .. . . . . .,.. . .. .. . .. .... . ..,. ~ -.. """ .. . . ... . . • • ~ • J ... , • • -' ., .... , ~. • ,. __ t •• .. •• • I".. . . . ~ .. . • . . . (:.. .. ),. ..... .,. ··~W::~:-. .. r.•=...-~ , ... ~., ~ .... ,.:.:. •• ;.:!•! ....... - . • • • .. .... ___, &-4'. • • ... ,.. ..... • }'• ... • \ • ~ --- • • •• • .. "'•"' r19 ,, ... :-:-:-~ . r •... , . -~ ~--.,_ •-) . ~· ... ,,-."' . .. . ., . • • . . . . . . . . ' .. . . . .
. . .. . .
.. I • :e ' 1.
• ••: : , .. • • I • • • 6'_ f:P..,, • • ••
.. . . .,_,._ ... .. ........... .. . -l ·~·· . ··t:· ~.,.-.:. .. •, . ._.,. . .. •:a.. .1. ..... . " •• • ... - ........ .., .,. •"'1 .. .
. .. .... • . .
. r ~•=-·· .-....."f:.:~~··~•.;.)it .. • • I In ••t•~• .,.-• ~--~ ~.,, •
. • . . ..
zy•• I • •, • •• ,-,., •• •••••I • II ,•:, :,• • •, • :•• •1, • . . . .
•••••• ....... ,. . . •: . . . . .· .
• • •I •• •I •• • •• ·~• • • • ••• • • •• • • ~ I • •• •• • • ~~·""•-.\.,.• .,,:4;,.;=- '·~.~U:.,..._•·a..:··> ,., • •• •·,,• ·: • ·:- ._ :-~·~ri/ .:o-~· .. v~ ~· "'' .: ,r,.,.~ . • • • • • • •• •• • -: ·•··". • •,.: ·>. • ... : £":--• , r. ~· .• ....:: ,. • .- . \ • ••• - • .,1._: ...... :.. • •• .... • , ... ,. • : • • • • • • • • • • • • .. .- •• :iii"~ • •~4· 'l;C .. J, •• A • • • , .. I • • • " • • • • • • •
• • ., ,. •I. • •'/•-, .:_.,.,.' ,.,:, ,~• -:-;-_~;I !'t. ,-• • ~?.:~~ ,. .,,;. .-... .:. • •• • • ~' •• • _. .• • • • •• ._•-r •• !'.ti-• • ..-. .-; ' • • • ,!~I .. I • , • • . . . .. -.... . . . -... -. . . ..,.. •'·., .. .... , ·--·· .. , . -· . . . . • • •• ,- •• • • • •• • I •,. • •' • • • •••• • • • • • : . .
I I I I I I I I I I I I
... \ • . . ...
• . •• r . . ,
. . . : .. , . ;..-: • ·,~·· ~~:~·· ... --·~ '!:~· ... : .. : .... ~ ., . . . • . • ·, ., 4' • ,...c..• ~~·~--~~ .J ........ ~ •• , .. ,. • • ,_ • I .._.... ...- ,.r .. • \~'II'• •• • •
• I .. ,t • .. •••1•.: I •• \ JO•• :..'in I r ,CW • ----/. • • · •• •• • • --••• .: •• "" • .. .. • .A.! •• ~,. ... : .-·· ••••• ,. ... ' • ., • ... • • • • • I • • I • ) "-" & \'; "'1' IV, .-?.J I;. ••1 • • ,_• t:-:.• • ~ ,.._ I ~ '•: • • .. • ·=· .. ,. .•• · 1 • ~·,~•#-:.-,•,.:Jo!•·,:··,-...... ,~-.. . .• ,:· .. .. . .. _ ... . ..... ,. . .. •.· . . . . .
•
I I I I I I I I I I I
• •
.. . • • • ..
I
. , .. · . . . . .. . . .
I
. .. . ..
005054

84 Low-frequency noise incl. infrasound – Report on the measurement project © LUBW
CONCLUSION
The infrasound shows a strong dependence on the measu
ring position. The linear levels in the narrowband spect
rum measured in the open field were up to 30 dB higher
than the levels measured in the forest (Table 8.1-1). The
differences are not as pronounced above 16 Hz, but a ten
dency towards higher levels can be seen in the open field
compared to the forest at low frequencies. Higher levels
were measured for Aweighted audible sound in the forest,
which is attributable to the rustling of leaves.
8.2 Sea surf
In addition to wind noise, sea surf is a widespread natural
source of lowfrequency noise and infrasound. The LUBW
was not able to take its own measurements at the coast
within the framework of this project. Therefore, currently
published values shall be drawn upon in order to provide
an order of magnitude. In 2012 Turnbull, Turner and
Walsh published metrics for sea surf as a natural source of
infrasound [21]. Accordingly, the Gweighted infrasound
level on a beach was 75 dB(G) at a distance of 25 m from
the waterline, 69 dB(G) at a distance of 250 m from a cliff,
and 57 dB(G) at a distance of 8 km from the coast
(Table 8.2-1). Near the coast, the third octave levels at dif
ferent frequencies below 20 Hz were in the range of 53 dB
to 70 dB (Figure 8.2-1).
Table 8.2-1: Infrasound levels of sea surf for different boundary conditions
Source G-weighted level in dB(G)
Infrasound third octave level ≤ 20 Hz in dB *
Beach, 25 m from the waterline 75 53 to 70
Cliff, at distance of 250 m 69 54 to 65
Inland, 8 km from the coast 57 43 to 63
* Linear third octave level in dB(Z)
Linear third octave level in dB
Frequency in Hz
0
10
20
30
50
80
120
40
60
100
70
110
90
200.8 16
12.5108
6.354
3.152.52
1.6
1.251
Inland, 8 km from the coastCliff, 250 m
Beach, 25 mPerception threshold
Figure 8.2-1: Third octave spectra of the total noise of surf, diffe-rent boundary conditions according to [21], perception threshold according to Table A3-1 for comparison
EXHIBIT A5-1
Page 84 of 104
~ --
I = -- Lf/:W I
LU:JN
005055
© LUBW Low-frequency noise incl. infrasound – Report on the measurement project 85
9 Designofalong-termmeasuringstationforlow-frequencynoise
9.1 Task
An integral part of the measurement project "Low-frequen-
cy noise incl. infrasound from wind turbines and other
sources" was the setup of a feasibility concept for a self-
sufficient long-term measuring station with which to mea-
sure and document the noise situation at wind turbines. In
particular, low-frequency effects were to be taken into ac-
count. When designing the concept, it was assumed that
such a measuring station is to be used primarily in the con-
text of monitoring measurements or in connection with
complaint cases. Furthermore, the long-term measuring
station should also provide a possibility to carry out special
studies, e.g. for the determination of infrasound or sound
modulations or before/after analyses. The following specifi-
cations had to be taken into account:
� DIN EN 61400-11 "Windenergieanlagen – Teil 11:
Schallmessverfahren" (2013) [6]
� Technical guidelines for wind turbines, part 1, revision
18 (as of 01.02.2008, issued by FGW Fördergesellschaft
Windenergie e.V.) [7]
� Technical instructions on noise abatement – "TA Lärm"
(1998) [10]
� DIN 45680 "Messung von Bewertung tieffrequenter
Geräuscheinwirkungen in der Nachbarschaft" (1997)
[4] as well as DIN 45680 "Messung und Beurteilung
tieffrequenter Geräuschimmissionen" (2013 draft) [5].
In addition, a mains voltage-independent operation of the
measuring station should be ensured for a period of two to
four weeks.
9.2 Concept
The design of the measuring station was to include in par-
ticular the technical equipment, the evaluation of the mea-
sured data as well as the evaluation of the results in the
context of immission protection. In principle, the projec-
ted long-term measuring station is divided into the fol-
lowing functional modules:
� Unit for detecting the operating parameters of the
wind turbine
� Meteorology measuring unit
� Noise measuring unit
� Device monitoring (remote control unit)
� Data centre (database and data analysis)
If the task requires it, the long-term measuring station
could contain several similar measurement units. The basic
design of a possible long-term measuring station is shown
in Figure 9.2-1 dargestellt.
9.3 Individual modules for data acquisition
FACILITY AND OPERATING PARAMETERS
Approximate statements regarding the operating state of a
wind power plant can be derived from wind data determi-
ned near the measuring location. However, this does not
apply for special operating modes of the system (e.g. low
noise operation, system downtime in case of insufficient
wind conditions).
Reliable results for the current performance of a wind tur-
bine require the continuous determination of the actual
turbine and operating parameters such as system power,
rotor speed, nacelle angle, blade angle, wind speed and
wind direction. Typically, the system operator already re-
cords these parameters as part of standard procedure. How-
ever, taking over such data from the operator into the coll-
ective of the data determined by the long-term measuring
station is often difficult, if not impossible, in practice. It is
therefore much more reliable, yet more bothersome, to re-
cord the turbine operation data on one’s own measuring
system. In order to do so, the turbine signals would have to
be decoupled from the turbine control system of the wind
EXHIBIT A5-1
Page 85 of 104 005056

86 Low-frequency noise incl. infrasound – Report on the measurement project © LUBW
power plant via transducers or existing interfaces, and be
registered by the appropriate data loggers. With this type
of gathering of data, the data recording (sampling sequence,
data formats, etc.) can be devised according to its own stan-
dard. Thus, optimal data integration into the overall system
would be guaranteed. However, this would certainly requi-
re the support by trained personnel during the setup and
connection of the measuring system to the turbine control.
WEATHER DATA
In addition to the noise measurement data, the meteorolo-
gical variables – mean wind speed, mean wind direction
(each in 10 s intervals) – as well as precipitation, air tempe-
rature and air pressure have to be determined. Commer-
cially available weather stations (sensors and data loggers)
equipped with sufficient data storage could be used for this
purpose. The collected meteorological parameters are then
linked with the other metrics in the data centre. If techni-
cally possible, the recording of meteorological data could
already be carried out on location together with the noise
measurement data in the sound level analyser. The wind
data should be collected at a height of up to 10 m above
ground. The respective masts that can also be used on
rough terrain are provided by a number of manufacturers.
ACOUSTIC DATA
In order to measure the acoustic data, a combination of
devices consisting of a standard sound level analyser and
changeable microphone unit can be used. As far as neces-
sary or appropriate, further functional units such as cont-
roller, monitoring system or meteorology recording can be
included or attached. The noise measuring system is funda-
mentally suitable for determining emissions (DIN EN
61400-11 [6]), noise immissions (TA Lärm [10]) and low-
frequency noise (DIN 45680 [4]). The following specifica-
tions must be met by the sound level analyser:
� Calibratable sound level meter according to DIN EN
61672-1:2003 [22] Class 1, with standard microphone
and third octave filters according to DIN EN
61260:2003 [23] Class 1
Emission reference measuring point
Immission measuring pointControl laboratory
Figure 9.2-1: Basic design of a possible long-term monitoring station
EXHIBIT A5-1
Page 86 of 104 005057

© LUBW Low-frequency noise incl. infrasound – Report on the measurement project 87
� Usable range of levels: 18 dB(A) to 110 dB(A), usable
frequency range: 1 Hz to 20 kHz
� Ongoing collection of different sound levels (LAeq,
LAFmax, LCeq, LCFmax, LTerzAeq, LTerzAFmax) in periodic
times of 0.1 s to 10 s
� Continuous recording of the audio signal and hourly
storage as a WAV file. The data storage capacity must
be sufficient for records of at least two weeks, or in the
case of a restricted frequency range of the audio recor-
ding for recordings of at least four weeks
� Extensive trigger management (timed triggering and
external trigger option)
� Alternatively usable infrasound microphone (lower li-
miting frequency ≤ 1 Hz, uncertainty at 1 Hz ≤ ± 3 dB)
� Additional weatherproof microphone plate with prima-
ry and secondary wind screens according to DIN EN
61400-11 [6]
� Additional primary and secondary wind screens for
mounting on tripod or measuring mast for immission
measurements according to TA Lärm [10]
DEVICE MONITORING
Ideally, the possibility should be given to monitor and con-
trol all measuring systems wirelessly via an Ethernet or
GSM connection from the data centre. If permitted by the
data connection, a transfer of the stored data to the data
centre should also be possible.
In order to increase the transparency of the respective
measuring project, a real-time display of measurement re-
sults on a publicly accessible website could also be enab-
led.
GENERAL REQUIREMENTS
In general, it must be possible to operate all devices of the
long-term measuring station with 12 V direct voltage inde-
pendently from the public power supply network. The
measuring station should be equipped with the respective
power supply units. A maintenance-free continuous opera-
tion of four weeks ought to be ensured. The long-term
measuring station should generally be designed in a wea-
therproof manner. As far as necessary, all parts should be
sufficiently protected from the weather (precipitation, sun,
wind). Operation in an air temperature range of -5 °C to
+30 °C must be made possible. The long-term measuring
station must be fitted with safety features against damage
by animals, against vandalism and against theft.
9.4 Central data evaluation
The evaluation of the data gathered on location and its
compilation to measurement reports is generally carried
out in the data centre after the end of the measurements.
The nature and scope of the evaluation depends on the
predefined task. The actual data evaluation can largely be
carried out automatically. Analysis programmes for this
purpose are commercially available. The following points
should be considered for the evaluation:
� Data preparation: Individual data that is required but
cannot be determined on location can be derived from
the measured data or the audio recordings. (e.g. G-
weighted noise levels, narrowband frequency analyses,
tonalities, impulsiveness).
� Data synchronization: The individual values of the tur-
bine data, the meteorological measurements and the
acoustic measurements are to be consolidated for the
same period lengths (e.g. 10 s) and to be synchronised to
the same absolute points in time.
� Rectifying faults: If there is extraneous noise at the mea-
surement point as well as noise from the wind power
plant, this could lead to misinterpretations of the noise
situation. The levels of the noise influenced by extrane-
ous sources therefore must be excluded when determi-
ning the turbine noise levels. This requires a compre-
hensive plausibility check of all measured data for every
individual case. Impulsive background noise can often
be well recognized from the level curve, ongoing exter-
nal noise interference can often be seen only on the
basis of the level curves of individual frequency bands.
When in doubt, the audio recordings will have to be
referred to.
EXHIBIT A5-1
Page 87 of 104 005058

88 Low-frequency noise incl. infrasound – Report on the measurement project © LUBW
9.5 Applicability and benefits
The affected population is often rather sceptical when it
comes to projected noise levels or measurements of wind
turbines that are taken within a matter of hours. It is thus
that the people affected often assume that the applied pro-
cedures do not take into account all facets of possible dis-
turbances. Also, it is believed that the worst operating mo-
de of the wind turbine is often not the basis for the noise
measurements. In such cases, the use of a long-term measu-
ring station is a good idea. In order to increase its accep-
tance, the general population could also be involved in the
evaluation proceedings.
FIELDS OF APPLICATION
� Determination of the noise emissions and immissions
caused by wind power plants subject to wind and plant
operating conditions. Generation of different statistics
on noise occurrence, plant parameters or wind condi-
tions.
� Comparison of the results with the reference valu-
es and indicators in the TA Lärm and DIN 45680 [4, 5],
as well as the level values used or specified in the ap-
proval procedure.
� Determination of the infrasound influencing a measu-
rement point, possibly depending on the wind and
plant operating conditions.
� Determination of noise exposure at a location before
and after commissioning of wind turbines.
� Identification of specific or not regularly occurring noi-
se or sound effects, for example implemented by com-
plainants.
� Ultimately, the operation of such a long-term measu-
ring station could be seen as a contribution towards
the protection of the population against the harmful
effects of noise, and in particular as a contribution to
the pacification of the conflict situation on location.
� The use of a long-term measuring station is not suited
as a means of carrying out acceptance tests. Such mea-
surements require direct support through expert staff.
EXHIBIT A5-1
Page 88 of 104 005059

© LUBW Low-frequency noise incl. infrasound – Report on the measurement project 89
Appendix A1 – General information
The following sections provide information on infrasound
and low-frequency noise in generally understandable form.
This concerns the development, occurrence, spreading as
well as the evaluation and perception of infrasound and
low-frequency sound [15] [19] [24] [25] [26] [27] [28].
A1.1 LOW-FREQUENCY NOISE AND INFRASOUND
Put simply, sound consists of compressional waves. When
such pressure fluctuations spread in the air, one refers to
them as airborne noise. A human’s sense of hearing is able
to capture sound, the frequency (see Appendix A3) of
which lies between approximately 20 Hz and 16,000 Hz
(for children this value is about 20,000 Hz). Low frequenci-
es correspond to low notes while high frequencies corres-
pond to high notes. Sound below the audible range, i.e.
with frequencies below 20 Hz, is called infrasound. Noise
above the audible range, i.e. with frequencies above
20,000 Hz, is known as ultrasound. Low-frequency noise is
defined as sound which is primarily within the frequency
range below 100 Hz. Infrasound is thus a part of low-fre-
quency sound.
Periodic air pressure fluctuations spread with a velocity of
approximately 340 meters per second. Low-frequency vib-
rations have large wave lengths while high-frequency vibra-
tions have small wave lengths. For example, the wavelength
of a 20 Hz tone in air is about 17 m, while a frequency of
20,000 Hz has a wavelength of 1.7 cm (see Table A1-1).
A1.2 SOUND PROPAGATION
The propagation of infrasound and low-frequency sound
follows according to the same physical laws as all kinds of
air-borne noise. A single sound source, such as a wind tur-
bine generator, emits waves that spread in all directions in
a spherical manner (Figure A1-1). As the sound energy is
distributed across an ever growing area, the noise intensity
decreases per square meter in an inverse proportion: With
increasing distance it quickly becomes quieter (roughly
6 dB per doubling of distance). In addition, there is also
the effect of absorption of sound through the air. A small
part of the sound energy is converted into heat during the
spread of the waves, resulting in additional absorption.
This air absorption depends on the frequency: Low-fre-
quency sound is only slightly absorbed while high-frequen-
cy is absorbed more. In comparison, the decrease of the
sound level over distance significantly outweighs the de-
crease through air absorption. When spreading across flat
surfaces, interference can occur, leading to highly fluctua-
ting sound levels. A pressure build-up may occur in front of
large obstacles leading to an increase in the sound pressure
level. Standing waves may occur outdoors between the fa-
cades of buildings. Furthermore, a special feature of low-
frequency sound waves is their low absorption through
walls or windows, meaning that effects can also occur in-
side of buildings. Here too, the formation of standing waves
may be the case. However, in the infrasound range these
can arise only in large halls or churches; in common resi-
dential buildings the fundamental oscillations are at higher
frequencies.
Table A1-1: Relationship between frequency and wavelength for sound waves in the air
Frequency 1 Hz 10 Hz 20 Hz 50 Hz 100 Hz 2,000 Hz
Wavelength 340 m 34 m 17 m 6.8 m 3.4 m 17 cm
EXHIBIT A5-1
Page 89 of 104 005060

90 Low-frequency noise incl. infrasound – Report on the measurement project © LUBW
A1.3 INCIDENCE AND OCCURRENCE
Infrasound and low-frequency noise are everyday compo-
nents of our environment. They are produced by a large
number of different sources. These include natural sources,
such as wind, waterfalls or sea surf, just as much as techni-
cal sources, such as heating and air conditioning systems,
road and rail traffic, airplanes or speaker systems in night-
clubs, etc.
A1.4 EVALUATION
The measurement and assessment of low-frequency noise
are regulated in the technical instructions for the protec-
tion against noise (TA Lärm [10], please refer to Chapter 7.3
and Appendix A1. 5) as well as the standard DIN 45680
[4]. The impact of noise can be safely determined on the
basis of these regulations. In this case the frequency range
from 8 Hz to 100 Hz is considered. The crucial aspect
when it comes to possible noise pollution is the human
hearing threshold or perception threshold, which is outli-
ned in the standard. See also the next section.
An own frequency weighting, the so-called G-weighting,
exists for the area of infrasound. The relevantly weighted
levels are specified as dB(G) – "decibel G". The A-weigh-
ting of noise dB(A) – "decibel A" – is more common, which
is derived from human hearing. The G-weighting is focused
at 20 Hz. Levels are amplified between 10 Hz and 25 Hz.
Above and below that, the valuation curve quickly falls.
The purpose of G-weighting is to characterise a situation
regarding low frequencies or infrasound with only a single
number. A disadvantage is that frequencies below 8 Hz
and above 40 Hz hardly contribute at all. For more infor-
mation please refer to "Frequency Evaluation" in Appen-
dix A3, where you will also find an evaluation curve
(Figure A3-1).
A1.5 PERCEPTION
In the area of low-frequency noise below 100 Hz there is a
smooth transition from hearing, i.e. the sensations of volu-
me and pitch, to feeling. Here the quality and nature of the
perception changes. The pitch sensation decreases and
does not apply at all for infrasound In general, the fol-
lowing applies: The lower the frequency, the higher the
Protective barrierHill
- 6 dB - 6 dB - 6 dB - 6 dB
High-rise building
136 m272m
544m
68 m
Sourceinfrasound
34 m
Figure A1-1: Exemplary presentation of spread of infrasound with a frequency of 10 Hz. The associated wavelength of 34 m is larger than the height of houses, trees and protective barriers. Therefore these hardly absorb the sound. However, the sound pressure level nevertheless decreases according to the same law as for audible sound: Each doubling of distance from the source results in a de-crease in sound level of 6 dB. Image source: Bayerisches Landesamt für Umwelt [15]
EXHIBIT A5-1
Page 90 of 104
I I
005061

© LUBW Low-frequency noise incl. infrasound – Report on the measurement project 91
sound intensity has to be so that the noise is heard at all
(see Table A1-2). Low-frequency impact with high intensity
is often perceived as ear pressure and vibrations. Perma-
nent exposure to such high noise levels can lead to buz-
zing, vibrating sensations or a feeling of pressure in the
head. In addition to the sense of hearing, other sensory
organs can also register low-frequency sound. For example,
the sensory cells of the skin convey pressure and vibration
stimuli. Infrasound can also affect cavities in the body, such
as lungs, sinuses and middle ear. Infrasound of very high
intensity has a masking effect for the middle and lower
acoustic range. That means: In the case of very strong infra-
sound, your hearing is unable to perceive quiet tones in
frequencies above it.
But where are the limits between hearing, feeling and "no
longer perceiving"? Table A1-2 shows some levels of the
hearing and perception thresholds for different frequenci-
es. The hearing threshold of DIN 45680 (1997) [4] is defi-
ned in such a way that 50 % of the population will no lon-
ger perceive the respective frequency below the specified
level. The perception threshold of DIN 45680 (2013) [5] is
defined so that 90 % of people will no longer perceive the
sound below this level. The limit from which low-frequen-
cy sound can be heard, varies from person to person. This
is nothing unusual, as it is similar to what we are accusto-
med to regarding audible sound in everyday life. For almost
70 % of people, the hearing threshold lies in a range of
± 6 dB around the values shown in Table A1-2. For particu-
larly sensitive individuals, who make up around two to
three percent of the total population, the hearing threshold
is at least 12 dB lower. Figure A1-2 provides a graphic depic-
tion of the relationship of the two thresholds. The differen-
ces are relatively small.
Laboratory tests on the impact of infrasound have shown
that high intensities above the perception threshold are
tiring and have an adverse effect on concentration, and can
influence performance. The best proven reaction by the
body is increasing fatigue after several hours of exposure.
The balance system can also be affected. Some test persons
had feelings of insecurity and anxiety, while others dis-
played a reduced respiratory rate. Furthermore, as is the
case with audible sound, very high sound intensities can
lead to a temporary hearing impediment – an effect often
known by people who go to nightclubs. Long-term exposu-
re to strong infrasound can also lead to permanent hearing
loss. However, the infrasound levels that occur in the vici-
nity of wind power plants will hardly be able to cause any
such effects, as they fall far short of the hearing or percep-
tion threshold. In scientific literature, any health effects
could so far be shown only at sound levels above the hea-
ring threshold. Below the hearing threshold, no effects on
humans caused by infrasound could so far be proven [25].
Table A1-2: Hearing and perception threshold (in decibels) in the range of infrasound. The lower the frequency, the louder the noise or sound intensity has to be in order for a person to perceive something. At 8 Hz the sound pressure level has to be at 100 deci-bels. Humans can hear best in the area of 2,000 to 5,000 Hz. That is where the average hearing threshold is at 0 decibels and even below it (up to minus 5 decibels).
Frequency (as a third octave centre frequency) 8 Hz 10 Hz 12.5 Hz 16 Hz 20 Hz
Hearing threshold according to DIN 45680 (1997) [4] 103 dB 95 dB 87 dB 79 dB 71 dB
Perception threshold according to draft DIN 45680 (2013) [5] 100 dB 92 dB 84 dB 76 dB 69 dB
Sound pressure level in dB
Frequency in Hz
0
10
20
30
50
80
120
40
60
100
70
110
90
160
125
10080635040
31.5252016
12.5108
6.3
Perception threshold draft DIN 45680: 2013 in dBHearing threshold DIN 45680: 1997 in dBHearing threshold DIN ISO 226: 2006 in dB
Figure A1-2: Representation of hearing and perception threshold according to ISO 226 [29], DIN 45680 (1997) [4] and draft DIN 45680 (2013) [5]. The perception threshold according to the draft of DIN 45680 is roughly 10 dB lower than the values of ISO 226.
EXHIBIT A5-1
Page 91 of 104
Lf/:JN
005062

92 Low-frequency noise incl. infrasound – Report on the measurement project © LUBW
EXHIBIT A5-1
Page 92 of 104 005063

© LUBW Low-frequency noise incl. infrasound – Report on the measurement project 93
Appendix A2 – Sources and literature
[1] Windenergieerlass Baden-Württemberg – common adminis-
trative regulation of the Ministry of Environment, Climate
and Energy (and other ministries) from 09.05.2012, joint of-
ficial journal of the federal state of Baden-Württemberg
from 30.05.2012, 2012 Edition, No. 7, pg. 413-441, Internet:
um.baden-wuerttemberg.de, enter "Windenergieerlass" in
the search field
[2] Law for the protection against harmful environmental im-
pacts caused by air pollutants, noises, vibrations, and similar
occurences (Bundes-Immissionsschutzgesetz – BImSchG) as
amended by the notice from 17 May 2013 (BGBl. I pg. 1274)
that was altered by article 1 of the law from 2 July 2013
(BGBl. I S. 1943).
Internet: http://www.gesetze-im-internet.de/bimschg
[3] Fourth Ordinance for the Implementation of the Federal
Immission Protection Law (Ordinance on Installations Re-
quiring a Permit – 4th BImSchV) from 2 may 2013 (BGBl. I
pg. 973, 3756). Internet: http://www.gesetze-im-internet.de/
bimschv_4_2013/BJNR097310013.html
[4] DIN 45680: Messung und Bewertung tieffrequenter Ge-
räuschimmissionen in der Nachbarschaft (mit Beiblatt),
date of issue 1997-03
[5] DIN 45680: Draft: Messung und Bewertung tieffrequenter
Geräuschimmissionen (September 2013), date of issue 2013-
09, with respect to perception threshold identical with draft
2011-08
[6] IEC 61400-11: Acoustic noise measurement techniques,
Edition 2.1, date of issue 2006-11 – German version:
DIN EN 61400-11: Windenergieanlagen – Teil 11:
Schallmessverfahren, date of issue 2013-09
[7] Technische Richtlinie für Windenergieanlagen, Teil 1:
Bestimmung der Schallemissionswerte, revision 18, as of
01.02.2008, editor: FGW Fördergesellschaft Windenergie
und andere Erneuerbare Energien e. V.
[8] DIN 45645: Ermittlung von Beurteilungspegeln aus Mes-
sungen, Teil 1: Geräuschimmissionen in der Nachbarschaft,
date of issue 1996-07
[9] ISO 7196: Acoustics – Frequency-weighting characteristic for
infrasound measurements, date of issue 1995-03
[10] Technische Anleitung zum Schutz gegen Lärm – Sechste
Allgemeine Verwaltungsvorschrift zum Bundes-Immissions-
schutzgesetz from 26 August 1998 (TA Lärm), GMBL 1998
Nr. 26, pg. 503-516, Internet:
http://www.verwaltungsvorschriften-im-internet.de/
bsvwvbund_26081998_IG19980826.htm
[11] Møller H. & Pedersen C. s. (2004): Hearing at low and
infrasonic frequencies, Noise & Health, Vol. 6, Issue 23,
S. 37-57
[12] DIN 45669: Messung von Schwingungsimmissionen
Teil 1: Schwingungsmesser – Anforderungen und
Prüfungen, date of issue 2010-09; part 2: Messverfahren,
date of issue 2005-06
[13] DIN 4150: Erschütterungen im Bauwesen, Teil 1: Einwir-
kungen auf Menschen in Gebäuden, date of issue
2001-06; Teil 2: Einwirkungen auf Menschen in Gebäuden,
date of issue 1999-06; Teil 3: Einwirkungen auf bauliche
Anlagen, date of issue 1999-02
[14] HenkeMeier F. & Bunk O. (2010): Schalltechnischer Bericht
Nr. 27257-1.006 über die Ermittlung und Beurteilung der
anlagenbezogenen Geräuschimmissionen der Windenergie-
anlagen im Windpark Hohen Pritz, Mai 2010, Messungen
der Fa. Kötter, im Auftrag des Landes Mecklenburg-Vor-
pommern, Landesamt für Umweltschutz, Naturschutz und
Geologie (LUNG), Rheine, Internet: http://www.lung.
mv-regierung.de/dateien/infraschall.pdf
[15] Bayerisches Landesamt für Umwelt & Bayerisches Landes-
amt für Gesundheit und Lebensmittelsicherheit (2014):
Windkraftanlagen – beeinträchtigt Infraschall die Gesund-
heit?, Augsburg/Erlangen, Internet: http://www.lfu.bayern.
de/umweltwissen/ doc/uw_117_windkraftanlagen_infraschall_
gesundheit.pdf
[16] Bayerisches Landesamt für Umweltschutz (2000): Langzeit-
Geräuschimmissionsmessung an der 1 MW-Windenergie-
anlage Nordex N54 in Wiggenbach bei Kempten (Bayern),
EXHIBIT A5-1
Page 93 of 104 005064

94 Low-frequency noise incl. infrasound – Report on the measurement project © LUBW
Augsburg, Internet: http://www.lfu.bayern.de/laerm/
messwerte/doc/windenergieanlage.pdf
[17] Møller H. & Pedersen C. S. (2010): Low-frequency noise
from large wind turbines, Journal of the Acoustical Society
of America, Vol. 129, No. 6, June 2011, S. 3727-3744
[18] EPA – Environment Protection Authority South Australia
& Resonate Acoustics (2013): Infrasound levels near wind-
farms and in other environments, Adelaide, Internet:
www.epa.sa.gov.au/files/477912_infrasound.pdf
[19] BorgMann r. (2005): Leitfaden Nichtionisierende
Strahlung – Infraschall, Fachverband für Strahlenschutz,
Garching, Internet: www.fs-ev.org
[20] Betke K. & reMMers H. (1998): Messung und Bewertung
von tieffrequentem Schall, in: Deutsche Gesellschaft für
Akustik (DEGA) (ed., 1998): Fortschritte der Akustik,
Tagungsband der Deutschen Akustiktagung 1998,
Oldenburg, Internet: http://www.itap.de/wp-content/
uploads/2015/11/tieffrequent.pdf
[21] turnBull C., turner J. & WalsH D. (2012): Measurement
and Level of Infrasound from Windfarms and other sources,
Acoustics Australia, Vol. 40, No. 1, April 2012, pg. 45-50
[22] DIN EN 61672-1: Elektroakustik – Schallpegelmesser,
Teil 1: Anforderungen (IEC 61672-1:2013); German version
EN 61672-1:2013, date of issue 2014-07
[23] DIN EN 61260: Elektroakustik – Bandfilter für Oktaven
und Bruchteile von Oktaven (IEC 61260:1995 + A1:2001);
German version EN 61260:1995 + A1: 2001, date of issue
2003-03
[24] LUBW Landesanstalt für Umwelt, Messungen und Natur-
schutz Baden-Württemberg (2015): Windenergie und Infra-
schall – Tieffrequente Geräusche durch Windenergie-
anlagen, 6th edition October 2015, Karlsruhe, Internet:
www.lubw.de/servlet/is/223628
[25] tWardella D. (2013): Importance of the expansion of wind
energy for human health, in: UMID Umwelt und Mensch –
Informationsdienst, pg. 14-18, Internet:
www.umweltbundesamt.de/sites/default/files/medien/360/
publikationen/umid_03_2013_internet_neu.pdf
[26] LUBW Landesanstalt für Umwelt, Messungen und Natur-
schutz Baden-Württemberg (2015): Fragen und Antworten
zu Windenergie und Schall – Behauptungen und Fakten,
Karlsruhe, Internet: www.lubw.de/servlet/is/255800
[27] Robert Koch-Institut (2007): Infraschall und tieffrequenter
Schall – ein Thema für den umweltbezogenen Gesundheits-
schutz in Deutschland?, Bundesgesundheitsblatt – Gesund-
heitsforschung – Gesundheitsschutz, Nr. 50, pg. 1582-1589,
Internet: http://www.rki.de/DE/Content/Kommissionen/
UmweltKommission/Archiv/Schall.pdf
[28] HA Hessen Agentur GmbH im Auftrag des Hessischen
Ministeriums für Wirtschaft, Energie, Verkehr und
Landesentwicklung (2015): Faktenpapier Windenergie
und Infraschall, Internet: www.energieland.hessen.de/
faktenpapier_infraschall
[29] DIN ISO 226: Akustik – Normalkurven gleicher Lautstärke-
pegel, date of issue 2006-04
[30] ISO 7196: Akustik – Frequenzbewertungs-Charakteristik für
Infraschallmessungen, date of issue 1995-03
[31] DIN 45641: Mittelung von Schallpegeln,
date of issue 1990-06
[32] Hau E. (2014): Windkraftanlagen: Grundlagen, Technik,
Einsatz, Wirtschaftlichkeit, 5th edition, Berlin/Heidelberg
[33] WeinHeiMer J. (2014): Höhere Schallleistungspegel von
Windenergieanlagen bei höherer Turbulenz?, in: Kötter
Consulting Engineers (ed., 2014): Good Vibrations,
Windenergie – Bauphysik – Immissionsschutz, September
2014, pg. 2/3, Internet: http://www.koetter-consulting.com/
coRED/_data/149-14_gv_71_versand.pdf
[34] WatanaBe T. & Møller H. (1990): Low frequency hearing
thresholds in pressure field and in free field, Journal of Low
Frequency Noise and Vibration, Vol. 9, No. 3 , pg. 106-115
EXHIBIT A5-1
Page 94 of 104 005065

© LUBW Low-frequency noise incl. infrasound – Report on the measurement project 95
Appendix A3 – Explanation of terms and parameters
A-weighting
Frequency-dependent alteration of a noise or sound signal
by means of A filter according to DIN EN 61672-1:2003
[22]. See also frequency weighting and dB(A).
Averaging level
See sound pressure level
Background noise
Noise with the wind power plant switched off. It consists
particularly of the sound caused by wind in the vicinity and
of noise coming from other sources of noise in the vicinity.
The background noise may also include sound induced by
the wind at the microphone. Also referred to in the report
as the operating condition "turbine off".
C-weighting
Frequency-dependent alteration of a noise or sound signal
by means of C filter according to DIN EN 61672-1:2003
[22]. See also frequency weighting and dB(C).
dB
Decibel, unit of measurement for the identification of le-
vels, in this case sound pressure level (quod vide).
dB(A)
Decibel A, unit of sound pressure level in A-weighting. See
also sound pressure level and A-weighting.
dB(C)
Decibel C, unit of sound pressure level in C-weighting. See
also sound pressure level and C-weighting.
dB(G)
Decibel G, unit of sound pressure level in G-weighting. Is
used particular with low-frequency noise incl. infrasound.
See also sound pressure level and G-weighting.
dB(Z)
Decibel Z, unit of sound pressure level in Z-weighting that
corresponds to the linear sound pressure level unweighted
in terms of frequency. Formerly also referred to as dB(lin).
Emission
See sound emission
Extraneous noise
Noise that is not caused by the turbine being measured
and can temporarily lead to an increase of background noi-
se. Disturbing extraneous noise is excluded from the evalu-
ation by placing markers, and is therefore included neither
in the represented total noise nor in the background noise.
Frequency
Number of oscillations per second; the unit is hertz (Hz).
The total audible frequency range is divided into:
� Infrasound: Sound with frequencies below 20 Hz
� Audible sound: Sound in the range of 20 Hz to about
16,000 Hz (limit is age-dependent)
� Ultrasound: Sound above roughly 16,000 Hz
� Low-frequency sound: Sound at frequencies below
100 Hz, including infrasound
Frequency weighting (noise)
The frequency content of noise is weighted differently ac-
cording to the specific objective. In addition to the gene-
rally usual A-weighted and C-weighted noise levels, G-
weighted and Z-weighted noise levels are also determined
and represented in this study.
By default, the frequency weighting A is used for the valu-
ation of sound signals in the normal audible sound range.
It approximately constitutes the hearing sensitivity of the
human ear in the low and medium sound intensity level.
The description and assessment of noise emission and im-
missions generally follows by means of A-weighted levels.
The evaluation of low-frequency noise including infra-
sound requires separate restrictions of the frequency ran-
ges; A-weighted sound levels that are determined across
the entire frequency band are unsuitable for this.
The frequency weighting C approximately corresponds to
the auditory sensation of the ear at high volumes. It is ap-
plied in particular when assessing noise level peaks in the
scope of occupational safety and health. In addition, the
EXHIBIT A5-1
Page 95 of 104 005066

96 Low-frequency noise incl. infrasound – Report on the measurement project © LUBW
level difference of measured C-weighted and A-weighted
levels is seen as an indicator for possible low-frequency
noise contamination in the area of immission control.
The frequency weighting G is a filter that was defined for
the effect adaptation of infrasound. Its focus lies at 20 Hz
(see Figure A3-1). However, no relevant reference or com-
parative values are known for the quantitative classification
of any infrasound effects or determined G-weighted levels.
The frequency weighting Z (zero) describes a linear band
pass filter without any effect on the frequency.
Frequency spectrum
See spectral analysis
G-weighting
Frequency-dependent change of noise or sound signal
using G filter according to ISO 7196:1995 [30]. See frequen-
cy weighting and dB(G).
Hearing threshold
See Appendix A1.5
Immission
See sound immission
Infrasound
See Appendix A1.1
Level
Logarithm of the relationship of two identical sizes. For the
sound pressure level, the ratio of sound pressure, which is
caused by noise, to a fixed reference size (hearing threshold)
is formed. See also sound pressure level.
Leq
Energy equivalent average of the (time-varying) sound
pressure level course within a reference period. See also
sound pressure level.
Lmax
Maximum sound pressure level in a measurement interval.
See also sound pressure level.
Low-frequency sound
See Appendix A1.1
Narrowband spectrum
See spectral analysis
G-Bewertung ISO 7196:1995 in dBC-Bewertung DIN EN 61672-1:2014 in dBA-Bewertung DIN EN 61672-1:2014 in dB
Frequency weighting in dB
Frequency in Hz
-100
-90
-80
-70
-60
-50
-40
-30
-20
-10
0
10
20
0.1 1 10 100 1,000 10,000
G-weighting ISO 7196: 1995 in dBC-weighting DIN EN 61672-1: 2014 in dBA-weighting DIN EN 61672-1: 2014 in dB
Figure A3-1: Course of the frequency weighting curves A, C and G in the range below 500 Hz according to ISO 7196 and DIN EN 61672-1 (2013) [22]
EXHIBIT A5-1
Page 96 of 104
I -
005067

© LUBW Low-frequency noise incl. infrasound – Report on the measurement project 97
Noise
Noise can be considered unwanted, disturbing or harassing
sound. While sound can be well-measured and characte-
rized as a physical phenomenon, human feelings also play a
part when it comes to noise.
Operating noise
Noise with wind turbine switched on, including back-
ground noise. Is referred to as total noise throughout the
report.
Perception threshold
The perception threshold used in this report is composed
of the perception threshold according to Table 2 in DIN
45680 (2013 draft) [5] and values from literature.
The values of the draft standard are based on DIN ISO 226
[29]; they are 10 dB below the hearing threshold specified
therein. For frequencies of 8 Hz to 20 Hz they are supple-
mented by the values determined by WatanaBe & Møller
[34]. The course corresponds to the 90 % percentile of au-
dible threshold distribution.
Since no standardized threshold levels exist in the frequen-
cy range below 8 Hz, the values of the hearing threshold
proposed by Møller & Pedersen [11, Figure 10] were ta-
ken for the representations in this measurement report in
the range of 1.6 Hz to 8 Hz (Table A3-1).
Sound
Put simply, sound consists of compressional waves. Airbor-
ne sound is the propagation of pressure fluctuations in the
air as a wave motion. If this happens in solid materials, e.g.
the floor or walls, it is called structure-borne sound. In or-
der to characterize sound, variables such as sound level
(characterizes the strength of the sound) or frequency (de-
notes the pitch) are used.
Sound emission
The noise coming from a turbine in accordance with § 3
para. 3 BImSchG [2]
Sound immission
The noise effecting humans, animals, etc. in accordance
with § 3 para. 2 BImSchG [2]
Sound pressure level L
Often simply referred to as sound level. 20-fold decimal
logarithm of the ratio of a given effective value of sound
pressure to a reference sound pressure (e.g. hearing
threshold), where the effective value of the sound pressure
is determined with a standard frequency and time weigh-
ting (L in dB). Sound pressure levels of the normal range of
hearing are determined primarily by the frequency weigh-
ting A and the time rating F according to DIN EN 61672-1
[22] (see also frequency weighting). The types of frequency
and time weightings are usually indicated as indices of the
formula sign, e.g. LAF in dB(A). The definition of the sound
pressure level L for a sound pressure p is:
Here p0 is a reference sound pressure in the region of the
hearing threshold, defined as 2·10-5 Pa. Sound level diffe-
rences of 1 dB are only just recognisable, differences of
3 dB can be heard clearly. Sound level differences of 10 dB
correspond to roughly double or half the impression of
loudness respectively.
� The addition of two identical sound levels (doubling of
the sound power) leads to an increase of the sum level
by 3 dB.
� The reduction of a road’s traffic volume by half results
in a 3 dB lower level.
� In the case of a single point source, a doubling of dis-
tance leads to a reduction of the sound level by 6 dB.
The instantaneous sound pressure level is the current level
value of a time-varying noise, for example specified as
LAF(t) in dB(A).
The maximum sound pressure level or maximum level is
the maximum value of the fluctuating sound pressure level
curve within a reference period, referred to as Lmax in dB.
For the frequency weighting A and the time rating F, the
level is referred to as LAFmax and specified in dB(A).
The average sound level or equivalent continuous sound
level Leq is the energy equivalent mean value of the tempo-
rally variable sound pressure level curve L(t) within a refe-
rence period, expressed in dB. It is formed according to
DIN 45641 [31] or directly with a measuring instrument
EXHIBIT A5-1
Page 97 of 104
2
L = 10 · lg p 2 (dB) = 20 · lg _p_ (dB) Po Po
005068

98 Low-frequency noise incl. infrasound – Report on the measurement project © LUBW
according to DIN EN 61672-1 [22]. For the frequency
weighting A and time weighting F, the time-average sound
pressure level is referred to as LAFeq and expressed in
dB(A).
Spectral analysis
Spectral analysis is an important tool for the analysis of
acoustic signals. The signal is fragmented into defined fre-
quency bands and a sound level is determined for each in-
dividual band. A distinction is made between frequency
bands of absolute and relative bandwidth.
In the case of narrowband spectra, the frequency range that
is to be analysed is divided up into bands of the same ab-
solute width. Here in this report, a bandwidth of 0.1 Hz
was consistently used. That enabled a high resolution de-
piction of the frequency spectra of the sound signal.
Octave and third octave spectra (1/3-octave spectra) are
composed of frequency bands of relative bandwidth. The
centre frequency of an octave band has a ratio of 1:2 to the
centre frequency of the adjacent bands; third octave bands
have a ratio of 1:1.26. The starting value for the determina-
tion of the centre frequencies is the frequency of 1,000 Hz.
The frequency bandwidths within octave or third octave
spectra thus differ. The third octave centre frequencies
from 1 Hz are: 1 Hz, 1.25 Hz, 1.6 Hz, 2 Hz, 2.5 Hz, 3.15 Hz,
4 Hz, 5 Hz, 6.3 Hz, 8 Hz, 10 Hz, 12.5 Hz, 16 Hz, 20 Hz,
25 Hz, 31.5 Hz, 40 Hz, 50 Hz, 63 Hz, 80 Hz, 100 Hz, 125 Hz
etc. – see also [23].
Third octave representation
Representation of a sound signal in a frequency spectrum.
See also spectral analysis and third octave spectrum.
Third octave level
Sound pressure level within a third octave frequency band.
See also spectral analysis.
Third octave spectrum
Frequency spectrum in which the frequency range and the
corresponding level proportions are divided into thirds.
See also spectral analysis.
Total noise
Noise with wind turbine switched on, including back-
ground noise. Also referred to in the report as the opera-
ting condition "turbine on".
Turbulence intensity
The turbulence intensity (also known as degree of turbu-
lence) was here formed from the average of the quotients
of standard deviation and arithmetic mean of the wind
speed. It is a measure of the variation of the wind speed
(gusts). The turbulence intensity is given in percent and is
subject to many influences, e.g. ground roughness, medium
wind speed, atmospheric situation or buildings. Its lowest
values (5 % or less) are reached over the sea, the highest
(20 % or more) are reached over built-up areas and forest
[32]. While the turbulence intensity has no significant ef-
fect on measurements in the A level range (audible sound)
[33], this is not documented for low frequencies. Here an
influence can by all means be expected. Some manufactur-
ers of wind turbines link the warranty condition for their
guaranteed values of acoustic power to maximum turbu-
lence intensities during measurement, e.g. 16 %. The turbu-
lence intensity is determined in accordance with DIN EN
61400-11 [6].
Vibrations
Vibrations are oscillations of solid bodies.
Vibrational immissions
Vibrational immissions are the oscillations that occur at
the measurement point.
Vibration velocity
The vibration velocity (speed) is the velocity of an oscilla-
ting mass at the measurement point in the predetermined
measurement direction, stated in millimetres per second
(mm/s). This variable is based on the assessment of vibrati-
on impacts on buildings and on people in buildings. The
vibration is defined initially through the ground motion,
i.e. the vibration displacement (amplitude), characterized
as a function of time. The vibration velocity can then be
derived by differentiating with respect to time.
EXHIBIT A5-1
Page 98 of 104 005069
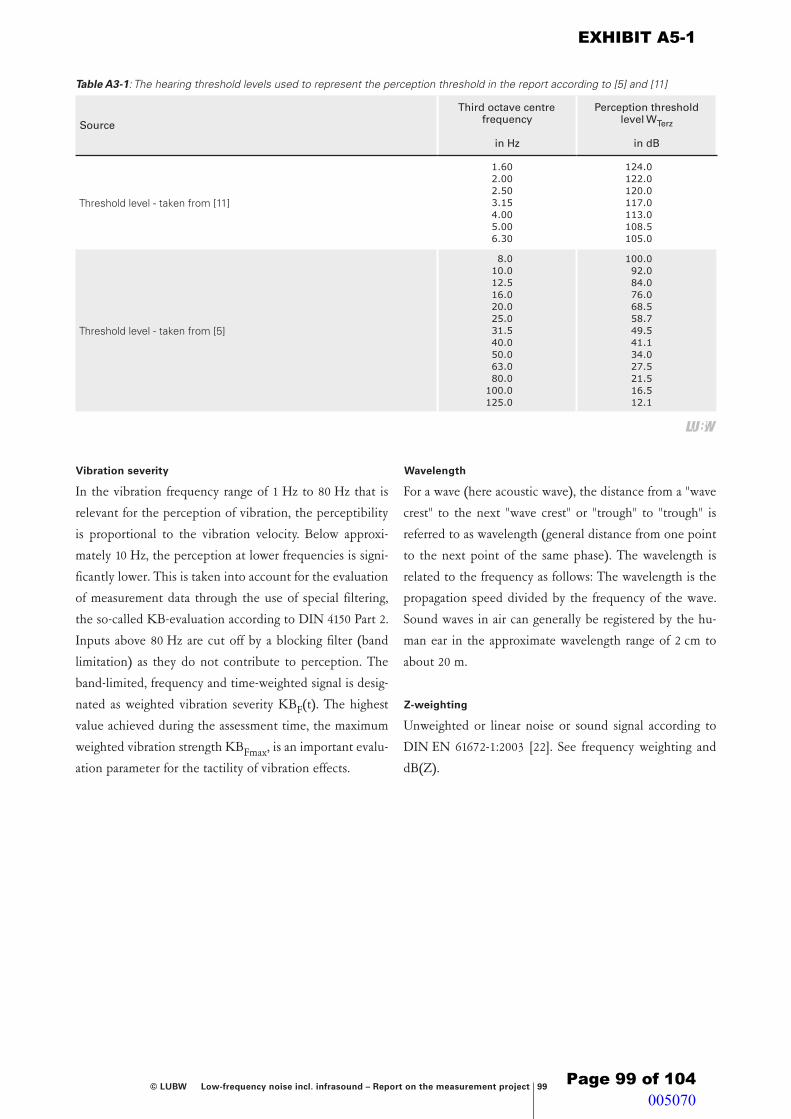
© LUBW Low-frequency noise incl. infrasound – Report on the measurement project 99
Vibration severity
In the vibration frequency range of 1 Hz to 80 Hz that is
relevant for the perception of vibration, the perceptibility
is proportional to the vibration velocity. Below approxi-
mately 10 Hz, the perception at lower frequencies is signi-
ficantly lower. This is taken into account for the evaluation
of measurement data through the use of special filtering,
the so-called KB-evaluation according to DIN 4150 Part 2.
Inputs above 80 Hz are cut off by a blocking filter (band
limitation) as they do not contribute to perception. The
band-limited, frequency and time-weighted signal is desig-
nated as weighted vibration severity KBF(t). The highest
value achieved during the assessment time, the maximum
weighted vibration strength KBFmax, is an important evalu-
ation parameter for the tactility of vibration effects.
Wavelength
For a wave (here acoustic wave), the distance from a "wave
crest" to the next "wave crest" or "trough" to "trough" is
referred to as wavelength (general distance from one point
to the next point of the same phase). The wavelength is
related to the frequency as follows: The wavelength is the
propagation speed divided by the frequency of the wave.
Sound waves in air can generally be registered by the hu-
man ear in the approximate wavelength range of 2 cm to
about 20 m.
Z-weighting
Unweighted or linear noise or sound signal according to
DIN EN 61672-1:2003 [22]. See frequency weighting and
dB(Z).
Table A3-1: The hearing threshold levels used to represent the perception threshold in the report according to [5] and [11]
Source
Third octave centre frequency
in Hz
Perception threshold level WTerz
in dB
Threshold level - taken from [11]
1.60 2.00 2.50 3.15 4.00 5.00 6.30
124.0 122.0 120.0 117.0 113.0 108.5 105.0
Threshold level - taken from [5]
8.0 10.0 12.5 16.0 20.0 25.0 31.5 40.0 50.0 63.0 80.0
100.0 125.0
100.0 92.0 84.0 76.0 68.5 58.7 49.5 41.1 34.0 27.5 21.5 16.5 12.1
EXHIBIT A5-1
Page 99 of 104
LU:W
005070

100 Low-frequency noise incl. infrasound – Report on the measurement project © LUBW
EXHIBIT A5-1
Page 100 of 104 005071
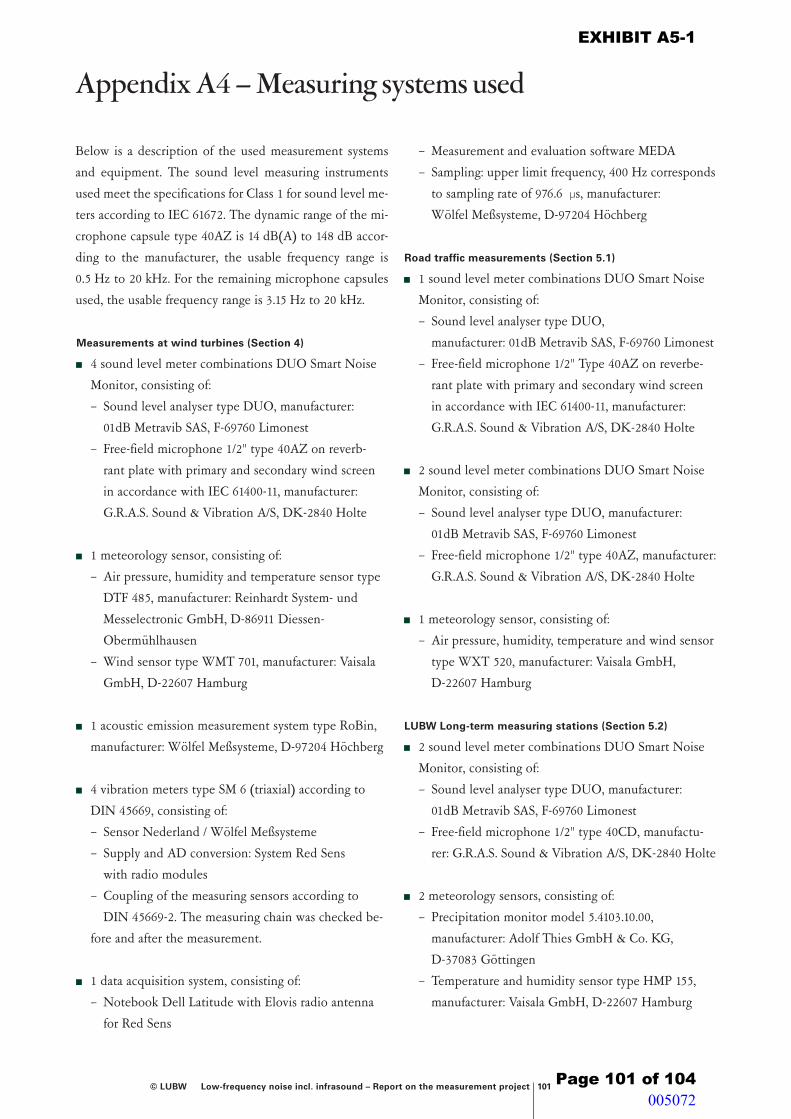
© LUBW Low-frequency noise incl. infrasound – Report on the measurement project 101
Appendix A4 – Measuring systems used
Below is a description of the used measurement systems
and equipment. The sound level measuring instruments
used meet the specifications for Class 1 for sound level me-
ters according to IEC 61672. The dynamic range of the mi-
crophone capsule type 40AZ is 14 dB(A) to 148 dB accor-
ding to the manufacturer, the usable frequency range is
0.5 Hz to 20 kHz. For the remaining microphone capsules
used, the usable frequency range is 3.15 Hz to 20 kHz.
Measurements at wind turbines (Section 4)
� 4 sound level meter combinations DUO Smart Noise
Monitor, consisting of:
– Sound level analyser type DUO, manufacturer:
01dB Metravib SAS, F-69760 Limonest
– Free-field microphone 1/2" type 40AZ on reverb-
rant plate with primary and secondary wind screen
in accordance with IEC 61400-11, manufacturer:
G.R.A.S. Sound & Vibration A/S, DK-2840 Holte
� 1 meteorology sensor, consisting of:
– Air pressure, humidity and temperature sensor type
DTF 485, manufacturer: Reinhardt System- und
Messelectronic GmbH, D-86911 Diessen-
Obermühlhausen
– Wind sensor type WMT 701, manufacturer: Vaisala
GmbH, D-22607 Hamburg
� 1 acoustic emission measurement system type RoBin,
manufacturer: Wölfel Meßsysteme, D-97204 Höchberg
� 4 vibration meters type SM 6 (triaxial) according to
DIN 45669, consisting of:
– Sensor Nederland / Wölfel Meßsysteme
– Supply and AD conversion: System Red Sens
with radio modules
– Coupling of the measuring sensors according to
DIN 45669-2. The measuring chain was checked be-
fore and after the measurement.
� 1 data acquisition system, consisting of:
– Notebook Dell Latitude with Elovis radio antenna
for Red Sens
– Measurement and evaluation software MEDA
– Sampling: upper limit frequency, 400 Hz corresponds
to sampling rate of 976.6 µs, manufacturer:
Wölfel Meßsysteme, D-97204 Höchberg
Road traffic measurements (Section 5.1)
� 1 sound level meter combinations DUO Smart Noise
Monitor, consisting of:
– Sound level analyser type DUO,
manufacturer: 01dB Metravib SAS, F-69760 Limonest
– Free-field microphone 1/2" Type 40AZ on reverbe-
rant plate with primary and secondary wind screen
in accordance with IEC 61400-11, manufacturer:
G.R.A.S. Sound & Vibration A/S, DK-2840 Holte
� 2 sound level meter combinations DUO Smart Noise
Monitor, consisting of:
– Sound level analyser type DUO, manufacturer:
01dB Metravib SAS, F-69760 Limonest
– Free-field microphone 1/2" type 40AZ, manufacturer:
G.R.A.S. Sound & Vibration A/S, DK-2840 Holte
� 1 meteorology sensor, consisting of:
– Air pressure, humidity, temperature and wind sensor
type WXT 520, manufacturer: Vaisala GmbH,
D-22607 Hamburg
LUBW Long-term measuring stations (Section 5.2)
� 2 sound level meter combinations DUO Smart Noise
Monitor, consisting of:
– Sound level analyser type DUO, manufacturer:
01dB Metravib SAS, F-69760 Limonest
– Free-field microphone 1/2" type 40CD, manufactu-
rer: G.R.A.S. Sound & Vibration A/S, DK-2840 Holte
� 2 meteorology sensors, consisting of:
– Precipitation monitor model 5.4103.10.00,
manufacturer: Adolf Thies GmbH & Co. KG,
D-37083 Göttingen
– Temperature and humidity sensor type HMP 155,
manufacturer: Vaisala GmbH, D-22607 Hamburg
EXHIBIT A5-1
Page 101 of 104 005072

102 Low-frequency noise incl. infrasound – Report on the measurement project © LUBW
– Ultrasonic aemometer type 85004, manufacturer:
R. M. Young Company, USA-2801 Aero Park Drive
Measurements at motorway (Section 5.3)
� 3 sound level meters combinations type NOR 140,
consisting of:
– Sound level analyser type Nor 140, manufacturer:
Norsonic AS, N-3421 Lierskogen
– Free-field microphone 1/2" type 1225, manufacturer:
Norsonic AS, N-3421 Lierskogen
Interior noise measurements car, minibus (Section 5.4)
� 1 sound level meter combination type NOR 140,
consisting of:
– Sound level analyser type Nor140, manufacturer:
Norsonic AS, N-3421 Lierskogen
– Free-field microphone 1/2" type 1225, manufacturer:
Norsonic AS, N-3421 Lierskogen
Urban background measurements (Section 6)
� 2 sound level meter combinations type DUO Smart
Noise Monitor, consisting of:
– Sound level analyser type DUO, manufacturer:
01dB-Metravib SAS, F-69760 Limonest
– Free-field microphone 1/2" type 40AZ on reverbe-
rant plate with primary and secondary wind screen
in accordance with IEC 61400-11, manufacturer:
G.R.A.S. Sound & Vibration A/S, DK-2840 Holte
� 1 sound level meter combination DUO Smart Noise
Monitor, consisting of:
– Sound level analyser type DUO, manufacturer:
01dB-Metravib SAS, F-69760 Limonest
– Free-field microphone 1/2" type 40AZ, manufacturer:
G.R.A.S. Sound & Vibration A/S, DK-2840 Holte
� 1 meteorology sensor, consisting of:
– Air pressure, humidity, temperature and wind sensor
type WXT 520, manufacturer: Vaisala GmbH,
D-22607 Hamburg
Measurements in a residential building (Section 7)
� 1 sound level meter combination type NOR 140,
consisting of:
– Sound level analyser type Nor 140, manufacturer:
Norsonic AS, N-3421 Lierskogen
– Free-field microphone 1/2" type 40AZ, manufacturer:
G.R.A.S. Sound & Vibration A/S, DK-2840 Holte
� 1 sound level meter combination type NOR 140,
consisting of:
– Sound level analyser type Nor 140, manufacturer:
Norsonic AS, N-3421 Lierskogen
– Free-field microphone 1/2" type 1225, manufacturer:
Norsonic AS, N-3421 Lierskogen
Measurements in rural area (Section 8.1)
� 2 sound level meter combinations DUO Smart Noise
Monitor, consisting of:
– Sound level analyser type DUO, manufacturer:
01dB Metravib SAS, F-69760 Limonest
– Free-field microphone 1/2" Type 40AZ on reverbe-
rant plate with primary and secondary wind screen
in accordance with IEC 61400-11, manufacturer:
G.R.A.S. Sound & Vibration A/S, DK-2840 Holte
� 1 sound level meter combinations DUO Smart Noise
Monitor, consisting of:
– Sound level analyser type DUO, manufacturer:
01dB Metravib SAS, F-69760 Limonest
– Free-field microphone 1/2" type 40AZ on reverbe-
rant plate with primary and secondary wind screen
in accordance with IEC 61400-11, manufacturer:
G.R.A.S. Sound & Vibration A/S, DK-2840 Holte
� 1 meteorology sensor, consisting of:
– Air pressure, humidity, temperature and wind sensor
type WXT 520, manufacturer: Vaisala GmbH,
D-22607 Hamburg
Note on the inherent noise of the measuring chain
In order to determine the minimum noise limit of the de-
ployed acoustic measuring chain, sound level measure-
ments were carried out inside buildings at two different
locations during the night. The locations were chosen so
that the least possible background noise was at hand. The
measured values in the range of 1 Hz to 1 kHz are at least
20 dB below the sound levels to be determined here. The
influence of the inherent noise of the measuring chain on
the measurement results is therefore negligible.
EXHIBIT A5-1
Page 102 of 104 005073

EXHIBIT A5-1
Page 103 of 104 005074

LUBW Landesanstalt für Umwelt, Messungen und Naturschutz Baden-Württemberg
Postfach 10 01 63 · 76231 Karlsruhe · Internet: www.lubw.de
EXHIBIT A5-1
Page 104 of 104
LU:W
005075

1
12th ICBEN Congress on
Noise as a Public Health Problem
Evaluation of Wind Turbine Noise in Japan
Akira SHIMADA1, Mimi NAMEKI2
1 Ministry of the Environment, Office of Odor, Noise and Vibration, Tokyo, Japan (corresponding author) 2 Ministry of the Environment, Office of Odor, Noise and Vibration, Tokyo, Japan
Corresponding author's e-mail address: [email protected]
ABSTRACT
In order to tackle with wind turbine noise (WTN) related complaints, Ministry of the Environment of Japan (MOEJ) set up an expert committee in 2013. In November 2016, the committee published a report on investigation, prediction and evaluation methods of WTN. The report compiles recent scientific findings on WTN, including the results of nationwide field measurements in Japan and the results of review of the scientific literature related to health effects of WTN. The report sets out methodology for investigation, prediction and evaluation as well as case examples of countermeasures. A noise guideline for wind turbine, which suggests WTN should not be more than 5dB above the residual noise where residual noise levels are above 35-40dB, is also presented in the report. MOEJ is developing a WTN noise guideline and a technical manual for WTN investigation based on the report. Both documents will be finalized in the fast half of 2017.
INTRODUCTION
Among renewable energy sources, wind power generation is an important energy sources that emits neither air-polluting substances nor greenhouse gases and can also contribute to energy security because the power can be generated by a natural resource readily available in Japan. The Basic Energy Plan of Japan (Cabinet decision in April, 2014) regards wind power generation as an energy source that can be made economically viable because its generation cost could be as low as that for thermal power generation if it could be developed on a large scale.
The number of wind power facilities installed in Japan started to increase around 2001, and 2,034 units were installed by 2014 (as of the end of March, 2015) [1]. According to the Supplementary Materials for the Long-term Energy Supply and Demand Outlook issued by the Agency for Natural Resources and Energy in July, 2015, approximately 10 million kW of wind power is expected to be installed by 2030, which represents a nearly four-fold increase from the existing installed wind power capacity of approximately 2.7 million kW [2].
EXHIBIT A5-2
Page 1 of 11
~ ICBEN ~
18-22JUNE 0 ZURICH N
005076

2
Figure 1: Installed capacity and number of wind turbines in Japan (Source: NEDO)
Wind power facilities emit a certain amount of noise due to their power generation mechanism in which blades rotate by catching wind to generate power. While the noise level is normally not significantly large, there are cases where even a relatively low level of noise causes complaints as wind power facilities are often constructed in agricultural/mountainous areas that have suitable weather conditions including wind direction and velocity that were originally quiet. There have not only been noise complaints but also complaints of inaudible sound of a frequency of 20 Hz or less.
Against such a backdrop, as a result of the amendment of the Order for Enforcement of the Environmental Impact Assessment Act in October, 2012, the establishment of wind power stations came to be classified as relevant projects under the Act and discussions on the environmental impact assessment of wind power facilities have taken place.
In assessing the impact of noise resulting from the installation of a facility, the procedure of environmental impact assessment performed before installation examines "the extent to which such noise can be feasibly avoided or reduced" and, if applicable, "whether it is intended to be consistent with standards or criteria given by the Japanese government or local municipalities from the perspective of environmental protection." For the former examination, the extent to which the impact of noise resulting from the implementation of the relevant project can be feasibly avoided or reduced is assessed by comparing multiple countermeasures in terms of the structure, layout, output, the number of units, and technical noise reduction measures in accordance with the maturity of the project plan. The assessment can also be performed by examining to what extent more feasible technology can be incorporated, etc. Specifically, assessment is made from such viewpoints as whether the local noise level will not be significantly raised, whether the layout plan for the project secures a sufficient distance between the facility and residences, etc.
EXHIBIT A5-2
Page 2 of 11
• Installed Capacity and Number of Wind Turbines in Japan NEDO (End April 2013)
3,000 ~-----------------------------~ 2,000
2.soo - - Installed Capacity(MW)
2,soo _ - Number of wind turbines 1-----------------/ _ ____, // - -2,400
2,200
2,000
/ - -
I - - -1,800 1-----------------------,-------- - - - -1,600 1----------------------/ --,1,__ _____ - - - - -
1,400 1---------------------/ ----1'- ---I >- >- - >- - -
1,200 1--------------------/ ----1'-----I >- >- - >- - -
1,000 1-------------------/ __ ___, - - - - - - -a i-----------------/- - - --------soo 1----------------i--- --- - - - - - - - - -400 t---------------~----t 1-- - - - 1-- 1-- - 1-- 1-- -
1,600
1,200
800
400
~ t------------~ ~-~ --~-----------oL---~~~~'.:::::~:.----r,__J..-.tl,___, __ _...u'-" ______ ,___,n•'--"---~•- o
~1989 1990 1991 1992 1993 1994 1995 1996 1997 1998 1999 2000 2001 2002 2003 2004 2005 2006 2007 2008 2009 2010 2011 2012
005077
3
The Environmental Quality Standards for Noise are generally used for the Environmental Impact Assessment. However, the standards are set based on traditional environmental noise (i.e. traffic noise or noise from factories), not in terms of noise generated from wind power facilities (hereinafter, "wind turbine noise") which has unique acoustical characteristics such as amplitude modulation sound. It is thus necessary to develop methods relevant to the investigation, prediction, and evaluation of wind turbine noise based on the latest scientific findings.
The Ministry of the Environment of Japan (hereinafter, “MOEJ”) has set up an expert committee and examined ideas and issues about methods for investigating, predicting, and assessing wind turbine noise from 2013 to 2016. The expert committee published a report on the investigation, prediction and evaluation methods of wind turbine noise in November 2016. During the development of the report, the MOEJ started a one-month public comment period. All comments were considered, and changes were made to the report where appropriate. The report compiles recent scientific findings on wind turbines in terms of noise, including the results of nationwide field measurements in Japan and the results of review of the scientific literature related to the health effects of wind turbine noise. The report sets out methodology for investigation, prediction and evaluation as well as case examples of countermeasures. Based on the report, MOEJ plans to develop a wind turbine noise guideline and a technical manual for wind turbine noise investigation in the fast half of 2017.
This report introduces the report by the expert committee, the wind turbine noise guideline and the technical manual for wind turbine noise investigation.
OUTLINE OF THE REPORT
The report by the expert committee consists of three parts. The first part explains key findings from past researches, namely the field survey measuring wind turbine noise in Japan and a literature review on wind turbine noise and human health. The second part proposes methods for investigating, predicting and evaluating wind turbine noise. A guideline on wind turbine noise is proposed in this part. The third part states the actions recommended by the expert committee. The following chapters summarize those three parts of the report.
KEY FINDINGS
Findings from the field study
Field surveys measuring wind turbine noise conducted in Japan from 2010 to 2012 revealed the following.
In terms of spectral characteristics, wind turbine noise generally has a spectral slope of -4 dB per octave. It has a 1/3 octave band sound pressure level in all parts of the super-low frequency range, which means 20 Hz or lower, is below the ISO threshold of hearing for pure tones and the criterion curve for the evaluation of low frequency noise proposed by Moorhouse et al. (Fig. 2). Super-low frequency range components of wind turbine noise are at imperceptible levels. Therefore, wind turbine noise is not an issue caused by super-low frequency range.
In regard to the audible frequency range, in the range from about 40 Hz and above, the 1/3 octave band sound pressure level is above the said criterion curve and the threshold of hearing defined by ISO 389-7. Therefore, wind turbine noise should be regarded as "audible" sound (noise) in discussing it.All papers must contain an abstract of max. 180 words. A
EXHIBIT A5-2
Page 3 of 11 005078

4
concise and factual abstract is required. The abstract should state briefly the purpose of the research or project, the principal results and major conclusions. An abstract is often presented separately from the paper, so it must be able to stand alone. For this reason, references should be avoided, but if essential, then cite the author(s) and year(s). Your abstract will be published in the printed and in the online program of the congress.
Figure 2: Results of the analysis of frequency characteristics of wind turbine noise (at 164 locations in the vicinity of 29 wind power facilities in Japan)
Noise exposure levels of nearby residents from wind power facilities are distributed in the range of 26‒50 dB in time-averaged A-weighted sound pressure levels. While this implies that wind turbine noise is not significantly higher than other types of environmental noise, it can cause serious annoyance to those living residential areas in the vicinity of wind power facilities located in extremely quiet agricultural/mountainous areas.
Low-frequency components of wind turbine noise obtained from field measurements were within the range of those of other environmental sounds.
In Japan, it is known that the following relation holds between LAeq, which properly excludes non-relevant noise, and LA90: LAeq≒LA90+2 dB
It is also generally said that acoustic isolation is not always effective for noise from wind power facilities because it contains more low-frequency components. In a quiet environment with little noise of other types, it is relatively more easily heard than ordinary noise is.
Findings from the literature review on health effects
After careful assessment of the evidence obtained from peer reviewed research results from around the world, it has been concluded that wind turbine noise has likely no negative effects on human health.
However, amplitude modulation and the tonal sounds of wind turbine noise tend to increase annoyance. Existing research results indicate that wind turbine noise over 35 – 40 dB raises annoyance and that the risk of sleep disturbance may increase accordingly.
No clear association is seen between infrasound or the low-frequency noise of wind turbine noise and human health.
Limit curve proposed by Moorhouse et al.
Threshold of hearing for pure tones (ISO 389-7)
EXHIBIT A5-2
Page 4 of 11
100 ~---------------~
90
80
70
60
lO
40
30
20
10
0 ............... .L.....L...L..;.Lu..L ......... ...J........J....Jc..::;:L)oL..,.L..,J
l 2 4 8 16 31.5 63 125 250 SOO lk 2k 4k
005079

5
Some research results have suggested that wind turbine noise related annoyance is also affected by other issues such as visual aspects or economic benefits.
METHODS FOR INVESTIGATING AND PREDICTING WIND TURBINE NOISE, A PERSPECTIVE FOR ITS EVALUATION, AND RESPONSES AGAINST IT
In light of the findings described in Section 2, the issue of wind turbine noise should be taken not as one of super-low frequency sound below 20 Hz but as one of "audible" sound (noise), and it should be basically measured at the A-weighted sound pressure level. We here summarize matters to be noted in conducting an investigation and/or the prediction of noise before and after installing wind power facilities and a perspective for wind turbine noise evaluation.
Investigation and prediction before installation
Matters to be noted upon an investigation
In selecting a method for investigation, it is necessary to collect various kinds of information in light of business and regional characteristics in order to conduct prediction and evaluation appropriately. Particularly with regard to wind turbine noise, it is important to distinguish and discuss three major issues:
(1) Sound source characteristics
It is necessary to pay attention to:
・ information on the wind power facility concerned, including its specifications,
manufacturer, model number, hub height, rotor diameter, rated wind velocity, and power generation;
・ the sound power level of the generated noise;
・ the A-weighted overall value and frequency characteristics (including the 1/3 octave
band sound power level) of the sound power level at the rated (maximum) output (to grasp the situation of maximal environmental impact);
・ A-weighted overall values and frequency characteristics (including the 1/3 octave band
sound power level) of sound power levels under different wind velocities;
・ pure tonal frequency components (to be determined in accordance with IEC 61400-
11:2012); and
・ existing data pertaining to the same model in operation.
(2) Propagation characteristics
In Japan, wind power facilities are often installed in agricultural/mountainous areas. Sound waves emitted from a wind power facility installed in an agricultural/mountainous area are affected by various factors before propagating to a sound receiving point (assessment point), in comparison with one installed on a large, flat piece of land such as a plain or desert. Its noise level and frequency characteristics tend to change due to phenomena including
EXHIBIT A5-2
Page 5 of 11 005080

6
reflection, absorption, transmission, refraction, and diffraction. It is therefore necessary to pay attention to:
・ phenomena such as the reflection, absorption, or diffraction of wind turbine noise due
to undulating terrain or ridges,
・ the state of the ground surface (including rivers and lakes), and
・ meteorological information such as wind conditions including wind direction, velocity,
and frequency.
(3) Information on a sound receiving point (assessment location)
With regard to locations where an investigation is conducted, focusing on the daily life and activities of residents in the vicinity of a wind power facility, it is necessary to pay attention to:
・ the configuration of establishments particularly requiring consideration for
environmental conservation such as schools and hospitals and the outline of housing configuration (including the structure of each house), and
・ the state of the acoustic environment (degree of quietness) of the area in question.
(4) The specific method for investigation
In measuring residual noise in a given area, it is necessary to pay attention to the following.
a. Sound to be excluded
Sounds of the types given below should be excluded. Since wind power facilities operate when wind is blowing, noises caused by wind such as the sound of rustling leaves are not excluded. ("Wind noise" generated by wind hitting a sound level meter's microphone is excluded, however.)
i) transitory noise such as the sound of automobiles passing nearby and aircraft noise
ii) artificial sound not occurring regularly such as sound generated by accidents/incidents, vehicles driven by hot-rodders, emergency vehicles, etc.
iii) natural sound not occurring regularly such as sound generated by natural phenomena including rain and defoliation, animals' cries, etc.
iv) sound incidental to measurement such as the voice of a person talking to a measurer, sound of tampering with measuring instruments, etc.
b. Surveying and other equipment
As the wind is generally strong in areas around wind power facilities, it is important to use a windbreak screen in order to avoid the effects of wind noise to the extent possible when measuring residual noise. Several kinds of urethane spherical windbreak screens of different diameters are commercially available. In general, the larger the diameter of such a screen is, the less likely a sound level meter inside the screen will be affected by wind noise. Installing a windbreak screen can reduce the impact of wind noise up to a wind velocity of around 5 m/s.
c. Survey areas and locations
Considering the propagation characteristics of wind turbine noise, the survey targets areas susceptible to an environmental impact by wind turbine noise, such as residential areas in the vicinity of a wind power facility (generally within a radius of about 1 km from a wind turbine). An area in which a quiet environment should be conserved such as hospital premises may be
EXHIBIT A5-2
Page 6 of 11 005081

7
included in these target areas. In selecting specific survey locations in the survey areas, in addition to locations where a wind power generation facility is planned to be installed, such locations are to be selected that are immune to local impacts of particular sound sources where the average level of noise in the relevant area can be assessed, including residential areas around the wind power generation facility. Measurement is to be performed at an outdoor location 3.5 m or more distant from a reflective object, excluding the ground.
d. Survey period and hours
In order to grasp conditions throughout the year accurately, a survey is to be conducted in each period of the year for different typical meteorological conditions under which a wind turbine operates (for instance, each season if meteorological conditions vary greatly by seasons).
The period of a single survey should be appropriately determined in consideration of the time variation of noise due to the impact of meteorological conditions and other elements. As measurement values may be unstable depending on wind conditions, a survey should be performed for three or more consecutive days in principle. The survey should be conducted both during the day (6:00‒22:00) and at night (22:00‒6:00) hours.
Matters to be noted in prediction
As mentioned above, in Japan, wind power facilities are often installed in agricultural/mountainous areas. In comparison with cases where such a facility is installed on a large, flat piece of land such as a plain or desert, sound waves emitted from a wind power facility installed in a mountainous area diffuse in a more complicated manner as they propagate due to the influence of geological states, vegetation, meteorological conditions such as wind conditions, etc. In addition, it should be noted that the propagation of wind turbine noise is extremely complicated as it is subject to attenuation by distance, reflection and absorption by the ground surface, reflection and diffraction by acoustic obstructions, attenuation by atmospheric absorption, etc.
Among the prediction methods used, while "ISO 9613-2:1996" allows incorporation of more
detailed conditions, the prediction calculation becomes rather complex. Furthermore, there is the problem of how the reflection rate should be calculated in cases where the effect of reflection by the ground surface becomes an issue, as is the case with a wind turbine installed on a ridge.
The New Energy and Industrial Technology Development Organization (hereinafter, "NEDO") published a prediction method for the environmental impact assessment of wind power generation in July, 2003 (revised as the second version in February, 2006). This models wind power facilities as sound source points and uses sound power levels provided by manufacturers of wind power generators. This method takes into account distance attenuation due to sound diffusion in the propagation process and attenuation by atmospheric absorption. While this method can be used easily, it is difficult to consider meteorological effects, etc.
It is necessary to pay attention to such characteristics of methods in making predictions.
EXHIBIT A5-2
Page 7 of 11 005082

8
Survey after the installation of a wind turbine
As stated in Section 3.1, predicting wind turbine noise involves elements with large uncertainty such as emission characteristics of noise from the source and effects of meteorological conditions as well as the terrain and structures in the propagation process. Predicted values before the installation of a wind turbine and measured values after installation may sometimes differ greatly.
We here summarize matters to be noted in a survey after the installation of a wind turbine.
(1) Conditions of measurement
It is necessary to grasp the conditions of measurement and other relevant local matters that may impact the propagation of noise. At least, one should grasp the wind direction and velocity at the nacelle height, the variation of power output, and meteorological data required for calculating the attenuation by atmospheric absorption (wind direction and velocity, temperature, and humidity).
(2) Survey method
Wind turbine noise varies greatly according to the wind conditions, and a wind turbine often starts and suspends operation repeatedly. Therefore, measurement should be performed in appropriate hours considering the state of operation of the wind power facility in question. For example, a method is conceivable that measures the average level in a 10-minute period in which wind turbine noise is stable (10-minute equivalent noise level: LAeq, 10 min) and regards it as the representative value. If the relevant wind power facility operates steadily for many hours, it is effective for obtaining robust data, for instance, to measure noise for 10 minutes every hour on the hour and calculate the average energy over the entire period of time.
For measurement locations, period, etc., refer to what is noted for a survey before the installation.
(3) Survey Results
The representative value of a survey after the installation of a wind power facility should be taken as the A-weighted equivalent sound pressure level measured over a period of time in which the effect of wind turbine noise is at its maximum and in which the effect of background noise is low (e.g. during night time). It is also required to confirm whether there is any pure tonal component.
The equivalent noise level during operation can be estimated by adding around 2 dB to the noise level exceeded for 90% of the measurement period (LA90).
Evaluation of wind turbine noise
With regard to the evaluation of wind turbine noise, the expert committee proposed the development of a new guideline. Detailed proposals on the new guideline are as follows:
The guideline should be applied when a wind power facility will be newly built or a wind power facility will be retrofitted to add a power generation facility.
As a guideline value, “residual noise + 5dB” is proposed. Residual noise should be measured when wind is steady. In low noise environments, a lower limit for wind turbine noise should be set since
there is no acoustic benefit. Wind turbine noise should be limited to 35dB in the
EXHIBIT A5-2
Page 8 of 11 005083

EXHIBIT A5-2
Page 9 of 11
--~ "'O
Q)
> Q)
....J QJ L.. :::s Vl Vl Q) L.. a.. "'O C :::s 0
V')
areas where background noise is lower than 30 dB and where some noise sensitive locations exist. For other areas, 40 dB should be set as the lower limit of wind turbine noise.
• To apply the guideline, locations where wind turbine noise might affect residents' daily activities (e.g. nearest dwellings) should be selected.
• To conserve the indoor environment, evaluation should be made based on outside noise data (both day and night).
-al ""C -QJ :::, rg > QJ C: ·-QJ
"C ·-
Temporal noise
/ (e.g. passing car) ~
Measuring Time
Guideline value
Residual noise
Figure 3: Image of relationship between residual noise and guideline value
Proposed guideline value 1 +Sdl(
,,' Residual noise , Lower limit ,,' (background
,"
,,
,, , ,, ,
, , ,
,,
,,
, ,
., , , , , , , , , ,
____ ,,;:: ______ noise)
, ,, , ,, ,
Residual noise (dB)
9
005084

10
Figure 4: Image of guideline value
RECOMMENDED ACTION
The expert committee recommended actions to be taken by stakeholders.
As for operators and manufacturers of wind power facilities, recommended actions include accumulating survey data after the installation of wind power facilities, promoting R&D for noise abatement technologies such as low noise blades. .
As for administrative agencies (the government of Japan and local municipalities, recommended actions include developing a wind turbine noise guideline and a detailed technical manual for investigation.
As for all parties concerned, recommended actions include facilitating communication among stakeholders.
WIND TUBINE NOISE GUIDELINE AND TECHINICAL MANUAL
On the basis of the report by the expert committee, MOEJ is developing a wind turbine noise guideline and a detailed technical manual for wind turbine noise investigation to be finalized in the fast half of 2017.
The key points of noise guideline are as follows:
All parties related on wind turbine should consider the social, geographical, or meteorological characteristics of the location of wind power generations and the noise from them.
The guideline aims to prevent possible noise related effects to protect living environment (indoor environment) of neighborhood residents before installation of a new wind power facility.
A guideline value of wind turbine noise should be set as “residual noise + 5dB” where residual noise level is above 35-40 dB.
Evaluation should be made based on outside noise data both day and night. The technical manual covers following points:
Methods to investigate wind speed and directions, Methods to investigate residual noise including site selection, sampling period, and
necessary equipment, Methods to investigate wind turbine noise including site selection, sampling period,
and necessary equipment Methods to process collected data Recommended formats to record data
CONCLUSION
This paper summarizes the basic ideas and methods proposed by the report published by the expert committee on wind turbine noise in November 2016, a noise guideline and a technical manual for wind turbine noise investigation which will be finalized in the fast half of 2017.
Acknowledgements
The authors wish to acknowledge the members of expert committee of wind turbine noise.
EXHIBIT A5-2
Page 10 of 11 005085

11
REFERENCES
[1] New Energy and Industrial Technology Development Organization (NEDO). NEDO offshore wind energy progress Edition II. [Internet] 2013. p.5. Available from: http://www.nedo.go.jp/content/100534312.pdf?from=b.
[2] Agency for Natural Resources and Energy, Ministry of Economy, Trade and Industry. [Internet] 2015. p.47. Available from: http://www.enecho.meti.go.jp/committee/council/basic_policy_subcommittee/mitoshi/011/pdf/011_07.pdf
EXHIBIT A5-2
Page 11 of 11 005086

wind turbinesin denmark
EXHIBIT A5-3
Page 1 of 32
DANISH dlJ EN~ R GY
AGENCY 005087

Contents
Foreword Page 3
Wind power – one of the solutions to the challenges of energy policy Page 4
the challenges of energy and climate policy
energy policy objectives
eu energy and climate policy
wind power – a challenging solution
The history of Danish wind power Page 6
How a wind turbine is constructed
wind turbine electricity production
the development of danish wind turbines
Public involvement
Wind turbines and their surroundings Page 9
environmental features of wind turbines
impact on the immediate surroundings
noise
Onshore wind turbines Page 12
Political framework conditions for the development of wind turbines
municipal planning and regulations on eias
regulations for siting onshore wind turbines
technical certification of wind turbines
Household wind turbines and small wind turbines
Offshore wind turbines Page 18
offshore wind turbines in denmark
the danish energy agency as a one-stop shop
mapping of future sites for offshore wind farms
tendering out of offshore wind farms
implementation of an offshore wind turbine project
New schemes in the Danish Promotion of Renewable Energy Act Page 22
a comprehensive act on renewable energy
the loss-of-value scheme
the option-to-purchase scheme
the green scheme
the guarantee scheme
energinet.dk’s Front office
Tariffs for electricity produced by wind turbines Page 26
the need for financial support for wind turbine electricity
Price supplements for onshore wind turbines
Price supplements for offshore wind turbines
Incorporation of wind power into the electricity system Page 27
Varying electricity production of wind turbines
research into an intelligent energy system
2 w ind turb ines in denmark
EXHIBIT A5-3
Page 2 of 32 005088

Foreword
this booklet, Wind Turbines in Denmark, aims
to provide a general introduction to wind turbines
in denmark. it is directed at municipalities, wind
turbine players and other interested parties, who
will gain insight into relevant topics relating to
wind turbines. the descriptions of the individual
topics are intended to answer and elaborate on
questions that are frequently asked about wind
turbines.
in 2007 the danish Government’s Planning
Committee for onshore wind turbines published a
report containing, among other things, a recom-
mendation that there should be an increase in
government information and advice on wind
power for the municipalities and the public in gen-
eral. this booklet is a response to that recommen-
dation.
Further information on wind turbines can be found on the websites of the danish energy agency
(www.ens.dk), the agency for spatial and environmental Planning (www.blst.dk), the danish
environmental Protection agency (www.mst.dk), and Caa-denmark (www.slv.dk). references to
other relevant websites can be found elsewhere in the booklet.
section 1 (“wind power – one of the solutions to the challenges of energy policy”) gives an intro-
duction to the evolution of renewable energy, the goals of energy policy, and the challenges pre-
sented by wind power. section 2 (“the history of danish wind power”) provides facts about wind
turbines and their development up to the present day. section 3 (“wind turbines and their sur-
roundings”) describes the environmental features of wind turbines, highlighting shadow and noise
as local challenges of wind turbines.
section 4 (“onshore wind turbines”) covers the general regulations for erecting onshore turbines
and the special regulations that apply for household wind turbines and small wind turbines. section
5 (“offshore wind turbines”) describes offshore wind turbines and the administrative ‘one-stop
shop’ set-up.
section 6 (“new schemes in the danish Promotion of renewable energy act”) discusses the four
schemes that were agreed politically in the Energy Policy Agreement of 21 February 2008 and
incorporated into the Danish Promotion of Renewable Energy Act: namely, the loss-of-value
scheme, the option-to-purchase scheme, the green scheme, and the guarantee scheme. section 7
(“tariffs for electricity produced by wind turbines”) presents the price supplements that are paid for
wind turbine electricity. Finally, section 8 (“incorporation of wind power into the electricity system”)
examines wind power production in the context of the overall european electricity system.
sections 3, 4 and 6 are aimed in particular at the municipalities and the planning that they under-
take with regard to the erection of onshore wind turbines.
this booklet has also been published in danish.
Phot
o: w
ind
turb
ine
secr
etar
iat
wind turb ines in denmark 3
EXHIBIT A5-3
Page 3 of 32 005089

4 w ind turb ines in denmark
1. wind Power – one oF tHe solutions to tHe CHallenGes oF enerGy PoliCy
FactboxWIND TurbINes IN
The EnERgy Policy AgREEmEnt
as part of the efforts to secure the target of
a 20% wind power share in 2011, the Energy
Policy Agreement of 21 February 2008 introduc-
es a number of improvements in the conditions
for erecting wind turbines:
• Thesupplementtothemarketpricefornew
onshore wind turbines is increased to dkk
0.25 per kwh for 22,000 full-load hours. dkk
0.023 per kwh as compensation for balancing
costs, etc., is retained
• Thescrappingschemeisamendedtogivean
additional price supplement of dkk 0.08 per
kwh for 12,000 full-load hours. the deadlines
for connecting new wind turbines to the grid
under the scrapping scheme are extended
• Themunicipalitiesarerequiredtoplanfor75
mw wind turbines in each of the years 2010
and 2011
• Anumberofschemesareintroducedtopro-
mote local acceptance of new onshore wind
turbines: 1) a loss-of-value scheme gives
neighbours the right to claim compensation
for loss of value on their property if the loss
is assessed to be at least 1% of the property’s
value; 2) an option-to-purchase scheme gives
the local population the right to purchase at
least 20% of new projects involving wind
turbines with a total height of more than 25
metres; 3) a guarantee fund of dkk 10 million
helps local wind turbine owners’ associations
to finance preliminary investigations, etc.; 4)
a green scheme offers subsidies for municipal
projects that enhance scenic values in local
areas where new wind turbines are erected
• Atotalof400MWoffshorewindturbineca-
pacity is being tendered out and is expected
to be put into operation in 2012 (the anholt
project)
• TheOffshore Wind Turbine Action Plan of
September 2008 is being updated, and
earlier site development is being considered.
Clearer guidelines are being set out for the
establishment of new offshore wind turbine
projects via an “open-door” procedure
1.a. The challeNges OF eNergy aND
clImaTe pOlIcy
since the first oil crisis in 1973 denmark has
transformed its energy supply and developed
its own production of oil, natural gas and
renewable energy. at the same time, energy
has been greatly optimised so that, in spite of
considerable economic growth during this peri-
od, there has only been a marginal increase in
energy consumption. denmark is therefore bet-
ter prepared for international energy crises
than most other countries, regardless of
whether the challenges relate to supply or
price. Furthermore, danish emissions of the
greenhouse gases covered by the kyoto
Protocol were reduced by around 8% in the
period 1990-2008.
in spite of these results, danish society is still
facing major challenges in its energy and climate
policies. denmark is expected, with its existing
fields and finds, to be a net exporter of oil and
natural gas for about 10 more years, although
technological advances and any new finds may
bring further production and extend this period.
but there is a need to build up alternative sus-
tainable energy production while there is still
time. in A visionary Danish energy policy 2025
the danish Government presented a vision for
the long-term phasing-out of fossil fuels such as
coal, oil and gas, and appointed the Climate
Commission to set out specific directions for how
this can be done. a phasing-out of fossil fuels
will strengthen long-term supply reliability and
contribute to a reduction in Co2 emissions.
1.b. eNergy pOlIcy ObjecTIves
A visionary Danish energy policy 2025 was
published in January 2007. it was followed by
the Energy Policy Agreement of 21 February
2008 between the danish Government and all
of the parliamentary parties with the exception
of the red-Green alliance. this agreement sets
out ambitious goals for the development of
renewable energy and for energy savings. a
specific goal is that, compared to 2006, gross
energy consumption should be reduced by 2%
by 2011 and by 4% by 2020. Furthermore,
renewable energy should cover at least 20% of
denmark’s gross energy consumption in 2011.
in order to achieve these goals, the Energy
Policy Agreement of 21 February 2008 contains
a number of resolutions on, among other
things, improving the feed-in tariff for electricity
from new wind turbines, biomass incineration,
biomass gasification, and biogas. Funding was
allocated to promote the introduction to the
market of newly developed renewable energy
technologies such as solar cells, thermal gasifi-
cation of biomass, and wave power, and gov-
ernment support for the research, development
and demonstration of energy technologies will
be increased to dkk 1 billion in 2010.
the agreement also contains a range of initia-
tives aimed at promoting local acceptance of and
commitment to new onshore wind turbine
projects. neighbours will be entitled to seek com-
pensation for loss of property value due to the
erection of wind turbines. a local option to pur-
chase has been introduced for new wind turbine
projects. local wind turbine owners’ associations
can apply for a guarantee covering their financing
of essential preliminary investigations. and
municipalities where new wind turbine projects
are established will have access to subsidies from
a green scheme for new wind turbine projects.
the agreement of 21 February 2008 also
includes initiatives to further promote the devel-
opment of wind power. a follow-up to the 2004
scrapping scheme for old wind turbines was
agreed. and it was also decided that the danish
minister for the environment should conclude an
agreement on behalf of the danish Government
with local Government denmark with a view to
facilitating local wind turbine planning. in april
2008 the minister duly signed just such an
agreement with local Government denmark
setting out the goals for local planning of
onshore wind turbines. in connection with this,
the danish ministry of the environment’s wind
turbine secretariat was established to assist the
municipalities with their planning.
Finally, the supporting parliamentary parties
agreed that 400 mw of new offshore wind tur-
bine capacity should be established and opera-
tional by the end of 2012.
EXHIBIT A5-3
Page 4 of 32 005090
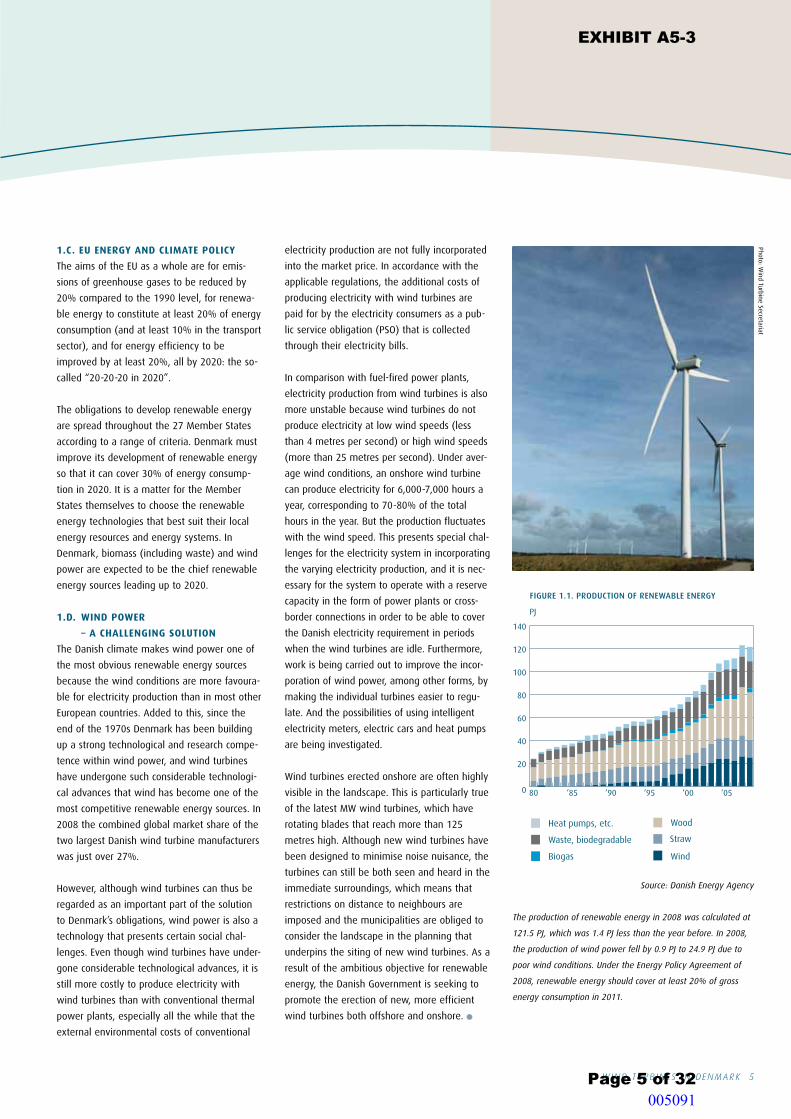
wind turb ines in denmark 5
1.c. eu eNergy aND clImaTe pOlIcy
the aims of the eu as a whole are for emis-
sions of greenhouse gases to be reduced by
20% compared to the 1990 level, for renewa-
ble energy to constitute at least 20% of energy
consumption (and at least 10% in the transport
sector), and for energy efficiency to be
improved by at least 20%, all by 2020: the so-
called “20-20-20 in 2020”.
the obligations to develop renewable energy
are spread throughout the 27 member states
according to a range of criteria. denmark must
improve its development of renewable energy
so that it can cover 30% of energy consump-
tion in 2020. it is a matter for the member
states themselves to choose the renewable
energy technologies that best suit their local
energy resources and energy systems. in
denmark, biomass (including waste) and wind
power are expected to be the chief renewable
energy sources leading up to 2020.
1.D. WIND pOWer
– a challeNgINg sOluTION
the danish climate makes wind power one of
the most obvious renewable energy sources
because the wind conditions are more favoura-
ble for electricity production than in most other
european countries. added to this, since the
end of the 1970s denmark has been building
up a strong technological and research compe-
tence within wind power, and wind turbines
have undergone such considerable technologi-
cal advances that wind has become one of the
most competitive renewable energy sources. in
2008 the combined global market share of the
two largest danish wind turbine manufacturers
was just over 27%.
However, although wind turbines can thus be
regarded as an important part of the solution
to denmark’s obligations, wind power is also a
technology that presents certain social chal-
lenges. even though wind turbines have under-
gone considerable technological advances, it is
still more costly to produce electricity with
wind turbines than with conventional thermal
power plants, especially all the while that the
external environmental costs of conventional
electricity production are not fully incorporated
into the market price. in accordance with the
applicable regulations, the additional costs of
producing electricity with wind turbines are
paid for by the electricity consumers as a pub-
lic service obligation (Pso) that is collected
through their electricity bills.
in comparison with fuel-fired power plants,
electricity production from wind turbines is also
more unstable because wind turbines do not
produce electricity at low wind speeds (less
than 4 metres per second) or high wind speeds
(more than 25 metres per second). under aver-
age wind conditions, an onshore wind turbine
can produce electricity for 6,000-7,000 hours a
year, corresponding to 70-80% of the total
hours in the year. but the production fluctuates
with the wind speed. this presents special chal-
lenges for the electricity system in incorporating
the varying electricity production, and it is nec-
essary for the system to operate with a reserve
capacity in the form of power plants or cross-
border connections in order to be able to cover
the danish electricity requirement in periods
when the wind turbines are idle. Furthermore,
work is being carried out to improve the incor-
poration of wind power, among other forms, by
making the individual turbines easier to regu-
late. and the possibilities of using intelligent
electricity meters, electric cars and heat pumps
are being investigated.
wind turbines erected onshore are often highly
visible in the landscape. this is particularly true
of the latest mw wind turbines, which have
rotating blades that reach more than 125
metres high. although new wind turbines have
been designed to minimise noise nuisance, the
turbines can still be both seen and heard in the
immediate surroundings, which means that
restrictions on distance to neighbours are
imposed and the municipalities are obliged to
consider the landscape in the planning that
underpins the siting of new wind turbines. as a
result of the ambitious objective for renewable
energy, the danish Government is seeking to
promote the erection of new, more efficient
wind turbines both offshore and onshore. l
FIGURE 1.1. PRODUCTION OF RENEWABLE ENERGY
PJ
0
20
40
60
80
100
120
140
‘05‘00‘95‘90‘8580
Wood
Biogas
Waste, biodegradable
Heat pumps, etc.
Straw
Wind
Source: Danish Energy Agency Source: Danish Energy Agency
The production of renewable energy in 2008 was calculated at
121.5 PJ, which was 1.4 PJ less than the year before. In 2008,
the production of wind power fell by 0.9 PJ to 24.9 PJ due to
poor wind conditions. Under the Energy Policy Agreement of
2008, renewable energy should cover at least 20% of gross
energy consumption in 2011.
Photo: wind turbine secretariat
EXHIBIT A5-3
Page 5 of 32
• • •
• • •
005091

6 w ind turb ines in denmark
2.a. hOW a WIND TurbINe
Is cONsTrucTeD
a wind turbine is a machine that converts the
kinetic energy of wind into electricity. the idea
of taking energy from wind has been known
and exploited for centuries in many countries.
in denmark, wind power has historically been
used to produce mechanical energy for, among
other things, grinding corn.
the size of a wind turbine can be stated in sev-
eral ways. it can be the wind turbine’s maxi-
mum electrical output, its height from the
ground to the top of the blade tip, the blade’s
diameter, or the area that the rotor’s three
blades cover in one revolution. by way of
example, we might have a wind turbine of 1
mw (1,000 kw), a total height of 77 metres, a
swept area (rotor diameter) of 54 metres, and
a rotor area of 2,300 square metres.
a modern wind turbine consists of a rotor (the
danish design has three blades) that drives a
generator that produces electricity. the rotor
and generator are installed at the top of a
tower, which stands on a foundation in the
ground or in the seabed. the turbine cap
(nacelle) and the blades are controlled based
on measurements of the wind direction and
speed. in order to ensure the best possible
incorporation of the wind turbine’s production
into the electricity system, new wind turbines
are fitted with advanced control electronics,
and a modern wind turbine consists of up to
10,000 different components.
2.b. WIND TurbINe
elecTrIcITy prODucTION
in simple terms, a wind turbine not only utilis-
es the wind’s pressure on an obliquely posi-
tioned blade, but also utilises the fact that the
air current around the blade creates a negative
pressure on the rear of the blade in relation to
the wind. the force from this negative pressure
produces a draught that causes the blades to
rotate.
the electricity production of a wind turbine
depends on wind conditions. obviously the
wind does not blow constantly, and wind
speed varies greatly from place to place and
over time. on average, the wind blows more at
sea than on land. in denmark, it blows most
along the western and southern facing coasts
and least inland. a turbine on the west coast of
Jutland generally therefore produces twice as
2. tHe History oF danisH wind Power
20 m
40 m
60 m
80 m
100 m
120 m
140 m
160 m
illus
trat
ion:
Ves
tas
win
d sy
stem
s a/
s
FIgure 2.1
TechNIcal specIFIcaTIONs OF a v90 Nacelle
WIND TurbINe sIZes
tall forest treesHeight 33 m
village church and free-standing treesChurch 16 mtrees 19 m
Treelined farmyard, grain silo and cattle houseFarmhouse 6.5 mCattle house 12 mGrain silo 24 m
1985wind turbine 225 kwHub height 30 mtotal height 45 m
High-voltage mast132 kV (elkraft)Height 30 m
High-voltage mast400 kV (elkraft)Height 42 m
EXHIBIT A5-3
Page 6 of 32
0 Qi] '(.O(lf-Qr e S•rvi.,c;it, ,Cl'•n•
• W.al~r coole.- fo.- ~nMato.r • 011liSpe..t• iO• K~t«
• Hii,t, 11-0l't 'le' tr.fmiftinn~r 0 (omf>odile d ~ (oypli•,
0 Vlh'oii:!iOr'II( wfnd MllliOfJ 0 Y.;IWp)ill'-J
0 VMP~Top con1.-o.tl1r-r ·¢1 Cltil rbo:N wm, «<n.....,.t
• M~chanlcal disc brake CD Bl.>de h~b
• Milld1, ,.. ·ro .. noJulon • Bl.>d'e
e er.d'<i i..artn1
CT
005092
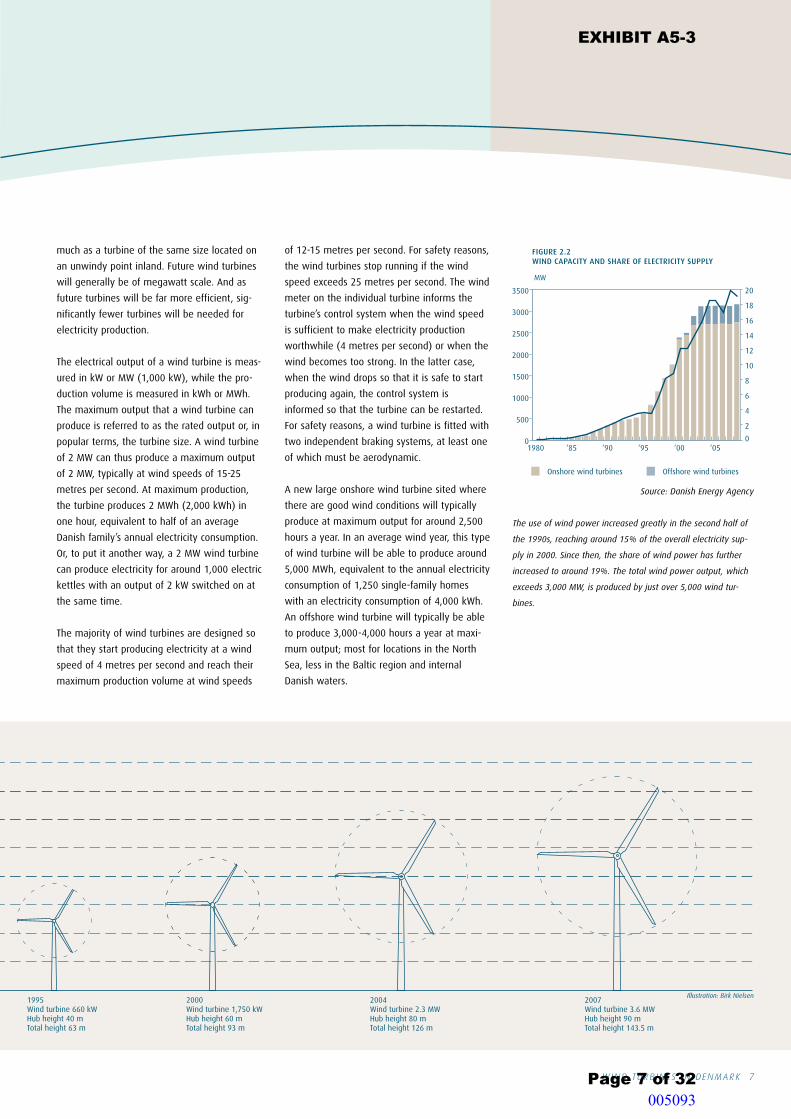
wind turb ines in denmark 7
much as a turbine of the same size located on
an unwindy point inland. Future wind turbines
will generally be of megawatt scale. and as
future turbines will be far more efficient, sig-
nificantly fewer turbines will be needed for
electricity production.
the electrical output of a wind turbine is meas-
ured in kw or mw (1,000 kw), while the pro-
duction volume is measured in kwh or mwh.
the maximum output that a wind turbine can
produce is referred to as the rated output or, in
popular terms, the turbine size. a wind turbine
of 2 mw can thus produce a maximum output
of 2 mw, typically at wind speeds of 15-25
metres per second. at maximum production,
the turbine produces 2 mwh (2,000 kwh) in
one hour, equivalent to half of an average
danish family’s annual electricity consumption.
or, to put it another way, a 2 mw wind turbine
can produce electricity for around 1,000 electric
kettles with an output of 2 kw switched on at
the same time.
the majority of wind turbines are designed so
that they start producing electricity at a wind
speed of 4 metres per second and reach their
maximum production volume at wind speeds
of 12-15 metres per second. For safety reasons,
the wind turbines stop running if the wind
speed exceeds 25 metres per second. the wind
meter on the individual turbine informs the
turbine’s control system when the wind speed
is sufficient to make electricity production
worthwhile (4 metres per second) or when the
wind becomes too strong. in the latter case,
when the wind drops so that it is safe to start
producing again, the control system is
informed so that the turbine can be restarted.
For safety reasons, a wind turbine is fitted with
two independent braking systems, at least one
of which must be aerodynamic.
a new large onshore wind turbine sited where
there are good wind conditions will typically
produce at maximum output for around 2,500
hours a year. in an average wind year, this type
of wind turbine will be able to produce around
5,000 mwh, equivalent to the annual electricity
consumption of 1,250 single-family homes
with an electricity consumption of 4,000 kwh.
an offshore wind turbine will typically be able
to produce 3,000-4,000 hours a year at maxi-
mum output; most for locations in the north
sea, less in the baltic region and internal
danish waters.
0
500
1000
1500
2000
2500
3000
3500
‘05‘00‘95‘90‘851980
FIGURE 2.2 WIND CAPACITY AND SHARE OF ELECTRICITY SUPPLY
MW
2
0
4
6
8
10
12
14
16
18
20
Offshore wind turbinesOnshore wind turbines
Source: Danish Energy Agency
The use of wind power increased greatly in the second half of
the 1990s, reaching around 15% of the overall electricity sup-
ply in 2000. Since then, the share of wind power has further
increased to around 19%. The total wind power output, which
exceeds 3,000 MW, is produced by just over 5,000 wind tur-
bines.
High-voltage mast400 kV (elkraft)Height 42 m
1995wind turbine 660 kwHub height 40 mtotal height 63 m
2000wind turbine 1,750 kwHub height 60 mtotal height 93 m
2004wind turbine 2.3 mwHub height 80 mtotal height 126 m
2007wind turbine 3.6 mwHub height 90 mtotal height 143.5 m
Illustration: Birk Nielsen
EXHIBIT A5-3
Page 7 of 32
• •
------t- ____,,_
-,-
----! ----
005093

8 v indmøller i danmark
2.c. The DevelOpmeNT
OF DaNIsh WIND TurbINes
the first batch-produced danish wind turbines
from the late-1970s had an output of 22 kw,
and the wind turbines were gradually scaled up
to 55, 75 and 95 kw through the course of the
1980s. alongside this commercial production, a
government-funded development programme
was undertaken by the electricity companies to
test considerably larger pilot wind turbines.
since the 1980s, the wind turbine industry’s
commercial products have become increasingly
larger-scale, and the largest commercial wind
turbines produced by danish manufacturers
today are 3 mw (Vestas) and 3.6 mw (siemens
wind Power) respectively.
the 3.6 mw wind turbine has a rotor diameter
of 107 metres, a swept area of 9,000 square
metres, and a hub height of 80-100 metres
depending on the conditions at the erection
site. the 3.6 mw wind turbine can thus reach a
total height of more than 150 metres and a
weight of around 465 tons.
the number of wind turbines in denmark peak-
ed in 2000 at more than 6,200, of which more
than half were older wind turbines with an
electrical output of less than 500 kw. since
then, the number of wind turbines has de-
creased by around 1,000, while the total in-
stalled output has grown from just under 2,400
mw in 2000 to just under 3,400 mw end of
2009. in the same year, smaller wind turbines
with an output of less than 500 kw accounted
for around 11% of the total installed output.
the wind power share of the domestic electric-
ity supply has been growing steadily since
1980. in 1990, the share was 1.9%, and since
then it has increased sharply. in 1999 the fig-
ure topped 10%, and in 2008 it reached 19.1%
of the electricity supply. in A visionary Danish
energy policy 2025 from 2007 the danish
Government formulated an objective of more
wind power through strategic planning of wind
turbine development. this includes a good
framework for danish wind capacity and the
promotion of onshore and offshore demonstra-
tion and pilot sites as well as the drafting of an
infrastructure plan for offshore wind turbines.
in 2008, the wind turbine industry’s danish
production sites had a gross turnover of dkk 53
billion, and overall exports reached dkk 42 bil-
lion, equivalent to 7.2% of total danish
exports. the wind turbine sector had 28,400
employees at the end of 2008.
2.D. publIc INvOlvemeNT
the development of wind power in denmark
has been characterised by strong public
involvement. it was small machinery manufac-
turers that created the established wind tur-
bine industry, and only after the consolidation
of the industry through the 1990s did it
become dominated by large, partly internation-
ally owned and listed companies. similarly, on
the customer side numerous joint-owned wind
turbines were established in the period 1984-
94. around two thousand of the 5,200 danish
wind turbines are still owned by local wind tur-
bine owners’ associations. these are mostly
older, smaller wind turbines because the
majority of wind turbines erected since 1995
are owned by individuals, energy companies
and other commercial wind power companies.
the progression towards fewer joint-owned and
relatively large wind turbines has made it diffi-
cult to maintain local support for new wind
power projects. but to ensure continued devel-
opment of wind power, it is essential to have
backing in the local community. the Energy
Policy Agreement of 21 February 2008 therefore
stipulated that a range of new initiatives should
be undertaken to promote local acceptance and
option to purchase wind turbines shares of new
wind power projects. the regulations are exam-
ined in more detail in section 6. l
FIgure 2.3 breaKDOWN OF eXIsTINg TurbINes by OuTpuT aND INsTallaTION year
Period 0-225 kw 226-499 kw 500-999 kw 1,000+ kw total
78-84 91 1 0 0 92
85-89 425 43 6 0 474
90-94 616 169 65 0 850
95-99 218 91 1687 73 2069
00-04 44 2 812 526 1384
05-09 33 0 26 150 209
Total 1427 306 2596 749 5078
Source: Danish Energy Agency
Danish wind turbines have undergone considerable upscaling.
Up to the mid-1990s, the majority of wind turbines that were
erected had an output of 225 kW or less, and a large propor-
tion of these have since been replaced by fewer, larger wind
turbines under the “scrapping schemes”. Most of the wind tur-
bines erected in the last decade have had an output above
500 kW. The largest new Danish wind turbines have an output
of 3.0-3.6 MW.
FIGURE 2.3 BREAKDOWN OF EXISTING TURBINES BY OUTPUT AND INSTALLATION YEAR
NUMBER
0-225
226-499
500-999
1,000+ Source: Danish Energy Agency
0
500
1000
1500
2000
2500
200500-0495-9990-9485-8978-84
EXHIBIT A5-3
Page 8 of 32
• • • •
----
005094

w ind turb ines in denmark 9
3. wind turbines and tHeir surroundinGs
3.a. eNvIrONmeNTal FeaTures
OF WIND TurbINes
clImaTe aND aIr pOlluTION
wind power is regarded as an environmentally
renewable energy source because producing
electricity with wind turbines does not entail
the use of fossil fuels such as oil, natural gas
and coal. in terms of energy supply, wind
power is advantageous because the source of
the electricity production, i.e. wind, is renewa-
ble and the electricity from wind turbines is
not therefore conditional on the import of fuels
or the use of limited resources. in terms of the
environment and climate, wind power has
major benefits because it is not associated
with atmospheric emissions of Co2, so2, nox
and particles, as is the case to a greater or
lesser extent with power plants that use fossil
fuels.
emissions of so2, nox and particles pollute the
regional and local environment around the
power plants, while emissions of Co2 from
electricity production are regarded as the larg-
est global contributor to the greenhouse effect,
which is considered by the un’s intergovermen-
tal Panel on Climate Change (iPCC) to be a seri-
ous threat to the climate. “Greenhouse effect”
is a term that denotes the changed balance
between incoming solar radiation and heat
radiated out into space, which arises due to
human-created discharges of greenhouse gases
such as Co2, methane and nitrous oxide.
eNergy balaNce
the energy balance of wind turbines over their
lifetime is analysed using a life cycle assess-
ment (lCa) that covers energy consumption
and other effects of production, erection, ongo-
ing operation, and scrapping when the wind
turbine no longer can or needs to produce
electricity. in this assessment, raw materials for
the wind turbine’s components as well as ener-
gy consumption for production, transport, oper-
ation and disposal are incorporated as a nega-
tive impact on the environment. the positive
side includes the wind turbine’s overall electric-
ity production and any recyclable materials.
assessed over the wind turbine’s normal life-
time of 20-25 years, the negative environmen-
tal impact is minimal compared with the aver-
age european electricity production. over 20-25
years the wind turbine will typically produce
more than 35 times the energy production
involved in its manufacture, operation, etc. a
modern mw wind turbine will take around
seven months to produce the amount of ener-
gy used in its manufacture, erection, operation
and disposal.
3.b. ImpacT ON The
ImmeDIaTe surrOuNDINgs
the planning and environmental legislation
sets out requirements to ensure that a wind
turbine project will not cause major damage or
nuisance to its surroundings, including noise
and spacing requirements. it is also assumed
that as a rule an environmental impact assess-
ment (eia) will be carried out as part of the
detailed planning for specific projects. as well
as describing the environmental impacts, this
ensures, among other things, that the legisla-
tive requirements are observed. the overall
impact of wind turbines on their immediate
environment includes visual impact, noise,
shadow, the effects of lighting, impacts on
nature, etc. the nature of these impacts
depends on how the wind turbine is positioned
in the landscape, the type of landscape, the
wind turbine’s size, and proximity to the wind
turbine. in order to minimise the overall
impact, when planning the siting of wind tur-
bines the municipalities should seek to limit
these nuisances, including ensuring that noise
and spacing requirements are observed.
similarly, wind turbine manufacturers are con-
tinuously working to optimise turbine design
so that they not only produce optimally but
also reduce the impact on their surroundings as
much as possible.
shaDOW
a wind turbine casts shadows when the sun is
shining. in windy, sunny weather, an area of
the turbine’s surroundings will be affected by
rotating shadows from the blades. in denmark
the area lying to the south of the wind turbine
will never be affected by shadow from the
blades. nuisance from shadow, which takes the
form of a rapid change between direct light
and short “flickers” of shadow, depends on
Photo: wind turbine secretariat
IllIllustration: Odense Environment Centre, based on calcula-
tions from CUBE Engineering
FIgure 3.1. shaDOW charT IN The eIa
In new wind turbine projects, the project developer must pro-
vide information in an Environmental Impact Assessment (EIA)
on the shadow cast by wind turbines. The chart shows the area
of calculated shadow for “real case” (weather-dependent) in
relation to Danish neighbours in an alternative project involv-
ing 5 x 3 MW wind turbines at Rens Hovedgaard Plantage in
Aabenraa Municipality. Number of hours per year.
EXHIBIT A5-3
Page 9 of 32 005095

10 w ind turb ines in denmark
FactboxshaDOW
shadows cast by rotating turbine blades are ex-
perienced by neighbours as a nuisance, with the
shadows passing across their homes for a short
duration but at a high frequency. the applicable
spacing requirements ensure that neighbours
are mainly subjected to shadows in the early
morning and late evening. shadow is normally
calculated as “real case”, i.e. taking into consid-
eration the normal distribution of sunshine hours
and wind. Possible remedial measures include
switching off the wind turbines at critical times.
where the wind turbine is standing from the
perspective of the neighbour, the distance
between the wind turbine and the neighbour,
the wind turbine’s hub height, and the length
of the blades.
the critical times for shadow occur mainly in
the early morning and late evening, with long
shadows at a greater distance from the wind
turbines than the neighbour distance require-
ment of four times the total height of the wind
turbine. the impact of shadow is calculated as
the total number of hours annually that a
neighbour is subjected to shadow and will vary
with seasonal changes in the weather. the
assessment of the anticipated number of annu-
al hours of shadow is therefore calculated
based on the anticipated normal distribution of
operating hours and sunshine hours during the
course of the year.
it is recommended that the calculated normal
distribution of shadow hours for neighbours not
exceeds 10 hours a year. by taking these issues
into consideration in the planning of wind tur-
bine sitings, the periods during which shadow
actually occurs can be limited. if a full assess-
ment shows that the most suitable siting
entails that the recommended maximum of 10
hours’ shadow cannot be observed, the owner
of the wind turbine may alternatively be re-
quired to shut down the wind turbine in critical
periods. the wind turbines can be fitted with
meters so that the operation can be halted if
the sun shines during critical periods; this can
reduce operating losses.
reFlecTION
as wind turbine blades must have a smooth
surface to be able to produce optimally and
repel dirt, the blades can produce reflective
flashes. as part of the type-approval of wind
turbines, the reflective qualities of the blades
are stated. typically, the reflective effect of the
blades will be halved during the wind turbine’s
first year of operation, and in their planning
the municipalities can set requirements for
anti-reflective treatment of the blades.
normally, the blades from the manufacturer
will be surface-coated to obtain a low gloss.
usually the gloss value will be less than 30,
which is regarded as sufficiently low for reflec-
tions from the wind turbine not to be a prob-
lem.
marKINg OF WIND TurbINes
IN relaTION TO aIr TraFFIc
in order that installations should not compromise
the safety of air traffic, any obstacles – including
wind turbines – with a total height of more than
100 metres must be approved by Civil aviation
administration-denmark (Caa-denmark). around
state-approved airports and airfields, aircraft are
protected against obstructions using the ap-
proved obstacle limitation surfaces. the approach
plan’s height restrictions are registered with
easements or notified in the municipal plans.
all wind turbines with a total height of mini-
mum 150 metres must be provided with high-
intensity, white flashing lights. the exact regu-
lations are set out in the BL 3-10 Regulations
for Civil Aviation based on applicable interna-
tional standards and recommendations. the
basis for the regulations is a desire for obstruc-
tions to air traffic to be visible at a suitable dis-
tance so that the pilot can take the necessary
operational actions in time. in the case of wind
turbines of 100-150 metres in height, which
will typically be pertinent in connection with
projects under the scrapping scheme and new
onshore wind turbines, Caa-denmark will carry
out a specific assessment of the need for mark-
ing, including taking into consideration danish
defence’s assessments of military flights in the
area. under normal circumstances, the marking
of the wind turbines with low-intensity fixed
red obstruction lights on the nacelle plus paint-
ing the wind turbine white will be sufficient.
where special air safety factors apply, marking
with medium-intensity flashing obstruction
lights will be necessary in addition to painting
the wind turbine white. it would be appropri-
ate for requirements for air traffic marking to
be clarified with Caa-denmark before an eia,
where one is required, is drawn up.
Previous attempts to counteract light nuisance
from tV-station transmitting masts have shown
that it is not possible to effectively shield sur-
Photo: wind turbine secretariat
Photo: wind turbine secretariat
EXHIBIT A5-3
Page 10 of 32 005096

wind turb ines in denmark 11
rounding houses against obstruction lights. any
shielding must be carried out taking into con-
sideration that obstruction lights must be
observable by the pilot from all directions in
the horizontal plane.
3.c. NOIse
wind turbines emit a relatively weak but char-
acteristic noise. the noise emanates from the
operation of the turbine’s gear and generator
as well as from the movement of the blades
through the air. in relation to generated out-
put, modern wind turbines emit considerably
less noise than the earliest wind turbines from
the 1970s and 1980s. in particular, the
mechanical noise from the turbine’s gear and
generator are significantly reduced in compari-
son with earlier models. in modern wind tur-
bines, the machine house is soundproofed, the
generator and gear are suspended in rubber
elements, and the nacelle’s cabin is tight-clos-
ing and fitted with sound locks that dampen
airborne noise. blade design has developed so
that the noise from the movement of the
blades through the air is minimised.
in order for a wind turbine to be certified for
erection in denmark, it must satisfy a number
of requirements set out in the Danish Ministry
of the Environment Order on noise from wind
turbines (no. 1518 of 14 december 2006).
among other things, a noise survey must be
carried out and the noise level calculated at
the premises of immediate neighbours.
sound is measured in decibels (db). the
human ear can just detect a change in sound
intensity of 1-2 db. if the sound intensity
increases by 6-10 db, it will be heard as a dou-
bling of the sound intensity. similarly, a reduc-
tion of 6-10 db will be heard as a halving of
the sound intensity. the intensity of the sound
is generally measured using a method that
mimics the ear’s sensitivity and is stated by the
measuring unit decibel-a, db(a).
in accordance with the danish ministry of the
environment’s order, the noise in the open land
immediately outside the neighbour’s house and
in open spaces up to 15 metres from the house
may not exceed 44 db(a) at a wind speed of 8
metres per second. this corresponds roughly to
the noise of soft speech. in more densely built-
up areas, summer home areas and noise-sensi-
tive recreational areas, the noise may not
exceed 39 db(a). the limits are lower for lower
wind speeds. the municipalities monitor compli-
ance with these noise limits.
the relatively weak noise from wind turbines
also includes some low-frequency noise, i.e.
deep sound with a low frequency. low-
frequency noise is where a significant propor-
tion of the sound energy is found in the fre-
quency range below around 160 Hertz (Hz).
Hertz is a designation for the number of oscil-
lations per second. none of the noise surveys
that have been carried out suggest that there
are special problems with low-frequency noise
from wind turbines. in the assessment of the
danish environmental Protection agency, wind
turbines that observe the limits for ordinary
noise do not give low-frequency noise higher
than the recommended limit. in order to shed
further light on the issues of low-frequency
noise, thereby giving municipalities and players
in the wind power industry a more reliable basis
for evaluating new wind turbine projects, delta
– danish electronics, light and acoustics – has
headed up a research project that has been
mapping the issues of low-frequency noise from
modern wind turbines since 2006. the project is
expected to be completed in spring 2010.
infrasound is sound with a frequency lower than
20 Hz and thus constitutes the “deepest” part of
the low-frequency range. Previously it was
thought that infrasound could not be detected
by the human ear, but infrasound can actually
be heard if it is strong enough, and even weak
infrasound is regarded as a nuisance. the
threshold for hearing infrasound has been well
researched, and the danish environmental
Protection agency recommends a limit that is
10 db lower than the hearing threshold. the
infrasound emitted by modern wind turbines is
of no consequence for the surroundings and is
much weaker than the danish environmental
Protection agency’s recommended limit. l
dB(A)
Limits Examples of noise
150
100
50
0
Jet aircraft at 25 m
Jet aircraft at 100 m
Pain threshold
Rock concert
Loud radio
Industrial noise
Traffic noise
Children playing
Ordinary speech
Soft speech
Home peace
Whispering
Quiet bedroom
Rustling leaves
Hearing threshold
Railway noise, recommended Road noise, recommended
Wind turbines, statutory
Illustration: Factsheet from the Danish
Wind Turbine Owners’ Association
Illustration: Odense Environment Centre, based on calculations
from EMD International
FIgure 3.2 charT OF calculaTeD NOIse ZONes IN The eNvIrONmeNTal ImpacT assessmeNT (eIa)
The two charts from the EIA for the wind turbine project at
Rens Hovedgaard Plantage show the calculated noise zones for
Danish neighbours from 5 x 1.8 MW wind turbines. The chart
on the left shows noise zones at a wind speed of 6 metres per
second, while the chart on the right shows the same noise
zones for a wind speed of 8 metres per second. The noise level
is stated in dB(A). The colours indicate the noise level: the
darker the colour, the higher the noise level.
EXHIBIT A5-3
Page 11 of 32 005097
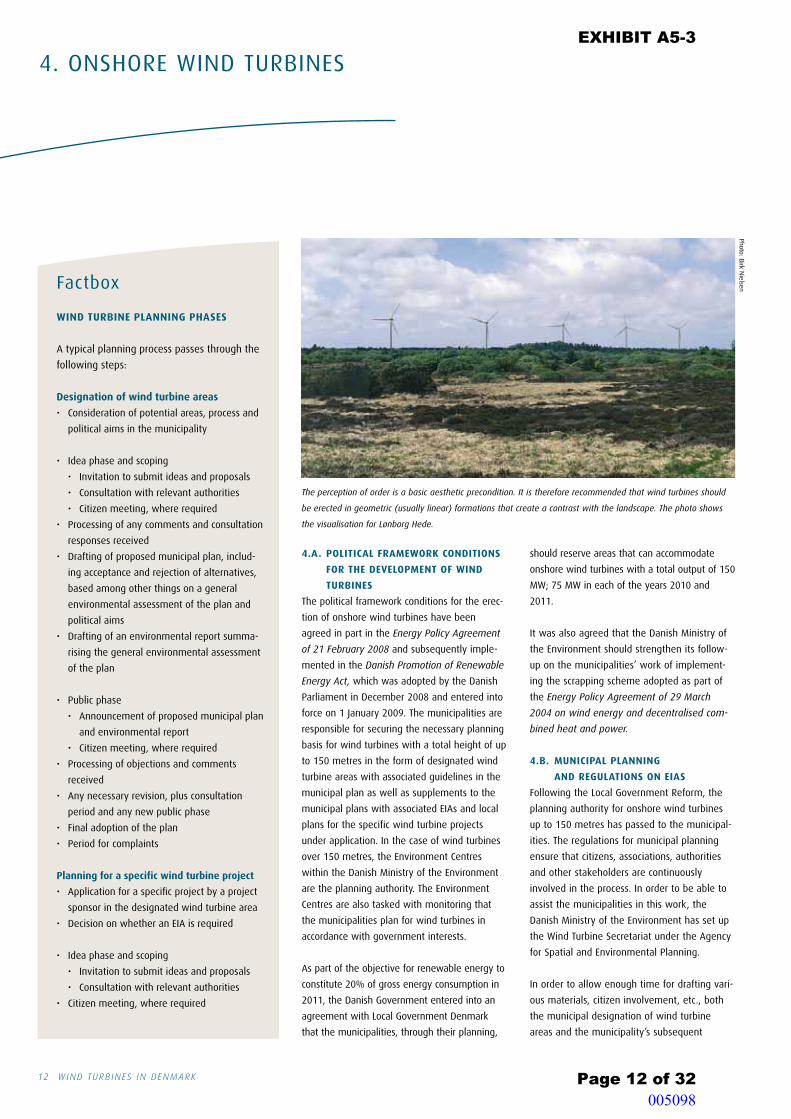
12 w ind turb ines in denmark
4.a. pOlITIcal FrameWOrK cONDITIONs
FOr The DevelOpmeNT OF WIND
TurbINes
the political framework conditions for the erec-
tion of onshore wind turbines have been
agreed in part in the Energy Policy Agreement
of 21 February 2008 and subsequently imple-
mented in the Danish Promotion of Renewable
Energy Act, which was adopted by the danish
Parliament in december 2008 and entered into
force on 1 January 2009. the municipalities are
responsible for securing the necessary planning
basis for wind turbines with a total height of up
to 150 metres in the form of designated wind
turbine areas with associated guidelines in the
municipal plan as well as supplements to the
municipal plans with associated eias and local
plans for the specific wind turbine projects
under application. in the case of wind turbines
over 150 metres, the environment Centres
within the danish ministry of the environment
are the planning authority. the environment
Centres are also tasked with monitoring that
the municipalities plan for wind turbines in
accordance with government interests.
as part of the objective for renewable energy to
constitute 20% of gross energy consumption in
2011, the danish Government entered into an
agreement with local Government denmark
that the municipalities, through their planning,
should reserve areas that can accommodate
onshore wind turbines with a total output of 150
mw; 75 mw in each of the years 2010 and
2011.
it was also agreed that the danish ministry of
the environment should strengthen its follow-
up on the municipalities’ work of implement-
ing the scrapping scheme adopted as part of
the Energy Policy Agreement of 29 March
2004 on wind energy and decentralised com-
bined heat and power.
4.b. muNIcIpal plaNNINg
aND regulaTIONs ON eIas
Following the local Government reform, the
planning authority for onshore wind turbines
up to 150 metres has passed to the municipal-
ities. the regulations for municipal planning
ensure that citizens, associations, authorities
and other stakeholders are continuously
involved in the process. in order to be able to
assist the municipalities in this work, the
danish ministry of the environment has set up
the wind turbine secretariat under the agency
for spatial and environmental Planning.
in order to allow enough time for drafting vari-
ous materials, citizen involvement, etc., both
the municipal designation of wind turbine
areas and the municipality’s subsequent
4. onsHore wind turbines
Factbox WIND TurbINe plaNNINg phases
a typical planning process passes through the
following steps:
Designation of wind turbine areas
• Considerationofpotentialareas,processand
political aims in the municipality
• Ideaphaseandscoping
• Invitationtosubmitideasandproposals
• Consultationwithrelevantauthorities
• Citizenmeeting,whererequired
• Processingofanycommentsandconsultation
responses received
• Draftingofproposedmunicipalplan,includ-
ing acceptance and rejection of alternatives,
based among other things on a general
environmental assessment of the plan and
political aims
• Draftingofanenvironmentalreportsumma-
rising the general environmental assessment
of the plan
• Publicphase
• Announcementofproposedmunicipalplan
and environmental report
• Citizenmeeting,whererequired
• Processingofobjectionsandcomments
received
• Anynecessaryrevision,plusconsultation
period and any new public phase
• Finaladoptionoftheplan
• Periodforcomplaints
planning for a specific wind turbine project
• Applicationforaspecificprojectbyaproject
sponsor in the designated wind turbine area
• DecisiononwhetheranEIAisrequired
• Ideaphaseandscoping
• Invitationtosubmitideasandproposals
• Consultationwithrelevantauthorities
• Citizenmeeting,whererequired
72
Opstillingsmønstre for store vindmøller
Oplevelsen af orden er en grundlæggende æste-tisk forudsætning. Ved placering af møllegrupper indikerer dette væsentligheden af, at møllerne op-leves som en klar sammenhængende enhed, det vil sige i geometriske, oftest lineære formationer, som danner kontrast til landskabet.
En letopfattelig orden kræver som udgangspunkt, at alle møller i en opstilling er ens i forhold til mo-del, størrelse og udseende. Udover princippet om at vindmøller som udgangs-punkt bør opstilles i geometriske, let opfattelige formationer og være af ens karakter, har man tid-ligere også anbefalet, at mølleopstillingen så vidt som muligt bør tilpasses landskabets træk, for ek-sempel ved at lade en række vindmøller følge ryg-gen af en bakke eller læhegnenes hovedretning. Vindmøller på op til 150 meter må nødvendigvis stå med så stor indbyrdes afstand, at opstillinger med flere møller kun vanskeligt lader sig tilpasse landskabets træk. Derfor vil principperne om den geometrisk let opfattelige opstilling ofte stå ale-ne.
Lønborg Hede (Visualisering: Birk Nielsen)
The perception of order is a basic aesthetic precondition. It is therefore recommended that wind turbines should
be erected in geometric (usually linear) formations that create a contrast with the landscape. The photo shows
the visualisation for Lønborg Hede.
Photo: birk nielsen
EXHIBIT A5-3
Page 12 of 32 005098

wind turb ines in denmark 13
73
Indbyrdes afstand
Ved opstilling af flere vindmøller i gruppe opstår forskellige krav til den indbyrdes placering og af-stand mellem de enkelte vindmøller. Af hensyn til den optimale udnyttelse af vindener-gien placeres møller med en vis indbyrdes afstand, så de ikke skaber læ for hinanden. På tværs af den fremherskende vindretning anbefales afstanden som minimum 3 x rotordiameteren, mens den langs vindretningen anbefales som minimum 5 x rotordiameteren, da de forreste møller her i højere grad vil skabe vindskygge (Siemens Wind Power). I praksis betyder afstandskrav til naboer og lods-ejerforhold dog oftest, at man kan acceptere min-dre indbyrdes afstande, ligesom lokaliteter med særlige vindforhold og/eller opstillingsretninger ligeledes kan være et argument for kortere ind-byrdes afstand. Derudover risikerer møller med en tæt indbyrdes afstand at skabe turbulens for hinanden, som kan være en sikkerhedsmæssig belastning for kon-struktionen. For afstande under 3 x rotordiameter må man tage særlige forbehold for dette (Siemens Wind Power).
De gennemførte undersøgelser af egenæstetikken viser, at en indbyrdes afstand mellem vindmøller-ne på 3 - 4 x rotordiameteren virker mest harmo-nisk, og dette forhold gælder, hvad enten der er tale om få eller mange vindmøller på række. Ved en afstand på over 5 x rotordiameteren fremstår møllerne ikke længere som en klart sammenhæn-gende enhed, da den indbyrdes afstand i forhold til møllernes størrelse virker stor.
2 x rotordiameter
3 x rotordiameter
4 x rotordiameter
5 x rotordiameter
Illustrationer: Birk Nielsen
• Processingofanycommentsandconsultation
responses received
• Draftingofsupplementtomunicipalplanand
local plan, including adjustment of the project
based on a general environmental assessment
of the plan
• DraftingofanEIAfortheproject
• Publicphase
• Announcementoftheproposedplans,incl.
eia for the project
• Citizenmeeting,whererequired
• Processingofanyobjectionsandcomments
received
• Anyrevision,plusconsultationperiodandany
new public phase
• FinaladoptionoftheplansandissuingofEIA
approval
• Periodforcomplaints
processing of a specific project normally take at
least a year.
apart from household and small turbines, wind
turbines may only be erected in areas desig-
nated through reservations and guidelines in
the municipal plan. the municipality must
therefore assess which areas are suitable for
erecting wind turbines.
the local council must ensure in its planning
that it gives full consideration to neighbouring
residences, nature, the landscape, culturo-his-
torical values, agricultural interests, and the
possibility of exploiting the wind resource.
the municipal plan must include guidelines and
a framework, and must be accompanied by a
statement on the assumptions underlying the
local council’s proposed plan. the guidelines for
designated wind turbine areas must include
regulations on the anticipated maximum
number and size of the turbines as well as the
spacing between the turbines.
the further planning of specific projects then
awaits the initiative of a project sponsor, a
wind turbine owners’ association or others
wishing to use the designated area to erect
wind turbines.
a project sponsor wishing to establish a wind
turbine project must notify the project to the
municipality. the planning process for projects
requiring an eia begins with an idea phase in
which the municipality drafts a discussion
paper inviting proposals from citizens on the
content of the eia and the supplement to the
municipal plan. this idea phase, which is also
called the pre-public phase, must last at least
two weeks.
the planning must also satisfy the require-
ments for environmental assessment of plans
and programmes, which include consultation
with the relevant authorities, including neigh-
bouring municipalities, the region and national
bodies that have to grant environmental
approvals to allow implementation of the
physical planning, as well as any local and
regional supply companies whose installations
may be affected by the project.
taking into consideration the feedback that it
receives, the municipality draws up guidelines
on the further local planning in a supplement
to the municipal plan and determines the
scope of the eia, which the project owner and
the municipality often prepare jointly. this
material is sent for public consultation lasting
at least eight weeks. in this public phase, pro-
perty owners, neighbours, associations, author-
ities, etc., may submit objections, comments
and alternative proposals.
after this, the municipality can finally adopt
the wind turbine project and give the project
sponsor an eia approval. if a local plan also has
to be drawn up for the project, the local coun-
cil draws this up in parallel. the local plan for a
wind turbine area must include regulations on
the turbines’ exact siting, number, minimum
and maximum total height, and appearance.
in accordance with the Danish Planning Act,
a supplement to the municipal plan for a wind
turbine project involving turbines with a total
height of more than 80 metres or a group of
more than three turbines must be accompa-
nied by an ela assessing the consequences of
the project for the environment. other projects
are screened by the local council, which
decides whether a project has such major con-
sequences for the environment that an eia
should be drawn up or whether only a rural
zone permit should be issued. Order no. 1335
of 6 December 2006 on the assessment of cer-
tain public and private installations’ impact on
the environment contains regulations on eias.
the eia must assess how the wind turbine
project will affect neighbouring residences in
terms of, among other things, noise and shad-
ow, nature, the landscape, culturo-historical val-
ues, and agricultural interests, as well as giving
information on local wind conditions. this nor-
mally requires the project owner to draw up a
visualisation of the project so that citizens can
more easily form a realistic impression of the
implications of the wind turbine project.
Illustrations: Birk Nielsen
With regard to both turbulence and aesthetics, it is recom-
mended that in projects involving multiple wind turbines their
spacing should be three to four times the rotor diameter. The
illustrations from Birk Nielsen show examples of wind turbines
spaced at intervals of two times the rotor diameter (top), three
times the rotor diameter, four times the rotor diameter, and
five times the rotor diameter (bottom) respectively.
FIgure 4.1
eXamples OF spacINg IN a WIND TurbINe prOjecT
EXHIBIT A5-3
Page 13 of 32 005099

14 w ind turb ines in denmark
Factbox all eIas, including those for wind turbine
projects, must include:
• Adescriptionoftheproject.
• Asummaryofmajoralternativestothe
execution of the proposed project that the
project sponsor has investigated (minimum
the zero alternative, i.e. the situation if the
project is not implemented).
• Adescriptionoftheimpactoftheprojecton
people, fauna, flora, soil, water, air, climate,
landscape, tangible property, and the dan-
ish cultural heritage.
• Adescriptionoftheproject’sshort-termand
long-term, direct and indirect, derived and
cumulative impacts on the environment.
• Adescriptionofenvironment-improving
measures, including preventive measures.
• Anon-technicalsummaryoftheassess-
ment.
in the case of wind turbine projects that do not
require an eia, the rural zone regulations of the
Danish Planning Act set out requirements for
informing neighbours about the project.
Generally, there is no requirement for the
information to include a visualisation, but
energinet.dk (the danish transmission system
operator) may require this if it would be a pre-
condition for neighbours being able to realisti-
cally assess whether the project will entail a
loss of value on their properties, cf. 6.b.
decisions of the local council concerning wind
turbine projects may be contested with the
nature Protection board of appeal.
the danish ministry of the environment’s wind
turbine secretariat is a type of “flying squad”
that provides the municipalities with guidance
and practical help in wind turbine planning –
such as identifying the sites that are most suit-
able in respect of neighbours and nature pro-
tection interests, formulating idea proposals,
decision-making documentation and proposals
for wind turbine plans, or arranging citizen
meetings, etc.
most of denmark’s municipalities are in dia-
logue with the wind turbine secretariat, either
to get answers to specific questions or to obtain
formal assistance with the planning process.
the wind turbine secretariat has a danish
website, www.vind.mim.dk, via the agency
for spatial and environmental Planning. Here
you can find answers to frequently asked ques-
tions as well as tools for use in municipal wind
turbine planning, including:
• Asummaryofessentialsitingconsidera-
tions.
• Aprocesslinewithamodeloftheplanning
process and a timeframe.
• Links,includingtoapplicableregulationsand
the agency for spatial and environmental
Planning’s spacing map.
4.c. regulaTIONs FOr sITINg
ONshOre WIND TurbINes
the siting of new wind turbines is carried out
on the basis of an overall balancing of various
factors such as wind speed, distance to nearest
neighbours, noise and shadow, other technical
installations, and regard for the landscape and
nature. this balancing is brought about through
the municipal wind turbine planning, which
directly involves affected citizens, organisa-
tions, authorities, etc. the key principles for
erecting wind turbines are wind conditions,
distance to neighbours, and regard for specific
affected interests, e.g. nature protection areas
and areas of culturo-historical interest.
the regulations for siting are set out in the
Danish Planning Act and implemented in Wind
Turbine Circular no. 9295 of 22 May 2009. the
aim of the Circular is to ensure regard for land-
scape, neighbours, etc. Generally, new wind
turbines must as a minimum be sited at a dis-
tance from the nearest neighbours of at least
four times the wind turbine’s total height.
special consideration must be given to the
coastal zone, which is defined in the Danish
Planning Act as a three-kilometre zone along
the coast throughout the country that is gene-
rally to be kept free of buildings and installa-
tions. if a municipality wants to erect wind tur-
bines in the coastal zone, this requires special
planning or functional justification, for example
that there are especially favourable wind con-
ditions along the municipality’s coasts, as is the
case in the west Jutland municipalities.
Visualisation is an excellent method for illus-
trating the implications of new wind turbines
for landscape and nature. landscapes that in
the past have been dominated by large techni-
cal installations will often be suitable for erect-
ing large wind turbines because the turbines
will not significantly increase the impact on the
landscape. these technical installations might
be CHP plants, waste incineration plants, high-
voltage masts, industrial activities with tall
chimneys, harbour areas with large cranes, etc.
these installations are already highly visible in
the landscape.
large and uniform landscapes will also usually
be suitable for erecting large wind turbines.
the reason for this is that the landscape
matches the large dimensions because it is
often characterised by flat or evenly sloping
FIgure 4.2 WIND TurbINe IN a TechNIcal laNDscape
Birk Nielsen’s sketch shows the siting of MW wind turbines at
Esbjerg Power Station.
Wind turbine 2.3 mWHub height 80 mtotal height 126 m
esbjerg power stationbuilding height 106 mChimney 250 m
Wind turbine 3.6 mWHub height 90 mtotal height 143.5 m
EXHIBIT A5-3
Page 14 of 32 005100

wind turb ines in denmark 15
terrain with large units of area and “landscape
space”.
small-scale landscapes will often be less suita-
ble for erecting large wind turbines. these
landscapes are characterised by small hills or
gentle slopes with less “landscape space”,
where large wind turbines would contrast
starkly with the nature of the landscape.
a more exhaustive description of the impact of
large wind turbines on different types of land-
scape can be found in the report Store vind-
møller i det åbne land – en vurdering af de
landskabelige konsekvenser (Large wind tur-
bines in the open countryside – an assessment
of implications for the landscape), which can
be downloaded (in danish only) from www.
blst.dk.
the oldest wind turbines were often erected
spread out in the landscape, which meant that
they impacted a very large area in relation to
their installed electrical output. as a starting
point, the aim is to site new wind turbines in
groups wherever possible so as to achieve a
high installed electrical output with impact on a
relatively small area. Furthermore, the munici-
pality can require wind turbines in a group to be
uniform and arranged in a simple geometric
pattern, for example in a single row, so that the
wind turbines create a calmer impression.
it is also important that wind turbines erected
as a group should appear harmonious and uni-
form in design. a wind turbine is regarded as
harmonious if there is a balance between
tower height and rotor diameter. Generally,
experience suggests that the most harmonious
rotor/tower ratio for larger wind turbines is
0.9–1.35, depending on the total height. as an
example, a wind turbine with a tower height
of 80 metres and a rotor diameter of 100
metres, giving a total height of 130 metres,
has a rotor/tower ratio of 1.25.
4.D. TechNIcal cerTIFIcaTION
OF WIND TurbINes
in order to help ensure that new wind turbines
are safe and can be incorporated into the elec-
tricity system, a secretariat for the danish wind
turbine Certification scheme has been set up
and located at risø dtu (national laboratory
for sustainable energy at the technical
university of denmark). the specific regulations
are described in Danish Energy Agency’s Order
no. 651 of 26 June 2008 on the technical cer-
tification scheme for the design, manufacture,
installation, maintenance and servicing of
wind turbines. the secretariat has a website at
www.vindmoellegodkendelse.dk. the tech-
nical prescriptions for the connection of wind
turbines to the electricity grid can be found at
www.energinet.dk.
4.e. hOusehOlD WIND TurbINes
aND small WIND TurbINes
a household wind turbine is normally under-
stood to be a smaller, stand-alone turbine with
a total height of less than 25 metres that is
erected directly connected to existing housing
in the open countryside, usually in a rural zone.
small wind turbines are normally understood to
be stand-alone turbines with a rotor area of up
to 1 m2 (“micro turbines”) or 1-5 m2 (“mini tur-
bines”). the turbine may be installed on a
building.
For all turbine types the Danish Ministry of the
Environment Order on noise from wind turbines
must be respected when erecting and operat-
ing the turbines. turbine types with a rotor area
in excess of 1 m2 are subject to the danish
Energy Agency’s Order no. 651 of 26 June 2008
on the technical certification scheme for the
design, manufacture, installation, maintenance
and servicing of wind turbines. in the case of
turbines with rotor area 1-5 m2, however, only
a registration notification is required.
wind turbine projects must as a minimum be
screened in accordance with the regulations of
the EIA Order. Household and small turbines
will not normally require an eia, supplement to
the municipal plan and eia.
erecTION OF WIND TurbINes
IN rural ZONes
it is the task of the municipalities, as the rural
zone authority, to issue rural zone permits. in
this regard, the municipality must carry out
70
Harmoniforhold
Det størrelsesmæssige forhold mellem vindmøl-lens tårn og vinger har betydning for dens ege-næstetik. Når vindmøllerne vokser i størrelse, virker forhol-det mellem tårn og rotor mest harmonisk, når ro-torens diameter øges yderligere i forhold til tårnet.
Det hænger sammen med, at nye, store mølletyper har en mere slank karakter end ældre modeller og derfor bedre kan bære lange ’arme’.
Vurderingen for 150 m høje møller peger mod, at forholdet tårn/ rotordiameter har det mest har-
moniske udtryk omkring 1:1,1 eller 1:1,2, altså at rotordiameteren er 10-20% større end tårnets høj-de. Et forhold under 1:1 forekommer uharmonisk, fordi vingerne synes for små, mens forhold større end 1:1,3 kan få vingerne til at virke overdimen-sioneret.
1: 0,9 1: 1,2 1: 1,51:0.9
70
Harmoniforhold
Det størrelsesmæssige forhold mellem vindmøl-lens tårn og vinger har betydning for dens ege-næstetik. Når vindmøllerne vokser i størrelse, virker forhol-det mellem tårn og rotor mest harmonisk, når ro-torens diameter øges yderligere i forhold til tårnet.
Det hænger sammen med, at nye, store mølletyper har en mere slank karakter end ældre modeller og derfor bedre kan bære lange ’arme’.
Vurderingen for 150 m høje møller peger mod, at forholdet tårn/ rotordiameter har det mest har-
moniske udtryk omkring 1:1,1 eller 1:1,2, altså at rotordiameteren er 10-20% større end tårnets høj-de. Et forhold under 1:1 forekommer uharmonisk, fordi vingerne synes for små, mens forhold større end 1:1,3 kan få vingerne til at virke overdimen-sioneret.
1: 0,9 1: 1,2 1: 1,51:1.2
70
Harmoniforhold
Det størrelsesmæssige forhold mellem vindmøl-lens tårn og vinger har betydning for dens ege-næstetik. Når vindmøllerne vokser i størrelse, virker forhol-det mellem tårn og rotor mest harmonisk, når ro-torens diameter øges yderligere i forhold til tårnet.
Det hænger sammen med, at nye, store mølletyper har en mere slank karakter end ældre modeller og derfor bedre kan bære lange ’arme’.
Vurderingen for 150 m høje møller peger mod, at forholdet tårn/ rotordiameter har det mest har-
moniske udtryk omkring 1:1,1 eller 1:1,2, altså at rotordiameteren er 10-20% større end tårnets høj-de. Et forhold under 1:1 forekommer uharmonisk, fordi vingerne synes for små, mens forhold større end 1:1,3 kan få vingerne til at virke overdimen-sioneret.
1: 0,9 1: 1,2 1: 1,51:1.5Illustrations: Birk Nielsen
FIgure 4.3 TOWer/blaDe raTIOs
The ratio between a wind turbine’s tower and blades (the “har-
mony ratio”) is important for the turbine’s own aesthetics. New
types of large turbine have a more slender design than older
models, and the tower can therefore better support long
blades with a large rotor area and production capacity. The rec-
ommended harmony ratio thus depends on the size of the
wind turbine. For wind turbines with a total height of less than
100 metres, the recommended rotor diameter is -/+ 10% in
relation to the tower height, while for larger wind turbines
with a total height of up to 150 metres, the recommended
rotor diameter is between +10% and +35% in relation to the
tower height.
EXHIBIT A5-3
Page 15 of 32 005101

16 w ind turb ines in denmark
planning appraisals in respect of ongoing plan-
ning. Furthermore, landscape considerations
and any building lines as per the Danish Nature
Protection Act as well as any supplementary
considerations regarding neighbours (view,
reflection, etc.) must also be taken care of.
in the case of household and small turbines,
the Wind Turbine Circular does not set out fixed
requirements for the distance to neighbouring
homes, etc., in relation to the turbine’s total
height.
the municipalities must carry out individual
assessments of cases/applications. However,
the fact that the decision must always be
taken on the basis of a specific assessment
does not preclude the municipality from clarify-
ing in its municipal planning guidelines other
protection interests and considerations that
receive particular attention in its case-handling,
including of course any guidelines for erecting
smaller wind turbines. l
Phot
o: w
ind
turb
ine
secr
etar
iat
In addition to large wind turbines, the Samsø
Renewable Energy Island project has also estab-
lished household wind turbines, one of which
(shown below) can be seen in front of the solar-
panelled roof of Samsø Energy Academy.
Photo: samsø energy a
cademy
WIND resOurce aTlas FOr DeNmarK:
in 1998, with funding from the danish
energy agency, risø dtu’s wind energy
division teamed up with the danish
software and consultancy firm emd
international to compile the wind re-
source atlas for denmark, which can be
seen on page 17. areas with the highest
average wind speeds are shown in red
and yellow, while areas with less wind
are shown in green and blue.
EXHIBIT A5-3
Page 16 of 32
•
005102
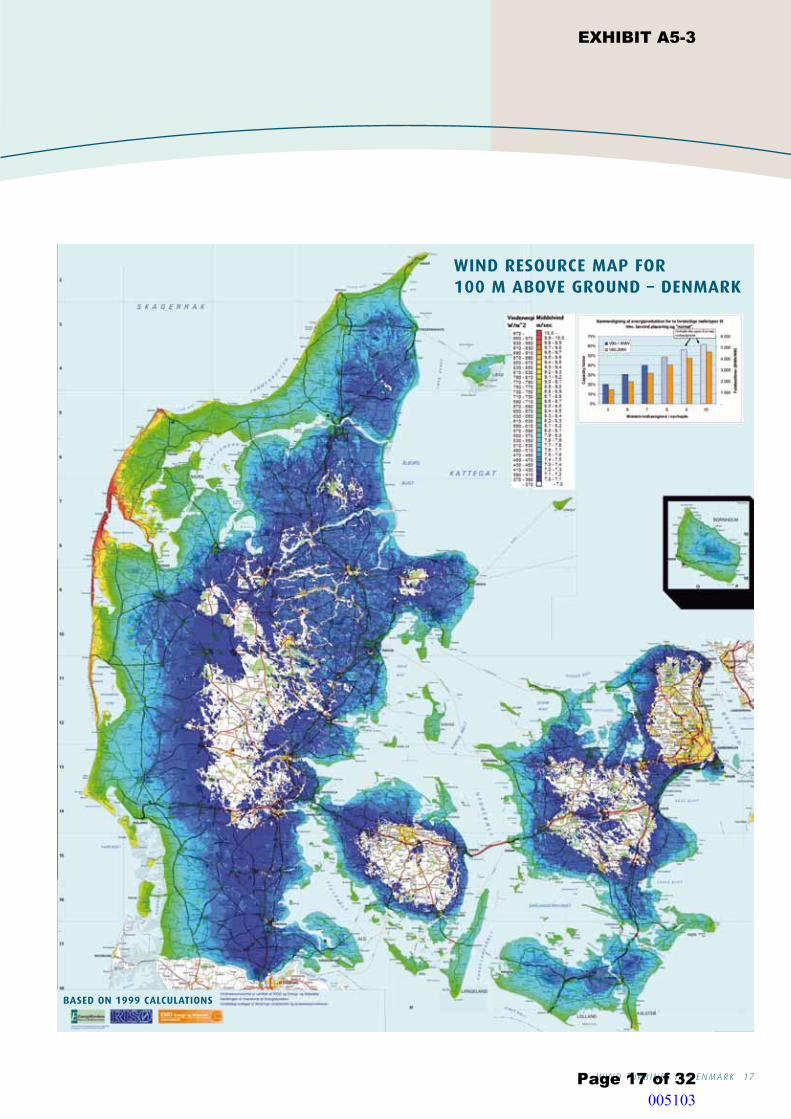
wind turb ines in denmark 17
WIND resOurce map FOr 100 m abOve grOuND – DeNmarK
baseD ON 1999 calculaTIONs
EXHIBIT A5-3
Page 17 of 32
. ,.
11
"
..
II
"
..
- .. -W'lili"'Z al..-: .,,, ....... .,.,_ ...... IN •I._ •~-«w IM-if~ .... ........ :;!!$ ....... ,., .... 111- r'I' 1,~1K Hl -ffl. .... l'!fli , til. 11111 -•il :J•~ .... •~• rll" ....... ... , .... ........ ~-.i" -~----~ :~
• u -a.1 1.1~11 I I• I I ~t:: 'I~ ., • l!T• U '1 1• 1..1 L1 1U I.I- II J.1 - 11 II •~II U,I! 111 , • J
•···.. -.,· ·~ ,, t • , u II I I I ~ l'. 1-1.1 ,.1.,.1 ,.,_ ,.., l' 1- p ~ P J . PI ,• ,•t "II~ I ~ii. r--,. I". ' ~.1 .. I I ~ ~ ., .
...
1H ~I
005103

18 w ind turb ines in denmark
5. oFFsHore wind turbines
5.a. OFFshOre WIND TurbINes
IN DeNmarK
in 1991 denmark became the first country in
the world to take wind turbines out to sea with
11 x 450 kw turbines in the Vindeby offshore
wind farm. this was followed by a number of
smaller demonstration projects, leading to the
first two large offshore wind farms Horns rev i
and nysted (rødsand i) with outputs of 160
and 165 mw respectively. some offshore wind
farms have been built because power compa-
nies were given political orders to do so or via
tenders, while others are wholly or partly
owned by local wind turbine owners’ associa-
tions such as middelgrunden and samsø.
with 660 mw offshore wind turbines connected
to the electricity grid in 2009, denmark is still
one of the largest developers of offshore wind
farms. only the united kingdom has a larger
capacity.
in 2010 the offshore wind turbines at rødsand
ii will be erected with an output of just over
200 mw. the danish energy agency has ten-
dered out another offshore wind turbine
project at anholt/djursland with an output of
around 400 mw. these projects are the result
of the Energy Policy Agreement of 29 March
2004 and the Energy Policy Agreement of 21
February 2008 respectively.
it is considerably more expensive to build and
operate offshore wind turbines than onshore
wind turbines. on the other hand, the produc-
tion conditions are better at sea with higher
wind speeds and more stable wind conditions.
the increased costs are reflected in the feed-in
tariff that the project developers for the latest
offshore wind farms have obtained through the
danish energy agency’s tender. donG energy,
which is the project sponsor for Horns rev ii,
receives dkk 0.518 per kwh for 10 twh, corre-
sponding to around 50,000 full-load hours,
after which the electricity produced has to be
sold under market conditions. e.on ab from
sweden, which won the tender for rødsand ii,
receives dkk 0.629 per kwh for 10 twh, corre-
sponding to around 50,000 full-load hours.
5.b. The DaNIsh eNergy ageNcy
as a ONe-sTOp shOp
the danish energy agency is the authority
responsible for the planning and erection of
offshore wind turbines. in order to make prep-
aration of new offshore wind turbine projects
as simple as possible for project developers,
the danish energy agency has organised the
overall official handling as a “one-stop shop”,
which means that a project owner wishing to
establish an offshore wind turbine project only
has to deal with one body – namely the danish
energy agency – to obtain all the necessary
approvals and licences.
as a one-stop shop, the danish energy agency
involves other relevant authorities such as the
agency for spatial and environmental Planning,
the danish maritime authority, the danish
maritime safety administration, Caa-denmark,
the Heritage agency of denmark, danish
defence, etc. the danish energy agency also
arranges consultation with the relevant stake-
holders and issues all the necessary approvals
and licences. energinet.dk is responsible for
transmitting the electricity production from off-
shore wind turbines to the electricity grid and
owns both the transformer station and the
underwater cables that carry the electricity
production of offshore wind farms to land.
in comparison with the official administration of
offshore wind farms in other countries, the
danish model has provided a quick, cost-effective
process to the benefit of operating economy in
the individual projects and the development of
offshore wind turbines as a whole.
5.c. mappINg OF FuTure sITes
FOr OFFshOre WIND Farms
in order to ensure that the future development
of offshore wind turbines does not clash with
other major public interests and that the devel-
opment is carried out with the most appropri-
ate socio-economic prioritisation, the danish
energy agency, in conjunction with the other
relevant authorities, has mapped the most
suitable sites for future offshore wind farms.
this mapping is a dynamic process because the
framework conditions for developing offshore
wind farms are continually changing. in 2007
With 209 MW produced by 91 wind turbines, the Horns Rev II
offshore wind farm, which was opened in September 2009, is
the largest offshore wind farm in the world to date. The tur-
bines are located 30 km from the coast and can produce elec-
tricity to cover the consumption of 200,000 households.
The offshore wind farm at Paludans Flak 4 km south of Samsø
comprises 10 wind turbines with a combined output of 23 MW
that produce approximately 77,500 MWh a year. The offshore
wind farm was commissioned in 2002, and in the long term its
production will make it possible to cover electricity consumption
for the operation of electric cars and hydrogen for transportation
on the island. Half of the wind turbines are owned by the munic-
ipality, while the inhabitants of Samsø own most of the rest.
Phot
o: d
on
G e
nerg
yPh
oto:
sam
sø e
nerg
y a
cade
my
EXHIBIT A5-3
Page 18 of 32 005104

wind turb ines in denmark 19
the danish energy agency published a techni-
cal mapping report designating 23 suitable
sites, each with space for around 200 mw.
these possible offshore wind farms could
achieve a total installed output of 4,600 mw, and
with average wind speeds of around 10 metres
per second they could produce around 18 twh
annually, equivalent to more than half of current
danish electricity consumption. the sites are pri-
oritised according to public interests such as
regard for grid transmission, navigation, nature,
landscape, raw material extraction, and the
anticipated cost of establishing and operating the
offshore wind farms. the cross-ministry commit-
tee work has placed its emphasis on a planned
and coordinated development of offshore wind
farms and the transmission grid, and the chosen
sites have been submitted to a strategic environ-
mental assessment in order to prevent any
future conflicts with environmental and natural
interests.
through its Offshore Wind Turbine Action Plan
of September 2008 the danish energy agency
updated the mapping in light of the Energy
Policy Agreement of 21 February 2008. the
good wind conditions at the chosen sites allow
the offshore wind farms to produce for around
4,000 full-load hours a year. with sea depths of
10-35 metres and a distance to the coast of
22-45 kilometres, a balance has been struck
between economic considerations and the visu-
al impact on land.
5.D. TeNDerINg OuT OF
OFFshOre WIND Farms
the establishment of offshore wind turbines
can follow two different procedures: a govern-
ment tender procedure run by the danish
energy agency; or an open-door procedure. For
The map of Denmark shows the locations of existing and planned offshore wind farms. Up to now offshore wind
farms have been located with a considerable geographical spread, which has made it easier for Energinet.dk to
incorporate the varying electricity production into the electricity system. Following a government tender initiated
in 2009, a 400 MW offshore wind farm is to be established between Anholt and Djursland.
map: d
anish energy agency
The Committee for Future Offshore Wind Power
Sites updated its mapping of potential locations in
September 2008. The purple colour on the map
indicates 26 potential sites, each of which can be
developed with 200 MW, giving a total of 5,200
MW, while the existing large offshore wind farms
are indicated in blue.
map: d
anish energy agency
EXHIBIT A5-3
Page 19 of 32
Status for offs~re wind energy def:).l0yment in Denmai,k 20Qi9' 1' -,_...., ( I ·.: .. ~ rl
Offshore Wind Energy Site Reservation
'Tian>-mk• lcn Grid
005105

20 w ind turb ines in denmark
Factbox Two types of procedure for establishing offshore wind farms
in denmark, new offshore wind farm projects
can be established according to two different
procedures: a government tender or an open-
door procedure.
a government tender is carried out to realise a
political decision to establish the project as part
of the danish development of renewable energy.
the danish energy agency tenders out the project
in an open competition to obtain the lowest pos-
sible costs. energinet.dk may be responsible for
preparing the environmental impact assessment
(eia) and the electricity link to land.
in an open-door procedure, the project devel-
oper applies to the danish energy agency for a
licence to carry out preliminary investigations
and establish an offshore wind farm in the given
area. the danish energy agency clarifies wheth-
er there are any competing public interests and,
where possible, issues the required licence. the
project developer receives the same price sup-
plement as for new onshore wind turbines and
has to finance the connection of the project to
the electricity grid on land.
both procedures, the project developer must
obtain a licence to carry out preliminary inves-
tigations, a licence to finally establish the off-
shore wind turbines, a licence to exploit wind
power for a given number of years, and – in
the case of wind farms of more than 25 mw –
an approval for electricity production.
in the government tender procedure, the danish
energy agency announces a tender for an off-
shore wind turbine project of a specific size, e.g.
200 mw, within a specifically defined geograph-
ical area. a government tender is carried out to
realise a political decision to establish a new
offshore wind farm at the lowest possible cost.
depending on the nature of the project, the
danish energy agency invites applicants to
submit a quotation for the price at which the
bidders are willing to produce electricity in the
form of a fixed feed-in tariff for a certain
amount of produced electricity, calculated as
number of full-load hours.
the winning price will differ from project to
project because the result of a tender depends
on the project location, the wind conditions at
the site, the competitive situation in the mar-
ket at the time, etc. in the two tenders so far
the winning price has been higher than the
feed-in tariff that is paid for an open-door
project which corresponds to the feed-in tariff
for new onshore wind turbines. as well as the
lowest feed-in tariff, the technical and financial
capacity of the bidding companies or consortia
to implement the project are assessed.
based on the experiences of the rødsand ii off-
shore wind farm, where the winner of the first
tender ultimately chose not to implement the
project due to changed market conditions, the
danish energy agency has tightened the condi-
tions in the latest tenders so that the project
developer has to pay a fine if the project is not
implemented as planned or is delayed.
in projects covered by a government tender,
energinet.dk owns both the transformer station
and the underwater cable that carries the elec-
tricity to land from the offshore wind farm. in
the tender for the anholt offshore wind farm,
which is being implemented in 2009-2010,
energinet.dk will also undertake the eia and
preliminary geotechnical and geophysical sur-
veys of the seabed. the winner of the tender
will pay energinet.dk’s costs for these prelimi-
nary surveys.
in the open-door procedure, the project devel-
oper takes the initiative in establishing an off-
shore wind farm in a specific area. this is done
by submitting an unsolicited application for a
licence to carry out preliminary investigations
in the given area. the application must as a
minimum include a description of the project,
the anticipated scope of the preliminary inves-
tigations, the size and number of turbines, and
the limits of the project’s geographical siting.
in an open-door project, the developer pays for
the transmission of the produced electricity to
land. an open-door project cannot expect to
obtain approval in the areas that are designated
for offshore wind farms in the report Future Off-
shore Wind Power Sites – 2025 from april 2007
and the follow-up to this from september 2008.
before the danish energy agency actually
begins processing an application, as part of the
one-stop shop concept it initiates a hearing of
other government bodies to clarify whether
there are other major public interests that
could block the implementation of the project.
on this basis, the danish energy agency
decides whether the area in the application
can be developed, and in the event of a posi-
tive decision it issues an approval for the appli-
cant to carry out preliminary investigations,
including an eia.
the danish energy agency has approved appli-
cations within the open-door procedure for the
following offshore wind turbine projects:
avedøre Holme, involving three demonstration
wind turbines (donG energy); Frederikshavn,
involving six demonstration wind turbines
(nearshorelab); and sprogø, involving seven
offshore wind turbines (sund & bælt).
Horns Rev II will predominantly be serviced by operating and
maintenance personnel who will live for one week at a time
on a habitation platform linked to the offshore wind farm. This
will help reduce transport time and costs, thereby optimising
operating economy.
Phot
o: d
on
G e
nerg
y
EXHIBIT A5-3
Page 20 of 32 005106

wind turb ines in denmark 21
FactboxThe environmental impact
of offshore wind farms
as an integral part of the projects for the first
two large demonstration offshore wind farms,
Horns rev i and nysted, from 1996 to 2006 an
environmental monitoring Programme was car-
ried out to document the impact of the projects
on the marine environment. on completion of
the programme, at the recommendation of an
international expert panel a small follow-up
programme was launched focusing on the long-
term effects for porpoises, water birds (common
scoters, divers, long-tailed ducks, etc.) and fish.
the results show that the foundations of the
offshore wind farms have created new artificial
habitats, thereby contributing to increased
biodiversity and better living conditions for the
local fish communities. seals were only affected
in the short term during the construction work,
while porpoises, which disappeared from the
area while the wind farm was being built, have
to some extent returned. birds have been able to
avoid the offshore wind farms.
the results of the environmental monitoring
Programme are quality-assured by the interna-
tional expert panel and regularly published on
the english pages of the danish energy agency’s
website, www.ens.dk.
5.e. ImplemeNTaTION OF aN
OFFshOre WIND TurbINe prOjecT
once the danish energy agency has granted
the project developer a licence to carry out
preliminary investigations, all projects follow
the same procedure. the preliminary investiga-
tions include as a minimum an eia as well as
geophysical and geotechnical surveys of the
seabed to clarify what type of foundation
should be used.
the eia must assess the offshore wind farm’s
impacts on the environment. on the basis of
responses from the initial consultation of
authorities and other stakeholders, the danish
energy agency determines what the eia should
include. the eia must demonstrate, describe
and assess the environmental consequences of
implementing the project in respect of:
a) people, fauna and flora
b) seabed, water, air, climate and landscape
c) tangible property and danish cultural
heritage
d) interaction between these factors.
Furthermore, the eia must describe proposals
for alternative siting and proposals for how
demonstrated environmental nuisances can be
prevented or reduced. Order no. 815 of 28
August 2000 on assessments of impacts on the
environment of offshore electricity-producing
installations sets out the detailed conditions for
this type of eia.
the project developer’s application to establish
the offshore wind farm must include a full
description of the project’s expected scope,
size, geographical location, coordinates for tur-
bines, grid connection plans and cable trace,
etc., as well as the results of the preliminary
investigations.
once the danish energy agency has received
the eia together with a final application to
establish the offshore wind farm, it sends both
for public consultation with a deadline for reply
of at least eight weeks. the consultation is
announced on the danish energy agency’s
website and in national and local newspapers.
this gives other authorities, interested organi-
sations and citizens the opportunity to voice
objections and other comments, which the
danish energy agency includes in its processing
of the application and the eia.
if the danish energy agency does not receive
any objections with weighty arguments for
cancelling the project, it grants a licence to
establish the offshore wind farm. in this
regard, the danish energy agency will general-
ly require the project developer to document,
prior to starting the construction work, a
detailed project description.
the project developer must apply for a licence
to exploit wind power from the offshore wind
farm and, in the case of wind farms of more
than 25 mw, for an authorisation to produce
electricity. this must be done after the installa-
tion work has begun and at the latest two
months before the first wind turbine is ready
to begin operating. the offshore wind farm
must not supply electricity to the grid until the
licence and, where required, the approval have
been granted.
significantly and individually affected parties as
well as relevant environmental organisations
may appeal the danish energy agency’s deci-
sions to the energy board of appeal. any
appeals must be submitted in writing within
four weeks of the publication of the decision. l
Photo: samsø energy a
cademy
EXHIBIT A5-3
Page 21 of 32 005107

22 w ind turb ines in denmark
Factboxclaims for payment for loss
of value on real property
the Energy Policy Agreement of February 2008
introduced a scheme giving neighbours of new
wind turbine projects the right to have loss of
value on their property covered if the loss is as-
sessed to be at least 1% of the property’s value.
the scheme was introduced to create greater local
acceptance of and involvement in the erection of
new onshore wind turbines.
in order for their claims to be processed,
neighbours living within a distance of six times
the wind turbine’s total height must notify their
claims for payment for loss of value within four
weeks after the wind turbine project developer
has conducted the prescribed information meet-
ing. neighbours living further away must pay a
fee of dkk 4,000. if the claim for payment for loss
of value is upheld, the fee is repaid.
the loss of value is assessed by an impartial
valuation authority appointed by the minister for
Climate and energy. in all there are five valuation
authorities covering the whole country, each
consisting of a lawyer and an expert in assessing
real property value in the local area. decisions of
the valuation authority cannot be contested with
another administrative authority, but they may be
taken before the courts.
energinet.dk’s Front office administers the loss-
of-value scheme and has placed forms and other
material for use in the case-handling on its web-
site, www.energinet.dk, where it also provides
regular updates on new decisions.
6. new sCHemes in tHe DANISH PROMOTION OF RENEWABLE ENERgy ACT
6.a. a cOmpreheNsIve acT
ON reNeWable eNergy
The Danish Promotion of Renewable Energy
Act (l 1392 of 27 december 2008), which
entered into force on 1 January 2009, covers,
among other things, price supplements for
installations producing electricity with renewa-
ble energy, technical and safety-related
requirements for wind turbines, and special
regulations for offshore wind turbines. the
Energy Policy Agreement of 21 February 2008
required that these regulations should be com-
bined into one act on renewable energy.
Further to this agreement, the Danish
Promotion of Renewable Energy Act also con-
tains four new schemes aimed at promoting
the local population’s acceptance of and
involvement in the development of onshore
wind turbines: a loss-of-value scheme for
neighbours of new wind turbines; an option-to-
purchase scheme with preference given to the
local population; a green scheme so that
municipalities can improve the scenery and
recreational values in areas where wind tur-
bines are erected; and a guarantee scheme to
support local initiative groups with preliminary
investigations. all the schemes are adminis-
tered by energinet.dk.
6.b. The lOss-OF-value scheme
any party erecting new wind turbines with a
height of 25 metres or more, including offshore
wind turbines erected without a government
tender procedure, must pay for any loss of
value on real property if the erection of the
wind turbines results in a loss of at least 1% of
the property value. in order to give neighbours
the opportunity to assess the consequences of
the wind turbine project, the erector must
draw up information material on the project
and invite the neighbours to a public informa-
tion meeting. the material must include a list
of the properties lying within a distance of up
to six times the wind turbine’s total height.
energinet.dk, which must approve the informa-
tion material, can require that the material
should also include a visualisation of the
project. the meeting must be convened with a
reasonable period of notice by means of an
announcement in local newspapers and must
take place at the latest four weeks before the
municipal planning process ends.
Property owners who believe, based on the
information material and the information
meeting, that the erection of the wind turbines
will reduce the value of their property must
notify the loss of value to energinet.dk within
four weeks of the meeting. if a property owner
lives further away than six times the wind tur-
bine’s total height, the owner must pay a fee
to energinet.dk of dkk 4,000. neighbours who
live closer to the wind turbine project are not
required to pay this fee. the fee is repaid if the
property owner is granted the right to compen-
sation for loss of value.
the wind turbine erector may enter into a vol-
untary agreement concerning compensation for
loss of value with property owners who have
notified their claims to energinet.dk. if this is
not done within four weeks, energinet.dk will
submit the owners’ claims to a valuation
authority. the danish minister for Climate and
energy has appointed five valuation authorities
consisting of a lawyer and an expert in assess-
ing real property value. the valuation authority
will decide, on the basis of a specific assess-
ment, the extent to which property owners’
claims can be accommodated.
if the property owner’s claim for compensation
is upheld, the wind turbine erector will pay the
valuation authority’s costs. if the property own-
er’s claim is rejected, energinet.dk pays the
case costs not covered by any fee of dkk
4,000. this cost is recouped from the electricity
consumers as a Pso contribution.
33
Hollandsbjerg Enge, standpunkt 1. Afstand til nærmeste mølle omkring 2,8 km Øverst: Oprindeligt VVM-forslag (11 stk 1,5 MW møller med en totalhøjde på 92 m)Nederst: 10 stk 3,6 MW møller med en totalhøjde på 150 m
Phot
o: V
isua
lisat
ion
by b
irk n
iels
en
EXHIBIT A5-3
Page 22 of 32 005108

wind turb ines in denmark 23
decisions of the valuation authority cannot be
contested with another administrative body but
may be brought before the courts as civil pro-
ceedings by the owner of the property against
the wind turbine erector.
6.c. The OpTION-TO-purchase scheme
erectors of wind turbines with a total height of
at least 25 metres, including offshore wind tur-
bines erected without a governmental tender,
shall offer for sale at least 20% of the wind
turbine project to the local population. anyone
over 18 years of age with his/her permanent
residence according to the national register of
Persons at a distance of maximum 4.5 kilome-
tres from the site of installation or in the
municipality where the wind turbine is erected
has the option to purchase. if there is local
interest in purchasing more than 20%, people
who live closer than 4.5 kilometres from the
project have first priority on a share of owner-
ship, but the distribution of shares should
ensure the broadest possible ownership base.
in order to give local citizens an adequate deci-
sion-making platform, wind turbine erectors
must provide information on the nature and
financial conditions of the project. this must be
done through sales material containing as a
minimum the articles of association of the
company that will be erecting the wind tur-
bine, a detailed construction and operating
budget, including the financing for the project,
the liability per share, and the price of the
shares on offer. the sales material must be
quality-assured by a state-authorised public
accountant. energinet.dk must approve the
sales material as a condition for the wind tur-
bine erector obtaining the price supplement
provided for in the Danish Promotion of
Renewable Energy Act.
the wind turbine erector must run through the
sales material at an information meeting con-
vened with a reasonable period of notice by
announcement in a local newspaper. Following
the information meeting, local citizens have a
period of four weeks to make a purchase offer.
in the case of both the loss-of-value and
option-to-purchase schemes, transitional regu-
lations exempting wind turbines where the
municipality has published a supplement to the
municipal plan with an associated eia or
announced that the project does not require an
eia apply until 1 march 2009. the wind turbine
project must also be connected to the grid
before 1 september 2010.
6.D. The greeN scheme
in order to further promote the local council’s
commitment to wind turbine planning and
local acceptance of new wind turbine projects,
the Danish Promotion of Renewable Energy
Act has introduced a green scheme for the
financing of projects that enhance the scenery
and recreational opportunities in the municipal-
ity. energinet.dk, which administers the
scheme, pays dkk 0.004 per kwh for the first
22,000 full-load hours from wind turbine
projects that are connected to the grid on 21
February 2008 or later. the money for the
green scheme is recouped from electricity con-
sumers as a Pso contribution.
the money is lodged in a special account for
the given municipality; the amount of money
depends on how many wind turbines and of
what size are connected to the grid in the
municipality. a wind turbine of 2 mw gener-
ates a total sum of dkk 176,000. in order to
24
Gisselbæk, standpunkt 1. Afstand til nærmeste mølle omkring 1,6 km Øverst: Oprindeligt VVM-forslag (3 stk 1,75 MW møller med en totalhøjde på 93 m)Nederst: 3 stk 3,6 MW møller med en totalhøjde på 150 m
Photos: Visualisations by birk nielsen
Visualisations are an important element of an Environmental
Impact Assessment (EIA) for new onshore wind turbine
projects, and the method has been described in the report
Store vindmøller i det åbne land – en vurdering af de landska-
belige konsekvenser (Large wind turbines in the open country-
side – an assessment of implications for the landscape). This
example from the project in gisselbæk illustrates the difference
between a project with 3 x 1.75 MW wind turbines, each with
a total height of 93 metres (top), and a layout of 3 x 3.6 MW
wind turbines, each with a total height of 150 metres. The dis-
tance from the observer to the nearest wind turbine is 1.6 kilo-
metres.
The visualisations were produced using a wind turbine model
taken from the list in the WindPro software program: Siemens
Wind Power’s 3.6 MW wind turbine. The report’s visualisation
examples assume that the turbines have a standard grey anti-
reflective coating. The spacing is three times the rotor diame-
ter, which is recommended in respect of the wind turbine
project’s own aesthetics and to avoid problems with turbu-
lence. For 3.6 MW wind turbines, this means a distance
between the wind turbines of 321 metres.
EXHIBIT A5-3
Page 23 of 32
- - ~ _,_,_z;.. - -
~ ~ - Tr""~ -= . , ---; ........ . - . ..
~-.- • .. l • -· --
.A
- - ~ - - -- - - --=- -
~ ~ •- t ---- --- . ' -----; -- . ~ . .
.._,- • •. l --- -
005109
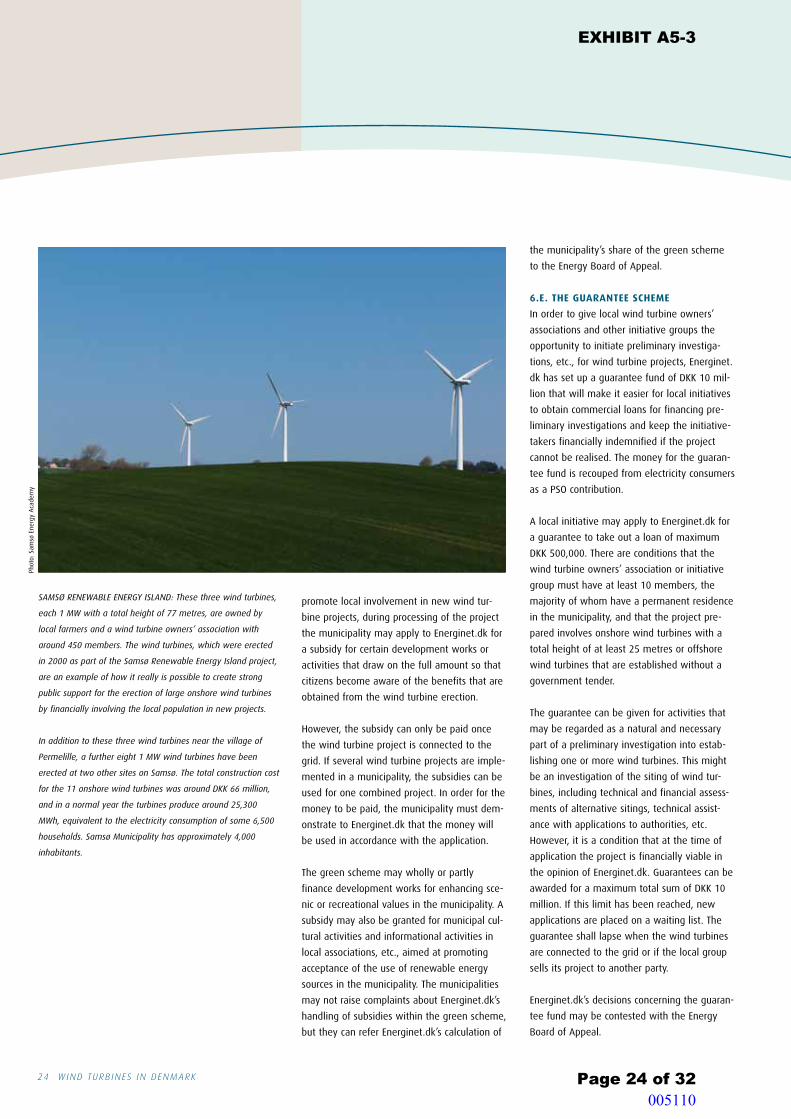
24 w ind turb ines in denmark
Phot
o: s
amsø
ene
rgy
aca
dem
y
SAMSØ RENEWABLE ENERgy ISLAND: These three wind turbines,
each 1 MW with a total height of 77 metres, are owned by
local farmers and a wind turbine owners’ association with
around 450 members. The wind turbines, which were erected
in 2000 as part of the Samsø Renewable Energy Island project,
are an example of how it really is possible to create strong
public support for the erection of large onshore wind turbines
by financially involving the local population in new projects.
In addition to these three wind turbines near the village of
Permelille, a further eight 1 MW wind turbines have been
erected at two other sites on Samsø. The total construction cost
for the 11 onshore wind turbines was around DKK 66 million,
and in a normal year the turbines produce around 25,300
MWh, equivalent to the electricity consumption of some 6,500
households. Samsø Municipality has approximately 4,000
inhabitants.
promote local involvement in new wind tur-
bine projects, during processing of the project
the municipality may apply to energinet.dk for
a subsidy for certain development works or
activities that draw on the full amount so that
citizens become aware of the benefits that are
obtained from the wind turbine erection.
However, the subsidy can only be paid once
the wind turbine project is connected to the
grid. if several wind turbine projects are imple-
mented in a municipality, the subsidies can be
used for one combined project. in order for the
money to be paid, the municipality must dem-
onstrate to energinet.dk that the money will
be used in accordance with the application.
the green scheme may wholly or partly
finance development works for enhancing sce-
nic or recreational values in the municipality. a
subsidy may also be granted for municipal cul-
tural activities and informational activities in
local associations, etc., aimed at promoting
acceptance of the use of renewable energy
sources in the municipality. the municipalities
may not raise complaints about energinet.dk’s
handling of subsidies within the green scheme,
but they can refer energinet.dk’s calculation of
the municipality’s share of the green scheme
to the energy board of appeal.
6.e. The guaraNTee scheme
in order to give local wind turbine owners’
associations and other initiative groups the
opportunity to initiate preliminary investiga-
tions, etc., for wind turbine projects, energinet.
dk has set up a guarantee fund of dkk 10 mil-
lion that will make it easier for local initiatives
to obtain commercial loans for financing pre-
liminary investigations and keep the initiative-
takers financially indemnified if the project
cannot be realised. the money for the guaran-
tee fund is recouped from electricity consumers
as a Pso contribution.
a local initiative may apply to energinet.dk for
a guarantee to take out a loan of maximum
dkk 500,000. there are conditions that the
wind turbine owners’ association or initiative
group must have at least 10 members, the
majority of whom have a permanent residence
in the municipality, and that the project pre-
pared involves onshore wind turbines with a
total height of at least 25 metres or offshore
wind turbines that are established without a
government tender.
the guarantee can be given for activities that
may be regarded as a natural and necessary
part of a preliminary investigation into estab-
lishing one or more wind turbines. this might
be an investigation of the siting of wind tur-
bines, including technical and financial assess-
ments of alternative sitings, technical assist-
ance with applications to authorities, etc.
However, it is a condition that at the time of
application the project is financially viable in
the opinion of energinet.dk. Guarantees can be
awarded for a maximum total sum of dkk 10
million. if this limit has been reached, new
applications are placed on a waiting list. the
guarantee shall lapse when the wind turbines
are connected to the grid or if the local group
sells its project to another party.
energinet.dk’s decisions concerning the guaran-
tee fund may be contested with the energy
board of appeal.
EXHIBIT A5-3
Page 24 of 32 005110

wind turb ines in denmark 25
FactboxThe scrapping scheme
Part of the current projects involving new
onshore wind turbines is being carried out under
the scrapping scheme, which was agreed in the
Energy Policy Agreement of 2004. older and less
efficient wind turbines with an output of maxi-
mum 450 kw can be dismantled in return for
a scrapping certificate giving an erector the right
to an extra supplement of dkk 0.08 per kwh for
12,000 full-load hours for new wind turbines
with a total output up to twice as high as that
of the dismantled turbines.
the scrapping scheme covers wind turbines
totalling 175 mw, equivalent to the erection of
new wind turbines with scrapping certificates for
a total of 350 mw.
the scheme for earning scrapping certificates
and redeeming them for new projects is ad-
ministered by energinet.dk, which also pays the
price supplements connected with the scrapping
scheme as a Pso-financed contribution.
The Vattenfall electricity company, which is the larg-
est owner of Danish onshore wind turbines, was also
responsible for the largest project under the scrapping
scheme at Nørrekær Enge, where 77 older wind tur-
bines were replaced with 13 x 2.3 MW turbines. In
the photo, the installers are setting up one of the
new wind turbines, which were connected to the grid
in 2009.
Phot
os: m
ogen
s H
olm
gaar
d/Va
tten
fall
win
d Po
wer
6.F. eNergINeT.DK’s FrONT OFFIce
in order to ensure smooth, efficient administra-
tion of the four new schemes, energinet.dk has
set up a Front office to take care of all direct
contact with users of the schemes, while
energinet.dk’s technical experts (back offices)
undertake the actual legal and financial case-
handling. in order to make the work easier for
wind turbine erectors, neighbours and munici-
palities, there is a link (in danish only) on the
energinet.dk website to a small library where all
relevant application forms and other documents
can be downloaded via the menu item “nye
vindmøller – hjælp til ejere, naboer og kom-
muner m.fl.” (new wind turbines – help for
owners, neighbours and municipalities, etc.).
the website also gives access to information
(in danish only) on the new schemes: the
menu item “kunder” (Customers) gives access
to information and material on the loss-of-val-
ue scheme and the option-to-purchase
scheme, while the menu item “klima og miljø”
(Climate and the environment) gives access to
information on all four schemes via the sub-
menu “Danish Promotion of Renewable Energy
Act”. the Front office staff can be contacted
during business hours (9:00 am to 3:00 pm) by
telephone on +45 70 20 13 53, or by e-mailing
the majority of initial inquiries have been
about the loss-of-value scheme. in the first
project to pass through the scheme’s proce-
dures, around half of the neighbours who
made a claim for compensation obtained a vol-
untary settlement with the wind turbine erec-
tor, while the valuation authority has been
involved in the other claims. Compensation
was paid in two cases, while two claims were
rejected. the valuation authority’s specific deci-
sions, which are published in anonymous form,
can be monitored via the website www.taksa-
tionsmyndigheden.dk (in danish only).
the website www.energinet.dk also contains
a summary of the individual municipalities’
accounts in the green scheme so that you can
see whether a municipality currently has funds
available for projects and activities. l
EXHIBIT A5-3
Page 25 of 32 005111

26 w ind turb ines in denmark
7. tariFFs For eleCtriCity ProduCed by wind turbines
Factbox Tariffs for electricity produced
by wind turbines
the development of wind power in denmark has
been promoted since the late 1970s by paying
wind turbine owners a supplement to the elec-
tricity production price. even though the electric-
ity market in denmark was liberalised in 1999 so
that the market price could fluctuate according
to supply and demand, the wind turbine owners
were guaranteed a fixed feed-in tariff.
in the Energy Policy Agreement of 2004 the
wind turbine owners’ production subsidy was
established as a supplement to the market price
of dkk 0.10 for 20 years. in the energy Policy
agreement of February 2008 it was decided to
increase the production subsidy to make it more
attractive to erect onshore wind turbines.
as the 4,700 or so onshore wind turbines were
erected at different times, the production subsidy
varies depending on the date of grid connection
and the size of the wind turbines. the detailed
conditions are set out in the Danish Promotion
of Renewable Energy Act, which contains all the
tariffs for electricity produced by wind turbines.
new onshore wind turbines connected to the
grid after the Energy Policy Agreement of 21
February 2008 receive a supplement to the mar-
ket price of dkk 0.25 per kwh. this supplement
applies for the first 22,000 full-load hours, after
which the wind turbine owner only receives
the market price. Furthermore, a supplement of
dkk 0.023 per kwh is paid to cover balancing
costs for the full lifetime of the wind turbine.
new wind turbines established with a scrapping
certificate receive an extra supplement of dkk
0.08 per kwh for 12,000 full-load hours.
offshore wind turbines established under an open-
door procedure receive the same supplement as
new onshore wind turbines, i.e. dkk 0.25 per kwh
plus dkk 0.023 per kwh. in the case of offshore
wind turbines established as part of a government
tender, the supplement depends on the price at
which the tendering party is prepared to produce
electricity. this price will usually depend on the
estimated construction costs, the local wind condi-
tions, and the project developer’s financing terms.
7.a. The NeeD FOr FINaNcIal suppOrT
FOr WIND TurbINe elecTrIcITy
right from the late 1970s, there has been
financial support for electricity produced by
wind turbines. in the early years, this support
took the form of both installation grants and
electricity production subsidies. since the
beginning of the 1990s, the support has taken
the form of a guaranteed feed-in tariff or a
supplement to the market price. the support is
offered as compensation for wind turbine own-
ers because electricity production from wind
turbines still cannot compete financially with
conventional production at power plants using
coal, natural gas or oil.
the current supplement to the market price is
paid by energinet.dk, which recoups the sum
as a public service obligation (Pso). the
amount is indicated on electricity bills. in
recent years, when the average market price in
the nordic spot market has been fluctuating
between dkk 0.20 and 0.35 per kwh, the Pso
tariff has been around dkk 0.10 per kwh. as
well as wind turbines, which receive around
half of these Pso contributions for environmen-
tally friendly electricity production, the contri-
butions are also spent on supporting decentral-
ised CHP plants, electricity production from bio-
mass, solar power, etc.
7.b. prIce supplemeNTs FOr
ONshOre WIND TurbINes
the price supplement for electricity produced
by wind turbines is regulated in the Danish
Promotion of Renewable Energy Act in accord-
ance with the Energy Policy Agreement of 21
February 2008. Here, a broad political majority
in the danish Parliament agreed to increase
the supplement to make it more attractive to
erect onshore wind turbines. the electricity
produced is supplied to the electricity supply
grid, and the turbine owner sells the actual
electricity on the market under market condi-
tions. a dkk 0.25 supplement to the market
price is paid for electricity produced by wind
turbines connected to the grid on or after 21
February 2008. the price supplement applies
for the first 22,000 full-load hours. Further-
more, a supplement of dkk 0.023 per kwh is
paid to cover balancing costs throughout the
turbine’s lifetime.
in the case of wind turbines that were connect-
ed to the grid before 21 February 2008, there
are special regulations that depend on the date
of connection and the size.
Household wind turbines and small turbines,
i.e. wind turbines with an output of less than
25 kw, that are connected in a household’s own
consumption installation, receive a price sup-
plement which, together with the current mar-
ket price, amounts to dkk 0.60 per kwh.
if a wind turbine erector has earned or pur-
chased scrapping certificates from older wind
turbines with an output of 450 kw or less and
dismantles the turbines in the period 15
december 2004 to 15 december 2010, the
erector may receive a scrapping price supple-
ment of dkk 0.08 per kwh, which is added to
the general price supplement of dkk 0.25 per
kwh. the scrapping price supplement is paid for
the first 12,000 full-load hours at double the
dismantled wind turbine’s output. the supple-
ment is conditional on the wind turbine being
connected to the grid by 31 december 2010.
7.c. prIce supplemeNTs FOr
OFFshOre WIND TurbINes
the price supplement for electricity produced
by offshore wind farms established as part of a
government tender is determined as part of
the given tender. the winners of the tenders to
date have been the bidders that could offer the
lowest feed-in tariff. in the two government
tenders carried out so far, the feed-in tariff for
Horns rev ii, which is owned by donG energy,
was set at dkk 0.518 per kwh for 10 twh, cor-
responding to around 50,000 full-load hours,
and the feed-in tariff for rødsand ii, which is
owned by e.on ab, was set at dkk 0.629 per
kwh for 10 twh, corresponding to around
50,000 full-load hours. wind turbines estab-
lished under an open-door procedure receive
the same price supplement as new onshore
wind turbines, i.e. dkk 0.25 per kwh for 22,000
full-load hours plus dkk 0.023 per kwh for the
full lifetime of the turbine. l
EXHIBIT A5-3
Page 26 of 32 005112

w ind turb ines in denmark 27
8. inCorPoration oF wind Power into tHe eleCtriCity system
8.a. varyINg elecTrIcITy prODucTION
OF WIND TurbINes
over the decades denmark has built up a well-
functioning electricity system that gives con-
sumers technical supply reliability that is
among the best in the world. the electricity
system has traditionally been based on a limit-
ed number of large thermal power stations
whose heat surplus is used to feed the district
heating supply of the largest towns. in the last
15-20 years this set-up has changed signifi-
cantly, with the predominant proportion of
new capacity being established as decentral-
ised CHP plants, waste-based CHP plants, and
wind turbines. this decentralised electricity
production set-up has required the develop-
ment of new methods for controlling and regu-
lating the electricity system.
with a total installed capacity of around 3,200
mw, wind turbines today can annually cover
around 20% of domestic electricity supply. by
way of example, to cover around half of the
electricity consumption with wind power in
2025 would require an increase to around
6,700 mw.
with the current wind turbine capacity there are
already periods of the year when the electricity
production of the wind turbines exceeds the
total danish consumption. this occurs in particu-
lar at night, when the wind blows strongly.
in a european context, denmark is located
between norwegian and swedish systems
dominated by hydroelectric power and a conti-
nental system dominated by thermal power
stations south of the border. in Germany, the
netherlands and belgium, as well as in norway
and sweden, there are currently plans for a
major development of wind power, and the
danish electricity system will therefore assume
an important role in linking areas with hydroe-
lectric power, wind power and thermal electric-
ity production respectively. the cross-border
connections from denmark to norway, sweden
and Germany currently play a key role in opti-
mum utilisation of the fluctuating electricity
production of the wind turbines. when it is
windy in denmark and electricity consumption
is relatively low, denmark exports electricity to
norway and sweden, which turn down their
hydroelectric power stations’ turbines accord-
ingly. in this way the hydroelectric power sta-
tions’ water reservoirs function as an indirect
store for wind-power-produced electricity
because the hydroelectric power stations can
quickly increase their production when the
wind turbines can no longer cover such a large
proportion of electricity consumption.
as the electricity system also has to be able to
supply danish consumers in periods when
danish wind turbines are not producing due to
a lack of wind or storms, the system can either
be fed by thermal power stations or via cross-
border connections. in this way, the develop-
ment of strong cross-border connections acts as
an alternative to danish back-up capacity with
thermal power stations.
an anticipated major development of danish
wind power capacity increases the need to
develop methods and means to make electrici-
ty consumption more flexible so that electricity
consumers are encouraged to reduce consump-
tion in periods of low production capacity in
return for increasing consumption when produc-
tion is high. Practical trials have demonstrated
various forms of flexible electricity consump-
tion: electric heat consumers can be switched
off for a few hours without inconvenience; cold
stores can switch off the electricity supply with-
out the temperature increasing to a critical
level; washing machines and dishwashers in
private homes can be switched on when elec-
tricity prices are low; and so on.
However, a greater effect on the electricity sys-
tem’s overall flexibility can be achieved by
integrating electric car batteries and heat
pumps into a flexible electricity consumption.
this will help reduce denmark’s greenhouse
gas emissions from the sectors of society that
are not covered by the european Co2 quota
regulation. (the european quota regulation reg-
ulates Co2 emissions for large dischargers such
as electricity and heating plants and energy-
intensive industry.) Given that from 2013
denmark will have a special climate emission
Photos: ricky John molloy/energinet.dk
gREAT BELT ELECTRICITy LINK: In order to be able to connect up
the two separate parts of Denmark into one electricity system,
work has been carried out in recent years on an electricity link
under the great Belt. The link is expected to begin operating in
2010 with a transmission capacity of 600 MW, equivalent to
about one tenth of the total Danish electricity consumption on
a cold winter’s day.
The great Belt link has a construction budget of approximately
DKK 1.2 billion and estimated annual operating costs of just
over DKK 100 million. This is regarded as a good investment for
Danish society because the link will make it possible to exploit
Danish wind turbine power more efficiently within Denmark.
The link will also reduce the need for reserve production capac-
ity in the electricity system and increase competition in the
electricity market.
The electricity link consists of a 32 km underwater cable and
two land cables of 16 km on Funen and 10 km on Zealand. The
link will run from Fraude on Funen to Herslev on Zealand.
The above photos show the underwater cable being laid in
summer 2009.
EXHIBIT A5-3
Page 27 of 32 005113

28 w ind turb ines in denmark
target duty for the sectors that are not covered
by the quota system, the reduction of emis-
sions in these sectors will be of particular
value. at the same time, the transport sector is
still completely dominated by oil, from which
denmark has a long-term goal to free itself.
there are therefore environmental, supply-
related and economic benefits associated with
converting energy consumption from the sec-
tors that are not quota-regulated into electrici-
ty and district heating. at the same time, an
increase in electricity consumption’s share of
total danish energy consumption makes it pos-
sible to use a relatively larger proportion of the
electricity production from the wind turbines in
denmark, especially if this can be done with a
more flexible electricity consumption.
8.b. research INTO aN
INTellIgeNT eNergy sysTem
Converting the danish energy system requires
the introduction of more intelligent and self-
regulating methods for controlling the system.
in order to maintain a high technical level of
supply reliability there must be a constant bal-
ance between production/supply and con-
sumption in the danish electricity system. as
the electricity production from wind turbines
can be changed at very short notice, there is a
need for advanced communication between
production installations, the system operator
and consumers. the quicker and more effi-
ciently the system operator can regulate both
production and consumption, the lower the
energy system’s economic costs become.
in order to ensure this development of the
electricity system, for several years intensive
research has been carried out into advanced
methods for regulating the electricity system,
and danish research environments are among
the most competent in the world. Furthermore,
research is being undertaken into components
that make individual wind turbines easier to
regulate by the system operator. by combining
new advanced regulation methods with intelli-
gent electric meters installed in the premises
of consumers, the operation of the electricity
system can be optimised and it will be techni-
cally possible to incorporate ever greater
amounts of fluctuating electricity production
from wind turbines, wave power installations,
solar cells, etc. l
Centralt kraftværk
Havmøllepark
Signaturforklaring
EL
400 kV-luftledning, vekselstrøm
400 kV-kabel, vekselstrøm
Luftledning, jævnstrøm
Kabel, jævnstrøm
Transformerstation
Omformerstation
From 201060 kV
Owned by Svenska Kraftnät
and Energinet.dk
Owned by Statnett
and Energinet.dk
220 kV
150 kV
20 kV
Owned by Svenska Kraftnät
and Energinet.dk
132 kV-netteti Nordsjælland
Ejet af E.ON
Sverige og
Energinet.dk
150 kV
From
201
0
132 kV
209 MWHorns Rev 2
200 MWRødsand
160 MWNysted
160 MWHorns Rev 1
FIGUR 2.3 MØLLER FORDELT PÅ EFFEKT OG INSTALLATIONSÅR
ANTAL
0-225
226-499
500-999
1-
0
500
1000
1500
2000
2500
00-04 05-0995-9990-9485-8974-80
Key
400 kV overhead line, a/c
400 kV cable, a/c
Overhead line, d/c
Cable, d/c
Transformer station
Converter station
Fra 2010 60 kV
Ejet af Svenska Kraftnät
og Energinet.dk
Ejet af Statnett
og Energinet.dk
220 kV
150 kV
20 kV
Ejet af Svenska Kraftnät
og Energinet.dk
132 kV-netteti Nordsjælland
Ejet af E.ON
Sverige og
Energinet.dk
150 kV
Fra
2010
132 kV
illustration: energinet.dk
The map of Denmark from Energinet.dk shows the Danish high-
voltage grid and associated cross-border connections to
Norway, Sweden and germany. Strong cross-border connections
are regarded as a vital precondition for efficient utilisation of
the varying Danish electricity production from wind turbines.
Currently there are plans to expand the connections between
Denmark and Norway (Skagerak IV) and between Denmark
and germany. Furthermore, it is possible to expand the connec-
tions between Denmark, Sweden and germany by connecting
a large offshore wind farm on Kriegers Flak to the grid. A pos-
sible offshore wind farm south of Læsø could also pave the
way for a stronger connection between Jutland and Sweden.
And finally, work is being carried out on plans for an underwa-
ter cable connection between Denmark and the Netherlands
(Cobra), which in the long term would make it possible to carry
electricity production from Denmark and Danish offshore wind
farms in the North Sea to continental Europe.
Key
EXHIBIT A5-3
Page 28 of 32
@
III
t@ .......... -f@"' ~ ---.
t ,,,,\,,,,,,,,,
005114

w ind turb ines in denmark 29
FurtHer inFormation
energinet.dk’s Front office can be contacted during business hours (09:00 am to
3:00 pm) by telephone on +45 70 20 13 53, or by e-mailing [email protected].
the legal provisions on wind power can be found in the Danish Promotion of
Renewable Energy Act (l 1392, adopted by the danish Parliament on 27
december 2008), bill no. 55 of 5 november 2008 with explanatory notes.
both can be downloaded (in danish) from www.retsinformation.dk.
more detailed regulations on onshore wind turbines can be found in Circular
no. 9295 of 22 May 2009 on planning and rural zone permits for the erection
of wind turbines. the Circular and the associated guideline (no. 9296) can be
downloaded (in danish) from www.blst.dk/landsplan/vindmoeller.
the birk nielsen visualisation report entitled Store vindmøller i det åbne land
– en vurdering af de landskabelige konsekvenser (Large wind turbines in the
open countryside – an assessment of implications for the landscape) can be
downloaded (in danish) from www.skovognatur/udgivelser/2007/
storevindmoller.htm.
the report of the danish Government’s Planning Committee for onshore wind
turbines, published in 2007, can be downloaded in danish from www.blst.
dk/landsplan/vindmoeller/vindmoelleudvalg. an interactive map for
assistance with wind turbine planning can be accessed via www.blst.dk/
landsplan/vindmoeller/afstandskort.
an english summary of the report of the danish Government’s Committee for
Future offshore wind Power sites entitled Future Offshore Wind Power Sites –
2025, published in april 2007, can be downloaded from www.ens.dk/
en-us/supply/renewable-energy/Windpower/offshore-Wind-power/
Future-offshore-wind-parks/sider/Forside.aspx and the updated Offshore
Wind Turbine Action Plan 2008, published in april 2008, can be downloaded
(in danish) from www.ens.dk/da-DK/undergrundOgForsyning/
vedvarendeenergi/vindkraft/sider/Forside.aspx.
the danish ministry of the environment’s wind turbine secretariat has a website
at www.vind.mim.dk and can be contacted during business hours (09:00 am
to 4:00 pm) by telephone on +45 72 54 05 00, or by e-mailing [email protected].
EXHIBIT A5-3
Page 29 of 32
------.1_ .... __ ._.,_ ~~,.·------__, ____ _
-•F _____ _
----
_ ....... ... --·----
------. _.._ .. _ -- ··-·
--
i=ll
·~ ----
005115
30 w ind turb ines in denmark30 w ind turb ines in denmark
wind turbines in denmark is published by the danish energy agency,
november 2009
amaliegade 44, 1256 Copenhagen k
tel: +45 33 92 67 00, e-mail: [email protected]
danish energy agency website: www.ens.dk
editors: Pia C. Jensen of the danish energy agency and
steen Hartvig Jacobsen (member of the danish union
of Journalists) of kommunikationsbureauet rubrik
layout: montaGebureauet aps
Front page photo: samsø energy academy
isbn: 978-87-7844-821-7
EXHIBIT A5-3
Page 30 of 32 005116

wind turb ines in denmark 31
Phot
o: s
amsø
ene
rgy
aca
dem
y
wind turb ines in denmark 31
EXHIBIT A5-3
Page 31 of 32 005117

danish energy agency
amaliegade 44
dk-1256 Copenhagen k
tel: +45 33 92 67 00
Fax: +45 33 11 47 43
www.ens.dk
EXHIBIT A5-3
Page 32 of 32
DANISH dl)
EN~ R GY AGENCY
005118
Health effects related to wind turbine sound
Frits van den Berg
Public Health Service Amsterdam
Amsterdam, the Netherlands
Irene van Kamp
National Institute for Public Health and the Environment
Bilthoven, the Netherlands
Summary
This report reviews recent literature on health effects related to wind turbines. This has been done at the
request of the Swiss Federal Office for the Environment. The request was to give an overview of the
conclusions from the more recent scientific reviews with respect to the health effects of sound from wind
turbines. Questions about health effects often play a prominent role in local discussions on plans for (an
extension of) a wind turbine farm.
Noise annoyance is the most often described effect of living in the vicinity of wind turbines. Annoyance
from other aspects, such as shadow flicker, the visual (in)appropriateness in the landscape and blinking
lights, can add to the noise annoyance. Some people report annoyance (irritation, anger and anxiety) if they
feel that the quality of their surroundings and living conditions will deteriorate or has deteriorated due to the
siting of wind turbines. Long lasting annoyance can lead to health complaints. There are less data available
to evaluate the effects of wind turbines on sleep. Sleep disturbance is found to be related to annoyance, but
there is no clear relation with the level of wind turbine sound. From knowledge about transportation sound,
sleep disturbance can be expected at high levels of wind turbine sound. There is no evidence for other direct
health effects. Other (indirect) health effects that have been reported on an individual basis could be a result
of chronic annoyance.
These are the main conclusions of a literature survey performed by the Municipal Health Service (GGD)
Amsterdam and the Dutch National Institute for Public Health and the Environment (RIVM), both in the
Netherlands. Residential sound levels from wind turbines are lower than those from comparable sources,
such as traffic or industry, but are experienced as more annoying. This is possibly caused by the typical
swishing or rhythmic character of the sound. Perhaps the low frequency component of wind turbine sound
also leads to extra annoyance, as is the case with other sources. However, there is no evidence of an effect
specifically related to the low frequency component. It has been suggested that a direct effect of infrasound
on persons has been underestimated, but available knowledge does not support this. Perhaps the effect of
rhythmic pressure pulses on a building can lead to added indoor annoyance and should be further
investigated. Besides the wind turbine sound as such, personal characteristics, the local situation and the
conditions for planning a wind farm also play a role in reported annoyance. For example, at equal noise
levels, people report more annoyance when they can actually see a wind turbine; or less annoyance, when
they benefit from the wind turbine or farm. Other factors that should be taken into account when interpreting
annoyance scores are noise sensitivity, privacy issues and social acceptance.
1. INTRODUCTION
This text gives an overview of knowledge about
wind turbine sound and its effects on
neighbouring residents. It emphasizes knowledge
from scientific publications, where peer-reviewed
articles are most eminent. However, some
scientific reports and papers presented at
conferences also provide important and often
reliable information.
EXHIBIT A5-4
Page 1 of 29 005119

Health effects related to wind turbine sound p. 2
This overview is commissioned by the Noise and
NIR Division of the Swiss Federal Office for the
Environment (Bundesamt für Umwelt). The
request was to give an overview of the
conclusions from the more recent scientific
reviews with respect to the health effects of sound
from wind turbines with special attention to
infrasound and low frequency sound. We have
collected all relevant reviews since 2009, but
these did not include the most recent studies,
especially from Canada and Japan. For the period
between 2009 – 2015 only reviews were
considered. For the period between 2015 and 2017
the reviews as well as the original studies were
included. Where relevant we refer to earlier
original papers (before 2015).
We start in Chapter 2 with an explanation of the
sound produced by and heard from a wind turbine
and what sound levels occur in practice. We use
the term ‘sound’ because we do not want to imply
a priori the negative meaning that noise
(‘unwanted sound’) has. Other aspects of wind
turbines can cause annoyance by themselves or
can have an influence on the appreciation of the
sound; these other impacts are considered in
Chapter 3. Chapter 4 is about how sound from a
wind turbine can affect people and especially
neighbouring residents and in what way and to
what degree other factors are important to take
into account. This is repeated in Chapter 5 for
sound at (very) low frequencies that allegedly can
affect people in others ways that ‘normal’ sound
does.
In Chapters 3 through 5 we have taken
information from others without evaluating the
different research results. Our evaluation is in
Chapter 6 where our conclusions from reading and
interpreting all the scientific information are
summarised. This chapter concludes the main text.
In Annex A it is described how we retrieved all
relevant scientific information and all the articles
providing this information are listed in Annex B.
A reference to this list is given in the main text by
a small superscript number, with more references
separated by a comma or –when including a
range- a hyphen(e.g. 4, 6 or 7-10). When we use
author names, ‘et al’ means there are two or more
co-authors.
We thank Professor Geoff Leventhall and
Professor Kerstin Persson Waye for their useful
comments to an earlier version of this text.
2. THE SOUND
of WIND TURBINES
2.1 Sound production
An overview of wind turbine sound sources is
given in a number of publications such as
Wagner1, Van den Berg2, Leventhall and
Bowdler3 or Hansen et al4.
For the tall, modern turbines most sound comes
from flowing air in contact with the wind turbine
blades: aerodynamical sound. The most important
contributions are related to the atmospheric
turbulence hitting the blades (inflow turbulence
sound) and air flowing at the blade surface
(trailing edge sound).
Turbulence at the rear or trailing edge of a
blade is generated because the air flow at the
blade surface develops into a turbulent layer.
The frequency with the highest (audible)
sound energy content is usually in the range of
a few hundred Hz (hertz) up to around 1000-
2000 Hz. At the blade tips conditions are
somewhat different due to air flowing towards
the tip, but this tip noise is very similar to
trailing edge noise and usually not
distinguished as a relevant separate source.
Inflow turbulence is generated because the
blade cuts through turbulent eddies that are
present in the inflowing air (wind). This sound
has a maximum sound level at around 10 Hz.
Thickness sound results from the
displacement of air by a moving blade and is
insignificant for sound production when the
air flows smoothly around the blade.
However, rapid changes in forces on the blade
result in sideways movements of the blade
and sound pulses in the infrasound region.
This leads to the typical wind turbine sound
‘signature’ of sound level peaks at frequencies
between about 1 to 10 Hz. These peaks cannot
be heard, but can be seen in measurements.
2.2 Sound character
Inflow turbulence sound is important in the low
and middle frequency range, overlapping with
trailing edge sound at medium and higher
frequencies. As both are highly speed dependent,
sound production is highest where the speed is
highest: near the fast rotating tips of the blades.
EXHIBIT A5-4
Page 2 of 29 005120

Health effects related to wind turbine sound p.3
When the sound penetrates into a dwelling, the
building construction will attenuate the higher
frequencies better than the lower frequencies. As a
result, indoor levels will be lower and the sound
inside is of a lower pitch, as higher frequencies
are more reduced than low frequencies. This is
true for every sound coming from outside.
Wind turbine sound changes over time. An
important feature is the variation of the sound at
the rhythm of the rotating blades that is described
as swishing, whooshing or beating. This variation
in synchrony with the blade passing frequency is
also called the Amplitude Modulation (AM) of the
sound.
An explanation for the typical swish that is
audible close to a turbine has been given by
Oerlemans5. Because of the forward directivity of
trailing edge sound (more sound is radiated in the
forward direction of the blade) and the Doppler
amplification (forward of the moving blade) there
is a higher sound level when the blade tip is
moving towards an listener and a lower level
when it moves away. As a result, one can hear a
variation in sound level in the rhythm of the
passing blades. This swishing can always be heard
close to a turbine. However, this explanation does
not hold for an observer distant and downwind
from a turbine. In that case, there is no blade
moving towards the observer. But even at long
distances one can sometimes hear a rhythmic
variation that can develop into a distinct beating.6
In papers and reports this is sometimes referred to
as ‘other’ or ‘special’ AM.7,8 The explanation for
this ‘special’ AM is a change in wind speed over
the rotor diameter. When a blade encounters
different wind speeds in its rotation, this will lead
to a variation in sound production at the blade.
This will typically occur when there is a high
wind shear, i.e. the wind speed increases
substantially with height. Certainly at night there
can be a firm wind at rotor height even though
there may be almost no wind at ground level. It
can also occur when part of the rotor is in the
‘wind shadow’ of a ridge or another turbine. A
regular variation can explain a rhythmic beating.
This is most often heard in evening, night time
and early morning and when there is low cloud
cover, which implies a stable atmosphere and high
wind shear.6,8,9,10
AM may be terrain dependent: over hilly or
mountainous terrain wind shear may be rather
different from the wind shear over flat terrain.
Even so, with turbines on a ridge and residents in
a valley, a high contrast between wind turbine and
background sound may exist,11 similar to the
effect of a stable atmosphere over flat ground.
Wind turbine sound can sometimes be tonal, i.e.
one can hear a specific pitch. This can be
mechanical sound from the gear box and other
devices in the turbine and this was a relevant
source for early turbines. However, this has been
reduced and is generally not an important source
for modern turbines. Another possible source is an
irregularity on a blade, but this is apparently rare
and can be mended. Nevertheless, tonal sounds
still can occur.
2.3 Human hearing
Human hearing is relatively insensitive at low
frequencies as shown in figure 1: the upper part
gives the average hearing threshold; the lower part
shows which frequencies are in the infrasound and
low frequency sound region (the upper limit of the
low frequency region is not formally defined and
can vary from 80 to 200 Hz).
It is usual to apply a correction to a measured
sound that takes the hearing sensitivity at different
frequencies into account. This so-called A-
weighting mimics the frequency dependency of
human hearing at moderate loudness. Most
environmental sounds with a level of 40 dBA (A-
weighted deciBels) will approximately have the
Figure 1: above: the average hearing threshold
for normal hearing people from 2 – 1000 Hz
(figure from Møller and Pedersen12); below:
infrasound, low frequency sound and total
audible sound region (from SHC13)
EXHIBIT A5-4
Page 3 of 29
120
• 1100 ! i 80
j ; 60
i 40 .., , ~ 20
10 100 1000
0,2 20 200 2000 20000
Frequency (Hz)
005121

Health effects related to wind turbine sound p. 4
same loudness for human hearing. Such a low to
moderate loudness is present at actual wind
turbine sound levels at many residences near wind
farms. Therefore, A-weighting should give a
(nearly) correct approximation of the loudness of
wind turbine sound at levels of 35 to 45 dBA.
With hearing tests this was confirmed in the
Japanese wind turbine sound study.14 A-weighting
is less correct at lower sound levels; application of
A-weighting to low levels (roughly < 30 dBA)
may allow for more low frequency sound. Of
course, this concerns sound levels that are already
low and usually will comply with limits. If the
unit dB (no weighting) is used, as is often done at
low frequencies, then no correction is applied to
the sound level. If expressed in dBA (or dB(A), to
be more correct), the A-weighting has been
applied.*
It is because of the combination of our hearing
capacities at different frequencies and the sound
level of the different wind turbine sources that
trailing edge sound is the most dominant sound
when outside and not too far from a wind turbine.
The sound will shift to lower frequencies at larger
distances or indoors and then inflow turbulent
sound can be more important.
2.4 Sound levels in practice
For a modern turbine, the maximum sound power
level is of the order of 100 to 110 dBA. For a
listener on the ground at about 100 m from a
turbine the sound level will not be more than
about 55 dBA. At more distant, residential
locations this is less and in most studies there are
few people that are exposed to an average wind
turbine sound level of more than 45 dBA. For two
turbine types in a temperate climate it was shown
that the sound level from these two types at full
power is 1 to 3 dB above the sound level averaged
over a long time.15
Measurements on many types of modern wind
turbines show that most sound energy is radiated
at low and infrasound frequencies and less at
higher frequencies (approximately 100 – 2000
Hz). However, because of the lower sensitivity of
human hearing at low frequencies, audibility is
greater at the higher frequencies. Over time wind
turbines have become bigger and onshore wind
turbines now can have several megawatts (MW)
* However, in the EU a sound level averaged over day,
evening and night is expressed in dB Lden, although it is an
A-weighted level.
electric power. 2 MW turbines produce 9 - 10 dB
more sound power when compared to 200 kW
turbines.16,17 Over time the amount of low-
frequency sound (10 – 160 Hz) increases at nearly
the same rate as the total sound level. This also
depends on the type of regulation of the rotor
speed. For pitch regulated turbines the low
frequency part of the sound increases at a
somewhat higher rate (about 1 dB more for a
tenfold increase in power) when compared to the
total sound level and the reverse is true for stall
regulated turbines.
3. SOCIAL AND PHYSICAL
ASPECTS other than noise
In this chapter we mention a set of issues which
are, next to sound, relevant for residents living in
the vicinity of wind turbines. The visual aspect of
wind turbines, safety, vibrations and
electromagnetic fields may also have an impact on
the environment and people in it. Other factors
that influence the impact include economic
benefit, intrusion in privacy and acceptance of the
wind turbines and other sources of disturbance.
Personal and contextual aspects can also
determine the level of annoyance due to wind
turbines.
3.1 Visual aspects
Modern wind turbines are visible from a
considerable distance because they rise high
above the environment and change the landscape.
Due to the movement of their rotor blades, wind
turbines are more salient in the landscape than
objects which do not move. The rotating blades
draw our attention and can cause variations in
light intensity when the blades block or reflect
sunlight. The visual and auditory aspects have
been shown to be highly interrelated18,19,20 and are
therefore hard to unravel with respect to their
effects. Annoyance from visual aspects may add
to or perhaps even reinforce annoyance from noise
(and vice versa).
3.1.1 Integration of wind turbines in the
landscape
The visual perception of wind turbines is
associated to a number of factors such as the type
of area and sound level.19,20 The perception may
depend on the siting procedure and the attitude
towards wind energy projects.21 In other words:
the violation of the landscape is very dependent
EXHIBIT A5-4
Page 4 of 29 005122
Health effects related to wind turbine sound p.5
on the context and a univocal judgment cannot be
given. Integrating wind turbines in the landscape
is a factor of great importance and is related to
ideas people have about the landscape.22 Residents
have expectations and requirements regarding
their living environment and the visual
appreciation may vary between individuals from
positive to very negative. An exchange of
viewpoints between different parties (residents,
authorities, landscape planners, developers, etc.)
can clarify these aspects, but do not necessarily
lead to solutions. The type of area and its
geographical features are important: in a more
urban or industrial environment wind turbines will
be less intruding than in a more natural landscape
in which the turbines contrast more with the
environment.23,24 All of this can influence people’s
reactions and emotions: when the turbines are
perceived as not matching with the environment
the reactions can be more negative and vice versa.
The Belgian Superior Health Council stated that
people become attached to the place where they
live and a wind turbine or wind farm in ‘their’
place may mean an intrusion and deterioration of
that place.13 Also, siting a wind farm in a natural
or ‘green’ area may counteract the positive health
effect of such an area. These aspects should be
part of the siting procedure as it is too difficult to
quantify these effects, even in a specific
situation.13
3.1.2 Light flicker
Light flicker can occur when the sun is reflected
from a blade at a certain position of the blade.
When the blades rotate this gives a continuous
flicker. This is conspicuous and can be annoying.
However, this feature has become rare for modern
wind turbines, since it has become standard
practice to cover the rotor blades with an anti-
reflection layer.
Light intensity near a wind turbine can also
change when the blades pass before the sun. This
rotating shadow casting or shadow flicker (that
only stops when the turbine stops) will be
mentioned in Chapter 4 in relation to noise.
3.2 Safety
Wind turbines are under control of quality
protocols of the producers and the authorities
issue a construction permit based on rules for
safety. On a regular (yearly) basis wind turbines
are checked for their proper functionality. When a
shortcoming is found or when a safety issue
cannot be excluded the turbine has to be stopped.
A turbine also can be stopped automatically when
there is ice on the blades (which could be thrown
from a rotating blade). Nevertheless, there is a
chance that something will happen during the
lifetime of a turbine. From a large number of wind
turbine accidents, Asian et al conclude that most
serious accidents (deaths) occur during the
construction and maintenance of a wind turbine.25
During operation, when generating electricity,
natural influences (wind and lightning) are most
important, followed by system or equipment
failures.25 An early study in Switzerland on ice
throw from wind turbines showed that this was -at
that time- occurring regularly.26
3.3 Vibrations due to wind turbines
Vibrations from wind turbines can lead to ground
vibrations and these can be measured with
sensitive vibration sensors. In several studies
vibrations have been measured at large distances,
but this was because these vibrations could affect
the performance of seismic stations that detect
nuclear tests. These vibrations are too weak to be
detected or to affect humans, even for people
living close to wind turbines.27
3.4 Electromagnetic fields
Electric, magnetic and electromagnetic fields exist
everywhere. Known and natural forms are UV-
radiation, infrared radiation and visible light.
Electromagnetic fields (EMF) are also present
near electric devices and transport of electricity
over longer distances (such as power lines),
including underground cables that link a wind
turbine to the power grid. The strength of these
fields reduces when the distance to the source
increases. It is not plausible that the
electromagnetic field strength near wind turbines
and related underground cables form a health risk,
as this is similar to what is present in homes.19
3.5 Contextual and personal factors
Research in the past decade has shed some light
on the question why some people are more
disturbed by wind turbines than other. Next to
physical aspects, personal and contextual aspects
also influence the level of annoyance. Often these
aspects are referred to as non-acoustic factors,
complementary to the acoustic factors in decibels.
Because the term non-acoustic refers to a broad
range of aspects, and as a result are very
unspecific, we prefer the term personal and
EXHIBIT A5-4
Page 5 of 29 005123
Health effects related to wind turbine sound p. 6
contextual factors.28 They can be subdivided in the
following sub-categories:
Demographic and socio-economic factors (age,
gender, income, level of education);
Personal factors (fear or worry in relation to
source, noise sensitivity, economic benefit
from the source);
Social factors (expectation, attitudes towards
producers or government, media coverage);
Situational factors (frequency of sound events,
meteorological circumstances, other sound
sources, distance to amenities, attractiveness of
the area).
Some of these aspects are relevant in the
framework of wind turbines and are discussed in
more detail below.
3.5.1 View of wind turbines
Noise and visual annoyance are strongly related as
already mentioned above. People who also see
turbines from their homes might be more worried
about the health effect of continuous exposure and
as a consequence also report more annoyance.13
3.5.2 Economic aspects
Economic aspects can also affect annoyance from
wind turbines. In a study of Pedersen and Van den
Berg and colleagues in the Netherlands29,30 some
14% of the respondents benefited from one or
more wind turbines, in particular enterprising
farmers who lived in general closer to the turbines
and were exposed to higher sound levels than the
remaining respondents. In the subgroup of people
benefiting from the turbine the percentage of
annoyed persons was low to very low, even
though they were on average closer to the turbines
and hearing the turbines as well as others, using
the same terms to describe the typical
characteristics of wind turbine sound. In the study
this group was described as “healthy farmers”: on
average they were younger, more often male and
had a higher level of education and reported less
problems with health and sleep when compared to
those not having economic benefits.30 However, it
might not only be the benefit, but differences in
attitude and perception as well as having more
control over the placement of the turbines that
might play a role.30 In the Canadian study of
health effects from wind turbine sound, personal
benefit was also correlated to being less annoyed,
when excluding factors that were likely to be a
reaction (such as annoyance) to wind turbine
operation.20 In the Japanese study there was also a
relation, but this was less strong (i.e. not
significant).
3.5.3 Privacy and freedom of choice
Pedersen et al31 found that people who perceive
the wind turbines as intruders and a threat to their
privacy (motion, sound, visual) reported more
annoyance. When people feel attached to their
environment (‘place attachment’), the wind farm
can form a threat to that environment and this can
create resistance.32 Also, a feeling of helplessness
and procedural injustice can develop when people
feel they have no real say in the planning process.
Potentially this plays a role especially in rural
areas if people choose to live there because of
tranquillity; for them the wind farm can form an
important threat (visual and auditory). Moreover,
there is anecdotal report of growing polarization
between groups of residents which influences
individual positions and choices.
3.5.4 Noise sensitivity
Noise sensitivity refers to an internal state
(physiological, psychological, attitude, lifestyle
and activities) of a person that increases the
reactivity to sound in general. Noise sensitivity
has a strong genetic component (i.e. is hereditary),
but can also be a consequence of an illness (e.g.
migraine) or trauma. Also, serious anxiety
disorders can go together with an extreme
sensitivity to sound which can in turn increase a
feeling of panic.33
Only a few studies have addressed this issue in
relation to wind turbine sound. An early example
is a study in New Zealand, in which two groups
were compared (a ‘turbine group’ versus a control
group).34 Noise sensitivity was measured with a
single question informing whether people
considered themselves as noise sensitive. In the
turbine group a strong association was found
between noise sensitivity and annoyance and a
weak association in the control group. This shows
there may be an interaction between exposure and
sensitivity that has an effect on annoyance. This
has also been documented for other sound
sources.35 According to a case report from Thorne
(2014), a relatively high proportion of residents
near two wind farms in Australia were noise
sensitive. Self-selection into a “quiet area” by
noise sensitive people can be a plausible
explanation. Recent studies of Michaud et al20 and
Kageyama37 confirm the independent role noise
sensitivity has on the reaction to wind turbines
(see Chapter 4).
EXHIBIT A5-4
Page 6 of 29 005124

Health effects related to wind turbine sound p.7
3.5.5 Social aspects
For the social acceptance of wind turbine projects
by a local community the SHC stated it is crucial
how the community evaluates the consequences
for their future quality of life.13 The
communication and relation between the key
parties (residents, municipality, project developer)
is very important. Disturbance by wind turbines is
a complex problem, in which the objective
(physical) exposure and personal factors play a
role, but also policy, psychology, communication
and a feeling of justice.
When planning and participation are experienced
as unjust or inadequate, public support will soon
deteriorate also among people who were
originally neutral or in favour of the wind farm.38
When residents feel they have been insufficiently
heard, they feel powerless and experience a lack
of control over their own environmental quality
and quality of life. Worry or concern can be
reduced by an open and honest procedure in
which residents can contribute to the decisions in
a positive way.39 Already in the early phase of
wind energy, research from Wolsink40 and later
from Breukers41 showed that collaboration with
emphasis on local topics was more successful than
a policy aimed at as much wind energy as possible
and a non-participatory approach. According to
Chapman et al42 and Crichton et al43 there is a
strong psychogenic component in the relation
between wind turbine sound and health
complaints. This is not unique for wind turbine
sound but has been documented for other sources
as well (see e.g. 44,45,46).
Many researchers have investigated the social
acceptance of wind projects in a number of
countries, including Switzerland, by local
communities and many stress the relevance of a
fair planning process and local involvement.47-
50,133
4. WIND TURBINE SOUND
and HEALTH
This chapter summarizes the state of the art
regarding the knowledge available about the
association between wind turbine sound and
health. It is based on several literature searches
and systematic reviews recently performed in the
Netherlands.51,52 Using the same search method
(see annex A for full description), these searches
were updated with literature until February 2017.
Some papers from the most recent conference on
Wind Turbine Noise (May 2017) have been
added.
After a short explanation of the health effects
addressed in the literature, first the main findings
regarding noise annoyance, sleep disturbance and
other health effects described in key reviews
published until early 2017 are summarized. The
influence of personal, situational and contextual
factors on these effects is also included. Then, the
most recent studies (2015-2017) will be described
separately in more detail. These studies do not
appear in reviews yet but are of high value as they
build on earlier studies. The review is primarily
based on results from epidemiological studies at
population level, and smaller scale laboratory
experiments. In addition, examples of individual
stories are given, since they can enhance our
insight in the problems that people living near
wind turbines can experience.
4.1 Which effects have been studied?
People can experience annoyance from wind
turbine sound, or irritation, anger or ill-being
when they feel that their environmental quality
and quality of life deteriorates due to the siting of
wind turbines near their homes. This can lead to
long term health effects. Annoyance and sleep
disturbance are the most frequently studied health
effects of wind turbine sound as is also the case
for sound from other sources. In line with the
World Health Organization’s (WHO) definition53
of health as “a state of complete physical, mental,
and social well-being and not merely the absence
of disease or infirmity”, noise annoyance and
sleep disturbance are considered as health
effects.54,55
4.1.1 Overview of the effects studied and
mediating factors
The number of publications on wind turbine
sound and its health effects has increased
considerably in the past ten years, including peer
reviewed articles, conference papers and policy
documents. They include 19,56-62,134 and papers
from the Internoise and Wind Turbine Noise
conferences in the years 2011-2014.
In the past years a large number of reviews was
published. The number of experimental and
epidemiological studies was limited but recently
has been increasing. Recent and leading reviews
and policy documents draw comparable
conclusions about the health effects of wind
turbine sound: in general, an association is found
EXHIBIT A5-4
Page 7 of 29 005125
Health effects related to wind turbine sound p. 8
between the sound level due to wind turbines and
annoyance from that sound. Also, an association
with sleep disturbance is considered plausible,
even though a direct relation is still uncertain
because of the limited number of studies with
sometimes contradictory results. Next to sound,
vibration, shadow flicker, warning lights and other
visual aspects have been examined in the reviews.
Stress is related to chronic annoyance or to the
feeling that environmental quality and quality of
life has diminished due to the placement of wind
turbines, and there is sufficient evidence that
stress can negatively affect people’s health and
well-being in people living in the vicinity of wind
turbines.13 The literature is inconclusive about the
influence of low frequency sound and infrasound
on health. There are no studies available yet about
the long-term health effects. Such longitudinal
studies (studies comparing the situation at
different times) would be more suitable to gain
insight in the causality of the different factors.
Most recently, Onakpoya et al61 reanalysed the
data from eight cross sectional studies, selected on
strict quality requirements and including 2433
participants. Effects considered were annoyance,
sleep disturbance and quality of life. Evidence
supports the earlier conclusion that there is an
association between exposure to wind turbine
sound level and an increased frequency of
annoyance and sleep problems, after adjustment
for key variables as visual aspects, attitudes and
background sound levels. The strength of
evidence was the most convincing for annoyance
followed by sleep disturbance, comparing effects
at exposure levels below and above 40 dBA. The
findings are in line with Schmidt and Klokker62
and Janssen et al63, but not with Merlin et al19 who
concluded that the direct effect of wind turbine
sound on annoyance was weak and annoyance
was more strongly related to other (contextual)
factors.
The review of Harrison60 is primarily focused on
the health effects of low frequency sound and will
therefore be discussed in Chapter 5.
As stated in Chapter 3 personal and contextual
factors can influence annoyance. There is
consensus in the literature that visual aspects,
attitudes towards wind turbines in the landscape
and towards the people responsible for wind
farms, the process around planning and
construction and economic interest can all in their
own way affect levels of annoyance.
The next sections will describe the state of the art
in more detail per health effect. Note that the
description is limited to the effects of wind turbine
sound in general in the “normal” frequency range.
Findings from studies, addressing specific impacts
of the low frequency component and infrasound
distinct from “normal” sound are summarized
separately in Chapter 5.
4.2 Noise annoyance
In many countries the assessment of the sound of
wind turbines is based on average, A-weighted
sound levels (see Chapter 2). It is generally
accepted that annoyance from wind turbines
occurs at lower levels than is the case for transport
or industrial sound. Based on Dutch and Swedish
data an exposure-effect relation was derived
between calculated sound exposure levels
expressed in Lden and the percentage highly
annoyed, for in as well as outdoor exposures.
Later research in Poland64 and Japan65 have
confirmed these results and obtained comparable
results. The relation between wind turbine sound
level and annoyance can be compared with those
for road, rail, aircraft and industry. This
comparison is presented in figure 2 where the
wind turbine data are from Janssen et al63, the
‘aircraft Europe’ data from the European HYENA
study66 and the other data from Miedema and
Vos67 for industrial sound and from Miedema and
Oudshoorn68 for air, road and rail transportation
sound. The more recent HYENA study has shown
that at a number of big European airports noise
annoyance has increased when compared to the
older data from Miedema and Oudshoorn68.
Figure 2 shows that sound from wind turbines
leads to a higher percentage of highly annoyed
when compared to other sound sources. The
relation resembles that of air traffic sound, but
near airports there are higher sound levels and a
correspondingly higher percentage of highly
annoyed. The relations for transport sound in
figure 2 have been derived for large numbers of
persons from many countries, but the actual
percentage for a specific place or situation can be
very different, for wind turbines as well as other
sources.
Some think that it is too early to define exposure-
effect relations for wind turbines.13,69 According to
them, the influence of context (like residential
factors, trust in authorities and the planning
process, situational) and personal factors (such as
noise sensitivity and attitudes) is so strong that the
exposure-effect relation can only (or at best) give
EXHIBIT A5-4
Page 8 of 29 005126

Health effects related to wind turbine sound p.9
an indication of the percentage of highly annoyed
at the local level.19,59 This is not unique to wind
turbines, but is - to some degree - also true for
other sound sources and in part explains why in
specific places or situations the actual percentage
of annoyed persons can differ from the relations in
figure 2. Michaud et al20 compared the results
from five studies and found there was a 7.5 dB
variation in wind turbine sound levels that led to
the same percentage of annoyed persons.
What makes wind turbine sound so annoying?
In a Dutch survey30 performed in 2007 75% of the
respondents indicated that the terms
“swishing/lashing” gave the best description of
wind turbine sound, irrespective of their being
annoyed or not by the sound. Laboratory studies
have shown since a long time that the periodic
variation in the sound of wind turbines adds to the
annoyance. Already in 2002 annoying wind
turbine sound was described as ‘swishing’,
‘lapping’ or ‘whistling’ and the least annoying as
‘grinding’ and ‘low frequency’.70 In the UK
research was performed near three dwellings
where people complained about wind turbine
sound.71 Rather than the low frequency
component of the sound, amplitude modulation or
the rhythmic character was stated to be the most
conspicuous aspect of the sound. In a later UK
study Large and Stigwood132 concluded that
amplitude modulation is an important aspect of
the intrusiveness of wind turbine sound. More
recently Yoon et al72 stated that there is a strong
possibility that amplitude modulation is the main
reason why wind turbine sound is easily
detectable and relatively annoying.
Whether the type of environment affects the levels
of wind turbine annoyance is not yet clear. It can
be assumed that people in rural areas are more
likely to hear and see wind turbines than in more
built up urban areas with more buildings and a
less open view. However, Dutch research showed
that the percentage of highly annoyed people was
equally high in rural and urban areas,30 although
the correlation with the wind turbine sound level
was less strong in the built-up area.73 Only in rural
areas the presence of a nearby busy road led to a
reduction of the percentage annoyed residents by
wind turbine sound. In a Swedish study it was
found that residents in rural areas reported more
annoyance in rural areas than in urban
environments, possibly due to their expectation
that the rural area would be quiet.31.
The findings regarding low frequency sound and
infrasound are not easy to interpret. It may be
confusing that the frequency of the rhythmic
changes in sound due to amplitude modulation is
the same as the frequency of an infrasound
component. Also, some authors conclude that low
frequency sound and infrasound may play a role
in the reactions to wind turbine sound that is
different from the effects of ‘normal’ sound,74,75
though this is contested by many others. This
topic is discussed in Chapter 5.
4.3 Sleep disturbance
Good sleep is essential for physical and mental
health. Sound is one of the factors that can disturb
sleep or affect the quality of sleep. Several
biological reactions to night time sound are
possible: increased heart rate, waking up,
difficulty in falling asleep, and more body
movements (motility) during sleep.55 A Dutch
study found that wind turbine sound did not affect
self-reported sleep onset latency but did
negatively influence the ability to keep
sleeping.30,73 An increase in outdoor residential
sound level above 45 dBA increased the
probability of awakening. This was not the case
for people who obtained economic benefit from
the wind turbines, but this might also have been
an age effect (co-owners of the turbines were
younger). These findings of the study in the
Netherlands are in line with the conclusions which
the WHO drew from a review of scientific
literature on the relation between transportation
noise and sleep (Night Noise Guidelines55).
According to the WHO, sleep disturbance can
occur at an average noise level due to transport
noise at the façade at night (Lnight) of 40 dB and
Figure 2: Comparison of the percentage highly
annoyed residents from sound of wind turbines,
transportation and industry
(approach adapted from Janssen et al63)
EXHIBIT A5-4
Page 9 of 29
40
35
~ wind turbines
_._ aircraft Europe
--aircraft (old)
--- ind ustry
cly traffic
-t- tra ins
45 55
Lden in dB
65 75
005127

Health effects related to wind turbine sound p. 10
higher. This is similar to conclusions of research
into the relation between wind turbine sound and
sleep in the reviews mentioned above. The night
noise guidelines of the WHO are not specifically
and exclusively aimed at noise from wind turbines
but cover a whole range of noise sources. It is
conceivable that the relatively small sound peaks
just above the threshold for sleep disturbance due
to the rhythmic character of wind turbine sound
cause sleep disturbance.76
A direct association between wind turbine sound
and sleep disturbance can only be concluded on
when there is a measurable reaction to the sound.
Such an immediate influence is only plausible
when the sound level is sufficiently high and as
yet has not been convincingly shown for wind
turbine sound.19, 57,59 An indirect effect has been
shown between self-reported sleep disturbance
and annoyance from wind turbine sound, but not
between sleep disturbance and the sound levels
per se.73 Research has shown that also for other
sound sources there is a high correlation between
self-reported sleep disturbance and annoyance
from noise.77
Several more recent studies show an association
between quality of life and sleep disturbance and
the distance of a dwelling to a wind turbine.78,79
Differences in perceived quality of life were
associated with annoyance and self-reported sleep
disturbance in residents. These results are highly
comparable with those found for air and road
traffic (e.g. see 80).
4.4 Other health effects due to sound
In an Australian report36 the number of people
living in the vicinity of wind turbines with serious
health complaints was estimated to be 10-15%.
However, literature reviews on the health effects
of wind turbines13,19,56,57,58,59,61,62 conclude
differently. According to these reviews there is no
evidence for health effects caused by wind
turbines in people living in the vicinity of wind
turbines, other than annoyance and self-reported
sleep disturbance and the latter inconclusive.
There is however a correlation between
annoyance and self-reported sleep disturbance73
and perhaps other effects.19 Based on existing
field studies there is insufficient evidence that
living near a wind turbine is the direct cause of
health effects such as mental health problems,
headaches, pain, stiffness, or diseases such as
diabetes, cardiovascular disease, tinnitus and
hearing damage.
4.5 Influence of situational and
personal factors
Research in the past years has shed some light on
why some people are more disturbed by sound
from wind turbines than others. Apart from the
typical rhythmic character of the sound, visual
aspects contribute considerably to the negative
reactions to wind turbines. These characteristics
are often described as ‘intrusive’: especially the
swishing sound, the varying flicker and the
continuous movement of the blades.18 Also, the
diminishing level of road traffic sound at night
while a wind turbine sound level remains the same
or even increases at night might affect people’s
perceptions. People who can see the turbine from
their dwelling might report more annoyance
because they fear that the turbine will damage
their health.13
Personal and situational factors can play a role in
annoyance from wind turbines. From the literature
a broad range of factors emerges which has been
shown to influence annoyance: economic interest,
procedural fairness, unpredictability of the sound
due to weather conditions, fear for accidents,
attitudes towards the visual aspects, noise
sensitivity, social acceptance, and the feeling that
privacy is intruded, to name a few. Individual
reactions vary accordingly. There is a lot of
variation in the aspects studied and also the
strength of the evidence varies strongly. Recently
more attention was given to the influence of
expectations on the level of annoyance42,43 and the
level of awareness (‘notice’) of the characteristics
and prominent sounds of wind turbines.82 The
influence of all these factors is not unique for
wind turbine sound but has been found in many
studied regarding the effects of sound sources.78
4.6 Evidence since 2015
4.6.1 Health studies
In the period between January 2015 and 2017 21
relevant publications were identified in the peer
reviewed literature. These are nine papers on field
studies20,37,82-88, seven on experiments72,89,90-94,
three on a prospective cohort study95-97, one panel
study98 and one qualitative analysis of interviews
and discourse.99
Two major studies were performed in this period,
one in Canada20,82-86 and one in Japan37. These are
discussed in more detail in the next sections.
EXHIBIT A5-4
Page 10 of 29 005128

Health effects related to wind turbine sound p.11
4.6.2 Health Canada study
The study from Health Canada20,57,82-86 was
performed among 1238 adult residents living at
varying distances from wind turbines. A-weighted
sound levels outdoors were calculated as well as
C-weighted levels, and additional measurements
were made at a number of locations. A strong
point of the study is the high response rate of 79
percent. The results were presented in six
publications, addressing effects on sleep, stress,
quality of life, noise annoyance and health effects
and a separate paper on the effect of shadow
flicker on annoyance. Also, two papers were
published describing the assessment of sound
levels near wind turbines and near receivers.100,101
In one of these papers82 Michaud et al describe the
findings on annoyance, self-reported health and
medication use. In line with earlier findings the
study confirms that the percentage of residents
highly annoyed with wind turbines increased
significantly with increasing wind turbine sound
levels. The effect was highest for visual impact of
wind turbines, followed by blinking lights,
shadow flicker, sound and vibrations. Beyond
annoyance, results do not support an association
between exposure to wind turbine sound level (up
to 46 dBA) and the evaluated health-related
endpoints such as mental health problems,
headaches, pain, stiffness, or diseases such as
diabetes, cardiovascular disease, tinnitus and
hearing damage.
The paper of Voicescu et al85 on the same data set
studied the effect of shadow flicker, expressed as
the maximum duration in minutes per day, in
combination with sound levels and distance, on
annoyance and health complaints including
dizziness. As shadow flicker exposure increased,
the percentage of highly annoyed increased from
4% at short duration of shadow flicker (<10
minutes) to 21% at 30 minutes of shadow flicker.
Variables associated with the percentage highly
annoyed due to shadow flicker included concern
for physical safety and noise sensitivity. Reported
dizziness was also found to be significantly
associated with shadow flicker.
In a further paper, of Feder et al86, results for
quality of life (Qol) showed no effect at sound
levels up to 46 dB. QoL was measured using the
WHO Qol index that includes physical,
environmental, social quality and satisfaction with
health. This appears to be in contrast with findings
reported earlier by Shepherd et al78 and
Nissenbaum et al79, who did find significant
effects of distance on QoL. However, the results
of these studies are hard to compare because the
exposures are not the same (sound level or
distance) and because different instruments were
used to measure perceived quality of life.
Important moderating variables in the Canadian
study were economic benefit and annoyance from
visual aspects of the turbines. These variables
have been reported earlier by many other
researchers as far as noise annoyance is
concerned.31,32,102-104 In all these studies, being
highly noise sensitive was also related to more
annoyance. Similarly, the odds of reporting poor
QoL and dissatisfaction with health were higher
among those who were highly noise sensitive.
However, after adjustment for current health
status and work situation (unemployment) the
influence of noise sensitivity became marginal.
Michaud et al83 reported on sleep disturbance from
a field study involving 742 of the 1238
respondents wearing an actimeter, to measure
several relevant sleep quality indicators during 3-7
consecutive nights after the interviews. Outdoor
wind turbine sound levels were calculated
following international standards for conditions
that typically approximate the highest long-term
average levels at each dwelling. Neither self-
reported sleep quality, diagnosed sleep disorders
nor objective measures such as sleep onset
latency, awakenings and sleep efficiency showed
an immediate association with exposure levels up
to 46 dB (after adjustment for relevant
confounders such as age, caffeine use, BMI and
health condition). This partly contrasts with earlier
findings on subjective sleep measures.31 No other
study addressed objective sleep measure before,
so comparisons can only partly be made. The
method of actigraphy is limited as compared to
more elaborate polysomnographic measures as
were employed by Jalali et al96 and described
below (section 4.6.7).
Michaud et al also studied the association between
wind turbine sound level and objective stress
indicators (cortisol, heart rate) and perceived
stress (PPS index).84 The several stress indicators
were weakly associated with each other, but
analysis showed no significant association
between exposure to wind turbine sound levels
(up to 46 dBA) and self-reported or objective
measures of stress. McCunney et al56 also did not
find a significant association and the explanation
was that sound levels from wind turbines do not
reach levels to cause such direct effects. Bakker et
al did find an association between sound level and
EXHIBIT A5-4
Page 11 of 29 005129

Health effects related to wind turbine sound p. 12
psychological distress, but the actual association
was shown to be between noise annoyance and
distress.73
Finally, the role of personal and situational
aspects was studied using the Health Canada
data.20 Fear and concern about the potential harm
of wind turbines showed to be an important
predictor of annoyance as has been reported
earlier for other noise sources.45,105-107 Noise
sensitivity was also a strong and independent
predictor of annoyance. Having to close the
window in order to guarantee an undisturbed sleep
had by far the strongest influence on annoyance.
This could be a reason that no relation between
wind turbine sound level and sleep disturbance
was found: if persons disturbed at night by wind
turbine sound would close their bedroom window,
the result could be that they are less disturbed at
night, although they could be annoyed because
they had to close the window. The results do not
directly support or negate this explanation.
However, those closing their bedroom windows
were eight times more likely to be annoyed.
Elsewhere it is mentioned that at higher wind
turbine sound levels people more often reported
wind turbines as a reason for closing the bedroom
window.82
Personal benefit from wind turbines was
associated with reduced annoyance, in a
significant but modest way as was found by
others.29 Length of exposure seemed to be an
important situational factor and led up to 4 times
higher levels of annoyance for people living more
than one year in the vicinity of a wind turbine,
indication a sensitization to the sound rather than
adaptation or habituation as is often assumed. The
Canadian results show that the moderate effect of
wind turbine sound level on annoyance and the
range of (other) factors that predict the level of
annoyance implies that efforts aimed at mitigating
the community response to wind turbine sound
will profit from considering other factors
associated with annoyance.
4.6.3 Japan study
Kageyama et al report on a field study in Japan
with structured face to face interviews at 34 study
sites (with wind turbines) and 16 control sites (no
turbines).37 Wind turbine sound levels were
estimated based on previous measurements at
some sites and expressed as average sound levels
(LAeq). Outcomes studied were sleep deprivation,
sleep disturbance, and physical and mental health
symptoms. Analysis showed a significant
association between sound levels above 40 dB and
sleeping problems (insomnia). Self-reported noise
sensitivity and visual annoyance with wind
turbines were independently associated with
insomnia.
These findings are in contrast with those reported
by Michaud et al83 who did not observe an
immediate association between sound exposure
levels and subjective and objective indicators for
sleep. The earlier findings of Bakker et al
regarding subjective sleep indicators showed that
sleep disturbance seemed to be related to sound
level only when no others factors were included.73
When annoyance with wind turbine sound was
included, then sleep disturbance was related to
that annoyance and not anymore to sound level.
Earlier, Pedersen and Persson Waye also
concluded on an association between annoyance
and sleep disturbance rather than a direct effect
with sound levels.31
In the Japanese study poor subjective health was
not related to wind turbine sound level, but again
noise sensitivity and visual annoyance were
significant predictors for the effects studied. Both
noise sensitivity and visual annoyance seem to be
indicators of a certain vulnerability to
environmental stimuli or changes in
environmental factors.
In a later publication from the Japanese study it
was found that within 860 m from a wind farm
10% of the residents were annoyed by shadow
flicker while within 780 m 10% of the residents
were highly annoyed by wind turbine noise.108
The authors concluded that a minimum (or
‘setback’) distance between residences and wind
farms should be considered from an aural and
visual point of view.
4.6.4 Other field studies
In the period between January 2015 and February
2017 two smaller studies have been reported from
Denmark88 and Iran87. Starting with the first, a
survey was held among 454 citizens living in rural
areas at varying distances to wind turbine farms
with a varying numbers of wind turbines. The
study included idiopathic symptoms (i.e. not
related to a specific disease) as effects and
distance to the wind farm and the number of
turbines as a measure of exposure. An association
of distance with fatigue, headaches and
concentration problems all disappeared after
adjustment for exposure to sound and odour from
other sources.
EXHIBIT A5-4
Page 12 of 29 005130
Health effects related to wind turbine sound p.13
The Iranian study of Abassi et al did not include
residents, but 53 workers divided in three groups
with repairing, security and administration tasks.87
The exposure to wind turbine sound of employees
in each job group was measured as an eight-hour
equivalent sound level as is usual in working
conditions. Outcome measures included
annoyance, sleep, psychological distress and
health complaints. Noise sensitivity, age, job
stress and shift work were accounted for.
Annoyance was associated with measured sound
levels but lower than found in residential studies.
The other health outcomes did not show a
significant association. It is not clear how this
relates to residential conditions as the situations
are quite different and different factors are
involved.
More recently, at the Wind Turbine Noise
conference in May 2017, the first results were
published of a new British study that was held
near wind turbines in densely populated, suburban
areas.109 In this study part of the participants
received a questionnaire that included explicit
questions on the impacts of the local wind
turbines on well-being, and the remaining part
received a variant with no such questions. When
including all participants, there was less
annoyance from wind turbine noise in this study
compared to what was found in the earlier
(Swedish, Dutch, Polish and Canadian) studies in
rural areas. For the first group (with questions
concerning local wind turbines) the noise levels
were not significantly related to health problems
and this group reported less health problems and
better general health; this was opposite to the
relationship found in the other, variant group.
4.6.5 Laboratory studies
In the period 2015-2017 several laboratory studies
have addressed the effects of wind turbine sound
on annoyance. In a listening test among 60 people,
after a pilot with 12 people, Schäffer et al93 found
an association between wind turbine sound and
annoyance, but the annoyance levels were lower
than those reported by Janssen et al63 and Michaud
et al20. Attitude towards wind turbines as well as
noise sensitivity were important confounders, and
finally the frequency seemed to play an important
role.
The relative contribution of the typical
characteristics of wind turbine sound, and
especially the rhythmic character or amplitude
modulation (AM) was studied in several
experiments.
Ionannidou et al report on a study among 19
volunteers in which the effect of changes over
time in the amplitude modulation of wind turbine
sound on annoyance was investigated.91 The
changes could either be the frequency of the
modulation, the depth (or strength) of the
modulation, or a change in depth over time. The
study confirms earlier results that AM leads to a
higher annoyance rating. A higher modulation
frequency (from 0.5 to 2 Hz) also resulted in a
higher rating, but the effect was not significant.
There was also a higher annoyance rating when
the modulation depth increased intermittently, but
again this was not significant. Because of the
limited statistical power of this test (because of
the low number of participants and the limited
time), it was recommended to investigate the
variations in AM for a longer period and in a field
setting.
A study from Hafke-Dys et al among 21
volunteers again concerned the effect of amplitude
modulation on annoyance.90 In this study sounds
with several modulation conditions were used.
The test sounds used were 1) sound from moving
cars, passing at a rate of 1 to 4 per second; 2)
broadband sound with the same spectrum as wind
turbines and 3) narrowband sound that could be
modulated at 1, 2 and 4 Hz. All three types of
sound had modulation depths typical for wind
turbines at 3, 6 and 9 dB similar to Van
Renterghem et al81, or zero (no modulation).
Results showed that AM did increase annoyance
in the case of broadband sound and passing cars,
but not for the narrow band sound. The modulated
sound was more annoying with increasing
modulation frequency, in agreement with an
expected highest sensitivity for modulated sounds
at 4 Hz. Modern wind turbines modulate their
sound at a frequency close to 1 Hz. The effect of
AM on annoyance was less for the broadband
sound than for passing cars. The main difference
between these two sounds was the spectral
content, with the broadband sound having less low
frequency sound than the passing cars. The
authors conclude that this result supports the
Japanese study14 in which it was demonstrated
“that low frequency components are not the most
significant problem when it comes to the
annoyance perception of wind turbine noise”.
Yoon et al studied the reaction to modulation of
wind turbine sound in 12 people.72 Findings show
again that there is an association between AM and
level of annoyance. The authors conclude that
there is a strong possibility that amplitude
EXHIBIT A5-4
Page 13 of 29 005131

Health effects related to wind turbine sound p. 14
modulation is the main cause of two typical
properties of wind turbine sound: that it is easily
detectable and highly annoying at relatively lower
sound levels than other noise sources. They add
that this does not mean that these properties can
be fully explained by the amplitude modulation.
Maffei et al studied 40 people subdivided in a
group familiar for a long time with wind turbine
sound versus a group not familiar with wind
turbine sound.92 The study comprised a listening
test to sound recorded at a wind farm of 34 wind
turbines including background sound (wind in
vegetation), or only background sound. Sound
recordings of about 5 minutes duration were made
at five distances (150 up to 1500 m) from the
wind farm. For each distance 65 soundtracks were
used and characterized in terms of sound level and
the main psychoacoustical indexes (loudness,
fluctuation strength, sharpness, tonality and
roughness). The aim was to detect wind turbine
sound at varying distances. For both groups of
participants, familiar and unfamiliar, there was no
difference in recognition of wind turbine sound at
distances of 300 m or less and detection was
easiest at distances up to 250 m. At 1500 m those
familiar with wind turbine sound could detect the
sound better, but they also reported more often
‘false alarms’. Noise sensitivity was an important
factor.
In two studies the role of expectations was
investigated. Crichton et al89 studied 60 volunteers
at exposure levels up to 43 dBA (the New Zealand
standard limit) in combination with infrasound (9
Hz, 50 dB). In one group the participants were
shown a video about the health risk of wind
turbine infrasound, in the second group a video on
health benefits was shown. An effect on
annoyance was found only in the group expecting
to be negatively affected and in this group noise
sensitivity increased the likelihood of being
annoyed. In the group expecting a positive effect
there was far less annoyance and almost no
influence from noise sensitivity.
Tonin et al94 studied 72 volunteers in a laboratory
setting for a double-blind test similar to that of
Crichton et al89 but used infrasound at a higher
level (91 dB). Before the listening test,
participants were influenced to a high expectancy
of negative effects from infrasound with a video
of a wind farm affected couple, or a low
expectancy of negative effects with a video of an
academic explaining why infrasound is not a
problem. Then normal wind turbine sound was
presented via a headset to all participants with the
inclusion of the infrasound or no infrasound for a
period of 23 minutes. The infrasound had no
statistically significant effect on the symptoms
reported by participants, but the concern they had
about the effect of infrasound had a statistically
significant influence on the symptoms reported.
4.6.6 Other studies
Jalali et al report on a prospective cohort (i.e.
before - after) study with 43 participants who
completed a questionnaire in spring 2014 and
again a year later.95 Exposure to a wind farm was
only measured in terms of distance. Residents
who were annoyed by the sound or sight of
turbines, or who had a negative attitude towards
them or were concerned about property
devaluation, after one year experienced lower
mental health and quality of life, and reported
more symptoms than residents who were not
annoyed and had positive attitudes toward
turbines. The response rate for this study was low
(only 22%) and 12 people (of 43 that’s is
approximately 25%) were not in the second round.
Another weak point is the lack of a control group.
By the same authors, sleep disturbance was
measured in a group of 16 people for 2
consecutive nights.96 A polysomnographic method
was used, including a range of sleep and
physiological parameters such as sleep onset,
duration, movement during sleep, awakening,
EEG activity, etc. Sound measurements over the
whole frequency range (0.5 to 20.000 Hz) were
performed in the bedroom as well as outdoors,
while accounting for weather conditions, wind
speed and temperature. Factors that were taken
into account were attitude, sensitivity, visibility,
distance within 1000 meters and windows open
versus closed. Results showed no major changes
in the sleep of participants who had new wind
turbines in their community. There were no
significant changes in the average indoor (31
dBA) and outdoor sound levels (40-45 dBA
before, 38-42 dBA after) before and after the wind
turbines became operational. None of the
participants reported waking up to close their
windows because of the outside noise. The lack of
an effect might be explained by the limited
measurements (two nights) or the low indoor
noise levels that almost equalled the threshold
value for sleep disturbance of 30 dBA.
In a third paper Jalali et al report on the
association between measured wind turbine sound
levels and subjective sleep quality as measured
EXHIBIT A5-4
Page 14 of 29 005132
Health effects related to wind turbine sound p.15
with the Pittsburgh sleep quality index.97 Results
show only an indirect association with attitude
towards the wind turbines, concern about reduced
housing values and the visibility of the turbine
from the properties. The results confirm the strong
psychological component and individual
differences where it concerns sleep disturbance
from wind turbine sound.
Against the background of the increasing number
of wind farms in Germany, Krekel et al (2016)
investigated the effect of the presence of wind
turbines on residential well-being.98 This was
done by combining household data from the
German Socio-Economic Panel with a dataset on
more than 20.000 wind turbines for the time
period between 2000 and 2012. The key effect
studied was life satisfaction. Results showed that
the construction of one or more wind turbines in
the neighbourhood of households had a significant
negative effect on life satisfaction. This effect was
limited both in distance and time.
Botterill and Cockfield99 studied the discourse
about wind turbines in submissions to public
inquiries and in a small number of detailed
interviews, and topics addressed in the discourse.
Health and property values were found to be the
most prominent topics discussed with regards to
wind turbines (and aesthetics/landscape arguments
less often) but in interviews were never
mentioned.
4.7 Individual cases
Apart from the limited epidemiological studies
concerning the health effects of wind turbine
sound, personal narratives and case reports can
enhance our insight of (sound from) wind
turbines. The nuance and personal differences
often drown in the statistics. Also in surveys an
effect can be missed because it was not included
in the questionnaire or the effect is so rare that it
disappears.
In the literature a few examples have been found
where individual cases (‘case studies’) were
analysed in a systematic manner (e.g. 18,110,111).
People who object to this method often state that
only negative cases are presented. On the other
hand, such an analysis can add to our
understanding what exactly has triggered and
maintained negative reactions. According to some,
the extent, consistency and uniformity of
symptoms described in case studies can be
considered as preliminary epidemiological
evidence for an association between wind turbine
sound and sleep disturbance or other health
effects.111
Based on the case studies the following set of
indicators is mentioned more often:
1. Distance to the turbine;
2. Character of the wind turbine sound;
3. The way residents were treated during the
planning and construction process;
4. Health problems;
5. Sleep issues and accompanying problems.
4.7.1 Summary of three cases from the USA
The three cases described first are from Philips.111
The first case concerns a man with three children.
The wind turbines were placed one by one in the
course of time and the closest turbine is within
330 m from the dwelling. He describes the turbine
sound as loud and comparable with aircraft
sound.” It is a ‘woosh’ sound and it creaks, grinds
and bangs”. The sound is all around us and it goes
in all directions. It resembles an angry thing above
you which does not allow for any tranquillity. The
noise prevents you from thinking and the body is
not capable to adapt to it”. His children suffer
from sleep problems and have consequential
problems at school. Eventually the family moved
and the home was not saleable.
The second case concerns a woman and her son.
Within 3 km from her dwelling 16 turbines were
placed, the nearest one at 400 meters. She
describes the sound as continuous with daily
fluctuations. There is no way to escape from the
sound. In particular the shadows and flickers
through the window are irritating and she has
developed a hypersensitivity to motion (e.g. the
ventilator on the ceiling). Also, she developed
tinnitus and a pulsating feeling in neck and chest.
Other complaints are nausea, vertigo, hearing loss,
itchy eyes, high blood pressure, memory
problems, headaches, palpitations, painful joints
and sleeping problems: a sleep test showed 214
“disturbances” in six hours. The housing values in
the area have dropped considerably and the
woman often resorts to friends where they
immediately fall asleep. She indicates to be angry
and feels powerless and she is very disappointed
and feels badly understood by the government.
The third case is a man who lives within 500
meter from a wind turbine. He experiences
reduced quality of life. His complaints are fear,
nervousness sleep problems, hypertension,
tension, migraine, vertigo, bad vision, palpitation,
anger, stomach problems and depression. He
EXHIBIT A5-4
Page 15 of 29 005133

Health effects related to wind turbine sound p. 16
indicates that it is not about loudness but rather
about the typical characteristics of wind turbine
sound: It settles in “your head” and you wait for it
when it is not there. He indicates that it is not
possible anymore to sit in the garden and he uses
the term ‘turbine torture’. After being away for a
month the complaints were gone but started again
when he returned. The number of buyers of
dwellings in the area have reduced with 50%.
4.7.2 A case from the Netherlands
In the Netherlands, comparable reactions have
been reported as is shown on the online complaint
site (windmolenklachten.nl) and other sites. One
example is:52
“A few years the wind turbine is there, a gigantic
wind turbine just behind our house. As an
advocate of sustainable energy I originally have
tried to take a positive stand but this has gradually
disappeared and changed into a true dislike in the
sick making monster. With certain directions of
the wind with a force of 4 to 5 it sounds as if a
whole range of military aircrafts take off from our
garden. No sleep and the annoyance is getting at
you. We cannot take more of this, it is subsidized
terror. Time for action.”
4.7.3 Analysis of non-selected perceptions in
Sweden
In a Swedish study by Pedersen et al18 15
interviews were held with people selected from a
group of residents with varying levels of
annoyance due to wind turbine sound. The
information from these interviews has been
systematically analysed. The interviewees
described the wind turbines as intrusive and as
disturbing their privacy. This was primarily
related to the idea that the sound and visual
aspects did not match their living environment.
Also, it was judged as important that the
authorities did not take them seriously and they
felt treated in an unfair manner. The lack of
control and a voice created a feeling of being
powerless. Several strategies were used, with
varying results, to cope with this such as filing a
complaint, covering the verandas and trying to
ignore the sound
6. HEALTH EFFECTS SPECIFIC
for LOW FREQUENCY SOUND
and INFRASOUND
In the non-scientific literature, which can be found
on the internet, a range of health effects are
attributed to the presence of wind turbines.
Infrasound is described as an important cause of
these effects, also when the (infra)sound levels
must be very low or are unknown. In this chapter
the question is whether infrasound or low
frequency sound deserves special consideration
with respect to the effects of wind turbine sound.
There is some discrepancy when comparing
conclusions from the majority of scientific
publications to conclusions in popular
publications. Also, some scientific publications
suggest possible impacts that are not generally
supported.
First, we will consider the audibility of infrasound
and low frequency sound, then possible health
effects not involving audibility.
5.1 Audibility of infrasound and low
frequency sound
Audible low frequency sound is all around us, e.g.
in road and air traffic. Audible infrasound is less
ubiquitous, but can be heard from big machines
and storms. In most publications on wind turbine
sound there is agreement that infrasound and low
frequency sound are present in wind turbine
sound. Generally, it is acknowledged that
infrasound is inaudible as infrasound levels are
low with respect to human sensitivity (e.g. 12,19,112,113).
Even close to a wind turbine, most authors argue
that infrasound is not a problem with modern
wind turbines. This can be shown from
measurement results at 10 and 20 Hz. At the
(infrasound) frequency of 10 Hz the A-weighted
sound power level is typically 60 dB lower than
the total sound level in dBA.16 At a receiver with a
total sound level of 45 dBA this means that the 10
Hz sound level is about minus 15 dBA or, in
physical terms (not A-weighted), 55 dB. This is
far below the hearing threshold at that frequency,
which for normal-hearing persons is about 95 dB.
A sound of 55 dB at 10 Hz would also be
inaudible for the few persons that have been
reported with a much lower hearing threshold
(close to 80 dB)12. At 20 Hz, the upper frequency
limit of infrasound, the result, again at a receiver
EXHIBIT A5-4
Page 16 of 29 005134

Health effects related to wind turbine sound p.17
total sound level of 45 dBA, would be a physical
level of wind turbine sound of 50-55 dB which is
much lower than the normal hearing threshold at
that frequency of 80 dB.
As part of a Japanese study on wind turbine low
frequency sound, persons in a laboratory were
subjected to wind turbine sound where very low
frequencies were filtered out over different
frequency ranges.14 When infrasound frequencies
were filtered out, the study persons did not note
different sensations. Above about 30 Hz they
began to notice a difference between the filtered
and original sound.
Leventhall states that the human body produces
infrasound internally (through blood flow,
heartbeat and breathing, etc.) and this masks
infrasound from outside sources when this sound
is below the hearing threshold.114
In contrast to infrasound, there is general
agreement that low frequency sound is part of the
audible sound of wind turbines and therefore
contributes to the effects caused by wind turbine
sound. The loudest part of the sound as radiated
by a turbine is in the mid-frequency range (250-
1600 Hz)16,17. This shifts to lower frequencies
when the sound travels through the atmosphere
and enters a building because absorption by the
atmosphere and a building façade reduces low
frequencies less than higher frequencies.
However, studying the effects of the low
frequencies separately from the higher frequencies
is not easy as both frequency ranges automatically
go together: wind turbines all have very much the
same sound composition. In a Canadian study on
wind turbines the sound levels at the facades of
dwellings were calculated both as A- and C-
weighted sound levels, but this proved not to be
an advantage as the two were so closely linked
that there was no added value in using both.100 A
limit in A-weighted decibels (where the A-
weighting mimics human hearing at moderate
sound levels) thus automatically limits the low
frequency part of the sound.112 However, this may
not be true when the character of wind turbine
sound changes because of noise reduction
measures.
Bolin et al115 calculated and compared wind
turbine and road traffic sound over a broad
frequency range (0-2000 Hz) at sound levels
considered acceptable in planning guidelines (40
dB LAeq for wind turbine sound and 55 dB LAeq for
road traffic sound). Compared to road traffic
sound, wind turbine sound had lower levels at low
frequencies. Thus, at levels often found in urban
residential areas, low frequency sound from wind
turbines is less loud than from road traffic sound.
Recent measurements in dwellings and residential
areas show that similar levels of infrasound occur,
when comparing wind turbine sound with sound
from traffic or household appliances.116
5.2 Effect of lower frequencies
McCunney et al mention that both infrasound and
low frequency sound have been suggested to pose
possibly unique health hazards associated with
wind turbine operations.56 From their review of
the literature, including results from field
measurements of wind turbine sound and
experimental studies in which people have been
purposely exposed to infrasound, they conclude
that there is no scientific evidence to support the
hypothesis that wind turbine infrasound and low
frequency sound has effects that other sources do
not have.
5.3 Subaudible effects
The term ‘subaudible’ means that the level of a
sound is below the hearing threshold and thus
below the level it can be audible. Usually the
‘normal’ threshold (hearing threshold of young
adults without hearing problems, according to the
international standard ISO 326) is used. The
normal threshold is the hearing threshold
separating the 50% best hearing from the 50% that
hear less well. There is variation between
individuals, but for an individual often the normal
hearing threshold is taken as an indication, though
for that person of course the individual hearing
threshold is relevant.
Several authors have linked infrasound and low
frequency sound from wind turbines to health
effects experienced by residents, assuming that
infrasound can have physiological effects at levels
below the (normal) hearing threshold.110,117,118
This was supported by Salt and Kaltenbach119 who
argued that normal hearing is the result of inner
hair cells in the inner ear producing electric
signals to the brain in response to sound received
by the ear. However, infrasound and low
frequency sound (up to 100 Hz) can also lead to
signals from the Outer Hair Cells (OHC) and the
threshold for this is lower than for the inner hair
cells. This means that inaudible levels of
infrasound and low frequency sound can still
evoke a response.119 The OHC threshold is 60 dB
at 10 Hz and 48 dB at 20 Hz. Comparing this to
EXHIBIT A5-4
Page 17 of 29 005135

Health effects related to wind turbine sound p. 18
actual sound levels (see second paragraph of
section 5.1) shows that infrasound levels from
wind turbines could just exceed this OHC
threshold when their total outdoor sound level is
45 dBA. It is unlikely that the OHC threshold can
be exceeded indoors, where levels are lower,
except at a high sound level that may occur very
close to a wind turbine. Salt and Kaltenbach
conclude from this that it is ‘scientifically
possible’ that infrasound from wind turbines thus
could affect people living nearby.119 However, it
is not clear to what reactions these signals would
lead or if they could be detrimental when just
exceeding the OHC threshold. If such inaudible
sound could have effects, it is not clear why this
has never been observed with everyday sources
(other than wind turbines) that produce infrasound
and low frequency sound such as road and air
traffic. Or with physiological sounds from heart
beat, blood flow, etc. However, high infrasound
levels may be inaudible but can add energy to the
rhythmic ‘normal’ sound of a wind turbine and
thus make vibrations perhaps more likely (see
section 5.5).
Farboud et al120 conclude that physiological
effects from infrasound and low frequency sound
need to be better understood; it is impossible to
state conclusively that exposure to wind turbine
sound does not cause the symptoms described by
authors such as Salt and Hullar or Pierpont.
Leventhall114 argues that infrasound at low level is
not known to have an effect. Normal pressure
variations inside the body (from heart beat and
breathing) cause infrasound levels in the inner ear
that are greater than the levels from wind turbines.
From exposure to high levels of infrasound, such
as in rocket launches and associated laboratory
studies or from natural infrasound sources, there is
no evidence that infrasound at levels of 120 – 130
dB causes physical damage to humans, although
the exposure may be unpleasant.114
Stead et al come to a similar conclusion when
considering the regular pressure changes at the ear
when a person is walking at a steady pace.121 The
up and down movement of the head implies a
slight change in atmospheric pressure that
corresponds to pressure ‘sound’ levels in the order
of 75 dB. The pressure changes in the rhythm of
the walking frequency are similar in frequency
(close to 1 Hz) and level to the pressure changes
from infrasound at rotation frequencies measured
at houses near wind farms.
5.4 Vestibular effects
According to Pierpont the (infra)sound of wind
turbines can cause Visceral Vibratory Vestibular
Disease (VVVD), affecting the vestibular system
from which we derive our sense of balance.110 She
characterized this new disease with the following
symptoms: “a feeling of internal pulsation,
quivering or jitteriness, and it is accompanied by
nervousness, anxiety, fear, a compulsion to flee or
check the environment for safety, nausea, chest
tightness, and tachycardia”, stating that infrasound
and low frequency sound were causing this ‘wind
turbine syndrome’.110 Pierpont’s research was
based on complaints from 38 people from 10
families who lived within 300-1500 meter from
one or more turbines in the USA or Great Britain,
Italy, Ireland and Canada. In several publications
(e.g. 56,59) it was pointed out that Pierpont’s
selection procedure was to find people who suffer
the most, and it was not made clear that it was
indeed the presence of the wind turbine(s) that
caused these symptoms. Although the complaints
may be genuine, it is possible that very sensitive
people were selected and/or media coverage had
lead to physical symptoms attributed to
environmental exposures as has been
demonstrated for wind turbines42 and other
environmental exposures122. Van den Berg noted
that the symptoms of VVVD are mentioned in the
Diagnostic and Statistical Manual of Mental
Disorders (DSM) as stress symptoms in three
disorders: an adjustment disorder, a panic disorder
and a generalized anxiety disorder.76 The Wind
Turbine Syndrome or VVVD may thus not be a
new phenomenon, but an expression of stress that
people have and which could have a relation to
their concern or annoyance with respect to a
(planned) wind farm.
In his examination of the Wind Turbine Syndrome
Harrison argued that at a level of 40–50 dBA no
component of wind turbine sound approaches
levels high enough to activate the vestibular
system.60 The threshold for this is about 110 dB
for people without hearing ailments. In people
with a hearing ailment, particularly the ‘superior
(semi-circular) canal dehiscence syndrome’
(SCDS), this threshold is lower and can be 85 dB.
Such levels are only reported very close to wind
turbines. Reports show that 1 to 5% of the adult
population may have (possibly undiagnosed)
SCDS.
Schomer et al studied residents of three homes
who generally did not hear the wind turbines in
EXHIBIT A5-4
Page 18 of 29 005136

Health effects related to wind turbine sound p.19
their area, but they did report symptoms
comparable to motion sickness.123 Schomer et al
suggest that this could result from sound affecting
the vestibular sensory cells and in their opinion
wind turbine infrasound could generate a pressure
that they compare with an acceleration exceeding
the U.S. Navy's criteria for motion sickness. This
has been investigated by Nussbaum and Reinis
much earlier (1985).124 They exposed sixty
subjects to a tone of 8 Hz and 130 dB with high
distortion (high level harmonics at multiples of 8
Hz) or low distortion (harmonics at lower level).
Dizziness and nausea were primarily associated
with the low distortion exposure, i.e. a relatively
high infrasound content. In contrast, headache and
fatigue was primarily associated with the high
distortion exposure, with a relatively low
infrasound content. Nussbaum and Reinis
hypothesized that the effects of the purer
infrasound could be explained as acoustically
induced motion sickness. However, this was
concluded from exposure levels (130 dB) much
higher than wind turbines can cause.
5.4 Vibroacoustic Disease
According to Alves-Pereira and Castelo Branco
the infrasound and low frequency sound of a wind
turbine can cause Vibroacoustic Disease (VAD),
an affliction identified by a thickening of the
mitral valve (one of the valves in the heart) and
the pericardium (a sac containing the heart).117
The most important data regarding VAD are
derived from a study among aircraft technicians
who were professionally exposed to high levels of
low frequency sound. VAD is controversial as a
syndrome or disease. Results of animal studies
have only been obtained in studies using low
frequency sound levels which are found in
industrial settings. No studies are known that use
a properly selected control group. And finally the
way the disease was diagnosed has been criticized
because of a lack of precision.125
After investigating a family with wind turbines
between 322 and 642 m from their dwelling,
Castelo Branco et al concluded that VAD
occurred and was caused by low frequency
sound.126 The measured sound levels were
substantially lower (20 dB or more) than levels at
which VAD was thought to occur by Marciniak et
al127 and the spectral levels were below the normal
hearing threshold for a considerable range of
frequencies in the low frequency range. In their
review of evidence on VAD Chapman and St
George concluded that in the scientific community
VAD was only supported by the group who
coined the term and there is no evidence that
vibroacoustic disease is associated with or caused
by wind turbines.128
5.5 Vibrations due to sound
In measurements at three dwellings Cooper found
surges in ground vibration near wind turbines that
were associated with wind gusts, outside as well
as inside one of the three houses.129 Vibration
levels were weak (less than from people moving
around), but measurable. According to Cooper
two residents were clearly more sensitive than the
other four; the sensations experienced by the
residents seemed to be more related to a reaction
to the operation of the wind turbines than to the
sound or vibration of the wind turbines. This
echoes earlier findings from Kelley et al who
investigated complaints, from two residences, that
were thought to be associated with strong low
frequency sound pulses from the experimental
downwind MOD-1 wind turbine.130 The low
frequency sound pulses were generated when a
turbine blade passed the wind wake behind the
mast. The residents perceived ‘audible and other
sensations, including vibration and sensed
pressure changes’. Although the wind turbine
sound at frequencies below about 30 Hz was
below the average hearing threshold, this sound
was believed to be causing the annoyance
complaints. The sound levels were within a range
of sound levels and frequencies given by Hubbard
for situations where (subaudible) industrial sound
within this range was believed to be the source of
the complaints. This could be explained by the
response of a building to the sound outside,
causing structure borne sound, standing waves
and resonances due to the configuration of a room,
closet and/or hallway. The rhythmic character of
wind turbine sound could have an added effect
because of the periodic pressure pulses; if these
coincide with a structural resonance of the
building the indoor level can be higher than
expected from just reduction by the façade. These
structural vibrations can lead to sound at higher
frequencies which are audible. Several authors
have pointed out that the rhythmic character itself
(technically: Amplitude Modulation) is more
relevant to human perception than low frequency
or infrasound (see What makes wind turbine
sound so annoying? in section 4.2 above).
However, the appreciation of the sound may
depend on a combination of the frequency and
strength of the modulation and the balance of low
and higher frequency components.131
EXHIBIT A5-4
Page 19 of 29 005137

Health effects related to wind turbine sound p. 20
7. CONCLUSIONS
Available scientific research does not provide a
definite answer to the question whether wind
turbine sound can cause health effects which are
different from those of other sound sources.
However, wind turbines do stand out because of
their rhythmic character, both visually and aurally.
6.1 A graphic summary of the
reaction to (planned) wind turbines.
There are many models or schemes that show how
people react to noise. However, much of the
public debate about wind turbines and noise is at a
stage when wind turbines have not been erected
yet. Michaud et al proposed a model that
incorporated the influence of (media) information
and expectations.84 In figure 3 we present a
simplified model based on the one from Michaud
et al. The model shows that plans for wind
turbines or actual wind turbines can lead to
disturbances and concern, but a number of factors
can influence the effect of the (planned) turbines
(see the ‘Michaud model’ for these factors). The
personal factors include attitude, expectations,
noise sensitivity and many more. Situational
factors include other possible impacts such as
visibility or shadow flicker, other sound sources,
type of area and others. Contextual factors include
participation, the decision making process, the
siting procedure, procedural justice and others.
6.2 Conclusions from chapter 3
Next to noise, several other features are relevant
for residents living in the vicinity of wind
turbines. These include physical and personal
aspects, and the particular circumstances around
decision making and siting of a wind farm as well
as communication and the relation between
different people involved in the process.
Visual aspects play a key role in reactions to wind
turbines and include the (mis-) match with the
landscape, shadow casting and blinking lights.
Shadow casting from wind turbines can be
annoying for people and also the movement of the
rotor blades themselves can be experienced as
disturbing.
Light flicker from the blades, vibrations and
electromagnetic fields play a minor role in modern
turbines as far as the effect on residents is
concerned.
People who benefit from and/or have a positive
attitude towards wind turbines in their
environment in general report less annoyance.
People who perceive wind turbines as intruding
into their privacy and detrimental to the quality of
their living environment in general report more
annoyance.
Perceived (procedural) injustice has been found to
be related with the feeling of intrusion and lack of
control/helplessness.
Most studies confirm the role of noise sensitivity
in the reaction to wind turbines, independent of
the sound level or sound characteristics.
Attitude and media coverage are just a few
elements of the complex process which plays a
role in decision making for siting wind turbines.
Most recent studies conclude that social
acceptance of wind projects is highly dependent
on a fair planning process and local involvement.
6.3 Conclusions from chapter 4
Noise annoyance is the main health effect
associated with the exposure to noise from an
operational wind turbine.
From epidemiological studies, experiments and
individual narratives the typical character of wind
turbine sound comes forward as one of the key
issues.
Figure 3: a model for the relation between the exposure to (information about) wind turbines
and the individual reaction
wind turbines
not (yet) present
information/
knowledge
about effects
perception of
risk/concern
personal factors .
situational factors
contextual factors
individual
response/health
effect
wind turbines
present
aural/visual
exposure to
wind turbines
disturbed
activities/amenity,
annoyance
EXHIBIT A5-4
Page 20 of 29 005138
Health effects related to wind turbine sound p.21
At equal sound levels, sound from wind turbines
is experienced as more annoying than that of road
or rail traffic or industrial sources. Residential
wind turbine sound levels themselves are modest
when compared to those from other sources such
as road or industrial noise.
Especially the rhythmic character of the sound
(technically: Amplitude Modulation or AM) is
experienced as annoying and described as a
swishing or wooshing sound.
However, recent laboratory studies are
inconclusive regarding the effect of amplitude
modulation on annoyance. One conclusion is that
“there is a strong possibility that amplitude
modulation is the main cause of the properties of
wind turbine noise”. Another dismisses amplitude
modulation as a negative factor per se because it is
highly related to attitude. A common factor is that
AM appears to aggravate existing annoyance, but
does not lead to annoyance to persons positive
about or benefiting from wind turbines.
The general exposure-effect relation for
annoyance from wind turbine sound includes all
aspects that influence annoyance and thus
averages over all local situations. The relation can
therefore give an indication only of the annoyance
levels to be expected in a local situation.
Evidence regarding the effect of night time sound
exposure on sleep is inconclusive. The current
results do not allow a definite conclusion
regarding both subjective and objective sleep
indicators. However, studies do find a relation
between self-reported sleep disturbance and
annoyance from wind turbines.
For other health effects there is insufficient
evidence for a direct relation with wind turbine
sound level.
Based on noise research in general we can
conclude that chronic annoyance from wind
turbines and the feeling that the quality of the
living environment has deteriorated or will do so
in the future, can have a negative impact on
wellbeing and health in people living in the
vicinity of wind turbines. This is similar to the
effect of other stressors.
The moderate effect of the level of wind turbine
sound on annoyance and the range of factors
predicting the levels of annoyance implies that
reducing the impact of wind turbine sound will
profit from considering other factors associated
with annoyance. The influence of these factors is
not necessarily unique for wind turbines.
6.4 Conclusions from chapter 5
There is substantial knowledge about the physical
aspects of low frequency sound. Low frequency
sound can be heard daily from road and air traffic
and many other sources.
Less is known about infrasound and certainly the
perception of infrasound. Infrasound can
sometimes be heard, e.g. from big machines and
storms, but is not as common as low frequency or
‘normal’ sound. However, with sensitive
equipment infrasound, as well as vibrations, can
be measured at large distances.
Infrasound and low frequency sound are present in
wind turbine sound. Low frequency sound is
included in most studies as part of the normal
sound range. In contrast, infrasound is in most
studies considered as inaudible as the level of
infrasound is low with respect to human
sensitivity. Studies of the perception of wind
turbine infrasound support this.
Infrasound and low frequency sound from wind
turbines have been suggested to pose unique
health hazards. There is no scientific evidence to
support this. The levels of infrasound involved are
comparable to the level of internal body sounds
and pressure variations at the ear while walking.
Infrasound from wind turbines is not loud enough
to influence the sense of balance (i.e. activate the
vestibular system), except perhaps for persons
with a specific hearing condition (SCDS).
Effects such as dizziness and nausea, or motion
sickness, can be an effect of infrasound, but at
much higher levels than wind turbines produce in
residential situations.
Vibroacoustic disease (VAD) and the wind
turbine syndrome (WTS) are controversial and
scientifically not supported. At the present levels
of wind turbine sound, the alleged occurrence of
VAD or WTS are unproven and unlikely.
However, the symptoms associated with WTS are
comparable to those found in relation to other
stressors.
The rhythmic character of wind turbine sound is
caused by a succession of sound pulses produced
by the blade rotations. From earlier research it was
concluded that this may lead to structural
vibrations of a house and wind turbines thus may
be perceived indirectly inside a house and hence
lead to annoyance. This possibility needs further
investigation.
EXHIBIT A5-4
Page 21 of 29 005139

Health effects related to wind turbine sound p. 22
Annex A:
Strategy literature search
For this review a systematic literature search was
performed at three moments in time (2000-2012;
2012-2015, 2015-2017). Observational as well as
experimental studies described in the peer review
literature in the period between 2009 and 2017
was performed. Language was restricted to
German, English, French and Dutch. Scopus,
Medline and Embase (note: only 2015-2017) were
searched. The search strategy is described below.
Only studies which mention in the title, abstract or
summary that the association between the noise of
wind turbines and reaction, health or wellbeing
was studied were included. Also studies
addressing participation during the building
process were accepted for review. This implied
that the association between exposure to wind
turbine (low frequency) noise an annoyance,
health, wellbeing or activity disturbance in the
adult population was studied.
For a first selection the following criteria were
used: Inclusion: papers address human health
effects, perception, opinion, concern in relation to
wind turbines Exclusion: papers address non-
human effects such as ecosystem effects, animals,
papers about t solely technical aspects of the wind
turbines, papers regarding health effects of noise
but not specific for wind turbines. This resulted in
total in 387 relevant studies.
The papers for the period from January 2015 to
February 2017 were grouped in 7 categories:
review, health effects, case studies, offshore, low
frequency noise, visual aspects, social and not
relevant. All reviews and health effects studies
were included for full paper examination, offshore
studies were a-priori excluded, papers from the
other categories were re-considered after reading
the abstracts.
Lastly, after full examination of the review and
health effect papers by the two authors, a final
decision was made about inclusion in this review.
As a result 24 new publications were included in
the report. Just the week prior to submitting this
review the 7th International Wind Turbine Noise
Conference was held in Rotterdam. Two relevant
papers have been mentioned in this review.
In the context of this report the main results are
summarized per outcome. For the key studies, the
study design, outcome etc. are discussed in more
detail. For this review primarily scientific
publications are used, both from peer reviewed
journals and conference proceedings. In some
cases results are discussed which were described
in non-scientific (‘grey’) literature. Also some
publications are mentioned which form the base of
the debate (discourse) about the risks of living in
the vicinity of wind turbines.
As usual all material from the selected literature
has been read and analysed, but not necessarily
included as reference, e.g. because the study was
less relevant than originally thought or in case of
doubling with other references. (e.g. a conference
paper and article from same authors/study).
Search strategy in Scopus, Medline and (only in
last search) Embase databases:
1 (wind turbine* or wind farm* or windmill*
or wind park* or wind power or wind energy).ti.
(550)
2 turbine noise*.tw. and wind/ (33)
3 (power plants/ or energy-generating sources/
or electric power supplies/) and wind/ (187)
4 (low frequency noise* or low frequency
sound* or infrasound or infrasonic noise* or
infrasonic sounds or infrasonic frequencies or low
frequency threshold or (noise* adj4 low
frequenc*)).ti. (500)
5 1 or 2 or 3 or 4 (1113)
6 (wind turbine* or wind farm* or windmill*
or wind park* or wind power or wind energy).ab.
(803)
7 (low frequency noise* or low frequency
sound* or infrasound or infrasonic noise* or
infrasonic sounds or infrasonic frequencies or low
frequency threshold or (noise* adj4 low
frequenc*)).ab. (1487)
8 noise*.ti. (26930)
9 (6 or 7) and 8 (498)
10 (impact or perception* or perceive* or
health* or well-being or "quality of life" or
syndrome*).ti. (1456358)
11 (annoyance or annoying or annoyed or
aversion or stress or complaints or distress or
disturbance or adversely affected or concerns or
worries or noise problems or noise perception or
EXHIBIT A5-4
Page 22 of 29 005140

Health effects related to wind turbine sound p.23
noise reception or noise sensitivity or (sensitivity
adj3 noise) or sound pressure level* or sleep
disturbance* or sleep quality or cognitive
performance or emotions or anxiet* or
attitude*).tw. (1260490)
12 (social barrier* or social acceptance or
popular opinion* or public resistance or (living
adj4 vicinity) or (living adj4 proximity) or
(residing adj4 vicinity) or (residing adj4
proximity) or living close or "living near" or
residents or neighbors or neighbours).tw.
(105942)
13 (soundscape or landscape or visual
annoyance or visual interference or visual
perception or visual impact or visual preferences
or visual assessment or visual effects or perceptual
attribute*).tw. (41227)
14 ((effects adj4 population) or dose-response
relationship* or exposure-response relationship*
or dose response or exposure response or human
response or health effects or health aspects or
health outcome*).tw. (136924)
15 (flicker or reflection).ti. (10980)
16 environmental exposure/ or noise/ae or
environmental pollution/ae (79725)
17 loudness perception/ or psychoacoustics/ or
auditory perception/ or auditory threshold/ or
sensory thresholds/ or visual perception/ or
motion perception/ (130572)
18 sleep disorders/ or emotions/ or anger/ or
anxienty/ or quality of life/ or epilepsy/ or
attitude/ or affect/ or pressure/ or esthetics/ or
social environment/ or risk factors/ (1232239)
19 (physiopathology or adverse effects).fs.
(3235762)
20 (5 or 9) and (10 or 11 or 12 or 13 or 14 or 15
or 16 or 17 or 18 or 19) (600)
21 20 and (english or dutch or french or
german).lg. (509)
22 21 not (animals/ not humans/) (369)
23 limit 22 to yr=2014-2017 (129)
24 limit 23 to ed=20150122-20161228 (81)
25 limit 23 to yr=2015-2017 (90)
26 24 or 25 (110)
27 remove duplicates from 26 (96)
As the diagram below shows, the literature
searches yielded 387 publications of which 107
were relevant for the review and in the end 32
(+2) are included in the reference list (annex B).
EXHIBIT A5-4
Page 23 of 29
Search for peer reviewed articles published between January 2009
and February 2017: 387 articles in Med line, Scopus and Embase (only as of 2015).
20092012: 76 - 20122015: 109 20152017: 202
- 355 excluded based on study, ,
exposure and population criteria
' relevant for the review
10reviews 22 original papers ( + 2 since Febuary 2017)
1 32 articles included (+2)
005141

Health effects related to wind turbine sound p. 24
ANNEX B: References
1. Wagner, S., R. Bareiss, and G. Guidati, Wind
turbine noise. Springer Science & Business Media,
2012.
2. Van den Berg, G.P., The sound of high winds. The
effect of atmospheric stability on wind turbine
sound and microphone noise. Thesis, University of
Groningen, 2006
3. Bowdler D., G. Leventhall. Wind turbine noise.
Multi-Science Publishing Co. Ltd.: Brentwood,
UK, 2011.
4. Hansen, C.H., C.J. Doolan, K.L. Hansen. Wind
Farm Noise: Measurement, Assessment, and
Control, John Wiley & Sons Inc, New York, USA,
2017
5. Oerlemans S., J. G. Schepers. Prediction of wind
turbine noise and validation against experiment,
International Journal of Aeroacoustics, Vol. 8, No.
6, 2009
6. Van den Berg, G.P. Effects of the wind profile at
night on wind turbine sound. Journal of Sound and
Vibration, Volume 277, Issue 4-5, p. 955-970,
2004
7. Oerlemans, S. Effect of Wind Shear on Amplitude
Modulation of Wind Turbine Noise, International
Journal of Aeroacoustics, Vol 14, Issue 5-6, 2015
8. Cand M, A. Bullmore M. Smith, S. von-
Hünerbein, R. Davis. Wind turbine amplitude
modulation: research to improve understanding as
to its cause & effect. Report Renewable UK, 2013
9. Stigwood M, Large S, Audible amplitude
modulation—results of field measurements and
investigations compared to psychoacoustical
assessment and theoretical research. Proceedings
Fifth International Conference on Wind Turbine
Noise, Denver, 2013
10. Larsson, C. and O. Ohlund, Amplitude modulation
of sound from wind turbines under various
meteorological conditions. J Acoust Soc Am,
135(1), p. 67-73, 2014
11. Van den Berg, F. Wind profiles over complex
terrain. Proceedings 2nd International Meeting on
Wind Turbine Noise, Lyon, France, 2007
12. Moller H., C.S. Pedersen. Hearing at low and
infrasonic frequencies. Noise and Health, 6(23):37,
2004
13. SHC. Public health effects of siting and operating
onshore wind turbines. Publication of the Superior
Health Council (SHC) no. 8738, Brussels, 2013
14. Yokoyama, S., S. Sakamoto, and H. Tachibana,
Perception of low frequency components in wind
turbine noise. Noise Control Engineering Journal,
62(5): p. 295-305, 2014
15. Van den Berg, F. Criteria for wind farm noise:
Lmax and Lden. Proceedings Acoustics'08, Paris,
2008
16. Søndergaard, B. Low frequency noise from wind
turbines: do the Danish regulations have any
impact? An analysis of noise measurements.
International Journal of Aeroacoustics, 14(5-6): p.
909-915, 2015
17. Møller, H., C.S. Pedersen. Low-frequency noise
from large wind turbines. The Journal of the
Acoustical Society of America, 2011. 129(6): p.
3727-3744
18. Pedersen, E. , LR-M. Hallberg, K.P. Waye. Living
in the Vicinity of Wind Turbines — A Grounded
Theory Study. Journal Qualitative Research in
Psychology, Volume 4(1-2), 49-63, 2007
19. Merlin T, Newton S, Ellery B, Milverton J, Farah
C. Systematic review of the human health effects
of wind farms. National Health and Medical
Research Council, Canberra, 2013
20. Michaud DS, Keith SE, Feder K, Voicescu SA,
Marro L., Than J, Guay M, Bower T, Denning A,
Lavigne E, Whelan C. Personal and situational
variables associated with wind turbine noise
annoyance. The Journal of the Acoustical Society
of America, Vol. 139(3):1455-66, 2016d
21. Firestone J., A. Bates, L.A. Knapp. See me, Feel
me, Touch me, Heal me: Wind turbines, culture,
landscapes, and sound impressions. Land Use
Policy, Vol. 46, 241-249, 2015
22. Abromas J, Kamicaityte-Virbasiene J,
Ziemelniece. Visual impact assessment of wind
turbines and their farms on landscape of Kretinga
region (Lithuania) and Grobina townscape
(Latvia). Journal of Environmental Engineering
and Landscape Management, 23(1):39-49, 2015
23. Molnárová, K., Sklenicka, P., Stiborek, J.,
Svobodová, K., Šálek, M. Visual preferences for
wind turbines: location, numbers and respondent
characteristics. Applied Energy, 92: 269–278,
2015
24. Betakova V, Vojar J, Sklenicka P. Wind turbines
location: How many and how far?. Applied
Energy, 151:23-31, 2015
25. Asian S, G Ertek, C Haksoz, S Pakter, S Ulun.
Wind Turbine Accidents: A Data Mining Study.
IEEE Systems Journal, 2016 (published online)
26. Cattin R, Kunz S, Heimo A, Russi G, Russi M,
Tiefgraber M. Wind turbine ice throw studies in
the Swiss Alps. Proceedings European Wind
Energy Conference, Milan, 2007
27. Colby W.D., R. Dobie, G. Leventhall, D.M.
Lipscomb, R.J. McCunney, M.T. Seilo, B.
Søndergaard. Wind Turbine Sound and Health
Effects - An Expert Panel Review. Report
prepared for the American Wind Energy
Association and Canadian Wind Energy
Association, 2009
28. Dusseldorp A, Houthuijs D, van Overveld A, van
Kamp I, Marra M. Handreiking geluidhinder
wegverkeer: Berekenen en meten. (Guidelines
noise annoyance road traffic: calculation and
measurement; in Dutch). RIVM rapport
609300020, 2011
29. Pedersen E, van den Berg F, Bakker R, Bouma J.
Response to noise from modern wind farms in The
EXHIBIT A5-4
Page 24 of 29 005142

Health effects related to wind turbine sound p.25
Netherlands. The Journal of the Acoustical Society
of America, 126(2):634-43, 2009
30. Van den Berg F, Pedersen E, Bouma J, Bakker R.
Visual and acoustic impact of wind turbine farms
on residents: final report. University of Groningen,
2008
31. Pedersen E, Waye KP. Wind turbine noise,
annoyance and self-reported health and well-being
in different living environments. Occupational and
environmental medicine, 64(7):480-6, 2007
32. Devine-Wright P, Howes Y. Disruption to place
attachment and the protection of restorative
environments: A wind energy case study. Journal
of Environmental Psychology, 30(3):271-80, 2010
33. Van Kamp I, Davies H. Noise and health in
vulnerable groups: A review. Noise & Health
15:153-9, 2013
34. Shepherd D, McBride D, Welch D, Dirks KN, Hill
EM. Evaluating the impact of wind turbine noise
on health-related quality of life. Noise & Health
13(54):333, 2011
35. Miedema HM, Vos H. Noise sensitivity and
reactions to noise and other environmental
conditions. The Journal of the Acoustical Society
of America 113(3):1492-504, 2003
36. Thorne B. The Relevance of the Precautionary
Principle to wind farm noise planning. Proceedings
Internoise and NOISE-CON Congress and
Conference, Institute of Noise Control
Engineering, 2014
37. Kageyama T, Yano T, Kuwano S, Sueoka S,
Tachibana H. Exposure-response relationship of
wind turbine noise with self-reported symptoms of
sleep and health problems: A nationwide
socioacoustic survey in Japan. Noise & health.
2016 Mar;18(81):53
38. Gross C. Community perspectives of wind energy
in Australia: The application of a justice and
community fairness framework to increase social
acceptance. Energy policy. 2007 May
31;35(5):2727-36
39. Tyler TR. Social justice: Outcome and procedure.
International journal of psychology. 2000 Apr
1;35(2):117-25.
40. Wolsink M. Maatschappelijke acceptatie van
windenergie. Thesis Publishers, Amsterdam
(1990)
41. Breukers, S., 2007. Institutional capacity building
for wind power. A geographical comparison. Ph.D.
Thesis, University of Amsterdam
42. Chapman S, George AS, Waller K, Cakic V. The
pattern of complaints about Australian wind farms
does not match the establishment and distribution
of turbines: support for the psychogenic,
‘communicated disease’ hypothesis. PloS one.
2013 Oct 16;8(10): e76584.
43. Crichton, Fiona; Dodd, George; Schmid, Gian;
Gamble, Greg; Petrie, Keith J. (2014) Can
expectations produce symptoms from infrasound
associated with wind turbines? Health Psychology,
Vol 33(4), Apr 2014, 360-364
44. Hatfield J, Job RS, Hede AJ, Carter NL, Peploe P,
Taylor R, Morrell S. Human response to
environmental noise: the role of perceived control.
International Journal of Behavioral Medicine.
2002 Dec 1;9(4):341-59.
45. Kroesen M, Molin EJ, van Wee B. Testing a
theory of aircraft noise annoyance: A structural
equation analysis. The Journal of the Acoustical
Society of America. 2008 Jun;123(6):4250-
60.Zaunbrecher and Ziefle, 2016;
46. White K, Hofman WF, van Kamp I. Noise
sensitivity in relation to baseline arousal,
physiological response and psychological features
to noise exposure during task performance.
Proceedings Internoise2010, Lisboa, 2010
47. Coleby, A.M., D.R. Miller, and P.A. Aspinall,
Public attitudes and participation in wind turbine
development. Journal of Environmental
Assessment Policy and Management, 2009. 11(1):
p. 69-95.
48. Enevoldsen, P. and B.K. Sovacool, Examining the
social acceptance of wind energy: Practical
guidelines for onshore wind project development
in France. Renewable and Sustainable Energy
Reviews, 2016. 53: p. 178-184.
49. Zaunbrecher, B.S. and M. Ziefle, Integrating
acceptance-relevant factors into wind power
planning: A discussion. Sustainable Cities and
Society, 2016. 27: p. 307-314
50. Wüstenhagen, R., M. Wolsink, M.J. Bürer. Social
acceptance of renewable energy innovation: An
introduction to the concept. Energy policy 35 (5),
2683-2691, 2013
51. Van Kamp I, Dusseldorp A, van den Berg GP,
Hagens WI, Slob MJ. Windturbines: invloed op de
beleving en gezondheid van omwonenden (Wind
turbines: influence on the perception and health of
residents; in Dutch) GGD Informatieblad medische
milieukunde Update 2013. RIVM briefrapport
200000001, 2014
52. Kennisplatform Windenergie (pilot). Geluid van
windturbines (Sound of wind turbines; in Dutch).
RIVM, 2015
53. WHO. WHO Constitution adopted by the
International Health Conference held in New York
from 19 June to 22 July 1946, signed on 22 July
1946 by the representatives of 61 States (Off. Rec.
Wld Hlth Org., 2, 100), and entered into force on 7
April 1948. WHO, 1948
54. WHO. L. Fritschi, A. Brown, R. Kim, D. Schwela,
S. Kephalopoulos (Ed.). Burden of disease from
environmental noise Quantification of healthy life
years lost in Europe. WHO Regional office for
Europe, 2011
55. WHO, C. Hurtley (Ed.) Night Noise Guidelines for
Europe (NNGL). World Health Organization
WHO Regional office for Europe. 2009
56. McCunney RJ, Mundt KA, Colby WD, Dobie R,
Kaliski K, Blais M. Wind turbines and health: A
critical review of the scientific literature. Journal
EXHIBIT A5-4
Page 25 of 29 005143

Health effects related to wind turbine sound p. 26
of occupational and environmental medicine. 2014
Nov 1;56(11):e108-30.
57. Health Canada. Wind Turbine Noise and Health
Study: Summary of Results, 2014.
www.canada.ca/en/health-
canada/services/environmental-workplace-
health/noise/wind-turbine-noise/wind-turbine-
noise-health-study-summary-results.html
(consulted 28-6-2017)
58. CCA. Understanding the Evidence: Wind Turbine
Noise. Ottawa (ON): The Expert Panel on Wind
Turbine Noise and Human Health, Council of
Canadian Academies, 2015.
59. Ellenbogen JM, Grace S, Heiger-Bernays WJ,
Manwell JF, Mills DA, Sullivan KA, Santos SL.
Wind Turbine Health Impact Study. Report of
Independent Expert Panel. Prepared for:
Massachusetts Department of Environmental
Protection. Massachusetts Department of Health.
60. Harrison, R.V., On the biological plausibility of
Wind Turbine Syndrome. International journal of
environmental health research, 2015. 25(5): p.
463-468.
61. Onakpoya IJ, O'Sullivan J, Thompson MJ,
Heneghan CJ. The effect of wind turbine noise on
sleep and quality of life: A systematic review and
meta-analysis of observational studies.
Environment international. 2015 Sep 30;82:1-9.
62. Schmidt, J.H. and M. Klokker, Health effects
related to wind turbine noise exposure: a
systematic review. PLoS ONE, 2014. 9(12): p.
e114183
63. Janssen SA, Vos H, Eisses AR, Pedersen E. A
comparison between exposure-response
relationships for wind turbine annoyance and
annoyance due to other noise sources. The Journal
of the Acoustical Society of America. 2011
Dec;130(6):3746-53
64. Pawlaczyk-Luszczynska M., Dudarewicz A.,
Zaborowski K., Zamojska-Daniszewska M.,
Waszkowska, M. (2014) Evaluation of annoyance
from the wind turbine noise: a pilot study.
International Journal of Occupational Medicine
and Environmental Health 2014;27(3):364 - 388
65. Yano T, Kuwano S, Kageyama T, Sueoka S,
Tachibana H. Dose-response relationships for
wind turbine noise in Japan. InProc. Inter-noise
2013 Sep 15.
66. Babisch W, Pershagen G, Selander J, Houthuijs D,
Breugelmans O, Cadum E, Vigna-Taglianti F,
Katsouyanni K, Haralabidis AS, Dimakopoulou K,
Sourtzi P. Noise annoyance—A modifier of the
association between noise level and cardiovascular
health?. Science of the total environment. 2013
May 1;452:50-7
67. Miedema HM, Vos H. Noise annoyance from
stationary sources: Relationships with exposure
metric day–evening–night level (DENL) and their
confidence intervals. The Journal of the Acoustical
Society of America. 2004 Jul;116(1):334-43.
68. Miedema HM, Oudshoorn CG. Annoyance from
transportation noise: relationships with exposure
metrics DNL and DENL and their confidence
intervals. Environmental health perspectives. 2001
Apr;109(4):409.
69. Fiumicelli, D., Wind farm noise dose response.
Acoustics Bulletin, 2011. 36(6): p. 26-34
70. Waye KP, Öhrström E. Psycho-acoustic characters
of relevance for annoyance of wind turbine noise.
Journal of sound and vibration. 2002 Feb
7;250(1):65-73
71. Hayes M. The measurement of low frequency
noise at three UK wind farms. Report contract
number W/45/00656/00/00, URN. 2006;6:1412
72. Yoon K, Gwak DY, Seong Y, Lee S, Hong J, Lee
S. Effects of amplitude modulation on perception
of wind turbine noise. Journal of Mechanical
Science and Technology. 2016 Oct 1;30(10):4503-
9
73. Bakker RH, Pedersen E, van den Berg GP, Stewart
RE, Lok W, Bouma J. Impact of wind turbine
sound on annoyance, self-reported sleep
disturbance and psychological distress. Science of
the Total Environment. 2012 May 15;425:42-51
74. Møller, H. and C.S. Pedersen, Low-frequency
noise from large wind turbines. The Journal of the
Acoustical Society of America, 2011. 129(6): p.
3727-3744
75. Salt AN, Hullar TE. Responses of the ear to low
frequency sounds, infrasound and wind turbines.
Hearing research. 2010 Sep 1;268(1):12-21
76. Van den Berg, F., Effects of sound on people, in
Wind Turbines Noise, D. Bowdler and G.
Leventhall, Editors. 2011, Multi-Science
Publishing Co. Ltd.: Brentwood, UK.
77. Van den Berg, F.; Verhagen, C.; Uitenbroek, D.
The Relation between Scores on Noise Annoyance
and Noise Disturbed Sleep in a Public Health
Survey. Int. J. Environ. Res. Public Health 2014,
11, 2314-2327.
78. Shepherd D, Welch D, Dirks KN, Mathews R.
Exploring the relationship between noise
sensitivity, annoyance and health-related quality of
life in a sample of adults exposed to environmental
noise. Int J Environ Res Public Health
2010;7:3579-94
79. Nissenbaum, M.A., J.J. Aramini, and C.D.
Hanning, Effects of industrial wind turbine noise
on sleep and health. Noise Health, 2012. 14(60): p.
237-43.
80. Van Kamp, I.; LAM Kin Che; Brown A L; Wong
T W and Law C W. "Sleep-disturbance and
Quality in Hong Kong in Relation to Nighttime
Noise Exposure". Paper presented in the Acoustics
2012 Hong Kong, organized by Hong Kong
Institute of Acoustics, 6 pgs. 2012. <P128098>
abstract in JASA 04/2012; 131(4):3222.
DOI:10.1121/1.4708017
81. Van Renterghem T, Bockstael A, De Weirt V,
Botteldooren D. Annoyance, detection and
EXHIBIT A5-4
Page 26 of 29 005144

Health effects related to wind turbine sound p.27
recognition of wind turbine noise. Science of the
Total Environment. 2013 Jul 1;456:333-45
82. Michaud DS, Feder K, Keith SE, Voicescu SA,
Marro L, Than J, Guay M, Denning A, McGuire
DA, Bower T, Lavigne E. Exposure to wind
turbine noise: Perceptual responses and reported
health effects. The Journal of the Acoustical
Society of America. 2016a Mar;139(3):1443-54.
83. Michaud DS, Feder K, Keith SE, Voicescu SA,
Marro L, Than J, Guay M, Denning A, Murray BJ,
Weiss SK, Villeneuve PJ. Effects of wind turbine
noise on self-reported and objective measures of
sleep. Sleep. 2016b Jan 1;39(1):97.
84. Michaud DS, Feder K, Keith SE, Voicescu SA,
Marro L, Than J, Guay M, Denning A, Bower T,
Villeneuve PJ, Russell E. Self-reported and
measured stress related responses associated with
exposure to wind turbine noise. The Journal of the
Acoustical Society of America. 2016c
Mar;139(3):1467-79
85. Voicescu SA, Michaud DS, Feder K, Marro L,
Than J, Guay M, Denning A, Bower T, van den
Berg F, Broner N, Lavigne E. Estimating
annoyance to calculated wind turbine shadow
flicker is improved when variables associated with
wind turbine noise exposure are considered. The
Journal of the Acoustical Society of America.
2016 Mar;139(3):1480-92
86. Feder K, Michaud DS, Keith SE, Voicescu SA,
Marro L, Than J, Guay M, Denning A, Bower TJ,
Lavigne E, Whelan C. An assessment of quality of
life using the WHOQOL-BREF among
participants living in the vicinity of wind turbines.
Environmental research. 2015 Oct 31;142:227-38.
87. Abbasi M, Monazzam MR, Ebrahimi MH,
Zakerian SA, Dehghan SF, Akbarzadeh A.
Assessment of noise effects of wind turbine on the
general health of staff at wind farm of Manjil, Iran.
Journal of Low Frequency Noise, Vibration and
Active Control. 2016 Mar;35(1):91-8
88. Blanes-Vidal V, Schwartz J. Wind turbines and
idiopathic symptoms: The confounding effect of
concurrent environmental exposures.
Neurotoxicology and Teratology, 2016. 55: p. 50-
57.
89. Crichton, F. and K.J. Petrie, Health complaints and
wind turbines: The efficacy of explaining the
nocebo response to reduce symptom reporting.
Environ Res, 2015. 140: p. 449-55
90. Hafke-Dys H, Preis A, Kaczmarek T, Biniakowski
A, Kleka P. Noise Annoyance Caused by
Amplitude Modulated Sounds Resembling the
Main Characteristics of Temporal Wind Turbine
Noise. Archives of Acoustics. 2016 Jun
1;41(2):221-32.
91. Ioannidou, C., S. Santurette, and C.H. Jeong,
Effect of modulation depth, frequency, and
intermittence on wind turbine noise annoyance. J
Acoust Soc Am, 2016. 139(3): p. 1241-51
92. Maffei L, Masullo M, Gabriele MD, Votsi NE,
Pantis JD, Senese VP. Auditory recognition of
familiar and unfamiliar subjects with wind turbine
noise. International journal of environmental
research and public health. 2015 Apr
17;12(4):4306-20.
93. Schäffer B, Schlittmeier SJ, Pieren R, Heutschi K,
Brink M, Graf R, Hellbrück J. Short-term
annoyance reactions to stationary and time-varying
wind turbine and road traffic noise: A laboratory
study a. The Journal of the Acoustical Society of
America. 2016 May;139(5):2949-63.
94. Tonin, R., J. Brett, and B. Colagiuri, The effect of
infrasound and negative expectations to adverse
pathological symptoms from wind farms. Journal
of Low Frequency Noise Vibration and Active
Control, 2016. 35(1): p. 77-90
95. Jalali L, Bigelow P, Nezhad-Ahmadi MR, Gohari
M, Williams D, McColl S. Before–after field study
of effects of wind turbine noise on
polysomnographic sleep parameters. Noise and
Health. 2016a Aug 1;18(83):194.
96. Jalali L, Bigelow P, McColl S, Majowicz S,
Gohari M, Waterhouse R. Changes in quality of
life and perceptions of general health before and
after operation of wind turbines. Environmental
Pollution. 2016b Sep 30;216:608-15.
97. Jalali L, Nezhad-Ahmadi MR, Gohari M, Bigelow
P, McColl S. The impact of psychological factors
on self-reported sleep disturbance among people
living in the vicinity of wind turbines.
Environmental research. 2016c Jul 31;148:401-10
98. Krekel, C. and A. Zerrahn, Does the presence of
wind turbines have negative externalities for
people in their surroundings? Evidence from well-
being data. Journal of Environmental Economics
and Management, 2017. 82: p. 221-238.
99. Botterill, L.C. and G. Cockfield, The Relative
Importance of Landscape Amenity and Health
Impacts in the Wind Farm Debate in Australia.
Journal of Environmental Policy and Planning,
2016. 18(4): p. 447-462
100. Keith SE, Feder K, Voicescu SA, Soukhovtsev V,
Denning A, Tsang J, Broner N, Leroux T, Richarz
W, van den Berg F. Wind turbine sound pressure
level calculations at dwellings. The Journal of the
Acoustical Society of America. 2016
Mar;139(3):1436-42.
101. Keith, SE, K Feder, SA Voicescu, V Soukhovtsev,
A Denning, J Tsang, N Broner, W Richarz, F van
den Berg, Wind turbine sound power measure-
ments, J Acoustical Soc America 139 (3), 2016,
1431-1435
102. Brisson G, Gervais M-C., Martin R. Éoliennes et
santé publique. Synthèse des connaissances.
Québec: Institut National de Santé Publique de
Québec; 2009 Septembre. www.inspq.qc.ca/sites
/default/files/publications/1633_eoliennessp_synth
conn_maj.pdf, accessed 29-6-2017
103. Pasqualetti, M.J., Social barriers to renewable
energy landscapes. Geographical Review, 2011.
101(2): p. 201-223
EXHIBIT A5-4
Page 27 of 29 005145

Health effects related to wind turbine sound p. 28
104. Pedersen E, Larsman P. The impact of visual
factors on noise annoyance among people living in
the vicinity of wind turbines. Journal of
Environmental Psychology. 2008 Dec
31;28(4):379-89.
105. Bartels, S., F. Márki, and U. Müller, The influence
of acoustical and non-acoustical factors on short-
term annoyance due to aircraft noise in the field-
The COSMA study. Science of the Total
Environment, 2015. 538: p. 834-843.
106. Fyhri A, Klæboe R. Road traffic noise, sensitivity,
annoyance and self-reported health-A structural
equation model exercise. Environment
International. 2009 Jan 31;35(1):91-7.
107. Park SH, Lee PJ, Yang KS, Kim KW.
Relationships between non-acoustic factors and
subjective reactions to floor impact noise in
apartment buildings. The Journal of the Acoustical
Society of America. 2016 Mar;139(3):1158-67
108. Yano, T., S. Kuwano, H. Tachibana (2017) The
visual effects of wind turbines in Japan; (2017)
Proceedings 7th Int. Conf. Wind Turbine Noise,
Rotterdam, 2017
109. Qu F., A. Tsuchiya, J. Kang (2017). Impact of
noise from suburban wind turbines on human well-
being; Proceedings 7th Int. Conf. Wind Turbine
Noise, Rotterdam.
110. Pierpont, N., Wind turbine syndrome: A report on
a natural experiment. 2009: K-Selected Books
Santa Fe, NM.
111. Phillips C. 2011. Properly interpreting the
epidemiologic evidence about the health effects of
industrial wind turbines on nearby residents. Bull
Sci Tech Soc 31:303-8.
112. Berger RG, Ashtiani P, Ollson CA, Aslund MW,
McCallum LC, Leventhall G, Knopper LD.
Health-based audible noise guidelines account for
infrasound and low-frequency noise produced by
wind turbines. Frontiers in public health. 2015;3
113. Cooper, K., P. Kirkpatrick, and A. Stewart, Health
effects associated with working in the wind power
generation industry: A comprehensive systematic
review. JBI Library of Systematic Reviews, 2014.
12(11): p. 327-373.
114. Leventhall, G. Infrasound and the ear. in
Proceedings 5th International. Conference on.
Wind Turbine Noise 2013, Denver
115. Bolin K, Bluhm G, Eriksson G, Nilsson ME.
Infrasound and low frequency noise from wind
turbines: exposure and health effects.
Environmental research letters. 2011 Sep
22;6(3):035103.6(3). 116. Herrmann, L., U. Ratzel, O. Bayer, K-G. Krapf,
M. Hoffmann, J. Blaul, C. Mehnert. Low-
frequency noise incl. infrasound from wind
turbines and other sources. Proceedings 5th
International. Conference on. Wind Turbine Noise
2013, Rotterdam
117. Alves-Pereira, M. and N.A.C. Branco,
Vibroacoustic disease: biological effects of
infrasound and low-frequency noise explained by
mechanotransduction cellular signalling. Progress
in Biophysics and Molecular Biology, 2007. 93(1):
p. 256-279.
118. Frey BJ, Hadden PJ. Noise radiation from wind
turbines installed near homes: effects on health.
With an annotated review of the research and
related issues. Internet: http://www.windaction.org
/posts/7500-noise-radiation-from-wind-turbines-
installed-near-homes-effects-on-health, consulted
21-7-2017) 119. Salt, A.N. and J.A. Kaltenbach, Infrasound from
wind turbines could affect humans. Bulletin of
Science, Technology & Society, 2011. 31(4): p.
296-302.
120. Farboud, A., R. Crunkhorn, and A. Trinidade,
‘Wind turbine syndrome’: fact or fiction? The
Journal of Laryngology & Otology, 2013. 127(03):
p. 222-226
121. Stead, M., J. Cooper, and T. Evans, Comparison of
infrasound measured at people’s ears when
walking to that measured near wind farms’.
Acoustics Australia, 2014. 42(3): p. 197-203.
122. Witthöft, M. and G.J. Rubin, Are media warnings
about the adverse health effects of modern life
self-fulfilling? An experimental study on
idiopathic environmental intolerance attributed to
electromagnetic fields (IEI-EMF). Journal of
psychosomatic research, 2013. 74(3): p. 206-212
123. Schomer PD, Erdreich J, Pamidighantam PK,
Boyle JH. A theory to explain some physiological
effects of the infrasonic emissions at some wind
farm sites. The Journal of the Acoustical Society
of America. 2015 Mar;137(3):1356-65.
124. Nussbaum DS, Reinis S. Some individual
differences in human response to infrasound.
University of Toronto; 1985 Jan 31.
125. ATSDR – Agency for Toxic Substance and
Disease Registry: Expert review of the Vieques
heart study. Summary report for the Vieques heart
study expert panel review. (2001) Contract No.
200-2000-10039. www.atsdr.cdc.gov/sites/vieques
/heart_study_summary
126. Castelo Branco, N.A.A.., T. Costa e Curto, J.P. da
Costa Pereira, L. Mendes Jorge, L. Amaral Dias,
P. Oliveira, J. Martins dos Santos, M. Alves-
Pereira. Family with wind turbines in close
proximity to home: follow-up of the case presented
in 2007, proceedings 14th Int. Meeting on Low
Frequency Noise and Vibration and its Control,
Aalborg, Denmark, 2010
127. Marciniak W, Rodriguez E, Olszowska K, Atkov
O, Botvin I, Araujo A, Pais F, Soares Ribeiro C,
Bordalo A, Loureiro J, Prazeres De Sá E, Ferreira
D, Castelo Branco MS, Castelo Branco NA.
Echocardiographic evaluation in 485 aeronautical
workers exposed to different noise environments.
(1999), Aviat Space Environ Med.vol. 70(3 Pt 2),
pp. 46-53.
128. Chapman, S., A. St George. How the factoid of
wind turbines causing ‘Vibroacoustic Disease’
came to be ‘irrefutably demonstrated’ Australian
EXHIBIT A5-4
Page 28 of 29 005146

Health effects related to wind turbine sound p.29
and New Zealand Journal of Public Health June,
2013; 33: 244–249
129. Cooper, S. The results of an acoustic testing
program Cape Bridgewater wind farm. The
Acoustic Group, report 44.5100.R7:MSC, 2014
130. Kelley ND, McKenna HE, Hemphill RR, Etter CL,
Garrelts RL, Linn NC. Acoustic noise associated
with the MOD-1 wind turbine: its source, impact,
and control. US Government Printing Office; 1985
131. Bengtsson J, Waye K P and Kjellberg A 2004
Evaluations of effects due to low-frequency noise
in a low demanding work situation J. Sound Vib.
278 83–99
132. Large, S. and M. Stigwood. The noise
characteristics of 'compliant' wind farms that
adversely affect its neighbours. Proceedings
Internoise2014 - 43rd International Congress on
Noise Control Engineering. 2014
133. Walker, C., J. Baxter, and D. Ouellette, Adding
insult to injury: The development of psychosocial
stress in Ontario wind turbine communities. Soc
Sci Med, 2015. 133: p. 358-65.
134. Knopper LD, Ollson CA, McCallum LC, Whitfield
Aslund ML, Berger RG, Souweine K, McDaniel
M. Wind turbines and human health. Frontiers in
public health. 2014 Jun 19;2:63.
EXHIBIT A5-4
Page 29 of 29 005147
Proceedings of 20th
International Congress on Acoustics, ICA 2010
23-27 August 2010, Sydney, Australia
ICA 2010 1
A new wind farm noise standard for New Zealand NZS 6808:2010
Dr Stephen Chiles
URS, Christchurch, New Zealand
PACS: 43.15.+s, 43.50.Rq, 43.50.Sr
ABSTRACT
New Zealand Standard NZS 6808 provides methods for the prediction, measurement, and assessment of sound from
wind turbines. The 1998 version was written prior to significant wind farm development in New Zealand, and while
the basic methodology proved robust, experience and research over the following decade brought to light numerous
refinements and enhancements which are now addressed in the new 2010 version. This paper describes the revision
process, and explores the technical issues addressed and key areas of debate. This was a challenging project, with
wide ranging views both within the committee and from hundreds of public submissions.
INTRODUCTION
Currently there are eleven wind farms operating in New Zea-
land with a total capacity of just under 500 MW. These pro-
vide up to 5% of the country’s electricity. There are active
proposals for numerous further wind farms, which collec-
tively will have many times this capacity.
Several recent wind farm developments and proposals have
been highly contentious, with local objections attracting sig-
nificant media coverage. Using the old version of NZS 6808
[1], the consent conditions associated with these projects
ballooned, as regulators and residents sought tighter controls
and increasingly more prescriptive measurement and assess-
ment procedures. This led to substantial inefficiencies and
inconsistencies. These matters are now dealt with in the re-
vised version of NZS 6808 [2], which once again provides a
standardised approach for managing wind farm sound in New
Zealand.
The original 1998 version of NZS 6808 was based on the
United Kingdom 1996 ETSU report [3]. There were minor
adjustments made, which included replacing the L90 descrip-
tor with the L95, as that was used to describe background
sound in New Zealand at the time. Also, rather than the dif-
ferent daytime and night-time ETSU noise limits, the fixed
part of the noise limit was set at 40 dB at all times in
NZS 6808. The ‘background +5 dB’ variable part of the noise
limit from the ETSU report was retained in NZS 6808.
Since its publication, NZS 6808:1998 was used for all wind
farms in New Zealand. In the absence of an Australian Stan-
dard prior to 2010, NZS 6808 was also adopted in the state of
Victoria.
The main thrust of the 2010 revision of NZS 6808 related to
technical refinements and incremental enhancements. How-
ever, probably the most controversial addition to the Standard
is the provision for a more stringent ‘high amenity noise
limit’ where justified by special local circumstances.
PROCESS
NZS 6808 was first published in 1998. In accordance with
Standards New Zealand’s procedures, it was formally re-
viewed in 2004. At that time various potential technical re-
finements were identified, but the Standard was still being
successfully implemented. In practice, most acousticians
were applying the key changes now included in the 2010
revision. The decision was made in 2004 not to revise
NZS 6808 yet.
By 2007 the Standard was coming under increased pressure,
with questions being raised over how it should be applied.
This led the New Zealand Wind Energy Association and the
Energy Efficiency and Conservation Authority to commis-
sion research into the technical issues in question [4]. The
results of this research then triggered another formal review
of NZS 6808 by Standards New Zealand.
The review started with a scoping workshop in late 2007,
where all stakeholders agreed that a full revision of the Stan-
dard was appropriate. Standards New Zealand then consti-
tuted a technical committee in mid 2008 to conduct the revi-
sion. The majority of the committee’s work was conducted in
the second half of 2008. The author chaired this technical
committee.
Standards New Zealand forms technical committees by invit-
ing organisations that represent relevant stakeholders to
nominate a technical expert. In this instance, the nominating
organisations were:
• Energy Efficiency and Conservation Authority
• Executive of Community Boards
• Local Government New Zealand
• Massey University
• Ministry for the Environment
• Ministry of Health
• New Zealand Acoustical Society
• New Zealand Institute of Environmental Health Inc.
EXHIBIT A5-5
Page 1 of 4
.~
1&12010
005148

23-27 August 2010, Sydney, Australia Proceedings of 20th International Congress on Acoustics, ICA 2010
2 ICA 2010
• New Zealand Wind Energy Association
• Resource Management Law Association
• University of Auckland
The only representative without particular technical expertise
was the representative of the Executive of Community
Boards. A resident adjacent to a large wind farm was nomi-
nated. That individual had good technical aptitude, and made
a valuable contribution, providing critical review and ques-
tioning all assumptions.
Given the strong public interest in the revision, the evidence
based approach used to make decisions needed to be docu-
mented to a greater degree than normal. The committee ini-
tially split into working groups addressing different issues
such as noise limits, measurements and predictions. Each
working group submitted recommendations back to the main
committee, where they were vigorously debated and tested
against the evidence. The process was focussed on achieving
consensus, which requires general agreement, but not una-
nimity.
A draft of the proposed revision was circulated for public
comment in early 2009. The draft elicited over 600 public
submissions, which is unusual for a technical standard, and
reflects the public criticism of sound from some wind farms
in New Zealand. The committee made decisions on each
individual submission and prepared a final draft in mid 2009.
The last action for a technical committee is a ‘postal ballot’.
In this instance, several unexpected issues emerged at the
ballot through a number of negative votes. The draft was
therefore amended over the following months until consensus
was reached at the second postal ballot later in 2009.
There was still one negative vote at the second postal ballot,
from the representative of Massey University. That individual
has publicised his views [5], and acknowledges they are con-
trary to most international scientific opinion. The remainder
of the committee could not reconcile the arguments he ad-
vanced against the Standard, with scientific evidence, or the
framework for all other noise assessments in New Zealand.
Due to the negative vote and public sensitivity around this
Standard, the Standards Council would not issue its final
approval to publish the revision of NZS 6808 until it was
demonstrated in detail that Standards New Zealand had fol-
lowed correct procedures, and there were legitimate technical
reasons not to accept the issues raised by the negative vote.
This process and editorial matters resulted in publication of
the new Standard on 1 March 2010, ‘NZS 6808:2010’.
NOISE LIMITS
The committee found that the previous wind farm noise limit
of 40 dB LA95 or background +5 dB is still appropriate, as it
provides protection from adverse health effects and maintains
reasonable residential amenity.
In terms of potential adverse health effects, the committee
was guided primarily by the internal noise criteria of
30 dB LAeq given by the World Health Organisation [6]. New
Zealand experience is that a limit of 40 dB LA90 outside a
dwelling will result in compliance with this internal limit,
with windows slightly ajar for ventilation. The background
+ 5 dB variable part of the noise limit was retained, as the
potential effect of wind turbine sound reduces as the back-
ground sound increases, and a constant limit of 40 dB LA90
would be meaningless at higher wind speeds as there would
be no reliable way of measuring compliance.
For general environmental noise, NZS 6802 [7] provides a
guideline night-time noise limit at dwellings of
45 dB LAeq(15 min). The way the New Zealand planning
framework operates is that this guidance can be modified as it
is implemented in each local planning document (‘district
plan’) throughout the country. However, most plans set night-
time limits of 40 or 45 dB LAeq(15 min), or LA10 in older plans.
Therefore, the wind farm noise limit is consistent with noise
limits for, say, industrial or agricultural activities in rural
areas.
The committee also made reference to wind farm noise limits
in other countries, and found that while there is some varia-
tion, the noise limits in NZS 6808 are comparable with the
majority of countries.
Several issues arose in public submissions regarding noise
limits. Many of these submissions, such as requests for a
buffer zone around wind farms of several kilometres, regard-
less of the wind farm scale or local conditions, were simply
not compatible with the effects-based approach taken by the
New Zealand planning system. The benefit of the method in
NZS 6808 is that it accounts for the actual wind farm layout,
turbine type, wind conditions, topography and background
sound, thus providing an effects-based assessment.
It appears that some of the public submissions were seeking
inaudibility as a de facto criterion for wind farms, but this is
not a criterion applied to any other sound source in New Zea-
land. Another theme from submissions was a desire to allow
for people either sleeping outdoors on their decks or sleeping
with full height doors/windows left wide open. Night-time
noise limits for all other sound sources in New Zealand are
set on the basis of people inside with windows only partially
open for ventilation. The committee did not find any reason
for treating wind farms differently to other sound sources in
rural areas.
Special audible characteristics
An area of significant improvement in the 2010 revision is
the treatment of ‘special audible characteristics’. These are
distinguishing features of wind farm sound that attract a 5 dB
penalty if present. In 1998 this was addressed in only a basic
manner.
The first enhancement is NZS 6808 now states that, if it is
known in advance that a special audible characteristic will be
present at a dwelling, the wind farm should not proceed. The
penalties are now only to cater for unexpected characteristics
that arise during or after commissioning.
Since 1998 a sophisticated test method for tonality has been
developed and is included in ISO 1996-2 [8]. NZS 6808 now
simply refers to that Standard. There is an option for a sub-
jective assessment or a simplified assessment, but an objec-
tive assessment using ISO 1996-2 will take precedence.
Another issue that has emerged internationally since 1998 is
the possibility of ‘aerodynamic modulation’ [9] of wind farm
sound. However, it has been observed at very few wind farms
and none in New Zealand. An interim test method has now
been provided in NZS 6808 should aerodynamic modulation
be suspected. Aerodynamic modulation as a special audible
characteristic will be deemed to exist if the measured A-
weighted peak-to-trough levels exceed 5 dB on a regularly
varying basis, or if the measured third-octave band peak-to-
trough levels exceed 6 dB on a regular basis in respect of the
blade pass frequency. It is acknowledged that a more refined
test may be developed in future.
EXHIBIT A5-5
Page 2 of 4 005149

23-27 August 2010, Sydney, Australia Proceedings of 20th International Congress on Acoustics, ICA 2010
ICA 2010 3
High amenity noise limit
Generally, when there are low background sound levels at
dwellings, wind farms are not operating. However, there can
be dwellings in sheltered valleys which are quiet at times
when there is still enough wind for a wind farm to be operat-
ing. This concern was raised for a particular project in New
Zealand, where the local planning document also set a lower
than normal noise limit for general environmental noise. In
that case the fixed part of the wind farm noise limit was re-
duced to 35 dB LA95 when those wind conditions occur. To
detect those wind conditions an extensive and elaborate semi-
permanent sound and wind monitoring system was installed
at a number of dwellings around the wind farm. When back-
ground sound levels at a dwelling are lower than 25 dB LA95
and the wind speed at 10 m above ground level is less than
1.5 m/s, the lower noise limit applies. These controls are
highly inefficient and relatively expensive to implement. In
this case, the complexity of the noise limits appears to have
created additional anxiety for the residents.
With this precedent of a lower wind farm noise limit, similar
controls have since been proposed for several other wind
farms. However, given the justification for the 40 dB LA90
noise limit described above and the consistency with noise
limits for other sound sources, it is not obvious why this
lower limit should be more widespread.
The committee recognised that there may be some areas in
New Zealand where acoustics amenity is valued to a greater
degree than any development. For example, there are a hand-
ful of areas in the country where the general environmental
noise limit is less than 40 dB. The project for which a re-
duced wind farm noise limit was first imposed was in one of
those areas. The committee decided that in these cases, where
a public process had resulted in a local planning document
providing for increased protection of amenity, it may be ap-
propriate to provide for a ‘high amenity noise limit’ of
35 dB LA90 or background +5 dB, in the evening and at night.
Figure 1 illustrates the wind farm noise limits in NZS 6808.
30
35
40
45
50
55
20 25 30 35 40 45
Background sound level, dB
No
ise
lim
it, d
B
Noise limit
High amenity noise limit
Figure 1. NZS 6808 noise limits
The committee sought to reduce the complexity of the control
systems previously used to identify sensitive times when a
high amenity noise limit should apply. It was found that there
are no simple relationships that will identify all sensitive
times. Even with the elaborate monitoring systems at dwell-
ings used previously, a proportion of those times are missed.
However, it was decided that this was acceptable as
40 dB LA90 still protects health and maintains reasonable
amenity. A new control was devised that captures a similar or
greater number of sensitive times, simply by using the wind
farm wind speed. In cases where the high amenity noise limit
is justified, it now applies when the wind farm wind speed is
6 m/s or less. This provides a more efficient control that
should provide greater benefit for communities.
Alleged health effects
Another key issue that exercised the committee was reported
adverse health effects from wind turbine sound, such as ‘vi-
broacoustic disease’, ‘wind turbine syndrome’, and various
other low frequency sound and vibration effects. The com-
mittee reviewed a substantial volume of international litera-
ture on these alleged effects, including papers published
through to the middle of 2009 at the International Meeting on
Wind Turbine Noise.
Despite the volume of material on some of these alleged
health effects, the committee unanimously found that in all
cases the evidence did not show any causal link between the
effects claimed and wind turbine sound. There were funda-
mental weaknesses in the scientific methodology in all cases.
No evidence was found that a precautionary approach with
lower noise limits for wind turbine sound is necessary.
Some recent wind farm proposals in New Zealand have cre-
ated significant anxiety in the surrounding community. This
has been fuelled by the convictions of those promoting these
alleged health effects, and it remains a challenge to commu-
nicate the wider scientific view, such that communities may
then experience less anxiety.
TERMINOLOGY
A number of changes have been made to the terminology
used in NZS 6808. The most notable are:
LA90(10 min) – NZS 6808 previously used the L95 descriptor for
background and wind farm sound levels. However, in all
other New Zealand Standards since 1999, the L90 has been
adopted for background sound. This has now been changed in
NZS 6808, and it has also been brought in line with interna-
tional standards by adding the frequency-weighting and
measurement time interval (e.g. LA90(10 min)). Comparisons
were made between L90 and L95 data for wind farms and it
was shown that there were less than 0.5 dB differences.
Therefore no amendment was made to the noise limits.
Wind turbine – The 1998 version of NZS 6808 used the ac-
ronym ‘WTG’ for wind turbine generator. However, this is
no longer used in international standards, and the 2010 ver-
sion of NZS 6808 just uses the words ‘wind turbine’.
Small wind turbine – Under the 1998 version of NZS 6808
there was no differentiation of wind turbine sizes, and it was
possible for an extensive measurement methodology to be
required even for small wind turbines. The 2010 revision now
includes a definition of small wind turbine, taken from IEC
61400-2 [10], as anything with a swept area less than 200m2.
This encompasses reasonable sized wind turbines with up to
8 m blade lengths, but currently in New Zealand turbines
tend to be clearly one side or the other of this point. For small
wind turbines the Standard now allows for compliance with
the general environmental noise limits and also provides for
on/off testing.
MEASUREMENTS
NZS 6808 is based on wind turbine sound data measured in
accordance with IEC 61400-11 [11]. This currently requires
wind data to be referenced to 10 m above ground level. It has
been shown [12] that the simplistic algorithm to account for
wind shear in IEC 61400-11 can introduce significant errors,
particularly with taller wind turbines. This issue has been
eliminated in the 2010 revision of NZS 6808 by referencing
EXHIBIT A5-5
Page 3 of 4
/
-----------✓
/
/ /
/
005150

23-27 August 2010, Sydney, Australia Proceedings of 20th International Congress on Acoustics, ICA 2010
4 ICA 2010
all wind speed data to the wind turbine hub-height. Improved
techniques for measuring and modelling wind speed mean
that wind farm developers are usually able to provide hub-
height wind speeds to a good degree of accuracy.
The background +5 dB variable part of the noise limit re-
quires a relationship to be determined between background
sound levels and wind farm wind speed. In some cases good
correlations of the data are not achieved, such as when sound
levels are dominated by road-traffic, or when a location is
sheltered by terrain in certain wind directions. The committee
determined that a prescriptive procedure for the correlations
would not be practical as there are too many site specific
factors. However, significant additional guidance has been
provided, with various factors now required to be taken into
account. It is now explicit the degree to which data may need
to be separated into different times or wind conditions. Also,
notes are provided for issues such as measurements near
water courses and trees.
Uncertainty
Historically, uncertainty associated with environmental sound
measurements in New Zealand has not been reported. In
common with other New Zealand acoustics Standards that
have been recently revised, NZS 6808 now makes reference
to the University of Salford guidelines on uncertainty [13],
and promotes this as good practice. At this stage, given that
the acoustics industry needs to develop in this area, it is not
mandatory to state the uncertainty of measured levels.
PREDICTIONS
The 1998 version of NZS 6808 provided a simple propaga-
tion algorithm accounting just for distance attenuation and air
absorption, based on 500 Hz. While this is generally conser-
vative, the use of air absorption at 500 Hz can introduce sig-
nificant errors. Most practitioners using acoustics software
were implementing more sophisticated propagation models.
NZS 6808 now specifies a wide range of factors that must be
taken into account in propagation modelling and references
ISO 9613-2 [14] as an appropriate method. A simplified
method is still provided in an appendix, but the limitations
are clearly set-out and octave-bands are required for air ab-
sorption.
An issue that arises with the NZS 6808 method is that wind
turbine sound power data in accordance with IEC 61400-11
is in terms of LAeq, whereas the noise limits are in terms of
LA90. It has previously been suggested that an adjustment to
predications is justified as the LA90 will be lower than the
LAeq. However, the committee decided that as the difference
is variable [4], it is better to assume that a prediction based
on LAeq source data is taken to be an LA90. This provides a
small degree of conservatism in the predictions.
RESOURCE MANAGEMENT ACT
In New Zealand, the planning and consenting process is con-
trolled by the Resource Management Act. Under this Act, a
couple of issues often arise which were not adequately ad-
dressed in the 1998 version of NZS 6808.
Reverse sensitivity
‘Reverse sensitivity’ issues could arise if a new dwelling was
constructed adjacent to an existing wind farm, and then com-
plaints by the new residents restricted the operation of the
wind farm. This can be addressed by alerting prospective
residents to the effects of a consented or existing wind farm,
and NZS 6808 now provides guidance on this issue.
Cumulative effects
NZS 6808 was previously silent on the issue of cumulative
noise effects from multiple wind farms or a single wind farm
developed in stages. It has now been made clear that the
noise limits apply to the combination of all wind farm sound
affecting any dwelling, and that background sound level
measurements used for determining the background +5 dB
limits must exclude any existing wind farm sound.
Conditions
In New Zealand, development or planning (‘resource’) con-
sents are usually granted subject to conditions. These condi-
tions may reference Standards, but they also have to explic-
itly include the actual noise limits and assessment points.
As noted previously, in the author’s opinion, convoluted
consent conditions for recent wind farms have resulted in
significant inconsistency and have contributed to community
confusion and anxiety. To ensure the new revision of
NZS 6808 is applied consistently and robustly, a set of model
conditions have been provided in an appendix.
CONCLUSIONS
A two year revision process was undertaken for the New
Zealand wind farm noise Standard, NZS 6808, from 2008 to
publication in 2010. The fundamental method of the 1998
version was found to be robust. The key changes made were
a raft of technical refinements and incremental enhance-
ments. Other changes include provision for a high amenity
noise limit in specific areas.
REFERENCES
1 NZS 6808:1998. Acoustics – The assessment and meas-
urement of sound from wind turbine generators.
2 NZS 6808:2010. Acoustics – Wind farm noise.
3 ETSU-R-97. The assessment and rating of noise from
wind farms. 1996.
4 Malcolm Hunt Associates and Marshall Day Acoustics.
Stakeholder review and technical comments, NZS
6808:1998. 2007.
5 P.J. Dickinson. “Nonsense on stilts, A new draft wind
turbine noise standard”, Proceedings of Acoustics 2009.
Adelaide 2009.
6 B. Berglund, T. Lindvall and D. Schwela (Eds). Guide-
lines for community noise. World Health Organization.
1999.
7 NZS 6802:2008. Acoustics – Environmental noise.
8 ISO 1996-2:2007. Acoustics – Description, measurement
and assessment of environmental noise. Part 2 Determi-
nation of environmental noise levels.
9 University of Salford. Research into aerodynamic modu-
lation of wind turbine noise. 2007.
10 IEC 61400-2:2006. Wind turbines. Part 2 Design re-
quirements for small wind turbines.
11 IEC 61400-11:2006. Wind turbines. Part 11 Acoustic
noise measurement techniques.
12 P. Botha, “The use of 10m wind speed measurements in
assessment of wind farm developments”. Proceedings of
the 1st International Meeting on Wind Turbine Noise,
Berlin 2005.
13 N.J. Craven and G. Kerry. A good practice guide on the
sources and magnitude of uncertainty arising in the prac-
tical measurement of environmental noise. University of
Salford. 2001. ISBN 0-9541649-0-3.
14 ISO 9613-2:1996. Acoustics – Attenuation of sound dur-
ing propagation outdoors Part 2 General method of cal-
culation.
EXHIBIT A5-5
Page 4 of 4 005151

Noise annoyance from wind turbines - a review Eja Pedersen, Högskolan i Halmstad
R e p o r t 5 3 0 8 · A u g u s t 2 0 0 3
EXHIBIT A5-6
Page 1 of 27 005152
Noise annoyance from wind turbines a review
Eja Pedersen, Högskolan i Halmstad
NATURVÅRDSVERKET SWEDISH ENVIRONMENTAL PROTECTION AGENCY
EXHIBIT A5-6
Page 2 of 27 005153

Orders Order telephone: +46 (0)8-505 933 40
Order telefax: + 46 (0)8-505 933 99 E-mail: [email protected]
Adress: CM-Gruppen Box 1110 93 SE-161 11 Bromma, Sweden
Internet: www.naturvardsverket.se/bokhandeln Naturvårdsverket, Swedish Environmental Protection Agency
Telephone: +46 (0)8-698 10 00 (switchboard) www: naturvardsverket.se
Address: Naturvårdsverket, SE-106 10 00 Stockholm, Sweden ISBN 91-620-5308-6.pdf ISSN 0282-7298
� Naturvårdsverket 2003
Digital publication
EXHIBIT A5-6
Page 3 of 27 005154

SWEDISH ENVIRONMENTAL PROTECTION AGENCY Report 5308 Noise annoyance from wind turbines – a review
3
Preface Wind power is a relatively new generator of electricity in Sweden. Legislation and regulation regarding noise from wind turbines in Sweden have been discussed. Eja Pedersen at Halmstad University has at the request of the Swedish Environmental Protection Agency prepared this report as a base for further discussions on regulation and guidelines on noise from wind turbines in Sweden. The report reviews the present knowledge on perception and annoyance of noise from wind turbines in residential areas as well as in recreational areas. It also summarizes regulations in some European countries. The author Eja Pedersen is responsible for the content of the report.
Stockholm, August 2003
EXHIBIT A5-6
Page 4 of 27 005155

SWEDISH ENVIRONMENTAL PROTECTION AGENCY Report 5308 Noise annoyance from wind turbines – a review
4
Contents Preface................................................................................................................ 3
Contents.............................................................................................................. 4
Summary............................................................................................................. 5
Sammanfattning .................................................................................................. 6
1. Introduction ..................................................................................................... 7
2. Method ............................................................................................................ 8
3. Results ............................................................................................................ 9 3.1 Noise sources from wind turbines, sound characteristics and masking possibilities .... 9 3.2 Perception and noise annoyance from wind turbines in living areas .......................... 11 3.3 Perception of noise from wind turbines in wilderness recreational areas ................... 15 3.4 Aspects of health and well-being ................................................................................ 18 3.5 A comparison of noise regulations in European countries.......................................... 19
4. Conclusions................................................................................................... 22
5. References.................................................................................................... 23
EXHIBIT A5-6
Page 5 of 27 005156

SWEDISH ENVIRONMENTAL PROTECTION AGENCY Report 5308 Noise annoyance from wind turbines – a review
5
Summary This study summarises present knowledge on noise perception and annoyances from wind turbines in areas were people live or spend recreation time. There are two main types of noise from a wind turbine: mechanical noise and aerodynamic noise. The aerodynamic noise emits from the rotor blades passing the air. It has a swishing character with a modulation that makes it noticeable from the background noise. This part of the wind turbine noise was found to be the most annoying.
Field studies performed among people living in the vicinity of wind turbines showed that there was a correlation between sound pressure level and noise annoyance, but annoyance was also influenced by visual factors such as the attitude to wind turbines’ impact on the landscape. Noise annoyance was found at lower sound pressure levels than in studies of annoyance from traffic noise. There is no scientific evidence that noise at levels created by wind turbines could cause health problems other than annoyance.
No studies on noise from wind turbines in wilderness areas have been found, but the reaction to other noise sources such as aircraft have been studied. In recreational areas, the expectation of quietness is high among visitors, but wind turbines are, in contrary to aircraft, stationary and could be avoided by recreationists. The visual impact of wind turbines might though be the dominant source of annoyance.
Regulations on noise from wind turbines are based on different principles. Some states, e.g. Denmark, have a special legislation concerning wind turbines, while others, like Sweden, have used recommendations originally developed for a different noise source. The noise level could either be absolute, as in Germany, or related to the background noise level as in France. This background noise level could be standardised, measured or related to wind speed.
EXHIBIT A5-6
Page 6 of 27 005157

SWEDISH ENVIRONMENTAL PROTECTION AGENCY Report 5308 Noise annoyance from wind turbines – a review
6
Sammanfattning Denna rapport har tagits fram av Eja Pedersen, Högskolan i Halmstad på uppdrag av Naturvårdsverket. Syftet är att ge underlag för fortsatta diskussioner om bedömning av ljud från vindkraftverk i Sverige
Rapporten sammanfattar kunskapsläget kring människors uppfattning och störning av buller från vindkraftverk vid bostäder och i friluftsområden. Vindkraftverk ger upphov till två typer av ljud: mekaniskt och aerodynamiskt. Det aerodynamiska ljudet uppstår när rotorbladen passerar luften. Det har en svischande karaktär med en modulation som gör det urskiljningsbart från bakgrundsljudet. Den här delen av vindkraftljudet har visat sig vara mest störande.
I fältstudier genomförda bland människor boende i närheten av vindkraftverk fann man ett samband mellan ljudnivå och bullerstörning, men störningen påverkades också av visuella faktorer som attityden till vindkraftverkens påverkan på landskapsbilden. Andelen störda av buller var högre än vad som tidigare funnits i studier av trafikbuller. Det finns inga vetenskapliga bevis för att buller med de nivåer som vindkraftverk ger upphov till skulle kunna orsaka hälsoproblem andra än störning.
Det gick inte att hitta några studier som behandlade buller från vindkraftverk i vild-mark, men effekten av andra bullerkällor såsom flyg har studerats. I friluftsområden är förväntningen på tystnad hög hos besökarna, men vindkraftverk är till skillnad från flyg en stationär källa och kan undvikas av besökarna. Det visuella intrycket av vindkraftver-ken kan därför vara den dominerande källan till störning.
Regler för buller från vindkraftverk baseras på olika principer. I några länder, t.ex. i Danmark, finns en speciell lagstiftning för vindkraftverk, medan man i andra, som Sverige, använder rekommendationer ursprungligen framtagna för en annan bullerkälla. Gränsvärdet för buller kan antingen vara absolut, som i Tyskland, eller relateras till bakgrundsljudets nivå. Ljudnivån i bakgrundsljudet kan vara standardiserad, mätt eller relaterad till vindstyrka.
EXHIBIT A5-6
Page 7 of 27 005158

SWEDISH ENVIRONMENTAL PROTECTION AGENCY Report 5308 Noise annoyance from wind turbines – a review
7
1. Introduction The aim of this study is to summarise present knowledge on noise perception and annoyance from wind turbines in areas where people live or spend time for recreational purposes. This review will also present examples of legislation regarding noise from wind turbines. The study was financed by the Swedish Environmental Protection Agency to form a base for regulation regarding wind turbine noise. Kerstin Persson Waye has 1995 reviewed noise annoyance from wind turbines [Persson Waye 1995]. The present study will recall some of her results, but focus on articles published from 1995 and later.
Noise from wind turbines is a relatively new noise source in Sweden. It can be classi-fied as an outdoor source of community noise. WHO defines community noise as noise emitted from all noise sources except at occupational settings [Berglund et al 1999]. This includes for example road, rail and air traffic, industries, construction and public work as well as neighbours.
This study does not examine the measurements and calculations of noise exposure used in various studies. As many assumptions, on for instance sound pressure levels causing annoyance or sleep disturbance, are based on dose-response relationships were the dose were either measured or calculated (or both) this is a crucial point. This is though a matter of acoustics and not within the subject of this review.
EXHIBIT A5-6
Page 8 of 27 005159

SWEDISH ENVIRONMENTAL PROTECTION AGENCY Report 5308 Noise annoyance from wind turbines – a review
8
2. Method Reviewed articles were searched for in relevant databases (Medline, SveMed, ISI, Science direct, Papers First) as well as in journals relevant for the topic. As these searches did not result in many articles, proceedings from well-known conferences have been searched in addition. One must bear in mind that this latter type of papers has often been accepted to conferences without closer examination. As a complement, Internet was searched. Direct contacts with researchers and developers have been made regarding health aspects and noise regulations.
EXHIBIT A5-6
Page 9 of 27 005160

SWEDISH ENVIRONMENTAL PROTECTION AGENCY Report 5308 Noise annoyance from wind turbines – a review
9
3. Results 3.1 Noise sources from wind turbines, sound characteristics and masking possibilities
There are two main types of noises from a wind turbine: mechanical noise and aerody-namic noise. Mechanical noise is mainly generated by the gearbox, but also by other parts such as the generator [Lowson 1996]. Mechanical noise has a dominant energy within the frequencies below 1000 Hz and may contain discrete tone components. Tones are known to be more annoying than noise without tones, but both the mechanical noise and tones that may occur can be reduced efficiently [Wagner et al 1996]. In the turbines erected during the last ten years, the manufacturers have been able to reduce the mechanical noise to a level below the aerodynamic noise. This is also due to the fact that the size of the turbines has increased and mechanical noise does not increase with the dimensions of turbine as rapidly as aerodynamic noise.
The aerodynamic noise from wind turbines originates mainly from the flow of air around the blades and therefore the noise generally increases with tip speed. It is directly linked to the production of power and therefore inevitable [Lowson 1996]; even though it could be reduced to some extend by altering the design of the blades [Wagner et al 1996]. The aerodynamic noise has a broadband character and is typically the dominating part of wind turbine noise today.
When listening to a wind turbine, one may distinguish broadband noise and a beating noise. Broadband noise is characterised by a continuous distribution of sound pressure. The beating noise is amplitude modulated, i.e. the sound pressure level rises and falls with time. This noise is of interest for this review, as it seems to be more annoying than a non-modulated noise at the same sound pressure level. Only a few studies have however explicitly compared noises with and without modulations. In one experimental study, it was found that a 30 Hz tone, amplitude modulated with a modulation frequency of 2.5 Hz, generally caused higher annoyance, symptoms and change in mood, however the difference compared to a non-modulated tone at 30 Hz was only statistically significantly different for subjective reports of drowsiness [Persson et al 1993]. It has also been found that annoyance caused by diesel trains decreases when the modulation depth was reduced over time from 13 dB to 5 dB [Kantarelis and Walker 1988]. Modulated noise from wind turbines has the beat of the rotor blades’ pace. The amplitude modulation has in experimental studies found to be most apparent in the 1 and 2 kHz octave band with amplitude of ± 2-3 dB [Dunbabin 1996]. Theories have been put forward regarding the source and extent of the amplitude modulation. One possible mechanism is the interaction of the blade with disturbed airflow around the tower, another the directionality of radiation from the blades as they rotate. Finally it is possible that variation in noise levels occur due to the atmospheric wind profile, which would result in a slight variation in angel of attack as the blade rotates [Dunbabin 1996]. In summery, the modulation in the noise from wind turbines is not yet fully explained and will probably not be reduced in
EXHIBIT A5-6
Page 10 of 27 005161

SWEDISH ENVIRONMENTAL PROTECTION AGENCY Report 5308 Noise annoyance from wind turbines – a review
10
the near future and is therefore a factor of importance when discussing noise annoyance from wind turbines.
The modulation frequency for a three-blade 600 kW turbine, a common size in Sweden today, with a steady speed of 26 rpm is 1.3 Hz. This is a frequency somewhat lower than the frequency of 4Hz known to be most easily detected by the human ear [Zwicker and Feldtkeller 1967]. The amplitude of the modulation does not have to be very high. The threshold for detection of a sound with a modulation frequency of 1 Hz was in one experimental study found to be 1-2 dB below a masking noise (white noise). The masking noise had its energy within the same frequency band as the modulated sound, thus providing optimal possibilities for masking. It was also found that the detection threshold was not depending on modulation depth or modulation frequencies (1Hz and 10 Hz) [Arlinger and Gustafsson 1988]. The new turbines erected today often have variable rotor speed. This means that the modulation frequency will be low at low wind speed, typically 0.5 Hz at 4 m/s and higher at high wind speed, typically 1.0 Hz at 20 m/s. This is still in the span were modulations could easily be detected. A lower modulation frequency is preferable, as it will then be less detectable and also most likely less annoying. It is however not known how much less annoying these types of turbines will be.
In experimental studies, where 25 subjects were exposed to five different wind turbine noises at the level of 40 dBA Leq, differences between the noises regarding annoyance were found [Persson Waye and Öhrström 2002]. The most annoying noises were predominantly described as “swishing”, “lapping” and “whistling”. These adjectives could all be seen as related to the aerodynamic noise and as descriptions of a time varying (modulated) noise with high frequency content.
In summery it can be concluded that the modulating characteristics of the sound makes it more likely to be noticed and less masked by background noise. Recent reports have indicated yet another complication. Common hub height of the operating wind turbines today in Sweden is 40-50 meters. The new larger turbines are often placed on towers of 80 – 90 meters. The wind speed at this height compared to the wind speed at the ground might (up to now) been underestimated. In a report published by Rijksuniversiteit Groningen it was found that the wind speed at 80 meter was 4.9 times higher then at 10 meter at night instead of 1.4 times as calculated [Kloosterman et al 2002]. The study was rather small, but indicates that the masking of the background noise is lower than calculated. Further studies need to be performed.
Topographical conditions at site have importance for the degrees to which the noises from wind turbines are masked by the wind. Dwellings that are positioned within deep valleys or are sheltered from the wind in other ways may be exposed to low levels of background noise, even though the wind is strong at the position of the wind turbine [Hayes 1996]. The noise from the turbine may on these conditions be perceived at lower sound pressure levels then expected. Current recommendation state that measures and sound propagation calculations should be based on a wind speed of 8 m/s at 10 meter above the ground, down wind conditions, creating a "worst case" scenario. This recommendation does not consider the case described above.
EXHIBIT A5-6
Page 11 of 27 005162
SWEDISH ENVIRONMENTAL PROTECTION AGENCY Report 5308 Noise annoyance from wind turbines – a review
11
3.2. Perception and noise annoyance from wind turbines in living areas
Noise from wind turbines can be more or less distinguished depending on the difference between noise from the wind turbine and the background noise. The background noise, for example traffic noise, noise from industries and the whistling in bushes and trees, vary from site to site, but also from day to night. The local environment at the dwelling could also cause a difference in wind speed between the wind turbine and the listener. An example of topographical conditions enlarging the differences in wind speed was described in chapter 3.1. Also less extreme local physical circumstances, as the placing of houses, may shelter the site from wind on the ground, lowering the background noise so that the noise from the wind turbine will be more easily heard.
Only few field studies on noise annoyance among people living close to wind turbines have been carried out. A major study, partly financed by the European Community, was performed in Denmark, the Netherlands and Germany in the beginning of the 1990's [Wolsink et al 1993]. Results from the Danish part of the study were analysed further and presented in a separate report [Holm Pedersen and Skovgard Nielsen 1994]. A Swedish dose-response study was performed 2000 [Pedersen and Persson Waye 2002]. The three studies all explore the correlation between noise exposure from wind turbines (dose) and the noise annoyance among the residents (response), as well as other variables of importance for annoyance. Unfortunately none of these studies has yet been published in refereed journals.
In the European study presented by Wolsink et al [1993], sixteen sites in the three countries comprising residents living within noise levels of 35 dBA were selected. As a certain variance had to be included in the study, residence living at sound pressure levels <25dBA to 60 dBA were chosen, though the major portion or 70% lived within noise levels of 30-40 dBA. The sites comprised a total of 134 turbines: 86 in the Netherlands, 30 in Germany and 18 in Denmark. Most of the turbines were small. Only 20 of them had a power of 500 kW, all the rest were of 300 kW or less.
The results presented were based on a total of 574 interviews: 159 in the Netherlands, 216 in Germany and 199 in Denmark. The response rate is not known. A questionnaire including questions on noise (annoyance, perceived loudness and interference), attitude to wind power, residential quality and stress were used for the interviews. Sound pressure levels were measured on sites, but how these measurements were made is not clear. Sound pressure level strata were calculated with 5 dBA intervals.
Only a weak correlation between sound pressure level and noise annoyance caused by wind turbines could be found (Kendall’s coefficient for correlating rank order variables t=0.09; p<0.05). The proportion annoyed by noise from wind turbines was 6.4% (n=37). The perceived loudness was also low, as well as the interference of noise with various daily activities. Residents complaining about wind turbines noise perceived more sound characteristics (t=0.56; p<0.001) and reported more interference of daily activities (t=0.56; p>0.001). The noise produced by the blades lead to most complaints. Most of the annoyance was experienced between 16.00 p.m. and midnight.
EXHIBIT A5-6
Page 12 of 27 005163

SWEDISH ENVIRONMENTAL PROTECTION AGENCY Report 5308 Noise annoyance from wind turbines – a review
12
Wolsink et al (1993) also evaluated other physical variables and their relation to noise annoyance, e.g. distance between residence and the wind turbine site, location with regard to wind direction, other buildings or natural barriers between the residence and the wind turbine. When adding these variables to the analysis, the objectively measured sound pressure level was no longer significantly related to noise annoyance. Other variables, both subjective and objective, were tried in a multivariate analyse of the level of annoyance of noise from wind turbines. Four variables had an impact of noise annoyance: stress caused by wind turbine noise, daily hassles, perceived effects of wind turbines in the landscape (visual intrusion) and the age of the turbine site (the longer it has been operating, the less annoyance). These four variables explained 53% of the variance of noise annoyance. Variables that had no impact on noise annoyance in the model were e.g. buildings between the residence and the wind turbine or objective sound pressure level. The results should be treated with caution, as the actual level of annoyance among the large majority of the subjects was low.
The Danish part of the study was, as mentioned, presented in a separate report. The 18 wind turbines on the selected sites were rather small; i.e. they had a power of 45 kW to 155kW. The hub height ranged from 18 to 33 meters, with a median of 23 meters. Interviews with 200 residents were performed. The questions agreed on in the European study were used, as well as additional questions. The survey was masked to the respon-dents as a study on general living conditions. The response rate is not known. A number of objective variables were linked to each respondent, e.g. distance and direction to nearest wind turbine, barriers between residence and turbine, trees or bushes that could mask the noise and a variable called visual angle. The visual angle was measured in degrees from the respondents dwelling to the hub with the ground as the horizontal line. This variable was included as a measure of visual impact. Several noise variables were also added. Sound pressure levels were measured on a ground board at a distance of 1-2 times the hub-height behind the turbine at the same time as the wind was measured at 10 meters height in front of the turbine. Sound pressure levels for each dwelling were then calculated in two ways; not including the influence of barriers and including the influence of barriers. Both reflect downwind conditions at 5 and 8 m/s. The sound was also analysed for tones.
The proportion rather annoyed by noise from wind turbines was 7% (n=14) and the proportion very annoyed was 4% (n=4). The annoyance increased with increasing sound pressure level. At Lr=40dBA (calculated LpA and 5dB added to for audible tones) the mean annoyance was 0.25 at a scale from 0 to 10. Comparing this with the distance and the visual angle, the distance should exceed 300 meters and the visual angle should be less than 3.5 degrees if the annoyance should be kept below 0.25. The angle 3.5 degrees correspond approximately to a distance from the dwelling to the turbine of 16 times the hub-height. A linear regression showed that the objective variable that had the greatest impact on noise annoyance was the visual angle that explained 12% of the variance. Of the variables describing sound properties, the once including LpA (A-weighted sound pressure level) and Lr (5dB added to LpA for audible tones), were also of importance, but to a lesser extend. There was no difference when the sound was calculated for 5 m/s or for 8 m/s. The visual angle and the variables describing sound properties were in turns correlated to each other. Subjective variables were also tried in a linear regression, which
EXHIBIT A5-6
Page 13 of 27 005164

SWEDISH ENVIRONMENTAL PROTECTION AGENCY Report 5308 Noise annoyance from wind turbines – a review
13
showed that whether the turbine noise could be heard or not had the greatest impact on noise annoyance and explained 49% of the variance. Three other subjective variables were also of importance: perception of shadows (r2=0.23), perception of flicker (r2=0.25) and the attitude to the turbines’ impact on the landscape (r2=0.23). All these are visual. The conclusion of the authors of the Danish study was that both sound pressure level and visual variables have an impact on noise annoyance.
The Swedish study was performed in Laholm during May-June 2000. The areas chosen comprised in total 16 wind turbines thereof 14 had a power of 600 kW. The study base comprised one randomly selected subject between the ages of 18 and 75 in each household living within a calculated wind turbine sound pressure level of 25 to 40 dBA (n=518).
The annoyance was measured using a questionnaire. The purpose of the study was masked and among questions on living conditions in the countryside, questions directly related to wind turbines were included. Annoyance from several outdoor sources was asked for regarding the degree of annoyance both outdoor and indoor. Annoyance was measured with a 5-graded verbal scale ranging from “do not notice” to “very annoyed”. The same scale was used for measuring annoyance from wind turbines specifically (noise, shadows, reflections, changed view and psycho-acoustical characters). The respondents’ attitude of the impact of wind turbines on the landscape scenery and the attitude to wind power in general were also measured with a 5-graded verbal scale, ranging from “very positive” to “very negative”. Questions regarding living conditions, health, sensitivity to noise and employment were also included. A total of 356 respondents answered the questionnaire, which gave a total response-rate of 69%.
For each respondent calculated A-weighted sound pressure level as well as distance and direction to the nearest wind turbine were obtained. Sound pressure levels (dBA) were calculated at 2.5-decibel intervals for each household. The calculations were done in accordance with [Naturvårdsveket 2001] and reflect downwind conditions. Data of distance between the dwelling of the respondent and the nearest wind turbine, as well as the direction, was obtained from maps.
The correlation between noise annoyance from wind turbines and sound pressure level was statistically significant (rs=0.399; n=341; p<0.001). The annoyance increased with increasing sound pressure level at sound pressure levels exceeding 35 dBA. No respondent stated them selves very annoyed at sound pressure levels below 32.5 dBA (Figure 1). At sound pressure levels in the range of 37.5 to 40.0 dBA, 20% were very annoyed and above 40 dBA 36%. The confidence intervals were though wide; see Figure 1.
EXHIBIT A5-6
Page 14 of 27 005165
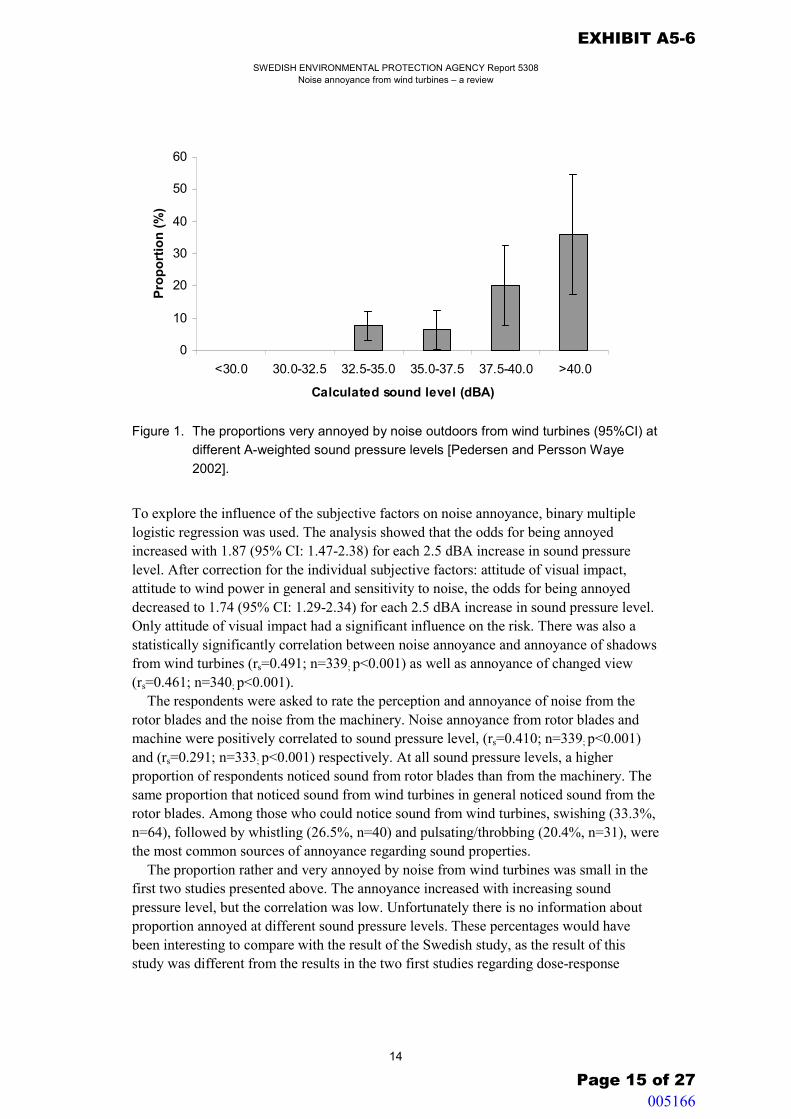
SWEDISH ENVIRONMENTAL PROTECTION AGENCY Report 5308 Noise annoyance from wind turbines – a review
14
0
10
20
30
40
50
60
<30.0 30.0-32.5 32.5-35.0 35.0-37.5 37.5-40.0 >40.0
Calculated sound level (dBA)
Prop
ortio
n (%
)
Figure 1. The proportions very annoyed by noise outdoors from wind turbines (95%CI) at
different A-weighted sound pressure levels [Pedersen and Persson Waye 2002].
To explore the influence of the subjective factors on noise annoyance, binary multiple logistic regression was used. The analysis showed that the odds for being annoyed increased with 1.87 (95% CI: 1.47-2.38) for each 2.5 dBA increase in sound pressure level. After correction for the individual subjective factors: attitude of visual impact, attitude to wind power in general and sensitivity to noise, the odds for being annoyed decreased to 1.74 (95% CI: 1.29-2.34) for each 2.5 dBA increase in sound pressure level. Only attitude of visual impact had a significant influence on the risk. There was also a statistically significantly correlation between noise annoyance and annoyance of shadows from wind turbines (rs=0.491; n=339; p<0.001) as well as annoyance of changed view (rs=0.461; n=340; p<0.001).
The respondents were asked to rate the perception and annoyance of noise from the rotor blades and the noise from the machinery. Noise annoyance from rotor blades and machine were positively correlated to sound pressure level, (rs=0.410; n=339; p<0.001) and (rs=0.291; n=333; p<0.001) respectively. At all sound pressure levels, a higher proportion of respondents noticed sound from rotor blades than from the machinery. The same proportion that noticed sound from wind turbines in general noticed sound from the rotor blades. Among those who could notice sound from wind turbines, swishing (33.3%, n=64), followed by whistling (26.5%, n=40) and pulsating/throbbing (20.4%, n=31), were the most common sources of annoyance regarding sound properties.
The proportion rather and very annoyed by noise from wind turbines was small in the first two studies presented above. The annoyance increased with increasing sound pressure level, but the correlation was low. Unfortunately there is no information about proportion annoyed at different sound pressure levels. These percentages would have been interesting to compare with the result of the Swedish study, as the result of this study was different from the results in the two first studies regarding dose-response
EXHIBIT A5-6
Page 15 of 27 005166
SWEDISH ENVIRONMENTAL PROTECTION AGENCY Report 5308 Noise annoyance from wind turbines – a review
15
correlation. In the Swedish study, the proportion very annoyed from wind turbine noise was rather high at sound pressure levels exceeding 37.5 dBA, and a firm correlation between sound pressure level and annoyance was found. All studies find a relation between noise annoyance and visual factors such as visual intrusion and shadows. These factors probably explain part of the noise annoyance. All three studies were performed among residents exposed to rather low sound pressure levels from wind turbines. Still annoyance occurred to some extent. In the noise, the aerodynamic part was found to be the most annoying, stressing the relevance of the sound characteristic, which is also in accordance with previous experimental studies [Persson Waye and Öhrström 2002].
3.3 Perception of noise from wind turbines in wilderness recreational areas
The special soundscape1 of wilderness recreational areas has been described by a number of authors, e.g. [Miller 2001, Dickinson 2002]. The soundscape differs from site to site and can be very quiet in remote areas, especially when vegetation is sparse (as in the Swedish bare mountain region). In a comparison between different outdoor settings in USA, it was found that the sound pressure level in a suburban area at nighttime was above 40 dBA, along a river in Grand Canyon 30-40 dBA and at a remote trail in the same park 10-20 dBA [Miller, 2002]. The effect of intruding sound should be judged in relation to the natural ambient soundscape. The sound pressure level of the intruding sound must be compared to the sound pressure levels of the background noise. The durability of audibility is another variable of importance for understanding visitors’ reactions to noise [Miller 2001].
No studies on noise from wind turbines in wilderness areas have to my knowledge been carried out, but the effect of noise from other sources has been discussed in a few articles. A larger study on noise annoyance from aircraft over-flights on wilderness recreationists was performed in three wilderness areas in USA [Fidell et al 1996]. The areas were chosen specifically for their expected relatively large number of aircraft over-flights. On-site interviews regarding noise annoyance were conducted among visitors. The response rate was 96% (n=920). In addition, more than 2000 h of automated, A-weighted sound pressure level measurements were made as well as forty-six hours of recordings. Out of these, day-night average sound pressure levels (DNL) of visitors’ total noise exposure and their exposure to indigenous sound for the time-period of interview-ing were estimated.
1 One definition of soundscape can be found in "The Handbook for acoustic ecology", Truax, B. (ed) R.C.
Publications, Vancouver, Canada. 1978. ”SOUNDSCAPE: An environment of sound (sonic environment) with emphasis on the way it is perceived and understood by the individual, or by a society. It thus depends on the relationship between the individual and any such environment.”
EXHIBIT A5-6
Page 16 of 27 005167

SWEDISH ENVIRONMENTAL PROTECTION AGENCY Report 5308 Noise annoyance from wind turbines – a review
16
Table 1. Prevalence of annoyance and estimated cumulative exposure to aircraft noise
[Fidell et al 1996]
%Highly annoyed2 Aircraft DNL Ambient DNL Total DNL Golden Trout 12 50 dB 47 dB 52 dB
Cohutta 2 47 dB 52 dB 53 dB Superstition 1 34 dB 38 dB 39 dB
The results showed that the large majorities (75%-92%) of respondents were not annoyed3 by noise of over-flights in the three wilderness areas studied. A minority (1%-12%) was highly annoyed. Aircraft that typically produced higher noise levels (low flying jets and helicopters) or operated at shorter slant ranges from observers were reported to be more annoying than small propeller driven aircraft and high altitude jet transports. Little evidence was found that over-flights diminished respondent’s overall enjoyment of their visits, nor their intention to return for additional visits. Other aspects of wilderness visits than noise annoyance were of more importance to the visitors than noise from aircraft, e.g. inadequate trail maintenance, crowding, insects and weather. The study was followed up with a telephone survey among visitors from nine wilderness areas in addition to the three selected for the first study. The results were on the whole the same. Fidell and co-workers compared their data with a theoretically derived dosage response relationship between the prevalence of annoyance in residential setting and exposure to general transportation noise. This suggested that respondents engaged in outdoor recreation in three wilderness areas included in the study described themselves as highly annoyed by 7 dB less aircraft noise exposure than would be tolerable in a residential setting.
A quasi-experimental field study on aircraft noise in recreational areas was performed in Norway [Aasvang and Engdahl 1999]. Two groups of people (n=10, n=16) were exposed to aircraft noise in a recreational area close to Fornebu Airport in Oslo and asked to rate their annoyance of noise during a 45-minute section. At the same time the number of over-flights and noise levels were measured. The correlation between noise exposure and annoyance was statistically significant. Of interest for this review is the rating of acceptable annoyance that the subjects were asked to do. Comparing the acceptance with the noise exposure in a linear regression, 50% of the subjects in group-1 considered the noise as not acceptable at sound pressure levels above 60 Laeq (dB). In group-2, who were exposed to less discernible noise events and lower noise levels due to different wind conditions, 50% did not accept sound pressure levels above 50 Laeq (dB). One should be aware of the small number of subjects in each group. Noticeable is that the background noise level for the first group was 40.2 Laeq (dB) and for the second group 42.6 Laeq (dB). Aasvang and Engdahl discussed several explanations of the different outcomes of the two groups. One suggestion was that air flight approach operations are more annoying than departures, even though they resulted in lower sound pressure levels. Due to wind conditions, the exposure of group 2 was dominated by approach operations.
2 The definition of highly annoyed used in this study has not been found. 3 The definition of not annoyed used in this study has not been found.
EXHIBIT A5-6
Page 17 of 27 005168

SWEDISH ENVIRONMENTAL PROTECTION AGENCY Report 5308 Noise annoyance from wind turbines – a review
17
Another Norwegian study on aircraft disturbance was carried out as an on-site study in a recreational mountain area [Krog et al 2000]. Daily over-flights were planned together with the Norwegian Air Force so that hikers would be exposed to aircraft noise at different level and different frequency. Interviews with visitors were performed near the end of a walking trail. The purpose of the study was masked, i.e. the study was presented as a general survey about outdoor recreation. A total of 761 respondents participated in the survey. The response rate is not known. Of the respondents exposed to over-flights (n=386), 56% found the aircraft noise very disturbing. When dividing the exposed into four different groups, according to which flying pattern they were exposed to, no differences between the rates of annoyance could be found between the groups. The results also showed that the disturbance due to military aircraft noise increased with increasing age, increasing total noise exposure and increasing duration of time spent on the hike. However, there was no significant difference between the exposed and the unexposed group regarding the overall satisfaction with today’s hike. Among the exposed subjects, it was found that the more negative evaluation of military aircraft noise, the higher the likelihood to judge the hike as less positive.
Staffan Hygge has recently in a report for the Swedish National Rail Administration (Banverket) and National Road Administration of Sweden (Vägverket) summarised studies on noise annoyance in recreational areas and national parks [Hygge 2001]. Though the overall proportion of annoyed by aircraft noise is low in many studies, the individual factors are of importance for annoyance. For visitors who seek quietness just hearing any sound from aircraft could be bothering. Hygge also discusses possible cultural differences in acceptance of noise in recreational areas. American studies show a lower proportion of annoyed than studies from Norway and New Zealand. This could be due to the fact that that the non-American studies were done in remote areas which presumable gives a group of respondent with a special profile, seeking quietness. He also discusses other sources of transportation noise and finds an indication that the legitimacy is of importance, e.g. rescue flights are more accepted than sightseeing tours.
Aircraft over-flight is a mobile source of noise in contrary to noise from wind turbines, so the two cannot directly be compared. Noise from wind turbines is more similar to noise from ski lifts. The noise source is stationary and the visitors can usually choose themselves if the like to stay by the noise or move on. Ski lifts are operating at special hours in the winter and they can be assumed to produce noise at comparable sound pressure levels when they are operating. Wind turbines are operating all year around, day and night, but the sound pressure levels vary with the wind and noise is only produced at special conditions.
Some results from the aircraft studies could though be transferred. The expectation of quietness is high among visitors and Fidell et al [1996] estimated that the noise level tolerated in wilderness areas compared to residential areas was 7 dBA lower. The tolerance also depended on the legitimacy of the noise source. Cultural differences in accepting noise should also be discussed. If there were a cultural difference in how noise in recreational areas is accepted, the tolerance would probably be low in Sweden. The visual effect of the wind turbines may be a source of annoyance equal to noise in recreational areas, especially if there is large wide-open space.
EXHIBIT A5-6
Page 18 of 27 005169

SWEDISH ENVIRONMENTAL PROTECTION AGENCY Report 5308 Noise annoyance from wind turbines – a review
18
3.4 Aspects of health and well-being
According to the definition made by WHO, health is a state of complete physical, mental and social well-being and not merely the absence of infirmity. The WHO Guidelines for Community noise lists specific effects to be considered when setting community noise guidelines: interference with communication; noise-induced hearing loss; sleep distur-bance effects; cardiovascular and psycho-physiological effects; performance reduction effects; annoyance responses; and effects on social behaviour [Berglund et al 1999]. Interference with communication and noise-induced hearing loss is not an issue when studying effects of noise from wind turbines as the exposure levels are too low.
No studies have been found exploring cardiovascular and psycho-physiological effects, performance reduction effects and effects on social behaviour specifically with regard to noise from wind turbines. A number of articles have though explored the relationships between exposure of other sources of community noise (road traffic, aircraft, railway traffic) and health effects. Evidence in support of health effects other than annoyance and some indicators of sleep disturbance is weak [Berry et al 1998]. In a Swedish official report Öhrström reviews the effects of community noise in general [Öhrström 1993]. On basis of studies on effects of noise from aircraft and road traffic, she finds that there are some evidences of noise causing psychosocial or psychosomatic nuisance. The effects are related to individual factors (sensitivity to noise and capacity to cope with stress) and to annoyance rather than to sound pressure level. Annoyance itself is though an undesired effect of health and well-being. In a review of studies performed 1993-1998, Lercher et al [1998] evaluated adverse physiological health effects of occupational and community noise. Most of the studies concern sources of noise with higher sound pressure levels than those of wind turbines. Even so, it was difficult to find correlation between exposure and e.g. cardiovascular or immunological effects. In a summery of possible long term effect of exposure to noise done by Passchier-Vermeer the observed threshold for hypertension and ischaemic heart disease was 70 dBA outdoors [Passchier-Vermer 2002]. Transferring the results of these studies, there are no evidences that noise from wind turbines could cause cardiovascular and psycho-physiological effects. However, the overall effect for people living in the vicinity of a wind turbine should be considered (noise annoyance, visual annoyance). The European field study mentioned above indicates that wind turbines could cause stress [Wolsink et al 1993]. Stress is not defined in the report and could be just another aspect of annoyance, but stress could also be one health variable that needs to be investigated further.
Annoyance response is probably the most studied health effect regarding wind tur-bines. As outlined in chapter 3.2 and 3.3, noise annoyance appears even at low sound pressure levels. Another health effect that may be relevant for people living near wind turbines is sleep disturbance. The WHO guidelines for community noise recommend that the outdoor noise levels in living areas should not exceed 45 dBA Leq at night, measured with the time base 8 hours [Schwela 1998], as sleep disturbance may occur with open windows. The exposure from wind turbines is not known to exceed this limit, but in the Swedish field-study mentioned above [Pedersen and Persson Waye 2002], of the 12 respondents at exposure level 37.5-40.0 dBA who stated them selves disturbed in their sleep by noise, 10 respondents mentioned wind turbines as source. Almost all of them
EXHIBIT A5-6
Page 19 of 27 005170

SWEDISH ENVIRONMENTAL PROTECTION AGENCY Report 5308 Noise annoyance from wind turbines – a review
19
slept with open window. The number of respondents was however too low for conclu-sions to be drawn and further research is needed.
In a review of health effects of road traffic noise, Rylander finds that there is no research done so far that indicates that environmental noise could provoke psychiatric disease [Rylander 1999]. Noise as a factor of stress, inducing symptoms among sensitive individuals is discussed, as well as the possibility of noise interacting with other environmental strains causing stress. Further research is though needed.
Summarising the findings, there is no scientific evidence that noise at levels emitted by wind turbines could cause health problems other than annoyance. However, sleep disturbances should bee further investigated. As noise from wind turbines has a special characteristic (amplitude modulation, swishing) it may be easily detected in a normal background noise and this may increase the probability for annoyance and sleep disturbance. The combination of different environmental impacts (intrusive sounds, visual disturbance and the unavoidance of the source in the living environment) could lead to a low-level stress-reaction, which should be further studied.
3.5 A comparison of noise regulations in European countries
A summary of limits and regulations regarding noise from wind turbines in some European countries was done by Lisa Johansson in the notes from an IEA topical expert meeting in Stockholm [Johansson 2000]. Her summary has here been updated and expanded.
The recommended highest sound pressure level for noise from wind turbines in Sweden today is 40 dBA outside dwellings (Naturvårdsverket webbplats). In noise sensitive areas as in the mountain wilderness or in the archipelago, a lower value for the highest sound pressure level is preferable. The penalty for pure tones is 5 dBA. In praxis, the sound pressure levels at dwellings nearby a planned wind turbine site are calculated according to [Naturvårdsverket 2001] during the process of applying for a permission to build. Measurements in site are only performed in case of complains and then as measurements of imission at the dwelling of the complainant at wind speeds of 8 m/s at 10 m height.
Denmark has a special legislation governing noise from wind turbines (Bekendtgørelse om støj fra vindmøller BEK nr 304 af 14/05/1991). The limit outside dwellings is 45 dBA and for sensitive areas 40 dBA Leq. Sensitive areas are areas planned for institutions, non-permanent dwellings or allotment-gardens, or for recreation. In case of complaints emission measurements are performed according to the legislation, i.e. on a plate on the ground at a distance of 1-2 times the hub height of the turbine. Noise imission at the dwelling of the complainant is then calculated.
The legal base for noise pollution in Germany is the Federal clean air act from 1974 (Bundes-Immissionschultz-Gesetzes. BimSchG, Germany, 1974). The limited values for the sound pressure levels are defined in TA Lärm (Technische Anleitung Lärm, Germany, 1998).
EXHIBIT A5-6
Page 20 of 27 005171

SWEDISH ENVIRONMENTAL PROTECTION AGENCY Report 5308 Noise annoyance from wind turbines – a review
20
Table 2. German noise regulations
Area Day Night Industrial Area (Industrigebeit/Gewergebeit) 70 dBA / 65 dBA 70 dBA / 50 dBA Mixed residential area and industry Or Residential areas mixed with industry
60 dBA
45 dBA
Purely residential areas with no commercial developments (Allgemeines Wohngebeit/Reines Wohngebeit)
55 dBA / 50 dBA
40 dBA / 35 dBA
Areas with hospitals, health resorts, etc. 45 dBA 35 dBA Calculation of sound propagation is done according to DIN ISO 9613-2. All calculations have to be done with a reference wind speed of 10 m/s at 10 m heights4.
The French legislation used in the case of wind turbines is the neighbour noise regula-tion law (Loi n° 92-1444 du 31 décembre 1992: Loi relative à la lutte contre le bruit). This legislation is based on the principle of noise emergence above the background level and there is no absolute noise limit. The permitted emergence is 3 dBA at night and 5 dBA at day. The background noise level has to be measured at a wind speed below 5 m/s. The legislation is not adjusted to wind turbine cases, and in praxis the noise measure-ments are made at 8 m/s when the wind turbine noise is expected to exceed the back-ground noise levels the most5.
New regulations on noise including noise from wind turbines were introduced in the Netherlands 2001 (Besluit van 18 oktober 2001, houdende regels voor voorzieningen en installaties; Besluit voorzieningen en installaties milieubeheer; Staatsblad van het Koninkrijk der Nederlanden 487). The limits follow a wind speed dependent curve. For the night the limit starts at 40 dBA at 1 m/s and increases with the wind speed to 50 dBA at 12 m/s. For daytime the limit starts at 50 dBA and for evenings at 45 dBA.
Figure 2. De WindNormCurve. Besluit van 18 oktober 2001, houdende regels voor voorzieningen en installaties; Besluit voorzieningen en installaties milieube-heer; Staatsblad van het Koninkrijk der Nederlanden 487. Bijlage 3.
4 Correspondence with Pamela Ljungberg, Enercon. 5 Correspondence with Karina Bredelles, consultant at ABIES, France
EXHIBIT A5-6
Page 21 of 27
60
55
50
~5 iii' ~o !:i
_j35
30
25
20
~ l1
1 2
-srt,1 · f:)J-:J !43 [44] [46 _._.
l4tt~H2J
------..,,_
·-·
De WindNormCurve WNC-40
3 4 5 6 7 8 9 10 11 12 Wlndsnelheld op 10 m hoogte in [m's]
005172

SWEDISH ENVIRONMENTAL PROTECTION AGENCY Report 5308 Noise annoyance from wind turbines – a review
21
In Great Britain the ETSU-report “The assessment and rating of noise from wind farms” (ETSU for DTI 1996) is referred to by for instance the Scottish Executive Development Department (PAN 45). The report presents a series of recommendations that is regarded as relevant guidance by the authorities. Generally noise limits should be set relative to the background noise and only for areas for which a quiet environment is desirable. More precisely, noise from wind farms should be limited to 5 dBA above background noise for both day- and night-time. The LA90, 10 min descriptor should be used both for the back-ground noise and for the noise from the wind farm. The argument for this is that the use of the LA90, 10 min descriptor allows reliable measurements to be made without corruption from relatively loud, transitory noise events from other sources. A fixed limit for 43 dBA is recommended for nighttime. This is based on a sleep disturbance criterion of 35 dBA. In low noise environments the daytime level of the LA90, 10 min of the wind farm noise should be limited to an absolute level within the range of 35-40 dBA. The actual value chosen within this range should depend upon the number of dwellings in the neighbour-hood of the wind farm, the effect of noise limits on the number of kWh generated, and the duration of the level of exposure.
In summery, these regulations are examples of different principles regarding noise from wind turbines. Some states have a special legislation concerning wind turbines, while others use recommendations. Different descriptors as LAeq or LA90, 10 min are used. The noise level could either be absolute or related to the background noise level. This background noise level could be standardised, measured or related to wind speed.
EXHIBIT A5-6
Page 22 of 27 005173

SWEDISH ENVIRONMENTAL PROTECTION AGENCY Report 5308 Noise annoyance from wind turbines – a review
22
4. Conclusions Noise from wind turbines is not at all as well studied as for instance noise from road traffic. As the number of studies is low no general conclusions could be drawn. However, some indications will be listed here. The reviewed studies above indicate that annoyance from wind turbine noise
• Is to a degree correlated to noise exposure.
• Occurs to a higher degree at low noise levels than noise annoyance from other sources of community noise such as traffic.
• Is influenced by the turbines’ visual impact on the landscape.
Wind turbine noise
• Does not directly cause any physical health problems. There is not enough data to conclude if wind turbine noise could induce sleep disturbance or stress-related symp-toms.
• Is, due to its characteristics, not easily masked by background noise.
• Is particularly poorly masked by background noise at certain topographical condi-tions.
Regulations on noise from wind turbines
• Are based on different principles leading to a heterogeneous legislation in Europe.
No conclusions on wind turbine noise in recreational areas could be drawn as no studies on the subject have been found. Other sources of noise studied as aircraft over flights indicate that noise levels tolerated in wilderness areas compared to residential areas are lower, but there is no evidence that this could be transferred to wind turbine noise.
Acknowledgement: I gratefully thank Kerstin Persson Waye for valuable contribution to this review.
EXHIBIT A5-6
Page 23 of 27 005174
SWEDISH ENVIRONMENTAL PROTECTION AGENCY Report 5308 Noise annoyance from wind turbines – a review
23
5. References Aasvang, G.M., Engdahl, B. (1999): Aircraft noise in recreational areas: a quasi-
experimental field study on individual annoyance responses and dose-response rela-tionships - Noise Control Engineering Journal, 47(4), 158-162.
Arlinger, S., Gustafsson, H-Å. (1988): Hur ett brusband med konstant ljudnivå maskerar
ett brusband med periodiskt varierande ljudnivå - Avd. För teknisk ausiologi, Universi-tet i Linköping.
Berglund, B., Lindvall, T., Schwela, D.H.(eds) (1999): Guidelines for community noise -
WHO, Geneva. Berry, B.F., Porter, N.D., Flindell, I.H. (1998): The feasibility of linking future noise
standards to health effects - Proceedings of ICBEN 98, 729-732, Sydney. Dickinson, P.J. (2002): Outdoor recreational noise – an overview - Proceedings of
Internoise 2002, Dearborn. Dunbabin P. (1996): An investigation of blade swish from wind turbines - Proceedings of
Internoise 96, 463-469, Liverpool. Fidell S., Silvati, L., Howe, R., Pearsons, K.S., Tabachnick, B., Knopf, R.C., Gramann,
J., Buchanan, T. (1996): Effects of aircraft over-flights on wilderness recreationists - J. Accoust. Soc. Am. 100(5), 2909-2918.
Hayes, M.D. (1996): The measurement of noise from wind farms and background noise
levels - Proceedings of Internoise 96, 471-478, Liverpool. Holm Pedersen, T., Skovgard Nielsen, K. (1994): Genevirkning af stöj fra vindmöller -
Rapport nr. 150, DELTA acoustic & vibration, Lydtekniske institut, Köpenhamn. Hygge, S. (2001): Buller och bullerstörning i naturområden och nationalparker – en
forskningsöversikt - Utredningsuppdrag för Banverket och Vägverket. Johansson, L. (2000): Notes from IEA topical expert meeting in Stockholm - 27-28
November. Kantarelis, C., Walker, J.G. (1988): The identification and subjective effect of amplitude
modulation in diesel engine exhaust noise - J Sound Vib 120, 297-302. Kloosterman, H., Land, D., Massolt, J., Muntingh, G., van den Berg, F. (2002): Hohe
Mühlen fangen viel Wind - NWU-106 D. Rijksuniversiteit Groningen.
EXHIBIT A5-6
Page 24 of 27 005175

SWEDISH ENVIRONMENTAL PROTECTION AGENCY Report 5308 Noise annoyance from wind turbines – a review
24
Krog, N.H., Aasvang, G.M., Osmundsen, E., Engdahl, B. (2000): Effects of noise from military jets on hikers in a recreational area - Proceedings of Internoise 2000, 2167-2170, Nice.
Lercher, P., Stansfeld,S.A., Thompson, S.J. (1998): Non-auditory health effects of noise:
review of the 1993-1998 - Proceedings of ICBEN 98, 213-220, Sydney. Lowson, M.V. (1996): Aerodynamic noise of wind turbines - Proceedings of Internoise
96, 479-484, Liverpool. Miller, N.P. (2001): A proposal for acoustic data collection in parks and wilderness areas
- Proceedings of Internoise 2001, Hague. Miller, N.P. (2002): Transportation noise and recreational lands - Proceedings of
Internoise 2002, Dearborn. Naturvårdsverket (2001): Ljud från vindkraftverk - Rapport 6241. Passier-Vermier, W. (2002): Dose-response relation induced health effects - Internet-
symposium Noise annoyance, stress and health effects. (www.netsympo.com) 2002-11-12.
Pedersen, E., Persson Waye, K. (2002): Störningar från vindkraft – undersökning bland
människor boende i närheten av vindkraftverk - Rapport 1/2002.Reviderad utgåva december 2002. Avdelningen för miljömedicin, Göteborgs universitet.
Persson, K., Björkman, M., Rylander, R. and Hellström, P-A. (1993): A pilot study
evaluating effects on vestibularis and subjective symptoms among sensitive subjects exposed to low frequency sounds - Proceedings of the seventh international meeting on low frequency noise and vibration, 135-140, Edinburgh,.
Persson Waye, K. (1995): Bullerstörningar från vindkraftverk - Litteraturstudie. Rapport
2/95. Avdelningen för miljömedicin, Göteborgs Universitet. Persson Waye, K., Öhtrsöm, E. (2002): Psycho-acoustic characters of relevance for
annoyance of wind turbine noise - J. Sound Vib. 250(1), 65-73. Rylander, R. (1999): Health effects from road traffic noise - In: Schwela D and Zali O
(eds.). Urban traffic pollution. WHO, 71-88. Schwela, D. (1998): WHO guidelines on community noise - Proceedings of ICBEN 98,
475-480, Sydney. Wagner, S., Bareiss, R., Guidati, G. (1996): Wind turbine noise - EUR 16823.
EXHIBIT A5-6
Page 25 of 27 005176
SWEDISH ENVIRONMENTAL PROTECTION AGENCY Report 5308 Noise annoyance from wind turbines – a review
25
Wolsink, M., Sprengers, M., Keuper, A., Pedersen T.H., Westra, C.A. (1993): Annoyance from wind turbine noise on sixteen sites in three countries - European community wind energy conference 8-12 March, Lübeck, Travemünde, 273-276.
Zwicker, E., Feldtkeller, K. (1967): Das Ohr als Nachrichtenempfänger - Hirzel. Öhrström, E. (1993): Omgivningsbullers effekter på människan - Bilaga 4 till utredningen
Handlingsplan mot buller SOU 1993:65. Regulation of noise from wind turbines Sweden Naturvårdsverket webbplats – Lag & rätt – Buller och riktvärde – Vindkraft
http://www.naturvardsverket.se (Visited 2003-05-15) Naturvårdsverket (2001): Ljud från vindkraftverk - Rapport 6241.
http://shop.vltmedia.se/cgi-bin/miljo.storefront/EN/Product/620-6241-7 (Visited 2003-05-15)
Denmark
Bekendtgørelse om støj fra vindmøller BEK nr 304 af 14/05/1991
Germany Bundes-Immissionschultz-Gesetzes. BImSchG, Germany, 1974
http://bundesrecht.juris.de/bundesrecht/bimschg/index.html (Visited 2003-05-15) TA Lärm (Technische Anleitung Lärm, Germany, 1998 http://www.wind-
consult.de/german/information/info_d_2.htm (Visited 2003-05-15) France Loi n° 92-1444 du 31 décembre 1992: Loi relative à la lutte contre le bruit
http://www.legifrance.gouv.fr/texteconsolide/UPEFM.htm (Visited 2003-05-15) The Netherlands Besluit van 18 oktober 2001, houdende regels voor voorzieningen en installaties; Besluit
voorzieningen en installaties milieubeheer; Staatsblad van het Koninkrijk der Neder-landen 487 http://www.goes.nl/milieu/wetv&in.pdf (Visited 2003-05-15)
Scotland PAN 45, Scottish Executive Development Department, revised 2000
http://www.scotland.gov.uk/publications/search.aspx?key=renewable%20energy (Visited 2003-05-15)
The assessment and rating of noise from wind farms, (ETSU for DTI 1996)
EXHIBIT A5-6
Page 26 of 27 005177

R e p o r t 5 3 0 8 · A u g u s t 2 0 0 3
Noise annoyance from wind turbines – a review This study summarises present knowledge on noise perception and annoyances from wind turbines in areas were people live or spend recreation time. Field studies performed among people living in the vicinity of wind turbines showed that there was a correlation between sound pressure level and noise annoyance, but annoyance was also influenced by visual factors such as the attitude to wind turbines impact on the landscape. Noise annoyance was found at lower sound pressure levels than in studies of annoyance from traffic noise. Regulations on noise from wind turbines are based on different principles. Some states have a special legislation concerning wind turbines, while others use recommendations. Different descriptors as LAeq or LA90, 10 min are used. The noise level could either be absolute or related to the background noise level. This background noise level could be standardised, measured or related to wind speed.
ISBN 91-620-5308-6 ISSN 0282-7298 NATURVÅRDSVERKET · SWEDISH ENVIRONMENTAL PROTECTION AGENCY
EXHIBIT A5-6
Page 27 of 27 005178

EXHIBIT A5-7
Page 1 of 8
INTER-NOISE 2016
Investigation, Prediction and Evaluation
of Wind Turbine Noise in Japan
Hitomi KIMURA 1; Yoshinori MOMOSE 1
; Hiroya DEGUCHl 1; and Mimi NAMEKl 1
1 Ministry of the Environment, Japan (MOEJ)
1-2-2 Kasumigaseki Chiyoda-ku, Tokyo 100-8975 JAPAN
ABSTRACT
While increasing in size and number, wind turbines in Japan are often located in quiet rural areas due to the
country's lack of shallow adjacent sea and geographically unbalanced wind energy. Since a quiet
environment makes wind turbine noise more noticeable, this location of wind turbines sometimes raises
complaints about noise by neighborhood residents even if the noise generated by wind turbines is not very
loud. The Ministry of the Environment of Japan has developed an interim report on investigation, prediction and
evaluation methods of wind turbine noise based on recent scientific findings, including the results of
nationwide field measurements and related surveys in Japan. The challenges to be addressed are also
identified.
Keywords: Wind turbine noise, investigation method, reference level I-INCE Classification of Subjects Number(s): 14.5.4
1. Introduction It is an important aspect of Japan's energy policy to accelerate the introduction of renewable
energy. Among renewable energy sources , wind power generation is one of the important energy
sources which emits neither air-polluting substances nor greenhouse gases and can also contribute to
energy security because it can be done in Japan. The Basic Energy Plan of Japan (Cabinet decision in
April , 2014) regards wind power generation as an energy source which can be made economically viable as its generation cost can be as low as that for thermal power generation if it can be developed
on a large scale. The number of wind power facilities installed in Japan started to increase around' 200 I, and 2,034
units have been installed by 20 I 4 (as of the end of March, 2015) ( 1 ). According to the
Supplementary Materials for the Long-term Energy Supply and Demand Outlook issued by the
Agency for Natural Resources and Energy in July, 2015, approximately 10 million kW of wind power is expected to be installed by 2030, which represents a nearly four-fold increase from the
existing installed wind power capacity of approximately 2.7 million kW (2).
5758
005179
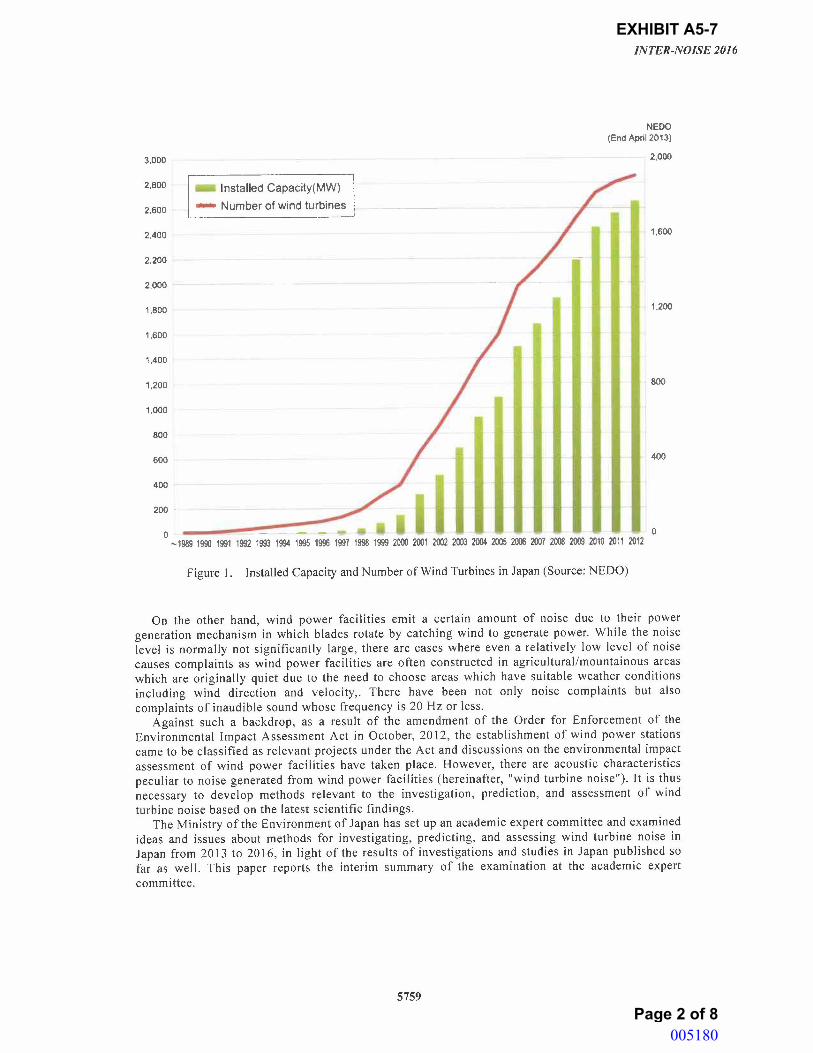
EXHIBIT A5-7
Page 2 of 8
3,000
2,800
2,600
2,400
2,200
2,000
1,800
1,600
1,400
1,200
1,000
800
600
400
200
Installed Capacity(MW)
- Number of wind turbines
INTER-NOISE 2016
NEDO (End April 2013)
2,000
1,600
1,200
800
400
0 0 ~1989 1990 1991 1992 1993 1994 1995 1996 1991 1998 1999 2000 2001 2002 2003 2004 2005 m 2001 2008 2009 2010 2011 2012
Figure I. Installed Capacity and Number of Wind Turbines in Japan (Source: NEDO)
On the other hand, wind power facilities emit a certain amount of noise due to their power
generation mechanism in which blades rotate by catching wind to generate power. While the noise
level is normally not significantly large, there are cases where even a relatively low level of noise
causes complaints as wind power facilities are often constructed in agricultural/mountainous areas
which are originally quiet due to the need to choose areas which have suitable weather conditions
including wind direction and velocity,. There have been not only noise complaints but also
complaints of inaudible sound whose frequency is 20 Hz or less. Against such a backdrop, as a result of the amendment of the Order for Enforcement of the
Environmental Impact Assessment Act in October, 2012, the establishment of wind power stations
came to be classified as relevant projects under the Act and discussions on the environmental impact
assessment of wind power facilities have taken place. However, there are acoustic characteristics
peculiar to noise generated from wind power facilities (hereinafter, "wind turbine noise"). It is thus
necessary to develop methods relevant to the investigation, prediction, and assessment of wind
turbine noise based on the latest scientific findings. The Ministry of the Environment of Japan has set up an academic expert committee and examined
ideas and issues about methods for investigating, predicting, and assessing wind turbine noise in
Japan from 2013 to 2016, in light of the results of investigations and studies in Japan published so
far as well. This paper reports the interim summary of the examination at the academic expert
committee.
5759
005180

EXHIBIT A5-7
Page 3 of 8
INTER-NOISE 2016
2. Extant findings Surveys measuring wind turbine noise conducted in Japan from 20 IO to 20 12 revealed the
following.
In terms of spectral characteristics, wind turbine noise generally has a spectral slope of -4 dB per octave. Its 1/3 octave band sound pressure level in all parts of the super-low
frequency range, which means 20Hz or lower, is below the ISO threshold of hearing for
pure tones and the criterion curve for the assessment of low frequency noise proposed by
Moorhouse et al. (Fig . 2). Super-low frequency range components of wind turbine noise are at imperceptible levels. Therefore, wind turbine noise is not an issue caused by
super-low frequency range. In regard to the audible frequency range, in the range from about 40 Hz and above, the 1/3 octave band sound pressure level is above the said criterion curve and the threshold of
hearing defined by ISO 389-7. Therefore, wind turbine noise should be regarded as
"audible" sound (noise) in discussing it.
100
en 90 ~o / Limit curve proposed ~ Q by Moorhouse et al. ai so > ~
~ 70 Threshold of hearing for :::, pure tones (ISO 389-7) "' "' ~ 60 C.
"O C 50 :::, 0
"' "O 40 C m .D Q) 30 > m t5 io 0
!2 10
0 I 2 4 8 16 31.5 63 Ill 2~ 500 lk 21c 4k
Frequency [Hz)
Figure 2. Result of the analysi s of frequency characteristics of wind turbine noise
(at 164 locations in the vicinity of 29 wind power facilities in Japan)
Noise exposure levels of nearby residents from wind power facilities are distributed in the range of 26-50 dB in time-averaged A-weighted sound pressure levels. While this implies
that wind turbine noise is not significantly higher than other types of environmental noise, it can cause serious annoyance to residential areas in the vicinity of wind power facilities
located in extremely quiet agricultural/mountainous areas.
In Japan, it is empirically known that the following relation holds between L Aeq, which
properly excludes non-relevant noise, and LA90 : LAeq =, LA9o+2 dB
It is also generally said that acoustic isolation is not always effective for noise from wind power
facilities because it contains more low-frequency components. In a quiet environment with little
noise of other types, it is relatively more easily heard than ordinary noise is.
5760
005181

EXHIBIT A5-7
Page 4 of 8
TNTER-NOTSE 2016
3. Methods for investigating and predicting wind turbine noise, a perspective
for its assessment, and responses against it
In light of the findings described in section 2, the issue of wind turbine noise should be taken not
as one of super-low frequency sound below 20 Hz but as one of "audible" sound (noise) , and it
should be basically measured at the A-weighted sound pressure level. We here summarize matters to be noted in conducting an investigation and/or prediction of noise before and after installing
wind power facilities and a perspective for wind turbine noise assessment.
3.1 Investigation and prediction before installation
3.1.1 Matters to be noted upon an investigation In selecting a method for investigation, it is necessary to collect various kinds of information in
light of business and regional characteristics to a necessary extent in order to conduct prediction and
assessment appropriately. Particu larly with regard to wind turbine noise, it is important to
distinguish and discuss three major issues:
( I ) Sound source characteristics It is necessary to pay attention to:
information on the wind power facility concerned, including its specifications, manufacturer, model number, hub height, rotor diameter, rated wind velocity, and power generation ; the sound power level of the generated noise ; the A-weighted overall value and frequency characteristics (including the 1/3 octave band sound power level) of the sound power level at the rated (maximum) output (to grasp the situation of maximal environmental impact); A-weighted overall values and frequency characteristics (including the 1/3 octave band sound power level) of sound power levels under different wind velocities ;
pure tonal frequency components (to be determined in accordance with I EC 61400-11:2012) ; and existing data pertaining to the same model in operation .
(2) Propagation characteri stics In Japan , wind power facilities are often installed in agricultural/mountainous areas . Sound waves
emitted from a wind power facility installed in an agricultural/mountainous area are affected by
various factors before propagating to a sound receiving point (assessment point), in comparison with one installed on a large, flat piece of land such as a plain or desert. Its noise level and frequency
characteristics tend to change due to phenomena including reflection , absorption , transmission , refraction, and diffraction. It is therefore necessary to pay attention to:
phenomena such as the reflection , absorption , or diffraction of wind turbine noise due to undulating terrains or ridges, the state of the ground surface (including rivers and lakes), and
meteorological information such as wind conditions including wind direction , velocity, and frequency .
(3) Information on a sound receiving point (assessment location) With regard to locations where an investigation is conducted, focusing on the daily life and
activities of residents in the vicinity of a wind power facility, it is necessary to pay attention to:
the configuration of establishments particularly requmng consideration for environmental conservation such as schools and hospitals and the outline of housing configuration ( including the structure of each house) , and
the state of the acoustic environment ( degree of quietness ) of the area in question.
(4) The specific method for investigation In measuring residual noise in a given area, it is necessary to pay attention to the following.
5761
005182
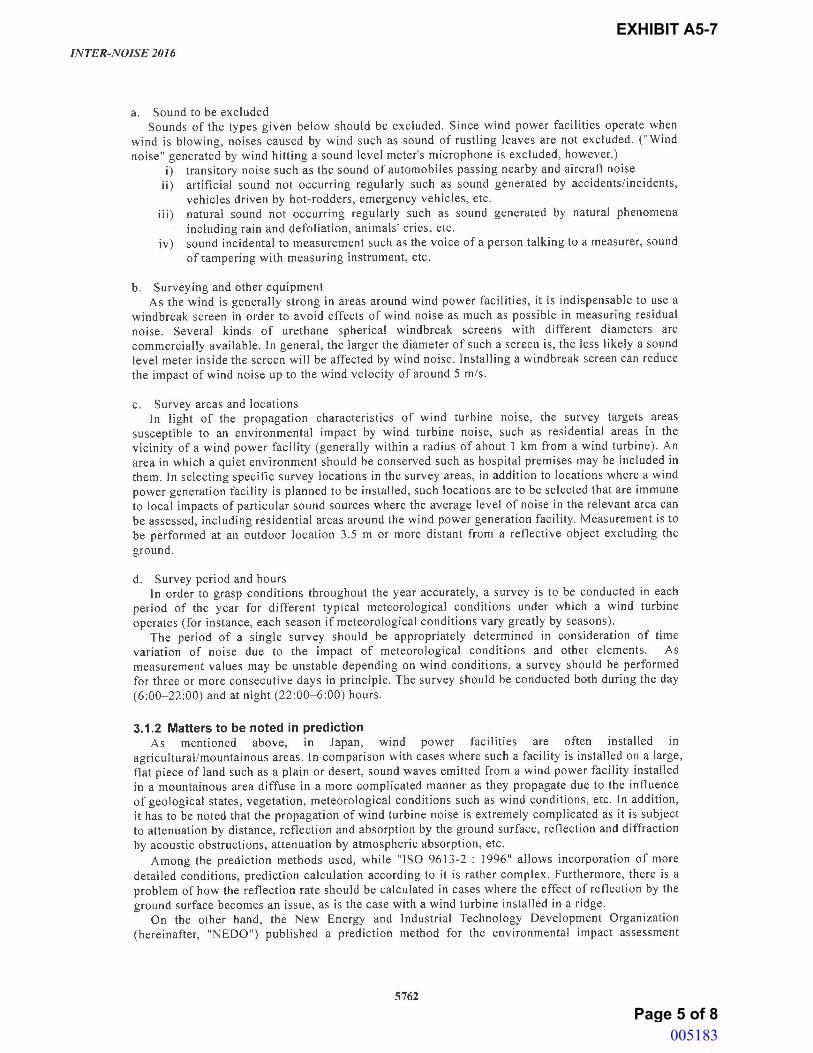
EXHIBIT A5-7
Page 5 of 8
INTER-NOISE 2016
a. Sound to be excluded Sounds of the types given below should be excluded . Since wind power facilities operate when
wind is blowing, noises caused by wind such as sound of rustling leaves are not excluded . (" Wind
noise" generated by wind hitting a sound level meter's microphone is excluded, however.)
i) transitory noise such as the sound of automobiles passing nearby and aircraft noise
ii ) artificial sound not occurring regularly such as sound generated by accidents/ incidents,
vehicles driven by hot-rodders , emergency vehicles, etc.
iii) natural sound not occurring regularly such as sound generated by natural phenomena
including rain and defoliation , animals' cries, etc . iv) sound incidental to measurement such as the voice of a person talking to a measurer, sound
of tampering with measuring instrument, etc.
b . Surveying and other equipment As the wind is generally strong in areas around wind power facilities , it is indispensable to use a
windbreak screen in order to avoid effects of wind noise as much as possible in measuring residual
noise. Several kinds of urethane spherical windbreak screens with different diameters are
commercially available. In general , the larger the diameter of such a screen is, the less likely a sound
level meter inside the screen will be affected by wind noise . Installing a windbreak screen can reduce
the impact of wind noise up to the wind velocity of around 5 mis.
c . Survey areas and locations In light of the propagation characteristics of wind turbine noise, the survey targets areas
susceptible to an environmental impact by wind turbine noise, such as residential areas in the
vicinity of a wind power facility (generally within a radius of about 1 km from a wind turbine). An
area in which a quiet environment should be conserved such as hospital premises may be included in
them. In selecting specific survey locations in the survey areas, in addition to locations where a wind
power generation facility is planned to be installed , such locations are to be selected that are immune
to local impacts of particular sound sources where the average level of noise in the relevant area can
be assessed, including residential areas around the wind power generation facility . Measurement is to
be performed at an outdoor location 3 .5 m or more distant from a reflective object excluding the
ground.
d . Survey period and hours In order to grasp conditions throughout the year accurately, a survey is to be conducted in each
period of the year for different typical meteorological conditions under which a wind turbine
operates (for instance, each season if meteorological conditions vary greatly by seasons) .
The period of a single survey should be appropriately determined in consideration of time
variation of noise due to the impact of meteorological conditions and other elements. As
measurement values may be unstable depending on wind conditions , a survey should be performed
for three or more consecutive days in principle. The survey should be conducted both during the day
(6:00-22:00) and at night (22:00-6:00) hours.
3.1.2 Matters to be noted in prediction As mentioned above, in Japan , wind power facilities are often installed in
agricultural/mountainous areas. In comparison with cases where such a facility is installed on a large,
flat piece of land such as a plain or desert , sound waves emitted from a wind power facility installed
in a mountainous area diffuse in a more complicated manner as they propagate due to the influence
of geological states , vegetation , meteorological conditions such as wind conditions , etc . In addition ,
it has to be noted that the propagation of wind turbine noise is extremely complicated as it is subject
to attenuation by distance, reflection and absorption by the ground surface, reflection and diffraction
by acoustic obstructions , attenuation by atmospheric absorption , etc.
Among the prediction methods used, while "ISO 9613-2 : I 996" allows incorporation of more
detailed conditions , prediction calculation according to it is rather complex. Furthermore, there is a
problem of how the reflection rate should be calculated in cases where the effect of reflection by the
ground surface becomes an issue , as is the case with a wind turbine installed in a ridge.
On the other hand, the New Energy and Industrial Technology Development Organization
(hereinafter, "NEDO") published a prediction method for the environmental impact assessment
5762
005183

EXHIBIT A5-7
Page 6 of 8
INTER-NOISE 2016
ofwind power generation in July, 2003 (revised into the second version in February, 2006). This
models wind power facilities as sound source points and uses sound power levels provided by manufacturers of wind power generators. This method takes into account distance attenuation due to
sound diffusion in the propagation process and attenuation by atmospheric absorption. While this
method can be used easily, it is difficult to consider meteorological effects, etc. It is necessary to pay full attention to such characteristics of methods in making prediction.
3.2 Survey after the installation of a wind turbine
As stated in section 3. I, predicting wind turbine noise involves elements with large uncertainty such as emission characteristics of noise from the source and effects of meteorological conditions as
well as terrain and structures in the propagation process . Predicted values before the installation of a
wind turbine and measured values after installation may sometimes differ greatly. We here summarize matters to be noted in a survey after the installation of a wind turbine.
( 1) Conditions of measurement
It is necessary to grasp the conditions of measurement and other relevant local matters that may
impact the propagation of noise. At least, one should grasp wind direction and velocity at the nacelle
height, the variation of power output, and meteorological data required for calculating the
attenuation by atmospheric absorption (wind direction and velocity, temperature, and humidity) .
(2) Survey method
Wind turbine noise varies greatly by wind conditions, and a wind turbine often starts and
suspends operation repeatedly. Therefore, measurement should be performed in appropriate hours in
light of the state of operation of the wind power facility in question. For example, a method is conceivable that measures the average level in a 10-minute period in which wind turbine noise is
stable ( 10-minute equivalent noise level: l Aeq, 10 mm) and regards it as the representative value. If the relevant wind power facility operates steadily for long hours, it is effective for obtaining robust data,
for instance, to measure noise for 10 minutes every hour on the hour and calculate the average
energy over the entire period of time. For measurement locations, period, etc. , refer to what is noted for a survey before the installation.
(3) Survey Results The representative value of a survey after the installation of a wind power facility should be taken
as the A-weighted equivalent sound pressure level measured over a period of time in which the effect
of wind turbine noise is at its maximum and in which the effect of background noise is low(e.g.
during night time). It is also required to confirm whether there is any pure tonal component. The equivalent noise level during operation can be estimated by adding around 2 dB to the noise
level exceeded for 90% of the measurement period (LA 90 ).
3.3 Assessment of wind turbine noise
In assessing the impact of noise resulting from the installation of a facility, the procedure of
environmental impact assessment performed before installation examines "whether such noise is avoided or reduced to an extent feasible" and , if applicable, "whether it is intended to be consistent
with standards or criteria given by the Japanese government or local municipalities from the
perspective of environmental protection." For the former examination, the extent to which the impact of noise resulting from the
implementation of the relevant project is avoided or reduced is assessed by comparing multiple
countermeasures in terms of the structure, layout, output, the number of units , and technical noise
reduction measures in accordance with the maturity of the project plan. The assessment can also be done by examining to what extent better feasible technology can be incorporated, etc. Specifically,
assessment is made from such viewpoints as whether the local noise level will not be significantly
raised , whether the layout plan for the project secures a sufficient distance between the facility and
residences , etc. On the other hand , no standards or criteria specific to wind turbine noise have been set from the
5763
005184

EXHIBIT A5-7
Page 7 of 8
INTER-NOISE 2016
perspective of environmental protection by the national government.
4. Future agenda
4.1 Actions to be taken by operators and manufacturers of wind power facilities
Operators and manufacturers will continue to be expected to accumulate survey data after the installation of wind power facilities, implement technical measures , such as developing low noise blades or implementing additional soundproof measures, and maintenance measures intended to reduce noise, etc. Furthermore, they are also expected to examine and develop technology supporting the broad promotion of efforts for noise control including the examination of an aerodynamic sound propagation prediction model reflecting locational conditions.
4.2 Actions to be taken by administrative agencies (the government of Japan and local
municipalities)
4.2.1 Collecting and sharing information on wind power facilities, raising awareness It is necessary to develop and improve manuals for appropriately responding to complaints
concerning wind power facilities. At the same time , it is necessary to examine a framework for sharing knowledge of technological countermeasures implemented by operators which can be applied to other facilities , to administer education and training programs to enhance local municipality officials' expertise further, to promote understanding by local residents through the dissemination of precise information on the auditory impression of wind turbine noise and similar matters as well as raising their awareness of such information, etc.
It is possible that not only the magnitude and properties of sound but also visual elements are related to complaints about noise from wind power facilities. It is necessary to continue to gather knowledge on the impact of elements other than noise and examine responses.
4.2.2 Perspective for the assessment of wind turbine noise At present, no standards or criteria specific to wind turbine noise have been set from the
perspective of environmental protection by the national government. In light of the fact that wind power facilities are often installed in quiet areas , possible annoyance caused by amplitude-modulation sound (swish sound) and, if applicable, pure tonal components of wind turbine noise, it is necessary to examine a certain reference level for assessment of noise in consideration of the impact on the sound recipients.
Furthermore, with regard to the sound environment in quiet areas, it is necessary to consider all facil ities, not limited to wind power facilities , located therein. It is necessary to examine what methods for investigating, predicting, and assessing the sound environment in quiet areas in Japan should be like while surveying examples in other countries.
4.3 Actions to be taken by all parties concerned
When it comes to wind turbine noise, it is important to facilitate communication among relevant stakeholders including operators of wind power facilities , manufacturers , local municipalities , local residents, in light of issues unique to sensory pollution. It has been reported that annoyance caused by wind turbine noise is low among residents who perceive wind turbines positively so that receptivity to the installation of a wind turbine facility is higher among them. There are cases where actions for maintaining a favorable relationship with local residents actually reduced complaints. Such actions include a wind power facility operator's holding briefing sessions , creating an optimal business plan based on the comprehensive analysis of the distance separating residences and the relevant establishment in conjunction with the installation and layout of a wind power facility, continuing to deal with complaints, and concluding an agreement with local residents and municipalities. It is necessary to enhance communication among the parties concerned in this light.
5764
005185

EXHIBIT A5-7
Page 8 of 8
INTER-NOISE 2016
REFERENCES I. New Energy and Industrial Technology Development Organization (NEDO). NEDO offshore wind
energy progress Edition II. [Internet] 2013 . p.5. Available from: http://www.nedo.go.jp/content/100534312.pdf?from=b
2. Agency for Natural Resources and Energy, Ministry of Economy, Trade and Industry. [Internet] 2015.
p.47. Available from : http ://www.enecho.meti .go .jp/committee/council/basic _policy_ subcommittee/mitoshi/011 /pdf/011 _ 07.
5765
005186
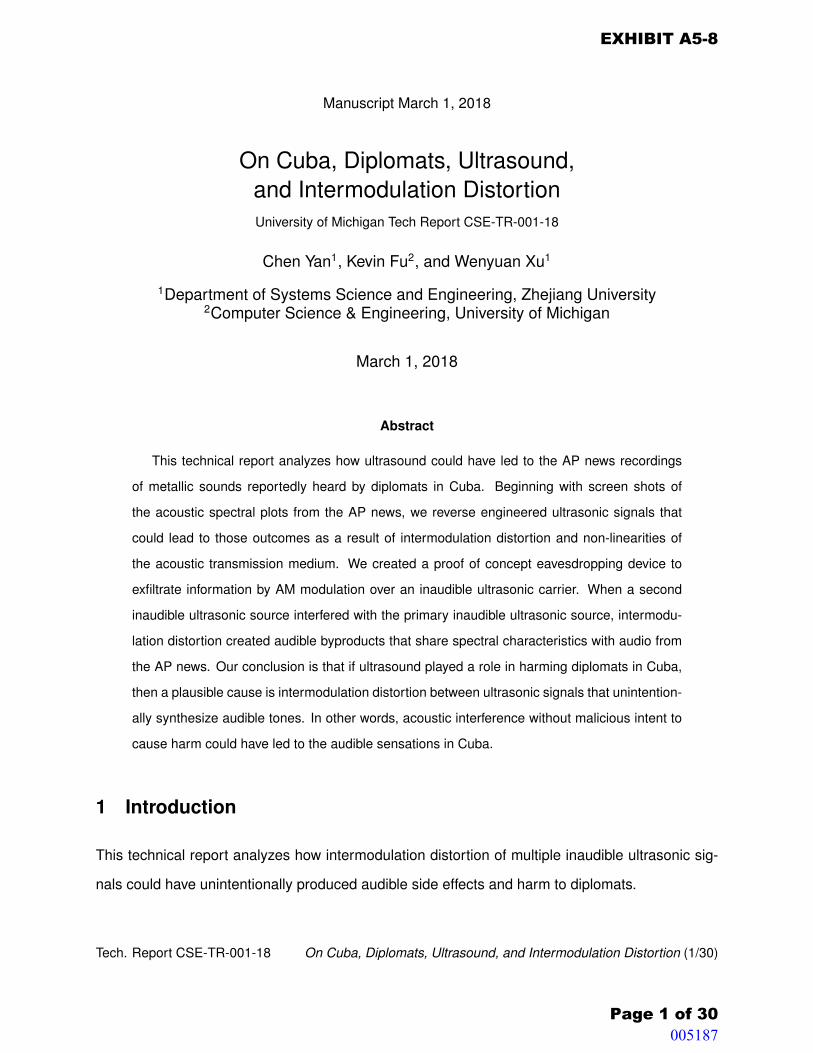
Manuscript March 1, 2018
On Cuba, Diplomats, Ultrasound,and Intermodulation DistortionUniversity of Michigan Tech Report CSE-TR-001-18
Chen Yan1, Kevin Fu2, and Wenyuan Xu1
1Department of Systems Science and Engineering, Zhejiang University2Computer Science & Engineering, University of Michigan
March 1, 2018
Abstract
This technical report analyzes how ultrasound could have led to the AP news recordings
of metallic sounds reportedly heard by diplomats in Cuba. Beginning with screen shots of
the acoustic spectral plots from the AP news, we reverse engineered ultrasonic signals that
could lead to those outcomes as a result of intermodulation distortion and non-linearities of
the acoustic transmission medium. We created a proof of concept eavesdropping device to
exfiltrate information by AM modulation over an inaudible ultrasonic carrier. When a second
inaudible ultrasonic source interfered with the primary inaudible ultrasonic source, intermodu-
lation distortion created audible byproducts that share spectral characteristics with audio from
the AP news. Our conclusion is that if ultrasound played a role in harming diplomats in Cuba,
then a plausible cause is intermodulation distortion between ultrasonic signals that unintention-
ally synthesize audible tones. In other words, acoustic interference without malicious intent to
cause harm could have led to the audible sensations in Cuba.
1 Introduction
This technical report analyzes how intermodulation distortion of multiple inaudible ultrasonic sig-
nals could have unintentionally produced audible side effects and harm to diplomats.
Tech. Report CSE-TR-001-18 On Cuba, Diplomats, Ultrasound, and Intermodulation Distortion (1/30)
EXHIBIT A5-8
Page 1 of 30 005187

Manuscript March 1, 2018In early 2017, diplomats in Cuba suffered hearing loss and brain damage after hearing strange
metallic sounds. The news media published reports ranging from scientific analysis of sound
recordings [16, 24, 27] to the diplomatic implications [11, 10, 12, 13]. The mystery deepened after
physicians published two dueling JAMA papers on neurological damage to diplomats [25, 18]. The
news media remained flummoxed on what may have caused the neurological damage [15, 17, 8].
Several news reports suggested that an ultrasonic weapon could have caused the harm. Other
experts suggested toxins or viruses. The cause remains a mystery. The substantiated facts
include:
• Ultrasonic tones are inaudible to humans.
• Diplomats in Cuba heard audible sounds.
Therefore, any sounds perceived by diplomats are not likely the ultrasound itself. We were left
wondering:
1. How could ultrasound create audible sensations?
2. Why would someone be using ultrasound for in the first place?
Assumptions and Limitations. We assume that the sound came from ultrasound, then work
backwards to determine the characteristics of the ultrasonic source that would cause the observed
audible sensations.
There could be added distortion in the AP audio, so we cannot assume the recordings reflect
what humans actually perceived. In one video, the AP news is seen playing a sound file from one
iPhone to a second iPhone, essentially making a recording of a recording. Each traversal through
a speaker or microphone will add distortion and filtering.
Our experiments focus on spectral properties rather than the effect of amplitude or distance. It
might be worthwhile to replicate our experiments with a high powered array of ultrasonic transduc-
ers. We do not explore non-ultrasonic hypotheses such as toxins, RF, or LRADs. We also do not
consider direct mechanical coupling such as sitting on an ultrasonic vibrator.
Tech. Report CSE-TR-001-18 On Cuba, Diplomats, Ultrasound, and Intermodulation Distortion (2/30)
EXHIBIT A5-8
Page 2 of 30 005188

Manuscript March 1, 2018Why Ultrasound? It is well known that audible sounds typically propagate omnidirectionally and
are difficult to confine to parts of a room. In contrast, ultrasound tends to propagate within a
narrower beam than audible sound and can focus a beam towards a more specific area. News re-
ports cited diplomats discussing sounds that were narrowly confined to a room or parts of a room.
This type of observation is strongly correlated with ultrasound. We believe that the high-pitched
audio signals confined to a room or parts of a room are likely created by ultrasonic intermodulation
distortion.
How to Produce Audible Sound from Ultrasound? Humans cannot hear airborne sounds at
frequencies higher than 20 kHz, i.e., ultrasound. Yet the AP news reported that “It sounds sort of
like a mass of crickets. A high-pitched whine, but from what? It seems to undulate, even writhe.”
The AP’s spectrum plot shows a strong audible frequency at 7 kHz. We believe that this 7 kHz
sound is caused by intermodulation distortion, which can down-convert the frequency of ultra-
sound into the audible range—resulting in high-pitched noises. Nonlinearity typically causes In-
termodulation distortion. The engineering question boils down to: assuming an ultrasonic source,
how can the audible byproducts consist of a mixture of several tones around 7 kHz separated by
180 Hz?
Sources of Ultrasound. There are many potential sources of ultrasound in office, home, and
hotel environments. Energy efficient buildings often use ultrasonic room occupancy sensors in
every room (Figure 1). Ultrasonic emitters can repel rodents and other pests. HVAC systems
and other utilities with pumps or compressors can vibrate entire buildings. Certain burglar alarm
sensors, security cameras, and automated doors use ultrasound for detection of movement.
Researchers from Illinois recently proposed using specially crafted ultrasound to jam micro-
phones [20]. If sounds from an ultrasonic jammer (Figure 2) were to collide with an eavesdropping
device attempting to covertly exfiltrate a signal over an ultrasonic carrier, these two signals could
combine to produce audible byproducts in both air and microphones. However, if there were
an ultrasonic jammer present, it would have likely jammed all nearby microphones, including the
microphone used to record the metallic sounds. This would make jammers an unlikely cause.
Tech. Report CSE-TR-001-18 On Cuba, Diplomats, Ultrasound, and Intermodulation Distortion (3/30)
EXHIBIT A5-8
Page 3 of 30 005189
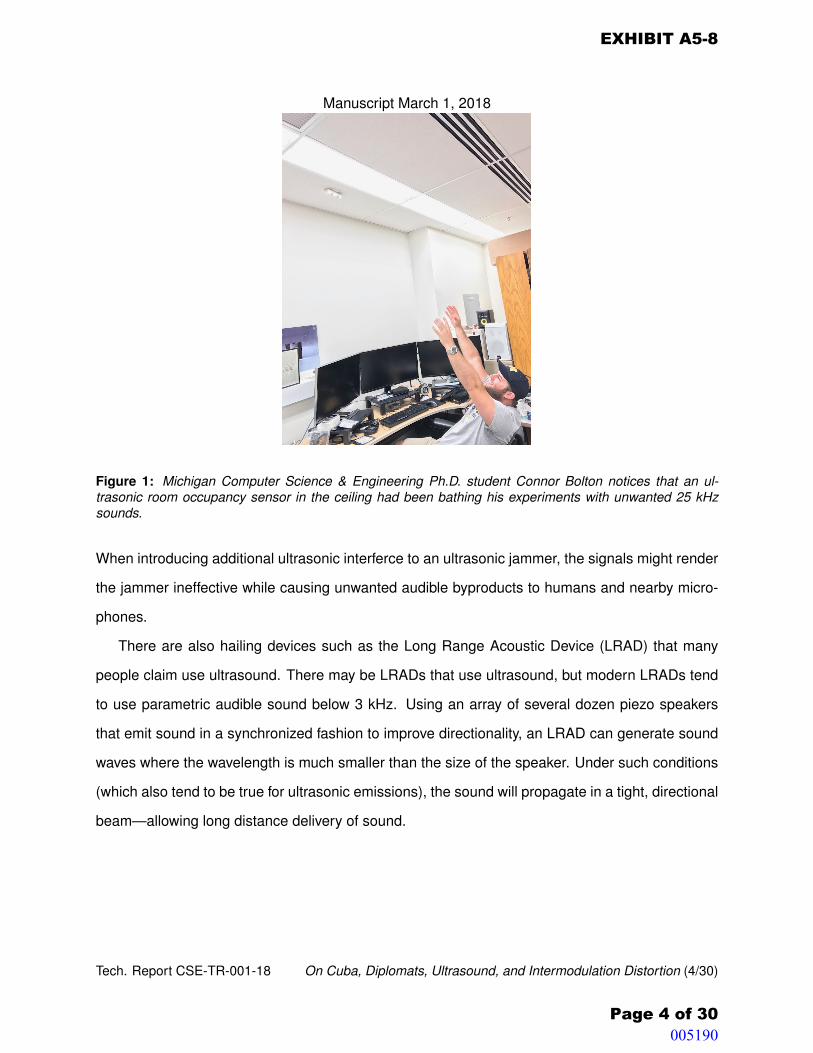
Manuscript March 1, 2018
Figure 1: Michigan Computer Science & Engineering Ph.D. student Connor Bolton notices that an ul-trasonic room occupancy sensor in the ceiling had been bathing his experiments with unwanted 25 kHzsounds.
When introducing additional ultrasonic interferce to an ultrasonic jammer, the signals might render
the jammer ineffective while causing unwanted audible byproducts to humans and nearby micro-
phones.
There are also hailing devices such as the Long Range Acoustic Device (LRAD) that many
people claim use ultrasound. There may be LRADs that use ultrasound, but modern LRADs tend
to use parametric audible sound below 3 kHz. Using an array of several dozen piezo speakers
that emit sound in a synchronized fashion to improve directionality, an LRAD can generate sound
waves where the wavelength is much smaller than the size of the speaker. Under such conditions
(which also tend to be true for ultrasonic emissions), the sound will propagate in a tight, directional
beam—allowing long distance delivery of sound.
Tech. Report CSE-TR-001-18 On Cuba, Diplomats, Ultrasound, and Intermodulation Distortion (4/30)
EXHIBIT A5-8
Page 4 of 30 005190

Manuscript March 1, 2018
Figure 2: Commercial products with several ultrasonic transducers can jam nearby microphones. Onemanufacturer sells a clutch, presumably for fashionable people to jam microphones at cocktail parties.
2 Spectral Analysis of AP News Audio
We initiate our study with two observations from the AP news: (1) the original audio recordings
and (2) description on the high-pitched sounds heard by those in Cuba. Our goal is to construct
ultrasonic signals that can lead to similar spectral and audible characteristics.
Audio clips. The AP News [16] published several recordings from Cuba described as high-
pitched or metallic cricket sounds1. As a common method to analyze signals, frequency spectrum
is obtained by Fourier transforms of the original sounds. The AP news performed the spectrum
analysis on a smartphone (Figure 3) and shown a spectrum plot centered at 7 kHz (Figure 4 and 5).
The spectrum plot demonstrates that there are roughly more than 20 different frequencies embed-
ded in the audio recording.
We acquired the audio from the AP News2, which claims include a recording of what some U.S.
embassy workers heard in Havana. The recording extracted from the video is 5 seconds long, and
sampled at 44.1 kHz with 32-bit floats. We analyzed the sound in time (Figure 6), frequency
(Figure 7), and time-frequency domains (Figure 8).
After zooming in and looking through the time signal, we found nothing remarkable. No mod-
ulation appears in the waveform (at least not ASK), and the waveform does not resemble FSK or1https://www.apnews.com/88bb914f8b284088bce48e54f6736d842https://www.youtube.com/watch?v=Nw5MLAu-kKs
Tech. Report CSE-TR-001-18 On Cuba, Diplomats, Ultrasound, and Intermodulation Distortion (5/30)
EXHIBIT A5-8
Page 5 of 30
Jammer~ , -~· , ~:;::;':;:::::;: ft
- ,_ ._... .. _ ...... , ... - ..... "",..,,,, --.. - ' -' __ , ,.......,.,_..._ ___ "{....., ____ ~_
............ "" ..,_(1,, ~---(!O· """"""-"'"' --·
- ==
TAMBOURINE•ULTRAf',/ersion
uc1utch'1-dictaphones and
microphones jam mer
$919.00
,· am ,_)G_,oG_,_ --
005191
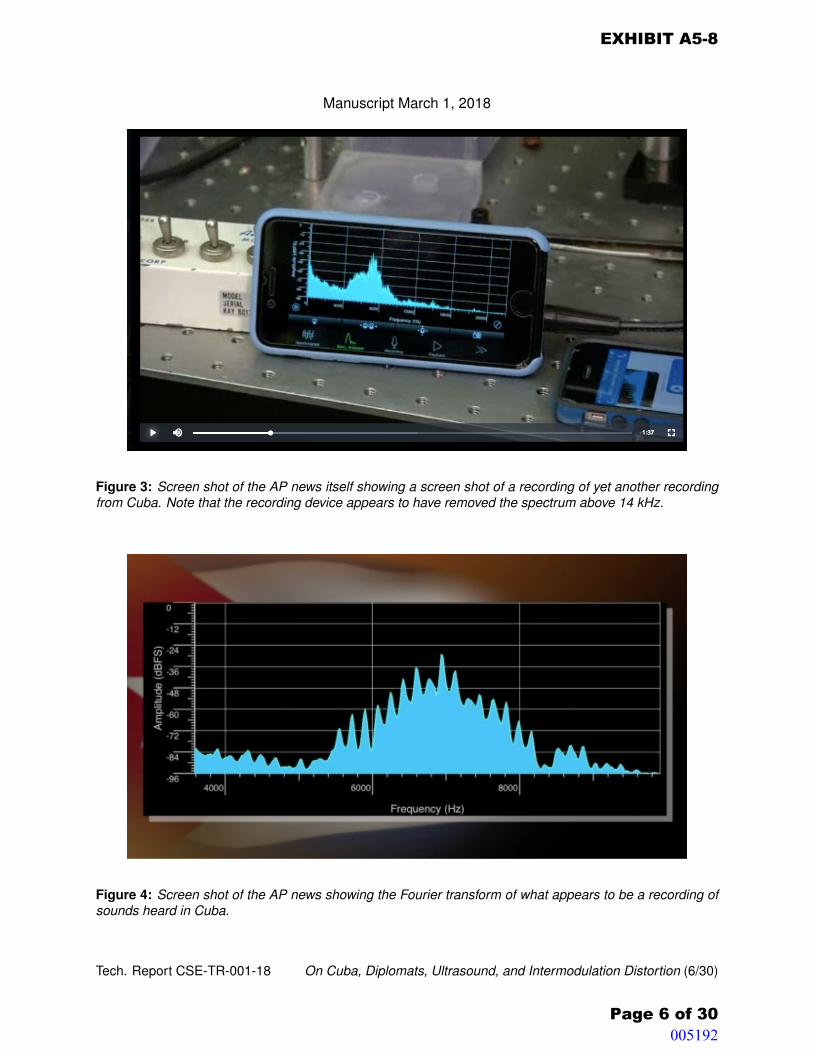
Manuscript March 1, 2018
Figure 3: Screen shot of the AP news itself showing a screen shot of a recording of yet another recordingfrom Cuba. Note that the recording device appears to have removed the spectrum above 14 kHz.
Figure 4: Screen shot of the AP news showing the Fourier transform of what appears to be a recording ofsounds heard in Cuba.
Tech. Report CSE-TR-001-18 On Cuba, Diplomats, Ultrasound, and Intermodulation Distortion (6/30)
EXHIBIT A5-8
Page 6 of 30 005192

Manuscript March 1, 2018
Figure 5: Screen shot of the AP news analyzing a different recording showing emphasis on spectrum near7 kHz.
Figure 6: The time domain signal of metallic sounds extracted from the AP News video.
Tech. Report CSE-TR-001-18 On Cuba, Diplomats, Ultrasound, and Intermodulation Distortion (7/30)
EXHIBIT A5-8
Page 7 of 30
AP obtains a recording of what some U.S. embassy workers heard in Havana as they were attacked by what investigators initially believed was a sonic weapon. The recording of a high-pitched noise is one of many taken in Cuba since attacks started. (Oct. 12)
005193

Manuscript March 1, 2018
Figure 7: The spectrum of metallic sounds extracted from the AP News video. The spectrum of the APnews audio ends abruptly at 15 kHz. We suspect this is an artifact of either the AP audio filtering, YouTubeaudio filtering that is known to roll off beginning at 16 kHz, or iPhone audio filtering that begins to roll off at21 kHz on our equipment.
PSK, among other common modulation schemes. We wondered for a moment if someone might
be playing a joke on us with fake audio if after demodulation, a message were to tell us it’s all a
joke. So for giggles, we tried AM demodulation. The resulting signal sounds like a F1 engine and
is not likely meant as a message.
The spectral plot (Figure 7) shows major frequency components around 7 kHz. The peaks
(6,704 Hz, 6,883 Hz, 7,070 Hz, 7,242 Hz, 7,420 Hz) are separated by approximately 180 Hz.
However, in the waterfall plot (Figure 8), the major frequencies (in yellow) do not change over
time. This lack of change again suggests that there is no frequency-related modulation, such as
FM or FSK. So wherever the sound comes from, it produces a mixture of several tones around
7 kHz separated by 180 Hz.
Tech. Report CSE-TR-001-18 On Cuba, Diplomats, Ultrasound, and Intermodulation Distortion (8/30)
EXHIBIT A5-8
Page 8 of 30
F.......-,cyAn.ly,i>
- Hid8 -!Sdll
-2 ldll
- Sl dll
_,.,. - 57dll
-60!18---+--+--+--+----,-+-+--+--+--
-63dll
- 66dll
-69dll
-75dll
-78dll
-S ldll
- 8411B
-87dll
- 9011B
. .,,
---+----+---e---+----+---e---• ·-"
f)
005194
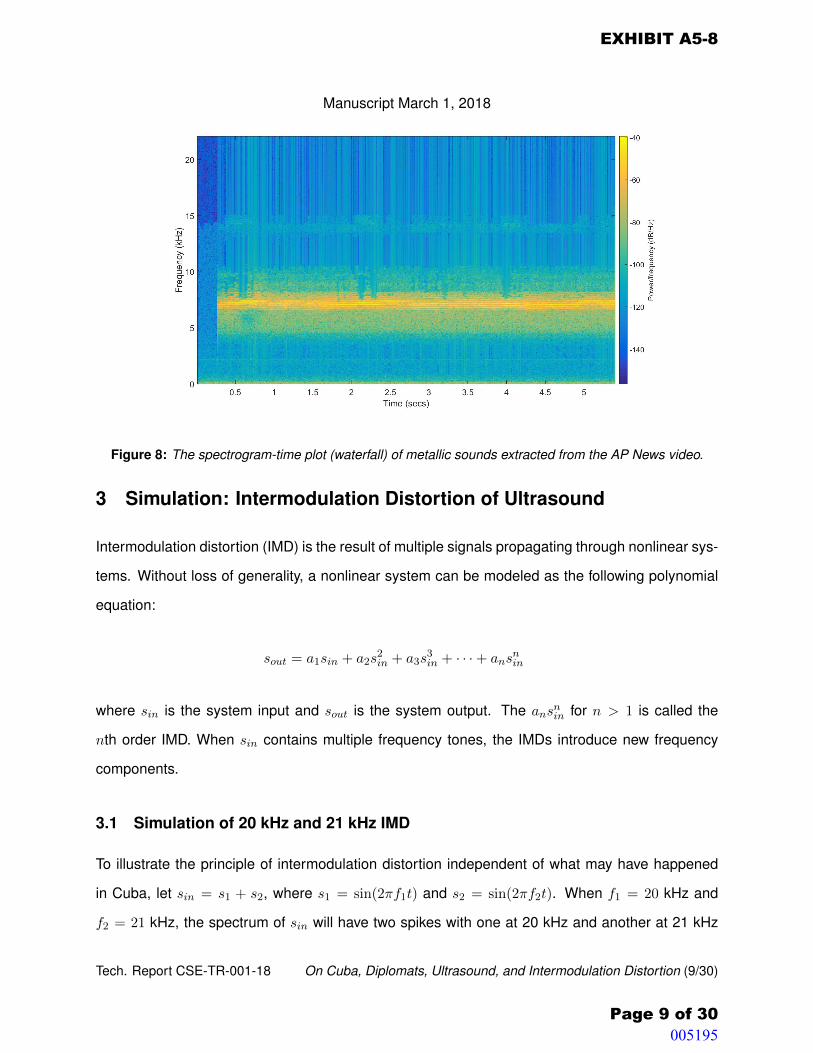
Manuscript March 1, 2018
Figure 8: The spectrogram-time plot (waterfall) of metallic sounds extracted from the AP News video.
3 Simulation: Intermodulation Distortion of Ultrasound
Intermodulation distortion (IMD) is the result of multiple signals propagating through nonlinear sys-
tems. Without loss of generality, a nonlinear system can be modeled as the following polynomial
equation:
sout = a1sin + a2s2in + a3s
3in + · · ·+ ans
nin
where sin is the system input and sout is the system output. The ansnin for n > 1 is called the
nth order IMD. When sin contains multiple frequency tones, the IMDs introduce new frequency
components.
3.1 Simulation of 20 kHz and 21 kHz IMD
To illustrate the principle of intermodulation distortion independent of what may have happened
in Cuba, let sin = s1 + s2, where s1 = sin(2πf1t) and s2 = sin(2πf2t). When f1 = 20 kHz and
f2 = 21 kHz, the spectrum of sin will have two spikes with one at 20 kHz and another at 21 kHz
Tech. Report CSE-TR-001-18 On Cuba, Diplomats, Ultrasound, and Intermodulation Distortion (9/30)
EXHIBIT A5-8
Page 9 of 30
-40
20
-60
15 -80 N
~ :3.
g " -100 5" 1'
1 Q_
-120
5
-140
0 0.5 1.5 2 2.5 3 3.5 4 4.5 5
Time (secs)
005195

Manuscript March 1, 2018
0 5000 10000 15000 20000 25000
Frequency (Hz)
-160
-140
-120
-100
-80
-60
-40
-20
0
20
Am
plitu
de (
dB)
Figure 9: Spectrum of our input signal with pure tones at 20 kHz and 21 kHz to illustrate effects of IMD ina nonlinear medium.
(Figure 9).
After the signals pass through the nonlinear system, sout will contain new frequency compo-
nents that are determined by the order of IMD. Figures 10–11 show the spectrum of the 2nd, 3rd,
4th, and 5th IMDs. For example, the 2nd order IMD introduces new frequencies at f2− f1 (1 kHz),
f2 + f1 (41 kHz), 2f1 (40 kHz), and 2f2 (42 kHz). Notice that f2 − f1 is below 20 kHz and audible.
The 4th order IMD introduces both f2 − f1 (1 kHz) and 2f2 − 2f1 (2 kHz).
0 10000 20000 30000 40000 50000 60000 70000 80000 90000
Frequency (Hz)
-160
-140
-120
-100
-80
-60
-40
-20
0
20
Am
plitu
de (
dB)
0 10000 20000 30000 40000 50000 60000 70000 80000 90000
Frequency (Hz)
-160
-140
-120
-100
-80
-60
-40
-20
0
20
Am
plitu
de (
dB)
Figure 10: Spectrum of the (L) 2nd and (R) 3rd order IMD for (f1, f2) = (20 kHz, 21 kHz).
Tech. Report CSE-TR-001-18 On Cuba, Diplomats, Ultrasound, and Intermodulation Distortion (10/30)
EXHIBIT A5-8
Page 10 of 30
+
+
+
005196

Manuscript March 1, 2018
0 10000 20000 30000 40000 50000 60000 70000 80000 90000
Frequency (Hz)
-160
-140
-120
-100
-80
-60
-40
-20
0
20A
mpl
itude
(dB
)
0 10000 20000 30000 40000 50000 60000 70000 80000 90000
Frequency (Hz)
-160
-140
-120
-100
-80
-60
-40
-20
0
20
Am
plitu
de (
dB)
Figure 11: Spectrum of the (L) 4th and (R) 5th order IMD for (f1, f2) = (20 kHz, 21 kHz).
3.2 Simulation of IMD of Three Ultrasonic Tones
In practice, most signals contain multiple tones. To illustrate the effects of IMD on three ultrasonic
tones, let us explore the case of three signals at 25 kHz, 32 kHz, and 32.18 kHz. That is, sin =
s1+s2+s3, where s1 = sin(2πf1t), s2 = sin(2πf2t), and s3 = sin(2πf3t), f1 = 25 kHz, f2 = 32 kHz,
and f3 = 32.18 kHz. We selected 32.18 kHz to mimic the observation of a 180 Hz separation in
the AP news spectrum.
0 2000 4000 6000 8000 10000 12000 14000 16000 18000 20000
Frequency (Hz)
-160
-140
-120
-100
-80
-60
-40
-20
0
20
Am
plitu
de (
dB)
0 2000 4000 6000 8000 10000 12000 14000 16000 18000 20000
Frequency (Hz)
-160
-140
-120
-100
-80
-60
-40
-20
0
20
Am
plitu
de (
dB)
Figure 12: Audible spectrum of the (L) 2nd and (R) 3rd order IMD for 25 kHz, 32 kHz, and 32.18 kHz tones.
When there are more than two signals, intermodulation happens between each pair of the
signals. In our case, the 2nd order IMD introduces new frequencies (below 20 kHz) at f2 − f1
Tech. Report CSE-TR-001-18 On Cuba, Diplomats, Ultrasound, and Intermodulation Distortion (11/30)
EXHIBIT A5-8
Page 11 of 30
+
+
+
+
+
005197
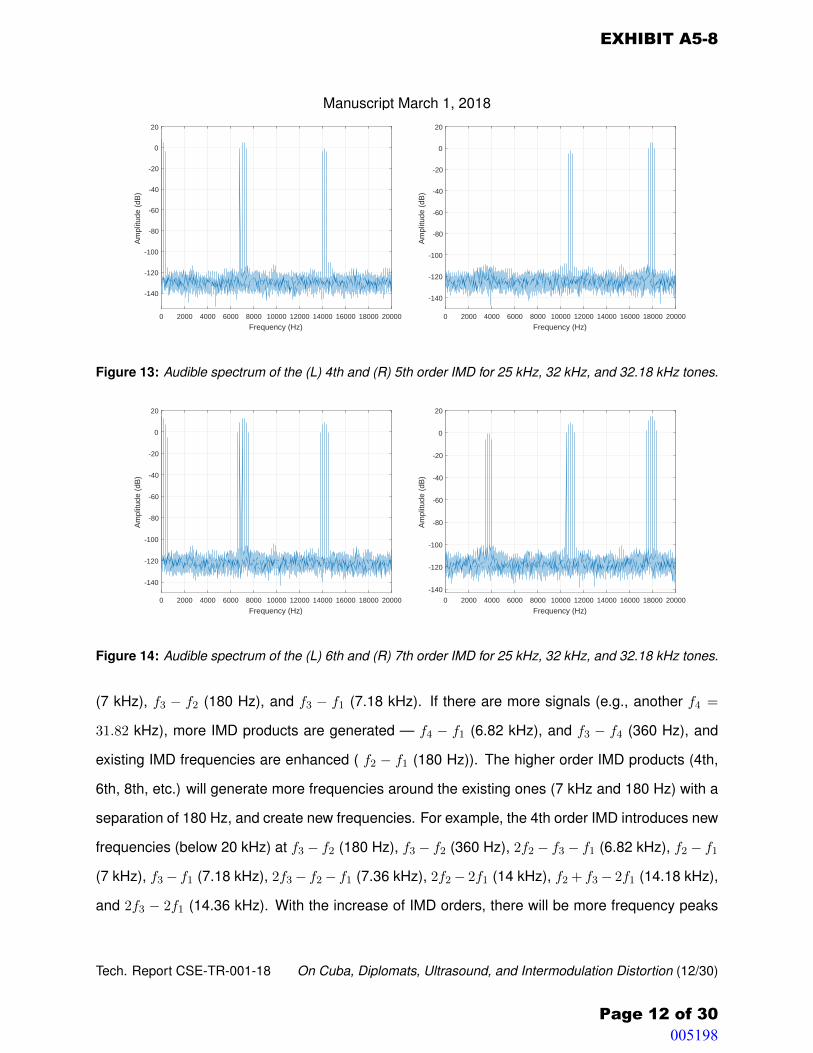
Manuscript March 1, 2018
0 2000 4000 6000 8000 10000 12000 14000 16000 18000 20000
Frequency (Hz)
-140
-120
-100
-80
-60
-40
-20
0
20A
mpl
itude
(dB
)
0 2000 4000 6000 8000 10000 12000 14000 16000 18000 20000
Frequency (Hz)
-140
-120
-100
-80
-60
-40
-20
0
20
Am
plitu
de (
dB)
Figure 13: Audible spectrum of the (L) 4th and (R) 5th order IMD for 25 kHz, 32 kHz, and 32.18 kHz tones.
0 2000 4000 6000 8000 10000 12000 14000 16000 18000 20000
Frequency (Hz)
-140
-120
-100
-80
-60
-40
-20
0
20
Am
plitu
de (
dB)
0 2000 4000 6000 8000 10000 12000 14000 16000 18000 20000
Frequency (Hz)
-140
-120
-100
-80
-60
-40
-20
0
20
Am
plitu
de (
dB)
Figure 14: Audible spectrum of the (L) 6th and (R) 7th order IMD for 25 kHz, 32 kHz, and 32.18 kHz tones.
(7 kHz), f3 − f2 (180 Hz), and f3 − f1 (7.18 kHz). If there are more signals (e.g., another f4 =
31.82 kHz), more IMD products are generated — f4 − f1 (6.82 kHz), and f3 − f4 (360 Hz), and
existing IMD frequencies are enhanced ( f2 − f1 (180 Hz)). The higher order IMD products (4th,
6th, 8th, etc.) will generate more frequencies around the existing ones (7 kHz and 180 Hz) with a
separation of 180 Hz, and create new frequencies. For example, the 4th order IMD introduces new
frequencies (below 20 kHz) at f3 − f2 (180 Hz), f3 − f2 (360 Hz), 2f2 − f3 − f1 (6.82 kHz), f2 − f1
(7 kHz), f3 − f1 (7.18 kHz), 2f3 − f2 − f1 (7.36 kHz), 2f2 − 2f1 (14 kHz), f2 + f3 − 2f1 (14.18 kHz),
and 2f3 − 2f1 (14.36 kHz). With the increase of IMD orders, there will be more frequency peaks
Tech. Report CSE-TR-001-18 On Cuba, Diplomats, Ultrasound, and Intermodulation Distortion (12/30)
EXHIBIT A5-8
Page 12 of 30
+ + + + +
005198

Manuscript March 1, 2018
0 2000 4000 6000 8000 10000 12000 14000 16000 18000 20000
Frequency (Hz)
-120
-100
-80
-60
-40
-20
0
20
Am
plitu
de (
dB)
Figure 15: Audible spectrum of the 8th order IMD for 25 kHz, 32 kHz, and 32.18 kHz tones.
rippling around 180 Hz, 7 kHz, and 14 kHz. Each ripple will be separated by 180 Hz.
Now consider the audible frequencies produced by all the IMDs up to and including the 8th
order summed together in Figure 16. The peaks near 7 kHz are beginning to resemble the AP
news spectrum.
100 1000 10000
Frequency (Hz)
-120
-100
-80
-60
-40
-20
0
20
40
Am
plitu
de (
dB)
Figure 16: Log-scale cumulative audible spectrum of 2nd though 8th order IMD for 25 kHz, 32 kHz, and32.18 kHz.
Tech. Report CSE-TR-001-18 On Cuba, Diplomats, Ultrasound, and Intermodulation Distortion (13/30)
EXHIBIT A5-8
Page 13 of 30 005199

Manuscript March 1, 2018
0 5000 10000 15000 20000 25000 30000 35000 40000
Frequency (Hz)
-160
-140
-120
-100
-80
-60
-40
-20
0
20
Am
plitu
de (
dB)
Figure 17: Calculated spectrum of 25 kHz tone and 180 Hz AM modulated over a 32 kHz carrier.
3.3 Simulation of IMD of Ultrasonic Modulation
To generate similar intermodulation of three ultrasonic tones, it is feasible to explore the IMD for
two signals where one is modulated on an ultrasonic carrier. In particular, to generate signals
similar to the recording, i.e., signals centered at 7 kHz with a serial of multiples of 180 Hz signals
nearby, we can utilize two signals and their intermodulation. Let sin = s1 + s2. One of the signals
can be a single tone, s1 = sin(2πf1t), and the other will be a signal that is modulated with a single
tone of 180 Hz. In particular, we utilize amplitude modulation (AM) that produces double-sideband
and transmitted carrier. For example, when the baseband signal is a single tone at fm = 180 Hz,
and the carrier signal is at fc = 32 kHz, AM with transmitter carrier will produce an output of
s2 = sin(2πfct) + sin(2πfct) sin(2πfmt), which can be seen as the combination of three signals at
fc (32 kHz), fc + fm (32.18 kHz), and fc − fm (31.82 kHz), as shown in Figure 17. When IMD
happens between such an AM signal and a f1 = 25 kHz single tone, the result will be exactly the
same as the previous example — signals around 7 kHz, 180 Hz, 14 kHz, and more.
The spectrum of the simulated IMD through the 7th order products with input of 25 kHz and
180 Hz AM modulated on a 32 kHz carrier is depicted in Figure 18 and Figure 19 (log-scale).
If the baseband signal is not a 180 Hz tone, but music or something else with many tones, it
will only change the separation (fm) of the smaller peaks. The recovered signals always remain at
around 7 kHz, 14 kHz, and 18 kHz. If we only consider the strongest 2nd order product, there will
Tech. Report CSE-TR-001-18 On Cuba, Diplomats, Ultrasound, and Intermodulation Distortion (14/30)
EXHIBIT A5-8
Page 14 of 30 005200
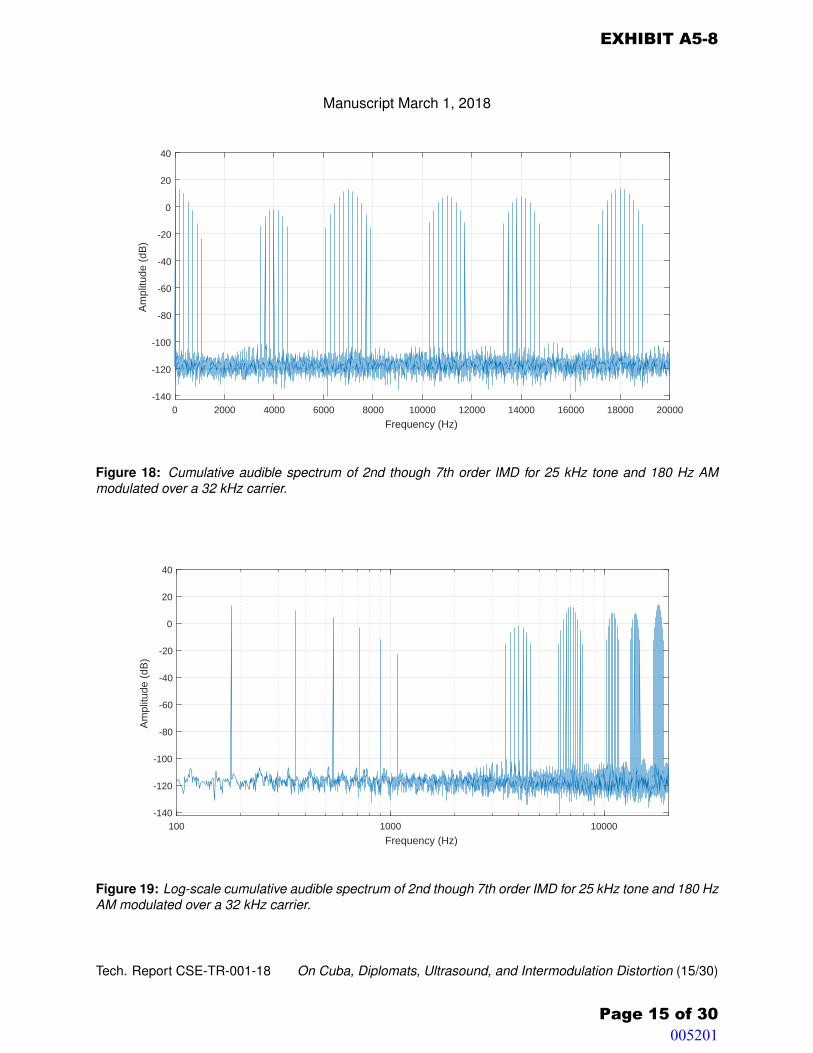
Manuscript March 1, 2018
0 2000 4000 6000 8000 10000 12000 14000 16000 18000 20000
Frequency (Hz)
-140
-120
-100
-80
-60
-40
-20
0
20
40A
mpl
itude
(dB
)
Figure 18: Cumulative audible spectrum of 2nd though 7th order IMD for 25 kHz tone and 180 Hz AMmodulated over a 32 kHz carrier.
100 1000 10000
Frequency (Hz)
-140
-120
-100
-80
-60
-40
-20
0
20
40
Am
plitu
de (
dB)
Figure 19: Log-scale cumulative audible spectrum of 2nd though 7th order IMD for 25 kHz tone and 180 HzAM modulated over a 32 kHz carrier.
Tech. Report CSE-TR-001-18 On Cuba, Diplomats, Ultrasound, and Intermodulation Distortion (15/30)
EXHIBIT A5-8
Page 15 of 30
+ +
+
005201

Manuscript March 1, 2018be signals at only around 7 kHz.
3.4 Discussion of Simulation Results
Different systems (e.g., recording devices) have different nonlinear properties that determine the
strength of each order of IMD products. In the simulations, we use ai coefficients of unity weight
for the strengths. If we were to obtain the recording devices and emitters from Cuba, we could
deduce the coefficients. We surmise that the reason that there are no obvious frequencies at
4 kHz, 11 kHz, and 18 kHz in the original AP news recording is because the intermodulation
products at the odd orders are weak relative to the 2nd and 4th order IMDs on whatever devices
recorded sounds in Cuba.
The IMD can also happen multiple times. IMD may occur during air-borne transmission. The
IMD can happen again inside the circuitry of a microphone as well as in the human inner ear itself.
Thus, the perceived sounds will differ depending upon where one is listening and what are the
characteristics of the microphone.
3.5 Summary of IMD Simulation
Our simulations confirmed the feasibility of reproducing the acoustic spectrum of the AP news
recording with the intermodulation distortion of multiple ultrasonic signals. Notice that in the spec-
trum of the AP news recording, there were also frequency components at 180 Hz (not obvious),
360 Hz, 540 Hz, and around 14 kHz.
4 Experiments
With the theories validated by the Matlab simulations, our next step was to generate real ultrasonic
signals that caused audible sensations that mimic the sounds heard in Cuba.
Tech. Report CSE-TR-001-18 On Cuba, Diplomats, Ultrasound, and Intermodulation Distortion (16/30)
EXHIBIT A5-8
Page 16 of 30 005202
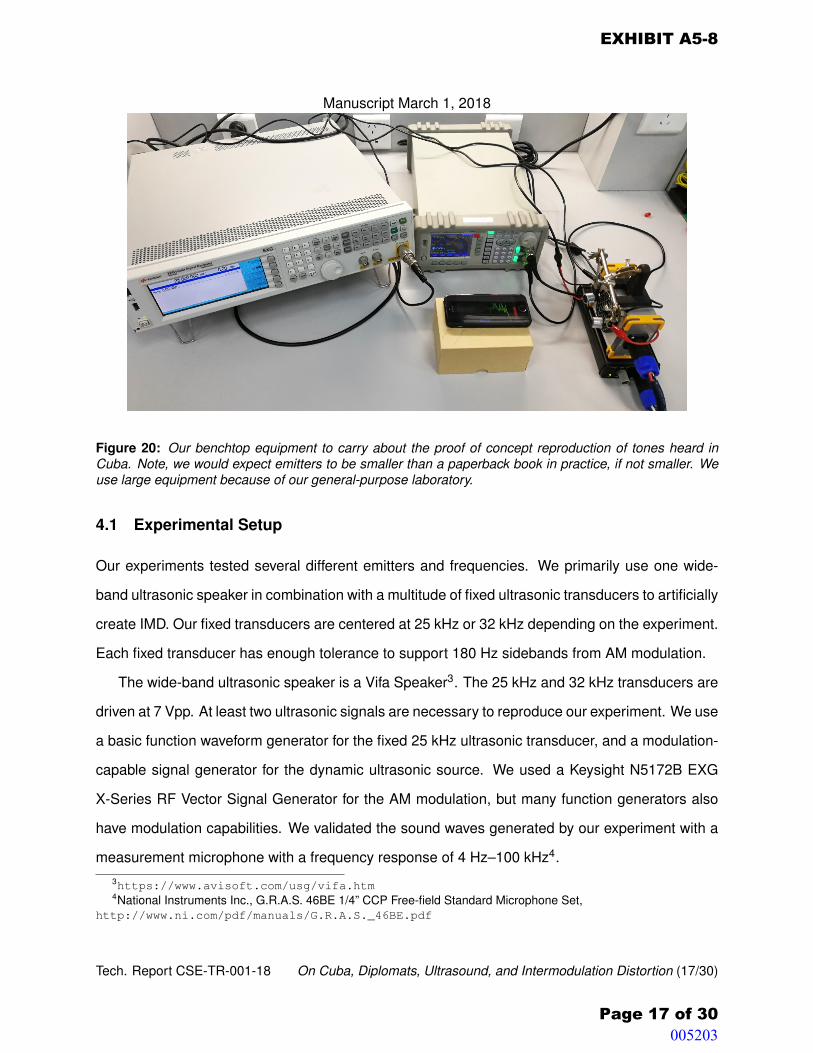
Manuscript March 1, 2018
Figure 20: Our benchtop equipment to carry about the proof of concept reproduction of tones heard inCuba. Note, we would expect emitters to be smaller than a paperback book in practice, if not smaller. Weuse large equipment because of our general-purpose laboratory.
4.1 Experimental Setup
Our experiments tested several different emitters and frequencies. We primarily use one wide-
band ultrasonic speaker in combination with a multitude of fixed ultrasonic transducers to artificially
create IMD. Our fixed transducers are centered at 25 kHz or 32 kHz depending on the experiment.
Each fixed transducer has enough tolerance to support 180 Hz sidebands from AM modulation.
The wide-band ultrasonic speaker is a Vifa Speaker3. The 25 kHz and 32 kHz transducers are
driven at 7 Vpp. At least two ultrasonic signals are necessary to reproduce our experiment. We use
a basic function waveform generator for the fixed 25 kHz ultrasonic transducer, and a modulation-
capable signal generator for the dynamic ultrasonic source. We used a Keysight N5172B EXG
X-Series RF Vector Signal Generator for the AM modulation, but many function generators also
have modulation capabilities. We validated the sound waves generated by our experiment with a
measurement microphone with a frequency response of 4 Hz–100 kHz4.3https://www.avisoft.com/usg/vifa.htm4National Instruments Inc., G.R.A.S. 46BE 1/4” CCP Free-field Standard Microphone Set,
http://www.ni.com/pdf/manuals/G.R.A.S._46BE.pdf
Tech. Report CSE-TR-001-18 On Cuba, Diplomats, Ultrasound, and Intermodulation Distortion (17/30)
EXHIBIT A5-8
Page 17 of 30
..... :
__ .... ::.:· ; _; .: .
005203

Manuscript March 1, 2018We used SpectrumView and Ultrasonic Analyzer to produce the Fourier transforms of the
sounds we measured with the microphone in our lab. Note, microphones can also add distor-
tion and may differ from what a human would have heard in the room. In our Fourier transforms of
the IMD recorded by our measurement microphone, we noticed very clear a 7 kHz tone and a few
peaks that are 180 Hz, 360 Hz, 540 Hz, 720 Hz away from 7 kHz.
4.2 Experiment with Three Ultrasonic Tones
As shown in Figure 21, we generate ultrasound at three different frequencies (25 kHz, 32 kHz,
32.18 kHz) with three devices—two 32 kHz ultrasonic transducers (for 32 kHz and 32.18 kHz)
and a wide-band ultrasonic speaker (for 25 kHz). A smartphone with recording and spectrum
analysis applications listen to the ultrasonic sources, which are driven by two signal generators.
The spectrum, the magnified spectrum around 7 kHz, and the waterfall plot appear in Figures 21–
23. The experimental findings are consistent with results of simulation, except for the 3.5 kHz and
11 kHz signals, which might be caused by imperfections of the ultrasonic speakers. Notice that
the logarithmic scale spectrum resembles what we observed in the simulations, which supports
the nonlinearity model.
4.3 Experiment with Modulation
Our experiments tested a couple modulation schemes, including AM and FM. The FM (Figure 25)
does not appear to match well with the AP News recording, but the AM modulation does (Fig-
ure 24).
4.4 Experiments with Video Demonstrations
The following videos show our experiments in action. The white appliance is the Keysight N5172B
EXG X-Series RF Vector Signal Generator for the AM modulation, and it is connected to the silver
ultrasonic speaker with orange rims on the right (the ultrasonic Vifa Speaker); the grey appliance
is the signal generator that drives the fixed ultrasonic transducers. Note, in the picture above, we
Tech. Report CSE-TR-001-18 On Cuba, Diplomats, Ultrasound, and Intermodulation Distortion (18/30)
EXHIBIT A5-8
Page 18 of 30 005204

Manuscript March 1, 2018
Figure 21: Spectrum recorded during an IMD experiment playing three ultrasonic tones (25 kHz, 32 kHz,32.18 kHz).
Figure 22: Magnified spectrum of the signals near 7 kHz during an IMD experiment playing three ultrasonictones (25 kHz, 32 kHz, 32.18 kHz)
Tech. Report CSE-TR-001-18 On Cuba, Diplomats, Ultrasound, and Intermodulation Distortion (19/30)
EXHIBIT A5-8
Page 19 of 30 005205

Manuscript March 1, 2018
Figure 23: Waterfall plot during an IMD experiment playing three ultrasonic tones (25 kHz, 32 kHz,32.18 kHz).
have two fixed ultrasonic transducers instead of one. The black smartphone in the middle serves
as a spectrum analyzer.
Science of Synthesizing Audible Sounds from Ultrasonic Intermodulation Distortion. How
can inaudible ultrasonic signals lead to audible byproducts? When multiple ultrasonic tones pass
through a nonlinear medium such as air or a microphone, the result is intermodulation distortion5.
In our experiment, we have two signals. One is a 180 Hz sine wave AM modulated over a 32 kHz
ultrasonic carrier. The second is a simple 25 kHz ultrasonic sine wave. The smartphone displays
the Fourier transform of repeated intermodulation distortion in the air and smartphone microphone
circuitry. The 2nd order intermodulation distortion includes the difference between the two signals,
which appears centered at 7 kHz and peppered with sidebands from the modulated 180 Hz. The
higher order intermodulation distortion products create additional ripples in the spectrum at 7 kHz
as well as several other frequencies. Matlab simulations predict the strong 7 kHz intermodulation
distortion product, and we suspect the 4 kHz tones are the result of secondary intermodulation5https://youtu.be/wA2MZshrafk
Tech. Report CSE-TR-001-18 On Cuba, Diplomats, Ultrasound, and Intermodulation Distortion (20/30)
EXHIBIT A5-8
Page 20 of 30 005206

Manuscript March 1, 2018
Figure 24: Spectrum of sounds heard by a smart phone when playing 25 kHz and 180 Hz AM modulatedon a 32 kHz carrer. The IMD spectrum resembles the ripples near 7 kHz in the AP news spectrum.
Figure 25: Spectrum of sounds heard by a smart phone when playing 25 kHz and 180 Hz FM modulatedon a 32 kHz carrer.
Tech. Report CSE-TR-001-18 On Cuba, Diplomats, Ultrasound, and Intermodulation Distortion (21/30)
EXHIBIT A5-8
Page 21 of 30 005207

Manuscript March 1, 2018distortion in the microphone.
At the beginning of the video, only the AM modulated signal (32 kHz carrier & 180 Hz sinusoidal
baseband) is played through the ultrasonic Vifa Speaker, and the modulated ultrasounds cannot
be heard or seen on the spectrum, which is out of the range of the spectrum plots. Once the signal
generator starts to drive the fixed ultrasonic transducer to transmit a 25 kHz tone, we observe the
IMD, as the spectrum analyzer shows, and can hear the high-pitched sounds.
Localized Audible Sounds Synthesized from Ultrasonic Intermodulation Distortion. Us-
ing two signal generators of low-intensity ultrasonic tones, we demonstrate synthesis of audible
byproducts below 20 kHz6. Note, there are likely two cascading instances of intermodulation dis-
tortion: Once in the air that nearby humans can perceive, and a second time in the microphone of
this smartphone. Thus, recordings of sound in Cuba are unlikely to match perfectly what humans
perceived. In this experiment, our smartphone sensed a 4 kHz tone, but the student conducting
the experiment could not hear a 4 kHz tone. Also note that the smartphone microphone has a
frequency response that tapers off quickly after 20 kHz.
Absence of Audible Intermodulation Distortion from Single Ultrasonic Tone. Using two sig-
nal generators of ultrasonic tones, we demonstrate that the audible byproducts disappear when
we disable one of the ultrasonic sources7. This is because at least two signals are necessary to
elicit intermodulation distortion from a nonlinear medium such as air or microphone amplification
circuitry.
Covertly Exfiltrating a Song with an Ultrasonic Carrier. This proof of concept shows two
things: (1) how ultrasound can be used to covertly exfiltrate data (in this toy example, the audio
from a memetastic song serves as a stand-in for eavedropping a conversation) and (2) how the
covert channel becomes audibly overt when a second ultrasonic tone interferes. In this video8,
there are three microphones, two ultrasonic transmitters, and one audible speaker. One GRAS6https://youtu.be/ZTLjs4dbnEA7https://youtu.be/o9jqwk83PSM8https://youtu.be/w7_J1E5g8YQ
Tech. Report CSE-TR-001-18 On Cuba, Diplomats, Ultrasound, and Intermodulation Distortion (22/30)
EXHIBIT A5-8
Page 22 of 30 005208

Manuscript March 1, 2018ultrasonic microphone, one audible microphone on the iPhone plotting the FFT, and one audible
microphone on the video recording device. The Vifa dynamic ultrasonic speaker emits the music
modulated on an ultrasonic carrier. A small ultrasonic emitter sends out a single 32 kHz tone.
A computer processing the ultrasonic signals from the G.R.A.S. microphone demodulates the
signal and plays the resulting data, which is the song except when IMD causes corruption of the
demodulation.
4.5 Discussion of Experiments
Our ultrasonic experiments create small, focused areas where one can perceive the audible
sounds. Only where the ultrasonic beams cross do the sounds become apparent. Moving even a
few inches from the beam can change the pitch, intensity, and sensation.
Our experiments were carried out in a lab at extremely low amplitudes to ensure the safety of
the researchers.
The IMD products generated in our lab differ from the AP news recording in that we notice a
set of tones at 4 kHz. IMD can happen between two signals and among more than two signals. To
illustrate, we carried out experiments with multiple ultrasonic signals. While the student carrying
out the experiment did hear the 7 kHz tone with his own ears, he could not hear the 4 kHz tone.
We suspect that non linearities in our measurement microphone created this additional 4 kHz IMD.
This observation is consistent with IMD we have found in other microphones from our previous
research on ultrasonic cybersecurity [28].
5 Safety and Neurological Implications
There are two important questions that affect humans. What types of ultrasound can lead to
hazardous situations or harm, and what are the neurological effects on humans?
Safety: Hazards, Hazardous Situations, Harm. We find little consensus on the risks of human
exposure to air-borne ultrasound [21, 1]. Airborne ultrasonic waves on their own are not neces-
Tech. Report CSE-TR-001-18 On Cuba, Diplomats, Ultrasound, and Intermodulation Distortion (23/30)
EXHIBIT A5-8
Page 23 of 30 005209
Manuscript March 1, 2018sarily harmful, but it may become harmful at large intensity or when in direct contact exposure to
a vibrating source. In direct contact exposure rather than by air, ultrasound can cause thermal in-
juries [1]. OSHA warns of potential harm from subharmonics of ultrasound [3], and appears to set
a safety threshold in an abundance of caution. Health Canada [1] sets stricter safety requirements
for the intensity of airborne ultrasound based on “plausible” risks of heating and cavitation as well
as auditory and subjective effects. Canada sets a conservative 110 dB safety limit on emissions
of airborne ultrasound.
According to the news [16], “The AP reported last month that some people experienced attacks
or heard sounds that were narrowly confined to a room or parts of a room.” Such a sensation is
typical for ultrasound because ultrasound is more directional than audible sound and infrasound.
Ultrasound can be focused on a certain area. Therefore, ultrasound would match the symtoms of
discomfort.
Neurological Effects of Ultrasound. Researchers analyzed the effects of intense sounds on
humans, but we find that the outcomes include large safety margins to make up for lack of con-
sensus [4]. The Handbook Human Vibration [9] and an ISO standard [2] explore the physiological
effects of low frequency vibrations and sounds. We have found little in the way of reproducible
control trials for ultrasonic vibrations aside from folklore. Neurologists who examined the injured
diplomats published their findings in JAMA [25], and suggest that the neurological damage is real.
However, there are limitations to the retroactive study [18]—namely, causality is difficult to es-
tablish without a control trial or elimination of other null hypotheses. Our report does not itself
contribute any new findings on neurological harm.
6 Alternative Explanations
While our results do not rule out other potential causes, the results do rule in the notion that
ultrasound without harmful intent could have led to accidental harm to diplomats in Cuba.
We originally suspected subharmonics of ultrasound as the cause, but this hypothesis would
not align well with the spectral analysis by the AP news. Rather than evenly spaced ripples in the
Tech. Report CSE-TR-001-18 On Cuba, Diplomats, Ultrasound, and Intermodulation Distortion (24/30)
EXHIBIT A5-8
Page 24 of 30 005210

Manuscript March 1, 2018frequency domain, we would expect to see frequencies at 1/n submultiples of the fundamental
frequency for integers n if subharmonics were to blame.
180 Hz happens to be the high end of the fundamental frequencies of average male conver-
sational voices. It may be coincidence that the tones are 180 Hz apart, but it could also indicate
some kind of voice eavesdropping modulated over ultrasound and gone awry.
7 Related Work
The notion of using audible and inaudible sound to cause auditory and sensory illusions is not
new. Our results build upon the following research.
Research from the music community used AM modulation on ultrasound to generate focused
audible sound [19]. This research evolved into a company called Holosonics9 with a product called
Audio Spotlight for music, personalized sound, and museum exhibits, among other artistic applica-
tions. Companies such as the LRAD Corporation10 produce products that deliver higher intensity
sounds with military application to crowd control and long-distance hailing at sea. However, mod-
ern LRADs use audible parametric sound rather than ultrasound. Projects such as Soundlazer11
allow the hobbyist engineer to play with ultrasonic generation of audible tones. Musicians have
also used intermodulation distortion of audible tones to synthesize additional audible tones from
nonlinearities of the inner ear [14]. Campbell even describes his realization of hearing synthe-
sized combination tones (also known as intermodulation distortion) while listening to a movement
in Sibelius’s Symphony #1 [6].
Several researchers use ultrasound to fool sensors such as microphones. The BackDoor paper
from Illinois [20] uses ultrasound and intermodulation distortion to jam eavesdropping microphones
and watermark music played at concerts. A team from Korea uses both audible and ultrasonic
tones to cause malfunctions in flight stability control of drones by acoustic interference at the
resonant frequency of MEMS gyroscopes [22].9https://www.holosonics.com/
10https://www.lradx.com/11http://www.soundlazer.com/
Tech. Report CSE-TR-001-18 On Cuba, Diplomats, Ultrasound, and Intermodulation Distortion (25/30)
EXHIBIT A5-8
Page 25 of 30 005211

Manuscript March 1, 2018In our past research, we use audible and ultrasonic tones to test the cybersecurity of computer
systems. The DolphinAttack paper [28] uses ultrasound and intermodulation distortion to inject in-
audible, fake voice commands into speech recognition systems including Siri, Google Now, Sam-
sung S Voice, Huawei HiVoice, Cortana, Alexa, and the navigation system of an Audi automobile.
Researchers from Princeton [23] investigate inaudible voice commands from ultrasound on An-
droid phones and Amazon Echo. The Walnut paper [26] exploits nonlinear amplifiers, permissive
analog filters, and signal aliasing to adulterate the output of MEMS accelerometers with sound
waves at the resonant frequency of the sensor found in applications such as Fitbits, airbags, and
smartphones. The sensors effectively serve as unintentional demodulators of the sound. Our up-
coming Blue Note [5] paper analyzes the physics of why hard drives and operating systems get
corrupted or spontaneously reboot when subjected to certain ultrasonic tones or by clicking on a
link to a web site that plays maliciously crafted sound through the victim computer’s mechanically
coupled speakers.
We have urged more attention to the physics of cybersecurity [7], and the events in Cuba
provide more evidence of the need to understand the causal relationships between physics and
cybersecurity.
8 Unresolved Questions
Our report only rules in ultrasound and intermodulation distortion as a cause. It does not eliminate
other hypotheses. In particular, several mysteries remain:
• How could ultrasound penetrate walls into homes and offices? Could an emitter be outside
the premises or planted inside? Was it primarily air-borne, or did it originate as contact
vibration?
• At what level of intensity could IMD products cause harm to humans? We know of no non-
trivial lower bounds. Based on our reading of various safety documents, we believe most
countries set conservative thresholds for airborne ultrasound from an abundance of caution
and to compensate for uncertainty. While there are anecdotes and folklore for harm from
Tech. Report CSE-TR-001-18 On Cuba, Diplomats, Ultrasound, and Intermodulation Distortion (26/30)
EXHIBIT A5-8
Page 26 of 30 005212

Manuscript March 1, 2018airborne ultrasound, we have found no primary sources that confirm this aside from stories
about extremely intense sounds above 155 dB.
• What about standoff distance? Our report does not investigate distance. We do not have a
facility to safely test high intensity ultrasound, but might look into it in the future if can borrow
an airport runway.
• Could audible tones be a symptom or cause? Without a control study, it would be difficult to
distinguish a cause from a symptom. It’s possible that the audible sensations are byproducts
from contact vibration or some other ultrasonic source.
9 Conclusion
Two inaudible ultrasonic signals mixing in a nonlinear medium could easily lead to an audible in-
termodulation distortion product. Although little is known about how audible sound waves can
cause neurological damage rather than merely be correlated with neurological damage, the safety
community has studied how certain audible sounds can cause pain and hearing damage. Thus,
ultrasonic intermodulation distortion could produce harmful, audible byproducts. The safety warn-
ings on audible frequencies and intensities would apply to these byproducts.
While our experiments do not eliminate the possibility of malicious intent to harm diplo-
mats, our experiments do show that whoever caused the sensations may have had no
intent for harm. The emitter source remains an open question, but could range from covert ul-
trasonic exfiltration of modulated data to ultrasonic jammers of eavesdropping devices or perhaps
just ultrasonic pest repellents. It’s also possible that someone was trying to covertly deliver data
into a localized space using ultrasound to say, activate a sensor or other hidden device. Our ex-
periments show that tones modulated on an ultrasonic carrier by one or more parties could have
collided invisibly to produce audible byproducts. These audible byproducts can exist at frequen-
cies known to cause annoyance and pain. Other theories include solid vibration (e.g., unwittingly
standing on a covert transmitter) at ultrasonic frequencies for prolonged periods—leading to bodily
harm. In such a case, audible intermodulation distortion could represent a harmless side effect
Tech. Report CSE-TR-001-18 On Cuba, Diplomats, Ultrasound, and Intermodulation Distortion (27/30)
EXHIBIT A5-8
Page 27 of 30 005213
Manuscript March 1, 2018rather than the cause of harm. Although our tests focus on frequencies rather than amplitudes or
distances, we believe that high amplitude ultrasonic signals could easily produce high amplitude
audible signals as unintentional byproducts capable of harm to hearing.
Acknowledgments
This research is supported by NSF CNS-1330142. The views and conclusions contained in this
paper are those of the authors and should not be interpreted as necessarily representing the
official policies, either expressed or implied, of NSF. We thank the U.S. Department of State and
the members of the U.S. Foreign Service for their dedication to representing America abroad.
Change Log, Errata
1. March 1, 2018: Release 1.0. Technical feedback is welcome, and we will periodically update
this report as new facts come to light.
References
[1] Guidelines for the Safe Use of Ultrasound: Part II Industrial and Commercial Applications.pages 1–43, 1991. Health Canada.
[2] Mechanical Vibration and Shock: Evaluation of human exposure to whole-body vibration.pages 1–7, 1997. ISO Standard 2631-1.
[3] OSHA Technical Manual: Noise: Appendix C Ultrasound. pages 1–3, 2013.
[4] C H Allen, I Rudnick, and H Frings. Some Biological Effects of Intense High FrequencyAirborne Sound. The Journal of the Acoustical Society of America, 20(2):221–221, March1948.
[5] Connor Bolton, Sara Rampazzi, Chaohao Li, Andrew Kwong, Wenyuan Xu, and Kevin Fu.Blue Note: How Intentional Acoustic Interference Damages Availability and Integrity in HardDisk Drives and Operating Systems. In Proceedings of the 39th Annual IEEE Symposium onSecurity and Privacy, May 2018.
[6] Murray Campbell and Clive Greated. The Musician’s Guide to Acoustics. OUP Oxford, April1994.
Tech. Report CSE-TR-001-18 On Cuba, Diplomats, Ultrasound, and Intermodulation Distortion (28/30)
EXHIBIT A5-8
Page 28 of 30 005214
Manuscript March 1, 2018[7] Kevin Fu and Wenyuan Xu. Inside Risks: Risks of Trusting the Physics of Sensors. Commu-
nications of the ACM, 61(2):20–23, February 2018.
[8] Tim Golden and Sebastian Rotella. The Sound and the Fury: Inside the Mystery of theHavana Embassy. Pro Publica, February 2018.
[9] M J Griffin. Handbook of Human Vibration. Academic Press, December 2012.
[10] Gardiner Harris. Tillerson Suggests Cuba Could Have Stopped ‘Targeted Attacks’ on U.S.Diplomats. The New York Times, December 2017.
[11] Gardiner Harris. U.S. to Open Formal Inquiry on Americans Sickened in Cuba. The New YorkTimes, January 2018.
[12] Gardiner Harris, Julie Hirschfeld Davis, and Ernesto Londono. U.S. Expels 15 Cuban Diplo-mats, in Latest Sign Detente May Be Ending. The New York Times, October 2017.
[13] Gardiner Harris and Adam Goldman. Illnesses at U.S. Embassy in Havana Prompt Evacua-tion of More Diplomats. The New York Times, September 2017.
[14] Gary S Kendall, Christopher Haworth, and Rodrigo F Cadiz. Sound Synthesis with AuditoryDistortion Products. Computer Music Journal, 38(4):5–23, 2014.
[15] Gina Kolata. Diplomats in Cuba Suffered Brain Injuries. Experts Still Don’t Know Why. TheNew York Times, February 2018.
[16] Josh Lederman and Michael Weissenstein. Dangerous sound? What Americans heard inCuba attacks. AP News, October 2017.
[17] Alexis C Madrigal. The Case of the Sick Americans in Cuba Gets Stranger. The Atlantic,February 2018.
[18] Christopher C Muth and Steven L Lewis. Neurological Symptoms Among US Diplomats inCuba. JAMA, pages 1–3, February 2018.
[19] F Joseph Pompei. The Use of Airborne Ultrasonics for Generating Audible Sound Beams.Journal of Audio Engineering Society, 47(9), September 1999.
[20] Nirupam Roy, Haitham Hassanieh, and Romit Roy Choudhury. BackDoor: Making Micro-phones Hear Inaudible Sounds. In ACM MobiSys ’17, pages 2–14. ACM Press, 2017.
[21] Bozena Smagowska. Effects of Ultrasonic Noise on the Human Body—A Bibliographic Re-view. International Journal of Occupational Safety and Ergonomics JOSE, 19(2), 2013.
[22] Yunmok Son, Hocheol Shin, Dongkwan Kim, Youngseok Park, Juhwan Noh, Kibum Choi,Jungwoo Choi, and Yongdae Kim. Rocking Drones with Intentional Sound Noise on Gyro-scopic Sensors. In 24th USENIX Security Symposium (USENIX Security), pages 881–896,2015.
[23] Liwei Song and Prateek Mittal. Inaudible voice commands. CoRR, abs/1708.07238, 2017.
Tech. Report CSE-TR-001-18 On Cuba, Diplomats, Ultrasound, and Intermodulation Distortion (29/30)
EXHIBIT A5-8
Page 29 of 30 005215

Manuscript March 1, 2018[24] Richard Stone. Stressful conditions, not ‘sonic weapon,’ sickened U.S diplomats, Cuba panel
asserts. Science, December 2017.
[25] Randel L Swanson II, Stephen Hampton, Judith Green-McKenzie, Ramon Diaz-Arrastia,M Sean Grady, Ragini Verma, Rosette Biester, Diana Duda, Ronald L Wolf, and Douglas HSmith. Neurological Manifestations Among US Government Personnel Reporting DirectionalAudible and Sensory Phenomena in Havana, Cuba. JAMA, pages 1–9, February 2018.
[26] Timothy Trippel, Ofir Weisse, Wenyuan Xu, Peter Honeyman, and Kevin Fu. WALNUT: Wag-ing doubt on the integrity of MEMS accelerometers with acoustic injection attacks. IEEEEuropean Symposium on Security & Privacy, pages 3–18, 2017.
[27] Emily Waltz. Was a Sonic Weapon Deployed in Cuba. IEEE Spectrum, December 2017.
[28] Guoming Zhang, Chen Yan, Xiaoyu Ji, Tianchen Zhang, Taimin Zhang, and Wenyuan Xu.DolphinAttack: Inaudible Voice Commands. ACM CCS, pages 103–117, 2017.
Tech. Report CSE-TR-001-18 On Cuba, Diplomats, Ultrasound, and Intermodulation Distortion (30/30)
EXHIBIT A5-8
Page 30 of 30 005216
PUBLIC HEALTHHYPOTHESIS ANDTHEORY ARTICLE
published: 11 November 2014doi: 10.3389/fpubh.2014.00220
The link between health complaints and wind turbines:support for the nocebo expectations hypothesisFiona Crichton1*, Simon Chapman2,Tim Cundy 3 and Keith J. Petrie1
1 Department of Psychological Medicine, University of Auckland, Auckland, New Zealand2 School of Public Health, University of Sydney, Sydney, NSW, Australia3 Department of Medicine, University of Auckland, Auckland, New Zealand
Edited by:Loren Knopper, IntrinsikEnvironmental Sciences Inc., Canada
Reviewed by:Robert G. Berger, IntrinsikEnvironmental Sciences Inc., CanadaJames Rubin, King’s College London,UK
*Correspondence:Fiona Crichton, Department ofPsychological Medicine, Faculty ofMedical and Health Sciences,University of Auckland, Private Bag92019, Auckland, New Zealande-mail: [email protected]
The worldwide expansion of wind energy has met with opposition based on concernsthat the infrasound generated by wind turbines causes health problems in nearby resi-dents. In this paper, we argue that health complaints are more likely to be explained by thenocebo response, whereby adverse effects are generated by negative expectations. Whenindividuals expect a feature of their environment or medical treatment to produce illnessor symptoms, then this may start a process where the individual looks for symptoms orsigns of illness to confirm these negative expectations. As physical symptoms are commonin healthy people, there is considerable scope for people to match symptoms with theirnegative expectations.To support this hypothesis, we draw an evidence from experimentalstudies that show that, during exposure to wind farm sound, expectations about infrasoundcan influence symptoms and mood in both positive and negative directions, depending onhow expectations are framed. We also consider epidemiological work showing that healthcomplaints have primarily been located in areas that have received the most negative pub-licity about the harmful effects of turbines. The social aspect of symptom complaints ina community is also discussed as an important process in increasing symptom reports.Media stories, publicity, or social discourse about the reported health effects of wind tur-bines are likely to trigger reports of similar symptoms, regardless of exposure. Finally,we present evidence to show that the same pattern of health complaints following nega-tive information about wind turbines has also been found in other types of environmentalconcerns and scares.
Keywords: wind farms, infrasound, nocebo effect, psychological expectations, health scares, symptom reporting,environmental risks, media warnings
INTRODUCTIONIn recent years, challenges to new wind farm developments havebeen mounted on the basis that exposure to sound, and particu-larly infrasound, generated by wind turbines poses a health risk(1). Unfortunately, addressing concerns about health effects hasbeen complicated by a lack of clarity about what might be caus-ing the symptoms reported. Perceived adverse health effects saidto be experienced by people living near wind turbines includesymptoms such as sleep disturbance, headache, earache, tinni-tus, nausea, dizziness, heart palpitations, vibrations within thebody, aching joints, blurred vision, upset stomach, and short-term memory problems (2). In this article, we explore factorsthat might explain symptom reporting attributed to wind farmsand put forward the case for the nocebo expectations hypothesis;that symptom reporting can be explained by negative expecta-tions, rather than any pathophysiological link between symptomsand wind farm sound. Research consistently indicates that theexpectation of adverse health effects can itself produce negativehealth outcomes, which is a phenomenon known as the noceboeffect (3). Negative expectations generating nocebo responses havebeen shown to have a powerful influence on health outcomes inclinical populations (4), and reported symptom experiences incommunity samples (5).
THE LINK BETWEEN WIND FARM SOUND AND HEALTHCOMPLAINTSWhen investigating the cause of symptom reporting attributedto any purported environmental hazard, it is axiomatic that theexistence of a biological basis for symptomatic experiences is thor-oughly explored, so that an organic cause of symptoms is noterroneously discounted (6). Given that symptom reporting hasbeen attributed to wind farm sound (2), it is necessary to considerthe evidence for any direct relationship between exposure to suchsound and symptom reporting. Given reductions in mechanicalnoise, as a result of refinements to wind turbine design, aerody-namic sound is now the dominant source of noise from modernwind farms (7). This aerodynamic noise, which is generated asa result of the flow of air past the turbine blades, is presentacross a range of frequencies, from the audible to sub-audibleinfrasound (8).
At this time, studies have not found a direct causal link betweenliving in the vicinity of wind farms, audible wind farm soundexposure, and physiological health effects (1). Audible soundlevels, assessed at the nearest residence, have been consistentlyfound to fall within accepted health and safety limits for ambi-ent background noise, and evidence does not support a directlink between such sound exposure and symptom reporting (9).
www.frontiersin.org November 2014 | Volume 2 | Article 220 | 1
EXHIBIT A5-9
Page 1 of 8 005217

Crichton et al. The nocebo expectations hypothesis
To elaborate further, although a small proportion of people reportbeing annoyed by wind farm sound, particularly by detectable fluc-tuations of sound in the mid-frequency range (500–1000 Hz), theevidence does not indicate that exposure to such sound is directlycausing adverse physiological effects in those living in the vicin-ity of wind farms (8). In addition, despite concerns that audiblelow frequency noise (20–200 Hz) produced by wind turbines istriggering symptomatic experiences, this is not supported by thescientific evidence (10).
Further, the evidence does not substantiate conjecture thatexposure to sub-audible wind farm generated infrasound (soundbelow 20 Hz) is responsible for health complaints. It is importantto note that exposure to infrasound is an everyday experience.Infrasound is constantly present in the external environment,caused by phenomena such as weather variations, air turbulence,ocean waves, traffic, and other machinery (11). Notably, the bodyand vestibular systems have evolved to prevent disturbance frominfrasound generated from internal processes, such as respirationand heart rate, which is produced at higher levels than infrasoundgenerated by wind farms (12). While sound in the infrasonic rangemay become audible at sufficiently high pressure levels, infrasoundproduced by wind turbines is below the threshold of human per-ception (11, 13), and research does not support the existence ofadverse health effects of exposure to infrasound at sub-audible lev-els (14). Importantly, a recent investigation found the contributionof wind turbines to measured infrasound levels at residential loca-tions near wind farms was insignificant in comparison with thebackground level of infrasound in the environment (15). Givenconsistent evidence that infrasound produced by wind turbinesdoes not exceed typical levels of infrasound found in every-day urban or rural environments, health impacts of infrasoundproduced by wind turbines are not indicated (12, 16).
As the evidence does not support a direct link between audibleor sub-audible sound generated by wind turbines and reportedsymptomatic experiences by people living in the vicinity of windfarms, it is apparent that factors beyond exposure to wind turbinesound are implicated in symptom reporting.
PERCEPTION OF HEALTH RISK AND EXPECTATIONSThere is accruing evidence that some people facing the prospectof a new wind farm near their residence, or currently living withinthe vicinity of a wind farm, are genuinely fearful of the potentialhealth effects of operating wind turbines (1). This has relevance asevidence shows a relationship between assessment of health riskand symptom reporting, which does not depend upon whethera health risk is genuine (17). This is seen in community exam-ples where there has been an error about exposure to a perceivedtoxic agent. In one such case, symptom complaints attributed toexposure to electromagnetic radiation from a mobile phone toweroccurred when the tower itself was not yet active (18).
In fact, extreme increases in symptom reports, in instances ofboth genuine and perceived toxic exposure to harmful agents, havebeen repeatedly shown in community settings (19) with strengthof environmental concern being a critical factor in predicting theoccurrence of symptom complaints (20). This was highlighted in astudy in which participants, from 10 villages in Germany, had theirsleep monitored over 12 nights during which they were exposed
to sham signals and electromagnetic field signals from an exper-imental base station (21). There was no evidence for short-termphysiological effects of electromagnetic fields emitted by mobilephone base stations on sleep quality, but findings demonstrateda negative influence on objective and subjective sleep quality insubjects who were concerned that proximity to mobile phone basestations might negatively affect health.
Evidence shows that health-related worries about perceivedenvironmental hazards inform negative expectations, which inturn draw attention to body processes and shape how individualsdecipher symptoms [e.g., Ref. (22)]. Negative expectations trans-late into symptomatic experiences, because focused attention tothe body has the tendency to draw awareness to common sensa-tions that might otherwise go unnoticed (23). Further, increasedanxiety itself causes a rise in physiological activity giving rise tosymptoms such as dry mouth and rapid heart-beat (23). Evidencesuggests people may misinterpret symptoms of hypervigilance andanxiety as a sign of illness, particularly if symptoms experiencedare consistent with concerns about health (24).
Recently, there has been a noticeable rise in the number of peo-ple expressing concern about health effects presented by the soundgenerated by wind farms, and fears about health risk have emergedas a key predictor of opposition to wind farm development (25,26). Such fears are more prominent in countries where wind farmsare relative new comers on the landscape, which aligns with con-sistent evidence of associations between the introduction of newtechnologies, community concern about related health risks, andsymptom reporting (27, 28).
MATTER OF EXPECTATIONWhile the operation of modern commercial wind farms com-menced more than 20 years ago in several nations, widespreadclaims that exposure to wind farm sound produces adverse, oftenacute and immediate, symptomatic experiences, are much morerecent (29). This change is reflected in the shifting focus of com-munity opposition to wind farms over time. Historically, com-munity opposition to wind farms has centered on concerns aboutdepreciation of property values, problems with esthetic integra-tion on the landscape, and apprehension about the intrusivenessof noise produced by wind turbines (30, 31). However, in recentyears, concern about the adverse health risk of exposure to windturbine sound has repeatedly emerged as a new focal point of com-munity opposition to wind farms, indicating a change in the wayin which wind farms are now perceived (1).
Such concern, as well as a dramatic amplification of symptomreports (29), coincided with the promotion in 2009 of the self-published book Wind Turbine Syndrome-A Natural Experiment(2), also available and summarized on the internet. The book por-trays infrasound produced by wind turbines as a threat to health,and explicitly sets out the physical symptoms and health effectsto be expected by those living in proximity to a wind farm. Giventhat wind farms simultaneously generate infrasound and audi-ble sound, negative health information about infrasound is likelyto influence the perception of wind farm sound in its entirety.Further, although the narrative of the book emphasizes the perni-ciousness of the sub-audible components of wind farm sound, italso sets out health concerns about audible sound, particularly low
Frontiers in Public Health | Epidemiology November 2014 | Volume 2 | Article 220 | 2
EXHIBIT A5-9
Page 2 of 8 005218

Crichton et al. The nocebo expectations hypothesis
frequency audible wind farm sound. Thus, health concerns trig-gered by the type of information contained in the book are likelyto inform negative expectations extending to both the audible andsub-audible components of wind farm sound exposure.
The concurrence of the publication of Wind Turbine Syndrome-A Natural Experiment and an increase in symptom reportingattributed to wind farms (29) supports the argument that symp-toms are more likely due to negative expectations triggered byhealth information, rather than being caused by pathogenic expo-sure to wind farm sound. This is exemplified in a study assessinghistorical complaints, in relation to 51 Australian wind farms oper-ating from 1993 to 2012 (29). Findings illustrated that, prior to2009, health and noise complaints were rare, despite small andlarge wind farms having operated in Australia for many years. Thestudy found that 90% of complainants made their first complaintpost 2009, after anti-wind farm campaigners disseminated infor-mation about the purported health effects of wind farms. Further,the majority of complaints were confined to the six wind farmstargeted by anti-wind farm campaigners, indicating complainantshad accessed negative health information (29).
Additional support for the involvement of negative expec-tations, in relation to the increase in symptom reporting seensince 2009, is also provided by recent field research demonstrat-ing that people higher in negative-oriented personality traits aremore likely to report higher levels of perceived noise (unrelatedto actual noise levels) and more non-specific physical symptomsaround wind farms (32). Experimental research demonstrates thatindividuals with higher levels of negative affect are more suscep-tible to the influence of expectations about health effects createdby suggestion and more likely to report expectation consistentsymptoms (33).
The ascription of a disease label “Wind Turbine Syndrome” isa powerful way to create health concerns and set expectations.Where individuals adopt disease labels to reflect symptomaticexperiences attributed to environmental causes they are morelikely to be concerned about the environmental health risk posed,and less likely to be reassured by scientific investigation if it indi-cates there is no link between the perceived environmental hazardand symptoms (34). The use of an illness label “Wind TurbineSyndrome” (2), along with a widely publicized and explicated listof syndrome symptoms, not only creates the impression that thereis a risk that those living near wind turbines will develop a rec-ognized medical condition, but also creates a comprehensive ideaof expected symptoms. Simply reading about symptoms of an ill-ness can prompt self-detection of disease specific symptoms, aphenomenon seen in medical student disease. Here, medical stu-dents, in the course of learning about an illness, start to experiencesymptoms indicative of the disease studied (35, 36). The processof learning about an illness appears to generate a cognitive repre-sentation of the illness, or mental schema, which guides the way inwhich internal sensory information is attended to, so that symp-toms or sensations that align with the schema are noticed andreported. Symptoms that are inconsistent with the schematic rep-resentation of the relevant illness are likely to be overlooked ordiscounted (37).
Thus, negative expectations operate as a blueprint or heuristicfor the type of symptoms attended to and reported. In a clinical
research setting, a substantial number of patients, randomized tothe placebo arms of placebo controlled drug trials, experience andreport symptoms reflective of the side effects of active treatment[e.g., Ref. (38)]. In an experimental study, participants inhaling abenign substance,described to them as a“suspected environmentaltoxin” known to cause headache, nausea, itchy skin, and drowsi-ness, reported increases in symptoms, particularly in relation tosymptoms they had been told they might expect to experience (39).
Therefore, merely being aware of the type of symptoms thathave been attributed to wind turbines is likely to trigger anexpectancy directed cognitive body search, whereby the body isselectively monitored for sensations and symptoms consistent withideas about the physiological effects of exposure to wind farms.During this process, individuals will be inclined to notice com-mon symptoms, which align with expectations and to interpretambiguous sensations in accordance with such beliefs (40). Thiswas demonstrated in a double-blind provocation study, whereparticipants who watched material from the internet suggestingthat infrasound produced by wind farms generated symptoms,reported significant increases from pre-exposure assessment, inthe number and intensity of symptoms experienced during expo-sure to both infrasound and sham infrasound (41). Importantly,elevations in symptom reporting, during exposure periods, coin-cided with information about the precise symptom profile, saidto be related to infrasound exposure. During both exposure peri-ods, participants reported more symptoms characterized as typicalsymptoms of infrasound exposure, than symptoms differentiatedas atypical symptoms of exposure to infrasound. Results suggestedthat expectations formed by accessing negative health informationabout wind farm sound could be providing a pathway for symptomreporting in community settings.
EXPECTATIONS AND MISATTRIBUTIONIt is important to note that many of the symptoms said to arisefrom exposure to wind farms, such as headache, fatigue, con-centration difficulties, insomnia, gastrointestinal problems, andmusculoskeletal pain, are commonly experienced by healthy indi-viduals (23). If people are worried about the health effects of anenvironmental agent and form symptom expectations, they arealso more likely to notice and misattribute their current sympto-matic experience to that environmental agent. This can occur evenwhen symptoms are more consistent with everyday experiencesand may, under different circumstances, be explained as just partand parcel of normal life (22). Given that the symptoms said tobe associated with wind turbines, such as tinnitus, sleep problems,and headache, are extremely common in the general community(42–44), many hearing about a putative connection with windturbine exposure may be persuaded that health problems theyexperience can be attributed to this exposure. An analysis of symp-tom reporting by people living in the vicinity of wind turbines inCanada indicated that the prevalence of reported symptoms wasconsistent with symptom prevalence in the general population,suggesting that people are likely to be misattributing their ordinaryexperience of common symptoms to wind turbines, rather thanbecoming more symptomatic (45).
Many of the symptoms associated with wind turbines,such as dizziness and heart palpitations, are also stress-related
www.frontiersin.org November 2014 | Volume 2 | Article 220 | 3
EXHIBIT A5-9
Page 3 of 8 005219

Crichton et al. The nocebo expectations hypothesis
concomitants of autonomic arousal associated with anxiety anddistress (46). Further, evidence indicates a bidirectional relation-ship between anxiety and insomnia (47), so that people who areanxious about the health effects of wind farms may experiencesleep difficulties because of this anxiety, and sleep difficulties may,in turn, exacerbate the experience of physiological symptoms ofanxiety. These symptoms may then be misattributed to wind farmsound, if there is an expectation that wind farm sound poses ahealth risk.
Evidence also indicates that fears associated with beliefs thatinnocuous stimuli have dangerous health consequences, engendersassociations between such stimuli and stress-related symptoms,so that exposure to such stimuli may become a cue for symptomexpression (48). Therefore, detecting wind turbine noise may facil-itate symptom expression because, for those concerned about thehealth effects of wind turbines, hearing the noise signifies exposureto a perceived environmental hazard. Such an interpretation wouldprovoke anxiety, resulting in heightened physiological arousal andstress-related symptoms.
Interestingly, evidence suggests that individuals are much lesslikely to be annoyed by wind turbine noise if they unable tosee wind turbines from their dwelling, even if the sound itselfis at a relatively high level (49). Where individuals are wor-ried about the health effects of wind turbines, the visibility ofwind turbines from a residence is likely to be a particularly con-crete reminder of their concern, thus perpetuating anxiety andrelated physiological arousal. Therefore, both audibility of soundand visibility of a wind turbine may act as situational cues forsymptom expression, triggering stress-related symptoms, therebyreinforcing health concerns (48).
Concerns about a perceived environmental hazard and corre-sponding negative expectations can also lead to misattribution ofcurrent illness, so that illnesses are viewed as a reaction to environ-mental exposure rather than the result of aging or other diseaseprocesses. Over the past 50 years, an increasing concern about theenvironment appears to have led to heightened sensitivities toenvironmental change, which have also impacted on the way peo-ple perceive illness and disease (17). Individuals are more inclinedthan previous generations to view ill health as a by-product of atoxic environment, and to worry about the enduring health effectsof environmental changes. The propensity to look for externalenvironmental causes for ill health is illustrated by research indi-cating a tendency among cancer survivors of the 10 most commoncancers to believe environmental factors play a much more sig-nificant role in carcinogenesis than scientific evidence warrants(50). Therefore, an environmental change, particularly involvingthe use of an emerging technology, is likely to be regarded withsuspicion and trigger expectations impacting on the way individ-uals interpret their own symptomatic experiences. Diseases suchas diabetes, skin cancer, and stroke, with much more establishedetiology, have instead been ascribed to wind farms indicating aprocess of misattribution (51).
MEDIA HEALTH WARNINGS AND EXPECTATIONSA recent study has demonstrated that the upsurge in noise andhealth complaints seen in Australia since 2009 has arisen primarilyin localities where there has been targeted publicity about the
alleged harmful impacts of wind farms (29). Two entire Australianstates with wind farms, but no history of anti-wind farm advocacy,had no reported instances of health or noise complaints. Findingsare consistent with research indicating that media warnings aboutpotential harm from environmental factors may create healthconcerns prompting symptom reporting, even in the absence ofobjective health risk (48). Merely watching a television reportabout the supposed adverse effects of Wifi has been shown toelevate concern about the health effects of electromagnetic fieldsand increase the likelihood of experiencing symptoms followingexposure to a sham Wifi signal (52).
In the case of wind farms, recent media stories have been shownto contain fright factors likely to trigger fear, concern, and anxietyabout the health risk posed by wind turbines (53). Assertions aboutthe adverse impacts of wind farm sound have been widely dis-seminated by the media, particularly via anti-wind farm internetwebsites, and have led to misconceptions about infrasound gener-ated by wind turbines and a conviction in some that wind farmscause a myriad of health complaints (12) Conjecture about theadverse health effects of wind farms is a consistent theme in publicdiscourse about wind turbines found in media reports embodiedin headlines such as “Wind turbines cause heart problems, headachesand nausea. . .“ (54); “Coming to a house, farm, or school near you?Wind Turbine Syndrome. . . “ (55); and television news items suchas “Wind Turbines cause health problems, residents say” (56). Fur-ther, misleading reports about the impact of living in the vicinityof wind farms, such as inaccurate accounts of home abandon-ment and emotive references to wind farm refugees, is also liableto create disquiet (57).
It has been verified in a recent double-blind provocation studythat the kind of information disseminated in the case of windfarms elevates health concerns and creates corresponding negativeexpectations, which result in symptomatic experiences. Partici-pants viewing a DVD, containing extracts from the internet out-lining the alleged health effects of infrasound generated by windturbines, reported increased concern about the health effects ofsound produced by wind farms, which was associated with ampli-fication of symptom reporting during both genuine and shamexposure to infrasound (41). Results showed negative expecta-tions may be created by media portrayal of alleged health risksposed by the sound created by wind turbines, which could explainsymptom reporting around wind farms.
The profound effect of the media narrative on the experi-ence of wind farm sound was confirmed in a follow-up study inwhich subjective health was influenced in either positive or neg-ative directions, depending on how the sound was portrayed. Inkeeping with previous findings, participants with negative expec-tations, formed from media warnings about infrasound, reportedincreased symptoms and deterioration in mood during simulta-neous exposure to infrasound and audible wind farm sound (58).In contrast, participants delivered positive expectations derivedfrom information extracted from the internet about the allegedtherapeutic effects of infrasound, experienced an improvement insymptomatic experiences and mood. Findings demonstrated themalleability of symptomatic responses and the power of informa-tion disseminated through the media to create expectations, whichdetermine how wind farm sound is experienced. It was particularly
Frontiers in Public Health | Epidemiology November 2014 | Volume 2 | Article 220 | 4
EXHIBIT A5-9
Page 4 of 8 005220
Crichton et al. The nocebo expectations hypothesis
telling that positive expectations about infrasound triggered aplacebo response in participants listening to audible wind farmsound, while being exposed to infrasound. This highlights thatexposure to audible wind farm sound can be a pleasurable expe-rience, if the narrative about the sound is depicted positively. Thestudy provides encouraging indications that if information dis-seminated about wind farm sound is framed in more neutral orbenign ways, then reported symptoms or negative health effectscan be ameliorated.
EXPECTATIONS CREATED BY SOCIAL INTERACTIONSIt is important to bear in mind that the experience of symptomsattributed to wind turbines occurs in community settings, and ina social context where there are a range of opinions, concerns, andpressure group activity about the construction of wind farms andabout possible health risks associated with them (1, 30). Evidencehas shown residents’ fears about the health effects of wind turbinesare increasingly becoming the focal point of community publicconsultation meetings, formed as part of resource consent andenvironmental assessment processes that relate to wind farms (1).Expectations can be learned from such social interactions (59), andmay also be created and reinforced by observation and modeling(Faasse et al. under review). The potential effect of observation onsymptom experience is indicated in an experimental study demon-strating that one-third of healthy controls, when exposed to imagesof other people in pain, reported pain in the same location as theobserved pain (60). Further, in an experimental study in whichparticipants inhaled an inert substance portrayed as a possibleenvironmental toxin, seeing someone exhibiting expected symp-toms increased participant reports of those specific symptoms,illustrating the phenomenon of contagion by observation, seen inmass psychogenic illness (61).
There are various avenues for observation and modeling ofsymptoms within communities where wind farms are established.Neighbors and members of the wider community may be exhibit-ing and talking about their symptomatic experiences, which theyattribute to wind farms. Television reports about the health effectsof wind turbines have also incorporated interviews with symp-tomatic people, describing their experiences in detail, providinganother medium by which symptoms may be modeled [e.g., Ref.(56)]. These interviews can usually be accessed on the internet, sopeople researching the effects of wind farms can observe modeledbehavior with ease.
There are also indications that, where symptoms are attrib-uted to wind turbines, health problems are reported by everyonewithin the affected household, including children [e.g., Ref. (2)].This suggests that familial modeling may play a role in symptomreporting, particularly in relation to affected children. Parentalpain and symptom modeling is implicated in the development ofunexplained pain and somatic complaints in pediatric populations(62, 63).
ANNOYANCE AND EXPECTATIONSIt seems apparent that elevated concern about the health effectsof living in the vicinity of wind farms, and the related formationof negative expectations, is also exacerbating reported annoyancewith wind farm sound. There is much variability between studies
in relation to the extent of reported wind farm noise annoyanceindicating that contextual matters are influencing annoyance reac-tions. Related studies undertaken in Sweden and the Netherlandshave indicated that approximately 10–20% of residents living inproximity to wind farms find wind turbine noise annoying, and6% of residents find wind turbine noise very annoying, at 35–40 dB exposure (7, 49, 64). However, another study conductedin New Zealand reported that 59% of respondents living within2 km of a wind farm experienced noise annoyance (65). The NewZealand study was undertaken at a time when there had beenadverse publicity about expected noise and health effects of liv-ing in the vicinity of the wind farm in question, including a storythat aired on free to air television (66). Understanding the fac-tors that contribute to annoyance is important because, althoughnoise annoyance is not in itself a disease or health state, annoy-ance is related to distress, which can lead to the experience ofstress-related symptoms (9, 67).
Being annoyed by noise is related to a range of personal andsituational variables, beyond the acoustic characteristics of noise(68, 69), and psychosocial factors account for more variation inindividual annoyance, than objective measures of noise level (70).Experimental work indicates that not being aware of the sourceof sound is associated with reduced noise annoyance in peopleexposed to wind farm sound, further confirming that the contextof sound exposure has more relevance for annoyance assessment,than the acoustic properties of wind farm sound (71). Importantly,a strong relationship has been found between concern about thenegative health effects of noise and noise annoyance (72). Theevidence also shows that wind turbine noise annoyance is morestrongly related to other negative attitudes about wind turbines,particularly the visual impact of wind turbines on the land scape,than to sound level (7, 49). Thus, rhetoric that creates health con-cerns about wind turbine sound, and presents a negative view ofwind farms, is likely to influence not just symptom reporting anddistress, but reported noise annoyance.
There is compelling evidence that creating a positive context forthe experience of wind farm sound, has a correspondingly posi-tive impact on reported annoyance. A field study conducted inThe Netherlands indicated that respondents who benefited eco-nomically from wind turbines, by either full or partial turbineownership or by receipt of other economic benefits, such as ayearly income, were less annoyed by wind turbine noise thanother respondents, despite exposure to higher sound levels (49).Notably, there were no differences in either likelihood to noticesound, or subjective noise sensitivity between those who did ordid not derive economic benefit. However, there were attitudi-nal differences. Respondents who benefited economically wereless negative both about wind turbines in general, and aboutthe visual impact of wind turbines on the landscape. Resultssuggest that experiencing wind farm sound in a positive con-text decreases the likelihood of forming negative views of windturbines associated with annoyance. This provides promising indi-cations that changing the narrative around wind farms, so thatworried residents become less concerned about their proximity towind farms and adopt more positive expectations and attitudes,might not only alleviate symptom reporting but also reduce noiseannoyance.
www.frontiersin.org November 2014 | Volume 2 | Article 220 | 5
EXHIBIT A5-9
Page 5 of 8 005221
Crichton et al. The nocebo expectations hypothesis
PATTERNS OF HEALTH COMPLAINTS SEEN IN OTHERINSTANCES OF PERCEIVED TOXIC EXPOSUREIt is relevant to note that symptom reporting, in response to per-ceived exposure to a toxic agent when no plausible health threatis posed, has been seen throughout history (17). Francis Bacon(1561–1626) noted “infections. . .if you fear them, you call thenupon you” (73). In one pertinent example, a dramatic elevationin reported symptoms in a community setting in Memphis fol-lowed a health scare fueled by media messages that the townwas located in close proximity to an old toxic waste dump (74).While a comprehensive examination of soil toxicity revealed nohazard was presented, health fears did not abate until it becameapparent authorities were mistaken as to the locality of the dump,which had actually been situated many miles from the town (19).Although symptom reporting then subsided, some residents con-tinued to insist they experienced symptoms from the phantomdump site.
Further, the advent of new technologies has consistently beenassociated with the development of subjective illness complaints,involving a constellation of symptoms, akin to those attributedto wind farms (28, 75). For instance, in 1889, following theincreasing use of the telephone, The British Medical Journal cau-tioned about the emergence of “telephone tinnitus” in respect ofwhich “the patients suffered from nervous excitability, with buzzingnoises in the ear, giddiness, and neuralgic pains” (76). With strik-ing parallels, almost a century later, the experience of a range ofnon-specific symptoms such as headache, fatigue, tinnitus, andconcentration problems have been attributed by some individu-als to exposure to electromagnetic fields via mobile telephones(77). This occurs despite the fact there is no generally acceptedcausal bio-electromagnetic mechanism, by which such symptomswould be triggered (78). Given that provocation studies haverepeatedly shown that sham electromagnetic exposure is sufficientto activate symptoms in individuals who believe they are sensi-tive to electromagnetic fields, the evidence suggests the involve-ment of nocebo responses; that it is anxiety about exposure andrelated negative expectations, which are triggering symptomaticexperiences (52).
CONCLUSIONAn analysis of the evidence concerning symptom reporting attrib-uted to sound produced by wind farms supports the noceboexpectation hypothesis; that health complaints can be explainedby the influence of negative expectations. It is apparent that symp-tom reporting coincided with an increase in health concern aboutwind farms promoted by a book and internet sites focused onhighlighting the purported heath dangers posed by sound, partic-ularly infrasound produced by wind turbines. Such information,which has been further circulated though social discourse andmedia reporting, is liable to trigger health concerns and relatedsymptoms of anxiety, while also creating a blueprint for whatsymptoms can be expected – expectations, which, in turn, arelikely to guide the type of symptoms noticed and reported. Thisis supported by epidemiological evidence that increased symp-tom reporting has occurred in locations where there has beentargeted dissemination of negative health information about windfarms, indicating that exposure to such information is shaping
symptomatic experiences. Experimental work also suggests thatit is expectation rather than wind farm sound exposure that isresponsible for symptom complaints.
Symptom reporting is also consistent with patterns of healthcomplaints seen in other environmental health scares involvingbenign exposure, and which often follow the introduction of newtechnologies. Importantly, indications that negative expectationsare implicated in symptomatic experiences ascribed to wind farmsaligns with evidence that instances of symptom reporting attrib-uted to perceived environmental hazards and exposure to moderntechnologies have been triggered by nocebo responses.
Understanding the underlying cause of health concerns andsymptom complaints, which have arisen in communities in whichwind farms have been proposed and developed, is critical if suchconcerns are to be addressed, and symptom reporting alleviated.Given indications of the determinative role of negative expecta-tions in creating and maintaining symptom reporting, success-ful strategies to address health complaints are likely to involvechanging the narrative about wind farms, to create more positiveexpectations.
AUTHOR CONTRIBUTIONSAll authors contributed to the conceptualization, writing, andediting of this manuscript.
REFERENCES1. Knopper LD, Ollson CA. Health effects and wind turbines: a review of the liter-
ature. Environ Health (2011) 10:78. doi:10.1186/1476-069X-10-782. Pierpont N. Wind Turbine Syndrome. Santa Fe, NM: K-Selected Books (2009).3. Benedetti F, Lanotte M, Lopiano L, Colloca L. When words are painful: unrav-
eling the mechanisms of the nocebo effect. Neuroscience (2007) 147:260–71.doi:10.1016/j.neuroscience.2007.02.020
4. Colloca L, Finniss D. Nocebo effects, patient-clinician communication, and ther-apeutic outcomes. JAMA (2012) 307:567–8. doi:10.1001/jama.2012.115
5. Faasse K, Gamble G, Cundy T, Petrie KJ. Impact of television coverage on thenumber and type of symptoms reported during a health scare: a retrospec-tive pre-post observational study. BMJ Open (2012) 2:e001607. doi:10.1136/bmjopen-2012-001607
6. Bartholomew RE, Wessely S. Protean nature of mass sociogenic illness: frompossessed nuns to chemical and biological terrorism fears. Br J Psychiatry (2002)180:300–6. doi:10.1192/bjp.180.4.300
7. Pedersen E, Persson Waye K. Perception and annoyance due to wind turbinenoise – a dose–response relationship. J Acoust Soc Am (2004) 116:3460–70.doi:10.1121/1.1815091
8. Merlin T, Newton S, Ellery B, Milverton J, Farah C. Systematic Review of theHuman Health Effects of Wind Farms. Canberra, ACT: National Health andMedical Research Council (2014). Available from https://www.nhmrc.gov.au/guidelines/publications/eh54
9. Ellenbogen JM, Grace S, Heiger-Bernays WJ, Manwell JF, Mills DA, Sulli-van KA, et al. Wind turbine health impact study: report of independentexpert panel. Prepared for Massachusetts Department of Environmental Protec-tion and Massachusetts Department of Public Health. (2012). Available fromhttp://www.mass.gov/dep/public/press/0112wind.htm
10. Bolin K, Bluhm G, Eriksson G, Nilsson ME. Infrasound and low frequencynoise from wind turbines: exposure and health effects. Environ Res Lett (2011)6:035103.
11. Leventhall G. Infrasound from wind turbines – fact, fiction or deception. CanAcoust (2006) 34:29–36.
12. Leventhall G. Concerns about infrasound from wind turbines. Acoust Today(2013) 9:30–8. doi:10.1121/1.4821143
13. O’Neal RD, Hellweg RD Jr, Lampeter RM. Low frequency noise and infra-sound from wind turbines. Noise Control Eng J (2011) 59:135–57. doi:10.3397/1.3549200
Frontiers in Public Health | Epidemiology November 2014 | Volume 2 | Article 220 | 6
EXHIBIT A5-9
Page 6 of 8 005222
Crichton et al. The nocebo expectations hypothesis
14. Health Protection Agency. Health Effects of Exposure to Ultrasound and Infra-sound. Report of the Independent Advisory Group on Non-ionising Radia-tion; (2010). Available from https://www.gov.uk/government/uploads/system/uploads/attachment_data/file/335014/RCE-14_for_web_with_security.pdf
15. Evans T, Cooper J, Lenchine V. Infrasound Levels Near Windfarms and in OtherEnvironments. Environmental Protection Authority South Australia (2013).Available from: http://www.epa.sa.gov.au/xstd_files/Noise/Report/infrasound.pdf
16. Turnbull C, Turner J, Walsh D. Measurement and level of infrasound from windfarms and other sources. Acoust Aust (2012) 40:45–50.
17. Page LA, Petrie KJ, Wessely S. Psychosocial responses to environmental inci-dents: a review and proposed typology. J Psychosom Res (2006) 60:413–22.doi:10.1016/j.jpsychores.2005.11.008
18. Bansal R. AP-S turnstile: say au revoir to cell phones. IEEE Antennas Propag Mag(2009) 51:152. doi:10.1109/MAP.2009.5251220
19. Schwartz SP, White PE, Hughes RG. Environmental threats, communities, andhysteria. J Public Health Policy (1985) 6:58–77. doi:10.2307/3342018
20. Lipscomb JA, Satin KP, Neutra RR. Reported symptom prevalence rates fromcomparison populations in community-based environmental studies. Arch Env-iron Health (1992) 47:263–9. doi:10.1080/00039896.1992.9938359
21. Danker-Hopfe H, Dorn H, Bornkessel C, Sauter C. Do mobile phone base sta-tions affect sleep of residents? Results from an experimental double-blind sham-controlled field study. Am J Hum Biol (2010) 22:613–8. doi:10.1002/ajhb.21053
22. Petrie KJ, Broadbent EA, Kley N, Moss-Morris R, Horne R, Rief W. Worries aboutmodernity predict symptom complaints after environmental pesticide spraying.Psychosom Med (2005) 67:778–82. doi:10.1097/01.psy.0000181277.48575.a4
23. Pennebaker JW. Psychological bases of symptom reporting: perceptual and emo-tional aspects of chemical sensitivity. Toxicol Ind Health (1994) 10:497–511.
24. Moss-Morris R, Petrie KP. Link between psychiatric dysfunction and dizziness.Lancet (1999) 353:515–6. doi:10.1016/S0140-6736(98)00348-1
25. Baxter J, Morzaria R, Hirsch R. A case-control study of support/opposition towind turbines: perceptions of health risk, economic benefits, and communityconflict. Energy Policy (2013) 63:931–43. doi:10.1016/j.enpol.2013.06.050
26. Walker C, Baxter J, Ouellette D. Beyond rhetoric to understanding determinantsof wind turbine support and conflict in two Ontario, Canada communities.Environ Plan (2014) 46:730–45. doi:10.1068/a130004p
27. Petrie KJ, Sivertsen B, Hysing M, Broadbent E, Moss-Morris R, Eriksen HR, et al.Thoroughly modern worries: the relationship of worries about modernity toreported symptoms, health and medical care utilization. J Psychosom Res (2001)51:395–401. doi:10.1016/S0022-3999(01)00219-7
28. Petrie KJ, Wessely S. Modern worries, technological change and medicine: newtechnologies mean new health complaints. BMJ (2002) 324:690–1. doi:10.1136/bmj.324.7339.690
29. Chapman S, St George A, Waller K, Cakic V. The pattern of complaints aboutAustralian wind farms does not match the establishment and distribution ofturbines: support for the psychogenic ‘communicated disease’ hypothesis. PLoSOne (2013) 8:e76584. doi:10.1371/journal.pone.0076584
30. Graham JB, Stephenson JR, Smith IJ. Public perceptions of wind energy devel-opments: case studies from New Zealand. Energy Policy (2009) 37:3348–57.doi:10.1016/j.enpol.2008.12.035
31. Sibille A, Cloquell-Ballester V-A, Cloquell-Ballester V-A, Darton R. Develop-ment and validation of a multicriteria indicator for the assessment of objectiveaesthetic impact of wind farms. Renew Sustain Energy Rev (2009) 13:40–66.doi:10.1016/j.rser.2007.05.002
32. Taylor J, Eastwick C, Wilson R, Lawrence C. The influence of negative orientedpersonality traits on the effects of wind turbine noise. Pers Individ Diff (2012)54:338–43. doi:10.1016/j.paid.2012.09.018
33. Put C, van den Bergh O, van Ongeval E, de Peuter S, Demedts M, VerledenG. Negative affectivity and the influence of suggestion on asthma symptoms.J Psychosom Res (2004) 57:249–55. doi:10.1016/S0022-3999(03)00541-5
34. Henningsen P, Priebe S. New environmental illnesses: what are their character-istics? Psychother Psychosom (2003) 72:231–4. doi:10.1159/000071893
35. Hunter RCA, Lohrenz JG. Nosophobia and hypochondriasis in medical students.J Nerv Ment Dis (1964) 139:147–52. doi:10.1097/00005053-196408000-00008
36. Woods SM, Natterson J, Silverman J. Medical students’ disease: hypochondriasisin medical education. J Med Educ (1966) 41:785–90.
37. Petrie KJ, Pennebaker JW. Health-related cognitions. In: Sutton S, Baum A, John-ston M, editors. The Sage Handbook of Health Psychology. London: Sage (2004).p. 127–42.
38. Reif W, Nestoriuc Y, von Lilienfeld-Toal A, Dogan I, Schreiber F, Hofmann SG,et al. Differences in adverse effect reporting in placebo groups in SSRI andtricyclic antidepressant trials: a systematic review and meta-analysis. Drug Saf(2009) 32:1041–56. doi:10.2165/11316580-000000000-00000
39. Lorber W, Mazzoni G, Kirsch I. Illness by suggestion: expectancy, modelling, andgender in the production of psychosomatic symptoms. Ann Behav Med (2007)33:112–6. doi:10.1207/s15324796abm3301_13
40. Pennebaker JW, Skelton JA. Selective monitoring of physical sensations. J PersSoc Psychol (1981) 41:213–23. doi:10.1037/0022-3514.41.2.213
41. Crichton F, Dodd G, Schmid G, Gamble G, Petrie KJ. Can expectations pro-duce symptoms from infrasound associated with wind turbines? Health Psychol(2014) 33:360–410. doi:10.1037/a0031760
42. McAteer A, Elliott AM, Hannaford PC. Ascertaining the size of the symptomiceberg in a UK-wide community-based survey. Br J Gen Pract (2011) 61:e1–11.doi:10.3399/bjgp11X548910
43. Petrie KP, Faasse K, Crichton F, Grey A. How common are symptoms? Resultsfrom a national telephone survey. BMJ Open (2014) 4:e005374. doi:10.1136/bmjopen-2014-005374
44. Shargorodosky J, Curhan GC, Farwell WR. Prevalence and characteristics oftinnitus among US adults. Am J Med (2010) 123:711–8. doi:10.1016/j.amjmed.2010.02.015
45. Hamilton M. A Re-evaluation of the Wind Concerns Ontario HealthSurvey: A Comparison to the General Population. (2014). Availablefrom http://barnardonwind.com/2014/07/28/a-re-evaluation-of-the-wind-concerns-ontario-health-survey/
46. Johansson A, Nordin S, Heiden M, Sandstrom M. Symptoms, personality traits,and stress in people with mobile phone-related symptoms and electromagnetichypersensitivity. J Psychosom Res (2010) 68:37–45.
47. Jansson-Forjmark M, Lindblom K. A bidirectional relationship between anxietyand depression, and insomnia? A prospective study in the general population. JPsychosom Res (2008) 64:443–9. doi:10.1016/j.jpsychores.2007.10.016
48. Winters W, Devriese S, van Diest I, Nemery B, Veulemans H, Eelen P, et al.Media warnings about environmental pollution facilitate the acquisition ofsymptoms in response to chemical substances. Psychosom Med (2003) 56:332–8.doi:10.1097/01.PSY.0000041468.75064.BE
49. Pedersen E, van den Berg F, Bakker R, Bouma J. Response to noise frommodern wind farms in The Netherlands. J Acoust Soc Am (2009) 126:634–43.doi:10.1121/1.3160293
50. Ferrucci LM, Cartmel B, Turkman YE, Murphy ME, Smith T, SteinKD, et al. Causal attribution among cancer survivors of the 10 mostcommon cancers. J Psychosoc Oncol (2011) 29:121–40. doi:10.1080/07347332.2010.548445
51. Chapman S. Symptoms, Diseases and Aberrant Behaviours Attributed to Wind Tur-bine Exposure. (2014). Available from http://ses.library.usyd.edu.au//bitstream/2123/10501/2/Wind_Disease_List.pdf
52. Witthoft M, Rubin GJ. Are media warnings about the adverse effects of modernlife self-fulfilling? An experimental study on idiopathic environmental intoler-ance attributed to electromagnetic fields. J Psychosom Res (2013) 74:206–12.doi:10.1016/j.jpsychores.2012.12.002
53. Deignan B, Harvey E, Hoffman-Goetz L. Fright factors about wind turbines andhealth in Ontario newspapers before and after the green energy act. Health RiskSoc (2013) 15:234–50. doi:10.1080/13698575.2013.776015
54. Johnston I. Wind Turbines Cause Heart Problems, Headaches and Nausea ClaimsDoctors. London: The Telegraph (2009).
55. Western Plains Landscape Guardians. Coming to a House, Farm or School Nearyou? Wind Turbine Syndrome. Victoria: Pyrenees Advocate (2009).
56. St Philip E. Wind Turbines Cause Health Problems, Residents Say [TelevisionBroadcast]. CTV News. Ontario: CTV Television Network (2008).
57. Chapman S. Factoid forensics: have “more than 40”Australian families aban-doned their homes because of wind farm noise? Noise Health (2014) 16:208–12.doi:10.4103/1463-1741.137043
58. Crichton F, Dodd G, Schmid G, Gamble G, Cundy T, Petrie KJ. The power ofpositive and negative expectations to influence reported symptoms and moodduring exposure to wind farm sound. Health Psychol (2013). doi:10.1037/hea0000037
59. Colloca L, Miller FG. Role of expectations in health. Curr Opin Psychiatry (2011)24:149–55. doi:10.1097/YCO.0b013e328343803b
60. Osborn J, Derbyshire SW. Pain sensation evoked by observing injury in others.Pain (2010) 148:268–74. doi:10.1016/j.pain.2009.11.007
www.frontiersin.org November 2014 | Volume 2 | Article 220 | 7
EXHIBIT A5-9
Page 7 of 8 005223
Crichton et al. The nocebo expectations hypothesis
61. Mazzoni G, Foan L, Kirsch I, Hyland ME. The effects of observation and gen-der on psychogenic symptoms. Health Psychol (2010) 29:181–5. doi:10.1037/a0017860
62. Osborne RB, Hatcher JW, Richtsmeier AJ. The role of social modelling in unex-plained paediatric pain. J Pediatr Psychol (1989) 14:43–61. doi:10.1093/jpepsy/14.1.43
63. Wolff NJ, Darlington ASE, Hunfield JAM, Verhulst FC, Jaddoe VWV, HoffmanA, et al. Determinates of somatic complaints in 18-month-old children: the gen-eration R study. J Pediatr Psychol (2010) 35:306–16. doi:10.1093/jpepsy/jsp058
64. Pedersen E, Persson Waye K. Wind turbine noise, annoyance and self-reportedhealth and well-being in different living environments. Occup Environ Med(2007) 64:480–6. doi:10.1136/oem.2006.031039
65. Shepherd D, McBride D, Welch D, Dirks KN, Hill EM. Evaluating the impactof wind turbine noise on health related quality of life. Noise Health (2011)13:333–9. doi:10.4103/1463-1741.85502
66. Owen W, Makara Residents Fuming Over Noisy Wind Farm [Television Broad-cast]. Campbell Live. Auckland, New Zealand: TV3 (2009).
67. Bakker RH, Pedersen E, van den Berg GP, Stewart RE, Lok W, Bouma J. Impactof wind turbine sound on annoyance, self-reported sleep disturbance and psy-chological distress. Sci Total Environ (2012) 425:42–51. doi:10.1016/j.scitotenv.2012.03.005
68. Fields JM. Effect of personal and situational variables on noise annoyance inresidential areas. J Acoust Soc Am (1993) 93:2753–63. doi:10.1121/1.405851
69. Maris E, Stallen PJ, Vermunt R, Steensma H. Evaluating noise in social context:the effect of procedural unfairness on noise annoyance judgments. J Acoust SocAm (2007) 122:3483–94. doi:10.1121/1.2799901
70. Staples SL. Public policy and environmental noise: modeling exposure or under-standing effects. Am J Public Health (1997) 87:2063–7. doi:10.2105/AJPH.87.12.2063
71. Van Renterghem T, Bockstael A, De Weirt V, Bottledooren D. Annoyance, detec-tion and recognition of wind turbine noise. Sci Total Environ (2013) 456:333–45.doi:10.1016/j.scitotenv.2013.03.095
72. Kroesen M, Molin EJ, van Wee B. Testing a theory of aircraft noise annoy-ance: a structural equation analysis. J Acoust Soc Am (2008) 123:4250–60.doi:10.1121/1.2916589
73. Bacon F. The Essays. Stillwell, KS: Digireads.com (2005).74. Maugh TH. The dump that wasn’t there. Science (1982) 215:645. doi:10.1126/
science.215.4533.645
75. Spurgeon A. Models of unexplained symptoms associated with occupationaland environmental exposures. Environ Health Perspect (2002) 110:601–5.doi:10.1289/ehp.02110s4601
76. The telephone as a cause of ear troubles. BMJ (1889) 1499:671–2.77. Rubin GJ, Cleare AJ, Wessely S. Psychological factors associated with self-
reported sensitivity to mobile phones. J Psychosom Res (2008) 64:1–9. doi:10.1016/j.jpsychores.2007.05.006
78. Rubin GJ, Nieto-Hernandez R, Wessely S. Idiopathic environmental intoleranceattributed to electromagnetic fields (formerly “electromagnetic hypersensitiv-ity”): an updated systematic review of provocation studies. Bioelectromagnetics(2010) 31:1–11. doi:10.1002/bem.20536
Conflict of Interest Statement: There are no commercial,financial,or other compet-ing factors, which could be viewed as constituting a conflict of interest influencingthe article’s content. The authors have not received any funding for the article,which is substantially based on the authors’ own epidemiological and experimen-tal research. The authors are independent, academic professionals working in thearea of psychological medicine, public health, and medicine, with a shared expertiseabout psychological factors, which impact on symptom reporting in response to per-ceived environmental risks. To this end, Simon Chapman has previously providedexpert advice on psychogenic aspects of complaints about wind farm to lawyersacting for Infigen. Further, Keith J. Petrie has previously provided expert evidencefor the NZ Environment Court and the Canadian Environment Review Tribunal onpsychological aspects of complaints about wind farm developments.
Received: 22 September 2014; accepted: 19 October 2014; published online: 11November 2014.Citation: Crichton F, Chapman S, Cundy T and Petrie KJ (2014) The link betweenhealth complaints and wind turbines: support for the nocebo expectations hypothesis.Front. Public Health 2:220. doi: 10.3389/fpubh.2014.00220This article was submitted to Epidemiology, a section of the journal Frontiers in PublicHealth.Copyright © 2014 Crichton, Chapman, Cundy and Petrie. This is an open-accessarticle distributed under the terms of the Creative Commons Attribution License (CCBY). The use, distribution or reproduction in other forums is permitted, provided theoriginal author(s) or licensor are credited and that the original publication in thisjournal is cited, in accordance with accepted academic practice. No use, distribution orreproduction is permitted which does not comply with these terms.
Frontiers in Public Health | Epidemiology November 2014 | Volume 2 | Article 220 | 8
EXHIBIT A5-9
Page 8 of 8 005224

Neuron
ReviewEXHIBIT A5-10
New Insights into the Placebo and Nocebo Responses
Paul Enck,1,* Fabrizio Benedetti,2 and Manfred Schedlowski31Department of Internal Medicine VI: Psychosomatic Medicine and Psychotherapy, University Hospital, 72076 Tubingen, Germany2Department of Neuroscience, University of Turin Medical School, and National Institute of Neuroscience, 10125 Turin, Italy3Institute of Medical Psychology and Behavioral Immunobiology, Medical Faculty, University of Duisburg-Essen,47048 Duisburg-Essen, Germany*Correspondence: [email protected] 10.1016/j.neuron.2008.06.030
In modern medicine, the placebo response or placebo effect has often been regarded as a nuisance in basicresearch and particularly in clinical research. The latest scientific evidence has demonstrated, however, thatthe placebo effect and the nocebo effect, the negative effects of placebo, stem from highly active processesin the brain that are mediated by psychological mechanisms such as expectation and conditioning. Theseprocesses have been described in some detail for many diseases and treatments, and we now know thatthey can represent both strength and vulnerability in the course of a disease as well as in the response toa therapy. However, recent research and current knowledge raise several issues that we shall address inthis review. We will discuss current neurobiological models like expectation-induced activation of the brainreward circuitry, Pavlovian conditioning, and anxiety mechanisms of the nocebo response. We will furtherexplore the nature of the placebo responses in clinical trials and address major questions for future researchsuch as the relationship between expectations and conditioning in placebo effects, the existence of a consis-tent brain network for all placebo effects, the role of gender in placebo effects, and the impact of getting drug-like effects without drugs.
IntroductionRecent experimental work clearly demonstrates that a better un-
derstanding of the neurobiology and psychology of the placebo
and nocebo responses is of great importance, as it might have
profound implications for basic and clinical research and clinical
practice. In basic research, we can learn more about how psy-
chological processes affect CNS neurochemistry and how these
alterations subsequently shape peripheral physiology and end
organ functioning. The growing knowledge on the neurobiology
of the placebo/nocebo response will also affect the design of
clinical trials in which treatment is tested against a placebo. Fi-
nally, it might affect our health care system not only by initiating
a discussion on the ethical dimension of placebo treatment but
also by forcing us to reconsider the significance of the placebo
in clinical training and practice.
The dynamic progress in this field is not only reflected in the
constantly growing number of publications explicitly focusing
on the neurobiology and psychology of the placebo response,
but also in the structure and content of scientific meetings on
this topic. A 1999 symposium on the Mechanisms of Placebo
covered this research area with two presentations on ‘‘expecta-
tion/conditioning mechanisms’’ and ‘‘opioid mechanisms’’ (9th
World Congress on Pain, Vienna). In 2000, a NIH-sponsored
workshop assembled ten presenters (and more than 500 atten-
dants and discussants), mainly from the US, to cover the field
and to assess the state of the art (Guess et al., 2002). A more re-
cent symposium on the Mechanisms of Placebo/Nocebo Re-
sponse held in Tutzing, Germany, in 2007 and supported by
the Volkswagen Foundation, one of the major German research
funding agencies, brought together 45 speakers and experts
from eight countries with topics like ‘‘general concepts,’’ ‘‘learn-
ing and memory,’’ ‘‘brain-immune interaction,’’ ‘‘Parkinson’s
disease and reward mechanisms,’’ ‘‘pain,’’ and ‘‘clinical-ethical
implications,’’ which reflect the steady growth of knowledge in
this research field.
This review summarizes (1) current neurobiological models of
the placebo response: expectations and reward, Pavlovian con-
ditioning, and anxiety mechanisms of the nocebo response; (2)
implications of insights into the placebo mechanisms for clinical
trials and testing; and (3) the main research questions currently
being discussed.
Comprehensive reviews focusing on the psychological (Price
et al., 2008; Klosterhalfen and Enck, 2006), neuropharmacolog-
ical/neuroanatomical (Colloca and Benedetti, 2005; Benedetti
et al., 1995; Pacheco-Lopez et al., 2006; Benedetti, 2008) and
methodological aspects of the placebo response (Colloca et al.,
2008; Klosterhalfen and Enck, 2008) have been recently pub-
lished elsewhere.
Current Models of the Placebo ResponseA major insight from the recent publications on placebo is that
there seems not to be a single neurobiological or psychobiolog-
ical mechanism which is able to explain placebo and nocebo
phenomena in general. Instead, we have learned that different
mechanisms exist by which placebo or nocebo responses are
steered across diseases and experimental conditions.
Expectation and the Brain Reward Circuitry
It has been proposed that the placebo effect is mediated by the
brain reward circuitry (de la Fuente-Fernandez et al., 2001; de la
Fuente-Fernandez and Stoessl, 2002). Based on placebo stud-
ies with Parkinson’s patients (de la Fuente-Fernandez et al.,
2004) and in experimental pain (Scott et al., 2007), it has been
Neuron 59, July 31, 2008 ª2008 Elsevier Inc. 195Page 1 of 12 005225

Neuron
ReviewEXHIBIT A5-10
hypothesized that reward expectations, such as expectation of
clinical improvement, are likely to play an important role in the
placebo effect. Thus, expectation may be closely tied to a tonic
activation of tegmental or prefrontal dopaminergic neurons,
which project to the dorsal and ventral striatum. In the expecta-
tion phase, prior to reward, there is uncertainty, and this is
reflected in sustained dopaminergic activation, which is maxi-
mized when the probability of reward is 0.5. It is known that
with a 0.5 probability of reward, 29% of dopaminergic cells are
tonically activated (Fiorillo et al., 2003). Conversely, both occur-
rence and nonoccurrence lead to virtually no tonic activation.
There is also phasic dopaminergic activation which takes place
after reward, and this is stronger when the reward has come
as a surprise. Therefore, uncertainty appears to heighten reward
mechanisms in this brain reward circuitry model.
Based on this information, the following neurobiological pla-
cebo mechanism has been proposed (de la Fuente-Fernandez,
2004; de la Fuente-Fernandez et al., 2004). When an interaction
(e.g., positive verbal suggestion) creates the possibility of a re-
ward, which in the case of placebo administration is represented
by the therapeutic benefit, certain cortical neurons become
active in relation to reward probability. These cells send direct
excitatory glutamatergic inputs to dopaminergic cell bodies
along with indirect inhibitory gamma amino butyric acid inputs
(de la Fuente-Fernandez et al., 2002a; Fricchione and Stefano,
2005). The combination of these signals arriving at the dopami-
nergic neurons via direct and indirect pathways contributes to
the probability of tonic activation (de la Fuente-Fernandez
et al., 2002b). Furthermore, it has been reported that neurons
in the prefrontal cortex, nucleus accumbens, and the caudate-
putamen display tonic activation during expectation of reward
(Schultz, 1998).
Compelling evidence of the involvement of reward mecha-
nisms in the placebo effect comes from recent brain imaging
studies on placebo analgesia. In fact, in a brain imaging study
in which both positron emission tomography and functional
magnetic resonance imaging were used, Scott et al. (2007)
tested the correlation between the responsiveness to placebo
and that to monetary reward. By using a model of experimental
pain in healthy subjects, they found that placebo responsiveness
was related to the activation of dopamine in the nucleus accum-
bens, as assessed by using in vivo receptor-binding positron
emission tomography with raclopride, a D2-D3 dopamine
receptor agonist. The very same subjects were then tested
with functional magnetic resonance imaging for activation in
the nucleus accumbens to monetary rewards. What these inves-
tigators found is a correlation between the placebo responses
and the monetary responses: the larger the nucleus accumbens
responses to monetary reward, the stronger the nucleus
accumbens responses to placebos.
This study strongly suggests that placebo responsiveness de-
pends on the functioning and efficiency of the reward system,
and this would explain, at least in part, why some individuals
respond to placebos whereas some others do not. Those who
have a more efficient dopaminergic reward system would also
be good placebo responders. Interestingly, Scott et al. (2007)
used an experimental approach that is typical of clinical trials,
whereby the subjects know they have a 50% chance to receive
196 Neuron 59, July 31, 2008 ª2008 Elsevier Inc.
either placebo or active treatment, and whereby no prior condi-
tioning was performed.
In a different study by the same group, Scott et al. (2008) stud-
ied the endogenous opioid and the dopaminergic systems in
different brain regions, including those involved in reward and
motivational behavior. Subjects underwent a pain challenge, in
the absence and presence of a placebo with expected analgesic
properties. By using positron emission tomography with 11C-
labeled raclopride for the analysis of dopamine and 11C-carfen-
tanil for the study of opioids, it was found that placebo induced
activation of opioid neurotransmission in the anterior cingulate,
orbitofrontal and insular cortices, nucleus accumbens, amyg-
dala, and periaqueductal gray matter. Dopaminergic activation
was observed in the ventral basal ganglia, including the nucleus
accumbens. Both dopaminergic and opioid activity were associ-
ated with both anticipation and perceived effectiveness of the
placebo. Large placebo responses were associated with greater
dopamine and opioid activity in the nucleus accumbens. There-
fore, as shown in the schema of the reward circuitry in Figure 1,
both dopamine and endogenous opioids have been found to be
activated in the nucleus accumbens after placebo administra-
tion, which indicates that these two neurotransmitters play a
key role in the modulation of the placebo response.
Pavlovian Conditioning of Placebo Effects:
Neuroimmune Responses
The behavioral conditioning of immune responses is based on
the intense crosstalk between the CNS and the peripheral im-
mune system (Meisel et al., 2005; Sternberg, 2006; Tracey,
2007). Commonly, in these approaches, experimental animals
are presented with a novel taste (e.g., saccharin) as conditioned
stimulus (CS) in the drinking water, and subsequently injected
with an agent that produces changes in immune status
Figure 1. Simplified Scheme of the Reward SystemPlacebo administration has been found to activate both dopamine and endog-enous opioid peptides in the nucleus accumbens, thus suggesting an involve-ment of reward mechanisms in some types of placebo effects (de la FuenteFernandez et al., 2001; Scott et al., 2008). Note: the main propose of thissketch is to focus on neural substrates of the reward system in the contextof the placebo response which, in this case, takes precedence over anatom-ical accuracy.
Orbitofrontal cortex Dorsolateral prefrontal cortex
Opioid Peptides
Ventral tegmental area
Amygdala Dopamine
Page 2 of 12 005226

Neuron
ReviewEXHIBIT A5-10
(unconditioned stimulus, UCS). When the CS (saccharin solution)
is re-presented at a subsequent time point, the animals avoid
drinking the saccharin, which is termed ‘‘conditioned taste aver-
sion’’ (CTA) (Garcia et al., 1955). Concomitantly, the animals
demonstrate a modification of immune parameters that com-
monly mimics the actual UCS effect (Ader, 2003). Ader and
Cohen (1975) demonstrated conditioned suppression of anti-
body production for the first time. Experimental evidence over
the last 25 years has shown behaviorally conditioned effects in
rodents, both in humoral and cellular immunity, with behavioral
conditioning able to re-enlist changes in lymphocyte circulation
and proliferation, cytokine production, natural killer (NK) cell ac-
tivity, and endotoxin tolerance (reviewed in Exton et al., 2001;
Ader, 2003; Pacheco-Lopez et al., 2006; Riether et al., 2008).
Regarding the neurobiological mechanisms, it was demon-
strated by employing the immunosuppressant cyclophoshamide
as a UCS that the insular cortex and the amygdala are key struc-
tures in behaviorally conditioned suppression of antibody pro-
duction (Ramırez-Amaya et al., 1996, 1998). In parallel, when
the calcineurin inhibitor and immunosuppressive agent cyclo-
sporine A was employed as a UCS in a taste aversion paradigm,
the behaviorally conditioned suppressive effect on lymphocyte
activity in the spleen, as well as cytokine production (interleu-
kin-2, interferon-g), was affected by brain excitotoxic lesions.
This shows that the insular cortex is essential to acquiring and
evoking this conditioned response in cellular immune functions.
In contrast, the amygdala seems to mediate the input of visceral
information necessary at acquisition time, whereas the ventro-
medial hypothalamic nucleus appears to participate in the output
pathway to the immune system, which is needed to evoke the
behaviorally conditioned immune response (Pacheco-Lopez
et al., 2005). On the peripheral efferent arm, these conditioned
effects are mediated via the splenic nerve through noradrenaline
and adrenoceptor-dependent mechanisms (Exton et al., 2001,
2002). The neural circuitry is illustrated in Figure 2.
A number of studies have meanwhile demonstrated the clinical
relevance of conditioned changes in immune function. Specifi-
cally, the morbidity and mortality of animals with autoimmune
disease was abated via conditioning using cyclophosphamide
(Ader and Cohen, 1982) or with cyclosporine (Klosterhalfen and
Klosterhalfen, 1990) as the UCS and, in addition, behavioral
conditioning prolonged the survival of heterotopic heart allograft
and significantly inhibited the contact hypersensitivity reaction
(Exton et al., 1998, 1999, 2000).
Experimental evidence also suggests that behavioral condi-
tioning of immunopharmacological drug effects is possible in
humans. Conditioned cyclosphosphamide-induced leucopenia
has been reported (Giang et al., 1996), along with a conditioned
immune response to the cytokine interferon-g (Longo et al.,
1999), as well as conditioned suppression of the ex vivo produc-
tion and mRNA expression of interleukin-2 and interferon-g, and
of the proliferation of peripheral lymphocytes (Goebel et al.,
2002). Allergic reactions have been shown to be affected by be-
havioral conditioning and emotional status (Kemeny et al., 2007).
However, more recently, it was demonstrated that the antihista-
minergic properties of the H1-receptor antagonist desloratadine
can be behaviorally conditioned in patients suffering from aller-
gic house-dust-mite rhinitis, as analyzed by subjective symptom
score, skin prick test, and decreased basophile activation (Goe-
bel et al., 2008). Interestingly, subjective symptom score and
skin reactivity, but not basophile activation, was reduced in
patients who where conditioned but not re-exposed to the
novel-tasting drink served as a CS. By contrast, only conditioned
patients who were re-exposed to the CS also demonstrated sig-
nificant inhibition in cellular immune activation. These data sup-
port earlier observations indicating that conscious physiological
pain and motor mechanisms are mainly affected by patients’
conscious expectations, whereas unconscious physiological
processes, such as hormone release or immune functions,
appear to be mediated by behavioral conditioning (Benedetti
et al., 2003).
Similar conditioning mechanisms have been found in the en-
docrine system. In one study aimed at differentiating the effects
of conditioning and expectation, plasma levels of both growth
hormone and cortisol were measured in different conditions
(Benedetti et al., 2003). In the first experimental condition, verbal
suggestions of growth hormone increase and cortisol decrease
were delivered to healthy volunteers, so as to make them expect
hormonal changes. These verbal instructions did not have any
effect on both hormones, and in fact no plasma concentration
Figure 2. Neural Substrates Involved in Behaviorally ConditionedImmunosuppression in RatsBrain excitotoxic lesions show that the insular cortex is essential to acquiringand evoking this conditioned immunosuppressive response. In contrast, theamygdala seems to mediate the input of visceral information necessary at ac-quisition time, whereas the ventromedial hypothalamic nucleus appears toparticipate in the output pathway to the immune system needed to evokethe behaviorally conditioned immune response (CS, conditioned stimulus,saccharin taste; UCS, unconditioned stimulus; CsA, cyclosporine A; BBB,blood-brain barrier; CVOs, circumventricular organs; VMH, ventromedialhypothalamic nucleus) (Pacheco-Lopez et al., 2005).
Acquisition
Evocation
' • • • • Neocortical-lmmune axis CR ression) (Immune Supp
Neuron 59, July 31, 2008 ª2008 Elsevier Inc. 197Page 3 of 12 005227

Neuron
ReviewEXHIBIT A5-10
change was detected. In the second experimental condition,
sumatriptan, a serotonin 5-HT1B/1D receptor agonist that stimu-
lates growth hormone and inhibits cortisol secretion, was admin-
istered for 2 days in a row and then replaced with a placebo on
the third day. A significant increase of growth hormone and
decrease of cortisol plasma concentrations were found after
placebo administration. These conditioned effects occurred
regardless of the verbal suggestions the subjects received. In
other words, the placebo mimicked the sumatriptan-induced
growth hormone increase, even though the subjects expected
a growth hormone decrease. Likewise, the placebo mimicked
the sumatriptan-induced cortisol decrease, even though the
subjects expected a cortisol increase. It can be assumed that
in this case the conditioned stimulus was represented by the
act of injecting the pharmacological agent (i.e., the context
around the treatment).
This experimental evidence demonstrates the potential appli-
cability of such behavioral conditioning protocols in clinical prac-
tice. However, in future studies it will be necessary to analyze the
kinetics of the behaviorally conditioned immunopharmacological
and endocrine response and to elucidate whether and to what
extent these conditioned responses can be reconditioned on
multiple occasions. Only with this information and more detailed
knowledge of the mechanisms behind the CNS-immune system
and CNS-endocrine system interaction will it be possible to
design conditioning protocols which can be employed in clinical
situations to the patients’ advantage.
Mechanisms of the Nocebo Effect
Compared to the placebo effect, much less is known about the
nocebo effect, since the induction of a nocebo response repre-
sents a stressful and anxiogenic procedure, thus limiting its
ethical investigation. The term nocebo (‘‘I shall harm’’) was intro-
duced in contraposition to the term placebo (‘‘I shall please’’)
by a number authors in order to distinguish the pleasing from
the noxious effects of placebo (Kennedy, 1961; Kissel and Bar-
rucand, 1964; Hahn, 1985, 1997). If the positive psychosocial
context, which is typical of the placebo effect, is reversed, the
nocebo effect can be studied. Therefore, it is important to stress
that the study of the nocebo effect relates to the negative psy-
chosocial context surrounding the treatment, and its neurobio-
logical investigation is the analysis of the effects of this negative
context on the patient’s brain and body. As for the placebo
effect, the nocebo effect follows the administration of an inert
substance, along with the suggestion that the subject will get
worse. However, the term nocebo-related effect can also be
used whenever symptom worsening follows negative expecta-
tions without the administration of any inert substance (Benedetti
et al., 2007b; Benedetti, 2008).
Brain imaging techniques have been crucial to understanding
the neurobiology of negative expectations, and most of this
research has been performed in the field of pain. Overall, nega-
tive expectations may result in the amplification of pain (Koyama
et al., 1998; Price, 2000; Dannecker et al., 2003) and several
brain regions, like the anterior cingulate cortex (ACC), the pre-
frontal cortex (PFC), and the insula, have been found to be
activated during the anticipation of pain (Chua et al., 1999; Hsieh
et al., 1999; Ploghaus et al., 1999; Porro et al., 2002, 2003;
Koyama et al., 2005; Lorenz et al., 2005; Keltner et al., 2006).
198 Neuron 59, July 31, 2008 ª2008 Elsevier Inc.
For example, Sawamoto et al. (2000) found that expectation of
a painful stimulus amplified the perceived unpleasantness of in-
nocuous thermal stimulation, and that these subjective hyperal-
gesic reports were accompanied by increased brain activations
in the anterior cingulate cortex (ACC), the parietal operculum
(PO), and posterior insula (PI). In another study by Koyama
et al. (2005), as the magnitude of expected pain grew, activation
increased in the thalamus, insula, PFC, and ACC. By contrast,
expectations of decreased pain reduced activation of pain-re-
lated brain regions, like the primary somatosensory cortex, the
insular cortex, and ACC. Likewise, Keltner et al. (2006) found
that the level of expected pain intensity altered the perceived
intensity of pain along with the activation of different brain
regions, like the ipsilateral caudal ACC, the head of the
caudate, the cerebellum, and the contralateral nucleus cuneifor-
mis (nCF).
Besides neuroimaging, pharmacological studies give us in-
sights into the biochemistry of the nocebo effect and of negative
expectations. For example, the antagonist action of CCK on
endogenous opioids (Benedetti, 1997) is particularly interesting
in the light of the opposing effects of placebos and nocebos. A
model has recently been proposed whereby the opioidergic
and the CCK-ergic systems may be activated by opposite
expectations of either analgesia or hyperalgesia, respectively.
In other words, verbal suggestions of a positive outcome (pain
decrease) activate endogenous m-opioid neurotransmission,
while suggestions of a negative outcome (pain increase) activate
CCK-A and/or CCK-B receptors. This neurochemical view of the
placebo-nocebo phenomenon, in which two opposite systems
are activated by opposite expectations about pain, is in keeping
with the opposite action of opioids and CCK in other studies
(Benedetti et al., 2007a). Interestingly, the CCK-antagonist
proglumide has been found to potentiate placebo-induced
analgesia, an effect that is probably due to the blockade of the
anti-opioid action of CCK (Benedetti et al., 1995; Benedetti,
1996). Therefore, CCK appears to play a pivotal role in the psy-
chological modulation of pain, antagonizing placebo-induced
opioid release on the one hand and mediating nocebo-induced
facilitation of pain on the other hand.
The involvement of CCK in nocebo hyperalgesia is likely to be
mediated by anxiety, as benzodiazepines have been found to
block both nocebo-induced hyperalgesia and the typical
anxiety-induced hypothalamus-pituitary-adrenal hyperactivity.
Conversely, the CCK antagonist, proglumide, has been found
to prevent nocebo hyperalgesia but not the hypothalamus-
pituitary-adrenal hyperactivity, which suggests two independent
biochemical pathways activated by nocebo suggestions and
anxiety (Figure 3).
More recent studies have found that nocebo effects are also
associated to a decrease in dopamine and opioid activity in
the nucleus accumbens, thus underscoring the role of the reward
and motivational circuits in nocebo effects as well (Scott et al.,
2008). In other words, the activation/deactivation balance of
both dopamine and opioids in the nucleus accumbens would
account for the modulation of placebo and nocebo responses.
Therefore, a complex interaction among different neurotransmit-
ters, such as CCK, dopamine, and opioids, occurs when either
placebos or nocebos are administered.
Page 4 of 12 005228

Neuron
ReviewEXHIBIT A5-10
Placebo Responses in Clinical TrialsEver since the dawn of the first randomized placebo-controlled
trials testing new drugs and treatments in the middle of the last
century, and even before (Hill, 1990), placebo responses in clin-
ical trials have given rise to discussion and concern regarding
their mechanisms and have usually been regarded as a nuisance
or a barrier to a rational approach in modern drug development.
High placebo responses have induced false expectations re-
garding drug efficacy and resulted in the refusal of drug approval
in some cases, e.g., neurokinins in the treatment of depression
(Kramer et al., 1998; Enserink, 1999).
Not only do placebo responses in clinical trials impose signif-
icant limits to the testing of new compounds, but they are also
linked to the drug adherence and compliance of patients in
such trials in a paradoxical way. Patients that adhered to medi-
cation instructions by more than 80% showed better survival in
a coronary disease study (Coronary Drug Project Research
Group, 1980), and poor drug adherence in a myocardial infarc-
tion survivor study was associated with a higher risk of mortality
(Beta-Blocker Heart Attack Trial, Horwitz et al., 1990), irrespec-
tive of whether the active compound or a placebo was taken,
and regardless of other potential risk factors. This has been
attributed to the greater expectancies or beliefs, both in drug
and placebo responders that the medication may be of help, al-
though other factors, such as health behaviors, cannot be ruled
Figure 3. Mechanisms of the Hyperalgesic Nocebo EffectNocebo suggestions induce anticipatory anxiety, which activates two inde-pendent pathways, the hypothalamus-pituitary-adrenal (HPA) axis on theone hand and a CCK-ergic pronociceptive system on the other hand. Benzo-diazepines act on anxiety, thus blocking both the HPA hyperactivity and theCCK pronociceptive system. In contrast, CCK antagonists act on the pronoci-ceptive system only, thus preventing nocebo hyperalgesia but not HPA-hyper-activity (Benedetti et al., 2006). Note: the main propose of this sketch is tofocus on neural substrates of the hyperalgesic nocebo effect which, in thiscase, takes precedence over anatomical accuracy.
CCK-antagonisfs
\ccK I\
-A-B-ccK.receptors
Nocebo suggestions
! ANTICIPATORY
ANXIETY
Hypothalamus
+ PRO-NOCICEPTIVE
SYSTEM Pituitary gland
ACTH
"
• Adrenal glands Cortisol
- Benzodiazepines
out completely. These findings have certainly fostered the devel-
opment of further experimental approaches to the placebo
phenomenon.
Attempts to unravel the mechanisms of the placebo response
in clinical trials have used meta-analytic approaches of the
placebo arm of trials—with mixed results. The placebo effect in
randomized controlled trials has been reported to be around
40% in functional disorders (Enck and Klosterhalfen, 2005) but
lower in depression (29%), bipolar mania (31%) (Sysko and
Walsh, 2007), and migraine (21%) (Macedo et al., 2008). The rea-
sons for these variable placebo response rates are unknown but
may include the sample size (Enck and Klosterhalfen, 2005), the
year of study (Walsh et al., 2002), design characteristics (Macedo
et al., 2006), and recruitment pattern (Kobak et al., 2007). Meta-
analyses can come to opposite conclusions on the same data
set, e.g., with respect to the direction of the effects of the number
of study visits on the placebo effect size (e.g., Pitz et al., 2005;
Patel et al., 2005), but this may be due to data extraction errors
that lead to false findings and conclusions (Gøtzsche et al.,
2007). Hrobjartsson and Gøtzsche (2001, 2004) came to con-
clude that the placebo response appears to be powerful only be-
cause of a lack of ‘‘no treatment’’ control groups in most studies.
However, their argument has been challenged by data indicating
that among the trials they included into their meta-analyses,
those with endpoints regulated directly by the autonomic
nervous system do report stronger response to placebo treat-
ment, while endocrine and other endpoints are less responsive
(Meissner et al., 2007).
Other contributing factors to the placebo response rate in clin-
ical trials were: the origin of patients—response rates in migraine
prophylaxis were higher in Europeans than in North Americans
(Macedo et al., 2008), personal expectations (Linde et al., 2007)
and the loss thereof, e.g., in Alzheimer’s disease (Benedetti
et al., 2006), the study center (Ondo, 2007), and patient recruit-
ment and physician training (Kobak et al., 2007). A genetic contri-
bution to placebo responsiveness has been proposed (Bendesky
and Sonabend, 2005; Raz, 2008) but empirical evidence is still
lacking.
Because of the difficulties to reliably identify placebo re-
sponders and predicting placebo response rates in clinical trials,
different methodological attempts have been made to the way
(novel) drugs are tested against placebo.
The most traditional way to attempt to control for placebo
response in clinical trials was the use of a crossover design, in
which an individual patient serves as her/his own control, reduc-
ing the between-subject variability and the number of patients
studied. This model was almost completely abolished due to
the fact that blinding may be rather difficult in such studies (Bou-
tron et al., 2006), unless one is able to implement ‘‘active place-
bos’’ that mimic the side-effects of a compound without inducing
its main effects (Edward et al., 2005). Another conventional
model to control for placebo effects is the use a placebo run-in
phase prior to drug and placebo dispensing to identify and
exclude placebo responders: placebo responders tend to exhibit
less severe symptoms during run-in (Evans et al., 2004) and to
respond faster to treatment with symptom improvement (Go-
meni and Merlo-Pich, 2007) than patients in the drug arm.
Drug-free run-in periods have also been used to identify
Neuron 59, July 31, 2008 ª2008 Elsevier Inc. 199Page 5 of 12 005229

Neuron
ReviewEXHIBIT A5-10
individual and group characteristics of placebo responders.
However, these results are not generalizable across medical
conditions, (Talleyn et al., 2006) since most of the variables
that are regularly documented at study initiation are related to
symptoms and disease characteristics rather than to individual
personality traits or states (Hyland et al., 2007). An extension of
placebo run-in periods are studies with multiple drug/placebo
phases that alternate, with or without washout periods in be-
tween (Kleveland et al., 1985). These models were more recently
requested again by drug approval authorities to account for vari-
able symptom courses and the alternation of symptom-free with
relapse periods in many chronic diseases. It has, however, been
shown that the placebo response in a first medication period
does not reliably predict the response (to drug or placebo) in
a second phase (Tack et al., 2005). If being a placebo responder
is a characteristic of an individual patient, study designs should
take this into account by employing a design with multiple (>2)
crossovers between placebo and drug and to randomize and
individualize in a ‘‘single-subject trials’’ (SST) the timing for run-in
and run-out for each phase (Madsen and Bytzer, 2002). In theory,
this should allow us to reliably distinguish placebo responders
from nonresponders. However, multiple crossovers with ran-
domly assigned treatment periods, with a complete random
order or a random starting day generate specific methodological
problems and need new statistical models before being applica-
ble in clinical drug testing.
In experimental laboratory research, a number of experimental
designs have been employed that may help to identify predictors
of the placebo response in the future. The so-called ‘‘balanced
placebo design’’ (BPD) was traditionally used in the testing for
placebo effects of frequently consumed everyday drugs such
as caffeine, nicotine, and alcohol (e.g., Dagan and Doljansky,
2006; Kelemen and Kaighobadi, 2007; Cole-Harding and
Michels, 2007). While one-half of the study sample receives pla-
cebo and the other half the drug, half of each group is receiving
correct information while the other half is receiving false informa-
tion on the nature of their study condition (drug or placebo)
immediately prior to drug testing, thus allowing to differentiate
between the ‘‘true’’ drug effect (those receiving the drug but
are told they received placebo) and the true placebo effect (those
receiving placebo but are told they received the drug). As is
evident, the BPD implies ‘‘deception’’ of the subjects (Miller
et al., 2005), which limits its suitability and acceptance outside
the laboratory and in patients for ethical reasons (Ehni and
Wiesing, 2008).
Hidden treatment (HT) or covert treatment is another option
that may be specifically useful for the test of drug effects in acute
and highly symptomatic conditions such as with postoperative
pain (Levine et al., 1981), anxiety, and motor dysfunction in Par-
kinson’s disease (Benedetti et al., 2004b; Lanotte et al., 2005). It
resembles some of the features of the SSTs (Madsen and Bytzer,
2002). In case of HT, the patient may receive a drug unnoticed in
terms of timing and dosage, and the drug effect (or its missing
action) can be determined independent of the patient’s expecta-
tions. Benedetti and colleagues demonstrated that under these
circumstances drugs commonly believed to have analgesic
properties such as CCK-antagonists failed to show any antinoci-
ceptive effects (Colloca et al., 2004). Evidently, HT can only be
200 Neuron 59, July 31, 2008 ª2008 Elsevier Inc.
applied with the patient agreeing prior to the test that she/he
may or may not receive a drug at all, which may raise other eth-
ical concerns (Machado, 2005), especially with the test of novel
compounds of unknown properties.
Finally, a free-choice paradigm (FCP), which maybe regarded
as a modification of the adaptive response design (Rosenberger
and Lachin, 1993) or the early-escape design (Vray et al., 2004)
may offer an alternative approach to common drug test proce-
dures. FCP allows the patient to choose between two pills, of
which one is the drug and one the placebo, at medication-dis-
pensing time; it is, however, essential that the patient does not
take both pills at the same time (hence, a technical or administra-
tive modus has to be implemented to prevent this and to prevent
over-dosage etc.), and that he/she may switch to the other con-
dition at any time (hence, the pharmacodynamics of the com-
pound under investigation have to be appropriate, e.g., the
speed of action, the feasibility of on-demand medication, etc.).
It would, on the other hand, allow assessment of drug efficacy
via the choice behavior rather than with symptomatic endpoints.
The FCP has been used occasionally in optimizing dosage of
drugs (Perkins et al., 1997; Pinsger et al., 2006) in clinical trials.
It bypasses many of the ethical concerns against the use of
placebos (Ehni and Wiesing, 2008), but its methodology and
statistics in assessing drug superiority over placebo have not
been validated (Zhang and Rosenberger, 2006).
Research Questions for Future ResearchThe experimental work on the neurobiological and neuropsycho-
logical mechanisms of the placebo/nocebo response from the
last decade has impressively increased our knowledge of this
long-known phenomenon. It became clear that these ap-
proaches will not only help us to better understand human phys-
iology but might have many practical consequences such as on
the design of clinical studies, our health care systems, in partic-
ular the doctor-patient relationship as well as the education of
medical care professionals. However, there are still numerous
open questions which urgently need to be addressed in future
studies.
The Relationship between Suggested
and Conditioned Placebo Effects
It has been postulated that the placebo response is generated by
two distinct mechanisms across clinical conditions, one of which
concerns suggestion and expectation, and one learning via Pav-
lovian conditioning (Benedetti et al., 2003; Klosterhalfen and
Enck, 2006). The relationship between these two is still unclear,
but it has been the subject of experimental research in recent
years. Benedetti et al. (2003) were able to demonstrate in exper-
imental pain and in Parkinson’s disease that conditioning is
actually mediated by expectations and that expectations do not
affect conditioned responses. Similar explanations have been
put forward, for example, that expectancies acquired through
verbal instructions might also be seen as conditioning stimuli
that reactivate earlier stimulus association (Klinger et al., 2007).
In a set of experiments, it has recently been demonstrated that
prior experience is able to shape placebo analgesia (Colloca and
Benedetti, 2006). Subjects that were conditioned to experience
placebo analgesia in an acute paradigm showed reduced pain
experiences for up to seven days and exhibited no extinction
Page 6 of 12 005230

Neuron
ReviewEXHIBIT A5-10
of responses in the range of minutes. However, placebo analge-
sia was reduced by prior exposure to negative painful experi-
ence. These data emphasize that previous experience with the
treatment of pain, both successful and unsuccessful, will have
lasting effects on how the second and subsequent treatments
of the same conditions are perceived. The analogy to clinical
conditions is evident, but relative. While experimental pain is
phasic and acute, clinical pain is usually chronic, long-lasting.
Whether and to what degree previous pain treatment contributes
to the experience of placebo analgesia in a clinical trial—usually
15%–20% of the effect size achieved under experimental pain
conditions (Vase et al., 2002)—probably needs to be tested
with a different experimental or clinical design. When experimen-
tal placebo analgesia was directly compared to pain relief in pain
patients, the data suggested that mechanisms counteracting
the proanalgesic effects of placebo suggestions are involved
(Charron et al., 2006).
It is puzzling to realize that, beyond the laws of Pavlovian learn-
ing studied for almost a century now, there is basically no model
available that allows us to predict the maintenance of a strong
placebo response in a clinical trial that may last for a year or
longer (e.g., Chey et al., 2004). According to these laws (Zim-
mer-Hart and Rescorla, 1974), any conditioned response should
diminish over time if no further pairing of the UCS (e.g., an effec-
tive drug) and the CS (a pill or injection) occurs but the CS is
presented alone. In such trials, extinction does not seem to
occur at all. Hence, one may speculate that if conditioning (learn-
ing) is part of this placebo response, it cannot be of a Pavlovian
nature. Alternatively, in the case of newly developed compound,
previous experience with a drug, or a similar compound, that
might shape the response can have been gained only by
generalization.
The other issue that requires attention is the clinical applicabil-
ity of conditioned and suggested placebo responses in daily
medicine, as many of the studies have so far been conducted
in the laboratory and with healthy subjects. One example of
a successful transfer from bench to bedside, however, has
been documented by studies demonstrating behaviorally condi-
tioned effects in peripheral immune responses (see above).
Is There a Consistent Brain Network
for All Placebo Effects?
The number of brain imaging studies on the placebo response
has increased greatly over the past few years, in particular in
the area of pain and placebo analgesia (Petrovic et al., 2002; Wa-
ger et al., 2004; Bingel et al., 2006; Kong et al., 2006; Price et al.,
2006), but also to a lesser degree with regard to neurological and
psychiatric diseases, such as Parkinson’s disease, depression,
or irritable bowel disorder (reviewed, e.g., by Benedetti et al.,
1995; Colloca and Benedetti, 2005; Beauregard, 2007; Lidstone
and Stoessl, 2007, Enck and Klosterhalfen, 2005).
As to experimental pain, different cortical (prefrontal cortex,
anterior cingulate gyrus, insula, supplementary motor area),
and subcortical structures (amygdala, periacqueductal gray,
thalamus) have been found to be involved in the placebo
response, and they seem to differentiate between the sensory
and the emotional/affective components of pain signals. PET
receptor-binding studies have provided direct evidence that
the m-opioid system involving the brain stem and elaborated cor-
tical networks mediates placebo analgesia (Zubieta et al., 2005;
Wager et al., 2007), thus confirming previous studies on the
blockade of placebo analgesia by the opioid antagonist nalox-
one (Levine et al., 1978; Amanzio and Benedetti, 1999). It should
be noted that other neurochemical systems have been found to
contribute to the placebo effect, e.g., the dopaminergic system
(Scott et al., 2007, 2008) and CCK (Benedetti et al., 1995; Bene-
detti, 1996). It remains unclear, however, whether each of these
systems contributes to all placebo responses or only to those
under specific clinical and experimental conditions. Placebo
responses in Parkinson’s disease and pain have been linked to
a subcortical dopaminergic ‘‘reward’’ in the ventral striatum (de
la Fuente-Fernandez et al., 2001; Scott et al., 2007); however,
the involvement of dopamine was recently questioned with re-
gard to the placebo response in experimental pain (Martikainen
et al., 2005). Nevertheless, it is worth mentioning that a possible
downstream effect of dopamine activation after placebo admin-
istration was found in the subthalamic nucleus, in which single
neurons changed their firing pattern (Benedetti et al., 2004a).
It is one of the drawbacks of imaging studies that they rely on
a stable and dominant activation pattern across all subjects,
since group means are necessary for adequate data analysis.
Therefore, placebo nonresponders in small samples of subjects
are frequently excluded or used as a type of control (Petrovic
et al., 2002; Leuchter et al., 2002; Nemoto et al., 2007). Assess-
ment of individual responsiveness to placebo (Chung et al.,
2007) is, however, necessary to advance the field.
Other neurophysiological and psychobiological mechanisms
of placebo analgesia and placebo response are currently being
discussed. Placebo analgesia following heat pain application
may change spinal cord pain processing via descending path-
ways (Matre et al., 2006), and expectations have been found to
alter spinal reflexes and the descending noxious inhibitory con-
trol (Goffaux et al., 2007). This raises an important issue that
needs to be addressed in future research: While for expecta-
tion-induced placebo responses, higher centers of the CNS
are needed, Pavlovian conditioning may also occur within the
peripheral neural circuitry, e.g., within the enteric nervous sys-
tem (Drucker and Sclafani, 1997). Whether this also relates to
conditioned placebo responses warrants further research.
The Role of Gender in Placebo Effects
Gender effects of the placebo response have rarely been docu-
mented in clinical trials but have occasionally been noted in
experimental settings (Flaten et al., 2006). However, whether
and to what extent gender differences may account for some
of the variance in the placebo imaging studies is unknown so
far. Cortical processing, independent of the placebo response,
has shown significant gender variation both in volunteers and
in patients with somatic and visceral pain (Paulson et al., 1998;
Berman et al., 2000) and with nonpainful stimuli (Sabatinelli
et al., 2004; Gizewski et al., 2006). Unfortunately, most imaging
studies on the placebo response have ignored the potential
role of gender (Klosterhalfen and Enck, 2008).
Gender effects in the placebo response were reported in an
experimental setting with placebo analgesia during ischemic
pain, whereby males responded to the manipulation of expec-
tancies through pain information, while women did not (Flaten
et al., 2006). However, an experimenter effect could not be
Neuron 59, July 31, 2008 ª2008 Elsevier Inc. 201Page 7 of 12 005231

Neuron
ReviewEXHIBIT A5-10
excluded, as all the experimenters were female nurses, which
could have induced a reporting bias (Kallai et al., 2004). Gender
effects were also noted in an acupuncture trial with male and
female acupuncturists, with females inducing greater trust than
male experimenters (White et al., 2003). Employing a motion-
sickness paradigm, conditioning was effective predominantly
in women, while in the suggestion experiment, men exhibited
a significantly greater reduction in rotation tolerance and
responded more strongly to rotation and to suggestions than
women (Klosterhalfen et al., 2007). However, other data from
this group pointed toward the role of biological factors (e.g.,
the menstrual cycle) on processing of visceral and vestibular
sensations (Klosterhalfen et al., 2008b) and on differential effects
of stress hormone release on nausea and motion sickness
(Rohleder et al., 2006). These observations clearly show the ne-
cessity to investigate gender effects in the placebo and nocebo
responses.
The Impact of Obtaining Drug-like
Effects without Drugs
One of the most practical implications of the recent neurobiolog-
ical advances in placebo research is the possibility to induce, at
least in some circumstances, drug-like effects without the
administration of drugs. Throughout this review we have seen
that placebos can induce the activation of endogenous opioids
and dopamine, that placebo-conditioned responses of several
immune mediators can be obtained through behavioral condi-
tioning, and that nocebos activate the endogenous CCK-ergic
systems. The obvious consequence of these findings is their ex-
ploitation both in the clinic and in other areas of society, although
important ethical constraints have so far limited the development
of therapeutic paradigms with placebos.
As far as the clinic is concerned, it would be conceivable today
to use a translational approach whereby many experimental
protocols, so far carried out in animals and healthy volunteers,
could be applied to real medical conditions. For example, there
is compelling evidence that pharmacological conditioning can
induce powerful placebo responses when the real drug is re-
placed with a placebo. This phenomenon is well documented
in humans, for example in pain (Amanzio and Benedetti, 1999),
the immune system (Goebel et al., 2002), and the endocrine
and motor systems (Benedetti et al., 2003), although unfortu-
nately no systematic investigation has been done in a real clinical
setting. There are, however, some indications that the applica-
tion of placebo-induced drug-like effects without drugs is possi-
ble in the clinic. For example, Benedetti et al. (2004a) conditioned
Parkinson’s patients with repeated administrations of the anti-
Parkinson’s drug apomorphin before the surgical implantation
of electrodes for deep brain stimulation. Then, the investigators
replaced apomorphin with a placebo in the operating room
and obtained a powerful placebo reduction of muscle rigidity
that mimicked the effects of apomorphin during the previous
days. Although the effect was short-lasting (no longer than 20–
30 min), it was useful from a clinical point of view because the
patient improved and felt better for a while, thus making some
surgical procedures easier and faster. These drug-mimicking
effects could be particularly useful whenever the drug has impor-
tant side effects. For example, in the study by Benedetti et al.
(2004a), the presurgical apomorphin resulted in both clinical
202 Neuron 59, July 31, 2008 ª2008 Elsevier Inc.
improvement and some side effects, like dyskinesia, whereas
the placebo in the operating room induced improvement but
not dyskinesia.
Besides the clinic, there are also some other areas of society in
which the drug-like effects of placebos may have a strong
impact. In a very recent study, Benedetti et al. (2007b) used pla-
cebos in an experimental simulation of a sporting event, whereby
a placebo was given on the competition day after precondition-
ing with a narcotic in the training phase. In fact, after repeated
administrations of morphine in the training phase, its replace-
ment with a placebo on the day of the competition induced an
opioid-mediated increase in pain endurance and physical perfor-
mance, even though no illegal drug was administered. This
shows that athletes can be preconditioned with narcotics and
then a placebo given just before the competition, thus avoiding
the administration of illegal drugs on the competition day. These
narcotic-like effects of placebos raise the important question of
whether opioid-mediated placebo responses are ethically ac-
ceptable in sport or whether they should rather be considered
as a doping procedure in all respects. In the light of the distinc-
tion between drugs that are prohibited during and/or out of com-
petition, the preconditioning procedure may be deemed ethical
and legal for drugs that are prohibited only during competition,
like narcotics (World Anti-Doping Agency 2007, www.wada.
ama.org). However, it may also be considered illegal because
morphine administration is aimed at conditioning the subjects
for subsequent replacement with a placebo, which is supposed
to show morphine-like effects during the competition. This issue
is not easy to be resolved and needs both an ethical and a legal
discussion. In fact, doping is a matter of great public concern
today, and we should be aware that if a procedure like the one
described by Benedetti et al. (2007b) is performed, illegal drugs
in sport would no longer be discoverable, nor would they violate
the current antidoping rules.
Where Does Placebo Research Go from Here?Despite the recent explosion of neurobiological placebo re-
search using sophisticated tools, such as neuroimaging, in vivo
receptor binding, and single-neuron recording in awake sub-
jects, our knowledge of the mechanisms underlying the placebo
effect is still in its infancy, and several issues need to be ad-
dressed in future research. The major questions to be answered
are where, when, how, and why placebo effects occur. In fact, we
need to know where they work exactly, that is, in which medical
conditions. For example, are all diseases and symptoms subject
to placebo effects? We also need to know when they work, that
is, whether there are special circumstances that are particularly
amenable to placebo effects. How they work is also a major
question, as we need to understand the brain mechanisms at
both the macroscopic (brain regions and their interactions with
body functions) and microscopic (cellular and molecular) level.
Finally, determining why placebo effects exist at all represents
a major scientific challenge, and meeting that challenge will
give us insights into the possible evolution of endogenous
healthcare systems.
Besides the profound implications of placebo research for a
better understanding of human biology, some practical aspects
should not be forgotten. For example, placebo and nocebo
Page 8 of 12 005232
Neuron
ReviewEXHIBIT A5-10
phenomena are a major hurdle in the development and validation
of new treatments, as high placebo responses sometimes distort
the effects of a therapy. If we can identify in more detail the major
mechanisms involved in placebo responsiveness, we could also
develop strategies aimed at minimizing placebo effects, thereby
uncovering the real effect of a therapy. Likewise, nocebo effects
can be a serious drawback, as negative reactions to drugs are
sometimes due to psychological effects rather than to specific
negative effects of the drug itself. Therefore, research aimed at
investigating nocebo mechanisms would enable us to disentan-
gle the negative effects of the drug from those of the psycholog-
ical state of the patient. In addition, a better understanding of the
neurobiology of the placebo and nocebo responses will form the
basis for designing behavioral protocols that can be employed
as supportive therapy together with standard pharmacological
regimen, the aim being to maximize the therapeutic outcome
for the patient’s benefit.
We believe that the future years will be characterized by
a deeper understanding of both the placebo and nocebo phe-
nomena, which in turn will give us profound insights into many
aspects of human biology.
REFERENCES
Ader, R. (2003). Conditioned immunomodulation: Research needs anddirections. Brain Behav. Immun. 17 (Suppl. 1), S51–S57.
Ader, R., and Cohen, N. (1975). Behaviorally conditioned immunosuppression.Psychosom. Med. 37, 333–340.
Ader, R., and Cohen, N. (1982). Behaviorally conditioned immunosuppressionand murine systemic lupus erythematosus. Science 215, 1534–1536.
Amanzio, M., and Benedetti, F. (1999). Neuropharmacological dissection ofplacebo analgesia: expectation activated opioid systems versus condition-ing-activated specific subsystems. J. Neurosci. 19, 484–494.
Beauregard, M. (2007). Mind does really matter: evidence from neuroimagingstudies of emotional self-regulation, psychotherapy, and placebo effect. Prog.Neurobiol. 81, 218–236.
Bendesky, A., and Sonabend, A.M. (2005). On Schleppfuss’ path: the placeboresponse in human evolution. Med. Hypotheses 64, 414–416.
Benedetti, F. (1996). The opposite effects of the opiate antagonist naloxoneand the cholecystokinin antagonist proglumide on placebo analgesia. Pain64, 535–543.
Benedetti, F. (1997). Cholecystokinin type-A and type-B receptors and theirmodulation of opioid analgesia. News Physiol. Sci. 12, 263–268.
Benedetti, F. (2008). Mechanisms of placebo and placebo-related effectsacross diseases and treatments. Annu. Rev. Pharmacol. Toxicol. 48, 33–60.
Benedetti, F., Amanzio, M., and Maggi, G. (1995). Potentiation of placeboanalgesia by proglumide. Lancet 346, 1231.
Benedetti, F., Pollo, A., Lopiano, L., Lanotte, M., Vighetti, S., and Rainero, I.(2003). Conscious expectation and unconscious conditioning in analgesic,motor, and hormonal placebo/ nocebo responses. J. Neurosci. 23, 4315–4323.
Benedetti, F., Colloca, L., Torre, E., Lanotte, M., Melcarne, A., Pesare, M.,Brgamasco, B., and Lopiano, L. (2004a). Placebo-responsive Parkinsonpatients show decreased activity in single neurons of subthalamic nucleus.Nat. Neurosci. 7, 587–588.
Benedetti, F., Colloca, L., Lanotte, M., Bergamasco, B., Torre, E., and Lopiano,L. (2004b). Autonomic and emotional responses to open and hidden stimula-tions of the human subthalamic region. Brain Res. Bull. 63, 203–211.
Benedetti, F., Arduino, C., Costa, S., Vighetti, S., Tarenzi, L., Rainero, I., andAsteggiano, G. (2006). Loss of expectation-related mechanisms inAlzheimer’s disease makes analgesic therapies less effective. Pain 121,133–144.
Benedetti, F., Lanotte, M., Lopiano, L., and Colloca, L. (2007a). When wordsare painful – unraveling the mechanisms of the nocebo effect. Neuroscience147, 260–271.
Benedetti, F., Pollo, A., and Colloca, L. (2007b). Opioid-mediated placebo re-sponses boost pain endurance and physical performance – is it doping in sportcompetitions? J. Neurosci. 27, 11934–11939.
Berman, S., Munakata, J., Naliboff, B.D., Chang, L., Mandelkern, M., Silver-man, D., Kovalik, E., and Mayer, E.A. (2000). Gender differences in regionalbrain response to visceral pressure in IBS patients. Eur. J. Pain 4, 157–172.
Bingel, U., Lorenz, J., Schoell, E., Weiller, C., and Buchel, C. (2006). Mecha-nisms of placebo analgesia: rACC recruitment of a subcortical antinociceptivenetwork. Pain 120, 8–15.
Boutron, I., Estellat, C., Guittet, L., Dechartres, A., Sackett, D.L., Hrobjartsson,A., and Ravaud, P. (2006). Methods of blinding in reports of randomizedcontrolled trials assessing pharmacologic treatments: a systematic review.PLoS Med. 3, e425. 10.1371/journal.pmed.0030425.
Charron, J., Rainville, P., and Marchand, S. (2006). Direct comparison ofplacebo effects on clinical and experimental pain. Clin. J. Pain 22, 204–211.
Chey, W.D., Chey, W.Y., Heath, A.T., Dukes, G.E., Carter, E.G., Northcutt, A.,and Ameen, V.Z. (2004). Long-term safety and efficacy of alosetron in womenwith severe diarrhea-predominant irritable bowel syndrome. Am. J. Gastroen-terol. 99, 2195–2203.
Chua, P., Krams, M., Toni, I., Passingham, R., and Dolan, R. (1999). A func-tional anatomy of anticipatory anxiety. Neuroimage 9, 563–571.
Chung, S.K., Price, D.D., Verne, G.N., and Robinson, M.E. (2007). Revelation ofa personal placebo response: its effects on mood, attitudes and future placeboresponding. Pain 132, 281–288.
Cole-Harding, S., and Michels, V.J. (2007). Does expectancy affect alcoholabsorption? Addict. Behav. 32, 194–198.
Colloca, L., and Benedetti, F. (2005). Placebos and painkillers: is mind as realas matter? Nat. Rev. Neurosci. 6, 545–552.
Colloca, L., and Benedetti, F. (2006). How prior experience shapes placeboanalgesia. Pain 124, 126–133.
Colloca, L., Lopiano, L., Lanotte, M., and Benedetti, F. (2004). Overt versuscovert treatment for pain, anxiety, and Parkinson’s disease. Lancet Neurol.3, 679–684.
Colloca, L., Benedetti, F., and Porro, C.A. (2008). Experimental designs andbrain mapping approaches for studying the placebo analgesic effect. Eur. J.Appl. Physiol. 102, 371–380.
Coronary Drug Project Research Group (1980). Influence of adherence totreatment and response of cholesterol on mortality in the coronary drugproject. N. Engl. J. Med. 303, 1038–1041.
Dagan, Y., and Doljansky, J.T. (2006). Cognitive performance during sustainedwakefulness: a low dose of caffeine is equally effective as modafinil in alleviat-ing the nocturnal decline. Chronobiol. Int. 23, 973–983.
Dannecker, E.A., Price, D.D., and Robinson, M.E. (2003). An examination of therelationships among recalled, expected, and actual intensity and unpleasant-ness of delayed onset muscle pain. J. Pain 4, 74–81.
de la Fuente-Fernandez, R. (2004). Uncovering the hidden placebo effect indeep-brain stimulation for Parkinson’s disease. Parkinsonism Relat. Disord.10, 125–127.
de la Fuente-Fernandez, R., and Stoessl, A.J. (2002). The placebo effect inParkinson’s disease. Trends Neurosci. 25, 302–306.
de la Fuente-Fernandez, R., Ruth, T.J., Sossi, V., Schulzer, M., Calne, D.B.,and Stoessl, A.J. (2001). Expectation and dopamine release: mechanism ofthe placebo effect in Parkinson’s disease. Science 293, 1164–1166.
Neuron 59, July 31, 2008 ª2008 Elsevier Inc. 203Page 9 of 12 005233

Neuron
ReviewEXHIBIT A5-10
de la Fuente-Fernandez, R., Phillips, A.G., Zamburlini, M., Sossi, V., Calne,D.B., Ruth, T.J., and Stoessl, A.J. (2002a). Dopamine release in human ventralstriatum and expectation of reward. Behav. Brain Res. 136, 359–363.
de la Fuente-Fernandez, R., Schulzer, M., and Stoessl, A.J. (2002b). Theplacebo effect in neurological disorders. Lancet Neurol. 1, 85–91.
de la Fuente-Fernandez, R., Schulzer, M., and Stoessl, A.J. (2004). Placebomechanisms and reward circuitry: clues from Parkinson’s disease. Biol.Psychiatry 56, 67–71.
Drucker, D.B., and Sclafani, A. (1997). The role of gastric and postgastric sitesin glucose-conditioned flavour preferences in rats. Physiol. Behav. 61, 351–358.
Edward, S.J., Stevens, A.J., Braunholtz, D.A., Lilford, R.J., and Swift, T. (2005).The ethics of placebo-controlled trials: a comparison of inert and activeplacebo controls. World J. Surg. 29, 610–614.
Ehni, H.J., and Wiesing, U. (2008). International ethical regulations on placebo-use in clinical trials: a comparative analysis. Bioethics 22, 64–74.
Enck, P., and Klosterhalfen, S. (2005). The placebo response in functionalbowel disorders: perspectives and putative mechanisms. Neurogastroenterol.Motil. 17, 325–331.
Enserink, M. (1999). Can the placebo be the cure? Science 284, 238–240.
Evans, K.R., Sills, T., Wunderlich, G.R., and McDonald, H.P. (2004). Worseningof depressive symptoms prior to randomization in clinical trials: a possiblescreen for placebo responders? J. Psychiatr. Res. 38, 437–444.
Exton, M.S., von Horsten, S., Schult, M., Voge, J., Strubel, T., Donath, S.,Steinmuller, C., Seeliger, H., Nagel, E., Westermann, J., and Schedlowski,M. (1998). Behaviorally conditioned immunosuppression using cyclosporinea: central nervous system reduces il-2 production via splenic innervation. J.Neuroimmunol. 88, 182–191.
Exton, M.S., Schult, M., Donath, S., Strubel, T., Bode, U., del Rey, A., Wester-mann, J., and Schedlowski, M. (1999). Conditioned immunosuppressionmakes subtherapeutic cyclosporin effective via splenic innervation. Am. J.Physiol. 276, R1710–R1717.
Exton, M.S., Elfers, A., Jeong, W.Y., Bull, D.F., Westermann, J., and Sched-lowski, M. (2000). Conditioned suppression of contact sensitivity is indepen-dent of sympathetic splenic innervation. Am. J. Physiol. 279, R1310–R1315.
Exton, M.S., Herklotz, J., Westermann, J., and Schedlowski, M. (2001). Condi-tioning in the rat: an in vivo model to investigate the molecular mechanismsand clinical implications of brain-immune communication. Immunol. Rev.184, 226–235.
Exton, M.S., Gierse, C., Meier, B., Mosen, M., Xie, Y., Frede, S., Goebel, M.U.,Limmroth, V., and Schedlowski, M. (2002). Behaviorally conditioned immuno-suppression in the rat is regulated via noradrenaline and beta-adrenoceptors.J. Neuroimmunol. 131, 21–30.
Fiorillo, C.D., Tobler, P.N., and Schultz, W. (2003). Discrete coding of rewardprobability and uncertainty by dopamine neurons. Science 299, 1898–1902.
Flaten, M.A., Aslaksen, P.M., Finset, A., Simonsen, T., and Johansen, O.(2006). Cognitive and emotional factors in placebo analgesia. J. Psychosom.Res. 61, 81–89.
Fricchione, G., and Stefano, G.B. (2005). Placebo neural systems: nitric oxide,morphine and the dopamine brain reward and motivation circuitries. Med. Sci.Monit. 11, MS54–MS65.
Garcia, J., Kimeldorf, D.J., and Koelling, R.A. (1955). Conditioned aversion tosaccharin resulting from exposure to gamma radiation. Science 122, 157–158.
Giang, D.W., Goodman, A.D., Schiffer, R.B., Mattson, D.H., Petrie, M., Cohen,N., and Ader, R. (1996). Conditioning of cyclophosphamide-induced leukope-nia in humans. J. Neuropsychiatry Clin. Neurosci. 8, 194–201.
Gizewski, E.R., Krause, E., Karama, S., Baars, A., Senf, W., and Forsting, M.(2006). There are differences in cerebral activation between females in distinctmenstrual phases during viewing of erotic stimuli: a fMRI study. Exp. BrainRes. 174, 101–108.
Goebel, M.U., Trebst, A.E., Steiner, J., Xie, Y.F., Exton, M.S., Frede, S., Can-bay, A.E., Michel, M.C., Heemann, U., and Schedlowski, M. (2002). Behavioral
204 Neuron 59, July 31, 2008 ª2008 Elsevier Inc.
conditioning of immunosuppression is possible in humans. FASEB J. 16,1869–1873.
Goebel, M.U., Meykadeh, N., Kou, W., Schedlowski, M., and Hengge, U.R.(2008). Behavioral conditioning of anti-histamine effects in patients withallergic rhinitis. Psychother. Psychosom. 77, 227–234.
Goffaux, P., Redmond, W.J., Rainville, P., and Marchand, S. (2007). Descend-ing analgesia - when the spine echoes what the brain expects. Pain 130,137–143.
Gomeni, R., and Merlo-Pich, E. (2007). Bayesian modelling and ROC analysisto predict placebo responders using clinical score measured in the initialweeks of treatment in depression trials. Br. J. Clin. Pharmacol. 63, 595–613.
Gøtzsche, P.C., Hrobjartsson, A., Maric, K., and Tendal, B. (2007). Dataextraction errors in meta-analyses that use standardized mean differences.JAMA 298, 430–437.
Guess, H.A., Kleinman, A., Kusek, J.W., and Engel, L.W., eds. (2002). Thescience of the placebo: towards an interdisciplinary research agenda (London:BMJ Publishing Group).
Hahn, R.A. (1985). A sociocultural model of illness and healing. In Placebo:Theory, Research, and Mechanisms, L. White, B. Tursky, and G.E. Schwartz,eds. (New York: Guilford), pp. 332–350.
Hahn, R.A. (1997). The nocebo phenomenon: concept, evidence, and implica-tions for public health. Prev. Med. 26, 607–611.
Hill, A.B. (1990). Suspended judgment: memories of the British streptomycintrial in tuberculosis. The first randomized clinical trial. Control. Clin. Trials 11,77–79.
Horwitz, R.I., Viscoli, C.M., Berkman, L., Donaldson, R.M., Horwitz, S.M.,Murray, C.J., Ransohoff, D.F., and Sindelar, J. (1990). Treatment adherenceand risk of death after a myocardial infarction. Lancet 336, 542–545.
Hrobjartsson, A., and Gøtzsche, P.C. (2001). Is the placebo powerless? Ananalysis of clinical trials comparing placebo with no treatment. N. Engl. J.Med. 344, 1594–1602.
Hrobjartsson, A., and Gøtzsche, P.C. (2004). Is the placebo powerless?Update of a systematic review with 52 new randomized trials comparingplacebo with no treatment. J. Intern. Med. 256, 91–100.
Hsieh, J.C., Stone-Elander, S., and Ingvar, M. (1999). Anticipatory coping ofpain expressed in the human anterior cingulated cortex: a positron emissiontomography study. Neurosci. Lett. 262, 61–64.
Hyland, M.E., Whalley, B., and Geraghty, A.W. (2007). Dispositional predictorsof placebo responding: a motivational interpretation of flower essence andgratitude therapy. J. Psychosom. Res. 62, 331–340.
Kallai, I., Barke, A., and Voss, U. (2004). The effects of experimenter character-istics on pain reports in women and men. Pain 112, 142–147.
Kelemen, W.L., and Kaighobadi, F. (2007). Expectancy and pharmacologyinfluence the subjective effects of nicotine in a balanced-placebo design.Exp. Clin. Psychopharmacol. 15, 93–101.
Keltner, J.R., Furst, A., Fan, C., Redfern, R., Inglis, B., and Fields, H.L. (2006).Isolating the modulatory effect of expectation on pain transmission: a func-tional magnetic resonance imaging study. J. Neurosci. 26, 4437–4443.
Kemeny, M.E., Rosenwasser, L.J., Panettieri, R.A., Rose, R.M., Berg-Smith,S.M., and Kline, J.N. (2007). Placebo response in asthma: a robust and objec-tive phenomenon. J. Allergy Clin. Immunol. 119, 1375–1381.
Kennedy, W.P. (1961). The nocebo reaction. Med. Exp. Int. J. Exp. Med. 95,203–205.
Kissel, P., and Barrucand, D. (1964). Placebos et Effect Placebo en Medicine(Paris: Masson).
Kleveland, P.M., Larsen, S., Sandvik, L., Kristensen, P., Johannessen, T., Haf-stad, P.E., Sandbakken, P., Løge, I., Fjøsne, U., and Petersen, H. (1985). Theeffect of cimetidine in non-ulcer dyspepsia. Experience with a multi-cross-overmodel. Scand. J. Gastroenterol. 20, 19–24.
Page 10 of 12 005234

Neuron
ReviewEXHIBIT A5-10
Klinger, R., Soost, S., Flor, H., and Worm, M. (2007). Classical conditioning andexpectancy in placebo hypoalgesia: a randomized controlled study in patientswith atopic dermatitis and persons with healthy skin. Pain 128, 31–39.
Klosterhalfen, S., and Klosterhalfen, W. (1990). Conditioned cyclosporineeffects but not conditioned taste aversion in immunized rats. Behav. Neurosci.104, 716–724.
Klosterhalfen, S., and Enck, P. (2006). Pychobiology of the placebo response.Auton. Neurosci. 125, 94–99.
Klosterhalfen, S., and Enck, P. (2008). Neurophysiology and psychobiology ofthe placebo response. Curr. Opin. Psychiatry 21, 189–195.
Klosterhalfen, S., Kellermann, S., Braun, S., Kowalski, A., Schrauth, M., Werz,U., and Enck, P. (2007). Women respond to conditioning, and men to sugges-tion of nausea. Gastroenterology 132, A133f.
Klosterhalfen, S., Kellermann, S., Muth, E.M., Meissner, K., and Enck, P.(2008b). Nausea induced by vection drum: Contributions of body position,visual pattern, and gender. Aviat. Space Environ. Med. 79, 384–389.
Kobak, K.A., Kane, J.M., Thase, M.E., and Nierenberg, A.A. (2007). Why doclinical trials fail? The problem of measurement error in clinical trials: time totest new paradigms? J. Clin. Psychopharmacol. 27, 1–5.
Kong, J., Gollub, R.L., Rosman, I.S., Webb, J.M., Vangel, M.G., Kirsch, I., andKaptchuk, T.J. (2006). Brain activity associated with expectancy-enhancedplacebo analgesia as measured by functional magnetic resonance imaging.J. Neurosci. 26, 381–388.
Koyama, T., Tanaka, Y.Z., and Mikami, A. (1998). Nociceptive neurons in themacaque anterior cingulated activate during anticipation of pain. Neuroreport9, 2663–2667.
Koyama, T., McHaffie, J.G., Laurienti, P.J., and Coghill, R.C. (2005). The sub-jective experience of pain: where expectations become reality. Proc. Natl.Acad. Sci. USA 102, 12950–12955.
Kramer, M.S., Cutler, N., Feighner, J., Shrivastava, R., Carman, J., Sramek,J.J., Reines, S.A., Liu, G., Snavely, D., Wyatt-Knowles, E., et al. (1998). Distinctmechanism for antidepressant activity by blockade of central substance Preceptors. Science 281, 1640–1645.
Lanotte, M., Lopiano, L., Torre, E., Bergamasco, B., Colloca, L., and Benedetti,F. (2005). Expectation enhances autonomic responses to stimulation of thehuman subthalamic limbic region. Brain Behav. Immun. 19, 500–509.
Leuchter, A.F., Cook, I.A., Witte, E.A., Morgan, M., and Abrams, M. (2002).Changes in brain function of depressed subjects during treatment withplacebo. Am. J. Psychiatry 159, 122–129.
Levine, J.D., Gordon, N.C., and Fields, H.L. (1978). The mechanism of placeboanalgesia. Lancet 2, 654–657.
Levine, J.D., Gordon, N.C., Smith, R., and Fields, H.L. (1981). Analgesicresponses to morphine and placebo in individuals with postoperative pain.Pain 10, 379–389.
Lidstone, S.C., and Stoessl, A.J. (2007). Understanding the placebo effect:contributions from neuroimaging. Mol. Imaging Biol. 9, 176–185.
Linde, K., Witt, C.M., Streng, A., Weidenhammer, W., Wagenpfeil, S., Brink-haus, B., Willich, S.N., and Melchart, D. (2007). The impact of patient expecta-tions on outcomes in four randomized controlled trials of acupuncture inpatients with chronic pain. Pain 128, 264–271.
Longo, D.L., Duffey, P.L., Kopp, W.C., Heyes, M.P., Alvord, W.G., Sharfman,W.H., Schmidt, P.J., Rubinow, D.R., and Rosenstein, D.L. (1999). Conditionedimmune response to interferon-[gamma] in humans. Clin. Immunol. 90,173–181.
Lorenz, J., Hauck, M., Paur, R.C., Nakamura, Y., Zimmermann, R., Bromm, B.,and Engel, A.K. (2005). Cortical correlates of false expectations during painintensity judgments—a possible manifestation of placebo/nocebo cognitions.Brain Behav. Immun. 19, 283–295.
Macedo, A., Farre, M., and Banos, J.E. (2006). A meta-analysis of the placeboresponse in acute migraine and how this response may be influenced by someof the characteristics of clinical trials. Eur. J. Clin. Pharmacol. 62, 161–172.
Macedo, A., Banos, J.E., and Farre, M. (2008). Placebo response in theprophylaxis of migraine: a meta-analysis. Eur. J. Pain 12, 68–75.
Machado, L.A. (2005). Problems with the ‘open-hidden’ paradigm: the debateis still open and the answer is still hidden. Pain 117, 240–241.
Madsen, L.G., and Bytzer, P. (2002). Review article: Single subject trials as aresearch instrument in gastrointestinal pharmacology. Aliment. Pharmacol.Ther. 16, 189–196.
Martikainen, I.K., Hagelberg, N., Mansikka, H., Hietala, J., Nagren, K., Schei-nin, H., and Pertovaara, A. (2005). Association of striatal dopamine D2/D3receptor binding potential with pain but not tactile sensitivity or placeboanalgesia. Neurosci. Lett. 376, 149–153.
Matre, D., Casey, K.L., and Knardahl, S. (2006). Placebo-induced changes inspinal cord pain processing. J. Neurosci. 26, 559–563.
Meisel, C., Schwab, J.M., Prass, K., Meisel, A., and Dirnagl, U. (2005). Centralnervous system injury-induced immune deficiency syndrome. Nat. Rev.Neurosci. 6, 775–786.
Meissner, K., Distel, H., and Mitzdorf, U. (2007). Evidence for placebo effectson physical but not on biochemical outcome parameters: a review of clinicaltrials. BMC Med. 5, 3.
Miller, F.G., Wendler, D., and Swartzman, L.C. (2005). Deception in researchon the placebo effect. PLoS Med. 2, e262. 10.1371/journal.pmed.0020262.
Nemoto, H., Remoto, Y., Toda, H., Mikuni, M., and Fukuyama, H. (2007).Placebo analgesia: a PET study. Exp. Brain Res. 179, 655–664.
Ondo, W.G. (2007). Placebo response in Parkinson trials using patient diaries:sites do matter. Clin. Neuropharmacol. 30, 301–304.
Pacheco-Lopez, G., Niemi, M.B., Kou, W., Harting, M., Fandrey, J., andSchedlowski, M. (2005). Neural substrates for behaviorally conditioned immu-nosuppression in the rat. J. Neurosci. 25, 2330–2337.
Pacheco-Lopez, G., Engler, H., Niemi, M.B., and Schedlowski, M. (2006).Expectations and associations that heal: immunomodulatory placebo effectsand its neurobiology. Brain Behav. Immun. 20, 430–446.
Patel, S.M., Stason, W.B., Legedza, A., Ock, S.M., Kaptchuk, T.J., Conboy, L.,Canenguez, K., Park, J.K., Kelly, E., Jacobson, E., et al. (2005). The placeboeffect in irritable bowel syndrome trials: a meta-analysis. Neurogastroenterol.Motil. 17, 332–340.
Paulson, P.E., Minoshima, S., Morrow, T.J., and Casey, K.L. (1998). Genderdifferences in pain perception and patterns of cerebral activation duringnoxious heat stimulation in humans. Pain 76, 223–229.
Perkins, K.A., Grobe, J.E., Caggiula, A., Wilson, A.S., and Stiller, R.L. (1997).Acute reinforcing effects of low-dose nicotine nasal spray in humans. Pharma-col. Biochem. Behav. 56, 235–241.
Petrovic, P., Kalso, E., Petersson, K.M., and Ingvar, M. (2002). Placebo andopioid analgesia - imaging a shared neuronal network. Science 295, 1737–1740.
Pinsger, M., Schimetta, W., Volc, D., Hiermann, E., Riederer, F., and Polz, W.(2006). Benefits of an add-on treatment with the synthetic cannabinomimeticnabilone on patients with chronic pain—a randomized controlled trial. Wien.Klin. Wochenschr. 118, 327–335.
Pitz, M., Cheang, M., and Bernstein, C.N. (2005). Defining the predictors of theplacebo response in irritable bowel syndrome. Clin. Gastroenterol. Hepatol. 3,237–247.
Ploghaus, A., Tracey, I., Gati, J.S., Clare, S., Menon, R.S., Matthews, P.M., andRawlins, J.N. (1999). Dissociating pain from its anticipation in the human brain.Science 284, 1979–1981.
Porro, C.A., Baraldi, P., Pagnoni, G., Serafini, M., Facchin, P., Maieron, M., andNichelli, P. (2002). Does anticipation of pain affect cortical nociceptivesystems? J. Neurosci. 22, 3206–3214.
Porro, C.A., Cettolo, V., Francescato, M.P., and Baraldi, P. (2003). Functionalactivity mapping of the mesial hemispheric wall during anticipation of pain.Neuroimage 19, 1738–1747.
Neuron 59, July 31, 2008 ª2008 Elsevier Inc. 205Page 11 of 12 005235

Neuron
ReviewEXHIBIT A5-10
Price, D.D. (2000). Psychological and neural mechanisms of the affectivedimension of pain. Science 288, 1769–1772.
Price, D.D., Zhou, Q., Moshiree, B., Robinson, M.E., and Nicholas Verne, G.(2006). Peripheral and central contributions to hyperalgesia in irritable bowelsyndrome. J. Pain 7, 529–535.
Price, D.D., Finniss, D.G., and Benedetti, F. (2008). A Comprehensive review ofthe placebo effect: Recent advances and current thought. Annu. Rev. Psychol.59, 565–590.
Ramırez-Amaya, V., Alvarez-Borda, B., Ormsby, C., Martınez, R., Perez-Montfort, R., and Bermudez-Rattoni, F. (1996). Insular cortex lesions impairthe acquisition of conditioned immunosuppression. Brain Behav. Immun. 10,103–114.
Ramırez-Amaya, V., Alvarez-Borda, B., and Bermudez-Rattoni, F. (1998).Differential effects of nmda-induced lesions into the insular cortex and amyg-dala on the acquisition and evocation of conditioned immunosuppression.Brain Behav. Immun. 12, 149–160.
Raz, A. (2008). Genetics and neuroimaging of attention and hypnotizability mayelucidate placebo. Int. J. Clin. Exp. Hypn. 56, 99–116.
Riether, C., Doenlen, R., Pacheco-Lopez, G., Niemi, M.-B., Engler, A., Engler,H., and Schedlowski, M. (2008). Behavioural conditioning of immune func-tions: How the CNS controls peripheral immune responses by evoking asso-ciative learning processes. Rev. Neurosci. 19, 1–17.
Rohleder, N., Otto, B., Wolf, J.M., Klose, J., Kirschbaum, C., Enck, P., andKlosterhalfen, S. (2006). Sex-specific adaptation of endocrine and inflamma-tory responses to repeated nausegoenic body rotation. Psychoneuroendocri-nology 31, 226–236.
Rosenberger, W.F., and Lachin, J.M. (1993). The use of response-adaptivedesigns in clinical trials. Control. Clin. Trials 14, 471–484.
Sabatinelli, D., Flaisch, T., Bradley, M.M., Fitzsimmons, J.R., and Lang, P.J.(2004). Affective picture perception: gender differences in visual cortex?Neuroreport 15, 1109–1112.
Sawamoto, N., Honda, M., Okada, T., Hanakawa, T., Kanda, M., Fukuyama,H., Konishi, J., and Shibasaki, H. (2000). Expectation of pain enhances re-sponses to nonpainful somatosensory stimulation in the anterior cingulatedcortex and parietal operculum/posterior insula: an event-related functionalmagnetic resonance imaging study. J. Neurosci. 20, 7438–7445.
Schultz, W. (1998). Predictive reward signal of dopamine neurons. J. Neuro-physiol. 80, 1–27.
Scott, D.J., Stohler, C.S., Egnatuk, C.M., Wang, H., Koeppe, R.A., andZubieta, J.K. (2007). Individual differences in reward responding explainplacebo-induced expectations and effects. Neuron 55, 325–336.
206 Neuron 59, July 31, 2008 ª2008 Elsevier Inc.
Scott, D.J., Stohler, C.S., Egnatuk, C.M., Wang, H., Koeppe, R.A., andZubieta, J.K. (2008). Placebo and nocebo effects are defined by oppositeopioid and dopaminergic responses. Arch. Gen. Psychiatry 65, 220–231.
Sternberg, E.M. (2006). Neural regulation of innate immunity: a coordinatednonspecific host response to pathogens. Nat. Rev. Immunol. 6, 318–328.
Sysko, R., and Walsh, B.T. (2007). A systematic review of placebo response instudies of bipolar mania. J. Clin. Psychiatry 68, 1213–1217.
Tack, J., Muller-Lissner, S., Bytzer, P., Corinaldesi, R., Chang, L., Viegas, A.,Schnekenbuehl, S., Dunger-Baldauf, C., and Rueegg, P. (2005). A randomisedcontrolled trial assessing the efficacy and safety of repeated tegaserod ther-apy in women with irritable bowel syndrome with constipation. Gut 54,1707–1713.
Talleyn, N.J., Locke, G.R., Lahr, B.D., Zinsmeister, A.R., Cohard-Radice, M.,D’Elia, T.V., Tack, J., and Earnest, D.L. (2006). Predictors of the placeboresponse in functional dyspepsia. Aliment Pharmacol. Ther. 23, 923–936.
Tracey, K.J. (2007). Physiology and immunology of the cholinergic antiinflam-matory pathway. J. Clin. Invest. 117, 289–296.
Vase, L., Riley, J.L., and Price, D.D. (2002). A comparison of placebo effects inclinical analgesic trials versus studies of placebo analgesia. Pain 99, 443–452.
Vray, M., Girault, D., Hoog-Labouret, N., Porcher, R., and Thalabard, J.C.(2004). Methodology for small clinical trials. Therapie 59, 273–286.
Wager, T.D., Rilling, J.K., Smith, E.E., Sokolik, A., Casey, K.L., Davidson, R.J.,Kosslyn, S.M., Rose, R.M., and Cohen, J.D. (2004). Placebo-induced changesin fMRI in the anticipation and experience of pain. Science 303, 1162–1167.
Wager, T.D., Scott, D.J., and Zubieta, J.K. (2007). Placebo effects on humanm-opioid activity during pain. Proc. Natl. Acad. Sci. USA 104, 11056–11061.
Walsh, B.T., Seidman, S.N., Sysko, R., and Gould, M. (2002). Placeboresponse in studies of major depression - variable, substantial, and growing.JAMA 287, 1840–1847.
White, P., Lewith, G., Hopwood, V., and Prescott, P. (2003). The placeboneedle, is it a valid and convincing placebo for use in acupuncture trials? Arandomised, single-blind, cross-over pilot trial. Pain 106, 401–409.
Zhang, L., and Rosenberger, W.F. (2006). Response-adaptive randomizationfor clinical trials with continuous outcomes. Biometrics 62, 562–569.
Zimmer-Hart, C.L., and Rescorla, R.A. (1974). Extinction of Pavlovian condi-tioned inhibition. J. Comp. Physiol. Psychol. 86, 837–845.
Zubieta, J.K., Bueller, J.A., Jackson, L.R., Scott, D.J., Xu, Y., Koeppe, R.A.,Nichols, T.E., and Stohler, C.S. (2005). Placebo effects mediated by endoge-nous opioid activity on mu-opioid receptors. J. Neurosci. 25, 7754–7762.
Page 12 of 12 005236

Nocebo effects can make you feel pain:Negative expectancies derived from features of commercial drugs elicit nocebo effects
Luana CollocaUniversity of Maryland, School of Nursing and School of Medicine, Baltimore, C655 W. Lombard Street Suite 729, 21201 Baltimore, MD
The mysterious phenomenon known as the nocebo effect describes the effects of negative
expectancies. This is in contrast to positive expectations that trigger placebo effects (1). In
evolutionary terms, nocebo and placebo effects coexist to favor perceptual mechanisms that
anticipate threat and dangerous events (nocebo effects) and promote appetitive and safety
behaviors (placebo effects). In randomized placebo-controlled clinical trials, patients that
receive placebos often report side effects (nocebos) that are similar to those experienced by
patients that receive the investigational treatment (2). Information provided during the
informed consent process and divulgence of adverse effects contribute to nocebo effects in
clinical trials (1). Nocebo (and placebo) effects engage a complex set of neural circuits in the
central nervous system that modulate the perception of touch, pressure, pain and temperature
(1, 3, 4). Commercial features of drugs such as price and labeling influence placebos (5, 6).
On page 105 of this issue, Tinnermann et al. (7) show that price also impacts nocebo effects.
Tinnermann et al. evaluated the responses of healthy participants who received two placebo
creams labeled with two distinct prices and presented in two boxes that had marketing
characteristics for expensive and cheap medication. The creams were described as products
that relieve itch but induce local pain sensitization (hyperalgesia). All creams, including
controls, were identical and contained no active ingredients. Nocebo hyperalgesic effects
were larger for the “more expensive” cream than for the “cheaper” cream. Combined
cortico-spinal imaging revealed that the expensive price value increased activity in the
prefrontal cortex. Furthermore, brain regions such as the rostral anterior cingulate cortex
(rACC) and the periacqueductal gray (PAG), encoded the differential nocebo effects between
the expensive and cheaper treatments. Expectancies of higher pain-related side effects
associated with the expensive cream may have triggered a facilitation of nociception
processes at early subcortical areas and the spinal cord [which are also involved in placebo-
induced reduction of pain (8)]. The rACC showed a deactivation and favored a subsequent
activation of the PAG and spinal cord resulting in an increase of the nociceptive inputs. This
finding suggests that the rACC-PAG-spinal axis may orchestrate the effects of pricing on
nocebo hyperalgesia (see the figure).
The anticipation of forthcoming painful stimulation makes healthy study participants
perceive non-painful and low-painful stimulations as painful and high-painful, respectively
(9). Verbally-induced nocebo effects are as strong as those induced through actual exposure
to high pain (9). Moreover, receiving a placebo after simulating an effective analgesic
treatment compared to receiving the same placebo intervention after a treatment perceived as
ineffective produce a 49.3% versus 9.7% placebo induced pain reduction, respectively (10).
HHS Public AccessAuthor manuscriptScience. Author manuscript; available in PMC 2018 January 05.
Published in final edited form as:Science. 2017 October 06; 358(6359): 44. doi:10.1126/science.aap8488.
Author M
anuscriptA
uthor Manuscript
Author M
anuscriptA
uthor Manuscript
EXHIBIT A5-11
Page 1 of 4
~---1 IC~I
005237

The relationship between prior either unsuccessful or successful pain relief interventions and
placebo analgesic effects is linked to a higher activation of the bilateral posterior insulae,
and reduced activation of the right dorsolateral prefrontal cortex (11).
Informing patients that a treatment has been stopped, compared to a covert treatment
interruption, impacts the response to morphine, diazepan or deep brain stimulation in post-
operative acute pain, anxiety or idiopathic Parkinson’s disease, respectively (12). Patients
openly informed about the interruption of each intervention experience a sudden increase of
pain, anxiety or bradykinesia (a manifestation of Parkinson’s disease), whereas a hidden
interruption does not (12). Neuroimaging approaches support the clinical observation. For
example, the action of the analgesic, remifentanil, is over-ridden by activation of the
hippocampus that occurs when healthy participants that receive heat painful stimulations are
misleadingly told that the remifentanil administration was interrupted (13). These findings
provide evidence that communication of treatment discontinuation might at least in part,
lead to nocebo effects with aggravation of symptoms.
In placebo-controlled clinical trials, nocebo effects can influence patients’ clinical outcomes
and treatment adherence. The Lipid-Lowering Arm of the Anglo-Scandinavian Cardiac
Outcomes Trial shows that atorvastatin induced in the same individuals an excess rate of
muscle-related adverse events in the non-blinded (ie. patients knew they were taking
atorvastatin) non-randomized three year follow-up phase but not in the initial blinded five
year phase when patients and physicians were unaware of the treatment allocation
(atorvastatin or placebo) (14). Misleading information about side effects for statins via
public claims has led to treatment discontinuation and increased fatal strokes and heart
attacks (14).
Given that nocebo effects contribute to perceived side effects and may influence clinical
outcomes and patients’ adherence to medication we should consider how to avoid them in
clinical trials and practices (15). For example, nocebo effects might be reduced by tailoring
patient-clinician communication to balance truthful information about adverse events with
expectations of outcome improvement, exploring patients’ treatment beliefs and prior
negative therapeutic history, and paying attention to framing (ie, treatment description) and
contextual effects (ie, price). Through an understanding of the physiological mechanisms,
strategies could be developed to reduce nocebo effects.
Acknowledgments
This research is funded by the U.S. National Institutes of Health (NIDCR, R01DE025946, L.C.).
References
1. Colloca L, Miller FG. The nocebo effect and its relevance for clinical practice. Psychosom Med.2011; 73:598. [PubMed: 21862825]
2. Barsky AJ, Saintfort R, Rogers MP, Borus JF. Nonspecific medication side effects and the nocebophenomenon. JAMA. 2002; 287:622. [PubMed: 11829702]
3. Blasini M, Corsi N, Klinger R, Colloca L. Nocebo and pain: an overview of thepsychoneurobiological mechanisms. PAIN Reports. 2017; 2:e585. [PubMed: 28971165]
Colloca Page 2
Science. Author manuscript; available in PMC 2018 January 05.
Author M
anuscriptA
uthor Manuscript
Author M
anuscriptA
uthor Manuscript
EXHIBIT A5-11
Page 2 of 4005238

4. Tracey I. Getting the pain you expect: mechanisms of placebo, nocebo and reappraisal effects inhumans. Nat Med. 2010; 16:1277. [PubMed: 20948533]
5. Waber RL, Shiv B, Carmon Z, Ariely D. Commercial features of placebo and therapeutic efficacy.JAMA. 2008; 299:1016. [PubMed: 18319411]
6. Kam-Hansen S, et al. Altered placebo and drug labeling changes the outcome of episodic migraineattacks. Sci Transl Med. 2014; 6:218ra215.
7. Tinnermann A, Geuter S, Sprenger C, Finsterbusch J, Büchel C. Interactions Between Brain andSpinal Cord Mediate Value Effects in Nocebo Hyperalgesia. Science. 2017; 358:105. [PubMed:28983051]
8. Eippert F, Finsterbusch J, Bingel U, Buchel C. Direct evidence for spinal cord involvement inplacebo analgesia. Science. 2009; 326:404. [PubMed: 19833962]
9. Colloca L, Sigaudo M, Benedetti F. The role of learning in nocebo and placebo effects. Pain. 2008;136:211. [PubMed: 18372113]
10. Colloca L, Benedetti F. How prior experience shapes placebo analgesia. Pain. 2006; 124, 126
11. Kessner S, Wiech K, Forkmann K, Ploner M, Bingel U. The Effect of Treatment History onTherapeutic Outcome: An Experimental Approach. JAMA Intern Med. 2013; 1
12. Colloca L, Lopiano L, Lanotte M, Benedetti F. Overt versus covert treatment for pain, anxiety, andParkinson's disease. Lancet Neurol. 2004; 3:679. [PubMed: 15488461]
13. Bingel U, et al. The effect of treatment expectation on drug efficacy: imaging the analgesic benefitof the opioid remifentanil. Sci Transl Med. 2011; 3:70ra14.
14. Gupta A, et al. Adverse events associated with unblinded, but not with blinded, statin therapy in theAnglo-Scandinavian Cardiac Outcomes Trial-Lipid-Lowering Arm (ASCOT-LLA): a randomiseddouble-blind placebo-controlled trial and its non-randomised non-blind extension phase. Lancet.2017; 389:2473. [PubMed: 28476288]
15. Colloca L, Finniss D. Nocebo effects, patient-clinician communication, and therapeutic outcomes.JAMA. 2012; 307:567. [PubMed: 22318275]
Colloca Page 3
Science. Author manuscript; available in PMC 2018 January 05.
Author M
anuscriptA
uthor Manuscript
Author M
anuscriptA
uthor Manuscript
EXHIBIT A5-11
Page 3 of 4005239

Figure 1. Medication price and labeling create expectancies of side effects that can lead to nocebo
hyperalgesia that is in turn, mediated by an activation of the rACC-PAG-spinal cord
coupling.
Colloca Page 4
Science. Author manuscript; available in PMC 2018 January 05.
Author M
anuscriptA
uthor Manuscript
Author M
anuscriptA
uthor Manuscript
EXHIBIT A5-11
Page 4 of 4005240
Related Documents