Welcome message from author
This document is posted to help you gain knowledge. Please leave a comment to let me know what you think about it! Share it to your friends and learn new things together.
Transcript


UNIVERSITY OF ZAGREB FACULTY OF AGRICULTURE AGRICULTURAL ENGINEERING DEPARTMENT UNIVERSITY OF J. J. STROSSMAYER IN OSIJEK FACULTY OF AGROBIOTECHNICAL SCIENCES
UNIVERSITY OF MARIBOR FACULTY OF AGRICULTURE AND LIFE SCIENCES
AGRICULTURAL INSTITUTE OF SLOVENIA, LJUBLJANA INSTITUTE OF AGRICULTURAL ENGINEERING, BOKU,
VIENNA NATIONAL INSTITUTE FOR AGRICULTURAL MACHINERY,
INMA BUCHAREST CROATIAN AGRICULTURAL ENGINEERING SOCIETY
ACTUAL TASKS ON AGRICULTURAL
ENGINEERING
PROCEEDINGS
of the 48th International Symposium Zagreb, Croatia, 2nd – 4th March 2021
48th Symposium "Actual Tasks on Agricultural Engineering", Zagreb, Croatia, 2021
Published by University of Zagreb, Faculty of Agriculture Department of Agricultural Engineering, Svetošimunska 25, 10000 Zagreb, Croatia
Editors Technical editor
Igor Kovačev ([email protected]) Nikola Bilandžija ([email protected]) Igor Kovačev
Organising committee Đuro Banaj Mateja Grubor Nikola Bilandžija Dubravko Filipović Krešimir Čopec Igor Kovačev, Chairman Goran Fabijanić Stjepan Sito
Scientific committee Assist. prof. dr. Nikola Bilandžija, HR, Chairman
Prof. dr. Dumitru Mnerie, RO
Ing. Jaroslav Čepl, CSc., CZ Prof. dr. Joachim Mueller, DE Prof. dr. Aleksandra Dimitrijević, RS Prof. dr. Pietro Picuno, IT Assist. prof. dr. Đorđe Đatkov, RS Prof. dr. Stjepan Pliestić, HR Prof. dr. Dubravko Filipović Prof. dr. Egidijus Sarauskis, LT Prof. dr. Ettore Gasparetto, IT Prof. dr. John Schueller, USA Prof.dr. Ivo Grgić, HR Prof. dr. Peter Schulze-Lammers, DE Prof. dr. Andreas Gronauer, AT Prof. dr. Denis Stajnko, SI Dr. Viktor Jejčič, SI Prof. dr. Dumitru Tucu, RO Prof. dr. Silvio Košutić, HR Assist. prof. dr. Vjekoslav Tadić, HR Assist. prof. dr. Igor Kovačev, HR Assist. prof. dr. Peter Vindiš, SI Prof. dr. Miran Lakota, SI Dr. Valentin Vladut, RO Prof. dr. Milan Martinov, RS Prof. dr. Daniele De Wrachien, IT
ISSN 1848-4425 http://atae.agr.hr
Cover photo: Lanz Alldog, students’ project of restauration led by Zlatko Koronc All papers in the Proceedings are peer reviewed.
Papers from the Proceedings have been indexed since 1997 into databases: Clarivate Analytics: Web of Science Core Collection: Conference Proceedings Citation Index CAB International: Agricultural Engineering Abstracts

48th Symposium "Actual Tasks on Agricultural Engineering", Zagreb, Croatia, 2021
IN MEMORIAM Zlatko Koronc (14.8.1983. – 1.9.2020.)
Zlatko Koronc, dipl. ing., rodom iz Ivanić Grada, na Agronomskom fakultetu u Zagrebu diplomirao je 2009. godine na smjeru mehanizacija poljoprivrede. Cijeli svoj profesionalni vijek okrenut je radu u poljoprivredi te restauraciji poljoprivrednih strojeva i opreme. Na Zavod za mehanizaciju poljoprivrede dolazi 2017. godine na mjesto asistenta. Zloćudna bolest uzela je Zavodu jednog od najboljih koji bi sa sigurnošću - da ga bolest nije presjekla u mladoj dobi - napravio mnogo. S njim je otišao dio našega intimnoga i profesionalnoga života. Mehanizacija je bila njegov životni poziv. Sa zadivljujućim entuzijazmom i vedrinom sudjelovao je u znanstvenim i stručnim aktivnostima. Održavao je nastavu na preddiplomskim studijima,
brinuo je za razvoj struke, pomagao je novim naraštajima istraživača preko izvannastavne aktivnosti „Mehanizatorska grupa“, u sklopu koje je obnovljen i Lanz Alldog prikazan na naslovnici. Mladi čovjek, velikog srca, uvijek nasmijan i spreman na razgovor, sa zlatnim rukama koje su mogle otkloniti bilo koji kvar, Zlatko nam je bio i kolega i prijatelj. Zauvijek nosimo u sebi ono čime nas je ljudski i profesionalno obogatio. Bio je omiljeni član kolektiva koji je poticao druge na optimizam i pozitivna razmišljanja, ali iznad svega bio je VELIK ČOVJEK. Pamtit ćemo ga po njegovoj dobroti i požrtvovnosti te kao nesebičnog i dragog mladog čovjeka kojemu osmijeh nije silazio s lica. Duboko zahvalni na njegovoj plemenitosti, upućujemo mu posljednji pozdrav. Zlatko Koronc, M.Sc. ing. born in Ivanić Grad, graduated from the Faculty of Agriculture in Zagreb in 2009 in the field of agricultural mechanisation. Throughout his professional life he worked in agriculture, focusing on restoration of agricultural machinery and equipment. In 2017, he joined the Department of Agricultural Engineering as an assistant. A malignant disease took one of the best people from the Department. He was a person who surely would have accomplished much had his life not been cut short. We have lost a part of our personal and professional lives with him, and we have lost a person for whom mechanisation was a life's work. He participated in scientific and professional activities with amazing enthusiasm and cheerfulness. He taught undergraduate courses, worked to develop the profession, and helped new generations of researchers through an extracurricular activity called the Mechanisation Group, where Lanz Alldog, presented on the cover page, was restored. A young man with a big heart, talkative and always smiling, with golden hands that could fix any malfunction. Zlatko was both our colleague and a friend. We will forever carry the experience and knowledge with which he enriched both our professional and personal lives. He was a beloved member of the collective who encouraged others to be optimistic and positive, but most of all he was a GREAT MAN. We will remember Zlatko for his kindness, hard work, selflessness and the smile that never left his face. With deep gratitude for his nobility, we send our last regards to him.
Počivao u miru / Rest in peace
Mateja Grubor and employees of the Department of Agricultural Engineering Zagreb, 16.02.2021.

48th Symposium "Actual Tasks on Agricultural Engineering", Zagreb, Croatia, 2021
PREFACE
Dear colleagues, Dear readers, The 48th edition of Actual Tasks on Agricultural Engineering is unique in the long tradition
of this Symposium. Due to the worldwide Corona pandemic, this year's symposium was organized exclusively online. This deprived it of an important component, because in addition to the scientific aspect, such gatherings provide an opportunity to establish contacts with researchers from different scientific fields, as well as to make friends.
From the very beginning, in the early 70s of the last century, the ATAE symposium focused on actual and future trends in the development of agricultural engineering in the function of increasing the quality and efficiency of agricultural production. Thus, the main theme of this year's symposium, Agriculture 4.0, focuses on new technologies brought by informatization and automation in all branches of Agricultural and Biosystems engineering.
It is the modern technologies that enable us to work in these difficult and restrictive times. We the hope that this online format will meet the criteria of the scientific community that gathers around the ATAE symposium. And for the quality of the content of the Proceedings, the authors of 56 papers from 10 countries are acknowledged, including: Bulgaria 1, Croatia 10, Czech Republic 1, Germany 11, Italy 2, Lithuania 3, Romania 17, Serbia 3, Slovenia 7, and Thailand 1.
The scientific importance of the ATAE symposium is assessed by the fact that papers from the Proceedings have been indexed since 1997 into databases: Clarivate Analytics: Web of Science Core Collection - Conference Proceedings Citation Index and CAB International - Agricultural Engineering Abstracts.
I would like to thank all authors, reviewers and especially the members of the Organising and Scientific Committees for their efforts in making this conference possible. A special gratitude for the support we express to the international professional associations, CIGR (International Commission of Agricultural and Biosystems Engineering) and EurAgEng (European Society for Agricultural Engineers), as well as the other co-organizers of the symposium.
I hope that at the next ATAE symposium in 2023, we will gather again in person and make a toast with a glass of wine from the cellars of the Faculty of Agriculture in Zagreb.
Zagreb, March 2021 Igor Kovačev, editor

48th Symposium "Actual Tasks on Agricultural Engineering", Zagreb, Croatia, 2021
CONTENTS
Peter SCHULZE LAMMERS, Milan MARTINOV, Andreas GRONAUER, Silvio KOŠUTIĆ ............................................................................................................. 11 Agriculture 4.0 – Challenge for Agricultural and Biosystems Engineering
Heinz BERNHARDT, Mehmet BOZKURT, Eduardo COLANGELO, Jan HORSTMANN, Martin KRAFT, Johannes MARQUERING, Thilo STECKEL, Heiko TAPKEN, Cornelia WELTZIEN, Clemens WESTERKAMP ........................... 19 Industry 4.0 - The next stage of agricultural technology?
Maximilian TREIBER, Heinz BERNHARDT ............................................................... 27 The NEVONEX ecosystem – Implications of an IoT framework on automation in the agricultural machinery sector
Jochen Georg WIECHA, Kathrin L. M. ZIEGLER, Heinz BERNHARDT ................ 35 Draft force reduction by an electrification-unit on implements
Peter LEPEJ, Jurij RAKUN .......................................................................................... 41 An overview of an autonomous farm robot software architecture
Eglė JOTAUTIENĖ, Antanas JUOSTAS ...................................................................... 51 Automatic steering of combine harvester for agricultural and environmental monitoring
Erik RIHTER, Damijan KELC, Denis STAJNKO, Peter VINDIŠ, Peter BERK, Peter POLIČ, Miran LAKOTA, Jurij RAKUN ............................................................ 59 The state of precision agriculture in Slovenia in comparison to four Central European countries
Matthias STETTMER, Franz-Xaver MAIDL, Jürgen SCHWARZENSTEINER, Kurt-Jürgen HÜLSBERGEN, Heinz BERNHARDT ................................................... 69 Sustainability of site-specific fertilization systems
Vlad MĂRĂZAN, Antoanela COZMA, Rareş HĂLBAC - COTOARĂ – ZAMFIR .. 77 Designing a common framework for climate change impact assessment in agriculture for the western part of Romania
Rares HALBAC-COTOARA-ZAMFIR, Cristina HALBAC-COTOARA-ZAMFIR ... 87 A brief analysis of drought in western Romania based on SPI 3M evolution
Atanas ATANASOV, Ivaylo HRISTAKOV, Mihail MILCHEV, Milan KOSZEL, Dario KNEŽEVIĆ .......................................................................................................... 99 Influence of local climatic factors on sunflower inflorescence visit by honey bees

48th Symposium "Actual Tasks on Agricultural Engineering", Zagreb, Croatia, 2021
Aleksandra DIMITRIJEVIĆ, Carmela SICA, Ilija KAMENKO, Zoran MILEUSNIĆ, Rajko MIODRAGOVIĆ ........................................................... 109 Greenhouse decision support model and its web-based application
Dan CUJBESCU, Iuliana GĂGEANU, Cătălin PERSU, Mihai MATACHE, Iulian VOICEA, Gabriel GHEORGHE, Ion MURGESCU ........................................ 119 Operation and design simulation of the photovoltaic system for smart greenhouses
Roberto PUGLISI, Dina STATUTO, Pietro PICUNO................................................ 131 Effects of greenhouse lime shading on filtering the solar radiation
Prud NETSAWANG, Lutz DAMEROW, Peter SCHULZE LAMMERS ................. 141 Use of laser radiation as an alternative technique for selective blossom thinning in apple
Peter BERK, Andreja URBANEK KRAJNC, Denis STAJNKO, Peter VINDIŠ, Damijan KELC, Miran LAKOTA, Aleš BELŠAK, Tomaž POJE, Matej SEČNIK ............................................................................................................. 151 Digital evaluation of the green leaf wall area of the vine in the "Yellow Muscat" variety
Denis STAJNKO, Peter VINDIŠ, Damijan KELC, Miran LAKOTA, Jurij RAKUN, Peter BERK ........................................................................................ 161 3D evaluation of apple tree canopies based on the LIDAR sensing system
Damijan KELC, Peter VINDIŠ, Erik RIHTER, Jurij RAKUN, Peter BERK, Denis STAJNKO, Miran LAKOTA ............................................................................. 169 Monitoring the condition of rapeseed plants using UAVs to determine the NDVI index
Gabriele DAGLIO, Damiano ZAMPIERI, Raimondo GALLO, Fabrizio MAZZETTO .................................................................................................. 179 New solution to harvest cereals in high mountain-Alpine region: first test with a stripper machine
Gheorghe VOICU, Gabriel-Alexandru CONSTANTIN, Paula TUDOR, Elena-Madalina STEFAN ............................................................................................ 189 Mathematical modeling of material movement on the sieves of the cleaning system at the cereal combine harvester
Theresa ERTL, Maximilian TREIBER, Heinz BERNHARDT .................................. 201 Ginger production in Europe and Asia – a comparison of cultivation methods
Catalina STAN (TUDORA), Adriana MUSCALU, Gabriel-Valentin NAE, Carmen POPESCU, Floarea BURNICHI, Valentin Nicolae VLADUT ..................... 209 Technological aspects regarding Holy Basil (Ocimum Sanctum L., Fam. Lamiaceae) cultivation and essential oil production
Petru CARDEI, Radu CIUPERCA, Adriana MUSCALU, Sebastian MURARU ..... 219 Planting errors in the exploitation of seedling planters, causes and improvement solutions

48th Symposium "Actual Tasks on Agricultural Engineering", Zagreb, Croatia, 2021
Edvardas VAICIUKEVIČIUS, Rolandas DOMEIKA, Egidijus ŠARAUSKIS, Algirdas JASINSKAS, Paulius JASEVIČIUS, Kęstutis ROMANECKAS ................ 229 Research of pea seed sorting in the sloping air flow
Adrian Doru PICA, Florinel BOJA, Alin TEUŞDEA, Ciprian FORA, Mihaela MOATAR, Nicuşor BOJA ............................................................................. 237 The usage motor drill in forestry planting
Tomaž POJE, Viktor JEJČIČ ...................................................................................... 249 Oil extraction from rapeseed with screw press for small scale production
Josef J. BAUERDICK, Berenike KRÖCK, Maximilian TREIBER, Heinz BERNHARDT .................................................................................................... 255 The future of pasture management in Germany – aspects of technology and regulation
Christoph KREITENWEIS-EISGRUBER, Heinz BERNHARDT............................. 265 Development of sustainable solutions for the construction of cowsheds in Bavaria
Martin HÖHENDINGER, Agnes SIXT, Maximilian TREIBER, Heinz BERNHARDT .................................................................................................... 271 Heatstress indices for automated climate control systems dairy cowshed
Radu ROŞCA, Petru CÂRLESCU, Virgil VLAHIDIS ............................................... 281 Assessment of the constructive properties of some milking liners and their effect over the pulsation cycle
Kathrin L. M. ZIEGLER, Jochen G. WIECHA, Heinz BERNHARDT .................... 293 Concept study of a cooling system for fattening pigs with heat recovery by conductivity
Mariana FERDEȘ, Bianca - Ștefania ZĂBAVĂ, Mirela DINCĂ, Georgiana MOICEANU, Mariana IONESCU ............................................................ 303 The effect of ozone on certain yeasts in wastewater
Cristian SORICĂ, Valentin VLĂDUŢ, Ion GRIGORE, Mario CRISTEA, Elena SORICĂ, Ion PIRNĂ, Dragoș PREDA, Bogdan DURAN ................................ 311 Technical performances of a portable UV-C device used for the decontamination of various working spaces
Željko JUKIĆ, Igor KOVAČEV, Nikola BILANDŽIJA, Zlatko KORONC, Ivan SMILJANOVIĆ ................................................................................................... 321 Corn stover management on family farm
Željko JUKIĆ, Igor KOVAČEV, Lepomir ČOGA, Zlatko KORONC, Ana MATKOVIĆ, Antun ZMAIĆ ............................................................................... 331 Potential and actual quantities of wheat straw that can be collected on family farm
Davor PETROVIĆ, Đuro BANAJ, Anamarija BANAJ, Dario KNEŽEVIĆ, Vjekoslav TADIĆ ......................................................................................................... 341 The use of sensor technology in crop protection

48th Symposium "Actual Tasks on Agricultural Engineering", Zagreb, Croatia, 2021
Andreas CHRIST, Oliver SCHMITTMANN, Peter SCHULZE LAMMERS ........... 347 Plant differentiation with truecolor arrays for online precision plant protection
Jaroslav ČEPL, Pavel KASAL, Andrea SVOBODOVA ............................................. 361 Potato weed management in condition of technology of destoned ridges
Indrė BRUČIENĖ, Domantas ALELIŪNAS, Egidijus ŠARAUSKIS ........................ 371 Time and costs analysis of different non-chemical weed control methods in sugar beet
Josip LAKIĆ, Igor KOVAČEV, Dubravko FILIPOVIĆ, Mateja GRUBOR ............ 381 Influence of different weed control methods on soybean yield
Peter BERK, Andrej PAUŠIČ, Denis STAJNKO, Andreja URBANEK KRAJNC, Peter VINDIŠ, Damijan KELC, Aleš BELŠAK, Danijela KOSI, Mario LEŠNIK .... 389 Efficiency of alternative weed control systems in the vineyard
Vjekoslav TADIĆ, Đuro BANAJ, Dario KNEŽEVIĆ, Anamarija BANAJ, Davor PETROVIĆ, Juraj SABLJAK .......................................................................... 401 Technical inspection of crop protection machines according to HRN EN ISO 16122:2015
Tajana KRIČKA, Mateja GRUBOR, Dijana VICAN, Ana MATIN ......................... 409 Influence of drying air temperature on maize grain breakage
Ana MATIN, Tajana KRIČKA, Tugomir MAJDAK, Astrid SARAPA, Mateja GRUBOR, Igor KOVAČEV ............................................................................ 415 Influence of drying on physical and energy properties of pistachio shell
Adriana ISTUDOR, Gheorghe VOICU, Gheorghe MUSCALU ................................ 425 Wheat dough proving process analysis using the carbon dioxide concentration
Neven VOĆA, Nikola BILANDŽIJA, Anamarija PETER, Jona ŠURIĆ, Tajana KRIČKA .......................................................................................................... 435 Potential of biogas generation from processing grape by-products
Oana-Diana CRISTEA, Luminiţa CATANĂ, Carmen BRĂCĂCESCU, Carmen BĂLŢATU, Laurenţiu VLADUŢOIU, Iulia GRIGORE, Nicoleta UNGUREANU ................................................................................................ 445 Processing methods of wine by-products to obtain grape seed oil and grape seed flour as functional ingredients for food fortification
Mateja GRUBOR, Ana MATIN, Nikola BILANDŽIJA, Sandra BISCHOF, Vanja JURIŠIĆ, Mislav KONTEK, Tajana KRIČKA ............................................... 455 Miscanthus and maize stalk as source for green energy production
Anamarija GUDELJ VELAGA, Nikola BILANDŽIJA, Mateja GRUBOR, Zorana KOVAČEVIĆ, Tajana KRIČKA ................................................................... 463 Energy utilisation of biofibre production residues – circular economy approach
48th Symposium "Actual Tasks on Agricultural Engineering", Zagreb, Croatia, 2021
Aleksandar NESTEROVIC, Djordje DJATKOV, Miodrag VISKOVIC, Milan MARTINOV ...................................................................................................... 473 Airborne emissions from agricultural biomass combustion in the city of Novi Sad
Ranko KOPRIVICA, Biljana VELJKOVIĆ, Dušan RADIVOJEVIĆ, Zoran MILEUSNIĆ, Dragoslav ĐOKIĆ, Dragan TERZIĆ, Tatjana DEDIĆ ........... 483 Seasonal performance of shared agricultural machinery in machinery ring
Nicolae LONTIS, Dumitru TUCU, Gabriel MALAIMARE, Ioan-Vasile GROZA ... 493 Simulation model of agricultural transport units behaviour on public roads
Ileana TOMOIAGA, Alexandra SUTA, Iasmina DIMCEA, Titus SLAVICI, Roxana BALINT, Florin NEDELCU, Lavinia CERNESCU MIHALI, Cristina SIRBU ............................................................................................................. 501 Artificial intelligence methods for sustainable agribusiness involving pellets
Alexandra SUTA, Ileana TOMOIAGA, Iasmina DIMCEA, Ștefan-Alfred MARIS, Roxana BALINT, Evelyne POP, Titus SLAVICI ........................................................ 513 Innovative results concerning optimized recipes for heat pellets
Alexandru TUCU, George Catalin CRISAN, Dumitru TUCU, Alexandru VASILICA .................................................................................................. 521 Motivational factors in systems of occupational risk management in agriculture
Alexandru TUCU, Anca-Alexandra PURCAREA, George Catalin CRISAN, Alexandru VASILICA, Dumitru TUCU ...................................................................... 527 Quality evaluation of occupational health & safety (OHS) risk management systems from agriculture

48th Symposium "Actual Tasks on Agricultural Engineering", Zagreb, Croatia, 2021
11
AGRICULTURE 4.0 – CHALLENGE FOR AGRICULTURAL AND BIOSYSTEMS ENGINEERING
Peter SCHULZE LAMMERS1, Milan MARTINOV2*, Andreas GRONAUER3, Silvio KOŠUTIĆ4
*E-mail of corresponding author: [email protected] 1 University of Bonn, Institute of Agricultural Engineering,
Regina-Pacis-Weg 3, 53113 Bonn, Germany 2 University of Novi Sad, Faculty of Technical Sciences, Department of Environmental Engineering,
Trg Dositeja Obradovića 6, Novi Sad, Serbia 3 University of Natural Resources and Life Sciences, Institute of Agricultural Engineering,
Peter-Jordan-Straße 82, 1190 Vienna, Austria 4 University of Zagreb Faculty of Agriculture, Department of Agricultural Engineering,
Svetošimunska c. 25, 10000 Zagreb, Croatia
SUMMARY
This manuscript reveals and describes origin and challenges of agriculture and biosystems engineering branch due to appearance of a new technological system named Agriculture 4.0, Authors also emphasize multidisciplinary-sustainable approach in recognition, analysing and solving issues that respect basic objectives and complexity of Agriculture 4.0.
Keywords: Agriculture 4.0, circular bioeconomy, agriculture and biosystems engineering, sustainable agriculture
INTRODUCTION
The term Industry 4.0 was introduced during the Hanover Industrial Fair in 2011th and means the introduction of cyber-physical systems. During 2017th meeting of Club of Bologna, a world’s task force on the strategies for the development of agricultural mechanization (www.clubofbologna.org), was declared, Agriculture 4.0. Both terms are based on digitalization of processes, technologies and machinery and information technologies.
However, the major strategic goal of agriculture and, consequently agricultural mechanization, is sustainability in food supply chains and their sustainable development. Digitalization must be, in this regard, understood as a usable tool to obtain it. Actors in
48. ACTUAL TASKS ON AGRICULTURAL ENGINEERING
Review paper

P. Schulze Lammers, M. Martinov, A. Gronauer, S. Košutić
12
agriculture primarily need functional, affordable and reliable machinery, on a high technological readiness level. Inadequate digitalize machinery can cause aversion of end-users against information technologies. Therefore, a multidisciplinary approach is obligatory, whereby agricultural and biosystems engineers should play a main role as well.
Here is discussed the role of agricultural and biosystems engineering in the process of digitalization, now and in future. The objective of the article is also to motivate experts in the field of agricultural engineering and adjacent professions on this issue, for discussion and creation of conclusions and recommendation for it.
AGRICULTURE 4.0
Agriculture 4.0 is a wide issue, but the main objective should be to enable sustainable development, including food security. United Nations members accepted, in 2015, 2030 Agenda for Sustainable Development Goals (SDG).
Food and Agriculture Organization (FAO) stated the following strategic objectives (Anonymous, 2015):
- Help eliminate hunger, food insecurity and malnutrition. - Make agriculture, forestry and fisheries more productive and sustainable. - Reduce rural poverty. - Enable inclusive and efficient agricultural and food systems. - Increase the resilience of livelihoods to threats and crises. Consistent with this, out of 17 SDGs for agricultural and biosystems engineering are
relevant following (citation): 2. End hunger, achieve food security and improve nutrition and promote sustainable
agriculture. Increase of productivity, food safety and quality. 7. Ensure access to affordable, reliable, sustainable and modern energy for all. Biomass, two thirds of this comes from agriculture and accounts for over 60 % of the
country's renewable energy potential. Recently, there has been a focus on the use of agricultural products and by-products for non-food goods, the bioeconomy.
12. Ensure sustainable consumption and production patterns. This goal is under development, mostly by supporting circular economy. 13. Take urgent action to combat climate change and its impacts. Savings of energy and introduction of good agricultural practice and organic production
is strongly focused and supported. 15. Protect, restore and promote sustainable use of terrestrial ecosystems, sustainably
manage forests, combat desertification, and halt and reverse land degradation and halt biodiversity loss.
About this aspect is now discussed, but concrete actions still missing, especially regarding the preservation of agricultural land fertility.

Agriculture 4.0 – Challenge for Agricultural and Biosystems Engineering
13
European Union focuses bioeconomy and circular bioeconomy, and these, for sure, closely includes activities in the field of agriculture and biosystems engineering. Recently is also promoted the European Green Deal (Anonymous, 2019), which means the production of renewable energies and feedstock based on agriculture and related activities, in order to reduced dependence on hydrocarbon based on fossil sources. A lot of new challenges for biosystems and agricultural engineering.
AGRICULTURAL AND BIOSYSTEMS ENGINEERING, A&BE
Mechanization in agriculture and agricultural engineering are well known and used terms. At the end of the last century a new term emerged, Biosystems Engineering. This denomination integrates engineering science and design with agricultural, applied biological, and environmental issues. It should include economic and social aspects, as well. Further are listed definitions of Biosystems Engineering, and give examples of use of this term.
In Europe, according to Erabee Network (www.erabee.aua.gr), Biosystems Engineering is a field of engineering which integrates engineering sciences and design with applied biological, environmental, forest and agricultural sciences. It represents an evolution of the Agricultural Engineering discipline applied to humanoid processes with living organisms, not including biomedical applications. Therefore, Biosystems Engineering is the branch of engineering that applies engineering sciences to solve problems involving biological systems.
Biosystems Engineering includes many engineering disciplines, but have respect for diverse sciences, e.g. physics, chemistry, agropedology and others. A&BE is, as well, consistent with the three basic components of sustainability: environmental, economic and social. It is related not only for farming, but for post harvesting and even food processing. The following schematic figure is a kind of exaggeration.
Figure 1 Biosystems Engineering complexity illustration
Nowadays, the most significant domains of biosystems engineering are related to
environmental protection and information technologies.

P. Schulze Lammers, M. Martinov, A. Gronauer, S. Košutić
14
The former Journal of Agricultural Engineering Research changed the name into Biosystems Engineering. The journal is closely connected to EurAgEng, has a high reputation. Nearby traditional agricultural engineering disciplines are strongly oriented toward Automation and Emerging Technologies, Information Technology, Human Interface and Rural Development (including renewable energy; pollution control; protection of the rural environment; infrastructure and landscape; sustainability).
CIGR transform its name to International Commission of Biosystems and Agricultural Engineering. Due to different approaches and interpretation, this global organization kept also term agricultural engineering.
In the last decade, ASAE (American Society of Agricultural Engineers) converted its traditional name to American Society of Agricultural and Biological Engineers, ASABE. ASABE recently began with development of the textbook Introduction to Biosystems Engineering. Some tentative chapters are (December 2020), available on the web for free. The book consists of the following chapters:
- Energy Systems. - Information Technology, Sensors, and Control Systems. - Machinery Systems. - Natural Resources and Environmental Systems. - Plant, Animal, and Facility Systems. - Processing Systems. The previous term agricultural engineering is still used by many stakeholders. This, and
the name of CIGR, is the reason to use, further in this text, the term Agricultural and Biosystems Engineering, or abbreviation A&BE.
A&BE CONTRIBUTION
The first green revolution can be defined as a substitution of manual labour in agriculture by mechanical operations declared as mechanization. This substitution started for operations with stressful manual labour e.g. tillage, reaping of grass and cereals and transport of agricultural goods from a field to the farm. Mechanization became more efficient by automatization of operations. The digitalization enabled advancement in conventional operations by more precise and ubiquitarian available information with quick access. However, fieldwork and on-farm actions are still physically based and must be performed mechanically.
Weed control is a proper example of a challenging field operation. Mechanical hoeing and herbicide applications are the current standards but a lot of efforts have been done to invent more effective and environmentally sound solutions. Digital instruments through plant recognition and classification as well as geo-referencing are widely used technology. But still, effectors are needed for the final step in weed control. Innovative solutions are spot spraying and removing weeds by hoeing undesirable plants between the crop rows and in the rows. Only the combination of engineering and digital measures promises successful solutions.
In conventional livestock farming, manual operations e.g. feeding, milking are increasingly substituted by digital tools supported automation. Automation means physical manipulation, technically implemented by mechanization that is a classical domain of

Agriculture 4.0 – Challenge for Agricultural and Biosystems Engineering
15
AE&E, examples are milking robots and feeding systems. Furthermore, livestock farming is a huge source of data which can be recorded stationary or when sensed on the individual animal transferred on short distances and processed stationary on farm. The latter is a domain of electronics and digitalization.
Feed production from grass (fodder or grass silage) on arable land technically underwent a similar evolution like crop farming. So, silage maize harvesting by forage harvester is technological process include sensing technology, e.g. continuous sensing of forage mass flow, moisture content of harvesting mass and chop length.
A major progress in implementation of digital technologies took place in tractor management. The most successful feature (as sales option) for tractors is the automatic guidance system which became almost a regular option for tractors with high power. The system is based on GPSS/GNSS for annotation of the current vehicle`s coordinates together with navigation software. Navigation of tractors is a smart task that cannot be achieved fully by automated functions. A key mission of tractors is driving in fields on parallel tracks. This feature can be automated in favour of driver’s comfort which means less driver’s working load with monotonous action. And the accuracy of field operations is enhanced by avoiding overlapping of tracks, when working with implements of constant working width. A crucial section of the system is the hardware of tractor steering. An effector is needed which is available as hydraulic steering allowing stable navigation of the vehicle even under off-road conditions. This part cannot be covered only digitally but need fundamental engineering knowledge on vehicle dynamics. Only together, the digital and mechanical features of an automated steering systems provide a reliable tractor option for farmers.
As increasing machine power and capacity are still the most economical way of producing food and feed in agriculture in the last decades (Pichelmaier, 2018). This trend in mechanization requests high investments which in consequence call for reliable operations of the farm machinery. Equipment manufacturers therefore spent high efforts to design machines with high performance in combination with high efficiency and save maintenance. However, use of big tractors and machinery is profitable only on big plots.
Latter is a topic of reliability of the machines as a system and of durability of the parts comprising the machines. To increase reliability, maintenance of the machines is crucial to ensure reliable mission during seasonal operations e.g. harvest of cereals by combines, a mission of the machines without failure and breakdowns. The current approach is driven by the manufacturers creating telemetric monitoring systems which are a combination of sensors in the machines and online data transfer via wireless networks. In this way maintenance of the machines is improved by providing current information about wear of parts, failure diagnosis and analysis of machine time history data. Services of the manufacturers become more professional with a faster diagnosis of failures and quick supply of parts aiming at reducing the time of fall-out and lower cost by provisional maintenance. For this case, study digitalization is a precondition providing connectivity, but fundamental engineering knowledge is needed for the diagnosis and repair of the machines.
The same situation as exemplified in the previous text is for tillage, sowing, fertilizer broadcasting and pesticide applications, as well as for harvest of food and feed crops. Livestock farming is characterized in many work processes by repetitive monotonous activities, which require for future progress a special combination of process engineering and informatics. In all agricultural processes (crop- and livestock farming) digitalization will bring progress but the physical operations need to be adapted to the new information

P. Schulze Lammers, M. Martinov, A. Gronauer, S. Košutić
16
technologies. Even though digitalization is the driving force of innovation nowadays, a successful system can only be put into operation for the benefit of agriculture in combination with professional engineering.
ROLE OF A&BE IN AGRICULTURE 4.0
Now, on the World and European Union levels, are strong supported innovations. However, developed new technologies, services and products should be in line with declared sustainability principles. Further, these technologies should be applicable regarding functionality in a common environment and affordable for users, concerning capital and operational expenses (CAPEX, OPEX). This means they should have adequate commercial maturity, i.e. be on desirable, Technology Readiness Level, –TRL.
A team of scientists and other experts can develop new products up to TRL 5 – Technology validated in a relevant environment, or, maximum, to TRL 6 – Technology demonstrated in a relevant environment. (European Union Technology Readiness Level scale, from TRL 1 till TRL 9, https://enspire.science/trl-scale-horizon-2020-erc-explained/.) In this process assistance of agricultural experts are also needed, i.e. A&B and other engineers. Further, to bring technology or machinery to TRL 9 – Actual system proven in an operational environment. Only after reaching this readiness level is the technology or machine commercially and practically ready for use. For this process contribution of previously mentioned players is also needed, including economists, and sometimes, sociologists.
As it has been declared for industry, forth revolution means Cyber Physical Systems. Of course, this implies Information and Communication Technologies (ICT or IT) which are efficient tools to obtain the stated goal.
IT, like in whole human activities, are already long time applied in agriculture in business, communications, information and production. The same is true for machinery. CIGR and ASAE (now ASABE) supported this with handbook (Munack (Ed,), 2006). Most of biosystems and agricultural engineers have, nowadays, at least basic knowledge of IT. They are qualified to understand and use IT for many tasks.
IT engineers and experts are now sought and favoured. They should have understanding for the complexity of farming and importance of other specializations, like this was demonstrated for A&BE. Who should take the leading position in process of development of new technology or machines? This is less important, but it is very important to understand that a multidisciplinary approach is needed. If not, a good result will not be reached.
Human manipulation is the anthropogenic impact on A&BE and is the discipline to control a biological system using technology, improving the economy for the benefit of society. The term A&BE includes all elements relevant for Agriculture 4.0. Digitalization does not substitute mechanization, or better A&BE.
Highlights: Advanced education in IT, should be included in the education process of agricultural and biosystems engineers, on the vocational and high education level. Additional, life-long education for all, from farmers to priory educated engineers, is an important issue as well. The same is an important task for agricultural extension services too.

Agriculture 4.0 – Challenge for Agricultural and Biosystems Engineering
17
CONCLUSIONS
Digitalization, is, nowadays, a dominant trend in agriculture, called also Agriculture 4.0. However, it may not be forgotten, that this must serve efforts of constant aspiration toward sustainable agriculture. This includes a new role of agriculture in circular bioeconomy and European Green Deal.
Agricultural and Biosystems Engineering has, and will have, inevitably role in this process. It should be, like until now, be an important part of multidisciplinary teams, having especial role in the development of new, innovative, technologies, machinery and similar. However, education in this domain should be restructured, in order to improve knowledge and skills of engineers, already educated and future in the sector of digitalization.
REFERENCES
Anonymous. (2015). FAO and the 17 Sustainable Development Goals. Food and Agriculture Organization of the United Nations, Rome.
Anonymous. (2018a). Bioeconomy: the European way to use our natural resources – Action plan. European Commission, Brussels.
Anonymous. (2018b). The circular economy and the bioeconomy – Partners in sustainability. European Environment Agency, Publications Office of the European Union, Luxembourg.
Anonymous. (2019). Communication from the Commission to the European Parliament, the European Council, the Council, the European Economic and Social Committee and the Committee of the Regions, The European Green Deal. European Commission, Brussels.
Munack, A. (Ed.). (2006). CIGR Handbook of Agricultural Engineering Volume VI: Information Technology. American Society of Agricultural Engineers, St. Joseph, Michigan.
Pichelmaier, B. (2018). Trends and new Technologies for Agricultural Machinery. AGCO – Germany, 28th Club of Bologna Members’ Meeting, Session 2–KNR 2.1 Bologna, 10-11 November 2018.


48th Symposium "Actual Tasks on Agricultural Engineering", Zagreb, Croatia, 2021
19
INDUSTRY 4.0 - THE NEXT STAGE OF AGRICULTURAL TECHNOLOGY?
Heinz BERNHARDT1*, Mehmet BOZKURT2, Eduardo COLANGELO3, Jan HORSTMANN4, Martin KRAFT5, Johannes MARQUERING6, Thilo STECKEL7,
Heiko TAPKEN8, Cornelia WELTZIEN9, Clemens WESTERKAMP8 *E-mail of corresponding author: [email protected]
1 Technische Universität München, Freising, 2 VDI, Düsseldorf, 3 Fraunhofer IPA, Stuttgart, 4 Krone, Spelle, 5 Johann Heinrich von Thünen-Institut, Braunschweig, 6 Jade Hochschule, Wilhelmshaven, 7 CLAAS E-Systems, Dissen a.T.W.,
8 Hochschule Osnabrück, Osnabrück, 9 ATB Potsdam, Potsdam
ABSTRACT
Industry 4.0 is currently considered a structural implementation of networked and cooperative digitisation. It is now to be investigated to what extent these structures are also suitable for agriculture and whether approaches to this already exist. To this end, the key points of Industry 4.0 will be analysed in order to subsequently test them using agricultural examples.
Many approaches of Industry 4.0 can also be used for Agriculture 4.0. In some cases, adjustments will have to be made because agriculture has a different basic structure. As with use in industry, it is also apparent in agriculture that there is still a need for action in networking systems.
Keywords: digitisation, industry 4.0, agriculture 4.0
INTRODUCTION
The terms industry 4.0 and agriculture 4.0 are currently the subject of much public debate on the future development of the sectors. However, a more detailed analysis shows that both the content of the individual terms and their possible interrelationships are not sufficiently clarified. In many cases, everyone associates them with his or her own image and imagination (Schmidt, 2018; Rase and Chilvers, 2018; Ozdogan et.al., 2017). As a result, although everyone uses the same term, very different ideas are associated with it. This is a very poor basis for a common orientation that the pair of terms is intended to achieve (Weltzien, 2016).
Here, a structure is to be created within the framework of a VDI/VDE guideline committee on the subject of "State of Industrial Use 4.0 - Technologies in Agricultural Engineering". The discussion comprises several stages. It is based on the current understanding of the term
48. ACTUALTASKS ONAGRICULTURAL ENGINEERING
Review paper

H. Bernhardt, M. Bozkurt, E. Colangelo, J. Horstmann, M. Kraft, J. Marquering, T. Steckel, H. Tapken, ...
20
Industry 4.0 with its structure and objectives. In the transition from Industry 4.0 to agriculture, the sectoral differences between industry and agriculture must be analysed in order to determine the direction of the degree of mechanisation. Based on this, the current state of the structures of Industry 4.0 in agriculture will be presented in practice and theory using various examples from arable and livestock farming. Overall it is shown that in many cases a largely coordinated understanding of the terms used by the respective group is necessary (Rojko, 2017).
History of terms The term "Industry 4.0" became widely known with the Hannover Fair 2013. It goes back
to an initiative of the Federal Government in 2011 (Kagermann et.al., 2011). To date there is still no binding definition of the term "Industry 4.0", but a generally accepted understanding is emerging (Müller et.al., 2017; Saurabh et.al. 2018; Frank, 2019). The term "Agriculture 4.0" has developed from this. However, this term is even more difficult to grasp. So far, "Agriculture 4.0" has been little more than a kind of advertising slogan, claiming state-of-the-art IT and production concepts and techniques for agriculture. Often "Agriculture 4.0" is just a new coat that means digital techniques in agriculture and precision farming, as in Roland Berger Focus - Agriculture 4.0 (Aulbur et.al., 2019). In order to find a sound definition of "Agriculture 4.0" as a revolutionary stage of agricultural production, first the generations 1.0 to 3.0 of agriculture have to be defined, and then the revolution that led to 4.0 has to be described as a second step - if there is a revolution at all that justifies a new generation 4.0. Due to the lack of such a historical clarification, the term "Agriculture 4.0" is avoided in this paper. Some authors already see an upcoming "Agriculture 5.0" on the horizon (Fraser et.al., 2019; Murugesan et.al., 2019).
UNDERSTANDING INDUSTRY 4.0
Over the last 270 years, industry has developed in the context of the so-called "industrial revolutions". The first industrial revolution began in the second half of the 18th century with the development of the steam engine. The second revolution took place towards the end of the 19th century with the development of mass production and the use of electrical energy. In the second half of the 20th century, the third industrial revolution began, characterised by the automation of production using electronic and IT approaches.
Each industrial revolution brings about a fundamental change in the production paradigm, made possible by the development of one or more technologies which trigger a fundamental change in established ideas and practices. However, their impact is not limited to production; they touch and influence the whole of society.
The current stage, caused by the fourth industrial revolution, is known as Industry 4.0. It differs from the third industrial revolution in that it focuses on networking the various automation modules (Li Da et al. 2018).
Despite the current widespread use of the Industry 4.0 concept, it is difficult to find a clear definition. The term is best described by its components.
From a purely technical point of view, the Industry 4.0 approaches can be summarised under the term networking. Instead of managing different machines, sensors etc. individually, as was previously the case, Industry 4.0 is based on cyber-physical systems (CPS), which can

Industry 4.0 - the next stage of agricultural technology?
21
be connected and used flexibly, and on the equally flexible service-oriented architecture (SOA), which enables the use of the necessary software components (Bauernhansel, 2017). This also improves the possibility of simulating processes up to the digital twin of the process. However, the networked and service-oriented character of Industry 4.0 goes beyond the boundaries of purely technical aspects and enables the design of new business models (Demot, 2017).
From this, the following implementation options (Bauernhansl and Schatz, 2015) can be derived for the intelligent products and services to be offered by Industry 4.0:
Digital individualisation: Digital media considerably simplify the offer of individualised products and services. This includes the entire production chain from customer request to realisation.
Flexibilisation: Industry 4.0 offers, for example, the possibility to react quickly to fluctuations in demand by making production capacities more easily scalable (e.g. through more intelligent plants and simplified capacity procurement) and by making more data available about the environment and the company itself.
Demand orientation/ "X-as a service": Service orientation will be transferred to business models, which in turn will be facilitated by increasing data volume and flexibility. For example, products and services can be offered and billed according to the extent of use.
Sustainability: Better planning and control of production processes through digitisation can save resources, e.g. through cost- and load-optimised production programmes for energy-intensive processes. The availability of extended and timely data from production and the supply chain, e.g. through the early detection of quality problems, allows an additional reduction in resource requirements.
Consistent process orientation: The networking capability enables each value-added stage in the supply chain (internal and external to the company) to call up information on the overall process. This enables a customer- and employee-oriented work organisation.
Automated knowledge and learning: The increase in data volume and the degree of automation in Industry 4.0 environments prove to be ideal prerequisites for the use of self-learning functionalities. The data can come from outside the company boundaries, for example through IoT approaches. In addition, the systems in question enable extended and simplified knowledge management in companies.
Collaboration competence: In terms of end-to-end process optimisation, Industry 4.0 approaches reduce the amount of cooperation between value-added partners. For example, it is possible to know the current stock and available capacity of suppliers.
Productivity optimisation: All the above-mentioned implementation options contribute to an increase in productivity. Optimisation options can be found at various levels, from the strategic orientation of the company to the operational management of production processes.
Although these implementation options have been analysed for the machinery and equipment sector, the identified benefits are also relevant for agriculture. However, implementing a highly flexible and distributed architecture is not without its challenges. The desired fast connection in the production chain also requires a corresponding data exchange. However, this requires appropriate standardisation or standardised interfaces and data formats between components from different manufacturers.

H. Bernhardt, M. Bozkurt, E. Colangelo, J. Horstmann, M. Kraft, J. Marquering, T. Steckel, H. Tapken, ...
22
The processing and storage of data on distributed systems, often outside the company, gives cause for concern about data security. Both software-based and methodical approaches are being developed for this purpose. While the former are based on novel security applications and protocols, the latter focus on issues such as intelligent data control and anonymisation. The analysis of the definition of Industry 4.0 shows that this definition is still under development and discussion.
INDUSTRY 4.0 APPROACHES IN AGRICULTURE
If the definition of Industry 4.0 is applied to agriculture, it quickly becomes clear that agriculture is still characterised by additional aspects (Sonnen, 2019). Particularly striking here is the environmental character of agriculture, which includes not only society and the state, but also to a large extent nature, the environment, people, farm animals and the weather. The organisation of work is also structured differently in agriculture than in industry. This shows that the socio-economic, technical and ecological systems in agriculture are much more closely interwoven, which makes the definition of “Agriculture 4.0” more difficult than in industry.
In order to explain the current status of Industry 4.0 approaches in agriculture, examples from arable farming and livestock farming are therefore used and a differentiation and description possibility based on technological levels is created.
Example from arable farming: steering systems Steering systems started in the 2000s as simple local systems, e.g. a forage harvester with
mechanical deflection sensors in row crop cultivation along the maize rows. The first tractors were kept on a given track by GNSS.
In recent years, these systems have been developed with great innovative power. Digital adaptation is achieved by taking into account a specific implement, so that the working width of the implement is automatically taken into account for track guidance via ISOBUS and for the cooperation between implement and tractor.
Flexibility is achieved through standardisation. A steering system can now be attached from a tractor to a self-propelled machine or another tractor within minutes.
Demand orientation is gaining ground through new business models. A "steering system as a service" does not yet exist, but the software activations, such as correction signals (RTK for 2 cm accuracy and long-term repeatability), which are subject to a fee, are only sold and invoiced if required.
When using a control system, sustainability is the first priority. The working width of the machine is used optimally, double crossings are avoided, and fuel and CO2 savings are achieved through optimal driving.
Automated knowledge and learning are currently not applied to the steering system. Only databases with lanes are being built up, which can be used for subsequent processes. Automated learning does not currently take place, but is in preparation with teach-in procedures and intelligent lane planning systems. Lane planning systems will in future be provided with field boundaries and the planned work process and the lane planning system will determine a proposed course of action for field work in a self-learning manner on the basis of collected empirical values.
Industry 4.0 - the next stage of agricultural technology?
23
Steering systems will increasingly be equipped with collaborative competencies. On the one hand, the correction signals are nowadays often obtained from external service providers via mobile phone. On the other hand, the steering systems are networked with each other, e.g. to exchange track sections or to automate e.g. overloading procedures by means of an electronic tiller.
Productivity optimisation is the main objective when using steering systems. Optimum utilisation of the working width saves machining time and fuel. Working even in the dark is made possible and the crop yield is increased by minimising soil compaction.
This means that modern GNSS and online-based steering systems fulfil a variety of characteristics that make Industry 4.0 stand out. In the coming years, these systems will be further developed and make an important contribution to the increasing automation requirements of farmers and contractors.
Example from livestock farming: automatic dairy farming Automation is widely used in dairy farming, also due to the clearly structured and
recurring daily processes. This has led to a large number of automated systems and sensors in dairy farming. The most important blocks are the Automatic Milking System (AMS), Automatic Feeding System (AFS) and automated cleaning and bedding systems. In addition, multiple sensors, such as animal identification, animal location, oestrus detection, calving detection or barn climate, are also found in the barn (Höhendinger, 2019).
The basis for this development is the automatic milking systems, which have been in widespread use since 1990. Here the individual process steps of milking are automated. These include the recognition of the cow via a sensor, the cleaning of the udder, the recognition and targeted attachment of the cluster to the individual teats of the cow, the flow-controlled milking of the cow, the removal of the cluster and dipping the cow (Bernhardt, 2019b). The basic structure of AMS is comparable to machine tools in the Industry 3.0 sector, but the other systems in the dairy sector are also to be assessed at a similar level of technology. All in all, they prayed for a great potential for Industry 4.0 in agriculture. Some of the possibilities are being considered, but not yet stringently implemented.
In the field of digital individualisation there are different approaches with regard to both cow and product milk. An already widespread system is the individualised concentrated feed distribution via station with identification of the animal via transponder. Another is the alignment of the animals in the AMS partly according to the stored body measurements. Another possibility here would be the quarter-individual milking in terms of milking phase duration and milking vacuum depending on the previous notification of the animal. In the case of milk, the approach is to separate the milk according to animal and ingredient to enable individual marketing (Bernhardt, 2019a).
Flexibility in application is difficult to implement in the AMS and the other automated systems due to the workload and continuous use. In terms of flexibilisation in relation to the presence of the farmer, the systems are very flexible. The only approach to making the application more flexible could be the AMS container, which accompanies the cows to the alpine pasture and returns to the barn in autumn.
In terms of its basic structure, the dairy sector is actually predestined for comprehensive information transparency. In the individual systems, data is also recorded and used accordingly. But unfortunately, there is no general and open data interface to make the data

H. Bernhardt, M. Bozkurt, E. Colangelo, J. Horstmann, M. Kraft, J. Marquering, T. Steckel, H. Tapken, ...
24
sufficiently public and share it with other systems. In some cases, the necessary information transparency does not even exist between different systems of one manufacturer.
The idea of demand-oriented provision is almost not common in the dairy sector. The individual systems are permanently assigned to the building and the animal stock is adapted to the technology rather than vice versa. Only in the case of mobile feeding systems is it sometimes the case that these are used and invoiced by several farms according to their requirements.
Dairy cattle farming is basically process-oriented due to its structure with the main processes of milk and meat production weighted according to breed. This is followed by the secondary process of producing offspring. The supply of fodder and the disposal of organic fertiliser are linked to this process.
A common problem in dairy farming is that these processes are not generally structured and documented in a way that is comprehensible to others. This means that measuring points and links are not optimally recognised, which makes it difficult to use decision models and their implementation. Methods from the Industry 4.0 construction kit would offer basic approaches to improving process orientation here.
In the field of automated knowledge and learning, the AMS offers great potential, since animal-specific data series are continuously generated. However, these data are not yet used consistently in the sense of Industry 4.0. The situation is similar with the collaboration competence. Here, networking various automatic systems in the barn would result in many approaches for Industry 4.0. For example, a measured change in the milk quantity could lead to an automatic adjustment of the feed quantity. This intelligent linking of different automated systems also makes it possible to optimise productivity, which at the same time can lead to a change in the farmer's work structure in the system.
In principle, dairy cattle farming offers good conditions for networking the individual systems due to its fixed spatial structure. In many cases, networking can be carried out via cable and ends up in the barn office in a star shape. Within the barn, this is used as a control centre. Difficulties are often encountered here with wireless networks for different sensors on the cow, as there is no uniform data and radio standard.
What often proves to be a problem when the barn is not directly adjacent to the residential building is the networking via a telecommunications provider between the barn and the house. Here, data networks in rural areas often do not offer sufficient bandwidth to guarantee the required direct access to the data network of the dairy cattle barn.
Areas such as young cattle rearing, calculation of feed ration, feed production and organic fertiliser can be outsourced as services in dairy cattle farming. However, it is often the case that the process or product is outsourced, but no regulations are made for data exchange or that this does not take place. As a result, these sectors are often underrepresented in the farm in terms of data technology and therefore cannot be used for networked decisions.
CONCLUSIONS
When analysing the applications of Industry 4.0 in agriculture, it is noticeable that, although many things initially look like 4.0, a closer analysis reveals that decisive aspects such as cross-industry networking or the individualisation and flexibilisation of production

Industry 4.0 - the next stage of agricultural technology?
25
are missing. These technical solutions can therefore be classified more as automated isolated applications of Industry 3.0.
The points of process orientation, standardisation, data communication and knowledge transfer can be identified as challenges for implementing Industry 4.0 in agriculture. In the case of process orientation, it can be seen that this has not yet fully penetrated agriculture and that tools such as digital twins cannot be sufficiently implemented. This is also reflected in standardisation. Here the ISO-Bus is available in arable farming, although an adapted development is also necessary here. A similar system is unfortunately lacking in livestock farming. Furthermore, the transitions between the individual links in the production chain are also not standardised throughout.
In addition to the organisational structure of data exchange, the technical infrastructure also needs to be expanded accordingly, as both cable-based and radio-based data networks still have performance gaps, especially in rural areas. In order to be able to make appropriate use of the possibilities of the Industry 4.0 modules, a corresponding structure for the further training of users is also necessary.
Another aspect that is frequently pointed out is the gap between practical implementation and technologically possible realisation. An example of this is TIM for balers and tractors. Here, implementation is slow, although with regard to Industry 4.0 approaches, other aspects such as track shifting from the previous implement, e.g. combine harvester or swather, performance planning based on the power requirements of the combine harvester organs or logistics planning based on yield estimates would also be possible. In indoor farming, too, for example, quarter-individual milking based on past milking cycles or route optimisation of cleaning robots using the current movement data of cows would correspond to the basic idea of Industry 4.0.
In many cases, these technological developments would only require appropriate adjustments and coordination. However, this requires a manufacturer-independent will, which is often hindered by company-specific interests. It is obvious that without cross-manufacturer networking, no application of Industry 4.0 in agriculture is possible, but only the automation of individual machines.
REFERENCES
Aulbur, W., Henske, R., Morris, G., Schelfi, G. (2019). Farming 4.0: How precision agriculture might save the world. Roland Berger Focus, Roland Berger GmbH, München.
Bauernhansl, T. (2017). Industry 4.0. in the field of tension between market, technology and organisation. In: Organisational Development: Journal for Corporate Development and Change Management (2), pp. 32-38.
Bauernhansl, T. Schatz, A. (2015). Industry 4.0 for business model innovations. Procedure for developing industry-specific business model scenarios. In: wt Werkstattstechnik online 105 (3), pp. 79-83.
Bernhardt, H. (2019a). Technik in der Rinderhaltung. In: Frerichs, Ludger (Ed.): Jahrbuch Agrartechnik 2018. Braunschweig: Institut für mobile Maschinen und Nutzfahrzeuge, 2019, pp. 1-13, https://doi.org/10.24355/dbbs.084-201901211151-0
Bernhardt, H., Martin H., Anja G., Omar, H., Manfred, H., Matthias, R., Stumpenhausen, J. (2019b). Development of Automatic Milking in Germany, 2019 ASABE Annual International Meeting 1900127. (doi:10.13031/aim.201900127)
H. Bernhardt, M. Bozkurt, E. Colangelo, J. Horstmann, M. Kraft, J. Marquering, T. Steckel, H. Tapken, ...
26
Demont, A., Paulus-Rohmer, D. (2017). Developing Industry 4.0 business models systematically. In: Schallmo, D., Rusnjak, A., Anzengruber, J., Werani, T., and Jünger, M. (eds.): Digital Transformation of Business Models, vol. 3. Wiesbaden: Springer Trade Media Wiesbaden, S. 97-125.
Fraser, E. D. G., Campbell, M. (2019). Agriculture 5.0: Reconciling Production with Planetary Health. One Eart 1, 278-280.
Germán F. A., Dalenogare, L. S., Ayala N. F. (2019). Industry 4.0 technologies: Implementation patterns in manufacturing companies, International Journal of Production Economics, Volume 210, p15-26, https://doi.org/10.1016/j.ijpe.2019.01.004.
Höhendinger, M., Schlereth, N., Treiber, M., Höld, M., Stumpenhausen, J., Bernhardt, H. (2019): Potential of cyber-physical systems in German dairy farming, 2019 ASABE Annual International Meeting 1900221. (doi:10.13031/aim.201900221).
Kagermann, H., Lukas, W. D., Wahlster, W. (2011). Industrie 4.0: Mit dem Internet der Dinge auf dem Weg zur 4. industriellen Revolution. VDI nachrichten, 13(1).
Li Da Xu, Eric L. Xu & Ling Li (2018). Industry 4.0: state of the art and future trends, International Journal of Production Research, 56:8, 2941-2962, DOI: 10.1080/00207543.2018.1444806
Müller, J., Dotzauer, V., Voigt, K. (2017). Industry 4.0 and its Impact on Reshoring Decisions of German Manufacturing Enterprises. In: Bode, C., Bogaschewsky, R., Eßig, M., Lasch, R., Stölzle, W. (eds) Supply Management Research. Advanced Studies in Supply Management. Springer Gabler, Wiesbaden. https://doi.org/10.1007/978-3-658-18632-6_8
Murugesan, R., Sudarsanam, S. K., Malathi G., Vijayakumar, V., Neelanarayanan, V., Venugopal, R., Rekha, D., Saha, S., Bajaj, R., Miral, A., Malolan, V. (2019). Artificial Intelligence and Agriculture 5.0. Int. J. Recent Technology and Engineering 8, 1870-1877.
Ozdogan, B , Gacar, A , Aktas, H. (2017). Digital agriculture practices in the context of agriculture 4.0. Journal of Economics Finance and Accounting, 4 (2), 186-193. DOI: 10.17261/Pressacademia.2017.448
Rojko, A. (2017). Industry 4.0 Concept: Background and Overview. International Journal of Interactive Mobile Technologies (iJIM), v. 11, n. 5, p. 77-90, doi:http://dx.doi.org/10.3991/ijim.v11i5.7072.
Rose, D. C., Chilvers, J. (2018). Agriculture 4.0: Broadening Responsible Innovation in an Era of Smart Farming, Frontiers in Sustainable Food Systems, Volume 2, p. 87, DOI=10.3389/fsufs.2018.00087
Saurabh, V., Prashant, A., Santosh, B. (2018). Industry 4.0 – A Glimpse, In: Procedia Manufacturing, Volume 20, p 233-238, https://doi.org/10.1016/j.promfg.2018.02.034.
Schmidt, C. (2018). Landwirtschaft 4.0 – Digitalisierung als Chance für eine nachhaltige Landwirtschaft. In: Bär, C., Grädler, T., Mayr, R. (eds) Digitalisierung im Spannungsfeld von Politik, Wirtschaft, Wissenschaft und Recht. Springer Gabler, Berlin, Heidelberg. https://doi.org/10.1007/978-3-662-55720-4_38
Sonnen, J. (2019). Digitalisierung und Vernetzung. In: Frerichs, L. (Ed.): Jahrbuch Agrartechnik 2018. Braunschweig: Institut für mobile Maschinen und Nutzfahrzeuge, pp. 1-11, https://doi.org/10.24355/dbbs.084-201901211129-0
Weltzien, C. (2016). Digital agriculture – or why agriculture 4.0 still offers only modest returns, LANDTECHNIK 71(2), p. 66–68, DOI: 10.15150/lt.2015.3123

48th Symposium "Actual Tasks on Agricultural Engineering", Zagreb, Croatia, 2021
27
THE NEVONEX ECOSYSTEM – IMPLICATIONS OF AN IOT FRAMEWORK ON AUTOMATION IN THE
AGRICULTURAL MACHINERY SECTOR Maximilian TREIBER*, Heinz BERNHARDT
*E-mail of corresponding author: [email protected] Systems Engineering, Technical University of Munich,
Duernast 4, D-85354 Freising, Germany
ABSTRACT
NEVONEX is an open and neutral IoT (Internet of Things) Framework for agricultural machinery data created by Robert Bosch GmbH. A simple analogy to describe NEVONEX is to compare it to the operating system of a smartphone (e.g. Android, iOS), where the smartphone would be a tractor and an App would be a FEATURE. NEVONEX aims to improve the compatibility of tractors, implements and sensors and improve on the limitations of existing solutions like the ISO 11783 standard. Furthermore, the secure transfer of data between machines and cloud systems is provided through the orchestration by NEVONEX. It also facilitates the development process for agricultural IoT solutions.
Aim of this research is to elaborate on IoT-Frameworks for agricultural machinery in general and propose a reference system for the evaluation and comparison of these frameworks. Furthermore, the proposed scheme is applied exemplarily to the NEVONEX framework.
It is shown that there are several IoT Frameworks for agricultural machinery on the market already. They show striking similarities in their structure, that can be analyzed by the proposed reference system, however the scheme needs further improvement as it was not able to capture all individual aspects necessary for the evaluation of an IoT Framework for agricultural machinery.
In the future, the reference system needs to be improved and the mechanisms, how these technologies generate value for agricultural stakeholders need further assessment.
Keywords: NEVONEX, tractor, implement, ISOBUS, J1939, connectivity
48. ACTUALTASKS ONAGRICULTURAL ENGINEERING
Preliminary communication

M. Treiber, H. Bernhardt
28
INTRODUCTION
Modern tractors are the backbone of our efficient and resilient agriculture. They have undergone a development from being a simple means of pulling force and replacing farm animals, to offering multiple options of power transmission for farming operations like the addition of hydraulics, PTO, and electronics (Brenner, 1960). With the additional options of power transmission and the opportunities of modern electronics, implements have advanced, too. Today tractors and implements form complex control systems and must be optimized in conjunction to gain further benefits for agriculture (Zhang, 2015). The first step to make this possible was the formation and normative regulation of BUS-systems like the ISOBUS (ISO 11783) (ISO, 2007), to form a common ground for tractor-implement communication. For the future however, the next step of development will be to elevate tractors to become smart connected products (Porter & Heppelmann, 2014). The challenge here is, to make tractor-implement combinations part of complex cyber physical systems and connect them to the Internet of Things (IoT). One of the biggest hindrances for the rapid adoption of Smart Farming Technologies in this regard, is the lack of compatibility between systems (Gabriel & Gandorfer, 2020), no matter if those are tractor-implement combinations or cloud-based farm management systems (FMS).
There are, however, certain unique challenges, that distinguish tractor-implement combinations from simpler IoT use-cases like weather stations and stationery or simple multi sensor nodes, like sensors for silo bins or cattle monitoring.
- Tractors and implements communicate via bus systems and are complex control systems on their own.
- The number of sensors and actuators available in tractors and implements generate a big amount of data with high sampling rates, therefore requiring a certain amount of edge computing capacity for preprocessing of data, otherwise there is the need for high data-rate broadband connection.
- Tractor Implement combinations are on the constant move while executing their tasks, selective availability of broadband networks for upload of data with high bandwidth is still the norm, not the exemption.
- Access to the Bus systems and therefore sensors and actuators of a tractor is partly limited by complex protocols and proprietary solutions and the sheer amount of necessary interfaces.
- Functional safety is crucial. When these challenges are overcome, the biggest challenge remains. The market for
agricultural machinery offers tractors and implements from many different manufacturers. Especially in Europe, farmers like to choose the machines that meet their individual needs best, and have the expectation, that they can combine tractors and implements, no matter the manufacturer. While ISOBUS has greatly improved on this situation, modern tractor implement combinations challenge the ISOBUS in regards of achievable data rates (Knechtges & Renius, 2017) a new trend could be observed recently, where manufacturers and third-party companies offer products that revolve around “Boxes” that get connected to the tractors or implements offering different solutions for the problems stated above. While most of these Boxes were still in a prototype or early market roll-out stage on the Agritechnica trade fair in 2019, a general set of common functionalities is observed. In most cases these “Boxes” contain a SoC (System-on-a-Chip Computer) and different means of connectivity

The NEVONEX ecosystem – implications of an IoT framework on automation in the agricultural machinery sector
29
like for example Bluetooth, Wireless LAN, GSM and ISOBUS access. For further reference, these “boxes” will be referred to as IoT-Gateways for agricultural machinery. These IoT Gateways are only one functional component of the products they are incorporated in. As these products revolve around the above-mentioned technologies and challenges and range on a spectrum from offering a single Application (e.g. Smartphone App), to complex all-encompassing connectivity and compatibility solutions for agricultural machinery combinations, they will be referred to as IoT-Frameworks for further reference.
Aim of this paper is to elaborate on IoT-Frameworks for agricultural machinery and propose a classification scheme for the evaluation and comparison of these frameworks. Furthermore, the scheme is applied exemplarily to the NEVONEX framework.
MATERIALS AND METHODS
First, literature review provides general information about the classification of IoT technology. During this step, a brief market review is carried out to identify relevant IoT Frameworks for agricultural machinery for future reference.
As a second step, a classification scheme for the functional layers of agricultural machinery IoT frameworks will be created to find a means of comparison and differentiation based on the functional offerings of these products. Therefore, a generic model of the IoT Technology Stack is applied to the special preconditions of agricultural machinery. This is done to give a more specific and realistic perspective on the requirements of IoT Frameworks for agricultural machinery and derive the desired proposal for a specific classification scheme.
As an example, this scheme will then be applied to the NEVONEX ecosystem to see whether its unique features are identified and therefore test, whether the classification scheme is transferable.
RESULTS AND DISCUSSION
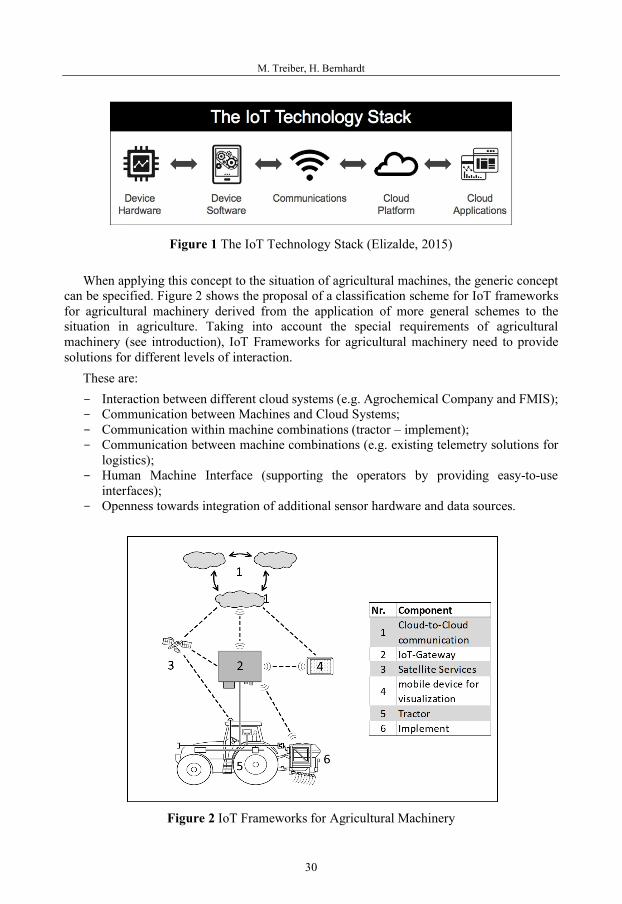
For analyzing IoT Systems, the concept of the IoT Technology stack is quite common. Figure 1 shows a simple interpretation of this concept. According to the author, IoT systems can be analyzed and categorized by considering the five layers, namely device hardware, device software, communications, cloud platforms and cloud applications. To build a successful IoT system, certain decisions must be made, and technologies need to be chosen for the different layers of the system. The difficulties that arise during this process are mainly related to complexity. For each of the layers, different parameters must be taken into account, so “zooming in” on each of the layers reveals another set of decisions that have to be made, while keeping the interoperability of all the layers in mind. An example would be the decision for a specific set of communications in an IoT system. To decide whether a certain connectivity option is viable, a decision-maker must take aspects like network topography, transmission frequency, range, data rate, latency, penetration, energy consumption and special aspects of the network protocols (Bluetooth, WiFi, LoRa WAN etc.) into account, which in turn influences the device hardware (correct chipsets for chosen connectivity), as well as the business model in general (e.g. who is going to provide the network infrastructure, own gateways vs. network provider).
M. Treiber, H. Bernhardt
30
Figure 1 The IoT Technology Stack (Elizalde, 2015)
When applying this concept to the situation of agricultural machines, the generic concept
can be specified. Figure 2 shows the proposal of a classification scheme for IoT frameworks for agricultural machinery derived from the application of more general schemes to the situation in agriculture. Taking into account the special requirements of agricultural machinery (see introduction), IoT Frameworks for agricultural machinery need to provide solutions for different levels of interaction.
These are: - Interaction between different cloud systems (e.g. Agrochemical Company and FMIS); - Communication between Machines and Cloud Systems; - Communication within machine combinations (tractor – implement); - Communication between machine combinations (e.g. existing telemetry solutions for
logistics); - Human Machine Interface (supporting the operators by providing easy-to-use
interfaces); - Openness towards integration of additional sensor hardware and data sources.
Figure 2 IoT Frameworks for Agricultural Machinery

The NEVONEX ecosystem – implications of an IoT framework on automation in the agricultural machinery sector
31
Of the six major components in the system, the IoT Gateway plays a central role as an enabling unit on the hardware side. To further emphasize the important role of the IoT Gateway, the means of peer-to-peer communication in the system are analyzed (Table 1).
Table 1 Means of peer-to-peer communication in IoT Frameworks for agricultural
machinery
In Addition to the hardware setup and connectivity protocols used for communication, the
challenge of integrating many different data formats can only be met by adaptable middleware. This kind of enabling Software is therefore a necessity for a system of systems approach in agriculture. In addition to live sensor data, control commands for actuators and time series data derived from the machines, additional datasets from cloud systems are relevant. Examples for this kind of data are application maps and other geographic information systems data (GIS), with the most important data formats being shape data and ISO-xml (Noack, 2007).
The classification scheme from Figure 2 and Table 1 shows, that despite of the complexity of agricultural machinery and production systems, the generic information from the IoT stack can be specified for the situation of agricultural machinery, as there are only so many options for the components in these systems.
As a final step, the proposed classification scheme is applied to the NEVONEX ecosystem by Robert Bosch GmbH (Muenzenmay et al., 2020).
In the NEVONEX framework, the IoT Gateway is called the “NEVONEX box” and offers the following hardware interfaces: ISOBUS, j1939, W-LAN, Bluetooth, 4G LTE, internal sensors (e.g. IMU & GPS). Additional Sensors and actuators that are not accessible via the bus-systems of a tractor, can be integrated via the Bluetooth or W-LAN interfaces, offering the option to integrate a wide array of “smart” sensors and implements.
The NEVONEX User-Interface is provided on a tablet computer via the “NEVONEX Cockpit App”. NEVONEX box and the tablet pc communicate over W-LAN. Within the NEVONEX Cockpit App, users can access, and control App-like Software modules called “FEATUREs”. These FEATUREs are executed directly on the NEVONEX box (edge computing) and can have read and write access to all available hardware interfaces. The FEATUREs are provided by partners in the NEVONEX ecosystem. Farmers buy FEATUREs directly from the FEATURE providers and the FEATUREs can interact with the FEATURE
Cloud IoT-Gateway Satellite Services TractorCloud API
IoT-Gateway cellular backhaul/ W-LAN
Satellite Services remote sensing applications
GPS/satellite communications backhaul
mobile device for visualization
alternative cellular backhaul
W-LAN
Tractor - ISOBUS/J1939/GPIO GPSImplement - W-LAN/Bluetooth - ISOBUS

M. Treiber, H. Bernhardt
32
provider cloud. In this case, secure end to end data transfer is provided by the NEVONEX cloud, that communicates with the individual NEVONEX boxes on the one hand and on the other hand with the FEATURE-provider Cloud systems via APIs. NEVONEX therefore acts as an orchestrator and provides the infrastructure for secure data transfer between machines and partnering cloud systems. There is additional Cloud infrastructure in the form of “MyNEVONEX”, where Access rights, NEVONEX boxes and FEATUREs of individual customers can be configured.
So far, the classification scheme (Figure 2) derived from the IoT Technology Stack is a proper fit.
However, there are additional components to the NEVONEX system, that can not be described by the proposed classification scheme for IoT Frameworks, e.g. the FEATURE Interface library, that collects available Interfaces from OEM or sensor manufacturers, as well as a development environment offering these interfaces as generic SDKs (software development kit) for FEATURE developers to use in their preferred IDE (integrated development environment). While these functionalities are not within the scope of the proposed classification scheme, they are additional functionalities that need to be assessed for a thorough analysis of the NEVONEX Framework and therefore other IoT Frameworks. It is therefore suggested to expand the classification scheme (Figure 2) with functionalities that are not directly related to the scope of the IoT technology stack, from which this scheme was derived. A possible integration of these functionalities could be to add a maintenance, services and business-model categories to the classification scheme that are currently out of the scope of the traditional IoT stack but nevertheless offer benefits to the partners interacting in such frameworks.
To further advance this topic, a brief market research yielded 23 potential IoT frameworks for agricultural machinery, as a reference for further comparison. Major examples are:
- AGCO “FUSE”; - Claas/John Deere/365farmnet “DataConnect”; - DKE-Data “agrirouter”; - The Climate Corporation “FIELDVIEW”; - EXA-Computing “exatrek”. The examples show that most of these Frameworks are purpose-driven platforms brought
to the market by established Agribusiness companies, however some of them are start-ups aiming to provide solutions to specific pain points of farmers. Most of them incorporate all of the components from Figure 2, others provide their solutions by just utilizing parts of the framework like e.g. the DKE agrirouter, where the Cloud to Cloud communication suffices as a technical solution for enhancing compatibility in agriculture.
Discussing the similarities and differences it is apparent, that most of these products revolve around compatibility issues and interfaces. This is backed by the fact that some of these solutions are brought to the market by consortiums or partner networks and are not single company offerings.
Another interesting factor is, that the IoT Frameworks are by no means exclusive, as the cooperations of NEVONEX and agrirouter on the one hand or the DataConnect initiative by Claas, John Deere and 365farmnet, on the other hand, show. While they differ in in certain functionalities and offerings to the farmer, the solutions to technological challenges show

The NEVONEX ecosystem – implications of an IoT framework on automation in the agricultural machinery sector
33
similarities, e.g. the connectivity protocols of the IoT Gateways and their specs are remarkably similar.
With these insights it appears, that the success of different IoT Frameworks for agricultural machinery will rely on the robustness of the technical implementation as much as it will rely on strategic partnerships and sophisticated business models for the monetarization of achievable benefits.
CONCLUSIONS
IoT Frameworks for agricultural machinery show striking similarities in their basic construction. The application of a general IoT technology stack, as conducted within this research, yields a good structure to evaluate the components of these frameworks in regard to next level tractor-implement-communication and cloud connectivity. Together with the brief market research, the foundation for further analysis and comparison is laid.
In general, IoT Frameworks for agricultural machinery offer better connectivity and compatibility of agricultural machines and cloud systems. The opportunities of smarter control of tractor-implement combinations offer potential for multiple efficiency gains in agricultural production and are an advancement towards enabling a system of systems approach in agriculture. Therefore, these systems can be seen as infrastructure for the digital age of agriculture, because they enable many different use cases that require cloud systems and machines to integrate seamlessly while using many different data formats.
In the future, the reference system needs to be improved and the mechanisms, how these technologies generate value for agricultural stakeholders need further assessment.
REFERENCES
Brenner, W. (1960). Schlepperentwicklung - wichtige Abschnitte. (AgTecCollection: Lehrstuhl für Landtechnik TUM / Archiv). München. http://mediatum.ub.tum.de/?id=697320
Elizalde, D. (2015). The 5 Layers of the IoT Technology Stack. https://danielelizalde.com/iot-primer/ Gabriel, A., & Gandorfer, M. (2020). Ergebnisbericht Landwirte-Befragung 2020: Digitale
Landwirtschaft Bayern. Ruhstorf a.d. Rott. https://www.lfl.bayern.de/mam/cms07/ilt/dateien/ilt6_praesentation_by_2390_27082020.pdf
ISO. (2007). Tractors and machinery for agriculture and forestry - serial control and communications data network. International standard / ISO: Vol. 11783. ISO.
Knechtges, H., & Renius, K. T. (2017). Gesamtentwicklung Traktoren. In L. Frerichs (Ed.), Jahrbuch Agrartechnik 2016 (pp. 1–10). http://publikationsserver.tu-braunschweig.de/get/64169
Muenzenmay, M., Tanimou, M., & Kurre, H. (2020). Digital Ecosystem Nevonex for Smart Agriculture. ATZ Heavyduty, 2020(02), 44–49.
Noack, P. O. (2007). Standards for Electronic Data Exchange in Agricultural Applications. Landtechnik, 62(SH2007), 238–285. https://www.landtechnik-online.eu/landtechnik/article/view/2007-62-SH-283-285/2007-62-SH-283-285-en-pdf
Porter, M. E., & Heppelmann, J. E. (2014). How Smart Connected Products Are Transforming Competition: Spotlight on Managing the Internet of Things. Harvard Business Review(R1411C), 3–23.
Zhang, Q. (Ed.). (2015). Precision Agriculture Technology for Crop Farming. CRC Press. https://doi.org/10.1201/b19336


48th Symposium "Actual Tasks on Agricultural Engineering", Zagreb, Croatia, 2021
35
DRAFT FORCE REDUCTION BY AN ELECTRIFICATION-UNIT ON IMPLEMENTS
Jochen Georg WIECHA*, Kathrin Lina Martha ZIEGLER, Heinz BERNHARDT
*E-mail of corresponding author: [email protected] Technical University of Munich, Chair of Agriculture Systems Engineering,
Dürnast 4, 85354 Freising, Germany
ABSTRACT
Electrification is implemented in newer tractors hesitantly. The need for electrified mounted implements and application units will rise continuously. Semi-liquid manure and digestive from biogas crops is injected directly into the soil more and more. This technic reduces significant nutrient losses and ammonia emissions. In the case of loamy soils and clay, a high draft force is needed for slurry deposition into the soil. With the development and testing of an application unit with reduced working width of three meters, the draft force reduction was found to be lower by nearly one third.
The field trials have been performed with spiked roller and star packer as traction element on the roller unit. In two steps, we tested with and without powering the electrified traction roller. This field tests took place on four fields near Freising/Germany.
As a result, we receive data that verify draft force reduction up to 35% with a powered traction roller on the mounted implement having 20% slippage on the traction roller. These values are observed pulling a tractor with the electrified implement by another tractor in horizontal ground level. Second, we observed a different variation range of the values between the three test fields. This is resulting from different soil structure on the test fields having pebbles and stones near the soil surface or bigger stones down the working depth of 22.5 centimeters.
The presented results show new kinds of working scenarios and operation modes for agriculture. Having a draft force reduction on heavy soils, electrification can be an advantage in taking care of nutrient losses and ammonia emissions.
Keywords: electrification, mounted implements, draft force, reduction
48. ACTUAL TASKS ON AGRICULTURAL ENGINEERING
Original scientific paper
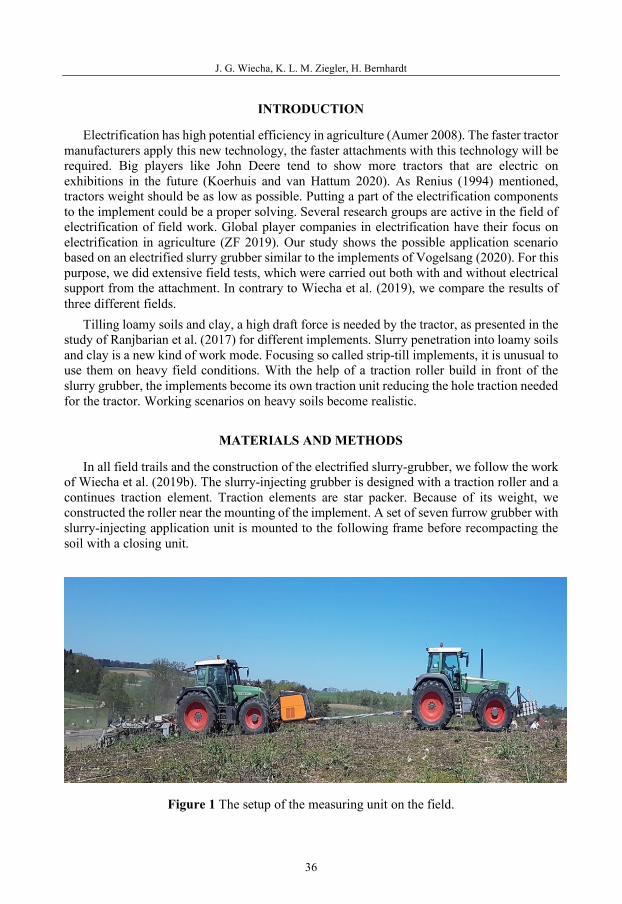
J. G. Wiecha, K. L. M. Ziegler, H. Bernhardt
36
INTRODUCTION
Electrification has high potential efficiency in agriculture (Aumer 2008). The faster tractor manufacturers apply this new technology, the faster attachments with this technology will be required. Big players like John Deere tend to show more tractors that are electric on exhibitions in the future (Koerhuis and van Hattum 2020). As Renius (1994) mentioned, tractors weight should be as low as possible. Putting a part of the electrification components to the implement could be a proper solving. Several research groups are active in the field of electrification of field work. Global player companies in electrification have their focus on electrification in agriculture (ZF 2019). Our study shows the possible application scenario based on an electrified slurry grubber similar to the implements of Vogelsang (2020). For this purpose, we did extensive field tests, which were carried out both with and without electrical support from the attachment. In contrary to Wiecha et al. (2019), we compare the results of three different fields.
Tilling loamy soils and clay, a high draft force is needed by the tractor, as presented in the study of Ranjbarian et al. (2017) for different implements. Slurry penetration into loamy soils and clay is a new kind of work mode. Focusing so called strip-till implements, it is unusual to use them on heavy field conditions. With the help of a traction roller build in front of the slurry grubber, the implements become its own traction unit reducing the hole traction needed for the tractor. Working scenarios on heavy soils become realistic.
MATERIALS AND METHODS
In all field trails and the construction of the electrified slurry-grubber, we follow the work of Wiecha et al. (2019b). The slurry-injecting grubber is designed with a traction roller and a continues traction element. Traction elements are star packer. Because of its weight, we constructed the roller near the mounting of the implement. A set of seven furrow grubber with slurry-injecting application unit is mounted to the following frame before recompacting the soil with a closing unit.
Figure 1 The setup of the measuring unit on the field.
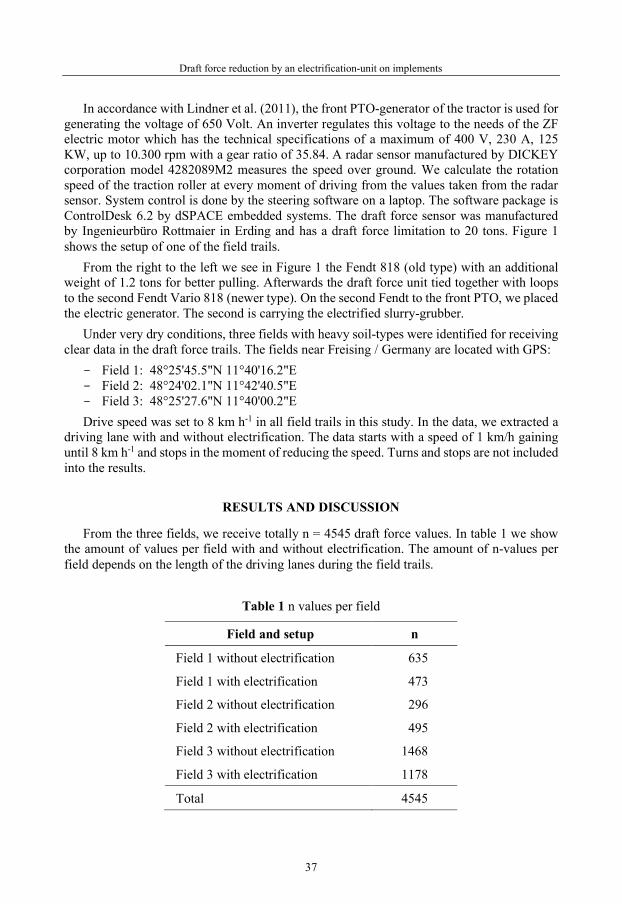
Draft force reduction by an electrification-unit on implements
37
In accordance with Lindner et al. (2011), the front PTO-generator of the tractor is used for generating the voltage of 650 Volt. An inverter regulates this voltage to the needs of the ZF electric motor which has the technical specifications of a maximum of 400 V, 230 A, 125 KW, up to 10.300 rpm with a gear ratio of 35.84. A radar sensor manufactured by DICKEY corporation model 4282089M2 measures the speed over ground. We calculate the rotation speed of the traction roller at every moment of driving from the values taken from the radar sensor. System control is done by the steering software on a laptop. The software package is ControlDesk 6.2 by dSPACE embedded systems. The draft force sensor was manufactured by Ingenieurbüro Rottmaier in Erding and has a draft force limitation to 20 tons. Figure 1 shows the setup of one of the field trails.
From the right to the left we see in Figure 1 the Fendt 818 (old type) with an additional weight of 1.2 tons for better pulling. Afterwards the draft force unit tied together with loops to the second Fendt Vario 818 (newer type). On the second Fendt to the front PTO, we placed the electric generator. The second is carrying the electrified slurry-grubber.
Under very dry conditions, three fields with heavy soil-types were identified for receiving clear data in the draft force trails. The fields near Freising / Germany are located with GPS:
- Field 1: 48°25'45.5"N 11°40'16.2"E - Field 2: 48°24'02.1"N 11°42'40.5"E - Field 3: 48°25'27.6"N 11°40'00.2"E Drive speed was set to 8 km h-1 in all field trails in this study. In the data, we extracted a
driving lane with and without electrification. The data starts with a speed of 1 km/h gaining until 8 km h-1 and stops in the moment of reducing the speed. Turns and stops are not included into the results.
RESULTS AND DISCUSSION
From the three fields, we receive totally n = 4545 draft force values. In table 1 we show the amount of values per field with and without electrification. The amount of n-values per field depends on the length of the driving lanes during the field trails.
Table 1 n values per field
Field and setup n
Field 1 without electrification 635
Field 1 with electrification 473
Field 2 without electrification 296
Field 2 with electrification 495
Field 3 without electrification 1468
Field 3 with electrification 1178
Total 4545

J. G. Wiecha, K. L. M. Ziegler, H. Bernhardt
38
Figure 2 Boxplots of the draft force reduction on three fields.
Regarding Figure 2, in all three cases the draft force reduction between the left boxplot
with no electrification (n.e.) and the right boxplot with electrification (e.) is significant. Field 1 and 2 shows a higher variation of values under electrification which was not expected. With an electrification assistance, a smoother run of the implement was anticipated. Next step is to evaluate the significance by “Welch Two Sample t-test” using R.
Figure 3 Output screen of the t-tests in R software of field 1.
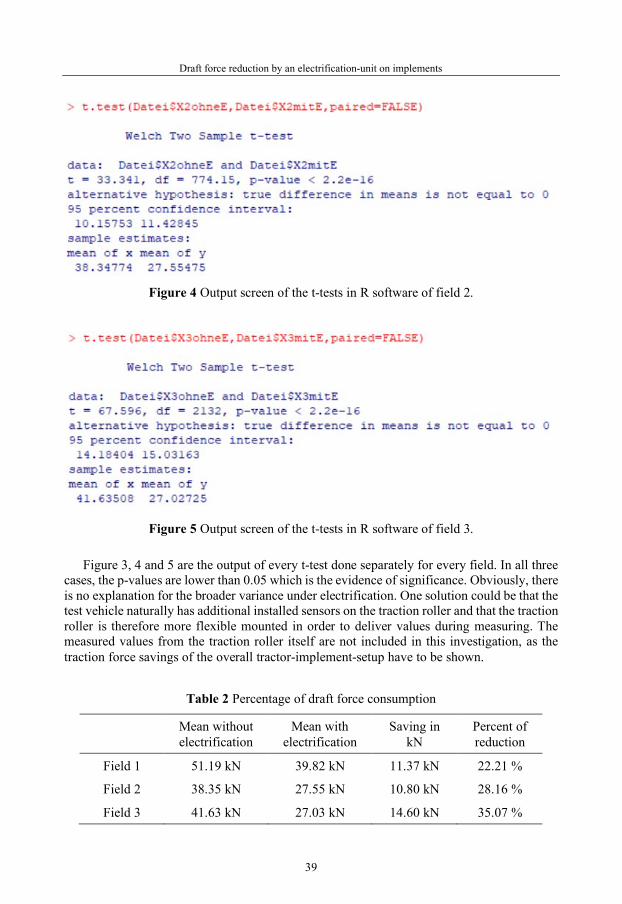
Draft force reduction by an electrification-unit on implements
39
Figure 4 Output screen of the t-tests in R software of field 2.
Figure 5 Output screen of the t-tests in R software of field 3.
Figure 3, 4 and 5 are the output of every t-test done separately for every field. In all three
cases, the p-values are lower than 0.05 which is the evidence of significance. Obviously, there is no explanation for the broader variance under electrification. One solution could be that the test vehicle naturally has additional installed sensors on the traction roller and that the traction roller is therefore more flexible mounted in order to deliver values during measuring. The measured values from the traction roller itself are not included in this investigation, as the traction force savings of the overall tractor-implement-setup have to be shown.
Table 2 Percentage of draft force consumption
Mean without electrification
Mean with electrification
Saving in kN
Percent of reduction
Field 1 51.19 kN 39.82 kN 11.37 kN 22.21 %
Field 2 38.35 kN 27.55 kN 10.80 kN 28.16 %
Field 3 41.63 kN 27.03 kN 14.60 kN 35.07 %

J. G. Wiecha, K. L. M. Ziegler, H. Bernhardt
40
CONCLUSIONS
The presented study for electrified implements mounted on farm equipment shows a clear outcome in draft force reduction. As a result, strip-till-implements can now be used better and more easily on heavy soils. At the moment, tractor manufactures have not fully decided to do build-in electrical generators to their tractors, but will show more and more models of electrified tractors on exhibitions in the future. Electrification in agriculture will gain in importance in the next few years and having some electrified implements, too.
ACKNOWLEDGMENTS
I would like to thank the partners on the Technical University of Dresden and Prof. Herlitzius for the support. The Federal Ministry of Food and Agriculture fund the KombiWKZ project. The project carrier ptBLE also provides support. Thanks so much.
REFERENCES
Aumer, W.; Lindner, M.; Geißler, M.; Herlitzius, Th. (2008): Elekrischer Traktor: Vision oder Zukunft? In: Landtechnik 63 (1), p. 14-15.
Koerhuis, R; van Hattum, B. (2020): “John Deere: `We believe in electric tractors. 100%`”, In: Future Farming, Machinery Background, 12.03.2020. Available under: https://www.futurefarming.com/Machinery/Articles/2020/3/John-Deere-We-believe-in-electric-tractors-100-552869E/. Last checked 10.10.2020.
Lindner, M.; Aumer, W.; Geißler, M.; Herlitzius, Th. (2011): Herausforderungen bei der Elektrifizierung von Geräten in der Landwirtschaft. In: Hybridantriebe für mobile Arbeitsmaschinen: 3. Fachtagung, 17. Februar 2011, p.107-116
Murugan, R., Koch, H.J., Joergensen, R.G. (2014). Long-term influence of different tillage intensities on soil microbial biomass, residues and community structure at different depths. Biology and Fertility of Soils 50-3, 487-498.
Ranjbarian, S., Askari, M., Jannatkhah, J. (2017). Performance of tractor and tillage implements in clay soil. Journal of the Saudi Society of Agricultural Sciences Vol. 16(2), 154-162.
Renius, K. (1994): Trends in Tractor Design with Particular Reference to Europe. Institute of Agricultural Machinery. In: Journal of agric. Engng Res. 57, p. 3-22.
Vogelsang GmbH & Co. KG (2020): Fortschrittliche Strip Till-Technik. Available under https://www.vogelsang.info/index.php?eID=dumpFile&t=f&f=2844&token=7130bfbb7c8f7a101573d0a3206fd6bb206ddbaa, last checked 10.10.2020.
Wiecha, J. G.; Bernhardt, H.; Bögel, T. und Herlitzius, T. (2019a): Reducing draft force on mounted implements by an electrified traction roller – Traction assistance on a slurry-injecting grubber. LAND.TECHNIK AgEng 2019, 8.-9.11.2019 Hannover. In: LAND.TECHNIK AgEng 2019 - The Forum for Agricultural Engineering Innovations. Düsseldorf: VDI Verlag 2019, S. 495-502.
Wiecha, J. G.; Bögel, T.; Herlitzius, Th.; Bernhardt, H. (2019b): Electrification of Mounted Implements – Conceps of Traction Assistance. In: 47th Symposium “Actual Tasks on Agricultural Engineering”, published by University of Zagreb, Opatija, Croatia, 2019.
ZF Friedrichshafen AG (2019): The Future of Farming. Avaible under: https://www.zf.com/products/media/industrial/agriculture/downloads_3/Agritechnica_Vademecum_2019_Screen.pdf

48th Symposium "Actual Tasks on Agricultural Engineering", Zagreb, Croatia, 2021
41
AN OVERVIEW OF AN AUTONOMOUS FARM ROBOT SOFTWARE ARCHITECTURE
Peter LEPEJ1, Jurij RAKUN2* *E-mail of corresponding author: [email protected]
1VISTION d.o.o., Kolodvorska ulica 22, 2310 Slovenska Bistrica, Slovenia 2Faculty of Agriculture and Life Sciences, University of Maribor, Pivola 10, 2311 Hoče, Slovenia
ABSTRACT
Agricultural autonomous field robots are slowly becoming a reality. Quite a few prototype solutions already operate in Europe and worldwide, slowly followed by commercially available solutions. Early adapters of the technology are working closely with the producers to make this kind of solution useful and reliable. This work presents the software architecture of such robots. It explains how they work in semi-changing conditions in the natural environment and includes innovative approaches divided into low, middle, and high-level processing nodes. All these rely on the readings from different sensors, including RTK GPS, visual/mechanical odometry, multichannel LIDAR, IMU, etc. To better explain the topic, the Rovitis (4.0) robot is presented as an example of an autonomous vineyard robot.
Keywords: field robot, precision agriculture, ROS, sensors, software architecture
INTRODUCTION
In the next 30 years, agriculture will face one of the toughest challenges so far. It is expected that the population will double worldwide; more and more food will have to be produced (Fróna et al., 2019). This should be done in a sustainable way, and by not polluting the land that will also use by future generations to come. One answer to these challenges presents the use of field robots that can do the tasks on the field more quickly, with a higher degree of accuracy, and with lower use of resources. It is estimated that 70% more food can be produced by using precision farming technologies (Saiz-Rubio, 2020). But field robotics is not yet ready as most of the developed solutions are still in the prototype phase, as these also have to be robust enough to work in an outdoor environment.
More and more (autonomous) field robots are taking shape, with some already commercially available (Naio technologies, 2020). Table 1 presents some of these solutions,
48. ACTUAL TASKS ON AGRICULTURAL ENGINEERING
Preliminary communication

P. Lepej, J. Rakun
42
starting with the name of the developer and the name of the robot, followed by what the robot is intended for. Next, the robot's size is added, which is eider big or small, where the small usually is the size that can fit between crop rows and the big have the size of a small tractor. There are really no huge robots the size of big tractors as it is more feasible to own more big robots than one huge one. In case if one breaks down, the other can finish its work. Next, the drive of the robot is presented with one of three options internal combustion engine (ICE), electric, and hybrid. Due to ecological restrictions, the prototype agricultural machinery is moving away from the classical ICE engines and switching them to hybrid or electric drives. These are also easier to control and usually more ecologically acceptable. The last three columns present the sensory system that the robot is using. Most of them are based on RTK-GPS systems, some use LIDAR technology to substitute or improve the accuracy of the GPS, and some use multiple cameras that are used for navigation or plant detection.
Table 1 An overview of new emerging field robot solutions
Company - Robot Intended for Format Drive GPS LIDAR Vision
SITIA - Trektor Vineyards, Orchards,
Fields Big Hybrid YES,
RTK NO NO
Ecorobotis - AVO Fields Big Electric YES NO YES
AGROINTELLI - Robotti Fields Big ICE YES,
RTK YES,
multichannel YES
Instar - Trooper Horticulture, logistics Small Electric YES NO YES
Bakus - ViTiBOT Vineyards, Orchards,
Fields Big Electric YES NO YES
VineScout Vineyards Small Electric YES YES YES
Naio – TED, Dino, OZ
Vineyards, Orchards,
Fields
Big, Big, Small Electric YES,
RTK YES YES
Meropy - SentiV Fields Small Electric YES NO YES
Rhoban - E-Tract Fields Big Electric YES, RTK YES NO
Ag. Giorgio Pantano - ROVITIS
Vineyards Big ICE YES, RTK
YES, multichannel
YES, visual odometry
Farmbeast Fields Small Electric NO YES, multichannel
YES, weed detection
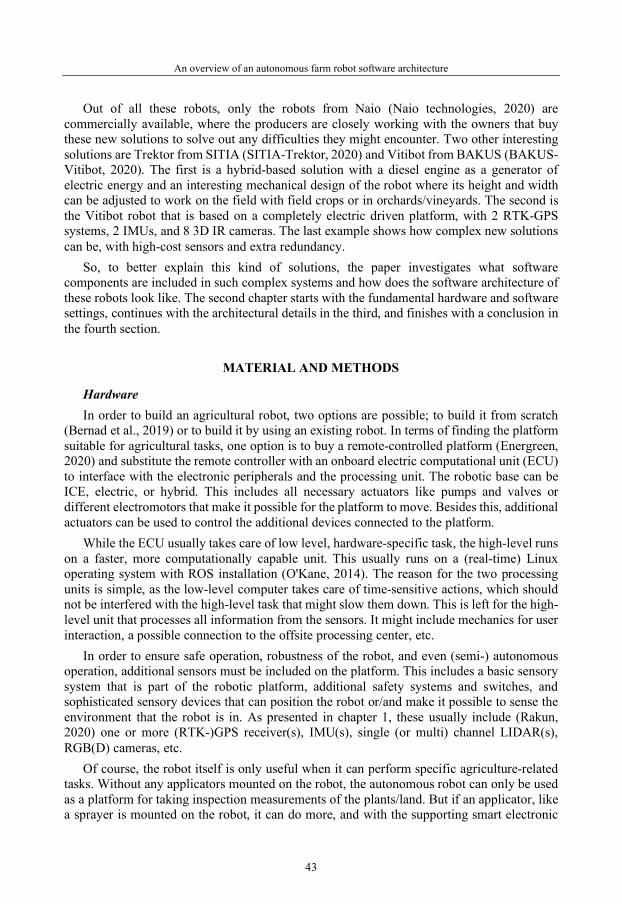
An overview of an autonomous farm robot software architecture
43
Out of all these robots, only the robots from Naio (Naio technologies, 2020) are commercially available, where the producers are closely working with the owners that buy these new solutions to solve out any difficulties they might encounter. Two other interesting solutions are Trektor from SITIA (SITIA-Trektor, 2020) and Vitibot from BAKUS (BAKUS-Vitibot, 2020). The first is a hybrid-based solution with a diesel engine as a generator of electric energy and an interesting mechanical design of the robot where its height and width can be adjusted to work on the field with field crops or in orchards/vineyards. The second is the Vitibot robot that is based on a completely electric driven platform, with 2 RTK-GPS systems, 2 IMUs, and 8 3D IR cameras. The last example shows how complex new solutions can be, with high-cost sensors and extra redundancy.
So, to better explain this kind of solutions, the paper investigates what software components are included in such complex systems and how does the software architecture of these robots look like. The second chapter starts with the fundamental hardware and software settings, continues with the architectural details in the third, and finishes with a conclusion in the fourth section.
MATERIAL AND METHODS
Hardware In order to build an agricultural robot, two options are possible; to build it from scratch
(Bernad et al., 2019) or to build it by using an existing robot. In terms of finding the platform suitable for agricultural tasks, one option is to buy a remote-controlled platform (Energreen, 2020) and substitute the remote controller with an onboard electric computational unit (ECU) to interface with the electronic peripherals and the processing unit. The robotic base can be ICE, electric, or hybrid. This includes all necessary actuators like pumps and valves or different electromotors that make it possible for the platform to move. Besides this, additional actuators can be used to control the additional devices connected to the platform.
While the ECU usually takes care of low level, hardware-specific task, the high-level runs on a faster, more computationally capable unit. This usually runs on a (real-time) Linux operating system with ROS installation (O'Kane, 2014). The reason for the two processing units is simple, as the low-level computer takes care of time-sensitive actions, which should not be interfered with the high-level task that might slow them down. This is left for the high-level unit that processes all information from the sensors. It might include mechanics for user interaction, a possible connection to the offsite processing center, etc.
In order to ensure safe operation, robustness of the robot, and even (semi-) autonomous operation, additional sensors must be included on the platform. This includes a basic sensory system that is part of the robotic platform, additional safety systems and switches, and sophisticated sensory devices that can position the robot or/and make it possible to sense the environment that the robot is in. As presented in chapter 1, these usually include (Rakun, 2020) one or more (RTK-)GPS receiver(s), IMU(s), single (or multi) channel LIDAR(s), RGB(D) cameras, etc.
Of course, the robot itself is only useful when it can perform specific agriculture-related tasks. Without any applicators mounted on the robot, the autonomous robot can only be used as a platform for taking inspection measurements of the plants/land. But if an applicator, like a sprayer is mounted on the robot, it can do more, and with the supporting smart electronic

P. Lepej, J. Rakun
44
systems, it can adjust the operation by using variable rate technology (Wei, 2017) to optimize the use of resources, minimize the negative effects and maximize the profit (Rakun, 2020).
Software In addition to the hardware components, the robot must include the necessary software.
This includes the software for the ECU and software for the high-level processing unit. The software defines how the robot behaves and what it is capable of. It could be implemented as a straightforward state machine, or it could be developed as a black box that is driven by artificial intelligence methods that learn by using predefined representative learning sets.
A de facto in robotic’s word is ROS, which stands for Robotic Operating System (Quigley et al., 2009). ROS is a meta-operating system installed on a Linux operating system. It provides a number of libraries and tools for different robotic applications; it includes hardware drivers, device drivers, visualizers, messages passing, and package management, all of this as open-source software. ROS supports code reuse in robotics research and development. It is a distributed framework of processes where processes can be grouped in packages. ROS provides a wide range of possibilities in robotic systems, and it expands its functionality also into the field of agricultural applications.
Rovitis The original Rovitis was developed by dr. Giorgio Pantano from Az. Agricultura Giorgio
Pantano. Rovitis is a vehicle concept for the management of grapevine fields that make it possible to reduce the harm that frequent contact with chemicals may lead (Bianco et al., 2017). For example, on a single yearly production season, a vine grower may come in contact with those products at least 16 times per season. If this is done with the robot, it reduces exposure of the vine grower to chemicals, and if this is done in autonomous mode, the vine grower may do some other work while the chemicals are applied to the plants. All this is possible with an assembly of mechanical, mechatronics, and electrical hardware components controlled by computer programs installed on a specially crafted Personal Computer.
Figure 1 Depicting the Rovitis robot (left) and new Rovitis 4.0 (right) The Rovitis vineyard robot is based on a 414HY Dodich excavator machine that was
modified, with variable displacement closed circuit axial piston pumps added and human-machine interfaces removed, to be used as a field robot. The Rovitis 4.0 is based on an
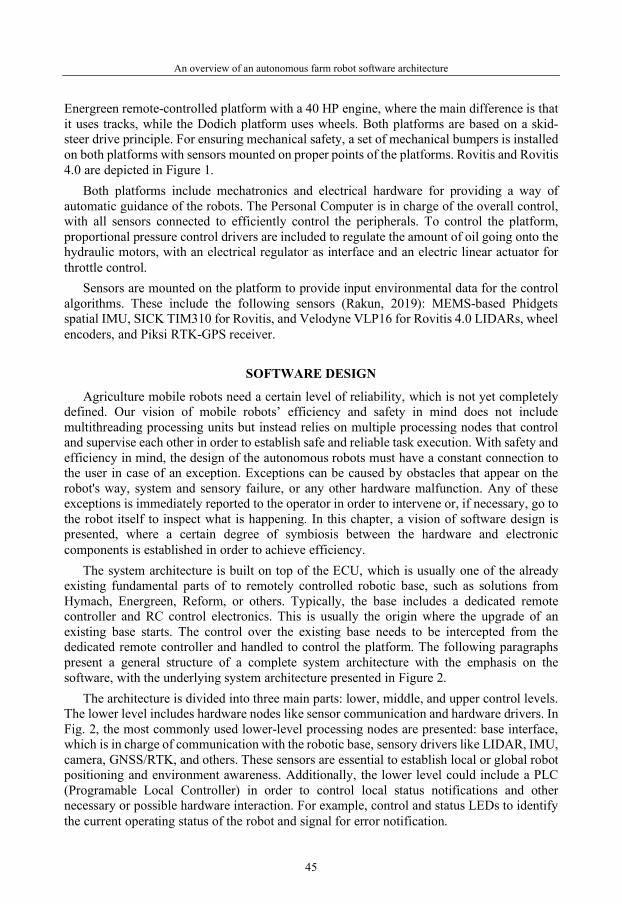
An overview of an autonomous farm robot software architecture
45
Energreen remote-controlled platform with a 40 HP engine, where the main difference is that it uses tracks, while the Dodich platform uses wheels. Both platforms are based on a skid-steer drive principle. For ensuring mechanical safety, a set of mechanical bumpers is installed on both platforms with sensors mounted on proper points of the platforms. Rovitis and Rovitis 4.0 are depicted in Figure 1.
Both platforms include mechatronics and electrical hardware for providing a way of automatic guidance of the robots. The Personal Computer is in charge of the overall control, with all sensors connected to efficiently control the peripherals. To control the platform, proportional pressure control drivers are included to regulate the amount of oil going onto the hydraulic motors, with an electrical regulator as interface and an electric linear actuator for throttle control.
Sensors are mounted on the platform to provide input environmental data for the control algorithms. These include the following sensors (Rakun, 2019): MEMS-based Phidgets spatial IMU, SICK TIM310 for Rovitis, and Velodyne VLP16 for Rovitis 4.0 LIDARs, wheel encoders, and Piksi RTK-GPS receiver.
SOFTWARE DESIGN
Agriculture mobile robots need a certain level of reliability, which is not yet completely defined. Our vision of mobile robots’ efficiency and safety in mind does not include multithreading processing units but instead relies on multiple processing nodes that control and supervise each other in order to establish safe and reliable task execution. With safety and efficiency in mind, the design of the autonomous robots must have a constant connection to the user in case of an exception. Exceptions can be caused by obstacles that appear on the robot's way, system and sensory failure, or any other hardware malfunction. Any of these exceptions is immediately reported to the operator in order to intervene or, if necessary, go to the robot itself to inspect what is happening. In this chapter, a vision of software design is presented, where a certain degree of symbiosis between the hardware and electronic components is established in order to achieve efficiency.
The system architecture is built on top of the ECU, which is usually one of the already existing fundamental parts of to remotely controlled robotic base, such as solutions from Hymach, Energreen, Reform, or others. Typically, the base includes a dedicated remote controller and RC control electronics. This is usually the origin where the upgrade of an existing base starts. The control over the existing base needs to be intercepted from the dedicated remote controller and handled to control the platform. The following paragraphs present a general structure of a complete system architecture with the emphasis on the software, with the underlying system architecture presented in Figure 2.
The architecture is divided into three main parts: lower, middle, and upper control levels. The lower level includes hardware nodes like sensor communication and hardware drivers. In Fig. 2, the most commonly used lower-level processing nodes are presented: base interface, which is in charge of communication with the robotic base, sensory drivers like LIDAR, IMU, camera, GNSS/RTK, and others. These sensors are essential to establish local or global robot positioning and environment awareness. Additionally, the lower level could include a PLC (Programable Local Controller) in order to control local status notifications and other necessary or possible hardware interaction. For example, control and status LEDs to identify the current operating status of the robot and signal for error notification.

P. Lepej, J. Rakun
46
Figure 2 A model of the autonomous field robot software architecture It is important to emphasize the safety features of the presented system design, which is
fundamentally connected to the lower level. The mechanical switches are used as a last resort to stop the mobile robot that is connected to the PLC or to the main STOP button. The next level of safety can be achieved by utilizing the readings from the onboard sensors.
The purpose of the middle level is to perform higher processing operations, like relevant sensory data extraction, steering control, environment detection, and safety. In the presented system design, middle-level safety can be achieved with the high-resolution thermal camera, which proves very reliable when used to detect living objects that emit heat. The other option is a multichannel lidar that can detect dynamic obstacles, which can come on the path of the robot. The details of each processing unit from the middle level are presented in Table 2.
UPP
ER
LEV
EL
MID
DLE
LEV
EL
LOW
ER L
EVEL
HARDWARE DRIVERS: SENSORS, ACTUATORS
PROCESSING LEVEL: SENSOR PROCESSING
HIGHER CONTROL LEVEL: USER INTERFACE
BASE INTERFACE
LIDAR DRIVER
IMU DRIVER
CAMERA DRIVER
GPS/GNSS DRIVER
PLC/DIO DRIVER
TASK CONTR.
ROW NAVIGATION
PC FILTERING
SAEFTY CONTROL
OBSTACLE DETECTOR
LOCALIZATION
TRAJECTORY SERVER
ODOMETRY, GPS+WHEEL
REMOTE CONTROL
WEB SERVER
USER INTERFACE
DIAGNOSTICS ROBOT DESCRIPTION

An overview of an autonomous farm robot software architecture
47
Table 2 Processing units with description and possible outputs
PROCESSING UNIT DESCRIPTION OUTPUT
PC FILTERING
LIDAR provided point cloud needs to be filtered to provide relevant information for row navigation.
Filtered point cloud, ground rows, holes on the ground, etc.
SAFETY CONTROL
Processing images from the thermal camera or LIDAR data in combination with safety features like sensor failure or mechanical switch stops detection.
Safety features – stopping the robot and notifying the user.
ODOMETRY, GPS+WHEELS
Local/global position and sensor fusion.
Sensor fusion output – precise robot location and orientation based on local readings.
LOCALIZATION Combine position sensors like IMU, GNSS/RTK, and odometry in sensor fusion.
Relevant robot position based on the environment, based on global systems.
TRAJECTORY SERVER Storing the current position of the robot to create a trajectory of the robot's past movements.
Trajectory history overview.
OBSTACLE DETECTOR Detection of obstacles on the robot’s path (holes, branches, etc.).
Obstacle detection output – notification and handling.
ROW NAVIGATION The navigation between the crop rows is based on given environmental sensors.
Steady and reliable row navigation.
TASK CONTROL Operator’s controls to select the current task.
Provide multiple functions to control tasks and robot addons.
ROBOT DESCRIPTION The digital representation of the model of the robot, based on sensory data.
Robot awareness in the virtual world.
DIAGNOSTICS Overall diagnostic monitoring for each processing node. System error detection.
The final, upper level of the software architecture includes the local remote control
handled by the operator, which can be used if the operator is physically present on the site.

P. Lepej, J. Rakun
48
The web server node is used to monitor the robot offsite, including its real-time sensory and control information. The user interface can also be implemented on the main processing unit to control and test the operation of the mobile robot. Furthermore, the software architecture for the user’s interactions demands a server-based application to monitor and handle exceptions remotely.
DISCUSSION
As shown by table 1, there are many similar field robot solutions being developed by different research groups where the majority is still in the prototype/development phase. In general, by comparing these to the Rovitis 4.0 robot, it can be concluded that the majority of these systems are much simpler and, consequently, with a much straightforward architecture. Starting with the propulsion, the most ecologically friendly and the easiest approach is to use en electrically driven platform that can be easily controlled, but it has a shorter autonomy in terms of working hours per one charge and still cannot fully compete with ICE based solutions. Next, the simplest way to drive a robot is to use a high precision GPS system, maybe include some safety bumpers, but the robot is driven semi-blind relying on pre-recorded waypoints. Some solutions do include additional sensors, such as LIDARs and cameras, but a sensor fusion-based approach is not common. So, to conclude; in order to build a cheap, capable, reliable, and robust solution, an ICE-based platform, with low costs sensors supported by additional compensation algorithms is the way to go at the moment, but not the easiest to develop.
CONCLUSION
This work presents the underlying software components that are needed to build a modern autonomous field robot that can work in a natural environment, with changing conditions, on its own without any supervision. As shown, this proves to be a challenging task but still solvable using off-the-shelf components and custom-written software supported by a multitasking software stack.
According to the fundamental software architecture, the work has already been implemented, and it is in the testing phase on Rovitis and Rovitis 4.0 robots, where minor adjustments are still being made to finetune the parameters of each robot to improve the performance. But the concept is sound and proven to work in a real-world environment.
In future work, we plan to test new sensory systems, such as new solid-state LIDARS, multi/hyper-spectral cameras, and others to widen the collection of tasks the robot is capable of and can do in one or more runs while driving thru the vineyard. Of course, this new task will be driven by additional components that will expand the presented software architecture.
ACKNOWLEDGMENTS
This project was funded by Italian PSR Veneto 2014-2020 call under grand no. 55 of 04 December 2017.
A special acknowledgment goes to dr. Giorgio Pantano who made it possible to test the presented architecture on Rovitis and Rovitis 4.0 robots.
An overview of an autonomous farm robot software architecture
49
REFERENCES
Fróna, D., Szenderák, J., Harangi-Rákos, M. (2019). The Challenge of Feeding the World. Sustainability 2019, 11, 5816.
Saiz-Rubio, V., Rovira-Más, F. (2020). From Smart Farming towards Agriculture 5.0: A Review on Crop Data Management. Agronomy 2020, 10, 207.
Naio technologies (2020). Retrieved on 15th of October 2020 on https://www.naio-technologies.com/en/.
SITIA – Trektor (2020). Retrieved on 15th of October 2020 on http://www.sitia.fr/en/innovation-2/trektor/.
BAKUS – Vitibot (2020). Retrieved on 15th of October 2020 on https://vitibot.fr/article_presse/bakus-attaque-les-vignes-champenoises/.
Bernad, P., Zajc, A., Friš, R., Mlinarič, J., Rakun, J. (2019). Farmbeast. V: FLOTO, Helga (ed.), GRIEPENTROG, Hans W. (ed.). Proceedings of the 16th Field Robot Event 2018, Bernburg- Strenzfeld, Germany, June 12th-14th, 2018 : Conducted in conjunction with the DLG-Feldtage/ DLG Field Days. Stuttgart: University of Hohenheim, Technology in Crop Production, February 2019. pp. 113-124.
Energreen (2020), Retrieved on 16th of October 2020 on https://en.energreen.it/robo/. O'Kane, J. (2014). A Gentle Introduction To ROS, Columbia S.C. Rakun, J. (2020). Robotics in agriculture: on-line presentation on 2nd the workshop on ICT in
agriculture "Mobile applications, robotics and drones in agriculture", Erasmus + VIRAL project, Mostar, 6th October, 2020.
Wei, D. (2017). Variable-rate Technology: A Critical Element in Precision Water-saving Irrigation. Irrigation & Drainage Systems Engineering, 06(02). https://doi.org/10.4172/2168-9768.1000e128.
Rakun, J. (2020). Smart canopy measuring system for the reduction of plant protection agents use : Technical reporting [of] OIS-AIR project. Hoče: University of Maribor, Faculty of Agriculture and Life Sciences.
Quigley, M., Conley, K., Gerkey, B., Faust, J., Foote, T., Leibs, J., Wheeler, R., & Andrew, N. (2009). ROS: an open-source Robot Operating System, ICRA Workshop on Open Source Software, Willow Garage, Menlo Park, California.
Bianco, P., Bellucci, V., De Falco, C., Deromedis, S., Gentilini, P., Carlo, J., Modenesi, C., Taffetani, F., Tiberti, M. (2017). Note sull'inquinamento da pesticidi in Italia (Notes on Italian pesticide pollution). GRE Lazio, European Consumers.
Rakun, J. (2019). Robotika v slovenskem kmetijstvu : predstavitev na dogodku "Od preciznega k pametnemu kmetijstvu", ki je potekal v okviru kmetijsko živilskega sejma AGRA 2019, 25. avgusta 2019.


48th Symposium "Actual Tasks on Agricultural Engineering", Zagreb, Croatia, 2021
51
AUTOMATIC STEERING OF COMBINE HARVESTER FOR AGRICULTURAL AND ENVIRONMENTAL
MONITORING Eglė JOTAUTIENĖ*, Antanas JUOSTAS
*E-mail of corresponding author: [email protected] Institute of Agricultural Engineering and Safety, Agriculture Academy, Vytautas Magnus University,
Studentu str. 15A, Akademija, 48005 Kaunas District, Lithuania
ABSTRACT
Some individual technological processes of modern agricultural machines already controlled by different automatic systems. One of them is automatic steering of combine harvester. Its most widely used system in precision harvesting. Automatic steering system is a complex combination of various components, where decision-making and operation carried out by electronics and machinery. Such systems can estimate and control preselected separation and grain cleaning losses, threshing drum load, engine load, grain layer thickness in a feeder house conveyor, and other machine operating parameters.
The aim of the study is to determine the benefits of an automatic steering system for a combine harvester at a farm. The obtained results showed that it is expedient to use automatic driving in grain harvesters when harvesting grain. When automatic steering was used, the fuel consumption was by 32 ± 2.3 % lower than with manual steering. Combines with manual steering mode at headlands in average spent 7.7 % of total combine harvesting time. The combine harvester operating data, collected in Telemetry system, successfully can be used for agricultural and environmental monitoring and decision-making.
Keywords: automatic steering, combine harvester, telemetry system, headland, time distribution.
INTRODUCTION
Farmers using the modern techniques and farming technologies want to make sure that it not only performs technological processes in a quality way but most importantly does not harm the soil. Machines for proper operation in different soil types, under different climatic
48. ACTUAL TASKS ON AGRICULTURAL ENGINEERING
Original scientific paper

E. Jotautienė, A. Juostas
52
and crop conditions, it is important to properly adapt and optimize the settings of these machines (Craessaertset et al., 2010).
Modern technologies make it possible to install automatic steering systems in many self-propelled agricultural machines, including combine harvesters. Self-propelled machines can be steered by mechanical sensors, optical sensors or satellite driven GPS signal. Automatic steering systems controlled by mechanical and optical sensors no longer require additional costs. These automatic steering systems no longer require additional costs to maintain a corrective signal, and optical sensors control a driving accuracy of up to ± 5cm. The accuracy of the work also influenced by soil preparation, field hilliness, etc. Therefore, there should be no large clods of soil and the soil structure should be similar to that prepared for sowing. (EASY on field, 2015).
The automatic machine steering system with optical sensors significantly optimizes production costs. This type of automatic steering system allows a more rational use of the available equipment and its implements for the performance of technological processes in agricultural work. At the same time, a larger field area is prepared, as well as no need for drivers with a high level of driving skills (Šumanovac et al., 2007). When driving with automatic steering systems, the driver can spend more time setting the implement parameters and adapting the machine to the current conditions. Even in bad weather conditions such as dust, fog, etc., working in hilly or wooded areas would always use the full width of the implement. It is very easy to return to automatic driving mode when you take over manual driving when you are trying to get around poles, wetlands or other obstacles.
Optical control systems can use steering with laser sensors or steering with cameras. With the help of these sensors, the control of the machines can be oriented according to the edge of the crop, the technological line, the furrow made by the marker, the swaths made by grass or cereals, and so on (Baillie et al., 2018).
Driving with optical sensors is very useful and facilitates the work process when working with wide combine harvesters, at high speeds or poor visibility. Harvesting significantly reduces the work stress for the driver. This maintenance-free optical sensor, at an angle of 6º in the horizontal plane, continuously sends invisible light signals to the left and right, thus recognizing the set field parameters for precise driving (EASY, 2014). The edge of growing plants and stubble reflects a ray of light. The sensor measures the return time of the reflected light and thus determines the exact boundary between cut and uncut plants. The machine automatically driven along this plant boundary with an accuracy of up to 10 cm. Such a field edge tracking system is extremely reliable even when removing stubborn grain or working on slopes. This system requires no additional service or maintenance (EASY, 2014).
The most modern combines are also equipped with automatic cruise control systems. Such a system selects the driving speed according to the set controlled parameters and continuously adjusts it. This system monitors the working speed by evaluating parameters such as: grain loss in the straw separation and cleaning systems, as well as the threshing system and engine load, the height of the grain delivered to the feed rake conveyor and the parameters of other sensors installed in the combine (Craessaertset et al., 2010).
The automatic ground speed system changes the driving speed depending on the grain yield, environmental conditions and other factors to ensure a constant supply of crop flow to the threshing mechanism. The operation of these systems is ensured by the control and
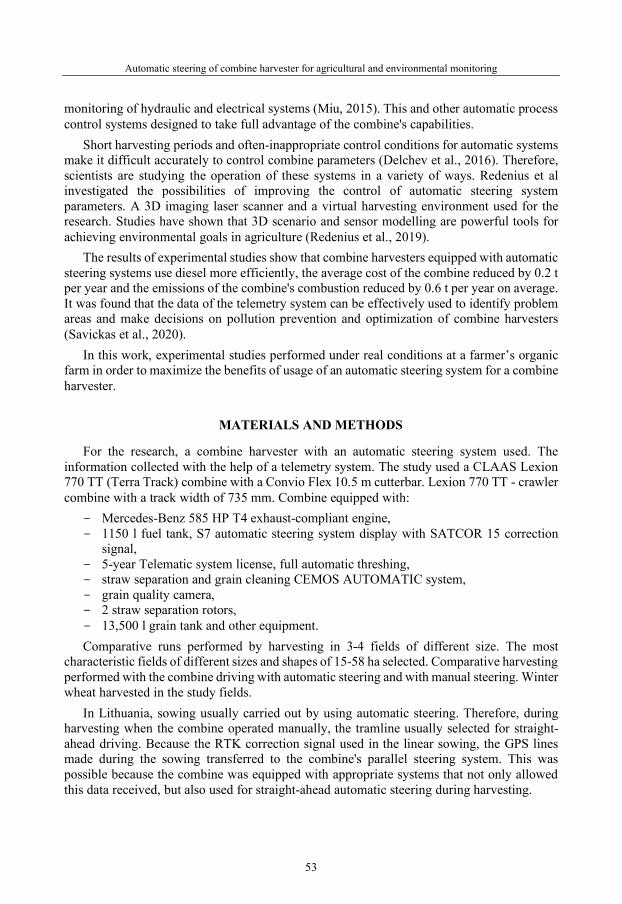
Automatic steering of combine harvester for agricultural and environmental monitoring
53
monitoring of hydraulic and electrical systems (Miu, 2015). This and other automatic process control systems designed to take full advantage of the combine's capabilities.
Short harvesting periods and often-inappropriate control conditions for automatic systems make it difficult accurately to control combine parameters (Delchev et al., 2016). Therefore, scientists are studying the operation of these systems in a variety of ways. Redenius et al investigated the possibilities of improving the control of automatic steering system parameters. A 3D imaging laser scanner and a virtual harvesting environment used for the research. Studies have shown that 3D scenario and sensor modelling are powerful tools for achieving environmental goals in agriculture (Redenius et al., 2019).
The results of experimental studies show that combine harvesters equipped with automatic steering systems use diesel more efficiently, the average cost of the combine reduced by 0.2 t per year and the emissions of the combine's combustion reduced by 0.6 t per year on average. It was found that the data of the telemetry system can be effectively used to identify problem areas and make decisions on pollution prevention and optimization of combine harvesters (Savickas et al., 2020).
In this work, experimental studies performed under real conditions at a farmer’s organic farm in order to maximize the benefits of usage of an automatic steering system for a combine harvester.
MATERIALS AND METHODS
For the research, a combine harvester with an automatic steering system used. The information collected with the help of a telemetry system. The study used a CLAAS Lexion 770 TT (Terra Track) combine with a Convio Flex 10.5 m cutterbar. Lexion 770 TT - crawler combine with a track width of 735 mm. Combine equipped with:
- Mercedes-Benz 585 HP T4 exhaust-compliant engine, - 1150 l fuel tank, S7 automatic steering system display with SATCOR 15 correction
signal, - 5-year Telematic system license, full automatic threshing, - straw separation and grain cleaning CEMOS AUTOMATIC system, - grain quality camera, - 2 straw separation rotors, - 13,500 l grain tank and other equipment. Comparative runs performed by harvesting in 3-4 fields of different size. The most
characteristic fields of different sizes and shapes of 15-58 ha selected. Comparative harvesting performed with the combine driving with automatic steering and with manual steering. Winter wheat harvested in the study fields.
In Lithuania, sowing usually carried out by using automatic steering. Therefore, during harvesting when the combine operated manually, the tramline usually selected for straight-ahead driving. Because the RTK correction signal used in the linear sowing, the GPS lines made during the sowing transferred to the combine's parallel steering system. This was possible because the combine was equipped with appropriate systems that not only allowed this data received, but also used for straight-ahead automatic steering during harvesting.

E. Jotautienė, A. Juostas
54
In the absence of automatic steering synchronization, at the beginning of the selected driving pattern, the operator selects the AB line mode for straight-ahead steering in the automatic steering display. After that, travel point A selected.
Figure 1 Schematic of parallel automatic steering by using AB straight-line mode
The harvesting started by running the combine parallel to the technological lines. The
minimum distance required to mark point B of straight-ahead driving (AB line) is at least 20 m. After driving more than the specified distance and placing point B, the automatic steering system, with the help of satellites, divides the field into parallel lines according to the set working width of the combine. From this moment on, the combine operator activates the automatic steering function, enabling the combine to drive in the direction of scratched lines. Driving errors are possible after driving more than 20 m and selecting parallel driving mode. The consequence is to move away from the parallel technological line. To avoid this, operators usually choose the B point at the end of the field. This ensures accuracy for subsequent run on parallel lines. Harvesting carried out at the headlands with the combine driving every second pass.
Harvested field yields and passages recorded and stored on the microprocessor of the combine’s navigation system.
RESULTS AND DISCUSSION
Data for research analysis selected from the data stored in the combine's telematics system. The system stores various machine data sets: exact machine location, work dates, downtime, combine operating parameters, and other. The combine worked in three fields with the automatic steering system activated. These fields are marked EJ1 (21 ha), EJ2 (32 ha), EJ3 (58 ha), respectively. In addition, in three fields with manual steering, where the fields marked - EJ4 (38 ha), EJ5 (45 ha), EJ6 (15 ha). As in practice, it is almost impossible to find fields of the same area or configuration, the following parameters chosen for the analysis: fuel consumption per hectare and grain tons. Figure 2 shows diagrams of fields harvested using
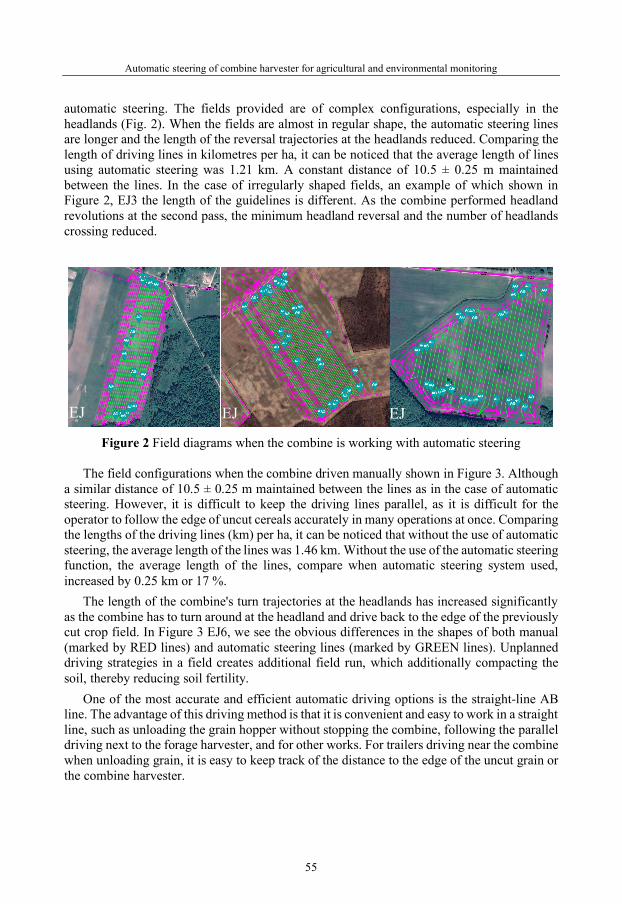
Automatic steering of combine harvester for agricultural and environmental monitoring
55
automatic steering. The fields provided are of complex configurations, especially in the headlands (Fig. 2). When the fields are almost in regular shape, the automatic steering lines are longer and the length of the reversal trajectories at the headlands reduced. Comparing the length of driving lines in kilometres per ha, it can be noticed that the average length of lines using automatic steering was 1.21 km. A constant distance of 10.5 ± 0.25 m maintained between the lines. In the case of irregularly shaped fields, an example of which shown in Figure 2, EJ3 the length of the guidelines is different. As the combine performed headland revolutions at the second pass, the minimum headland reversal and the number of headlands crossing reduced.
Figure 2 Field diagrams when the combine is working with automatic steering
The field configurations when the combine driven manually shown in Figure 3. Although
a similar distance of 10.5 ± 0.25 m maintained between the lines as in the case of automatic steering. However, it is difficult to keep the driving lines parallel, as it is difficult for the operator to follow the edge of uncut cereals accurately in many operations at once. Comparing the lengths of the driving lines (km) per ha, it can be noticed that without the use of automatic steering, the average length of the lines was 1.46 km. Without the use of the automatic steering function, the average length of the lines, compare when automatic steering system used, increased by 0.25 km or 17 %.
The length of the combine's turn trajectories at the headlands has increased significantly as the combine has to turn around at the headland and drive back to the edge of the previously cut crop field. In Figure 3 EJ6, we see the obvious differences in the shapes of both manual (marked by RED lines) and automatic steering lines (marked by GREEN lines). Unplanned driving strategies in a field creates additional field run, which additionally compacting the soil, thereby reducing soil fertility.
One of the most accurate and efficient automatic driving options is the straight-line AB line. The advantage of this driving method is that it is convenient and easy to work in a straight line, such as unloading the grain hopper without stopping the combine, following the parallel driving next to the forage harvester, and for other works. For trailers driving near the combine when unloading grain, it is easy to keep track of the distance to the edge of the uncut grain or the combine harvester.
EJ
EJ
EJ
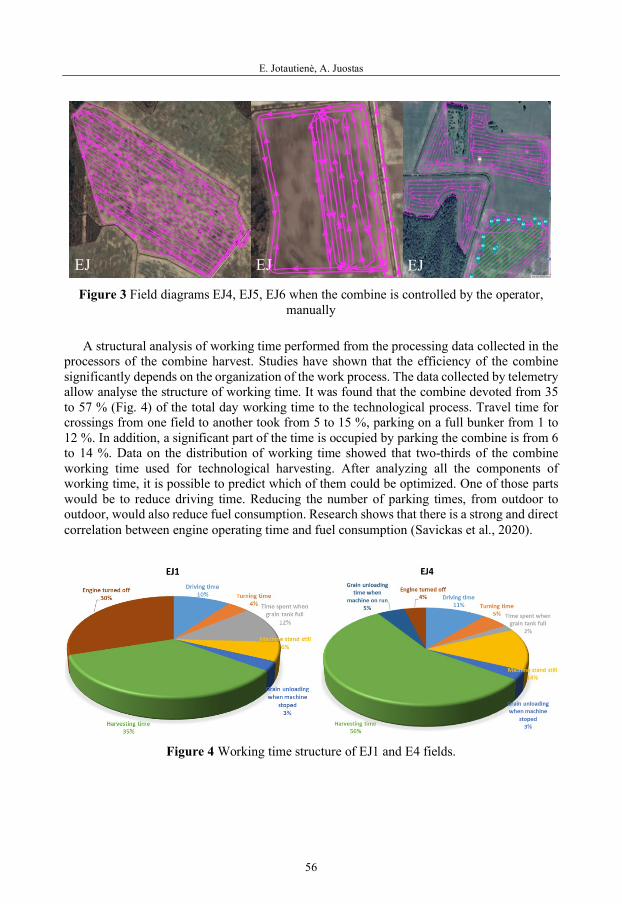
E. Jotautienė, A. Juostas
56
Figure 3 Field diagrams EJ4, EJ5, EJ6 when the combine is controlled by the operator,
manually A structural analysis of working time performed from the processing data collected in the
processors of the combine harvest. Studies have shown that the efficiency of the combine significantly depends on the organization of the work process. The data collected by telemetry allow analyse the structure of working time. It was found that the combine devoted from 35 to 57 % (Fig. 4) of the total day working time to the technological process. Travel time for crossings from one field to another took from 5 to 15 %, parking on a full bunker from 1 to 12 %. In addition, a significant part of the time is occupied by parking the combine is from 6 to 14 %. Data on the distribution of working time showed that two-thirds of the combine working time used for technological harvesting. After analyzing all the components of working time, it is possible to predict which of them could be optimized. One of those parts would be to reduce driving time. Reducing the number of parking times, from outdoor to outdoor, would also reduce fuel consumption. Research shows that there is a strong and direct correlation between engine operating time and fuel consumption (Savickas et al., 2020).
Figure 4 Working time structure of EJ1 and E4 fields.
EJ
EJ
EJ
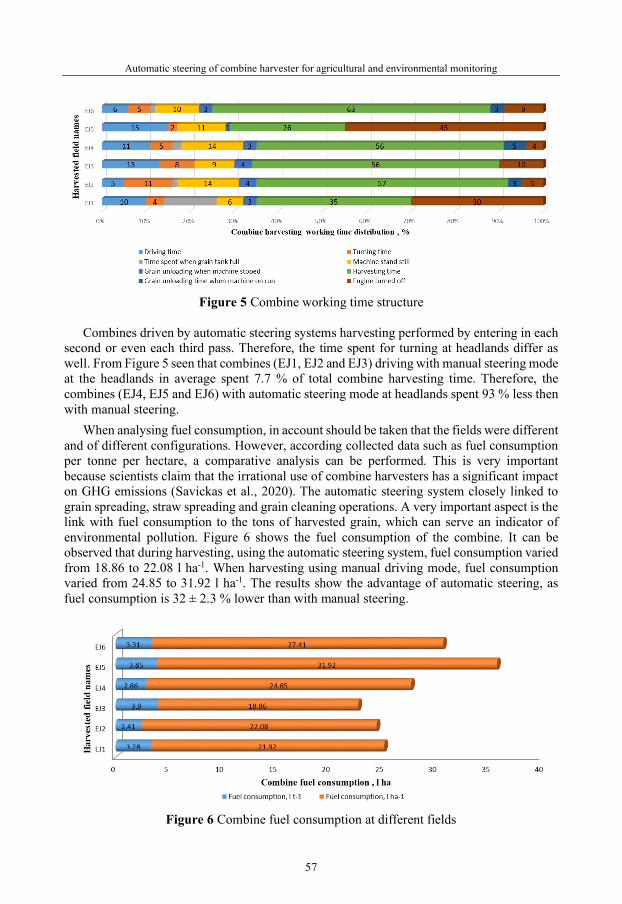
Automatic steering of combine harvester for agricultural and environmental monitoring
57
Figure 5 Combine working time structure
Combines driven by automatic steering systems harvesting performed by entering in each
second or even each third pass. Therefore, the time spent for turning at headlands differ as well. From Figure 5 seen that combines (EJ1, EJ2 and EJ3) driving with manual steering mode at the headlands in average spent 7.7 % of total combine harvesting time. Therefore, the combines (EJ4, EJ5 and EJ6) with automatic steering mode at headlands spent 93 % less then with manual steering.
When analysing fuel consumption, in account should be taken that the fields were different and of different configurations. However, according collected data such as fuel consumption per tonne per hectare, a comparative analysis can be performed. This is very important because scientists claim that the irrational use of combine harvesters has a significant impact on GHG emissions (Savickas et al., 2020). The automatic steering system closely linked to grain spreading, straw spreading and grain cleaning operations. A very important aspect is the link with fuel consumption to the tons of harvested grain, which can serve an indicator of environmental pollution. Figure 6 shows the fuel consumption of the combine. It can be observed that during harvesting, using the automatic steering system, fuel consumption varied from 18.86 to 22.08 l ha-1. When harvesting using manual driving mode, fuel consumption varied from 24.85 to 31.92 l ha-1. The results show the advantage of automatic steering, as fuel consumption is 32 ± 2.3 % lower than with manual steering.
Figure 6 Combine fuel consumption at different fields

E. Jotautienė, A. Juostas
58
The analysis of fuel consumption per ton of grain used, it can be seen that both the use of automatic driving and driving manually they were similar. With automatic steering, fuel consumption varied from 2.41 to 3.9 l t-1. When driving manually, they varied from 2.86 to 3.85 l t-1. The results show the advantage of automatic steering, as fuel consumption is 4.49 ± 0.3 % less than with manual steering.
CONCLUSIONS
The use of automatic steering ensures more precise driving in the field. When harvesting performed by manual driving mode, fuel consumption varied from 24.85 to 31.92 l ha-1. Compared with automatic steering fuel consumption was by 32 ± 2.3 % lower than with manual steering.
Using automatic steering mode, the headland turns took less time compare to manual one. Combines with manual steering mode at headlands in average spent 7.7 % of total combine harvesting time. Therefore, the combines with automatic steering mode at headlands spent 93 % less then combines with manual steering.
The combine harvester operating data, collected in Telemetry system, can be used for agricultural and environmental monitoring.
REFERENCES
Baillie, C. P., Thomasson, J. A., Lobsey, C. R., McCarthy, C. L., & Antille, D. L. (2018). A review of the state of the art in agricultural automation. Part I: Sensing technologies for optimization of machine operation and farm inputs. In 2018 ASABE Annual International Meeting (p. 1). American Society of Agricultural and Biological Engineers.
Craessaerts, G., de Baerdemaeker, J., Missotten, B., & Saeys, W. (2010). Fuzzy control of the cleaning process on a combine harvester. Biosystems engineering, 106(2), 103-111.
Delchev, N., Trendafilov, K., Tihanov, G., & Stoyanov, Y. (2016). Grain combines productivity according to various unloading methods-in the field and at the edge of the field. Agricultural Science and Technology, 8(3), 221-226.
EASY on field. (2015). CLAAS steering systems. CLAAS KGaA mbH, Muhlenwinkel 1, Harsewinkel, Germany.
EASY. (2014). CLAAS steering systems. CLAAS KGaA mbH, Muhlenwinkel 1, Harsewinkel, Germany.
Miu, P. (2015). Combine harvesters: theory, modeling, and design. CRC Press. Redenius, J., Belau, S., Irmer, D., Ruckelshausen, A., Middelberg, R., Spiekermann, S., ... & Hertzberg,
J. ‘Virtual Harvesting’as a Key Element in the Development of a novel LiDAR based Combine Harvester Steering System.
Savickas, D., Steponavičius, D., Kliopova, I., & Saldukaitė, L. (2020). Combine harvester fuel consumption and air pollution reduction. Water, Air, & Soil Pollution, 231(3), 1-11.
Šumanovac, L., Ban, J., & Kiš, D. (2007). Universal grain combine harvesters used in the precision agriculture system. Balkan Agricultural Engineering Review, 10, 2-9.
48th Symposium "Actual Tasks on Agricultural Engineering", Zagreb, Croatia, 2021
59
THE STATE OF PRECISION AGRICULTURE IN SLOVENIA IN COMPARISON TO FOUR CENTRAL
EUROPEAN COUNTRIES Erik RIHTER*, Damijan KELC, Denis STAJNKO, Peter VINDIŠ, Peter BERK,
Peter POLIČ, Miran LAKOTA, Jurij RAKUN *E-mail of corresponding author: [email protected]
University in Maribor, Faculty of Agriculture and Life Sciences, Pivola 10, 2311 Hoče, Slovenia
ABSTRACT
Precision agriculture (PA) technologies (PATs) represent tools and strategies that help to use resources more efficiently, reduce costs, increase sustainability and improve the accuracy of work on farms. Rapid technological progress in agriculture has contributed to the increase of PATs implementation worldwide, including Central Europe. A survey questionnaire was conducted in this research, where 236 farmers responded. The study's main objective is to compare the state and use of advanced technologies in agriculture in 4 different countries and determine where Slovenia stands. The structures of the independent variables in the country surveys were determent to be very similar. The results show that, on average, 40% of all respondents in all surveyed countries do not yet use PATs on their farms but want to in the near future. In all research countries, the highest percentage of respondents answered that the inhibitory factor “initial investment” has the greatest impact on inhibiting the use of these technologies. In general, all respondents consider PA tools to be important for daily use on the farm. The respondents believe that most of the possible data that can be obtained with the PATs are important and would be useful for them. Although farms in Slovenia have some specific demographic and regional specifics, the survey shows that these do not significantly stand out from other countries' average results. The surveyed countries have different characteristics and structures of agriculture, but the results are still comparable. The diversity of farm structure in Europe is a major problem in developing appropriate guidelines for the successful development of precision agriculture. With a lot of cooperation and research, the future development of PA is positive, many upgrades and developments can be expected.
Keywords: precision agriculture, precision agriculture technology, survey
48. ACTUAL TASKS ON AGRICULTURAL ENGINEERING
Preliminary communication
E. Rihter, D. Kelc, D. Stajnko, P. Vindiš, P. Berk, P. Polič, M. Lakota, J. Rakun
60
INTRODUCTION
Rapid technological development and the implementation of new concepts for more sustainable agriculture are among the challenges on European and also global level. The promotion and adoption of innovation are often cited as the key to achieving certain goals and challenges in agriculture. One of these concepts is precision agriculture (hereafter PA), which has been recognized in recent years as one of the most innovative and research-intensive scientific fields in agriculture. Europe's innovation potential in PA is great and an important lever for agricultural prosperity (Possas et al., 1996; Standing Committee on Agricultural Research [EU SCAR], 2012). PA is developing into an innovative solution and includes data-based technologies. This includes the use of modern technologies that make it possible to reduce spatial changes over time and make the production process more homogeneous (EurActiv, 2015).
Precision agriculture technologies (hereafter PATs) are used to monitor and measure the targeting of specific agronomic operations, taking into account the actual needs of different crops and the variability between or within fields (Krishna, 2013). PATs (automation of agricultural machinery, geospatial tools, sensor and information systems, etc.), in addition to creating accurate integrated data sources needed for spatial changes decisions, contribute to diagnostic data that link mapped field locations to the most appropriate decisions on sowing, fertilizer application, irrigation, plant, crop and other pesticides (Du et al., 2008).
Precision agriculture market and implementation The North American market plays a leading role in PA. The European, Asian, and South
American markets also have a significant share (EurActiv, 2015; Roland, 2015). BIS Research (2016) predicts average annual growth of 13 percent per year in the global precision engineering market. The market value by 2022 is estimated at $ 7.6 billion dollars.
Khosla (2011) states that PA has enjoyed tremendous expansion and popularity in some parts of the world, especially where more intensive agricultural practices are present. Farms use advanced mechanization in various agricultural industries. He points out that PA is often misinterpreted as an expensive, complex technological innovation that should only be used by more developed countries and large farms.
Numerous studies have been conducted around the world to evaluate the level of implementation of PATs depending on the region or focus on the functionality of a particular technology. An important step towards expanding the development and use of PA in Europe was the European Parliament resolution in 2016, which called for promoting the use of new technologies in agriculture. This study by the European Parliamentary Research Service [EPRS] (2016), conducted by European Parliament at PA and examining the future of agriculture in Europe, found that the use of PATs has accelerated since 2000. Despite a wide range of technological solutions, only 25% of farms on European soil contained components from PA. The European agricultural market has a well-established ecosystem as a public and private investment capacity. There is also a high level of professionalism, but there is a lack of large-scale agricultural land and entry costs are somewhat lower than in the U.S. market (Roland, 2015).
In a Germany-wide survey, between 6.6% and 11% of the surveyed farmers used PATs for data collection and recording (Reichardt et al., 2009). In 2012, a survey carried out as part

The state of precision agriculture in Slovenia in comparison to four central European countries
61
of the GeoWebAgri project in Germany, Finland, and Denmark showed that 36% of the farmers surveyed already had previous experience using PATs (Bligaard, 2013).
Research in Poland found that although 46% of respondents use modern technologies in agriculture on their farms, only 10% of them use global positioning systems, and 40% use variable rate technology (VRT) for fertilizer application and plant protection products (Borusiewicz et al., 2016).
Terravita magazine (Martarello, 2018) reports that Italy is at the forefront of available technologies, providing for farmers. However, the actual use of advanced technologies in agricultural fields in Italy is reported to be only 1%, according to the data. Italy's national guidelines (Falzarano, 2018) on precision agriculture state that PATs implementation is limited for a variety of reasons: small farms, difficult investments, the high average age of farmers, the age of machinery, and lack of internet connections in rural areas.
The state of PA in Hungary was also studied by eNET Internet Research (2019), where 1210 farmers were surveyed in 2017 and 1294 farmers in 2018. The results show that 23% of farmers in Hungary already use PATs. It is written that some of the surveyed farmers may not even known that the solutions they use are essentially PA. The study identifies the lack of financial resources and knowledge required to use PATs as the main obstacles to their implementation.
According to a survey KeyQuest (2018) on the use of digital technologies, which surveyed 400 field farmers in Austria, about 6% of all Austrian farms currently use PATs, and 13% of farmers already use GPS-based technologies. However, about 87% of the farmers in this survey had at least a rough idea of PA, and 17% of the farmers are considering using PATs in the future. The study showed that the larger the farm, the more PATs are used. PATs are also used more frequently by younger and more skilled farmers.
PK diagnostic technologies are increasingly accepted compared to PK application technologies. The number of agricultural data collection devices worldwide was estimated at 30 million in 2015 and is expected to increase to 75 million by 2020 (Mitchell et al., 2018).
Against the background of these facts and the results of the above-mentioned research on the use of PATs in some Central European countries, the main objective of this work was to evaluate PATs by farmers and assess the state of precision agriculture in Central Europe. The purpose of the research is also to compare the results of the research with Slovenia and some Central European countries. The reason for the research was that after reviewing the literature, it was found that, unlike some Central European countries, a similar analysis of the state of implementation of PATs has not yet been conducted in Slovenia. This research should also provide answers about the importance of certain data and methods, which are available in PATs. Considering the specific factors of agriculture in general in Europe and Central Europe, it is assumed that the implementation of technologies and the importance of certain methods of PA does not differ statistically from Slovenia and the other four countries. It is assumed that PATs is not yet widely used among respondents, for which there are several reasons.
METHODS AND SCOPE OF THE STUDY
This study was conducted as part of the Central Europe project Transfarm 4.0, funded by the Interreg Central Europe Program to promote cooperation on common challenges in
E. Rihter, D. Kelc, D. Stajnko, P. Vindiš, P. Berk, P. Polič, M. Lakota, J. Rakun
62
Central Europe. Transfarm 4.0 consists of 10 partners from 5 Central European countries; Slovenia, Austria, Poland, Italy and Hungary.
The aim of the project is to identify new agricultural solutions that meet farmers' needs and demand for technology. Pilot actions will be carried out in all these regions to contribute to innovation in PA, regional agendas to increase investment and specialization, and a regional benchmarking of the potential of PA. The priorities of the project are therefore knowledge transfer, innovation, and cooperation, which have been identified in the literature as important factors for the implementation of PA (EPRS, 2016; Transfarm 4.0, 2019).
The participating countries in this project are known for their specific properties related to agriculture, such as: average farm size, average age of farmers, educational structure, agricultural activity (Eurostat, 2018). In order to understand the growing or declining interest in PATs, some preliminary assessments of the international scenario regarding the implementation and application of precision or advanced technologies in agriculture are required.
For this reason, an online survey was conducted among all the five partner countries. The respondents data was collected in the period from 12th of August to 18th of October 2019 from farms in selected regions of each country. This sample of 236 randomly selected farms provided insight into the condition or position of farmers in relation to the implementation of PA. Due to the scale of the project survey, which was generally related to farmers requirements for technological innovation in agriculture, focus only on issues that are relevant to this research. A survey questionnaire was a research instrument that consisted of two parts. The first part related to information on farm owners (e.g. age, education) and farm characteristics of farms. The second consisted of questions relating to the PA, the importance of implementing PA, and its use in various agricultural work processes. Survey responses were processed using the IBM SPSS 25 software package. The results are presented in the contingency tables and presented with fundamental statistical analysis. With the help of farmers' responses, the hypotheses are accepted or rejected. Randomly selected farms provided insight into the state of PATs implementation and use. The results of responses my help to provide more comprehensive solutions for more frequent adoption of new technologies on farms.
RESULTS AND DISCUSSION
Of all (236) surveyed farmers shown in table 1, the majority age group (28%) consisted of the persons aged 30-39 years, then farmers aged 40-49 (26%), then farmers in the age group 50-59 (25%). The age group (20-29) consisted of 19%, and the smallest group (10-19) consisted of 2%. In Slovenia, most respondents (39%) answered in the age group (30-39). Other results on the age groups of respondents are statistically very comparable to other partner countries.
The results of the educational structures of all respondents in the survey show that university education (university degree, bachelor, master, Ph.D.) with 53% predominates, then farmers with high-school education (26%). The others (21%) had a primary school education. Compared to other project partners; Slovenia stands out with a high proportion of respondents (83%) with higher education.
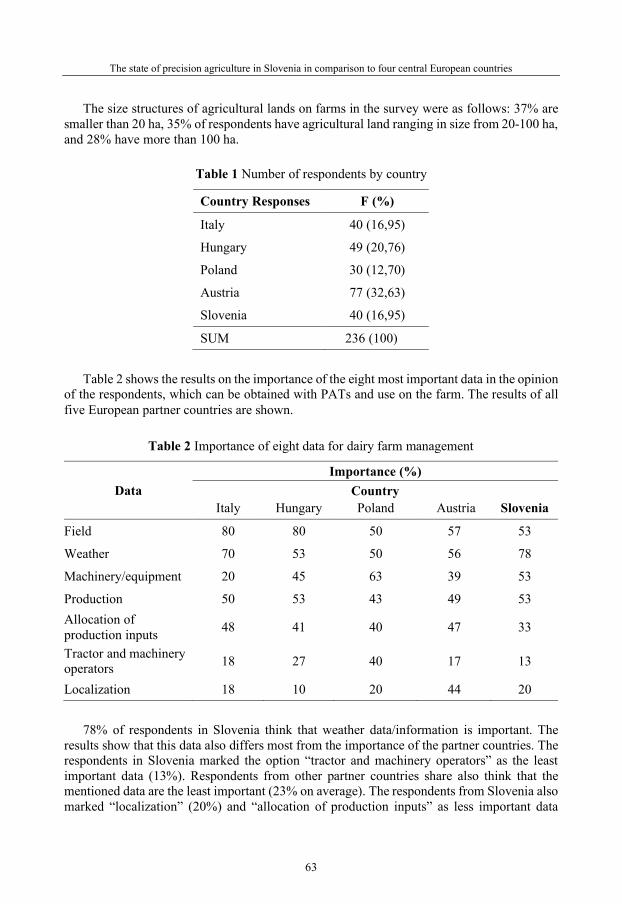
The state of precision agriculture in Slovenia in comparison to four central European countries
63
The size structures of agricultural lands on farms in the survey were as follows: 37% are smaller than 20 ha, 35% of respondents have agricultural land ranging in size from 20-100 ha, and 28% have more than 100 ha.
Table 1 Number of respondents by country
Country Responses F (%)
Italy 40 (16,95)
Hungary 49 (20,76)
Poland 30 (12,70)
Austria 77 (32,63)
Slovenia 40 (16,95)
SUM 236 (100) Table 2 shows the results on the importance of the eight most important data in the opinion
of the respondents, which can be obtained with PATs and use on the farm. The results of all five European partner countries are shown.
Table 2 Importance of eight data for dairy farm management
Data Importance (%)
Country Italy Hungary Poland Austria Slovenia
Field 80 80 50 57 53
Weather 70 53 50 56 78
Machinery/equipment 20 45 63 39 53
Production 50 53 43 49 53 Allocation of production inputs 48 41 40 47 33
Tractor and machinery operators 18 27 40 17 13
Localization 18 10 20 44 20 78% of respondents in Slovenia think that weather data/information is important. The
results show that this data also differs most from the importance of the partner countries. The respondents in Slovenia marked the option “tractor and machinery operators” as the least important data (13%). Respondents from other partner countries share also think that the mentioned data are the least important (23% on average). The respondents from Slovenia also marked “localization” (20%) and “allocation of production inputs” as less important data

E. Rihter, D. Kelc, D. Stajnko, P. Vindiš, P. Berk, P. Polič, M. Lakota, J. Rakun
64
(33%). As the results in table 2 show, respondents in all five surveyed countries surveyed consider field data to be most important. A large percentage (about 50% of all respondents) of the importance was also attributed by respondents to production data.
Table 3 lists 14 different PATs. Respondents had to choose which technologies they had already acquired and used.
Table 3 Adopted PATs in the farm
PATs Already acquired and in use in the farm (%)
Country Italy Hungary Poland Austria Slovenia
Agro-weather stations 53 43 20 22 25
App's 58 29 20 86 28
Agro-app's for crop farming 10 27 17 48 25
Agro-app's for livestock farming 5 6 13 18 0
Global position systems 33 10 17 48 5
Sensors for crop farming 28 6 3 3 8
Yield modeling systems 15 8 7 13 3
Drones 5 8 10 4 5
Precision irrigation systems 38 4 10 3 5
Technology for site-specific fertilization 30 24 13 12 5
Technology for site-specific tillage and sowing 8 16 20 12 20
Technology for site-specific chemical plant protection 13 18 20 12 8
Augmented reality 5 0 7 1 3
Farm management and information systems 23 12 17 34 8
The results in table 3 show that, on average, respondents from all participating countries,
including Slovenia, are the least likely to use “augmented reality” (2%) and “drones” (6%) on their farms. According to the respondents, various applications (“apps”) related to agriculture are generally the most used (51%). In second place (32%) in terms of the frequency of use of PATs is the “agro-weather stations” by all farmers surveyed. If other countries of the project partners are compared, it is established that Slovenia statistically deviates the most in the implementation of “global position systems”. The average use of the mentioned systems of the project partners is 27% (Slovenia 5%). There are also large deviations in the use of “technology for site-specific fertilization”. In Slovenia, this technology was used by 5% of the respondents. In the other four countries, as shown in the table, the average is close to 20%.
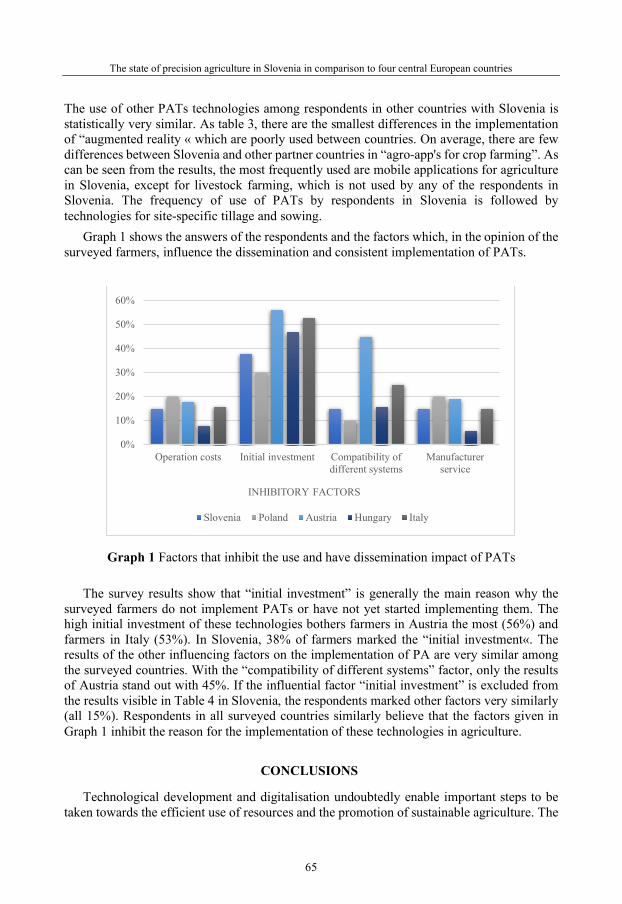
The state of precision agriculture in Slovenia in comparison to four central European countries
65
The use of other PATs technologies among respondents in other countries with Slovenia is statistically very similar. As table 3, there are the smallest differences in the implementation of “augmented reality « which are poorly used between countries. On average, there are few differences between Slovenia and other partner countries in “agro-app's for crop farming”. As can be seen from the results, the most frequently used are mobile applications for agriculture in Slovenia, except for livestock farming, which is not used by any of the respondents in Slovenia. The frequency of use of PATs by respondents in Slovenia is followed by technologies for site-specific tillage and sowing.
Graph 1 shows the answers of the respondents and the factors which, in the opinion of the surveyed farmers, influence the dissemination and consistent implementation of PATs.
Graph 1 Factors that inhibit the use and have dissemination impact of PATs
The survey results show that “initial investment” is generally the main reason why the
surveyed farmers do not implement PATs or have not yet started implementing them. The high initial investment of these technologies bothers farmers in Austria the most (56%) and farmers in Italy (53%). In Slovenia, 38% of farmers marked the “initial investment«. The results of the other influencing factors on the implementation of PA are very similar among the surveyed countries. With the “compatibility of different systems” factor, only the results of Austria stand out with 45%. If the influential factor “initial investment” is excluded from the results visible in Table 4 in Slovenia, the respondents marked other factors very similarly (all 15%). Respondents in all surveyed countries similarly believe that the factors given in Graph 1 inhibit the reason for the implementation of these technologies in agriculture.
CONCLUSIONS
Technological development and digitalisation undoubtedly enable important steps to be taken towards the efficient use of resources and the promotion of sustainable agriculture. The
0%
10%
20%
30%
40%
50%
60%
Operation costs Initial investment Compatibility ofdifferent systems
Manufacturerservice
INHIBITORY FACTORS
Slovenia Poland Austria Hungary Italy

E. Rihter, D. Kelc, D. Stajnko, P. Vindiš, P. Berk, P. Polič, M. Lakota, J. Rakun
66
implementation and application of more advanced technologies in the agricultural sector still falls short of expectations, despite rapid progress in the European Union. The main reason for this is the great diversity of agriculture and the distribution of these technologies in the EU. There are other reasons: farmers’ personalities and family structures, maturity and readiness to use PATs, poor internet connectivity, economic factors, the role of policies and institutions, cooperation, etc. (European Commission, 2018; Say et. al., 2018; Massot, 2019).
This study assesses the state of precision agriculture in Central Europe. The main objective was to compare the implementation of PA in Slovenia with other partner countries in Central Europe. The state of PA was determined on the basis of results on influencing inhibiting factors according to the respondents and on the basis of the use of individual technologies of PA. For a clearer evaluation for the future, the survey also shows the importance of data reported by farmers in Central Europe, that can be obtained with PATs.
The results show that, in general of the PATs, various agricultural-related applications (» app's «) are currently the most used (51%). PATs are still poorly implemented and used among respondents. Respondents still very rarely use » augmented reality « (2%) and » drones « (6%) on their farms.
A large percentage (about 50% of all respondents) of importance was also attributed to production data by the respondents. The biggest reason why the surveyed farmers do not implement PATs is the initial investment (over 30% in all surveyed countries). The results of the respondents in Slovenia are generally very similar to the results of the partner countries and do not differ statistically. Our study had some limitations, e.g., there is a possibility that some respondents did not know the true meaning of PA, although a definition was given in the survey.
Studies (EU SCAR, 2012) emphasize that in the implementation of PATs, attention must be paid to the treatment of small and medium-sized farms, as one obstacle to a more mass implementation in European Union and the creation of an appropriate common agricultural policy is the great European diversity of agriculture and specific structures. Studies (European Commission, 2018; Massot, 2019) mention that advanced technologies are often associated with high start-up costs. PA is often associated with the use of large and heavy machinery, which can entail risks as farmers have to sell more to pay for the debt incurred by the purchase of the equipment.
In general, there is insufficient information on the actual distribution of PA in all parts of the world, not only in the EU. There is often a lack of financial resources and knowledge aboutthese technologies. It is expected that the implementation of the PATs will slowly become self-evident, but a lot of work and effort needed to identify appropriate measures for the CAP, the participation of all stakeholders, and farmers’ perception of these technologies. This study can help in future research and development activities in the field of implementation of PA, especially for countries in European Union and beyond.
ACKNOWLEDGEMENTS
This research was co-financed by the project by INTERREG CE program, Transfarm project, under grant number CE1550.

The state of precision agriculture in Slovenia in comparison to four central European countries
67
REFERENCES
BIS Research. (2016). Global precision agriculture market – analysis and forecast, 2016-2022. Retrieved on 15. September at https://bisresearch.com/industry-report/global-precision-agriculture-industry-forecast.html
Bligaard, J. (2013). Identified user requirements for precision farming in Germany, Finland, and Denmark. Geospatial ICT Infrastructure for Agricultural Machines and FMIS in Planning and Operation of Precision Farming: 1–12. Aarhus: GeoWebAgri.
Borusiewicz, A., Kapela, K., Drozyner, P., Marczuk, T. (2016). Application of Precision Agriculture Technology in Podlaskie Voivodeship. Agricultural Engineering: 20(1), 5–11.
Du, Q., Chang, N. Bin, Yang, C., Srilakshmi, K. R. (2008). Combination of multispectral remote sensing, variable rate technology, and environmental modelling for citrus pest management. Journal of Environmental Management: 86(1), 14–26.
ENet. (2019). Idehaza is hódít a precíziós mezőgazdaság: kütyükkel a jobb hozamért. Retrieved on 8. September at https://enet.hu/hirek/idehaza-is-hodit-a-precizios-mezogazdasag-kutyukkel-a-jobb-hozamert/
EU SCAR. (2012). Agricultural Knowledge and Innovation Systems in Transition – a reflection paper (Study). Retrieved on 28. August on https://doi.org/10.2777/34991
EurActiv. (2015). Innovation - Feeding the World (Special Report). Retrieved on 16. August at https://euractiv.eu/wp-content/uploads/special-report/euractiv_special_report_ _innovation_feeding_the_world_0-1.pdf
European Commission. (2018). The Common Agricultural Policy at a Glance. The Common Agricultural Policy Supports Farmers and Ensures Europe's Food Security. Retrieved on 23. August at https://ec.europa.eu/info/food-farming-fisheries/key-policies/common-agricultural-policy/cap-glance_en
European Parliament. (2016). Precision agriculture and the future of farming in Europe. European Parliamentary Research Service (EPRS). Brussels: Scientific Foresight Unit (STOA). Retrieved on 20. August on https://www.europarl.europa.eu/RegData/etudes/STUD/2016/581892/EPRS_ STU(2016)581892_EN.pdf
Eurostat. (2018). Agriculture, forestry and fishery statistics. Retrieved on 10. August at https://ec.europa.eu/eurostat/documents/3217494/9455154/KS-FK-18-001-EN-N.pdf/a9ddd7db-c40c-48c9-8ed5-a8a90f4faa3f
Falzarano, P. (2018). Agricoltura di precisione, pubblicate le linee guida nazionali. Retrieved on 10. September at https://agriregionieuropa.univpm.it/it/content/article/31/53/agricoltura-di-precisione-pubblicate-le-linee-guida-nazionali
Interreg Central Europe. (2019). Transfarm 4.0. Retrieved on 30. September 2020 at https://www.interreg-central.eu/Content.Node/Transfarm4.0.html
KeyQuest. (2018). Keyquest erhebt nutzung und sinnhaftigkeit von landwirtschaft 4.0. Retrieved on 17. September at https://www.keyquest.at/news/artikel/keyquest-erhebt-nutzung-sinnhaftigkeit-von-landwirtschaft-4-0/
Krishna, K. R. (Ed.). (2013). Precision Farming: Soil Fertility and Productivity Aspects (1er ed.) Toronto: Apple Academic Press.
Martarello, S. (2018). Agricoltura 4.0 Italia al top per technologia disponibile, ma i campi non sono smart. Retrieved on 19. September 2020 at https://terraevita.edagricole.it/featured/agricoltura-4-0-italia-tecnologia-campi-smart/
Massot, A. (2019). The common agricultural policy (CAP) and the Treaty, 2019. Retrieved on 1. September at https://www.europarl.europa.eu/factsheets/en/sheet/103/the-common-agricultural-policy-cap-and-the-treaty

E. Rihter, D. Kelc, D. Stajnko, P. Vindiš, P. Berk, P. Polič, M. Lakota, J. Rakun
68
Mitchell, S., Weersink, A., Erickson, B. (2018). Adoption of Precision Agriculture Technologies in Ontario Crop Production. Canadian Journal of Plant Science, 98(6), 1384–1388.
Possas, M. L., Salles-Filho, S., Da Silveira, J. M. (1996). An Evolutionary Approach to Technological Innovation in Agriculture: Some preliminary remarks. Research Policy, 25(6): 933–945.
Roland, B. (2016). Bussiness opportunities in precison farming: Will big data feed the world in the future? Strategy Consultants GmbH: Automative Competence Center: 1-12.
Say, S. M., Keskin, M., Sefri, M., Sekerli, Y. E. (2018). Adoption of Precision Agriculture Technologies in Developed and Developing Countries. V A. Isman (ur.), The Online Journal of Science and Technology 8(1): 7–14. Retrieved on 30. August at http://tojsat.net/journals/tojsat/volumes/tojsat-volume08-i01.pdf#page=16

48th Symposium "Actual Tasks on Agricultural Engineering", Zagreb, Croatia, 2021
69
SUSTAINABILITY OF SITE-SPECIFIC FERTILIZATION SYSTEMS
Matthias STETTMER1*, Franz-Xaver MAIDL2, Jürgen SCHWARZENSTEINER3, Kurt-Jürgen HÜLSBERGEN2, Heinz BERNHARDT1 * E-mail of corresponding author: [email protected]
1 Technische Universität München, Lehrstuhl für Agrarsystemtechnik, Dürnast 4, D-85354 Freising, Germany
2 Technische Universität München, Lehrstuhl für Ökologischen Landbau und Pflanzenbausysteme, Liesel-Beckmann-Str. 2, D-85354 Freising, Germany
3 Farmtastic Consulting GmbH, Graf-von-Bray-Straße 14, D-94342 Irlbach, Germany
ABSTRACT
The EU Nitrates Directive is part of a comprehensive legal framework of the European Union with the aim of achieving a good ecological status of the ground and surface waters. In particular, the EU Nitrate Directive serves to avoid agricultural nitrate pollution in the groundwater and is implemented in practice through the fertilizer ordinance. As a result of exceeding the nitrate limit of 50 mg NO3 per litre water in some regions of Germany significantly, the options for fertilizing agricultural crops will be clearly limited by a revision of the fertilizer ordinance. In order to protect the competitiveness of farms and the food of mankind in the long term, an even more environmentally friendly and efficient agriculture is necessary. A modern technology to achieve this goal is site-specific fertilization. Adapted fertilization can significantly improve N-efficiency and reduce water pollution.
This paper presents a system comparison of different fertilization methods to increase the N-efficiency, which will be carried out as a Ph.D.-project at the Technical University of Munich. Therefore, concept, experimental setup, methods (and preliminary results) will be shown. The tests are intended to provide information about which fertilization system meets the requirements for sustainable fertilization best in practice. It is expected that the systems will bring advantages of different degrees but will clearly contribute to improving the N-efficiency. First trials indicate that the Albrecht/Kinsey-method is expected to have a positive effect on N-efficiency. Especially with the Albrecht/Kinsey variant the biomass formation seems to be more pronounced with the same amount of nitrogen fertilizer than in the reference variant.
Keywords: Variable rate application, Nitrogen management, Nitrogen use efficiency, Winter wheat
48. ACTUAL TASKS ON AGRICULTURAL ENGINEERING
Preliminary communication

M. Stettmer, F.-X. Maidl, J. Schwarzensteiner, K.-J. Hülsbergen, H. Bernhardt
70
INTRODUCTION
Background The plant nutrient nitrogen plays a special role. On the one hand, it has a very significant
influence on plant growth and yield formation (Kwast, 1966), on the other hand, it can lead to significant water pollution (Strebel et al., 1989). These two points are of great importance for our society. Clean waters are essential for the functioning of our ecosystems. They enable the ecological material cycles and, especially in the form of drinking water, form the basis of human life. However, a resilient agricultural production with correspondingly good yields is just as important, in order to be able to supply the population with regional and high-quality food in the long term. The nitrogen problem in agriculture has not been resolved yet. This problem requires an even more environmentally friendly and efficient agriculture in future (Hahne, 2020). A modern technology to achieve this goal is site-specific fertilization (Prücklmaier, 2020). Adapted fertilization can significantly improve N-efficiency and reduce water pollution (Cui et al., 2010). Many scientists have already carried out studies on how fertilization could be optimized so that high nitrogen surpluses are avoided, and environmental pollution is kept as low as possible while achieving the best possible yields. Site-specific systems have clear advantages in contrast to uniform fertilization (Spicker, 2016; Huber et al., 2003; Raun et al., 2002). However, the quality and advantages of the site-specific systems differ significantly depending on type and method (Schächtl, 2004; Ebertseder et al., 2003; Auernhammer, 2001). Huber et al. (2003) identified the advantages of methods based on plant scoring. Argento et al. (2020) and Vuolo et al. (2019) investigated site-specific fertilization based on remote sensing data in more detail and were able to determine positive effects compared to standardized fertilization. In contrast, Kunkel (2020) also worked with remote sensing data and found some limitations of satellite data regarding fertilization in his research. Prücklmaier (2020) achieved very good results in his research with sensor-based fertilization in winter wheat, winter barley and corn. Maidl et al. (2004) compared fertilizer systems based on a mapping-, online- and online + mapping-approach with uniform fertilization in winter wheat, whereby the online + mapping-approach achieved significantly better results. Vinzent et al (2017) achieved a significant reduction in N balances and N20 emissions compared to uniform fertilization when using the fertilization algorithm for winter rape (Spicker, 2016). Spicker (2016) was able to reduce the fertilizer quantities in winter barley by up to 50 kg N ha-1 compared to uniform fertilization with the same yields using the fertilization algorithm with map overlay-approach. Schmidhalter (2014) also found that the combination of online- + mapping-approaches is necessary for positive environmental impacts and high N-efficiencies.
In conclusion, the superiority of site-specific fertilization approaches over uniform fertilization has been proven, in general. Some studies also compared the different site-specific fertilization approaches and determined that the online + mapping-approach offers the greatest potential.
Research approach The project is based on the proven potential of increasing nitrogen efficiency through site-
specific fertilization in order to generate additional knowledge on the following aspects. In many tests, the individual methods of site-specific fertilization have been compared with uniform fertilization. However, the various systems of site-specific fertilization technology available on the market are hardly compared with one another, so that research is still needed

Sustainability of site-specific fertilization systems
71
at this point. In particular, the practicability of systems of the favoured mapping + online-approach must be investigated in further detail. With the online-approach, plants can be evaluated using reflection measurement, satellite data or by determining the chlorophyll content. These variants must be analysed and compared in more detail in order to gain knowledge about any advantages and disadvantages of the individual approaches. Furthermore, the project aims to find additional options to increase nitrogen efficiency. For this purpose, with the Albrecht/Kinsey-method an alternative fertilization system is being tested.
The aim of this research project is to examine and compare the various methods of site-specific fertilization in more detail to optimize the N-efficiency in arable farming. Important parameters are the determination of nitrogen uptake and biomass formation, yield, nitrogen efficiency and the potential nitrogen loss into the surface- and groundwater. By using the Albrecht/Kinsey-method, there also is an alternative fertilization system tested in this research. The aim is to work out possible advantages of soil fertilization compared to fertilization after plant deprivation.
Hypotheses a) Uniform nitrogen fertilization leads to negative nitrogen balances in high yield
zones, while positive nitrogen balances arise in the low yield zones. b) The various methods of site-specific fertilization increase the nitrogen efficiency to
different degrees. c) The various non-contact measurement methods differ in the characterization of plant
growth and nitrogen uptake. d) Fertilization based on a recommendation by Albrecht/Kinsey improves nitrogen
efficiency. e) Water pollution through nitrate loss is reduced through improved nitrogen efficiency.
MATERIALS AND METHODS
Experiment description In 2020, 2021 and 2022, plot trials are carried out in winter wheat on heterogeneous fields.
The location of the experiments are fields of the Poschinger Bray´sche Güterverwaltung in the Bavarian “Gäuboden” region on very fertile soils. Typically, there is 750 mm of precipitation per year with an average temperature of 8.3 °C at an altitude of 330 m above sea level. From a soil science point of view, the test site is primarily parabrown earth from loess. The experiments are set up in three yield areas (high, medium, and low yield). The same experimental set up is carried out in all three yield areas. Each parcel is 15 m long and 6 m wide. The demarcation of the yield areas will be done through long-term mapping of the biomass growth, the yields and soil-scientific knowledge. The trials are fully randomized and repeated four times. Fertilization with other basic nutrients and plant protection are executed uniformly for the whole field. A parcel combine is used for harvesting. The investigations contain 10 variants, which are shown in Table 1. The variant “Düngeberatungssystem Stickstoff (DSN)” is the calculation model developed by the Bavarian State Institution for Agriculture (LfL). This method is the recommendation of the official consulting and is very common in Bavaria. This model specifies uniform fertilizer quantities per field. The variants “TUMA”, “Yara” and “Vista” are site-specific fertilization methods. The “TUMA” system is

M. Stettmer, F.-X. Maidl, J. Schwarzensteiner, K.-J. Hülsbergen, H. Bernhardt
72
a sensor-based method developed by the Technical University of Munich based on the “wheat-algorithm” by Maidl (2011). The “Yara” variant depicts a system of site-specific fertilization based on chlorophyll measurements, developed by YARA GmbH & Co. KG. Variants four and five are both supplied with nitrogen according to the company VISTA Geowissenschaftliche Fernerkundung GmbH. This method is based on coupling the plant growth model “PROMET” developed by VISTA with current satellite data. In addition, variant five is supplied with supplementary nutrients based on a recommendation by an Albrecht/Kinsey soil analysis.
Table 1 Experimental setup
Variant Fertilization System
1 Düngeberatungssystem Stickstoff (DSN)
2 TUMA
3 Yara
4 Vista
5 Vista + Kinsey
6 0 N (0/0/0)
7 120 N (40/40/40)
8 160 N (60/60/40)
9 200 N (80/80/40)
10 240 N (80/80/80)
Fertilization of the experiments The trials are fertilized in variants 1-5 according to the individual fertilization systems.
Variants 6-10 are predefined nitrogen-levels for determining the optimum yield of the location, so the fertilizer quantities are specified there. The fertilization is divided into three application-dates. It is fertilized at vegetation start (approximately BBCH 25), in growth stage BBCH 31/32 and BBCH 37/39.
Biomass and soil samples To evaluate the experiments, soil samples are taken on three occasions and plant samples
on six occasions. Soil samples are taken at vegetation start (approximately BBCH 25), after harvest and at the beginning of the main seepage period in late autumn in order to be able to characterize the potential nitrate loss. Therefore, the soluble soil nitrate is analyzed. The extractant is used is a CaCl2 solution. The plant samples are taken in BBCH 31/32, BBCH 37/39, BBCH 55 and BBCH 65 to determine the biomass growth and nitrogen uptake. For this purpose, the parcels are divided into a harvest and a sample plot. In the sample plot 1.2 square meters of plants are cut off manually with a battery cutter. At the same time ratings of biomass formation and nitrogen uptake according to the “TUMA”, “Yara” and “Vista” systems are carried out. In BBCH 87 plant samples are manually cut to determine the yield

Sustainability of site-specific fertilization systems
73
structure parameters. During harvest yield and protein content are determined. The biomass is specified by weighing and drying at 105°C. The nitrogen content is defined by NIRS analysis with calibration curves and the Dumas-method.
Statistical analyses Documentation and preparation of the data is carried out in MS Excel. All statistical
analyses are performed with the statistical program R. Regression analysis and investigations of variance are made. Mean values are calculated within the variants and the outliers are removed by box-plot analysis. The chosen significance level is at p < 0.05.
RESULTS AND DISCUSSION
Preliminary data from initial trials in 2020 show that the individual fertilization systems recommend different amounts of nitrogen during vegetation. As a result, differences in yield and nitrogen efficiency can be foreseen after harvest. Therefore, possible differences in relation to potential water pollution through nitrate loss are to be expected depending on the fertilizer systems. Furthermore, ratings during the vegetation of a preliminary test in 2020 suggest a positive influence of the Albrecht/Kinsey recommendation. Therefore, this could be an alternative way to optimize nitrogen efficiency. Figure 1 shows the REIP values of the reflection measurement in growth stage BBCH 65 in the variants “Vista + Kinsey” and “Vista”.
Figure 1 REIP values of the reflection measurement in growth stage BBCH 65 in the
variants “Vista + Kinsey” and “Vista”. In all three yield ranges, the mean value within the repetitions in variant “Vista + Kinsey”
is higher than in the “Vista” variant. This can be demonstrated statistically in the high and medium yield at a significance level of p < 0.05. According to studies by Maidl (2011) and Spicker (2016), the REIP vegetation index in BBCH 65 correlates very well with the yield. However, it should be noted that these are only tendencies of first preliminary data and that
727
728
729
730
731
732
733
734
HE ME NE
REIP values BBCH 65
Vista + Kinsey Vista
B
A
B
A
A A

M. Stettmer, F.-X. Maidl, J. Schwarzensteiner, K.-J. Hülsbergen, H. Bernhardt
74
no concrete results are available yet. Furthermore, it is important to understand that the basis of the Albrecht/Kinsey-method is based on nutrient ratios in soil. Changes in soil properties are very slow processes that last for several years (Albrecht, 1939). However, the parcels from which the above-mentioned preliminary data originate are only fertilized for one year according to the Albrecht/Kinsey-method. This must be considered when assessing the above-mentioned differences.
CONCLUSIONS
Future-oriented agriculture must be in harmony with environmental protection. A central aspect there is efficient and environment-friendly fertilization. The conclusion of the investigations should give a classification regarding the environmental friendliness of the individual fertilization systems. The variants are expected to result in different yields and nitrogen efficiencies. In general, site-specific fertilization is expected to achieve uniform nitrogen balances and increased nitrogen efficiency. However, significant differences between the fertilization systems are suspected. Consequently, there should also be differences in potential water pollution. The noticeable tendencies by fertilization with the Albrecht/Kinsey-method could open further possibilities for agriculture to increase nitrogen efficiency.
REFERENCES
Albrecht, W. A. (1939). Variable Levels of Biological Activity in Sanborn Field after Fifty Years of Treatment 1. Soil Science Society of America Journal, 3(C), 77-82.
Argento, F., Anken, T., Abt, F., Vogelsanger, E., Walter, A., & Liebisch, F. (2020). Site-specific nitrogen management in winter wheat supported by low-altitude remote sensing and soil data. Precision Agriculture, 1-23.
Auernhammer, H. (2001). Precision farming—the environmental challenge. Computers and electronics in agriculture, 30(1-3), 31-43.
Cui, Z., Zhang, F., Chen, X., Dou, Z., & Li, J. (2010). In-season nitrogen management strategy for winter wheat: Maximizing yields, minimizing environmental impact in an over-fertilization context. Field crops research, 116(1-2), 140-146.
Ebertseder, T., Gutser, R., Hege, U., Brandhuber, R., Schmidhalter, U. (2003). Strategies for site-specific nitrogen fertilization with respect to long-term environmental demands. In: STAFFORD, J., WERNER, A. (Eds.): Precision agriculture. Proceedings of the 4th European Conference on Precision Agriculture, Wageningen Academic Publishers, Wageningen, 193-198.
Hahne, J. (2020). Hohe Nitratbelastungen im Grundwasser erfordern verschärfte Maßnahmen in der Landwirtschaft zur Minderung von Nährstoffüberschüssen. Jahrbuch Agrartechnik 2019, Band 31, 31.
Huber, G., Maidl, F. X., & Schächtl, J. (2003). Vergleichende Untersuchungen verschiedener Systeme der Teilschlagdüngung bei Winterweizen. 46. Jahrestagung der Gesellschaft für Pflanzenbauwissenschaften e.V. vom 25. bis 27. September 2003 in Gießen, 67-70.
Kunkel, F. (2020). Nutzung von Satellitendaten für den Standort-spezifischen Pflanzenbau am Beispiel der Talking Fields Basiskarte für den Winterrapsanbau im Anbaujahr 2018/2019. Master Thesis. Hochschule Neubrandenburg, Germany.
Sustainability of site-specific fertilization systems
75
Kwast, A. (1996). Vorstellung des internationalen organischen Stickstoff‐Dauerdüngungsversuchs (IOSDV) Dülmen und Auswertung der Erträge und N‐Entzüge. Archives of Agronomy and Soil Science, 40(2), 133-143.
Maidl, F. X. (2011). Verfahren zur Bestimmung des Düngerbedarfs, insbesondere des Stickstoff-Düngerbedarfs und Vorrichtung zur Durchführung des Verfahrens. Patentnr. DE 102011050877.
Maidl, F. X., Huber, G., & Schächtl, J. (2004). Strategies for site specific nitrogen fertilisation in winter wheat. In Proc. 7. Int. Conf. On Prec. Agriculture, Minnesota/USA.
Prücklmaier, J. X. (2020). Feldexperimentelle Analysen zur Ertragsbildung und Stickstoffeffizienz bei organisch-mineralischer Düngung auf heterogenen Standorten und Möglichkeiten zur Effizienzsteigerung durch computer- und sensorgestützte Düngesysteme. Doctoral dissertation. Technische Universität München, Germany.
Raun, W. R., Solie, J. B., Johnson, G. V., Stone, M. L., Mullen, R. W., Freeman, K. W., Thomason, W. E., & Lukina, E. V. (2002). Improving nitrogen use efficiency in cereal grain production with optical sensing and variable rate application. Agronomy Journal, 94(4), 815-820.
Schächtl, J. (2004). Sensorgestützte Bonitur von Aufwuchs und Stickstoffversorgung bei Weizen- und Kartoffelbeständen. Doctoral dissertation. Technische Universität München, Germany.
Schmidhalter, U. (2014). Sensorgestützte Ermittlung des Nährstoffbedarfs. VDLUFA-Schriftenreihe 70, Kongressband 2014, p. 57-66, Hohenheim.
Spicker, A. B. (2016). Entwicklung von Verfahren der teilflächenspezifischen Stickstoffdüngung zu Wintergerste (Hordeum vulgare L.) und Winterraps (Brassica napus L.) auf Grundlage reflexionsoptischer Messungen. Doctoral dissertation. Technische Universität München, Germany.
Strebel, O., Duynisveld, W. H. M., & Böttcher, J. (1989). Nitrate pollution of groundwater in western Europe. Agriculture, ecosystems & environment, 26(3-4), 189-214.
Vinzent, B., Fuß, R., Maidl, F. X., Hülsbergen, K. J. (2017). Efficacy of agronomic strategies for mitigation of after harvest N2O emissions of winter oilseed rape. European Journal of Agronomy. Vol. 89, p. 88-96.
Vuolo, F., Essl, L., Sandén, T., & Spiegel, H. (2019). Multidisziplinäre Überlegungen zur nachhaltigen N-Düngung unter Berücksichtigung der Möglichkeiten der satellitengestützten Präzisionslandwirtschaft. Dreiländertagung OVG–DGPF–SGPF, Vienna, Feb 20–22, 2019. In: Kersten TP (Hrsg.), Dreiländertagung OVG–DGPF–SGPF Photogrammetrie-Fernerkundung-Geoinformation–2019. ISBN: 0942–2870.


48th Symposium "Actual Tasks on Agricultural Engineering", Zagreb, Croatia, 2021
77
DESIGNING A COMMON FRAMEWORK FOR CLIMATE CHANGE IMPACT ASSESSMENT IN AGRICULTURE
FOR THE WESTERN PART OF ROMANIA Vlad MĂRĂZAN1*, Antoanela COZMA2, Rareş HĂLBAC - COTOARĂ - ZAMFIR1
*E-mail of corresponding author: [email protected] 1Department of Overland Communication Ways, Foundation and Cadastral Survey (CCTFC),
Politehnica University of Timișoara, 300006 Timișoara, România 2Department of Soil Science, Banat University of Agricultural Sciences and Veterinary Medicine
"King Michael I of Romania" from Timișoara, 300645 Timișoara, România
ABSTRACT
Anthropogenic actions have a significant impact on climate variability and change. Thus, climate change represents a key challenge for both sustainable development and agriculture, for economic growth and for prosperity. In light of recent climate observations, a bigger focus is to be set on designing and defining a common climate change impact assessment.
The aim of this paper is to present a version of a climate change impact assessment based on sustainable development but in the same time offering low-carbon footprint. Modern technology such as radio waves and satellite images together with local weather station observations and the use of drones and other sensor equipped devices allows a better rendering of the local climate situation. This enables better understanding of agriculture, environment and industry related climate induced threats. Impact assessment shall thus be done in such a manner that local and regional development are to be continued, but special emphasis shall be placed on strategies which imply low-carbon footprint during the implementation of the strategy and afterwards.
Combining the above-mentioned technology with climate change scenarios, and thus creating climatological hazard maps, offers a better perspective of area-related hazards and therefore customized mitigation and adaptation measures are to be developed. The impact assessment implies that both mitigation and adaptation may have different and conflicting goals, and that these are taken into consideration. Adding assets and liabilities but also the social and economic impact assessment together with the need for complex and sustainable agriculture lead to a complex framework in which all factors are taken into consideration to ensure sustainable development.
Keywords: climate change, mitigation and adaptation measures, sustainable development, impact assessment, agricultural engineering
48. ACTUAL TASKS ON AGRICULTURAL ENGINEERING
Original scientific paper

V. Mărăzan, A. Cozma, R. Hălbac–Cotoară–Zamfir
78
INTRODUCTION
Nowadays, human society faces numerous extreme climate events greatly influencing environment and population. The extreme temperature and precipitation events causing natural catastrophes had the highest frequency in the recent decades at global and national scale. They were characterized by long persistence, duration and high intensity triggering more and more hazards, which greatly affect environment, society but also agriculture.
Mitigating the effects of climate change in agriculture is a key objective in the European Union’s strategic development action. Thus, interdisciplinary actions are to be implemented in order to ensure a smooth approach for identifying and correlating the research and development activities with assets and processes.
The main change that occurs in the climate system is the increase in mean annual temperature, the lack of precipitation in arid areas and the prevalence of severe weather events. Putting all these together, it is clear that agriculture is one key sector in which climate change produces a lot of damage and thus, the need for mitigation strategies and adaptation measures is a priority for developing countries.
At regional level, climate change scenarios show that for the next decade a rise in temperature of 0.64° C to 0.69° C compared to 1901 (Busuioc et all, 2010) is present in each of the three climate change scenarios developed by the Intergovernmental Panel for Climate Change. The greatest impact will arise in the southern part of Romania, mainly Oltenia and Dobrogea. For Banat region, models show that due to the western circulation, there will be no significant temperature rise until the mid of the 21st century (Sandu et all., 2008).
To better understand the impact of extreme weather conditions on natural vegetation and crops, the spatial and temporal dynamics of vegetation is essential. As for Timiş county, our research pattern, heat waves (HW) are expected to become more frequent and severe as climate changes with now unknown consequences for the biodiversity and agriculture.
Studies regarding climate variability and change regarding the Western part of Romania have been published, but with more emphasis on general development as opposed to agriculture (Şerban, 2010).
In 2016, almost all farms in Romania were run by families or a small group of people. This type of farms with an income of less than 8000 € per year accounts for 94.6% of all shares, while medium sized farms account for 5.3% and big farms with an income of more than one quarter of a million Euro account for only 0.1% of all shares (EUROSTAT, 2018).
DEFINING RESEARCH AREA AND METEOROLOGICAL CHARACTERISTICS
In order to ensure data quality, the National Weather Service of Romania (Administraţia Naţională de Meteorologie) logs and records all meteorological parameters which make up the climatological archive. The coverage of all Romania is ensured by seven Regional Forecasting Centers. Banat Regional Forecasting Center records all the meteorological data for Banat region and thus also for Timiş county. Romania has a transitional temperate-continental climate and it is characterized by oceanic influences from the West, Mediterranean influences from the South-West and cold continental influence from the North-East. Because of the limited space, only some meteorological characteristics have been presented and

Designing a common framework for climate change impact assessment in agriculture for the western part of Romania
79
analyzed. For agriculture the most important are the temperature values, the precipitation quantities, the solar radiation, the nebulosity and severe weather events. Besides these, the atmospheric circulation pattern has to be integrated in order to provide synoptic data for the critical evaluation of the meteorological characteristics.
Figure 1 Regional Forecasting Centers of the National Weather Service
(www.meteoromania.ro) For this study, four weather stations have been selected. Since the majority of the county’s
surface (77%) is plain, hills account for 19% and mountains represent only about 3.45% of the total surface, for agricultural needs the following weather stations have been selected (Drinovan, 1973). Climate is usually defined as the statistical description in terms of the mean and variability of relevant quantities over a period of time ranging from months to thousands or millions of years (WMO, 2017). Since the guidelines accept a timeline of 30 years in regard to defining a climatological period, the timeframe 1979 – 2009 has been chosen. Data for these stations has been processed from both The Climate of Romania (Sandu et all., 2008) and from Climate Change Report for the “International Arrival Terminal” investment objective at Traian Vuia International Airport (CCR-LRTR) Timişoara (Mărăzan, 2018).
Maximum mean monthly temperature is positive during the entire year. Peaks reach 28.5°C at Sânnicolau Mare station during the summer (July – August), a slight smaller value is recorded at Banloc and Timisoara stations (28.2°C) and the lowest of the maximum mean monthly temperatures was recorded at Lugoj weather station. This is due to the fact that the Timiş river crosses the city in the vicinity of the station. The maximum annual mean is 16.7°C for all the stations which take part in this study.

V. Mărăzan, A. Cozma, R. Hălbac–Cotoară–Zamfir
80
Table 1 Weather stations in the Timiş county
Weather station
Altitude. (m)
Elevation level
Geographical coordinates
River basin
Year of establishment Latitude Longitude
Sânnicolau Mare 85 plain 46°04’ 20°37’ Aranca 1939
Banloc 83 plain 45°23’ 21°08’ Timiş 1942
Timişoara 86 plain 45°46’ 21°15’ Bega 1872
Lugoj 123 plain 45°41’ 21°54’ Timiş 1896
Minimum mean monthly temperature is recorded January and its minimum peak is -3.9°C
for Sânnicolau Mare station, -3.4°C for Banloc, Timisoara recorded -3.6°C and Lugoj had the second lowest value -3.7°C. The minimum mean annual temperature was positive for all the stations, with values ranging from 5.8°C to 6.2°C.
Figure 2 Maximum mean monthly temperature and maximum mean annual temperature for the timescale 1979-2009 (processed from The Climate of Romania,
2008 & CCR-LRTR, 2018) The mean monthly temperature ranged from -1.5°C in January at Sânnicolau Mare station
to 22.1°C in July and August at Banloc station. Sânnicolau Mare station had two months of mean negative temperatures, while the rest of the stations had positive values for all the months except for January. The mean annual temperature for the timescale 1979-2009 was 10.7 with lowest value at Lugoj station (10.6°C) and highest value at Banloc station (10.9°C).
0
5
10
15
20
25
30
Sânnicolau Mare Banloc Timişoara Lugoj
Tem
pera
ture
(°C
)
Maximum mean monthly temperature and maximum mean annual temperature (1979-2009)
JanuaryFebruaryMarchAprilMayJuneJulyAugustSeptemberOctoberNovemberDecemberAnnual

Designing a common framework for climate change impact assessment in agriculture for the western part of Romania
81
Figure 3 Minimum mean monthly temperature and minimum mean annual temperature for the timescale 1979-2009 (processed from The Climate of Romania,
2008 & CCR-LRTR, 2018)
Figure 4 Mean monthly temperature and mean annual temperature for the timescale 1979-2009 (processed from The Climate of Romania, 2008 & CCR-LRTR, 2018)
-5
0
5
10
15
20
Sânnicolau Mare Banloc Timişoara Lugoj
Tem
pera
ture
(°C
)
Minimum mean monthly temperature and minimum mean annual temperature (1979-2009)
January
February
March
April
May
June
July
August
September
October
November
December
Annual
-5
0
5
10
15
20
25
Sânnicolau Mare Banloc Timişoara Lugoj
Tem
pera
ture
(°C
)
Mean monthly temperature and mean annual temperature (1979-2009)
January
February
March
April
May
June
July
August
September
October
November
December
Annual
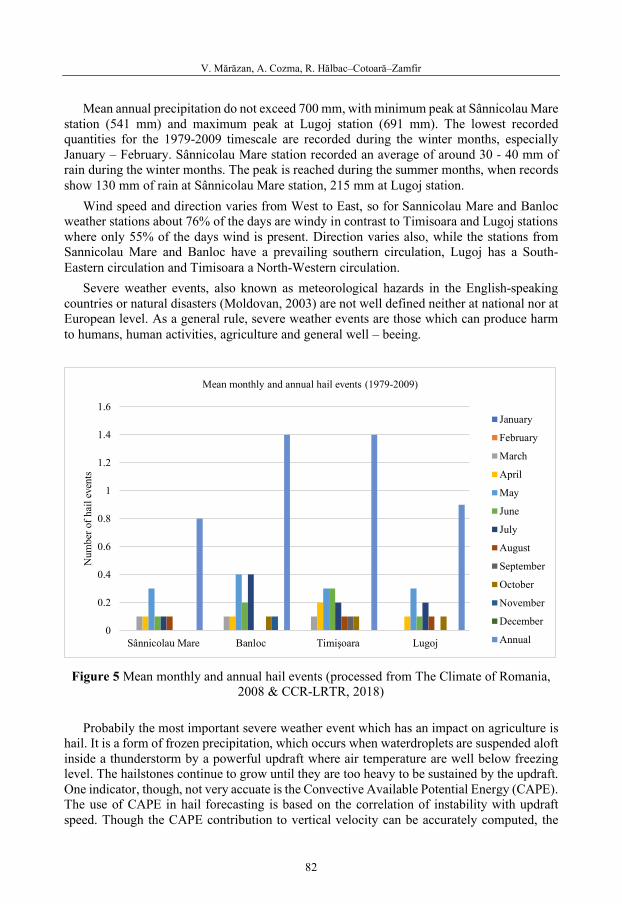
V. Mărăzan, A. Cozma, R. Hălbac–Cotoară–Zamfir
82
Mean annual precipitation do not exceed 700 mm, with minimum peak at Sânnicolau Mare station (541 mm) and maximum peak at Lugoj station (691 mm). The lowest recorded quantities for the 1979-2009 timescale are recorded during the winter months, especially January – February. Sânnicolau Mare station recorded an average of around 30 - 40 mm of rain during the winter months. The peak is reached during the summer months, when records show 130 mm of rain at Sânnicolau Mare station, 215 mm at Lugoj station.
Wind speed and direction varies from West to East, so for Sannicolau Mare and Banloc weather stations about 76% of the days are windy in contrast to Timisoara and Lugoj stations where only 55% of the days wind is present. Direction varies also, while the stations from Sannicolau Mare and Banloc have a prevailing southern circulation, Lugoj has a South-Eastern circulation and Timisoara a North-Western circulation.
Severe weather events, also known as meteorological hazards in the English-speaking countries or natural disasters (Moldovan, 2003) are not well defined neither at national nor at European level. As a general rule, severe weather events are those which can produce harm to humans, human activities, agriculture and general well – beeing.
Figure 5 Mean monthly and annual hail events (processed from The Climate of Romania,
2008 & CCR-LRTR, 2018) Probabily the most important severe weather event which has an impact on agriculture is
hail. It is a form of frozen precipitation, which occurs when waterdroplets are suspended aloft inside a thunderstorm by a powerful updraft where air temperature are well below freezing level. The hailstones continue to grow until they are too heavy to be sustained by the updraft. One indicator, though, not very accuate is the Convective Available Potential Energy (CAPE). The use of CAPE in hail forecasting is based on the correlation of instability with updraft speed. Though the CAPE contribution to vertical velocity can be accurately computed, the
0
0.2
0.4
0.6
0.8
1
1.2
1.4
1.6
Sânnicolau Mare Banloc Timişoara Lugoj
Num
ber o
f hai
l eve
nts
Mean monthly and annual hail events (1979-2009)
January
February
March
April
May
June
July
August
September
October
November
December
Annual

Designing a common framework for climate change impact assessment in agriculture for the western part of Romania
83
effects of shear add considerable uncertainty to instability-based estimates (Vasquez, 2015). Due to its Western circulation, the Timiş county experiences this type of severe weather event especially during the summer months, when convective clouds develop in the Eastern part of Hundary, Northern part of the Republic of Serbia or even in the Western part of Romania.
Figure 6 Hail incidence in Timiş county (Mărăzan, 2018)
Hail incidence varies from a little over one day per year in the Western part of Timiş
county to more than three days per year in the Eastern part. This happens because of the orographic lift and due to the slopes in the Eastern part of Timiş county. The Southern circulation (33.65%) is mostly related to hail phenomenon, followed by the Western circulation (24.03%), North Western circulation (15%). The Eastern circulation accounts as the least related to hail storms (Nichita et all., 2014). The Southern and South Western humid air advection from the Mediterranean Sea is the key factor for the development of Cumulonimbus clouds with high vertical development and strong updraft currents.
Cloud cover is a meteorological characteristic which depends mostly on general atmospheric circulation, on convection and active surface particularities. The mean annual value for the Western part of Romania is around 5.6 – 5.9 out of a tenth and the maximum value is recorded during the winter. The value during winter exceeds 7 out of a tenth. The lowest nebulosity value is endorsed in August at a value of 4 out of a tenth. The annual insolation average is around 2000-2100 hours, with the annual maximum reaching over 2500 hours, while the minimum was 1580 hours (Săulescu, 2014).

V. Mărăzan, A. Cozma, R. Hălbac–Cotoară–Zamfir
84
FRAMEWORK PROPOSAL
In order to establish a common framework, some steps have been brought together in order to ensure a smooth analysis of the entire condition of agriculture. The following steps have been proposed for evaluation of climate change induced risks in agriculture.
Sensitivity is the degree to which a system is affected, either adversely or beneficially, by climate variability or change. The effect may be directed or indirect (IPCC, 2007, 2012).
Exposure means the nature and degree to which a system is exposed to significant climatic variations. Exposure is determined by the type, magnitude, timing and speed of climate events and variation to which a system is exposed (World Bank, 2009).
Vulnerability represents the degree to which a system is susceptible to, and unable to cope with, adverse effects of climate change, including climate variability and extremes. Vulnerability is a function of the character, magnitude or rate of climate change and variation to which a system is exposed, its sensitivity, and its adaptive capacity (Engle, 2011).
1. The climate sensitivities shall be determined in relation to a range of climate variables and second effect or climate-related hazards. As for agriculture and agricultural engineering, the most important climate variables for the Western part of Romania are precipitation, temperature, radiation, humidity. Hail phenomenon can be counted as second effect due to the damage it can cause for both crops and land.
2. The evaluation of the exposure to current observed climate shall be done in different locations, but in a narrow area in order to investigate all the climate hazards as well as to determine frequency and intensity. Risk assessment maps regarding amount of precipitation, temperature values, solar radiation, freezing risk, heat waves and cold waves and flooding shall be produced and interpreted.
3. The evaluation of the exposure to future climate changes allows the revealing of aspects which are questionable in regard to current climate hazard exposure, to future climate and to future climate change induced hazards.
4. Assessing the vulnerability of the observed climate implies establishing the degree of sensitivity to current climatic conditions and associated risks.
5. Assessing the vulnerability to future climate implies the analysis of the sensitivity in accordance to climatic scenarios, thus establishing and implementing mitigation strategies for future risks.
6. The assessment of the general risk implies a hol-atomistic analysis of both current climate situations but also future climate situation. Exposure and vulnerabilities are to be linked together in order to link it as a cause-chain effect.
7. Severe weather events analysis implies a multi-phase process which is conducted in order to establish if severe weather events are to be present in current time or in the future and if these events have or might have an impact on agriculture in the region.
8. The identification of the adaptation options implies finding holistic solutions and / or recommendations for agriculture in the desired area.
9. The appraising of the adaptation options implies the development of a cost-benefit analysis and the ranking of the previously found solutions and/ or recommendations for agriculture.
Designing a common framework for climate change impact assessment in agriculture for the western part of Romania
85
One of the issues which arises in both agricultural sector as well as a part of the spatial planning field is that climate change has a major impact over time. Thus, besides this framework, a solution must be found in order for people working in agricultural field to cope with both underfunded researches, no diversification of the crops in larger areas, lack of competitive research in the field, lack of technology regarding climate change and hydrotechnical engineering. The biggest issue is the lack of access to more active intervention services in the atmosphere. Greece is a good example of active atmospheric intervention, in which planes are used in order to seed clouds and thus protect the local farmers as well as the entire community from hail and heavy rainfall.
CONCLUSION
The agricultural sector is susceptible to major changes due to climate change. There is no need to redesign agricultural practices, but to implement adaptation measures and mitigation strategies. Medium to long term planning together with governmental policies are to be applied in such a manner that people working in the agricultural industry are to be made aware of the risks and to be open minded to the agriculture of the future. Countries like Israel use their land in order to grow crops, although the Sinai desert lacks water. Through research, farmer-oriented policies and practices together with a well-developed climate change strategy, agriculture in developing countries, such as Romania can develop its agricultural potential. Romania has the ability to integrate both hydrotechnical as well as soil conservation measures but also to develop, at local and regional level, policies for developing skills to better understand and cope with climate change and climate change risks. The proposed framework will be implemented into a cross border study, which involves the Western part of Romania and the South Banat District of Serbia. The smooth transition to a more resilient agriculture is crucial for local farmers, which do not have a great financial power in order to implement own climate change strategies and measures to protect the land and crops from future climate risks.
REFERENCES
Busuioc, A. (2010). Climate variability and change in Romania (in Romanian). ProUniversitaria, București.
Drinovan, Gh. (1973). Timiş county geographical-historical and economic-touristic micro monography (in Romanian). People’s Council of Timiş county, Timişoara.
Engle, N., L. (2011). Adaptive capacity and its assessment. Global Environmental Change, 21 (2), 647-656.
European Union. (2018). Agriculture, forestry and fishery statistics 2018 edition. IPCC. (2007). Climate change 2007: Impacts, adaptation and vulnerability. Contribution of Working
Group II to the Fourth Assessment Report of the Intergovernmental Panel on Climate Change [Parry, M., L., Canziani, O., F., Palutikof, J., P., van der Linden, P., J., Hanson, C., E., (eds)]. Cambridge University Press, Cambridge.
IPCC. (2012). Managing the risks of extreme events and disasters to advance climate change adaptation. A special report of Working Groups I and II of the Intergovernmental Panel on Climate Change. Cambridge University Press, Cambridge.
Mărăzan, V. (2018). Climate change report for the “International Arrival Terminal” investment objective at Traian Vuia International Airport (CCR – LRTR) – Timişoara (in Romanian).

V. Mărăzan, A. Cozma, R. Hălbac–Cotoară–Zamfir
86
Moldovan, F. (2003). Extreme climatic phenomena (in Romanian). Echinox, Cluj-Napoca. Nichita, C., Vasilache, I., A., Mircov, V., D., Petrici, S. (2014). Characteristic baric structures at 500
MB associated with dangerous meteorological phenomena in South Western Romania. Research Journal of Agricultural Science, 46 (2), 223-229.
Sandu, I., Mateescu. E., Vătămanu. V. V. (2010). Climate change in Romania and its effects on agriculture (in Romanian). Sitech, Craiova.
Sandu, I., Pescaru, V. I., Poiana, I. (2008). The climate of Romania (in Romanian). Publishing House of the Romanian Academy, Bucureşti.
Săulescu, N. (2014). Climate change – a major challenge for agricultural research. Publishing House of the Romanian Academy, București.
Șerban, E. (2010). Precipitation generated climate hazards in the Western Plain situated to the North of Mureş river (in Romanian). University of Oradea Publishing House, Oradea.
Vasquez, T. (2010). Severe storm forecasting. Weather Graphics Technologies, Gareland. World Bank. (2009). Albania. Climate vulnerability assessments. An assessment of climate change
vulnerability, risk and adaptation in Albania’s power sector, Report no. 53331-ALB. World Meteorological Organization. (2017). World Meteorological Organization Guidelines on the
calculation of climate normals.

48th Symposium "Actual Tasks on Agricultural Engineering", Zagreb, Croatia, 2021
87
A BRIEF ANALYSIS OF DROUGHT IN WESTERN ROMANIA BASED ON SPI 3M EVOLUTION
Rares HALBAC-COTOARA-ZAMFIR1*, Cristina HALBAC-COTOARA-ZAMFIR2
*E-mail of corresponding author: [email protected] 1Department of Overland Communication Ways, Foundation and Cadastral Survey,
Politehnica University of Timisoara, 1A I. Curea Street, Timisoara, Romania 2Faculty of Civil Engineering, Politehnica University of Timisoara, 2nd T. Lalescu Street,
Timisoara, Romania
ABSTRACT
Droughts are one of the costlier natural hazards on a year-to-year basis considering their impacts which are generally significant and widespread. Monitoring these events is a vital process in the efforts of predicting, analysing and recovering after. A clear understanding of droughts and their behaviour will improve the resilience of the affected regions and their capacity to recover after such events. It is important to note that the impacts of droughts can be as varied as the causes of droughts. In this article SPI (Standardized Precipitation Index) is used for a critical analysis of meteorological drought in the last 50 years (1968 - 2018) in western Romania (Timisoara area). This index is calculated using RDIT recently introduced in Romanian research institutions for drought estimation and monitoring. The complexity of calculating SPI index requested the development of specialized programs to perform this task. We analysed the results for SPI at 3 months (3M) calculated with this program. The results led to the conclusion that the number of severely dry months will continue to increase as a result of a reduction in the number of extremely humid months.
Keywords: drought, SPI, RDIT, monitoring
INTRODUCTION
Drought is a climatic phenomenon that, due to its features and its way of development, has generated many debates and polemics still being a wide range of issues related to drought that are unknown or insufficiently understood. Droughts are regional in nature and, unlike other water hazards, their impacts don’t have precise borders. There are some major challenges in the debate about regional drought research—challenges that stress the importance of developing a comprehensive understanding of the climatology of drought.
48. ACTUAL TASKS ON AGRICULTURAL ENGINEERING
Original scientific paper

R. Halbac-Cotoara-Zamfir, C. Halbac-Cotoara-Zamfir
88
The reasons for the occurrence of droughts are complex, because they are dependent not only on the atmosphere but also on the hydrologic processes which feed moisture to the atmosphere. Moreover, the conceptual and structural characteristics of a drought make this phenomenon to be very hardly predicted and difficult to analyze (Halbac-Cotoara-Zamfir, 2017). In addition, climate changes are expected to alter hydro-climatological drivers of drought processes which will lead to even more severe, wide-spread and prolonged drought events worldwide (Houghton et al., 2001; Milly et al., 2008; Trenberth, 2011; Dai, 2013; Dewes et al., 2017).
All classifications and all drought analyses are based on meteorological drought. There is a relative wide acknowledgment according to which droughts have the origin in precipitations deficit and which results from a water deficit for a specific activity or for a target group thus drought being both spatially variant and context dependent (Quiring, 2009; Halbac-Cotoara-Zamfir, 2015). Palmer defined drought as a meteorological phenomenon characterized by a prolonged and abnormal humidity deficiency, respectively, in a more specific manner, as a time interval (of months or even years) in which the moisture intake falls below climatological expectations (Palmer, 1965; Palmer, 1968). Hulme, in 1992, defined meteorological drought by comparing fallen (lower) precipitation volumes with average values for a defined time period (Hulme, 1992). Meteorological drought was also defined through volumes of spatial and temporal precipitation (Sobisek, 1993). Smakhtin and Schipper concluded in 2008 that regardless of the drought that we are discussing, all are based on the meteorological drought (Smakhtin and Schipper, 2008). Thus, meteorological drought, characterized by a lack or reduced precipitations over a certain period of time (weeks, months, years) is a critical process which needs to be studied (predicted, monitored, analysed) within the general framework of drought risk mitigation (Potop et al., 2014; Li et al., 2017; Escalante-Sandoval and Nunez-Garcia, 2017).
The climate changes in Eastern Europe led to an increased frequency of extreme weather events (such as droughts) (Halbac-Cotoara-Zamfir et al., 2019; Katz and Brown, 1992; Karl et al., 1993; Frei et al., 1998; Jones, 1999; Kreibich et al., 2014; Lehner et al., 2006)., several studies indicating that drought was severe at the beginning of the 1980s and gaining momentum again from the late 1990s onwards (Gavriletea, 2017). In addition, it was shown that Romania has experienced an increase of about 0.5 °C in annual mean temperature during the last century. The records on precipitation didn’t indicated any uniform long-term change although there were observed some differences along a South-North gradient (Arghius et al, 2016; Busuioc et al., 2007; Cazacioc, 2007).
MATERIALS AND METHODS
Studied Area Timisoara is located in western part of Romania, being one the most important cities (see
figure 1). The city is developed at an altitude of 90m above sea level and has the following coordinates: 45º44’58’’N and 21º13’38’’E. The climate is moderate continental benefiting of hot summer and mild and dry winters irregularly disturbed by periods of frost (Pavel et al., 2017). Given the geographical position, the area covered by city of Timisoara is opened to winds for all directions, with air advections of different masses (Barbu and Mircov, 2013). Average annual rainfall is around 600 mm, which correspond with a typical continental temperate climate, with a maximum rainfall at the end of spring (May – beginning of June) and a minimum rainfall in February (see figures 2 and 3) (Barbu and Mircov, 2013).

A brief analysis of drought in western Romania based on SPI 3M evolution
89
Figure 1 Location of Timisoara metropolitan area
Figure 2 The variation of annual average temperature for Timisoara meteorological station
(1968 – 2018)
Figure 3 The variation of annual precipitation for Timisoara meteorological station
(1968 – 2018)
Data Drought represents the effects of water demands unmet by the available resources.
Regional characteristics of a drought, such as covered area, total water deficit, or return time, are very important in determining the phenomenon’s severity.
89
1011121314
1968
1971
1974
1977
1980
1983
1986
1989
1992
1995
1998
2001
2004
2007
2010
2013
2016
Tem
pera
ture
(C
elsiu
s deg
rees
)
200
400
600
800
1000
1968
1971
1974
1977
1980
1983
1986
1989
1992
1995
1998
2001
2004
2007
2010
2013
2016Pr
ecip
itatio
n [m
m]

R. Halbac-Cotoara-Zamfir, C. Halbac-Cotoara-Zamfir
90
For this analysis we are using monthly precipitation and temperatures recorded between 1968 and 2018 and Timisoara Meteorological Station.
The complexity of this natural hazard and the significant impact which may have on human society and surrounding environment requires a careful and sound analysis of drought magnitude, severity and consequences. For achieving this objective there can be used a wide range of drought indices which integrate several drought indicators. Svoboda and Fuchs (2016) set up a clear difference between these 2 key terms – indices and indicators – explaining what is meant by each of them. Drought indicators are represented by raw data used to describe drought conditions. Drought indices are representing simplified complex climatic functions, quantifying in a single number the climatic anomalies and providing, within a historical context, concise information on drought events (Tsakiris et al., 2007; Hayes, 2011).
Worldwide, over 100 drought indices were developed, each of them with specific features and approaching different aspects of drought. Given that some drought indices require processing large quantities of data (numerous drought indicators should be monitored for long periods of time), specialized software for their calculation were developed worldwide, many of them using an end-user simple interface and being easily accessible to stakeholders. Facilitating the process of calculating drought indices later allowed for more complex analyzes characterized by comparing the results of several drought indices which subsequently led comprehensive assessments of drought severity.
In Romania there are 2 drought indices widely used: SPI (Standard precipitation index) (Paltineanu et al., 2008; Chendes et al., 2010; Cheval et al., 2014; Sabau et al., 2015; Ionita et al., 2016) and PDSI (Palmer drought severity index) (Ghioca, 2009; Mihailescu et al., 2010; Mares et al., 2016a; Mares et al., 2016b; Dascalu et al., 2016)
In this article we will focus on SPI. SPI is a probability index that considers only rainfall and it was designed to quantify the precipitation deficit for multiple time periods. The equations underlying the calculation of the SPI index have already been widely presented in multiple articles and will not be the subject of this paper. The SPI calculation for any location is based on the long-term precipitation record for a desired period. This long-term record is fitted to a probability distribution, which is then transformed into a normal distribution so that the mean SPI for the location and desired period is zero (Tigkas et al., 2013; Edwards and McKee, 1997).
Although SPI can monitor wet periods, it is widely used for monitoring and zoning regional and local droughts around the world as well as for assessing the length and magnitude of drought events (Paulo and Pereira, 2007; Shahabar and Eitzinger, 2013; SafariShad et al., 2013; Akbari et al., 2015; Keskin et al., 2009; Touchan et al., 2005; Keyantach and Dracup, 2002; Pandey et al., 2008; Patel et al., 2007; Roudier and Mahe, 2010). Its design started from the assumption that the primary driver of drought is represented by a decrease in precipitation volumes compared with the normal values. SPI can be calculated for different periods of time (3, 6, 12, 24 and 48 months) and considering its standardization it can be used for comparing drought conditions between different time periods and regions with different climatic conditions. The index has negative values for drought and positive for wet conditions. The positive amount of SPI for all months in a drought event can be called the magnitude of the drought (McKee et al., 1993; Bonaccorso et al., 2003; WMO, 2012).

A brief analysis of drought in western Romania based on SPI 3M evolution
91
Table 1 Interpretation of SPI values
SPI value Category
> 1.5 Severely/ extremely wet 1 to 1.49 Moderately wet
-0.99 to 0.99 Normal conditions -1.49 to -1 Moderate drought
< -1.5 Severe/ extreme drought One disadvantage of the SPI is its sensitivity to the lengths of the record used (Mirabbasi
et al., 2013; Wu et al., 2005). Significant differences may occur in analyzing drought for some stations if the time scale of the data is no longer enough (eg. 45 – 50 years) (Wu et al., 2005).
Drought software RDIT is a software developed by Agrimetsoft and can calculate eight indices of
meteorological drought (SPI (Standardized Precipitation Index), DI (deciles index), PN (Percent of Normal Index), RAI (Rainfall Anomaly Index), EDI (effective drought index), CZI(China-Z index), MCZI (modified CZI), ZSI (Z-Score Index)) in form of yearly, seasonally, monthly and moving average for 3, 6, 9, 12, 18, 24, 48 months.
RESULTS AND DISCUSSION
The results obtained after processing the average monthly temperatures respectively of the monthly precipitations for the period 1968 - 2018 are presented in the form of graphs (figures 4 and 5) to allow a better understanding respectively for a clearer perception of the climatic evolution. In addition, we used the results to present some comparisons between the outputs of used applications (see figure 6 and to establish the trends of dry and humid month frequencies for different decades.
Figure 4 3M SPI index variation based on calculations provided by RDIT program for 1968 - 1993 periods, Timisoara area
-4-3-2-101234
1968
1969
1970
1971
1972
1973
1974
1975
1976
1977
1978
1979
1980
1981
1982
1983
1984
1985
1986
1987
1988
1989
1990
1991
1992
1993
SPI 3
m v
alue
s
Years
3M SPI variation between 1968 and 1993 (RDIT)
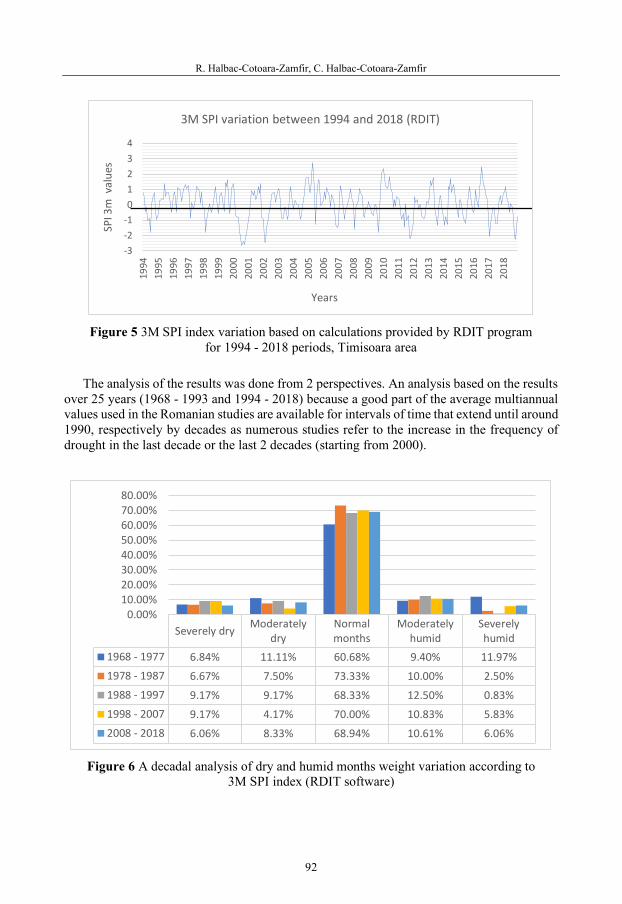
R. Halbac-Cotoara-Zamfir, C. Halbac-Cotoara-Zamfir
92
Figure 5 3M SPI index variation based on calculations provided by RDIT program
for 1994 - 2018 periods, Timisoara area The analysis of the results was done from 2 perspectives. An analysis based on the results
over 25 years (1968 - 1993 and 1994 - 2018) because a good part of the average multiannual values used in the Romanian studies are available for intervals of time that extend until around 1990, respectively by decades as numerous studies refer to the increase in the frequency of drought in the last decade or the last 2 decades (starting from 2000).
Figure 6 A decadal analysis of dry and humid months weight variation according to
3M SPI index (RDIT software)
-3-2-101234
1994
1995
1996
1997
1998
1999
2000
2001
2002
2003
2004
2005
2006
2007
2008
2009
2010
2011
2012
2013
2014
2015
2016
2017
2018
SPI 3
m v
alue
s
Years
3M SPI variation between 1994 and 2018 (RDIT)
Severely dry Moderatelydry
Normalmonths
Moderatelyhumid
Severelyhumid
1968 - 1977 6.84% 11.11% 60.68% 9.40% 11.97%1978 - 1987 6.67% 7.50% 73.33% 10.00% 2.50%1988 - 1997 9.17% 9.17% 68.33% 12.50% 0.83%1998 - 2007 9.17% 4.17% 70.00% 10.83% 5.83%2008 - 2018 6.06% 8.33% 68.94% 10.61% 6.06%
0.00%10.00%20.00%30.00%40.00%50.00%60.00%70.00%80.00%

A brief analysis of drought in western Romania based on SPI 3M evolution
93
The 25-year periods analysis of the results provided by the R-DIT application led to the following observations:
- For the period 1968 - 1993, the predominance of the dry months (18.77%) is observed over those considered humid (15.54%). 65.7% of the months were considered normal.
- In the period 1994 - 2018, the number of severely dry months decreased by about 1.75% from total against the background of a moderately dry month decrease by almost 5% from total. The number of moderately humid months registered a slight increase of almost 2% (from 9.71% to 11.67%). A slight decrease could be recorded in the case of severely humid months (from 5.83% to 5% of total).
- There is a tendency to decrease the severely dry / humid months, respectively an increase in the number of normal months.
- While 1968 – 1993 period was mode dry (18.77% dry months vs 15.54% humid months), the next one, 1994 – 2018 period was more humid (12.34% dry months vs 16.67% humid months).
- However, the number of severely dry months during the analysed period (1968 - 2018) was almost 40% times higher than that of the severely humid months (7.55% compared to 5.42%).
The analysis at the decadal level led to the following conclusions: - The period 1968 - 1977 was indicated as the most "humid" with 21.37% of the months
being moderately humid and severely humid compared to 17.95% moderately dry and severely dry months.
- For the period 1978 - 1987 there is a steep reduction in the number of severely humid months (from 11.97% to 2.5%). This decade is drier with 14.17% of moderately dry and severely dry months compared to 12.5% humid months.
- In the next decade (1988 - 1997) the trends of the previous period are kept. The number of dry months increases with more than 4% (of which 2.5% increase in the number of severely dry months), but there is also a slight increase in the number of humid months (by 0.83% compared to the previous decade).
- For the decade 1998 - 2007 the number of severely dry months remained the same, representing 9.17% of total. The number of moderately dry months reduced with more than half, being also recorded a decrease of moderately humid months (from 12.5% to 10.83% of total). This decade recorded a high increase of severely humid months, from 0.83% to 5.83% of total.
- Between 2008 and 2018, the number of severely humid months equalized the number of severely dry months. Also, the number of moderately humid months was higher than the number of moderately dry months. The number of normal months recorded a slight decrease, from 70% to 68.94% of total.
CONCLUSIONS
The statistics show us that the drought phenomenon, without having a very strict cyclical character, generally occurred at intervals of 10-15 years, more often in the recent period, the alternation of extreme drought years with excess years under the aspect of the rainfall regime (1-3 years) becoming more and more obvious.

R. Halbac-Cotoara-Zamfir, C. Halbac-Cotoara-Zamfir
94
The most recent grouping of drought years is the 2000-2020 period, the drought of the summer of 2000 being considered the strongest of the last 2 decades.
Analyzing the graphs of SPI 3M index variation, we can notice a climate with sharp alternations of very dry and very humid periods. However, we can also observe that severe dry months have remained at a constant level while the frequency of very humid months has decreased a lot in the last decades compared to 1968 – 1977 period.
The use of different application for calculating drought indices can facilitate the work of the researchers in identifying different typologies of the drought phenomenon development and in anticipating the climatic variation for the next decades. However, these studies should be correlated with other measurements and analysis for reliable forecasts and conclusions.
REFERENCES
Akbari, H., Rakhshandehroo, G., Sharifloo, A., Ostadzadeh, E. (2015). Drought Analysis Based on Standardized Precipitation Index (SPI) and Stream flow Drought Index (SDI) in Chenar Rahdar River Basin, Southern Iran. Watershed Manage. 11–22.
Arghius, V., Rosian, G., Mihaiescu, R., Muntean, L., Arghius, C. (2016). Analysis of annual and seasonal air temperature and precipitation trends in south-eastern part of Romania in the context of climate change and desertification. Proceedings of the 16th International Multidisciplinary Scientific GeoConference SGEM, SGEM2016 Conference Proceedings. Book 4 (2), 227–234.
Barbu, S., Mircov, V. (2013). From the weather to climate in the western plain, Research Journal of Agricultural Science 45(3), 209-222.
Bonaccorso, B., Bordi, I., Cancelliere, A., Rossi, G., Sutera, A. (2003). Spatial variability of drought: An analysis of the SPI in Sicily. Water Resources Management 17, 273-296.
Busuioc, A., Dumitrescu, A., Soare, E., Orzan, A. (2007). Summer anomalies in 2007 in the context of extremely hot and dry summers in Romania. Rom. J. Meteorol. 9(1-2), 1–17.
Cazacioc, L. (2007). Spatial and temporal variability of extreme daily precipitation amounts in Romania. Rom. J. Meteorol. 9, 34–46.
Chendes, V., Cheval, S., Dumitru, S. (2010). The assessment of some hydrometeorological drought indices in the bend Subcarpathians and peripheral zones, Research Journal of Agricultural Science 42(3), 60-70.
Cheval, S., Busuioc, A., Dumitrescu, A., Birsan, M.V. (2014). Spatiotemporal variability of meteorological drought in Romania using the standardized precipitation index (SPI). Clim Res 60, 235-248.
Dai, A.G. (2013). Increasing drought under global warming in observations and models. Nat Clim Chang 3, 52–58
Dascalu, S.I., Gothard, M., Bojariu, R., Bîrsan, M.V., Cică, R., Vintilă, R., Adler, M.J., Chendeș, V., Mic, R.P. (2016). Drought-related variables over the Bârlad basin (Eastern Romania) under climate change scenarios. Catena 141, 92-99.
Dewes, C.F., Rangwala, I., Barsugli, J.J., Hobbins, M.T., Kumar, S. (2017). Drought risk assessment under climate change is sensitive to methodological choices for the estimation of evaporative demand. PLoS ONE 12(3), e0174045.
Edwards, D.C., McKee, T.B. (1997). Characteristics of 20th century drought in the United States at multiple time scales. Climatology Report Number 97-2, Colorado State University, Fort Collins, Colorado, USA.

A brief analysis of drought in western Romania based on SPI 3M evolution
95
Escalante-Sandoval, C., Nunez-Garcia, P (2017). Meteorological drought features in northern and northwestern parts of Mexico under different climate change scenarios, Arid Land 9, 65.
Frei, C., Schar, C., Luthi, D., Davies, H.C. (1998). Heavy precipitation processes in a warmer climate. Geophys. Res. Lett. 25(9), 1431–1434.
Gavriletea, M.D. (2017). Catastrophe risk management in Romania and Transylvania' specifics. Issues for national and local administrations. Econ. Res. 30(1), 761–776.
Ghioca, M. (2009). Drought monitoring using self-calibrating Palmer’s indices in the southwest of Romania. Romanian Reports in Physics 61(1), 151-164.
Halbac-Cotoara-Zamfir, R. (2015). Understanding drought. From science to public opinion. 14th International Conference on Environmental Science and Technology (CEST2015) Rhodes, Greece.
Halbac-Cotoara-Zamfir, R. (2017). Understanding and manipulating drought – a permanent challenge. Proceedings of the 17th International Multidisciplinary Scientific GeoConference SGEM, 2017, 17(43), 577-584.
Halbac-Cotoara-Zamfir R., Keesstra, S., Kalantari, Z. (2019). The impact of political, socio-economic and cultural factors on implementing environmental friendly techniques for sustainable land management and climate change mitigation in Romania, Science of the Total Environment 654, 418-429.
Hayes, M.J. (2011). Comparison of Major Drought Indices: Introduction. National Drought Mitigation Center, USA.
Houghton; J.T., Ding, Y., Griggs, D.J., Noguer, M., van der Linden, P.J., Dai, X., Maskell, K., Johnson, C.A. (2001). Climate Change 2001: The Scientific Basis. Contribution of Working Group I to the Third Assessment Report of the Intergovernmental Panel on Climate Change, Cambridge University Press.
Hulme, M. (1992). Rainfall changes in Africa — 1931–1960 to 1961–1990. International Journal of Climatology 12, 685–699.
Ionita, M., Scholz, P., Chelcea, S.M. (2016). Assessment of droughts in Romania using the standardized precipitation index, Natural Hazards 81(3).
Jones, J.A.A. (1999). Climate change and sustainable water resources: placing the threat of global warming in perspective. Hydrol. Sci. J. 44(4), 541–557.
Karl, T., Quayle, R.G., Groisman, P.I. (1993). Detecting climate variations and change: new challenges for observing data management systems. J. Clim. 6, 1481–1494.
Katz, W.R., Brown, G. (1992) Extreme events in changing climate: variability is more important than averages. Clim. Chang. 21, 289–302.
Keskin, M.E., Terzi, O., Taylan, E.D., Kucukyaman, D. (2009). Meteorological drought analysis using data-driven models for the Lakes District, Turkey. Hydrol. Sci. J. 54(6), 1114–1124.
Keyantash, J., Dracup, J.A. (2002). The quantification of drought: an evaluation of drought indices. Bull. Am. Meteorol. Soc. 83(8), 1167–1180.
Kreibich, H., van den Bergh, J.C.J.M., Bouwer, L.M., Bubeck, P., Ciavola, P., Green, C., Hallegatte, S., Logar, I., Meyer, V., Schwarze, R., Thieken, A.H. (2014). Costing natural hazards. Nat. Clim. Chang. 4, 303–306.
Lehner, B., Doll, P., Alcamo, J., Henrichs, T., Kaspar, F. (2006). Estimating the impact of global change on flood and drought risks in Europe: a continental integrated analysis. Clim. Chang. 75, 273–299.
Li, Z., Chen, Y.N., Fang, G.H., Li, Y.P. (2017). Multivariate assessment and attribution of droughts in Central Asia. Scientific Reports 7, 1316.
Mares, C., Mares, I., Mihailescu, M. (2016a) Identification of extreme events using drought indices and their impact on the Danube lower basin discharge. Hydrological Processes 30(21), 3839-3854.
R. Halbac-Cotoara-Zamfir, C. Halbac-Cotoara-Zamfir
96
Mares, C., Adler, M.J., Mares, I., Chelcea, S., Branescu, E. (2016b) Discharge variability in Romania using Palmer indices and a simple atmospheric index of large-scale circulation, Hydrological Sciences Journal 61(6), 1010-1025.
McKee, T.B., Doesken, N.J., Kleist, J. (1993). The relationship of drought frequency and duration to time scale. Preprints Eighth Conference on Applied Climatology, American Meteorological Society, Anaheim (CA), USA.
Mihailescu, M., Mares, I., Mares, C., Huebener, H. (2010). Climate variability of drought indices in Romania in the 20th and 21st centuries. Proceedings of BALWOIS 2010 Conference, Ohrid, Republic of North Macedonia.
Milly, P.C.D., Betancourt, J., Falkenmark, M., Hirsch, R.M., Kundzewicz, Z.W., Lettenmaier, D.P., Stouffer, R.J. (2008). Stationarity is dead: Whither water management? Science, 80(319), 573–574.
Mirabbasi, R., Anagnostou, E.N., Fakheri-Fard, A., Dinpashoh, Y., Eslamian, S. (2013). Analysis of meteorological drought in Northwest Iran using the Joint Deficit Index. J. Hydrol. 497, 35–48.
Palmer, W. C. (1965). Meteorological drought. U.S. Weather Bureau Research Paper 45. Palmer, W.C. (1968). Keeping track of crop moisture conditions, nationwide: The new Crop Moisture
Index. Weatherwise, 21, 156–161. Paltineanu, C., Mihailescu, I.F., Prefac, Z., Dragota, C., Vasenciuc, F., Claudia, N. (2008). Combining
the standardized precipitation index and climatic water deficit in characterizing droughts: a case study in Romania, Theor Appl Climatol 97, 219–233.
Pandey, R.P., Dash, B.B., Mishra, S.K., Singh, R. (2008). Study of indices for drought characterization in KBK districts in Orissa (India). Hydrol. Process. 22(12), 1895–1907.
Patel, N.R., Chopra, P., Dadhwal, V.K. (2007). Analyzing spatial patterns of meteorological drought using standardized precipitation index. Meteorol. Appl. 14(4), 329–336.
Paulo, A.A., Pereira, L.S. (2007). Prediction of SPI drought class transitions using markov chains. Water Resour. Manage. 21(10), 1813–1827.
Pavel, S., Dobosi, I.S., Stan, D., Fischer Szava, G. (2017). The efficiency and the profitability of the photovoltaic panels as generator for household electricity in the region of Banat/ Romania. In Visa, I.; Duta, A. (eds.) Nearly zero energy communities. Proceedings of the Conference for Sustainable Energy (CSE). Springer, 421 – 434.
Potop, V., Boroneanţ, C., Možný, M., Štěpánek, P., Skalák, P. (2014). Observed spatiotemporal characteristics of drought on various time scales over the Czech Republic. Theoretical and Applied Climatology 115, 563–581
Quiring, S.M. (2009). Developing Objective Operational Definitions for Monitoring Drought. J. Appl. Meteor. Climatol. 48, 1217–1229.
Roudier, P., Mahe, G. (2010). Study of water stress and droughts with indicators using daily data on the Bani River (Niger basin, Mali). Int. J. Climatol. 30(11), 1689–1705.
Sabau, N.C., Man, T.E., Armas, A., Balaj, C., Giru, M. (2015). Characterization of agricultural droughts using Standardized Precipitation Index (SPI) and Bhalme-Mooley drought index (BDMI). Environmental Engineering and Management Journal 14(6), 1441-1454.
SafariShad, M., DashtiMarvili, M., Allahbakhshian Farsani P. (2013). Zoning droughts by standardized precipitation index in Esfahan province (IRAN). Int. J. Adv. Biol. Biomed. Res. 1(5), 477–481.
Shahabfar, A., Eitzinger, J. (2013). Spatio-temporal analysis of droughts in semi-arid regions by using meteorological Drought indices. Atmosphere 4(2), 94–112.
Smakhtin, V., Schipper, E.L.F. (2008). Droughts: The impact of semantics and perceptions. Water Policy 10(2), 131-143.
Sobíšek, B. (1993). Meteorological Dictionary. Academia, MŽP ČR, Praha.
A brief analysis of drought in western Romania based on SPI 3M evolution
97
Svoboda, M., Fuchs, B. (2016). Handbook of Drought Indicators and Indices. Drought Mitigation Center Faculty Publications 117.
Tigkas, D., Vangelis, H., Tsakiris G. (2013). The drought indices calculators (DrinC). Proceedings of the 8th International EWRA Conference, Porto, Portugal.
Touchan, R., Funkhouser, G., Hughes, M.K., Erkan, N. (2005). Standardized precipitation index reconstructed from Turkish tree-ring widths. Clim. Change 72(3), 339–353.
Tsakiris, G., Pangalou, D., Vangelis, H. (2007). Regional drought assessment based on the reconnaissance drought index (RDI). Water Resour Manag. 21(5), 821–833.
Trenberth, K.E. (2011) Changes in precipitation with climate change. Clim Res. 47, 123–138. World Meteorological Organization (WMO) (2012). Standardized Precipitation Index User Guide.
WMO-No. 1090. Wu, H., Hayes, M.J., Wilhite, D.A., Svoboda, M.D. (2005). The effect of the length of record on the
Standardized Precipitation Index calculation. Int. J. Climatol. 25(4), 505–520.


48th Symposium "Actual Tasks on Agricultural Engineering", Zagreb, Croatia, 2021
99
INFLUENCE OF LOCAL CLIMATIC FACTORS ON SUNFLOWER INFLORESCENCE VISIT BY
HONEY BEES Atanas ATANASOV1*, Ivaylo HRISTAKOV1, Mihail MILCHEV1, Milan KOSZEL2,
Dario KNEŽEVIĆ3 *E-mail of corresponding author: [email protected]
1University of Ruse, Agro-industrial Faculty, Department of Agricultural Machinery, 8 Studentska Str, 7017, Ruse, Bulgaria
2 University of Life Sciences in Lublin, Department of Machinery Exploitation and Management of Production Processes, Głęboka 28, 20-612 Lublin, Poland
3University J.J. Strossmayer, Faculty of Agriculture in Osijek, Vladimira Preloga 1, 31000, Osijek, Croatia
ABSTRACT
Influence local climatic factors on sunflower inflorescence visit by honey bees was evaluated. The study was conducted in 2020 growing season in the Northeast part of Bulgaria in village Brestovica. Geographical location of experimental apiary in Brestovica is 43°32'4.02"С N, 25°45'14.10" E and at an altitudinal range of 222 m. The results show that a high intensity of sunflower inflorescence visit is observed between 9:30 and 11:00, with the number of bees counted between 10 and 11 per m2. The lowest intensity of sunflower inflorescence visit is between 13:00 and 15:00, the number of bees counted is between 1 and 2 per m2. The most frequent visits were estimated at surface temperature of the sunflower blossom between 33 °C and 37 °C, air tempera-ture at 23,83 °С to 27,09 °С, humidity of the air at 53,80 % to 59,33 % and the atmospheric pressure at 987,42 hPa to 987,61 hPa. From the Spearman correlation analysis, it was found that we have a significant correlation between the number of bees visiting the sunflower inflorescences N and the measured surface temperature of the sunflower blossom X1. In the other weather indicators as temperature of the air X2, the humidity of the air X3 and the atmospheric pressure X4 the correlation with N is not proven. Relationship between weather conditions X1, X2, X3, X4, number of bees visiting the sunflower inflorescences N and changing the weight of the hive Y show that we have a significant positive correlation between Y and the time of the measurements and the temperature of air X2.
Keywords: evaluation, climatic factors, sunflower, honey bee visit
48. ACTUAL TASKS ON AGRICULTURAL ENGINEERING
Original scientific paper

A. Atanasov, I. Hristakov, M. Milchev, M. Koszel, D. Knežević
100
INTRODUCTION
For the hilly plains of North-eastern Bulgaria, sunflower is one of the most important bee pastures during the months of June and July. Sunflower is also the last main pasture on which depends the stocking of bee colonies with honey and pollen for the winter period. The areas occupied by sunflower for 2020 in the country are 128 154 ha, which is 75.1% less than in 2019. (Operational analysis, Bulletin No. 15/2020). In their quest for higher yields, farmers in Bulgaria began to grow hybrids that bloom together and bloom quickly in 10 -11 days. In addition, in recent years there have been high daily temperatures and permanent drought during sunflower flowering. All these factors led to a decrease in the average yield of honey per hive. On the other hand, honey bees are the main pollinators of the sunflower (Osman Abd Elmhmoud Altayeb et.al.2015). Some authors as (Krishna et. al., 2014; Fazal et. al., 2017) investigated on the pollination efficiency of honey bees in sunflower. An interesting study does (Mallinger et.al. 2017) for degree of attendance of bees in different sunflower hybrids depending on the content of nectar sugar. The study of the climatic factors affecting the foraging activity during the sunflower blooming period is of great importance for the pollination of crops and for the obtaining of higher honey yield (Pătruică et.al. 2017). Other authors as (Puškadija et. al., 2007; Amit Jadhav et.al. 2015; Ramya et.al. 2014) determine influence of weather conditions on activity of honey bees for different sunflower hybrids. Unfortunately, the climatic diversity of the local regions and the variety diversity make these studies inapplicable for the individual regions in Bulgaria. The aim of our study is to assess the influence of local climatic factors on sunflower inflorescence visit by honey bees, by use digital technologies.
MATERIALS AND METHODS
The study was conducted in 2020 growing season in the Northeast part of Bulgaria in village Brestovica. Geographical location of experimental apiary in Brestovica is 43°32'4.02"С N, 25°45'14.10" E and at an altitudinal range of 222 m. In the region of great importance honey source plant for honeybee is Sunflower (Helianthus annuus L). The fields on which the experiment was conducted were sown with Syngenta's Bacardi CLP sunflower hybrid widely used in Bulgarian agricultural production. The experimental apiary was located 925 meters from the sunflower field. The experimental apiary consisted of 190 bee colonies housed in Dadant-Blatt hives. Their strength was appropriate to the corresponding strength for successful pollination.
There are many factors that can impact foraging activity of honeybee. These factors can be divided into two major groups: in-colony factors and out-colony factors. With regard to out-colony factors, the availability of suitable plant resources has a great impact on foraging activity (Abou-Shaara, 2014). In our study we took into account the influence of external factors such as outside air temperature (X2) and air humidity (X3), atmospheric pressure (X4), surface temperature of flowering sunflower (X1) and the amount of precipitated rainfall (X5) on the sunflower inflorescences N and weight change of the hive (Y) due to the flow of nectar secretion during the various hours of the day. To achieve the aim of the present work, a prototype of a meteorological station for the measurement of the microclimate in the bee colonies and outside we used Fig.1 and Fig. 2. Consisting of: 1) a hardware configuration including an electrical module, a LAN module, a temperature sensor - DS18B20, a combined temperature / humidity sensor DHT22, CO2 sensor, barometer 2) software configuration using

Influence of local climatic factors on sunflower inflorescence visit by honey bees
101
common applications, such as CarterLake.org и PHP conversion by Saratoga-Weather.org. The surface temperature of flowering sunflower was measured with a CAT S61 с FLIR ONE PRO unit thermal camera.
Figure 1 Functional diagram of a meteorological station for measuring the microclimate in
the bee colony and beyond
Figure 2 Meteorological station for measuring the microclimate in the bee colony and
beyond The recording of the change in the weight of the hive was carried out with an electronic
beekeeping scale of TEHTRON-VAGA. Reporting was done of every 30 min at 8:00 a.m. to 19:00 p.m. The received data was stored on the web-based applications and then downloaded as numeric values in Excel spreadsheets. For the statistical processing of the data obtained, the software STATISTICA 10 was used. The weather conditions influence was analysed by Spearman correlation coefficient.

A. Atanasov, I. Hristakov, M. Milchev, M. Koszel, D. Knežević
102
Honey bees’ visiting sunflower inflorescences were assessed by counting the individual bees present on 1 m2, 23 times per day (from 8. 00 a.m. to 19:00 pm for every 30 minutes.).
RESULTS AND DISCUSSION
The frequency of visits by bees to flowering sunflowers depends on meteorological conditions and nectar secretion of the hybrid. In the period of our study, the highest intensity of inflorescences attendance was observed on the 1st and 2nd of July 2020. From the obtained results in fig.3. it was found that a high intensity of blossoms attendance was observed between 9:30 and 11:00, with the number of bees counted between 10 and 11 per m2. The lowest intensity of attendance is observed between 13:00 and 15:00, with the number of bees counted between 1 and 2 per m2. From 15:30 to 18:30 there is again active flight with an intensity between 5 and 7 bees per m2. At the same time from Fig.4. it can be seen that at an air temperature of 23.83 °C and 27.09 °C measured between 9:30 and 11:00 we have the highest intensity of sunflower inflorescences attendance. From Fig.5. found that the highest frequency of attendance of bees we have at the measured surface temperature of the sunflower blossom between 33 °C and 37 °C in the hours between 9:30 and 11:00. From the photos shown in Fig.6. it can be seen that the surface temperature of the head of sunflower is highest in the periphery of the inflorescence, where we have full flowering of the blossoms.
The bees that visit the flowers are localized in this area. From Fig.7. it can be seen that in the hours between 8:00 and 11:00 we have high values of the surface temperature of the inflorescence between 32 °C and 38 °C at low values of the air temperature between 20 °C and 27 °C with a temperature difference of 11 °C. This is due to the direct illumination of the blooms by the sun. After 11:00 an increase in air temperature is observed while the surface temperature of the blooms decreases and equalizes with the air.
This is due to the peculiarity of the sunflower hybrid to self-shade by tilting the blossoms. At 13:00, 13:30, 14:00, 14:30 we have the lowest temperature difference then the frequency of blossoms attendance decreases significantly.
Figure 3 Influence of time on honey bees visit of sunflower inflorescences during flowering time
0
2
4
6
8
10
12
00:00 04:48 09:36 14:24 19:12 00:00
Num
ber o
f bee
s
Time of day
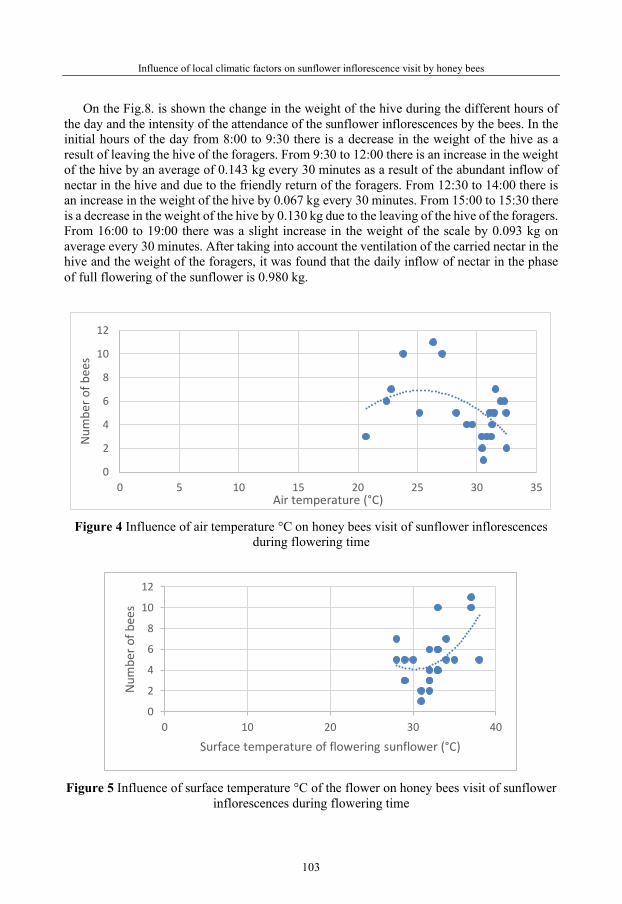
Influence of local climatic factors on sunflower inflorescence visit by honey bees
103
On the Fig.8. is shown the change in the weight of the hive during the different hours of the day and the intensity of the attendance of the sunflower inflorescences by the bees. In the initial hours of the day from 8:00 to 9:30 there is a decrease in the weight of the hive as a result of leaving the hive of the foragers. From 9:30 to 12:00 there is an increase in the weight of the hive by an average of 0.143 kg every 30 minutes as a result of the abundant inflow of nectar in the hive and due to the friendly return of the foragers. From 12:30 to 14:00 there is an increase in the weight of the hive by 0.067 kg every 30 minutes. From 15:00 to 15:30 there is a decrease in the weight of the hive by 0.130 kg due to the leaving of the hive of the foragers. From 16:00 to 19:00 there was a slight increase in the weight of the scale by 0.093 kg on average every 30 minutes. After taking into account the ventilation of the carried nectar in the hive and the weight of the foragers, it was found that the daily inflow of nectar in the phase of full flowering of the sunflower is 0.980 kg.
Figure 4 Influence of air temperature °C on honey bees visit of sunflower inflorescences during flowering time
Figure 5 Influence of surface temperature °C of the flower on honey bees visit of sunflower inflorescences during flowering time
0
2
4
6
8
10
12
0 5 10 15 20 25 30 35
Num
ber o
f bee
s
Air temperature (°C)
0
2
4
6
8
10
12
0 10 20 30 40
Num
ber o
f bee
s
Surface temperature of flowering sunflower (°C)

A. Atanasov, I. Hristakov, M. Milchev, M. Koszel, D. Knežević
104
Figure 6 Infrared images of sunflower blossom
Figure 7 Change in the frequency of visits of sunflower inflorescences by bees,
air temperature and surface temperature of sunflower flowers
05
10152025303540
00:00 04:48 09:36 14:24 19:12 00:00
air temperature surface temperature nuber of bee

Influence of local climatic factors on sunflower inflorescence visit by honey bees
105
Figure 8 Change in the frequency of visits of sunflower inflorescences by bees
and weight of the hive The measured air humidity shown on Fig.9. in the hours between 9:30 and 11:00 it varies
between 53.80% and 59.33%. The influence of atmospheric pressure is shown on Fig.10. as the highest frequency of color attendance, we have at a pressure between 987.42 hPa and 987.61 hPa.
Figure 9 Influence of air humidity % on honey bees visit of sunflower inflorescences during flowering time
0
2
4
6
8
10
12
69.500
70.000
70.500
71.000
71.500
72.000
72.500
73.000
weight of the hive nuber of bees
0
2
4
6
8
10
12
0 20 40 60 80 100
Num
ber o
f bee
s
Air humidity (%)

A. Atanasov, I. Hristakov, M. Milchev, M. Koszel, D. Knežević
106
Figure 10 Influence of atmospheric pressure hPa on honey bees visit of sunflower inflorescences during flowering time
Relationship between weather conditions and honey bee visit was analyzed by Spearman
coefficient. Table 1 shows that there is a significant correlation between the number of bees visiting
the sunflower inflorescences N and the measured surface temperature of the sunflower blossom X1.In the other weather indicators as temperature of the air X2, the humidity of the air X3 and the atmospheric pressure X4 the correlation with N is not proven. There was no precipitation X5 during the experiment time and don’t was recorded their influence.
Table 1 The relationship between local weather conditions and honey bees visit of
sunflower inflorescences during flowering time
Spearman Rank Order Correlations (Sunflower 07.v)MD pairwise deletedMarked correlations are significant at p <,05000
Variable Time X1 X2 X3 X4 NTimeX1X2X3X4N
1,000000 -0,569012 0,815652 -0,856522 -0,966087 -0,252660-0,569012 1,000000 -0,356347 0,332180 0,639754 0,4381680,815652 -0,356347 1,000000 -0,921739 -0,820870 -0,200279
-0,856522 0,332180 -0,921739 1,000000 0,848696 0,191476-0,966087 0,639754 -0,820870 0,848696 1,000000 0,271588-0,252660 0,438168 -0,200279 0,191476 0,271588 1,000000
Relationship between weather conditions (X1, X2, X3, X4), N and changing the weight of
the hive Y is shows in Table 2. From the correlation analysis it was found that we have a significant positive correlation between Y and the time of the measurements and the temperature of air X2. The other factors X1, X3, X4 have a negative correlation with Y.
0
2
4
6
8
10
12
985 985.5 986 986.5 987 987.5 988
Num
ber o
f bee
s
Atmospheric pressure (hPa)

Influence of local climatic factors on sunflower inflorescence visit by honey bees
107
Table 2 The relationship between X1, X2, X3, X4, N and changing the weight of the hive Y
Spearman Rank Order Correlations (Sunflower07)MD pairwise deletedMarked correlations are significant at p <,05000
Variable Time X1 N X2 X3 X4 YTimeX1NX2X3X4Y
1,000000 -0,569012 -0,252660 0,815652 -0,856522 -0,966087 0,951076-0,569012 1,000000 0,438168 -0,356347 0,332180 0,639754 -0,666263-0,252660 0,438168 1,000000 -0,200279 0,191476 0,271588 -0,3854560,815652 -0,356347 -0,200279 1,000000 -0,921739 -0,820870 0,775821
-0,856522 0,332180 0,191476 -0,921739 1,000000 0,848696 -0,804523-0,966087 0,639754 0,271588 -0,820870 0,848696 1,000000 -0,9554250,951076 -0,666263 -0,385456 0,775821 -0,804523 -0,955425 1,000000
CONCLUSIONS
In this paper we have investigated influence local climatic factors on sunflower inflorescence visit by honey bees. The results show that a high intensity of sunflower inflorescence visit is observed between 9:30 and 11:00, with the number of bees counted between 10 and 11 per m2. The lowest intensity of sunflower inflorescence visit is between 13:00 and 15:00, the number of bees counted is between 1 and 2 per m2. The most frequent visits were estimated at surface temperature of the sunflower blossom between 33 0C and 37 0C, air temperature at 23,83 0 С to 27,09 0 С, humidity of the air at 53,80 % to 59,33 % and the atmospheric pressure at 987,42 hPa to 987,61 hPa.
From the Spearman correlation analysis, it was found that we have a significant correlation between the number of bees visiting the sunflower inflorescences N and the measured surface temperature of the sunflower blossom X1. In the other weather indicators as temperature of the air X2, the humidity of the air X3 and the atmospheric pressure X4 the correlation with N is not proven.
Relationship between surface temperature of the sunflower blossom, temperature of the air, the humidity of the air, the atmospheric pressure, number of bees visiting the sunflower inflorescences N and changing the weight of the hive Y show that we have a significant positive correlation between Y and the time of the measurements and the temperature of air X2.
ACKNOWLEDGEMENT
The study was supported by contract 2020-FNI-01, funded by the Research Fund of the University of Ruse.
A. Atanasov, I. Hristakov, M. Milchev, M. Koszel, D. Knežević
108
REFERENCES
Abou-Shaara, H. F. (2014). The foraging behaviour of honey bees, Apis mellifera: a review. Academic Journal Veterinarni Medicina, 59., 1–10. Available at: https://doi.org/10.17221/7240-VETMED
Fazal S., Inayatullah M., Ali H. (2017). Studies on Visitation Pattern of Honeybee (Hymenoptera: Apidae) and its Impact on the Yield and Oil Contents of Sunflower (Helianthus annuus L.) Seed in Peshawar Valley, Pakistan., Pakistan Journal of Zoology, Vol. 49 Issue 3, 943-949. Available at: http://dx.doi.org/10.17582/journal.pjz/2017.49.3.943.949
Jadhav A., Sreedevi K. (2015). Impact of abiotic factors on foraging behaviour of majorpollinators in sunflower ecosystem, Asian journal of environmental science, volume 10, issue 1, 1-6.
Krishna K. Venata, Prashanth Y., Yogeeswarudu B. (2014). Pollination efficiency of Honey bees in Sunflower (Helianthus annuus L.), Journal of Agriculture and Life Sciences, Vol. 1, No. 2. Available at: http://www.jalsnet.com/journals/Vol_1_No_2_December_2014/12.pdf
Mallinger R. E., Prasifka J. R. (2017). Bee visitation rates to cultivated sunflowers increase with the amount and accessibility of nectar sugars, Journal of Applied Entomology, 1-13. Available at: https://doi.org/10.1111/jen.12375
Ministry of Agriculture, Food and Forestry (2020). Operational analysis for main agricultural crops, Bulletin No. 15/2020. Available at: https://www.mzh.government.bg/media/filer_public/2020/04/16/operativen_ analiz_2020-04-15_eZNY6xi.pdf
Osman Abd Elmhmoud Altayeb, Siham Kamil Abdalla Nagi, (2015). Efficacy of honeybees (Apis mellifera) on the production of sunflower (Helianthus annus L.) seeds in the Sudan Journal of Experimental Biology and Agricultural Sciences, Volume – 3(2). Available at: http://www.jebas.org/00300220032015/10.18006_2015.3(2).191.195.pdf
Pătruică S., Dezmirean D. S., Bura M., Jurcoane R., Sporea A. (2017). Monitoring of Bee Colonies’ Activity During the Major Gatherings in 2017. Bulletin UASVM Animal Science and Biotechnologies 74(2), 92-96. Available at: http://journals.usamvcluj.ro/index.php/zootehnie/article/view/12812
Puškadija Z., Štefanić E., Mijić A., Zdunić Z., Parađiković N., Florijančić T., Opačak A. (2007). Influence of weather conditions on honey bee visits (Apis mellifera carnica) during sunflower (Helianthus annuus l.) blooming period. Agriculture, Vol.13, No.1, 230-233. Available at: https://hrcak.srce.hr/16147
Ramya M. Muthuraman M., Saravanan P.A. (2014). Foraging Behaviour of Different Honeybees on Sunflower – A Comparative Study, Madras Agricultural Journal, Vol.101 No.10/12, .379-381. Available at https://drive.google.com/file/d/0B20TM0cqzsQmRmwzTV9kQ1Z6M00/view
https://www.mzh.government.bg/media/filer_public/2020/04/16/operativen_analiz_2020-04-15_eZNY6xi.pdf

48th Symposium "Actual Tasks on Agricultural Engineering", Zagreb, Croatia, 2021
109
GREENHOUSE DECISION SUPPORT MODEL AND ITS WEB-BASED APPLICATION
Aleksandra DIMITRIJEVIĆ1*, Carmela SICA2, Ilija KAMENKO3, Zoran MILEUSNIĆ1, Rajko MIODRAGOVIĆ1
*E-mail of corresponding author: [email protected] 1University of Belgrade – Faculty of Agriculture, Belgrade, Serbia
2 University of Basilicata - SAFE School, Potenza, Italy 3 University of Novi Sad – Faculty of Technical Sciences, Novi Sad, Serbia
ABSTRACT
Greenhouse production system is a very complex and very intensive production system in agriculture. From the initial idea to the final system design great attention must be paid. The farmer must have an idea what he wants, what he is capable of, what are his resources and what are his possibilities. In previous research an improvement of a simple model as decision support model for the greenhouse production system was presented where a simple algorithm gives to the farmer an adequate solution of the greenhouse construction type and technical systems with their capacities. Improvement was made in sense of using spatial analysis (GIS) where, based on the farmer / producer location algorithm draws the data from the various terrain orographic characteristics and weather conditions providing the farmer / producer with the necessary input data in the short period of time. In this paper a web application of the improved algorithm will be presented. It was a pilot web application introduced to the local farmers to use.
Keywords: greenhouse production system, model, algorithm, web application
INTRODUCTION
Starting a greenhouse production involves numerous variables that need to be taken into the account. When starting a greenhouse production project, farmer most often contacts people from the equipment trading companies. When doing this he needs to have a kind of idea of what he wants, what he has in sense of the location potential, production surfaces, type of production etc.
In the past, lot of research has been done concerning the modeling of the greenhouse production system and processes. Optimal computerized control of greenhouses using information about crop growth is well underway in the research community (Bennins et al,
48. ACTUAL TASKS ON AGRICULTURAL ENGINEERING
Preliminary communication

A. Dimitrijević, C. Sica, I. Kamenko, Z. Mileusnić, R. Miodragović
110
2008). Most of the research is focused on controlling the greenhouse production conditions (Van Straten et al, 2000, Bennis et al, 2008, Blasco et al., 2007, Speetjens et al, 2009, Van Henten, 1994, Molina-Aiz et al, 2010, Ehret et al., 2011). The other part of research is dealing with controlling the irrigation, nutrition and plat protection (Helmer et al, 2005, Massa et al., 2011, Aggarwal et al., 2006). There are few researchers that are dealing with complete greenhouse growth models (Clarke et al., 1999, Incrocci et al., 2006, Gupta et al, 2010).
A simple model as a decision support model for the greenhouse production system that is able to give a start-up idea for any producer that wishes to start this serious business was made (Dimitrijevic et al., 2012a). For using this model farmer needed to have a PC computer and Microsoft Excel software installed. For the adequate operation model used input parameters and the knowledge sources. Analyzing this model (Dimitrijevic et al., 2012b) it was concluded that the model is to time and knowledge consuming for the farmer. Some farmers are not in position to know the soil quality of an area where they want to establish their production. They have no means to visit and explore new available surfaces. In sense of facilitating input of data needed for the model, the idea of using the spatial analysis (GIS) was proposed. The idea was to upgrade the previously made decision support model (Dimitrijevic et al, 2012a) using GIS in sense of getting data about the location, soil quality and microclimatic parameters. Further conclusion was that proposed algorithm, realized in the MS Excel 2000 Program had shown some difficulties that indicated the need of using some other program or application.
In this sense, further idea was to use the web technology to create a web application that will be user friendly for the farmers. This web application uses the mentioned algorithm and guides the farmer to the process of „building“ his greenhouse production system from the idea to the exact recommendations and numbers about the greenhouse construction type, covering material, production technologies, technical systems and their capacities.
The paper gives the brief description of the algorithm itself and web application designed, currently, for the farmers in Serbia.
MATERIAL AND METHOD
The proposed decision support model for the greenhouse production is based on the databases regarding available greenhouse constructions, covering materials, available types of irrigation systems and their characteristics as well as of heating systems and ventilation and it was constructed based on four group of questions that are presented to the farmer.
The first group of questions was based on the chosen fruit/vegetable production and production surface that is on disposal. Knowing the location and having access to the maps the data about the surfaces can be automatically loaded (Dimitrijevic et al., 2015). These questions are used in model for formulating the greenhouse type of construction, its dimensions and orientation.
The second group of question was based on production technology, the time of harvesting and soil quality. Previously farmer was asked to enter the data about the soil quality (Dimitrijevic et al., 2012a). In that sense the soil quality analysis were necessary before starting the model. Since this is not a one-hour job, the idea was making it simpler. Soil maps will be used to give the answer about soil quality parameters and terrain exposition (Dimitrijevic et al., 2015). For the purpose of production technology determination another database that consists of the planting/harvesting dates for the moment most common
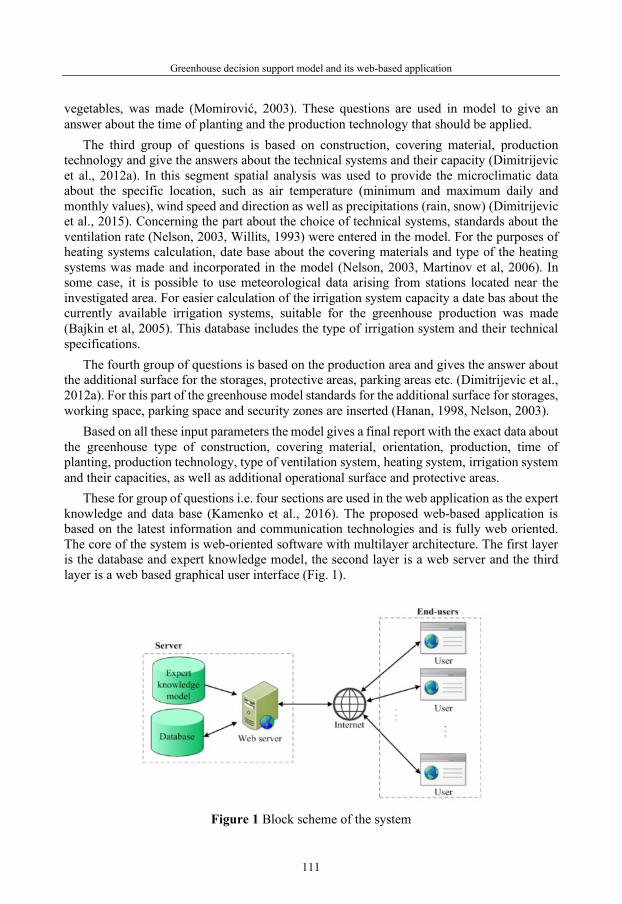
Greenhouse decision support model and its web-based application
111
vegetables, was made (Momirović, 2003). These questions are used in model to give an answer about the time of planting and the production technology that should be applied.
The third group of questions is based on construction, covering material, production technology and give the answers about the technical systems and their capacity (Dimitrijevic et al., 2012a). In this segment spatial analysis was used to provide the microclimatic data about the specific location, such as air temperature (minimum and maximum daily and monthly values), wind speed and direction as well as precipitations (rain, snow) (Dimitrijevic et al., 2015). Concerning the part about the choice of technical systems, standards about the ventilation rate (Nelson, 2003, Willits, 1993) were entered in the model. For the purposes of heating systems calculation, date base about the covering materials and type of the heating systems was made and incorporated in the model (Nelson, 2003, Martinov et al, 2006). In some case, it is possible to use meteorological data arising from stations located near the investigated area. For easier calculation of the irrigation system capacity a date bas about the currently available irrigation systems, suitable for the greenhouse production was made (Bajkin et al, 2005). This database includes the type of irrigation system and their technical specifications.
The fourth group of questions is based on the production area and gives the answer about the additional surface for the storages, protective areas, parking areas etc. (Dimitrijevic et al., 2012a). For this part of the greenhouse model standards for the additional surface for storages, working space, parking space and security zones are inserted (Hanan, 1998, Nelson, 2003).
Based on all these input parameters the model gives a final report with the exact data about the greenhouse type of construction, covering material, orientation, production, time of planting, production technology, type of ventilation system, heating system, irrigation system and their capacities, as well as additional operational surface and protective areas.
These for group of questions i.e. four sections are used in the web application as the expert knowledge and data base (Kamenko et al., 2016). The proposed web-based application is based on the latest information and communication technologies and is fully web oriented. The core of the system is web-oriented software with multilayer architecture. The first layer is the database and expert knowledge model, the second layer is a web server and the third layer is a web based graphical user interface (Fig. 1).
Figure 1 Block scheme of the system

A. Dimitrijević, C. Sica, I. Kamenko, Z. Mileusnić, R. Miodragović
112
In the concrete implementation, Microsoft SQL Server 2008 is used. Web application is relying on the algorithm for the decision support for greenhouse production. Access to the software is provided through a graphical interface using standard web browser. For designing and implementation of user interface is used ASP.NET technology.
ASP.NET is a web application framework developed and marketed by Microsoft that enables programmers to build dynamic websites, web applications and web services. ASP.NET web pages, known as web forms, are the main building block for application development. These pages typically contain static (X)HTML markup, a markup defining server-side web controls and user controls. This feature provides the ease of development offered by scripting languages with the performance benefits of a compiled binary (MacDonald and Szpuszta, 2005; MacDonald and Szpuszta, 2006).
RESULTS AND DISCUSSION
In the first part of the application, producer inserts culture and the desired production surface, and model suggests the type of greenhouse construction (Fig 2). The output data from this part of model are greenhouse orientation, production surface and the covering material/production surface ratio.
Figure 2 Selection of the greenhouse construction type and parameters
Knowing the GPS coordinates is possible to obtain, in a GIS system, information
about: terrain, slope, orientation, soil quality, carbonate content and pH, etc (Fig. 3).

Greenhouse decision support model and its web-based application
113
Figure 3 Slope and exposition maps of an area located in Basilicata Region (South Italy)
Further part of the algorithm is dealing with the production season and technology. User
is asked about the plant that he wants to cultivate and time of (Fig. 4). Based on the GPS coordinates (Fig. 5) soil quality parameters are automatically uploaded.
Figure 4 Selection of the production technology and season, and plant number.
In the case of heating system optimization, web application suggests whether heating
is needed or not. The input variables are already known except that the user must suggest what covering material will be used and what kind of heating system does he want (air heating, pipe central heating, etc.) (Fig. 6). Other input variables are wind speed and the temperature in the region (Fig. 7). Farmer does not need to know these because these data can be provided in meteorological station.
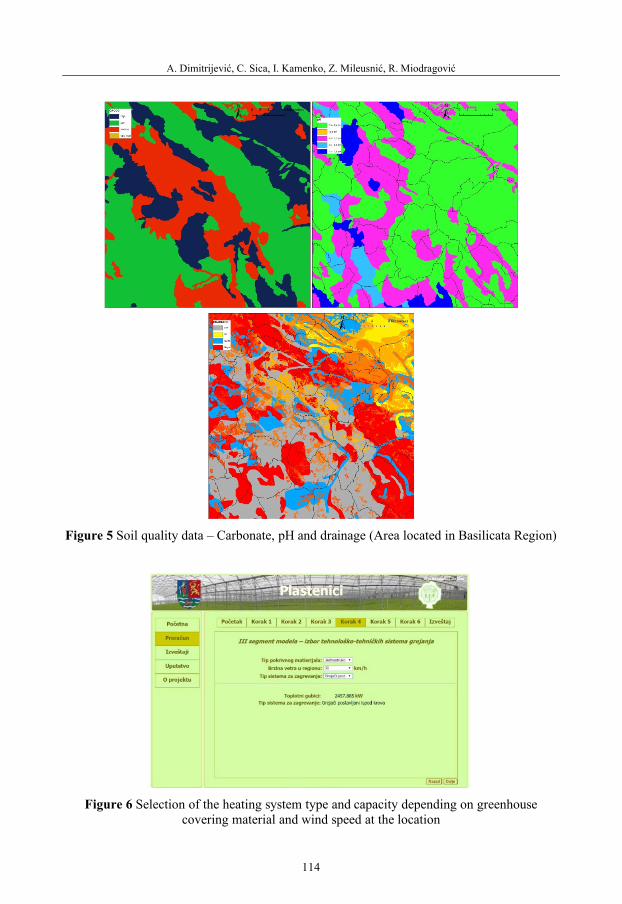
A. Dimitrijević, C. Sica, I. Kamenko, Z. Mileusnić, R. Miodragović
114
Figure 5 Soil quality data – Carbonate, pH and drainage (Area located in Basilicata Region)
Figure 6 Selection of the heating system type and capacity depending on greenhouse
covering material and wind speed at the location

Greenhouse decision support model and its web-based application
115
Figure 7 Average Temperature in the region, °C (Area located in Basilicata Region) The final step represents the overview of calculated data in previous steps and can be seen
in Fig. 8. The report can be stored in the database and accessed later on the reports web page (izvestaji.aspx). The reports web page (izvestaji.aspx) enables the user to manipulate with the previously saved reports and can be seen in Fig. 8.
Figure 8 The final report of the web application
In the upper part of the web form is a list of reports with basic information while the lower
part is a detailed review of the reports highlighted in the previous list. User can view each saved report and optionally delete unwanted report.

A. Dimitrijević, C. Sica, I. Kamenko, Z. Mileusnić, R. Miodragović
116
CONCLUSION
In this paper a simple model for establishing the greenhouse production is presented as well as its web application. The aim was to make the greenhouse production system closer to a farmer by letting him to know on what parameters he can influence and how changing the one parameter can influence the establishment of whole system. The idea of introducing spatial analysis as an input data tool, that will facilitate model usage, was presented. Possibilities of using spatial data and thematic maps, such as soil quality, available surface and exposition, microclimatic condition, etc were analyzed and discussed. During the algorithm preparation, it was concluded that some kind of computer application must be made in order to help the farmer. Existing expert knowledge about optimal greenhouse production is not available to every agricultural producer. So, the proposed web application implements such expert knowledge and makes it available to every interested user with the Internet access and with standard web browser. Each generated report can be saved for later use. In this way, the user can compare two or more proposed solutions and makes a final decision on raising greenhouse production system at the proposed specification.
ACKNOWLEDGEMENT
We would like to thank to the Ministry of Education and Science, Republic of Serbia for funding the TR 31051 and TR 32018.
REFERENCES
Aggarwal P. K., Kalra N., Chandet S., Pathak H. InfoCrop: A dynamic simulation model for the assessment of crop yields. Losses due to pests, and environmental impact of agro-ecosystems in tropical environments. I. Model Description. Agricultural Systems 89 (2006) 1-25.
Bennis N., Duplaix J., Enea G., Haloua M., Youlal H. Greenhouse climate modeling and robust control. Computers and electronics in agriculture 61(2008) 96-107.
Blasco X., Martinez M., Herrero J. M., Ramos C., Sanchis J. Model-based predictive control of greenhouse climate for reducing energy and water consumption. Computers and Electronics in Agriculture 55 (2007) 49-70.
Clarke N. D., Shipp J. L., Papadopoulos A. P., Jarvis W. R., Khosla S., Jewett T. J., Ferguson G. Development of the Harrow Greenhouse Manager: a decision-support system for greenhouse cucumber and tomato. Computers and Electronics in Agriculture 24 (1999) 195-204.
Dimitrijevic A., Miodragovic R., Mileusnic Z., Urosevic M., Ponjican O. (2012a). Introduction to the Greenhouse Decision Support Model. In: Kosutic S (ed) Proc 40th International Symposium on agricultural Engineering Actural Tasks on Agricultural Engineering, Opatija, Croatia, pp 569-576.
Dimitrijevic A., Bajkin A., Zoranovic M., Ralevic I. (2012b). Model izbora energetski efikasnog tehnološko-tehničkog sistema gajenja u kontrolisanim uslovima. Journal on Processing and Energy in Agriculture, 16 (2): 57-60.
Dimitrijevic A., Statuto D., Sica C., Ponjican O. (2015) Possibilities of using spatial analysis as an input data tool for the greenhouse decision support model. In: Kosutic S (ed) Proc 43rd International Symposium on agricultural Engineering Actual Tasks on Agricultural Engineering, Opatija, Croatia, pp 451-459.
Greenhouse decision support model and its web-based application
117
Ehret D. L., Hill B. D., Helmer T., Edwards D. R. Neural network modeling of greenhouse tomato yield, growth and water use from automated crop monitoring data. Computers and Electronics in Agriculture 79 (2011) 82-89.
Gupta M. K., Samuel D. V. K., Sirohi N. P. S. Decision support system for greenhouse seedling production. Computers and Electronics in Agriculture 73 (2010) 133-145.
Hanan J. J. (1998). Greenhouses – Advanced Technology for Protected Horticulture, CRC Press, Boca Raton, USA
Helmer T., Ehret D. L., Bittman S. CropAssist, an automated system for direct measurement of greenhouse tomto growth and water use. Computers and Electronics in Agriculture 45 (2005) 198-215.
Incrocci, L., Fila, G., Bellocchi, G., Pardossi, A., Campiotti, C. A., Balducchi, R. Soil-less indoor-grown lettuce (Lactuca sativa L.): Approaching the modeling tasks. Environmental Modelling & Software 21 (2006) 121-126.
Kamenko I., Dimitrijević A., Kulić F., Nikolić P. (2016) Web based application for optimal greenhouse production system selection. Journal on Processing and Energy in Agriculture 20 (4): 182-185.
MacDonald, M., Szpuszta, M. (2005). ProASP.NET 2.0 Website Programming. Apress, New York City, United States.
MacDonald, M., Szpuszta, M. (2006). ProASP.NET 2.0 in C# 2005 (1st edition ed.). Apress, New York City, United States.
Martinov M. et al. (2006). Tehničko–ekonomske osnove za izbor plastenika / staklenika za komercijalna porodična gazdinstva – samostalna udruženja, Ar – specijalno izdanje, Novi Sad
Massa, D., Incrocci, L., Maggini, R., Bibbiani, C., Carmassi, G., Malorgio, F., Pardossi, A. Simulation of crop water and mineral relations in greenhouse soilless culture. Environmental Modeling & Softwere 26 (2011) 711-722.
Molina-Aiz F. D., Fatnassi H., Boulard T., Roy J. C., Valera D. L. Comparison of finite element and finite volume methods for simulation of natural ventilation in greenhouse. Computers and Electronics in Agriculture 72 (2010) 69-86.
Momirović N. (2003). Škola gajenja povrća, Poljoprivredni list, Specijalno izdanje Nelson P. V. (2003). Greenhouse Oparation and management, Sixth Edition, Prentice Hall, New Jersey Speetjens S. L., Stigter J. D., van Straten G. Towards and adaptive model for greenhouse control.
Computers and Electronics in Agriculture 67 (2009) 1-8. Willits D. H. (1993). Greenhouse Cooling, North Carolina Flower Growers′ Bul, 38 (2): 15–18 Van Hanten E. J. (1994). Validation of a Dynamic Lettuce Growth Model for Greenhouse Climate
Control. Agricultural Systems 45: 55-72. Van Straten G., Challa H., Buwalda F. Towards user accepted optimal control of greenhouse climate.
Computer and Electronics in Agriculture, 26(2000): 221-238.

48th Symposium "Actual Tasks on Agricultural Engineering", Zagreb, Croatia, 2021
119
OPERATION AND DESIGN SIMULATION OF THE PHOTOVOLTAIC SYSTEM FOR SMART GREENHOUSES
Dan CUJBESCU1, Iuliana GĂGEANU1*, Cătălin PERSU1, Mihai MATACHE1, Iulian VOICEA1, Gabriel GHEORGHE1, Ion MURGESCU2
*E-mail of corresponding author: [email protected] 1Testing Department, INMA, Ion Ionescu de la Brad Blv. No. 6, Sector 1, Bucharest, Romania 2Laboratory of Renewable Energy Sources, ICPE-CA, 313 Splaiul Unirii, Sector 3, Bucharest,
Romania
ABSTRACT
The sustainable energy approach promotes the use of renewable energy (supplemented by natural processes with a comparable or faster frequency than its consumption rate) in the agricultural sector, especially in areas where solar energy is abundantly available (rural areas, remote areas, etc.). Renewable energy technologies are those that consume primary energy resources that are not subject to depletion. The photovoltaic cell converts sunlight directly into electricity, being the fastest type of alternative energy, with a growth rate of 50% per year. The paper presents a simulation of the operation of two photovoltaic systems for greenhouses, achieving the energy balance of important electric consumers and a predicted load curve was designed, in two possible variants. Depending on these, two versions of photovoltaic systems (PV generators) were dimensioned to ensure the supply of equipment in the greenhouse, mainly the ventilation and the fertigation system. The load curve was introduced in the PVSyst design and simulation program and two construction variants were designed, with two types of photovoltaic panels, inverters and batteries.
Key words: greenhouse, renewable energy, simulation, design, photovoltaic
INTRODUCTION
Today, in order to reduce greenhouse gas emissions, the use of alternative and renewable energy has become increasingly common, leading to a reduction in the use of fossil fuels (Marin et al., 2020; Sace, 2010).
Solar energy is available all over the world, with small longitudinal / latitudinal differences certainly in quantities more than enough, being produced by transforming sunlight into
48. ACTUAL TASKS ON AGRICULTURAL ENGINEERING
Preliminary communication

D. Cujbescu, I. Găgeanu, C. Persu, M. Matache, I. Voicea, G. Gheorghe, I. Murgescu
120
electrical or thermal energy, through photovoltaic applications (Mînzu and Let, 2006; Tong et al. 2018).
An important parameter for assessing the impact of production on the environment is the efficient use of energy (Liu et al., 2010).
The need to use more and more energy sources in the agricultural sector increases the impact on the environment (Tudisca et al., 2013). Experimental research on greenhouse gas emissions, with high impact on environmental contamination, has shown that agriculture accounts for 10-12% of total greenhouse gas emissions, especially carbon dioxide (Fatemeha et al. 2019; Nabavi et al., 2016).
Recently, many studies have focused on photovoltaic systems, with the aim of substantially, reducing energy consumption, use in disadvantaged areas, rural areas, as well as diversifying farmers' incomes, while ensuring an adequate economic outlook for the new European regulatory framework (Kadowakia et al., 2012, Marucci et al., 2018, Poncet et al., 2012).
The paper presents the simulation of the operation of two photovoltaic systems for greenhouses, through the energy balance of important consumers, designing a predicted load curve, in two possible versions, depending on which two versions of photovoltaic systems (generators PV) were dimensioned.
MATERIALS AND METHODS
For experimental research, standalone photovoltaic systems (off-grid) were used to provide a greater degree of independence to the main objective: the greenhouse. The simplified diagram of the photovoltaic generator is presented in Fig.1.
Figure 1 Diagram of the off-grid photovoltaic generator
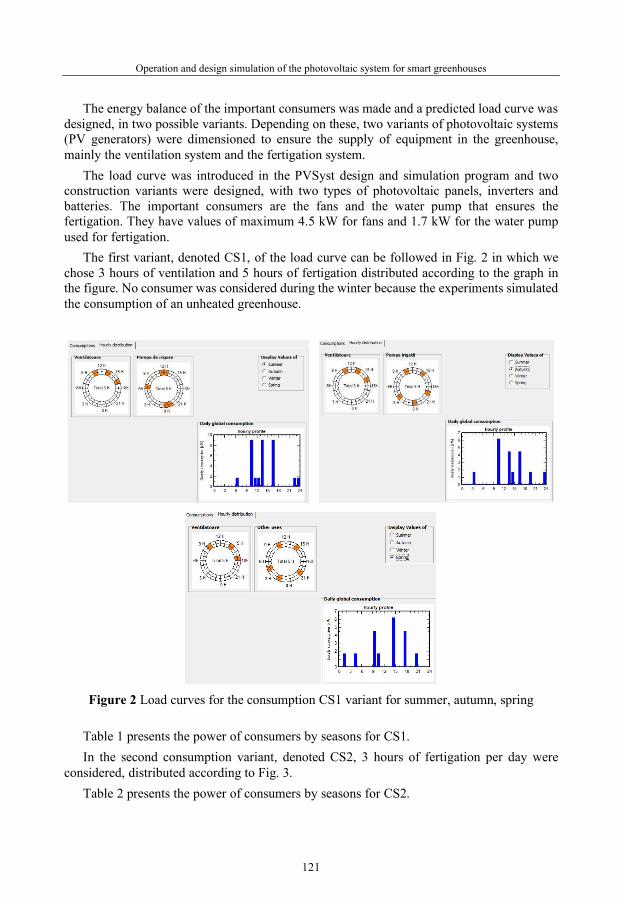
Operation and design simulation of the photovoltaic system for smart greenhouses
121
The energy balance of the important consumers was made and a predicted load curve was designed, in two possible variants. Depending on these, two variants of photovoltaic systems (PV generators) were dimensioned to ensure the supply of equipment in the greenhouse, mainly the ventilation system and the fertigation system.
The load curve was introduced in the PVSyst design and simulation program and two construction variants were designed, with two types of photovoltaic panels, inverters and batteries. The important consumers are the fans and the water pump that ensures the fertigation. They have values of maximum 4.5 kW for fans and 1.7 kW for the water pump used for fertigation.
The first variant, denoted CS1, of the load curve can be followed in Fig. 2 in which we chose 3 hours of ventilation and 5 hours of fertigation distributed according to the graph in the figure. No consumer was considered during the winter because the experiments simulated the consumption of an unheated greenhouse.
Figure 2 Load curves for the consumption CS1 variant for summer, autumn, spring
Table 1 presents the power of consumers by seasons for CS1. In the second consumption variant, denoted CS2, 3 hours of fertigation per day were
considered, distributed according to Fig. 3. Table 2 presents the power of consumers by seasons for CS2.

D. Cujbescu, I. Găgeanu, C. Persu, M. Matache, I. Voicea, G. Gheorghe, I. Murgescu
122
Table 1 Distribution of consumption by seasons in variant CS1
Number Power Use Energy Summer (Jun-Aug)
Fans 2 4,500 W tot 3 h/day 27,000 Wh/day
Irrigation pump 1 1,700 W tot 5 h/day 8,500 Wh/day
Stand-by consumers 24 h/day, 7days 288 Wh/day
Total daily energy 35,788 Wh/day
Autumn (Sep-Nov)
Fans 1 4,500 W tot 3 h/day 13,500 Wh/day
Irrigation pump 1 1,700 W tot 5 h/day 8,500 Wh/day
Total daily energy 22,000 Wh/day
Spring (Mar-May)
Fans 1 4,500 W tot 3 h/day 13,500 Wh/day
Other uses 1 1,700 W tot 5 h/day 8,500 Wh/day
Total daily energy 22,000 Wh/day
Figure 3 Load curves for the consumption CS2 variant for summer, autumn, spring

Operation and design simulation of the photovoltaic system for smart greenhouses
123
Table 2 Distribution of consumption by seasons in variant CS2
Number Power Use Energy
Summer (Jun-Aug)
Fans 2 4,500 W tot 3 h/day 27,000 Wh/day
Irrigation pump 1 1,700 W tot 3 h/day 5,100 Wh/day
Stand-by consumers 24 h/day, 7days 288 Wh/day
Total daily energy 32,388 Wh/day
Autumn (Sep-Nov)
Fans 1 4,500 W tot 3 h/day 13,500 Wh/day
Irrigation pump 1 1,700 W tot 3 h/day 5,100 Wh/day
Total daily energy 18,600 Wh/day
Spring (Mar-May)
Fans 1 4,500 W tot 3 h/day 13,500 Wh/day
Other uses 1 1,700 W tot 3 h/day 5,100 Wh/day
Total daily energy 18,600 Wh/day The two consumption variants presented were introduced in the simulation program for
two constructive variants of the photovoltaic system. PVsyst program was used to design the photovoltaic generators.
The configuration of the photovoltaic generator in variant 1, denoted by G1, is shown in Table 3.
The main components are: - 12 Semi-flexible photovoltaic panels with nominal power Pn=160 W,
type SZ-160-36MF SOLARFAM, - 4 Newmax GEL 12 V gel batteries, 150 Ah, - 1.8 kW pure sine wave inverter, type 3SP250024W. In the G2 variant, the system is equipped with semi-flexible 310 W photovoltaic panels,
the total power of the panel area being 3.1 kWp compared to 1.9 kWp that the first variant had. Scheme G2 is identical to that used in G1 but differs in the parameters of the basic components (Table 4).
These are: - 12 Flexible Monocrystalline Photovoltaic Panels 310W - model: SH-310S6-20,
power: 310 W, - 4 ULTRACELL UCG250-12 12V 250Ah batteries, - PIP-MS / MG PF1 pure sine wave inverter.
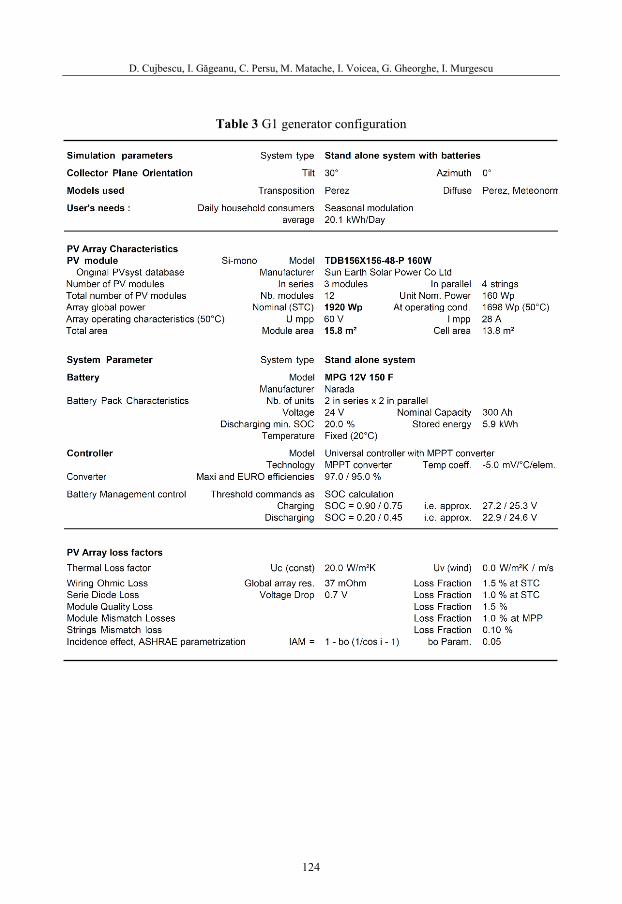
D. Cujbescu, I. Găgeanu, C. Persu, M. Matache, I. Voicea, G. Gheorghe, I. Murgescu
124
Table 3 G1 generator configuration

Operation and design simulation of the photovoltaic system for smart greenhouses
125
Table 4 G2 generator configuration
RESULTS AND DISCUSSION
Figure 4 presents the detailed results for energy production, general consumption, consumption of renewable energy production and the degree of use of the generator, for G1, for consumption curve CS1. The diagram of the generator is that of Figure 1.

D. Cujbescu, I. Găgeanu, C. Persu, M. Matache, I. Voicea, G. Gheorghe, I. Murgescu
126
Figure 4 Energy production G1 for CS1
Figure 5 presents the detailed results for energy production, general consumption,
consumption of renewable energy production and the degree of use of the generator, for G1, for consumption curves CS2. The diagram of the generator is that of Figure 1.

Operation and design simulation of the photovoltaic system for smart greenhouses
127
Figure 5 Energy production G1 for CS2
Figure 6 shows the simulated production for the consumption curve CS2, for the
configuration of the generator G2.

D. Cujbescu, I. Găgeanu, C. Persu, M. Matache, I. Voicea, G. Gheorghe, I. Murgescu
128
Figure 6 Energy production G2 for CS2
Only the CS2 load curve was considered because it is much more advantageous in terms
of the degree of renewable energy consumption.
CONCLUSIONS
Analyzing the two variants G1 and G2 in terms of costs, the price difference is obvious, variant G2 being about 30% more expensive than G1. The price difference is primarily due to the higher power of the G2, 3.1 kWp compared to 1.9 kWp at G1.
In the case of the G2 variant, the degree of use of renewable energy – Solar Fraction in the table, is close to half - 0.465 as opposed to G1 where it is about a third - 0.337. This is

Operation and design simulation of the photovoltaic system for smart greenhouses
129
primarily due to the high value of unused energy 4.24 MWh per year for G1 and 3.42 MWh for G2.
Also, comparing the degree of use of the source, in the case of G1 for both CS1 and CS2 scenarios, a higher degree of use was observed: 0.337 for CS2 compared to 0.248 for CS1. The improvement occurred due to the transfer of consumption to the irrigation pump from the dark period to the sunny period.
It is recommended to increase the use by increasing the capacity of the batteries and by scheduling the use of consumers, as much as possible, during the period of sunshine.
ACKNOWLEDGEMENTS
This work was supported by the Ministry of Agriculture and Rural Development, through the project entitled “Technologies and intelligent equipment for increasing productivity in protected spaces” – ADER 25.2.1 – Ctr. 25.2.1/27.09.2019.
REFERENCES
Fatemeha H. F., Motevali A., Nabavi P. A. Hashemi S. J., Chau K. (2019). Energy-Life cycle assessment on applying solar technologies for greenhouse strawberry production. Renewable and Sustainable Energy Reviews 116, 109411, 1–18.
Kadowakia M., AkiraY., Fumito I., Toshihiko T., Shuji N. (2012). Effects of greenhouse photovoltaic array shading on Welsh onion growth. Biosystems Engineering Volume 111, Issue 3, 290–297.
Liu Y., Jensen H. H., Egelyng H., Langer V. (2010). Energy efficiency of organic pear production in greenhouses in China. Renewable Agriculture and Food Systems: 25(3), 196–203.
Marin E., Mateescu M., Manea D., Dumitrașcu A., Carmen V., Popa R., Popa V. (2020). Theoretical research to accomplish a system of ecological heating a greenhouse for vegetables. E3S Web of Conferences 180, 03022, TE-RE-RD 2020, 1–6.
Marucci A., Zambon I., Colantoni A., Monarca D. (2018). A combination of agricultural and energy purposes: Evaluation of a prototype of photovoltaic greenhouse tunnel. Renewable and Sustainable Energy Reviews 82, 1178–1186.
Mînzu V., Let D. (2006). Process control elements in a photovoltaic conversion system. In: CNSNRE - National Conference on New and Renewable Energy Sources At: Târgoviște, România, 1-27.
Nabavi-P. A., Rafiee S., Hosseinzadeh-B. H., Shamshirband S. (2016). Modeling energy consumption and greenhouse gas emissions for kiwifruit production using artificial neural networks. J Clean Prod; 133: 924–931.
Poncet C., Muller M.M., Brun R., Fatnassi H. (2012). Photovoltaic Greenhouses, Non-Sense or a Real Opportunity for the Greenhouse Systems?. Acta Hort. 927, 75–79.
Sace A., (2010). Technical Application Papers No. 10–Photovoltaic plants. A Division of ABB SpALV Breakers.
Tong X., Sun Z., Sigrimis N., Li T. (2018) Energy sustainability performance of a sliding cover solar greenhouse: solar energy capture aspects. Biosyst Eng; 176, 88–102.
Tudisca S., Trapani A.M.D., Sgroi F., Testa R., Squatrito R. (2013). Economic analysis of PV systems on buildings in Sicilian farms. Renew Sustain Energy Rev; 28, 691–701.


48th Symposium "Actual Tasks on Agricultural Engineering", Zagreb, Croatia, 2021
131
EFFECTS OF GREENHOUSE LIME SHADING ON FILTERING THE SOLAR RADIATION
Roberto PUGLISI*, Dina STATUTO, Pietro PICUNO *E-mail of corresponding author: [email protected]
University of Basilicata - SAFE School, via dell’Ateneo Lucano n.10, 85100 Potenza, Italy
ABSTRACT
Protecting crops under a greenhouse allows their optimal management all over the year. Mostly during summer, in order to limit the indoor temperature and create suitable internal growing conditions, a common traditional solution is whitening the external side of the cladding material with slaked lime (calcium hydroxide– Ca(OH)2). The benefits of whitewashing reported in the literature confirm that it has positive effects both on the microclimate and on the development of crops. This paper shows the results of a research, performed by using spectrophotometers in the Laboratory for Testing Materials of the University of Basilicata (Italy), aimed to analyse different types of calcium hydroxide solutions. The analysis verified the variation of radiometric properties and shading effect. The whitening concentration was a fixed dose of simple calcium hydroxide, diluted in two different water concentrations, then painted on an EVAC plastic film. Moreover, an unpainted transparent EVAC plastic film was considered as a reference. The radiometric measurements on the samples were carried out to measure transmittance, reflectance and absorbance on all wavelengths of the Photosynthetically Active Radiation (PAR). The results have given information on the effect of different dilutions of slaked lime on the selective filtering of the solar radiation. These conclusions may be useful to compare similar results with more recent solutions for greenhouse shading, such as the use of plastic nets.
Keywords: whitewashing, plastic film, crop shading, radiometric characteristics, micro-climatic effect.
INTRODUCTION
Continuous climate changes involve many sectors, among which agriculture seems to be the most affected. Climate management is essential to increase crop productions and improve their quality. Protected crops are widely used forms of intensive production, with yields higher than the traditional field crops. A greenhouse must guarantee optimal microclimatic
48. ACTUAL TASKS ON AGRICULTURAL ENGINEERING
Preliminary communication

R. Puglisi, D. Statuto, P. Picuno
132
conditions for the growth of crops, by using well-performing covering materials, which are the most important elements. Indeed, they protect from atmospheric agents, at the same time influencing the transmission of incident solar radiation - according to the radiometric properties of the material - and reducing the energy losses (Castronuovo et al., 2017; Castronuovo et al., 2019).
The ability of covering materials to modify the microclimate depends on their radiometric properties, mainly on their transmittance (Vox et al., 2010), as well as reflectance and emissivity/absorbance (Papadakis et al., 2000). Solar radiation is the primary source of energy flows reaching the earth's surface. Solar radiation has its peak at a wavelength of 500 nm. The visible range (380 - 760 nm) is nearly coincident with the Photosynthetically Active Radiation (PAR), having a wavelength ranging from 400 nm to 700 nm (Papadakis et al., 2000; Castellano et al., 2008). Within PAR, the green wavelength can play an important role, because it is antagonistic to plant development, when compared to the red and blue components, that instead promote plant development (Folta and Maruhnich, 2007). Excessive solar radiation levels can affect crops negatively, altering the production and creating an unhealthy environment for the agricultural workers to carry on their work. The combination of different wavelengths can influence the morpho-physiological development of plants. Different roofing materials through selective filtering of incoming solar radiation can influence the productive aspects of the plant (Schettini et al., 2011). In addition, adverse temperatures and excessive radiation can significantly reduce the photosynthetic process with photo-inhibition (Moreno-Teruel et al., 2020). Therefore, the solution would be to use shading devices (Castronuovo et al., 2017; Abdel-Ghany et al., 2016), capable of controlling the temperature inside the greenhouse, in order to reach an environment suitable for crops. Different cooling strategies can be used, such as evaporative cooling systems and forced ventilation, or by means of shading methods. Within these methods, the most currently employed is the traditional whitening of the external side of the plastic film with slaked lime (calcium hydroxide – Ca(OH)2). More recently, the use of shading nets - with fairly high photo-selective properties, with equally large shading factors (Abdel-Ghany and Al-Helal, 2020) - has been affirmed, thanks to their properties to selective filtering the solar radiation, when applied outside the greenhouse.
Among the most inexpensive traditional techniques, the whitening of greenhouse covering materials is quite easy to apply, with relatively low costs and satisfying results on crops and the maintenance of the microclimate inside the greenhouse. For example, in the Mediterranean area, especially during the summer period, natural ventilation is not always sufficient to limit the high temperatures, so whitening is used as a possible cooling technique (Valera et al., 2016). Then, an effective lime removal takes place naturally, with the help of autumn rains. Baille et al., (2001) described how the whitening of the greenhouse covering material could influence the behaviour of the microclimate inside a greenhouse. The greenhouse observed was located in a coastal area of eastern Greece. Whitewashing reduced the average greenhouse transmission coefficient of solar radiation from 0.62 to 0.31. The conclusions from the use of whitewashing method provided important information on the economic benefits of the technique (Goudriaan and Laar, 1994; Mashonjowa et al., 2010; Abdel-Ghany et al., 2012). Also, positive effects on both the behaviour of the crops and the effectiveness of the practice have been observed. Hence, this simple technique turned out to be an ideal mean to overcome the high summer temperatures in warmer countries, thus limiting the heat generated by the incident solar radiation, by reflecting it to a large extent (Picuno et al., 2011; Ahemd et al.,
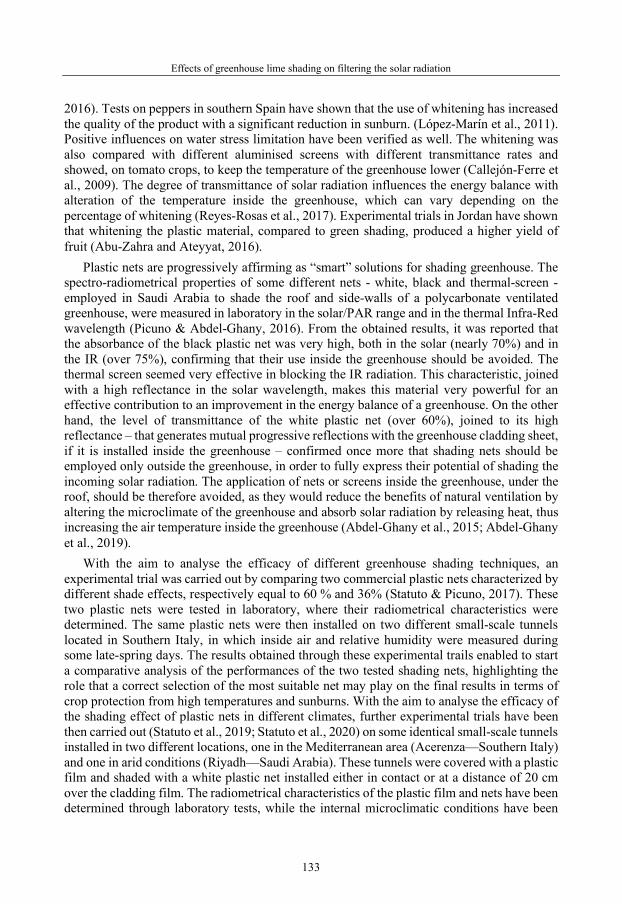
Effects of greenhouse lime shading on filtering the solar radiation
133
2016). Tests on peppers in southern Spain have shown that the use of whitening has increased the quality of the product with a significant reduction in sunburn. (López-Marín et al., 2011). Positive influences on water stress limitation have been verified as well. The whitening was also compared with different aluminised screens with different transmittance rates and showed, on tomato crops, to keep the temperature of the greenhouse lower (Callejón-Ferre et al., 2009). The degree of transmittance of solar radiation influences the energy balance with alteration of the temperature inside the greenhouse, which can vary depending on the percentage of whitening (Reyes-Rosas et al., 2017). Experimental trials in Jordan have shown that whitening the plastic material, compared to green shading, produced a higher yield of fruit (Abu-Zahra and Ateyyat, 2016).
Plastic nets are progressively affirming as “smart” solutions for shading greenhouse. The spectro-radiometrical properties of some different nets - white, black and thermal-screen - employed in Saudi Arabia to shade the roof and side-walls of a polycarbonate ventilated greenhouse, were measured in laboratory in the solar/PAR range and in the thermal Infra-Red wavelength (Picuno & Abdel-Ghany, 2016). From the obtained results, it was reported that the absorbance of the black plastic net was very high, both in the solar (nearly 70%) and in the IR (over 75%), confirming that their use inside the greenhouse should be avoided. The thermal screen seemed very effective in blocking the IR radiation. This characteristic, joined with a high reflectance in the solar wavelength, makes this material very powerful for an effective contribution to an improvement in the energy balance of a greenhouse. On the other hand, the level of transmittance of the white plastic net (over 60%), joined to its high reflectance – that generates mutual progressive reflections with the greenhouse cladding sheet, if it is installed inside the greenhouse – confirmed once more that shading nets should be employed only outside the greenhouse, in order to fully express their potential of shading the incoming solar radiation. The application of nets or screens inside the greenhouse, under the roof, should be therefore avoided, as they would reduce the benefits of natural ventilation by altering the microclimate of the greenhouse and absorb solar radiation by releasing heat, thus increasing the air temperature inside the greenhouse (Abdel-Ghany et al., 2015; Abdel-Ghany et al., 2019).
With the aim to analyse the efficacy of different greenhouse shading techniques, an experimental trial was carried out by comparing two commercial plastic nets characterized by different shade effects, respectively equal to 60 % and 36% (Statuto & Picuno, 2017). These two plastic nets were tested in laboratory, where their radiometrical characteristics were determined. The same plastic nets were then installed on two different small-scale tunnels located in Southern Italy, in which inside air and relative humidity were measured during some late-spring days. The results obtained through these experimental trails enabled to start a comparative analysis of the performances of the two tested shading nets, highlighting the role that a correct selection of the most suitable net may play on the final results in terms of crop protection from high temperatures and sunburns. With the aim to analyse the efficacy of the shading effect of plastic nets in different climates, further experimental trials have been then carried out (Statuto et al., 2019; Statuto et al., 2020) on some identical small-scale tunnels installed in two different locations, one in the Mediterranean area (Acerenza—Southern Italy) and one in arid conditions (Riyadh—Saudi Arabia). These tunnels were covered with a plastic film and shaded with a white plastic net installed either in contact or at a distance of 20 cm over the cladding film. The radiometrical characteristics of the plastic film and nets have been determined through laboratory tests, while the internal microclimatic conditions have been

R. Puglisi, D. Statuto, P. Picuno
134
monitored inside these experimental tunnels in both locations. The obtained results have been taken as the base for a comparative analysis to evaluate the performance of different nets, and to explore the role of shading on the temperature reduction and quality of light in different climates.
The present work aims to show the main results of a laboratory research aimed at analysing the effect of greenhouse shading with different types of calcium hydroxide concentrations. This experimental analysis was carried out to verify the variations in terms of radiometric properties (transmittance, reflectance, absorbance) and shading effect, so as to compare these results with plastic nets.
MATERIALS AND METHODS
The concentration of the whitening solution used for this analysis (Table 1), is a fixed dose (100 g) of simple calcium hydroxide (Roca et al., 2016), which was diluted in two different concentrations of water (50 ml and 30 ml) and then whitened on a 200µm thick EVAC transparent plastic film (fig. 1). An untreated EVAC plastic film was also analysed as a control. The experimental activity was carried out at the Laboratory for Testing Materials of the SAFE School of the University of Basilicata (Italy), by determining the radiometric properties – i.e.: transmittance, reflectance and absorbance - thanks to the use of spectrophotometers (Jasco V-570®), which allowed to test the different samples and to analyse these characteristics for all the wavelengths along the PAR.
Table 1 Concentrations used in the experimental activities.
Treatment Name treatment White lime dose (g) Water dose (ml)
White A1
100 g 50 ml
A2 30 ml
Control T0 --- ---
Figure 1 EVAC film tested during the experimental activity.

Effects of greenhouse lime shading on filtering the solar radiation
135
RESULTS AND DISCUSSION
The spectro-radiometric analyses provided data in terms of shading along the PAR. It can be inferred that the shading effect will be able to provide further information on the actual ability of the whitewashed film to protect crops inside the greenhouse. These analyses can provide, with more in-depth analysis, further information on the actual ability of the whitewashed film to protect plant crops under the covering material from excessive solar radiation. The use of EVAC plastic film whitened with lime has significantly increased the shading effect at PAR (Tab.2).
Table 2 Results of spectro-radiometric analyses of shading effect in different test.
Range Wavelength Transmittance Reflectance Absorbance Shading effect
nm % % % %
T0 400 - 700 88.40 10.10 0.06 10.15
A1 400 - 700 19.75 80.69 0.73 81.42
A2 400 - 700 13.48 85.88 0.89 86.77 The results show that there are clear differences between samples whitened with calcium
hydroxide. Among these, sample A2 - i.e., the least diluted sample - showed a slightly lower transmittance than the most diluted sample, i.e. A1. Reverse situation for reflectance, which has – as expected - significantly higher percentages on the whitened samples, compared to the T control (Tab. 2). Among the whitened samples, the one with the highest reflectance is A2, i.e., the less diluted sample with water, followed by A1. The reflectance, like absorbance, respects the dilution trend, from lowest to highest. The absorbance shows indeed almost similar results in the whitened films, being higher than in the case of the non-whitened film (Tab. 2).
The effect of whitewashing on the radiometric characteristics along the PAR, has been then further assessed through the analysis of their change along the different colours/wavelengths in the range from 400 to 700 nm (tables 3, 4 and 5).
Table 3 Results of spectro-radiometric analysis on the transparent EVAC film (T0).
Range Wavelength Transmittance Reflectance Absorbance Shading effect
nm % % % %
VIOLET 400 - 435 86.87 11.28 0.06 11.34
INDIGO 435 - 500 87.73 10.77 0.06 10.83
BLUE 500 - 520 88.22 10.35 0.06 10.41
GREEN 520 - 565 88.83 9.70 0.05 9.75
YELLOW 565 - 590 88.74 9.76 0.05 9.82
ORANGE 590 - 625 88.95 9.57 0.05 9.62
RED 625 - 700 89.35 9.27 0.05 9.32

R. Puglisi, D. Statuto, P. Picuno
136
Table 4 Results of spectro-radiometric analysis on EVAC film whitened with calcium hydroxide (A1).
Range Wavelength Transmittance Reflectance Absorbance Shading effect
nm % % % %
VIOLET 400 - 435 15.69 81.32 0.85 82.17
INDIGO 435 - 500 18.13 82.40 0.77 83.17
BLUE 500 - 520 19.29 81.90 0.74 82.64
GREEN 520 - 565 20.97 80.20 0.70 80.90
YELLOW 565 - 590 20.73 80.45 0.71 81.15
ORANGE 590 - 625 21.26 79.79 0.69 80.48
RED 625 - 700 22.30 78.68 0.67 79.36
Table 5 Results of spectro-radiometric analysis on EVAC film whitened with calcium hydroxide (A2).
Range Wavelength Transmittance Reflectance Absorbance Shading effect
nm % % % %
VIOLET 400 - 435 9.20 84.63 1.07 85.70
INDIGO 435 - 500 11.82 86.95 0.94 87.89
BLUE 500 - 520 13.02 86.95 0.90 87.85
GREEN 520 - 565 14.68 85.93 0.84 86.77
YELLOW 565 - 590 14.50 86.15 0.85 87.00
ORANGE 590 - 625 14.96 85.64 0.83 86.47
RED 625 - 700 15.85 84.78 0.81 85.59
From these results, it is possible to deduce that the reduction in the transmittance of the plastic film, depending on the level of painting concentration, is higher as long as shorter wavelengths are considered. Indeed, as shown in figure 2, the reduction of the transmittance is progressively increasing from red to violet. This last colour/waveband has a significantly lower transmittance in all samples with EVAC film whitened with lime, respectively 9.20% in A2 (Tab. 5) and 15.69% in A1 (Tab. 4), while the control has an approximately uniform transmittance throughout the PAR. The red colour, on the other hand, is significantly higher than the other colours/wavebands in all tests, by 15.85% in A2 (Tab. 5) and 22.30% in A1 (Tab. 4). Indigo and blue have intermediate transmittance values.
The reflectance results show that in A2 violet (84.63%) and red (84.78%) are significantly lower than the other colours. In the control the results show decreasing data from violet to red (Fig. 3). The absorbance, instead, presents significantly higher results from violet, 1.07% in A2 and 0.85% in A1, to red, 0.81% in A2 and 0.67% in A1 (Fig. 4).
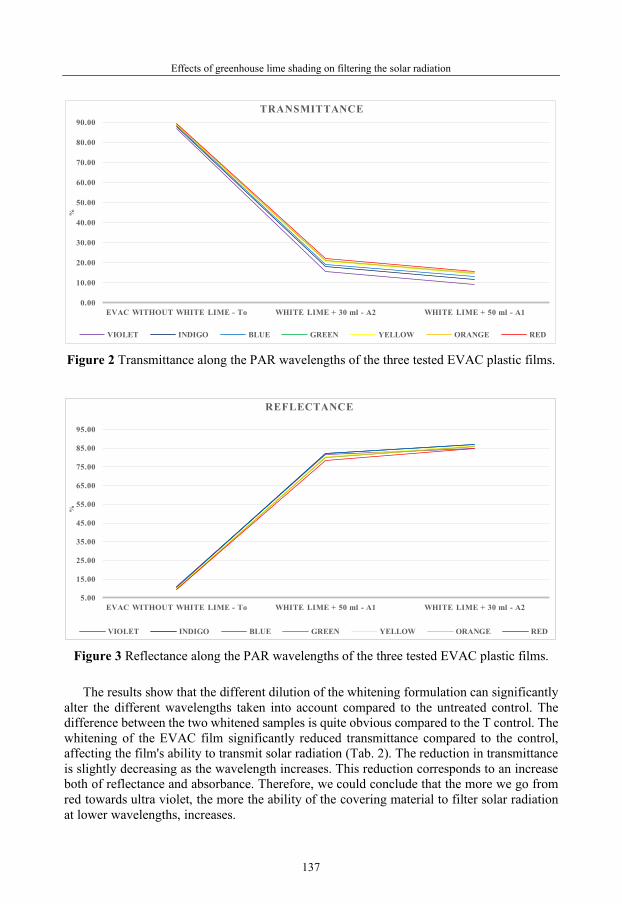
Effects of greenhouse lime shading on filtering the solar radiation
137
Figure 2 Transmittance along the PAR wavelengths of the three tested EVAC plastic films.
Figure 3 Reflectance along the PAR wavelengths of the three tested EVAC plastic films.
The results show that the different dilution of the whitening formulation can significantly
alter the different wavelengths taken into account compared to the untreated control. The difference between the two whitened samples is quite obvious compared to the T control. The whitening of the EVAC film significantly reduced transmittance compared to the control, affecting the film's ability to transmit solar radiation (Tab. 2). The reduction in transmittance is slightly decreasing as the wavelength increases. This reduction corresponds to an increase both of reflectance and absorbance. Therefore, we could conclude that the more we go from red towards ultra violet, the more the ability of the covering material to filter solar radiation at lower wavelengths, increases.
0.00
10.00
20.00
30.00
40.00
50.00
60.00
70.00
80.00
90.00
EVAC WITHOUT WHITE LIME - To WHITE LIME + 30 ml - A2 WHITE LIME + 50 ml - A1
%
TRANSMITTANCE
VIOLET INDIGO BLUE GREEN YELLOW ORANGE RED
5.00
15.00
25.00
35.00
45.00
55.00
65.00
75.00
85.00
95.00
EVAC WITHOUT WHITE LIME - To WHITE LIME + 50 ml - A1 WHITE LIME + 30 ml - A2
%
REFLECTANCE
VIOLET INDIGO BLUE GREEN YELLOW ORANGE RED

R. Puglisi, D. Statuto, P. Picuno
138
Figure 4 Absorbance along the PAR wavelengths of the three tested EVAC plastic films.
Further evaluation of the shading effects of calcium hydroxide on different wavelength
ranges (e.g., UVA, UVB, IR, etc.) would be then necessary. Comparing this selective filtration performance of whitened plastic films with other shading techniques - such as the use of plastic nets, which are progressively used today in protected agriculture - should be investigated as well.
CONCLUSIONS
Calcium hydroxide as a shading technique is mainly used thanks to its cost-effectiveness, as well as its ease of use. It is not a highly technological solution, but it is still frequently used, especially in the Mediterranean areas. It would be of great importance to use current scientific knowledge to support further experimentation in order to compare and develop new shading technologies, such as shading nets. The lack of a specific standard does not allow to determine the spectro-radiometric characteristics of shading roofing materials, such as nets, which requires further laboratory tests. The determination of the spectro-radiometric properties of plastic films whitened with calcium hydroxide is difficult. The dose of calcium hydroxide and the dilution of the whitening formulation, as can be seen from this research, presents very different results on transmittance characteristics. This research also shows that the different dilutions of the whitening formulation do not affect the general transmittance properties and individual wavelengths, so it may not be convenient to use a large amount of lime, while a higher dilution of the whitening formulation would be sufficient and, above all, economically convenient. This research leads to the conclusion that further research on shading materials is needed, which must be accompanied by technical information on the shading factor throughout the solar range, even when they have a function other than shading. This specific information on the shading factor in the main wavelength ranges seems to be very significant, taking into account the different effects on the protected environment.
0.00
0.20
0.40
0.60
0.80
1.00
1.20
1.40
1.60
1.80
2.00
EVAC WITHOUT WHITE LIME - To WHITE LIME + 50 ml - A1 WHITE LIME + 30 ml - A2
%
ABSORBANCE
VIOLET INDIGO BLUE GREEN YELLOW ORANGE RED

Effects of greenhouse lime shading on filtering the solar radiation
139
ACKNOWLEDGEMENTS
Special thanks to Mr. Cosimo Marano - technical staff of the SAFE School of the University of Basilicata - for his support in performing spectro-radiometric laboratory analyses.
REFERENCES
Abdel-Ghany, A., Al-Helal, I., Alkoaik, F., Alsadon, A., Shady, M., Ibrahim, A. (2019). Predicting the Cooling Potential of Different Shading Methods for Greenhouses in Arid Regions. Energies 12, 4716.
Abdel-Ghany, A.M., Al-Helal, I.M. (2020). Toward Sustainable Agriculture: Net-Houses Instead of Greenhouses for Saving Energy and Water in Arid Regions, in: Stagner, J.A., Ting, D.S.-K. (Eds.), Sustaining Resources for Tomorrow, Green Energy and Technology. Springer International Publishing, Cham, pp. 83–98.
Abdel-Ghany, A.M., Al-Helal, I.M., Picuno, P., Shady, M.R. (2016). Modified plastic net-houses as alternative agricultural structures for saving energy and water in hot and sunny regions. Renewable Energy, 93: 332-339.
Abdel-Ghany, A.M., Al-Helal, I.M., Alzahrani, S.M., Alsadon, A.A., Ali, I.M., Elleithy, R.M. (2012). Covering Materials Incorporating Radiation-Preventing Techniques to Meet Greenhouse Cooling Challenges in Arid Regions: A Review. The Scientific World Journal 2012, 1–11.
Abdel-Ghany, A.M., Picuno, P., Al-Helal, I., Alsadon, A., Ibrahim, A., Shady, M. (2015). Radiometric Characterization, Solar and Thermal Radiation in a Greenhouse as Affected by Shading Configuration in an Arid Climate. Energies 8, 1–10.
Abu-Zahra, T.R., Ateyyat, M.A. (2016). Effect of Various Shading Methods on Cucumber (Cucumis sativus L.) Growth and Yield Production. International Journal of Environment and Sustainability 5.
Ahemd, H.A., Al-Faraj, A.A., Abdel-Ghany, A.M. (2016). Shading greenhouses to improve the microclimate, energy and water saving in hot regions: A review. Scientia Horticulturae 201, 36–45.
Baille, A., Kittas, C., Katsoulas, N. (2001). Influence of whitening on greenhouse microclimate and crop energy partitioning. Agricultural and Forest Meteorology 107, 293–306.
Callejón-Ferre, A.J., Manzano-Agugliaro, F., Díaz-Pérez, M., Carreño-Ortega, A., Pérez-Alonso, J. (2009). Effect of shading with aluminised screens on fruit production and quality in tomato (Solanum lycopersicum L.) under greenhouse conditions. Spanish Journal of Agricultural Research 7, 41–49.
Castellano, S.; Scarascia-Mugnozza, G.; Russo, G.; Briassoulis, D.; Mistriotis, A.; Hemming, S.; Waaijenberg D. (2008). Plastic nets in agriculture: a general review of types and applications. Applied Engineering in Agriculture, 24(6), 799-808.
Castronuovo, D., Statuto, D., Muro, N., Picuno, P., Candido, V. (2017). The use of shading nets for the greenhouse cultivation of sweet pepper in the Mediterranean area. Acta Horticulturae 1170, 373–380.
Castronuovo, D., Statuto, D., Muro, N., Picuno, P., Candido, V. (2017). Technical and Agronomic Behavior of Plastic Nets for the Greenhouse Cultivation of Sweet Pepper in the Mediterranean Area. Proceedings of the International Symposium on New Technologies and Management for Greenhouses – GreenSys 2015, Evora (Portugal), 19-23 July 2015. Acta Horticulturae n.1170_46, pp 373-380.
Castronuovo, D., Russo, D., Libonati, R., Faraone, I., Candido, V., Picuno, P., Andrade, P., Valentao, P., Milella, L. (2019). Influence of shading treatment on yield, morphological traits and phenolic profile of sweet basil (Ocimum basilicum L.). Scientia Horticulturae, 254: 91-98.
Folta, K.M., Maruhnich, S.A. (2007). Green light: a signal to slow down or stop. J Exp Bot 58, 3099–3111.

R. Puglisi, D. Statuto, P. Picuno
140
Goudriaan, J., Laar, H.H.V. (1994). Modelling Potential Crop Growth Processes: Textbook with Exercises, Current Issues in Production Ecology. Springer Netherlands.
López-Marín, J., González, A., Gálvez, A. (2011). Effect of shade on quality of greenhouse peppers. Acta Hortic. 895–900.
Mashonjowa, E., Ronsse, F., Mhizha, T., Milford, J.R., Lemeur, R., Pieters, J.G. (2010). The effects of whitening and dust accumulation on the microclimate and canopy behaviour of rose plants (Rosa hybrida) in a greenhouse in Zimbabwe. Solar Energy 84, 10–23.
Moreno-Teruel, M. de los Á., Valera, D., Molina-Aiz, F.D., López-Martínez, A., Peña, A., Marín, P., Reyes-Rosas, A. (2020). Effects of Cover Whitening Concentrations on the Microclimate and on the Development and Yield of Tomato (Lycopersicon esculentum Mill.) Inside Mediterranean Greenhouses. Agronomy 10, 237.
Papadakis, G., Briassoulis, D., Scarascia Mugnozza, G., Vox, G., Feuilloley, P., Stoffers, J.A. (2000). Radiometric and thermal properties of, and testing methods for, greenhouse covering materials. Journal of Agricultural and Engineering Research 77, 7–38.
Picuno, P., Tortora, A., Capobianco, R.L. (2011). Analysis of plasticulture landscapes in Southern Italy through remote sensing and solid modelling techniques. Landscape and Urban Planning, 100 (1-2): 45-56.
Picuno, P., Abdel-Ghany, A.M. (2016). Spectro-radiometrical analysis of plastic nets for greenhouse shading under arid conditions. Proceedings of the 44th Symposium on: “Actual Tasks on Agricultural Engineering – ATAE 2016, Opatija (Croatia), 23-26 February 2016. UDC 631.234:728.98, pp. 469-477.
Reyes-Rosas, A., Molina-Aiz, F.D., Valera, D.L., López, A., Khamkure, S. (2017). Development of a single energy balance model for prediction of temperatures inside a naturally ventilated greenhouse with polypropylene soil mulch. Computers and Electronics in Agriculture 142, 9–28.
Roca, L., Sánchez, J., Rodríguez, F., Bonilla, J., de la Calle, A., Berenguel, M. (2016). Predictive Control Applied to a Solar Desalination Plant Connected to a Greenhouse with Daily Variation of Irrigation Water Demand. Energies 9, 194.
Schettini, E., Salvador, F.R.D., Scarascia-Mugnozza, G., Vox, G. (2011). Radiometric properties of photoselective and photoluminescent greenhouse plastic films and their effects on peach and cherry tree growth. The Journal of Horticultural Science and Biotechnology 86, 79–83.
Statuto, D., Picuno, P. (2017). Micro-climatic effect of shading nets for crop protection in Mediterranean areas. Proceedings of the 45th Symposium on: “Actual Tasks on Agricultural Engineering – ATAE 2017, Opatija (Croatia), 21-24 February 2017. UDC 502.7:631.95, pp. 613 – 622.
Statuto, D., Picuno, P., Abdel-Ghany A.M. (2019). Shading methods for crop protection under greenhouse in mediterranean areas. Proceedings of the 47th Symposium on: “Actual Tasks on Agricultural Engineering – ATAE 2019, Opatija (Croatia), 5 - 7 March 2019. pp. 297-306. ISSN 1848-4425.
Statuto, D., Abdel-Ghany, A.M., Starace, G., Arrigoni, P., Picuno, P. (2020). Comparison of the efficiency of plastic nets for shading greenhouse in different climates. Lecture Notes in Civil Engineering, 67, pp. 287-294.
Valera, D.L., Belmonte, L.J., Molina, F.D., López, A. (2016). Greenhouse agriculture in Almería: A comprehensive techno-economic analysis. Cajamar Caja Rural: Almería, Spain.
Vox, G., Teitel, M., Pardossi, A., Minuto, A., Tinivella, F., Schettini, E. (2010). Sustainable greenhouse systems, in: Sustainable Agriculture: Technology, Planning and Management. pp. 1–80.
48th Symposium "Actual Tasks on Agricultural Engineering", Zagreb, Croatia, 2021
141
USE OF LASER RADIATION AS AN ALTERNATIVE TECHNIQUE FOR SELECTIVE BLOSSOM THINNING
IN APPLE Prud NETSAWANG1,2,*, Lutz DAMEROW2, Peter SCHULZE LAMMERS2
*E-mail of corresponding author: [email protected] Faculty of Engineering, Rajamangala University of Technology Lanna, Chiang Mai, Thailand
2 Institute of Agricultural Engineering, University of Bonn, Germany
ABSTRACT
Crop load management by blossom thinning is an important method, which affects fruit quality and also benefits to overcome alternate bearing. Therefore, the development of methods for reducing a distinct amount of flower is essential for fruit production. Selective blossom thinning is a high precision method for removing unwanted flowers. This study aims to explore an alternative approach for selective blossom thinning by applying laser radiation for controlling the number of flowers. 150 flower clusters on branches of apple cv.’Hilieri’ at three different flower development stages; mouse ear (BBCH 54), pink bud (BBCH 57) and balloon stage (BBCH 59) were examined by laser application in thelaser laboratory at institute of agricultural engineering, University of Bonn.The flowers in each stage of flower development were evaluated on twopositions of the laser spot a) from front of flower cluster and b) from side offlower cluster. A 4-Watt blue diode laser with 450 nm wavelength was appliedfor the laboratory laser blossom thinner. A microcontroller, which wasadjusted by a computer, was applied to control a TTL laser driver. Thehorizontal distance between flower and laser was limited in the range of 15 cm,which provided a constant laser spot area of 3.92 mm2. The damage assessmentof flowers was performed after laser treatment every alternate day, untilnatural damage appeared in the control group. The result demonstrates thatthe laser radiation is a potential alternative technique for blossom thinning.Emitting of the laser beam at the position of laser spot on the front of flowercluster had a greater efficacy than from side of flower cluster. Application oflow power laser radiation with the 4-Watt diode laser and 1000 ms exposuretime (1.02 J mm-2 power density) successfully reduced the number of flowers.The greatest thinning efficacy of 52% was estimated with the laser position from front of flower. The early stages of flower development at mouse ear and pink
48. ACTUALTASKS ONAGRICULTURAL ENGINEERING
Original scientific paper

P. Netsawang, L. Damerow, P. Schulze Lammers
142
bud were not suitable for applying the laser radiation for blossom thinning, because of low thinning efficacy.
Key words: Laser, Blossom thinning, Apple, Crop load management
INTRODUCTION
Crop load management (CLM) is an important method to improve the fruit quality in fruit production (Seehuber et al., 2011). Thinning of flowers is a common CLM method to control the number of fruit, which has a positive effect on the fruit size (Meland and Kaiser, 2011). In addition, an early reduction of blossoms by thinning overcomes alternate bearing in pome and stone fruit (Hehnen et al., 2012). Apple trees have generally an abundance of 250-300 flowers per tree, but not all of flowers are supplied to become a fruit for a sufficient harvest (Costa et al., 2013). Untiedt and Blanke (2001) informed that only 7% of flowers are necessary in apple trees to achieve sufficient yield with high fruit quality.
The number of unwanted flowers is generally moderated by three main techniques. Firstly, the flower buds are removed by hand at the flowering (Breen et al., 2015; Tustin et al., 2012). This technique requires extensive manpower. Secondly, the chemical agents are applied to remove excess flowers such as Ammoniumthiosulfate (ATS) and Ethephon (Maas, 2016; Hampson and Bedford, 2011; Wertheim, 2000). Chemical blossom thinning has been found to improve fruit quality, but its efficiency is unpredictable and dependent upon weather conditions and cultivar (Forshey, 1976; Williams, 1979; Wertheim, 2000). Thirdly, the flowers can be removed mechanically by thinners, which is regarded as environmentally friendly method (Seehuber et al., 2011). Several machines were innovated to be used for blossom thinning in the bio-orchards and with save labor conditions (Damerow et al., 2007; Cline, 2017; Solomakhin and Blanke, 2010; McClure and Cline, 2015; Kon et al., 2013; Lopes et al., 2019). However, disadvantages of mechanical thinning have been reported in many studies. Kong et al. (2009) reported that there was a damage of branches and flower buds after applying mechanical thinning. In some cases, the mechanical thinning need additional chemical and/or hand thinning to improve the efficacy of thinning (Seehuber et al., 2014; Basak et al., 2016). Therefore, the advancing of flower removal is necessary to achieve higher efficiency of blossom thinning.
Laser radiation is applied disaggregating materials not in industry but also in agricultural and horticultural sector. Marx et al. (2013) investigated lasers for marking of plants and fruits. Their results indicate that using suitable lasers marking energy succeeds to reduce damaging of horticultural product surfaces, and correspondingly the risk of fungal infection. Laser beam affects a water loss in the tissue of products without toxic effects (Sood et al., 2008; Sood et al., 2009). In addition, laser application is the alternative method in weed control in arable farming successfully reducing the use of chemicals (Mathiassen et al., 2006; Marx et al., 2012; Bauer et al., 2020).
To further improve the blossom thinning in apple as one of most important fruit crop in Germany, this study aims to explore an alternative approach for selective blossom thinning by applying laser radiation to flower clusters and study the efficiency in different vegetation phases.

Use of laser radiation as an alternative technique for selective blossom thinning in apple
143
MATERIAL AND METHODS
Laser set up and energy measurement A 4 W, 450 nm blue diode laser was applied for a prototype of laser blossom thinner. The
laser system was installed on the aluminum frame (Fig. 1). A distance between flower cluster and laser device of 15 cm was used as focal length with the constant laser spot area of 3.92 mm2. The targeting was done by hand using a cross red laser with low power. The diode laser was operated in continuous mode emitting a laser beam with Gaussian profile to transfer energy horizontally toward the flower cluster. An Arduino Uno microcontroller board was connected with a TTL laser driver by an interface. Exposure time was adjusted by programming on the computer.
Figure 1 The laboratory laser application for blossom thinning
The optical power of laser was measured by a laser power meter (PM100A, Thorlabs GmbH., Dachau, Germany) with a thermal power sensor (S425C-L, Thorlabs GmbH., Dachau, Germany). The beam profile was measured by a beam diagnostic (LaserCam-HR II, Coherent Inc., USA) with a beam view software (Coherent Inc., USA) to determine the laser spot area on the targeted flower tissue. The laser energy and density were determined based on laser power, spot area and exposure time (Mathiassen et al., 2006).
E = P x T (1) and I = E
A (2)
Where E is the laser energy in J, P is the laser power in W, T is the exposure time in second, I is the laser energy density in J mm-2 and A is the laser spot area in mm2.
Computer Microcontroller Laser stand Apple branch stand
Laser protector
Video camera
Laser device with TTL laser driver
15 cm
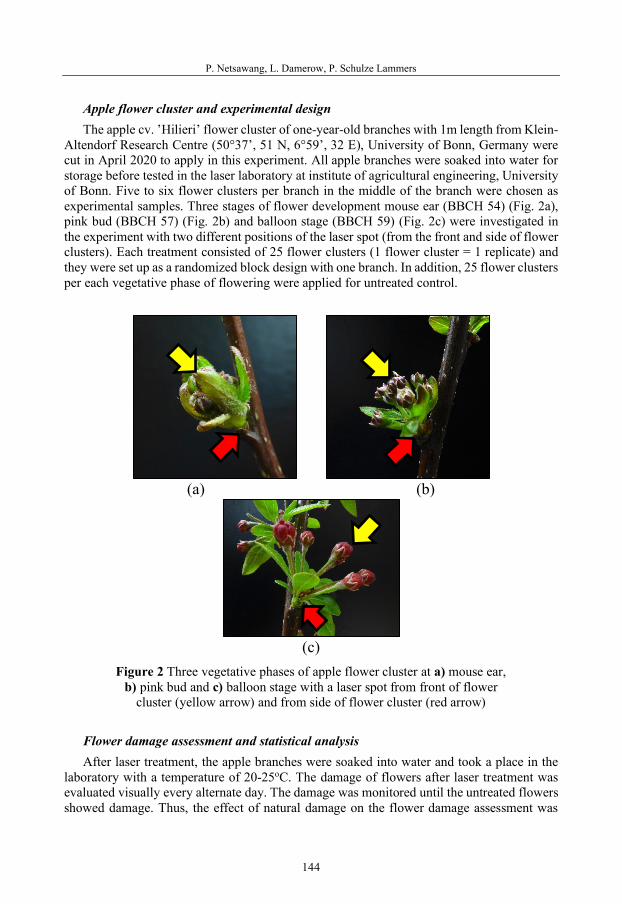
P. Netsawang, L. Damerow, P. Schulze Lammers
144
Apple flower cluster and experimental design The apple cv. ’Hilieri’ flower cluster of one-year-old branches with 1m length from Klein-
Altendorf Research Centre (50°37’, 51 N, 6°59’, 32 E), University of Bonn, Germany were cut in April 2020 to apply in this experiment. All apple branches were soaked into water for storage before tested in the laser laboratory at institute of agricultural engineering, University of Bonn. Five to six flower clusters per branch in the middle of the branch were chosen as experimental samples. Three stages of flower development mouse ear (BBCH 54) (Fig. 2a), pink bud (BBCH 57) (Fig. 2b) and balloon stage (BBCH 59) (Fig. 2c) were investigated in the experiment with two different positions of the laser spot (from the front and side of flower clusters). Each treatment consisted of 25 flower clusters (1 flower cluster = 1 replicate) and they were set up as a randomized block design with one branch. In addition, 25 flower clusters per each vegetative phase of flowering were applied for untreated control.
(a) (b)
(c)
Figure 2 Three vegetative phases of apple flower cluster at a) mouse ear, b) pink bud and c) balloon stage with a laser spot from front of flower
cluster (yellow arrow) and from side of flower cluster (red arrow)
Flower damage assessment and statistical analysis After laser treatment, the apple branches were soaked into water and took a place in the
laboratory with a temperature of 20-25oC. The damage of flowers after laser treatment was evaluated visually every alternate day. The damage was monitored until the untreated flowers showed damage. Thus, the effect of natural damage on the flower damage assessment was

Use of laser radiation as an alternative technique for selective blossom thinning in apple
145
prevented. The duration of the assessment in this experiment was different, depending upon the vegetative phase of flowering with nine days on mouse ear, seven days on pink bud and five days on balloon stage.
The position of damage was focused on stigma, style, and ovary to identify the damaged flowers. Flowers are divided into two categories depending on the position of damage on the flower. The damage of flower at the stigma, style, and ovary was classified as damaged flowers, while the damage at other part of the flower such as petal was recorded as undamaged flowers. The number of damaged flowers was statistically evaluated using SPSS version 20 (SPSS Co., USA). The LSD test determined the difference between group means at the 95% confidence level.
RESULTS AND DISCUSSION
In our experiment the laser beam had the optical power of 4 W and the laser energy at the exposure time of 1000 ms of 4 J (equation 1). The laser beam profile showed that the laser spot had an ellipse shape with a major diameter of 2.53 mm and a minor diameter of 1.98 mm at the focal length of 15 cm. Thus, the energy density of laser that was emitted to the flower in this experiment had the energy density of 1.02 J mm-2 (equation 2). This laser setting was chosen because of representing easy application in unprotected areas (orchards). The exposure time fits to a fast thinning process as it is expected when used in robots.
The thinning efficiency as the percentage of damaged flowers and flower clusters is presented in Figures 3, 4 and 5. The results show that laser radiation is a potential alternative technique for blossom thinning. Targeting the laser spot from front of a flower cluster damages a part of flower cluster at the stigma on an individual flower. There is no damage on the flower cluster when emitting of the laser at the position of the laser spot from side of the flower cluster.
Figure 3 The percentage of damaged flower and flower cluster on different laser spot
position at mouse ear (black colour: position of laser spot from front of flower cluster; grey colour: position of laser spot from side of flower cluster)
0
20
40
60
80
100
Perc
enta
ge o
f flo
wer
and
flo
wer
clu
ster
(%)
Time of flower damage assessment (day after application)
Damaged flower Undamaged flowerDamaged flower cluster Undamaged flower cluster

P. Netsawang, L. Damerow, P. Schulze Lammers
146
Figure 4 The percentage of damaged flower and flower cluster on different laser spot
position at pink bud (colour coding as for Fig. 3)
Figure 5 The percentage of damaged flower and flower cluster on different laser spot
position at balloon stage (colour coding as for Fig. 3)
The results of flower damage assessment indicate that the vegetative phase of the flower affects the thinning efficacy. The highest percentage of damaged flower occurred at the last day of damage assessment in all vegetative phases (mouse ear 4%, day nine, Fig. 3; pink bud 12%, day seven, Fig. 4; balloon stage 52%, day five, Fig. 5). Applying of laser at balloon stage induced a significant stronger flower damage than did at mouse ear and pink bud
0102030405060708090
100
Perc
enta
ge o
f flo
wer
and
flo
wer
clu
ster
(%)
Time of flower damage assessment (day after application)
Damaged flower Undamaged flowerDamaged flower cluster Undamaged flower cluster
0102030405060708090
100
Perc
enta
ge o
f flo
wer
and
flo
wer
clu
ster
(%)
Time of flower damage assessment (day after application)
Damaged flower Undamaged flowerDamaged flower cluster Undamaged flower cluster

Use of laser radiation as an alternative technique for selective blossom thinning in apple
147
(Fig. 6). In addition, there was no statistically significant difference in the thinning efficacy between mouse ear and pink bud.
These results show that applying a low power laser with a 4 W diode laser and 1000 ms exposure time (power density of 1.02 J mm-2) successfully reduces the number of flower by emitting of laser spot from front of flower cluster at balloon stage.
Figure 6 The percentage of damaged flower on different vegetative phase of flower
at the last day of damage assessment (a,b significant difference according LSD with 95% confidence level)
CONCLUSIONS
Laser radiation can be performed as an alternative technique for blossom thinning. The application of low power diode laser with 4 W and 450 nm succeeded to reduce the number of flowers by emitting of laser with 1000 ms exposure time and 1.02 J mm-2 on the spot position from front of flower cluster at balloon stage. In addition, applying laser radiation for blossom thinning at the balloon stage provided a greater thinning efficacy than at early of flowering phases mouse ear and pink bud. There was no damage effect on the flower on the emitting of the laser at the position of the laser spot from the side to flower clusters.
ACKNOWLEDGEMENTS
We are grateful to Thai government and Rajamangala University of Technology Lanna for the research grant, Mr. Achim Kunz for providing the experimental material from an orchard at Campus Klein-Altendorf and the technical staffs at Institute of agricultural engineering, University of Bonn for technical support in the laser laboratory.
4%a12%a
52%b
0
20
40
60
80
100
Mouse ear Pink bud Balloon
Perc
enta
ge o
f dam
aged
flo
wer
(%
)
Vegetative phase of flower
P. Netsawang, L. Damerow, P. Schulze Lammers
148
REFERENCES
Basak, A., Juraś, I., Białkowski, P., Blanke, M.M., Damerow, L. (2016). Efficacy of mechanical thinning of apple in Poland. Acta Horticulturae 1138, 75–82.
Bauer, M.V., Marx, C., Bauer, F.V., Flury, D.M., Ripken, T., Streit, B. (2020). Thermal weed control technologies for conservation agriculture-a review. Weed Research 60 (4), 241–250.
Breen, K.C., Tustin, D.S., Palmer, J.W., Close, D.C. (2015). Method of manipulating floral bud density affects fruit set responses in apple. Scientia Horticulturae 197, 244–253.
Cline, J.A. (2017). Thinning of peach trees using high-pressure water. Journal of the American Pomological Society 71 (4), 203–213.
Costa, G., Blanke, M.M., Widmer, A. (2013). Principles of Thinning in Fruit Tree Crops – Needs and Novelties. Acta Horticulturae 998, 17–26.
Damerow, L., Kunz, A., Blanke, M. (2007). Mechanische Fruchtbehangsregulierung (Regulation of fruit set by mechanical flower thinning). Erwerbs-Obstbau 49 (1), 1–9.
Forshey, C.G. (1976). Factors affecting chemical thinning of apples. New York Food and Life Sciences Bulletin 64, 68–73.
Hampson, C., Bedford, K. (2011). Efficacy of blossom thinning treatments to reduce fruit set and increase fruit size of Ambrosia and Aurora Golden Gala™ apples. Can. J. Plant Sci. 91 (6), 983–990.
Hehnen, D., Hanrahan, I., Lewis, K., McFerson, J., Blanke, M. (2012). Mechanical flower thinning improves fruit quality of apples and promotes consistent bearing. Scientia Horticulturae 134, 241–244.
Kon, T.M., Schupp, J.R., Winzeler, H.E., Marini, R.P. (2013). Influence of mechanical string thinning treatments on vegetative and reproductive tissues, fruit set, yield, and fruit quality of ‘Gala’ apple. HortScience 48 (1), 40–46.
Kong, T., Damerow, L., Blanke, M. (2009). Einfluss selektiver mechanischer Fruchtbehangsregulierung auf Ethylensynthese als Stressindikator sowie Ertrag und Fruchtqualität bei Kernobst. Erwerbs-Obstbau 51 (2), 39–53.
Lopes, M., Gasper, P.D., Simões, M.P. (2019). Current Status and Future Trends of Mechanized Fruit Thinning Devices and Sensor Technology. International Journal of Mechanical and Mechatronics Engineering 13 (1), 43–57.
Maas, F.M. (2016). Control of fruit set in apple by ATS requires accurate timing of ATS application. Acta Horticulturae 1138, 45–52.
Marx, C., Barcikowski, S., Hustedt, M., Haferkamp, H., Rath, T. (2012). Design and application of a weed damage model for laser-based weed control. Biosystems Engineering 113 (2), 148–157.
Marx, C., Hustedt, M., Hoja, H., Winkelmann, T., Rath, T. (2013). Investigations on laser marking of plants and fruits. Biosystems Engineering 116 (4), 436–446.
Mathiassen, S.K., Bak, T., Christensen, S., Kudsk, P. (2006). The effect of laser treatment as a weed control method. Biosystems Engineering 95 (4), 497–505.
McClure, K.A., Cline, J.A. (2015). Mechanical blossom thinning of apples and influence on yield, fruit quality and spur leaf area. Can. J. Plant Sci. 95 (5), 887–896.
Meland, M., Kaiser, C. (2011). Ethephon as a blossom and fruitlet thinner affects crop load, fruit weight, fruit quality, and return bloom of ‘Summerred’ Apple (Malus domestica) Borkh. HortScience 46 (3), 432–438.
Seehuber, C., Damerow, L., Blanke, M. (2011). Regulation of source: sink relationship, fruit set, fruit growth and fruit quality in European plum (Prunus domestica L.)-using thinning for crop load management. Plant Growth Regul 65 (2), 335–341.

Use of laser radiation as an alternative technique for selective blossom thinning in apple
149
Seehuber, C., Damerow, L., Kunz, A., Blanke, M. (2014). Mechanische Fruchtbehangsregulierung bei Apfel verbessert Fruchtgröße, Fruchtfestigkeit, Fruchtausfärbung und die Source: Sink-Verhältnisse mit mehr Einzelfruchtständen (Singlets) bei ‘Gala’. Erwerbs-Obstbau 56 (2), 49–58.
Solomakhin, A., Blanke, M. (2010). Mechanical flower thinning improves the fruit quality of apples. Journal of the science of food and agriculture 90 (5), 735–741.
Sood, P., Ference, C., Narciso, J., Etxeberria, E. (2008). Effects of laser labeling on the quality of tangerines during storage. In Proceedings of Florida state horticultural society 121, 297–300.
Sood, P., Ference, C., Narciso, J., Etxeberria, E. (2009). Laser Etching: A Novel Technology to Label Florida Grapefruit. HortTechnology 19 (3), 504–510.
Tustin, D.S., Dayatilake, G.A., Breen, K.C., Oliver, M.J. (2012). Fruit set responses to changes in floral bud load-a new concept for crop load regulation. Acta Horticulturae 932, 195–202.
Untiedt, R., Blanke, M. (2001). Effects of fruit thinning agents on apple tree canopy photosynthesis and dark respiration. Plant Growth Regulation 35, 1–9.
Wertheim, S.J. (2000). Developments in the chemical thinning of apple and pear. Plant Growth Regulation 31, 85–100.
Williams, M.W. (1979). Chemical thinning of apples. Horticultural reviews 1, 270–300.


48th Symposium "Actual Tasks on Agricultural Engineering", Zagreb, Croatia, 2021
151
DIGITAL EVALUATION OF THE GREEN LEAF WALL AREA OF THE VINE IN THE "YELLOW MUSCAT"
VARIETY Peter BERK1*, Andreja URBANEK KRAJNC1, Denis STAJNKO1, Peter VINDIŠ1,
Damijan KELC1, Miran LAKOTA1, Aleš BELŠAK2, Tomaž POJE3, Matej SEČNIK4
*E-mail of corresponding author: [email protected] 1Department of Biosystems engineering, University of Maribor, Faculty of Agriculture and Life
Sciences, Pivola 10, 2311 Hoče, Slovenia 2Department of Mechanical Engineering Design, University of Maribor, Faculty of Mechanical
Engineering, Smetanova 17, 2000 Maribor, Slovenia 3Agricultural Institute of Slovenia, Department of Agricultural Engineering and Energy,
Hacquetova 17, 1000 Ljubljana, Slovenia 4Department of Energy Engineering, University of Ljubljana, Faculty of Mechanical Engineering,
Aškerčeva 6, 1000 Ljubljana, Slovenia
ABSTRACT
Dosage rate reduction of plant protection products, mixed with water (spray mixture) in a prescribed concentration in vineyards will be possible in the future, only by taking into account the natural properties of vine canopies (green leaf wall area). In a practical experiment in a vineyard, we evaluated the green leaf wall area grape variety (''Yellow Muscat'') on different segments on the left and right row of the vine canopy. We compared the results of manual measurements and laser measuring technology (LIDAR) with the corresponding algorithm, with which we enabled the digital reconstruction of the green leaf wall area of the vine. Using the regression method, we estimated the relationship between the dependent variable (digital number of points in the cloud) and an independent variable (green leaf wall area, manually measured). An analysis of four randomly selected vines in the vineyard showed that the maximum value of the correlation coefficient is r = 0.78 for the left row and r = 0.79 for the right row of the green leaf wall area of the vine.
Keywords: algorithm, plant protection product, control, green wall leaf area, measurement
INTRODUCTION
For good quality and yield of the crop (grapes) in the vineyard, it is necessary to ensure adequate protection of the crop against various diseases, pests and weeds. Crop protection can
48. ACTUAL TASKS ON AGRICULTURAL ENGINEERING
Original scientific paper
P. Berk, A. Urbanek Krajnc, D. Stajnko, P. Vindiš, D. Kelc, M. Lakota, A. Belšak, T. Poje, M. Sečnik
152
be carried out in several different ways, the most important of which is chemical protection with plant protection products (hereinafter PPP). In protecting the crop with various liquid chemicals, we try to destroy harmful organisms and prevent infections, with part of the amount of PPP remaining on the crop and part of the amount of PPP finding its way to the surrounding area. Residues of PPPs can lead to contamination of soil, groundwater, air, plants and animals, which is a major problem in modern agriculture in viticulture. The problem that arose cannot be solved overnight, by returning to the old way of growing or organic production, without the use of PPPs. Therefore, for stable and sustainable grape production, it is necessary to ensure the reduction of harmful effects on the environment in which we live. The modern method of production in viticulture will thus be the only alternative in the future where we will have to take into account environmental aspects. Therefore, we will have to apply smaller quantities of PPPs that are dangerous to the environment, given the fact that we will have to maintain the same quality of grape protection in the vineyard. We will be able to ensure this in the future by taking into account the characteristic properties of the vine (volume, leaf area, height, phenological phase, age, grape canopy variety), which can be evaluated in real time through powerful sensor modular measuring systems.
The development and expansion of digitalization on the agricultural holding in the organization of grape production in viticulture requires the development of new viticultural practices relating to the precise process of measuring the various developmental stages of the vine leaf wall area in vineyards. To reduce the consumption of doses of plant protection products (PPPs mixed with water in vineyards requires accurate knowledge of the characteristic properties of the vine canopy, which is the most important factor in improving the application of PPPs). The most important factor is the leaf wall area (hereinafter LWA) of the vine, which in practice, in addition to reducing the dose of PPP, is a key factor in achieving optimal quality of grapes and consequently wines (Klodt et al., 2015). The LWA can be measured manually, but this measuring process is a destructive, time-consuming and expensive procedure in which all leaves must be plucked from an individual vine crown by hand, where the resulting phenotypic data (characteristic properties) are the subjective assessment of the personnel in charge. Canopy properties can be described by OIV descriptors (OIV, 2018) or the BBCH scale (Lorenz et al., 1995). OIV descriptor 351 (OIV, 2018) is used to classify vine density into five categories (1 = very weak; 3 = weak; 5 = medium; 7 = strong; 9 = very strong). Precise characterization of grapevine growth from a large number of cultivars (viticulture) or breeding material (grapevine breeding) requires simple, fast and sensor-based modular systems which are applicable from a moving fruit-growing vineyard tractor for highthroughput data acquisition (Herzog et al., 2014). As the evaluation of the natural properties of the vine canopy is a very complex task, in the past individual research groups started planning indirect and non-invasive measurement systems. Systems have been studied to characterize grapevine foliage directly in vineyards (Mabrouk and Sinoquet, 1998; Diago et al., 2012; Arnó et al., 2013). Most of the studies are based on sensor techniques, e.g. electromagnetic scanners (Berk et al., 2016), ultrasonic sensors (Stajnko et al., 2012), laser scanners (Berk et al., 2020), infrared sensors (Bates et al., 2011), fish-eye optical sensors (Bates et al., 2011; Johnson and Pierce, 2004) or model based strategies (Louarn et al., 2008).
Ultrasonic measuring systems operate by means of ultrasonic measuring sensors consisting of a component for receiving and transmitting a component for transmitting an ultrasonic signal to the surrounding area. With their help, non-contact distance measurement is enabled, in a similar way as with radars, so that we can evaluate the properties of objects

Digital evaluation of the green leaf wall area of the vine in the "Yellow Muscat" variety
153
(tree canopy), (Stajnko et al., 2012; Molto et al., 2001; Berk et al., 2016). It should be emphasized that ultrasonic measuring systems are used to detect the vine canopy, but they can also be used to measure the depth of the canopy and through this parameter, e.g. canopy volume size.
The stereoscopic measuring system works on the basis of photographs taken from the air(aerial photogrammetry). These are designed to produce the exact position of points on the Earth's surface, where image coordinates determine the locations of the object's points (tree canopy) and can be imaged, (Shimborsky, 2003). There are several different optical measuring systems that operate on the principle of optical measuring sensors and can very accurately reconstruct the properties of the tree canopy. The amount of LWA on an individual tree canopy in an orchard can be determined on the basis of photosynthetically active radiation (PAR - photosynthetically active radiation), which acts on the basis of the occurrence of the process of photosynthesis on the LWA of the tree canopy. During the photosynthesis process, the leaves on the tree canopy absorb energy in the range of the electromagnetic spectrum of the 400–700 nm wave. Photosynthetic radiation can be measured using a quantum sensor, which is a meter with a suitable combination of photocells and filters. Image analysis provides a promising technique for noninvasive plant phenotyping (Fiorani and Schurr, 2013). RGB cameras are a practical sensor for usage in the field because they are portable, provide fast data aquisition and are suitable for outdoor illuminations. However, only a few studies exist on automated approaches for monitoring grapevine growth habits directly in vineyards using low-cost consumer cameras (Roscher et al., 2014).
Laser measuring technology, which works on the principle of the LIDAR method for measuring the distance from the target based on laser beams, offers solutions for a wide range of applications in geodesy, geomatics, archeology, geography, geology, geomorphology, seismology, forestry and agriculture. Based on laser measuring systems, we capture data on two-dimensional and three-dimensional geometric shapes of objects. For experiments in an orchard, vineyard or laboratory, the measurement data are processed in real time, which is a great advantage of the measurement system, (Sanz et al., 2011). The laser measuring sensor uses the pulse or phase time method, with the pulse time method being the most commonly used in precision agriculture. The pulse time method works by measuring the time interval between the emitted laser beam (pulse) and the beam detected by the sensor on the receiving unit, determines the distance between the sensor and the detected object. The use of a laser measuring system with associated algorithms enables the reconstruction of three-dimensional properties of vine LWA in an vineayard (evaluation of LWA and natural tree canopy shapes) and is more efficient than other measurement systems.
Research work presents a novel approach measurement system (own develop) for non-invasive, fast and objective LWA evaluation on diferent vine canopy segments. The modular system is based on precise digital vine reconstruction, point cloud classification and canopy reconstruction from point clouds, marked with a different color. The main contributions of this research work are the following:
- In the research work we describe the precise measuring system LIDAR, which defined the LWA on individual segments of the vine canopy in the vineyard and is part of an automated modular measuring system for digiral reconstruction of the vine.
- Measurement data on the distance and sector of view between the laser sensor and the vine in the vineyard were recorded in an Excel file and used them for digital reconstruction of the vine LWA. Digital reconstruction of the LWA (algorithm for

P. Berk, A. Urbanek Krajnc, D. Stajnko, P. Vindiš, D. Kelc, M. Lakota, A. Belšak, T. Poje, M. Sečnik
154
displaying the digital number of hits of reflected laser beams on individual segments of the vine canopy) we performed on the basis of a stand-alone algorithm developed in the Matlab R2015a software package.
- The manual principle of the LIDAR measuring system, with which we estimated the actual size of the LWA on individual segments of the vine, was then compared in the last step with the results of the digital measuring system.
MATERIAL AND METHODS
The research work included two main parts. In the first part, we used automated laser LIDAR measuring technology, digitaly using laser beams to capture the green LWA on the vine canopy (Figure 1). In the second part, we manually plucked the leaves from individual vine canopies in the vineyard, determined their mass and area, and compared the latter with the number of reflected laser beams.
Vineyard For experimental purposes, we used the vineyard of the agricultural farm Dora Petrič, Slap
53a, 5271 Vipava, Slovenia. The size of the vineyard area was 9000 m2, the location of the experiment was 45°50'17.4" N, 13°55'33.9" E. In an intensive vineyard plantation, grafted SO4-based vine seedlings are planted, which behave well in various soils, including limestone, and affect the early and good maturity of the wood, with the varieties fertilizing well, which affects the aromatic profile and high sugar level of the grapes. The inter-row distance between seedlings is 230 cm and the upbringing form is single-spawning (spar with up to ten eyes) with a plug (one to two eyes on the plug), where the height of the vine stem is 70 cm and the average distance between the vines is 92 cm. In the experiment in the vineyard for the evaluation of the LWA, we included the grape variety "Yellow Muscat" (age 7 years), wherein the phenological phase of growth was BBCH91 (Lorenz et al., 1995).
Digital evaluation of LWA in a vineyard The modular electronic measuring system for digital evaluation of the LWA in the
vineyard consists of three main components. The first component consists of laser (LIDAR) measuring technology. With LIDAR measuring technology, which is mounted on a special bracket on the tractor, we digitally determine the amount of LWA of the vine on an individual segment. In the research work, we used a laser sensor manufactured by SICK, model LMS111 (Figure 1). The SICK LMS111 laser rangefinder offers the IP67 protection standard, which means that it is also suitable for outdoor use in the vineyard. The Lidar LMS11 offers a great compromise between compact size and performance. It enables data capture with a frequency of 50 Hz and an angular resolution of 0.5 °. Its range is up to 20 m. Data transfer takes place in real time via an Ethernet interface with a nominal speed of 100 Mbit/s.
Another component built into the modular system is a microcontroller with an added Ethernet module, which takes care of the transfer of measurements from LIDAR measuring technology. We used a Teensy 3.6 microcontroller. The Teensy 3.6 microcontroller has a built-in 32-bit 180 MHz ARM Cortex-M4 processor, which offers enough processing power to process data from LIDAR measurement technology. The third component is the DGPS measuring system, which allows us to determine the driving speed and location of the modular measuring system to a few centimeters accurately. The location and speed of the modular system can be determined with a frequency of 10 Hz. We used the latest DGPS system from

Digital evaluation of the green leaf wall area of the vine in the "Yellow Muscat" variety
155
UBLOX, the F9P receiver model. The system enables two-frequency reception of GPS signal with RTK correction. The system consists of two parts. In the field near the vineyard, we install the DGPS reference station, which takes care of the correction of the pseudo distances of the GPS receiver. The correction data is transmitted to the mobile station (mounted on the tractor) via a real-time data connection, demodulated and then used to correct the GPS data. Using a user interface developed via the Teensy 3.6 microcontroller, we captured laser measurements in real time and saved them to a txt file.
For the digital reconstruction of the vine LWA (covering the left and right rows in the vineyard), the size of the LWA was measured separately, automatically with a modular measuring system mounted on a Fendt 211 V tractor. When moving the tractor between two rows in the vineyard, we measured the real-time polar coordinates (distance, angle) from the center of the row to the left and right sides of the vine canopy wall using reflected laser beams. The data were recorded in real time on the hard disk of the modular measuring system. On the principle of automatic capture of measurements with the help of LIDAR technology, a precise digital evaluation of the LWA of the vine was enabled, which we placed in a virtual digital space. The processing of laser measurement data was performed using an algorithm written in the Matlab R2015a software tool. Digital reconstruction of the LWA (covered left and right row of vines) was presented via a graphical user interface in the form of a digital number of points in the cloud (Figure 3 a, b). From the point cloud, we determined the number of points, individually for four individual segments, namely for the left and right row of the vine canopy. The individual values of the number of points in the cloud were then compared with the actual LWA, which was defined on the basis of manual measurements for each individual segment separately. For the analysis of the LWA, four vines were randomly selected in the vineyard (2 vines in the left row and 2 vines in the right row). For each individual segment of the vine LWA, we determined the number of points in the cloud and compared it with the manually measured LWA on the individual vine canopy segments. The Excel software (CORREL function) was used for analysis by the linear regression method.
Figure 1 Principle of digital reconstruction of the vine LWA with the help of an automated
modular measuring system. After performing digital measurements of the LWA of the vine, we started performing
manual measurements of the LWA on the individual segment of the vine crown in the vineyard. Manual measurements of leaf area were performed by manually plucking each leaf from each individual segment of the vine crown wall and storing each leaf in a plastic bag

P. Berk, A. Urbanek Krajnc, D. Stajnko, P. Vindiš, D. Kelc, M. Lakota, A. Belšak, T. Poje, M. Sečnik
156
(Figure 2 a). We picked the leaves individually on a randomly selected vine, for the left and right rows in the vineyard. Each segment from which the leaves were plucked was defined separately, with the height of tearing the leaves for segment 1 (marked in yellow) ranging from 50 cm to 100 cm, segment 2 (marked in blue) from 100 cm to 150 cm, segment 3 (marked in red) from 150 cm to 200 cm and segment 4 (marked in turquoise) from 200 cm to 250 cm (Figure 1). The width of the leaf picking area on an individual vine segment was determined according to the distance between the vines in the vineyard and averages 92 cm. The LWA of an individual leaf on an individual vine segment was later evaluated in laboratory conditions using a modular automated imaging system. The modular automated imaging system consisted of the following components: laptop (Lenovo legion y540-17 i5-9300h), photocopier (Konica Minolta bizhub C364e) and software (Easy Leaf Area, Figure 2 b).
a) b)
Figure 2 Manual leaf wall area measurement: a) storing each leaf in a plastic bag b) leaf wall area evaluating using modular automated imaging system.
The aim of this research work was to evaluate the reliability of the values of the vineyards
LWA obtained with laser measurement technology (LIDAR) with the corresponding algorithm in order to develop a specific measurement protocol for grapevines. The performance of the laser measuring technique (LIDAR) was evaluated by means of destructive measurements, which enabled us to digitally reconstruct the LWA of the vine. The LWA estimates from destructive sampling followed the approach proposed by (Berk, 2018). The destructive LWA measurements were collected immediately after the completion of the indirect estimates by removing all leaves at the petiole from four different segment for each sample vine. The analysis of the total LWA per segment was carried out using the ''Easy leaf area'' programme. Four for each vine (N=4) within both measures the fresh leaf weight (W) of each section was determined and referred to the LWA and weight of the scanned segment.
RESULTS
Figures 3 a, b shows a digital reconstruction of the vine LWA for the left row of two randomly selected vines in an experiment in a vineyard, a similar digital reconstruction was made for the right row of two randomly selected vines.

Digital evaluation of the green leaf wall area of the vine in the "Yellow Muscat" variety
157
a)
b)
Figure 3 Digital reconstruction of the vine LWA, namely for the left row, two randomly selected vines in an experiment in the vineyard a) the first selected vine and b) the second
selected vine.
Figure 4 Correlation between the number of points in the cloud and the LWA on all four
segments of the left (a) and right (b) row of the four covered vines. In the research work, we found that the value of the correlation coefficient (Figure 4) for
the left row of two captured vines r = 0.78 and for the right row of two covered vines in the vineyard r = 0.79. From the values of the correlation coefficients, we can conclude that in our
a) b)

P. Berk, A. Urbanek Krajnc, D. Stajnko, P. Vindiš, D. Kelc, M. Lakota, A. Belšak, T. Poje, M. Sečnik
158
case there is a positive high correlation between the two variables. From the measurement results we can conclude that the automated measuring technology LIDAR is comparable or even better than the solutions of other researchers. Namely in the research work (Llorens et al., 2011), measured the maximum value of the correlation coefficient r = 0.409 with respect to the ratio between the number of reflected laser beams and the LWA.
CONCLUSIONS
In the research work were reconstructed the digital reconstruction of the LWA vine canopy in the digital virtual space of the Matlab R2015a program, in which we created a graphical user interface. With the digital reconstruction of the vine, we enabled the analysis of the natural properties of the canopy, which is proven by the positive high correlation between the digital number of point clouds on four individual segments of the canopy and the actually measured LWA. In the case of the left row of two captured vines in the vineyard, the value of the correlation coefficient r = 0.78 was estimated, and in the case of the right row of two covered vines r = 0.79.
Without a doubt, optical measuring systems that include a laser measuring sensor to electronically identify the vine canopy provide the most accurate and detailed information on the structure of the natural shape of the vine canopy in the vineyard. With the appropriate algorithm, we can control the operation of the optical measuring system and create a virtual environment at low cost of installing the measuring system on a tractor. For all the above reasons, optical measuring systems should be installed on tractor prototypes for commercial purposes; they operate on the principle of laser measuring technology, which in the near future will provide more even control of spray mixture over the entire structure of the LWA in the vineyard on the basis of autonomous decision-making models. Benchmarking will be a powerful tool for controlling dosage spray mixture in vineyards in the near future. Information in the form of the estimated size of the LWA on the individual segment of the vine canopy in the vineyard will be included in an autonomous decision-making model with which we will be able to control the spray mixture dosage in the range from 0 % to 100 %.
ACKNOWLEDGEMENTS
The authors acknowledge the Ministry of Agriculture, Forestry and Food for granting the EIP project No. 33117-3002/2018, Chamber of Agriculture and Forestry of Slovenia - Agricultural and Forestry Institute Nova Gorica (Mojca Mavrič) for technical support in carrying out experiments and the Public Scholarship, Development, Disability and Maintenance Fund of the Republic of Slovenia for granting the PKP project No. 041103-4-FKBV3.
REFERENCES
Arnó, J., Escolà, A., Vallès, J., Llorens, J., Sanz, R., Masip, J. (2013). Leaf area index estimation in vineyards using a ground-based lidar scanner. Precision Agric., 14(3), 290-306.
Bates, T., Grochalsky, B., Nuske, S. (2011). Automating measurements of canopy and fruit to map crop load in commercial vineyards. Res Focus: Cornell Viticulture Enology, 4, 1-6.

Digital evaluation of the green leaf wall area of the vine in the "Yellow Muscat" variety
159
Berk, P., Stajnko, D., Belšak, A., Hočevar, M. (2020). Digital evaluation of leaf area of an individual tree canopy in the apple orchard using the LIDAR measurement system. Computers and electronics in agriculture, vol. 169, 1-12.
Berk, P. (2018). Defining plant protection product dose rate using a fuzzy decision-making model. Doctoral thesis. University of Maribor, Faculty of Mechanical Engineering, Slovenia.
Berk, P., Hočevar, M., Stajnko, D., Belšak, A. (2016). Development of alternative plant protection product application techniques in orchards, based on measurement sensing systems: A review. Computers and electronics in agriculture, vol. 124, 273-288.
Diago, M.P., Correa, C., Millán, B., Barreiro, P., Valero, C., Tardaguila, J. (2012). Grapevine yield and leaf area estimation using supervised classification methodology on rgb images taken under field conditions. Sensors, 12(12), 16988-17006.
Fiorani, F., Schurr, U. (2013). Future scenarios for plant phenotyping. Annu Rev Plant Biol., 64, 267-91.
Herzog, K., Roscher, R., Wieland, M., Kicherer, A., Läbe, T., Förstner, W. (2014). Initial steps for high-throughput phenotyping in vineyards. Vitis, 53(1), 1-8.
Johnson, L.F., Pierce, L.L. (2004). Indirect measurement of leaf area index in california north coast vineyards. HortScience, 39(2), 236-38.
Klodt, M., Herzog, K., Töpfer, R., Cremers, D. (2015). Field phenotyping of grapevine growth using dense stereo reconstruction. BMC Bioinformatics, 1-11.
Llorens, J., Gil, E., Llop, J., Escolà, A. (2011). Ultrasonic and LIDAR Sensors for Electronic Canopy Characterization in Vineyards: Advances to Improve Pesticide Application Methods. Sensors, 11(2), 2177-2194.
Lorenz, D.H., Eichhorn, K.W., Bleiholder, H., Klose, R., Meier, U., Weber, E. (1995). Growth stages of the grapevine: Phenological growth stages of the grapevine (vitis vinifera l. ssp. vinifera)-codes and descriptions according to the extended bbch scale. Aust J Grape Wine Res., 1(2), 100-3.
Louarn, G., Lecoeur, J., Lebon, E. (2008). A three-dimensional statistical reconstruction model of grapevine (vitis vinifera) simulating canopy structure variability within and between cultivar/training system pairs. Ann Bot., 101(8), 1167-84.
Mabrouk, H., Sinoquet, H. (1998). Indices of light microclimate and canopy structure of grapevines determined by 3d digitising and image analysis, and their relationship to grape quality. Aust J Grape Wine Res., 4(1), 2-13.
Molto, E., Martin, B., Gutierrez, A. (2001). ''Pesticide loss reduction by automatic adaptation of spraying on globular trees,'' Journal of Agric. Eng. Res., 78, 35-41.
OIV, (2018). http://www.oiv.int/en/technical-standards-and-documents/description-of-grape-varieties/ oiv-descriptor-list-for-grape-varieties-and-vitis-species-2nd-edition
Roscher, R., Herzog, K., Kunkel, A., Kicherer, A., Töpfer, R., Förstner, W. (2014). Automated image analysis framework for high-throughput determination of grapevine berry sizes using conditional random fields. Comput Electronics Agric., 100(0), 148-58.
Sanz, R., Llorens, J., Escolà, A., Arnó, J., Dasi, M., Vilalta, J., Camp, F., Aguilà, F.J., Solanelles, F., Planas, F.S., Pallejà, T., Palacín, J., López, J.E., Moral, I., Rosell, P. (2011). Innovative LIDAR 3D Dynamic Measurement System to Estimate Fruit-Tree Leaf Area. Sensors, 11, 5769-5791.
Shimborsky, E. (2003). ''Digital tree mapping and its applications,'' Precision Agriculture, 645-650. Stajnko, D., Berk, P., Lešnik, M., Jejčič, V., Lakota, M., Štrancar, A., Hočevar, M., Rakun, J. (2012).
Programmable ultrasonic sensing system for targeted spraying in orchards. Sensors,2012, 12(11), 15500-15519.

48th Symposium "Actual Tasks on Agricultural Engineering", Zagreb, Croatia, 2021
161
3D EVALUATION OF APPLE TREE CANOPIES BASED ON THE LIDAR SENSING SYSTEM
Denis STAJNKO*, Peter VINDIŠ, Damijan KELC, Miran LAKOTA, Jurij RAKUN, Peter BERK
*E-mail of corresponding author: [email protected] University of Maribor, Faculty of Agriculture and Life Sciences, Chair for Biosystems Engineering,
Pivola 10, 2311 Hoče, Slovenia,
ABSTRACT
In the future, the reduction of the plant protection product dosage (spray mixture) in a prescribed concentration will be possible only by precise sensing the natural characteristics of the tree canopy and 3D reconstruction. In practical experiment in the orchard, the tree crown of apple trees ('Golden Delicious' and ‘Gala’) were evaluated on different tree canopy segments. The results of LIDAR measurements and the application of our own algorithm were compared with manual measurements of the tree crown. By using regression analysis, the relationship between digitally detected point of clouds and the leaf areas showed the correlation coefficient r = 0.91 for the left half and r = 0.86 for the right half of the ‘Golden Delicious’ tree crown and r = 0.73 for the left half and r = 0.72 for the right half of the ‘Gala’ tree crown, respectively
Keywords: algorithm, plant protection product, controlling, tree canopy, measurement
INTRODUCTION
Nowadays, fruit growers are still using a range of empirical models for dose rate calculation in permanent crops such as TRV model and leaf surface wall model (Walklate, 2002). These models enable a fixed calculation of the quantities of water and plant protection products (hereinafter, PPP) in any orchard. Almost four decades ago, Byers et al. (1984) found these methods inappropriate to apply the same amount of PPP to small and large tree canopies in the orchard, without considering the total leaf area of the tree canopy. At any time individual tree canopy properties with different leaf area and volume sizes are neglected, the PPP application results in a reduction of the effectiveness of disease and pest control, as well as additional environmental pollution caused by air drift (Walklate and Cross, 2013). To avoid environmental and health concerns arising from chemical tree protection in orchards the
48. ACTUAL TASKS ON AGRICULTURAL ENGINEERING
Preliminary communication

D. Stajnko, P. Vindiš, D. Kelc, M. Lakota, J. Rakun, P. Berk
162
minimum essential PPP quantity must first be adopted according to measured and analysed canopy properties.
Defining the natural properties of tree canopies in the orchard is a very complex task. For that reason, from early 1980s individual research groups (Ladd and Reichard, 1980; Giles et al., 1989) began to use electronic measuring systems for the reconstruction of tree canopies. A selective and precise spray mixture application process was first enabled by using of ultrasonic measuring systems for advanced measurement and control system the spray mixture dose rate through the nozzles (Balsari and Tamagnone, 1998). Ultrasonic systems operate by means of ultrasonic measuring sensors consisting of a component for receiving and transmitting ultrasonic signal to the surrounding area. They enable non-contact distance measurement in a similar way to radar, so that we can evaluate the properties of the tree canopy (Berk et al., 2016).
Recently, optical measuring systems based on an infrared laser beam, which is reflected from the object back to the sensor receiver (LIDAR, Light detection and ranging), have become the most commonly used method for reconstruction of the tree canopy properties in orchards and vineyards. LIDAR measurements are non-destructive and operates on a fast-rotating mirror to allow scanning in a 2D plane, perpendicular to the mirror rotation axis. LIDAR provides data arranged in a cloud of points, immediately available for further visualization and analysis (Rosell et al., 2009a; Rosell et al., 2009b). Analysis may include measurement of the three-dimensional (3D) structure of tree canopy vegetation (geometry, size, height, cross-section, volume, density etc.). Thus, LIDAR provides the possibility for better PPP dose adjustment using variable rate nozzles or similar technology for on-the-go, canopy optimised spraying according to the orchard or vineyard requirements (Escolà et al., 2007).
The development and expansion of digitalization on the agricultural farm in the organization of production in fruit growing enables the development of new fruit - growing practices, which refer to the precise process of measuring the various developmental stages of leaf area in orchards. The main goal of our research was focused on presenting a novel approach for fast non-invasive and objective tree canopy evaluation on two different apple varieties ‘Gala’ and ‘Golden Delicious’ based on our innovative algorithm and LIDAR measurements. The modular system for precise 3D digital reconstruction of apple trees based on point cloud classification and canopy reconstruction, marked with a different colour.
MATERIAL AND METHODS
Orchard For experimental purposes, the orchard 'Pod bloki IV' owned by University of Maribor,
Faculty for Agriculture and Life Sciences was selected (lan. 46°30' 9'' N, lat. 15° 37' 38 '' E). In intensive 5-years old orchard 'Golden Delicious' and ‘Gala’ apple trees are growing on weak base MM 9. The trees were grown in a form in a narrow spindle.
LIDAR measurement system The LIDAR model SICK LMS111 was mounted on a tractor (GOLDONI Star 100) 140
cm above the ground, so the entire canopies are well exposed to LIDAR beams, and additional measurements from the top or bottom are not required. Tractor speed was constant at 3.6 km h-1. LIDAR is measuring two-dimensional polar coordinates of tree canopies in a vertical

3D evaluation of apple tree canopies based on the lidar sensing system
163
direction with the maximum angular range of 0 - 270° and angular resolution of 0.5°. The LIDAR SICK LMS111 has a working range from 0.5 to 20 m and an accuracy of ± 3.0 cm; laser emission wavelength was 905 nm and scanning frequency 50 Hz, so by a given tractor speed vertical scan profiles were 2 cm apart in x direction. Every laser beam incident position on the tree canopy is determined by distance and direction. Communication between sensor and computer laptop (HP 6830s) was the TCP/IP protocol at a data transmission rate of 100 MBit/s. The TCP/IP protocol was implemented by sending messages between the computer laptop and LIDAR via the LABVIEW 2015 software package. Each tree canopy was scanned twice, once on each side (left and right sides of the canopy). To determine the instantaneous position of the LIDAR sensor and to distinguish among trees, a Real-time Kinematics global positioning system (RTK–GPS) was used. The GPS consisted of a U-blox EVK-6T receiver module and Trimble’s Bullet III antenna, with a gain of 35 Db (Caldera et al., 2016). For correction of the satellite signal from a base station, the Slovenian national DGPS (Differential Global Positioning System) correction network SIGNAL (https://gu-signal.si/) was used. In addition to using DGPS as described above, selected defoliated trees were provided with wooden crates of size 0.5 m x 0.35 m x 0.35 m. The wooden crates were placed on the ground below canopies.
Point cloud analysis was performed in the volume elements, which are marked in different colours for four segments of the tree. Coordinate z = 0 was set to the ground by finding the minimum value within the point cloud in the z axis. All other heights were calculated relative to the ground and thus represent elevation above the ground. Volume elements started at z = 50 cm and extended to z = 250 cm. In this configuration, each tree is represented by a maximum of 25 x 271 = 6775 LIDAR points.
Determination of the tree canopy leaf area Manual measurements of the leaf area were carried out by removing leaves from each
individual tree canopy volume elements (Fig. 1, right) and later analysis in the laboratory. Scanning of leaves was performed using the Optomax automated image analyser (Berk, 2016).
Figure 1 A sample of ‘Gala’ tree before (left) and after removing of leaves (b) Algorithm for 3D tree canopy reconstruction Reflected laser beams from the inner and outer sides of the canopy form the point cloud,
which enables 3D reconstruction of the tree canopy volume elements. For comparison of LIDAR measurements and manual measurement of leaf area density, total number of points in the cloud and canopy volume per volume element were selected. The 3D reconstruction

D. Stajnko, P. Vindiš, D. Kelc, M. Lakota, J. Rakun, P. Berk
164
and the regression analysis of the tree canopy for each individual volume element was performed by using the MATLAB software package. Individual volumes of tree canopy volume elements were calculated with the trapezoidal method.
RESULTS AND DISCUSSION
Number of leaves in each segment of the tree canopy Table 1 and Table 2 show the results of manual leaf counting and leaf area measurements
from five segments of the ‘Gala’ and ‘Golden Delicious’ variety, respectively. As can be seen, the smallest number of leaves is in the bottom S1 segment of all trees regardless different varieties. In S2 and S3 segments, the most leaves were counted in all canopies, however with big deviations between the same varieties showing the non-uniformity among the trees. In the S4 segment, the number of leaves is again lower than in the previous two, which is characteristic for narrow spindle form.
Table 1 Number of leaves and leaf area surface on ‘Gala’ trees compared to LIDAR
measurements
Left side of tree crows Right side of tree crows
Tree/segment Leaves (n)
LAI [cm2]
LIDAR cloud of dots [n]
Leaves (n)
LAI [cm2]
LIDAR cloud of dots [n]
1-S1 0 0.0 13 128 3,621.3 373
1-S2 322 10,419.6 1,476 484 14,172.5 1024
1-S3 250 6,314.0 924 356 9,799.6 941
1-S4 214 5,904.1 30 277 7,818.9 875
2-S1 39 536.2 124 83 2,096.9 362
2-S2 427 14,089.7 1,426 141 4,189.9 800
2-S3 232 6,533.8 1,020 298 8,993.6 1018
2-S4 223 5,239.8 13 310 7,883.6 925
3-S1 25 481.7 197 0 0 226
3-S2 112 2,779.6 671 171 4,637.4 853
3-S3 301 7,230.0 1,023 116 3,207.2 536
3-S4 80 1,653.8 15 330 8,239.1 796
4-S1 227 6,185.9 372 143 3,433.4 224
4-S2 368 11,311.22 1,336 246 6,228.9 926
4-S3 466 14,021.5 1,551 246 8,328.1 1003
4-S4 379 11,858.9 66 333 9,872.5 744
5-S1 0 0.0 15 349 10,124.8 611
5-S2 180 5,503.1 1,025 443 12,790.3 769
5-S3 311 9,409.9 1,274 393 10,073.4 888
5-S4 176 4,106.3 125 170 4,472.4 618

3D evaluation of apple tree canopies based on the lidar sensing system
165
Table 2 Number of leaves and leaf area surface on ‘Golden Delicious’ trees compared to LIDAR measurements
Left side of tree crows Right side of tree crows
Tree/segment Leaves (n)
LAI [cm2]
LIDAR cloud of dots [n]
Leaves (n)
LAI [cm2]
LIDAR cloud of dots [n]
1-S1 0 0.0 107 0 0 126
1-S2 145 4481.7 964 150 3,506.1 868
1-S3 132 4370.9 872 176 5,292.7 1011
1-S4 126 3544.8 549 91 3,434.2 377
2-S1 27 415.0 397 64 1,496.8 289
2-S2 198 7608.2 870 138 5,255.5 1071
2-S3 143 5985.1 847 164 5,565.7 864
2-S4 154 5244.9 650 178 6,870.3 787
3-S1 0 0.0 119 8 100.2 241
3-S2 263 9862.5 1,365 178 5,971.7 1240
3-S3 115 3613.7 717 102 2,877.5 692
3-S4 118 3321.4 387 47 1,527.6 424
4-S1 75 1848.9 205 0 0 100
4-S2 152 5350.4 1,085 203 7,041.5 1000
4-S3 86 2735.8 419 195 6,040.3 836
4-S4 227 7269.2 865 244 6,382.1 704
5-S1 21 682.5 102 12 315.9 100
5-S2 201 6686.1 1,135 94 2,626.4 678
5-S3 197 6616.3 866 113 3,776.6 886
5-S4 167 5378.6 762 190 6,203.1 850
Leaf area in a particular segment of the tree canopy As seen from Table 1 and Table 2 showing the results of measuring leaf area, the smallest
leaf area coincides with the number of leaves, so it is the lowest in S1 segment. In ‘Gala’ the largest leaf area (24592.09 cm2) was measured at crown number 2 in segment S2, while in ‘Golden Delicious’ (15834.22 cm2) at crown number 3. In the fourth segment the measured leaf are is again smaller than in the previous two.
Also, the smallest leaf area coincides with the number of leaves and was the lowest in the S4 segment of tree number 5 (8578.62 cm2) for ‘Gala’ and 6491.17 cm2 in the S4 segment of tree number 3 for ‘Golden Delicious’.
LIDAR measurement The results of the LIDAR measurement are presented with the number of reflected laser
beams or cloud of dots (Table 1, Table 2). As can be seen from Table 1 the smallest number of points in the cloud on the left of ‘Gala’ trees was measured in the S1 segment of the tree

D. Stajnko, P. Vindiš, D. Kelc, M. Lakota, J. Rakun, P. Berk
166
number 1 (13), while in ‘Golden Delicious’ 100 points of clouds were detected in the S1 segment of the tree number 4 and 5 (Table 2).
The highest number of points in the cloud (1476) was detected for ‘Gala’ in segment 2 of the tree number 1 and 1365 clouds of dots in the S2 segment of the tree crown number 3 for ‘Golden Delicious’, respectively.
Figure 2 Example of 3D digital canopy reconstruction, for the first randomly selected tree
in the experiment: a) left and b) right half of the canopy. Precise regression analysis between detected point of clouds (LIDAR measurements) and
the leaf areas discovered that the value of the correlation coefficient for the left side of the ‘Golden Delicious’ trees is r = 0.91 and for the right side r = 0.86. For ‘Gala’ the correlation r = 0.73 was estimated for the left half of tree crowns and r = 0.72 for the right half of the tree crowns, respectively.
From the values of the correlation coefficients, we can conclude that in our case there is a close correlation between the two variables, so the presented measuring LIDAR based technology is comparable or even better than the solutions of other researchers such as Llorens et al., (2011), who measured the maximum value of the correlation coefficient r = 0.41 with respect to the ratio between the number of reflected laser beams and the leaf surface). In a more recent study, Sanz et al. (2018) performed LIDAR scanning and defoliation of 14 blocks of apple trees at different phenological stages. They found a very high correlation coefficient R2 of 0.88 due to the differences in growth form (narrow spindle form in our case vs spindle form), ages of trees and tree varieties.
a) b)

3D evaluation of apple tree canopies based on the lidar sensing system
167
CONCLUSIONS
In this paper we described the precise measuring system built around LIDAR which enables digital reconstruction of the tree crown in the 3 D virtual space of the Matlab R2015a program. With the digital reconstruction of the canopy, the analysis of the natural properties of the apple tree canopy is possible due to very close correlation between the digital number of point clouds and the manual measured leaf area.
Without a doubt, optical measuring systems including a laser measuring sensor for electronic canopy detection provide the most accurate and detailed information on the structure of the natural shape of the tree canopy in the orchard. With the appropriate algorithm, we can control the operation of the optical measuring system and create a 3D-virtual environment at low cost of installing the measuring system on a tractor. For all these reasons, in future optical measuring systems should be installed on tractor prototypes for commercial purposes.
It is expected in the near future that smart decision models will ensure more even control of spraying PPP over the entire apple tree canopies of the orchard. Benchmarking will be a powerful tool for controlling PPP doses in orchards and vineyards in the near future. Information in the form of the estimated size of the leaf area on the individual canopy of an apple tree in an orchard will be captured in a smart decision model with which we will be able to control the PPP doses in the range from 0% to 100%.
ACKNOWLEDGEMENTS
The results presented are an integral part of the project CRP V4-1815 entitled "Reducing of draught stress and increasing of soil fertility by introducing conservation (conservation) soil tillage into sustainable agriculture", which is financed by the Slovenian Research Agency and the Ministry of Agriculture, Forestry and Food of the Republic of Slovenia.
REFERENCES
Balsari, P.and Tamagnone, M. (1998). An ultrasonic airblast sprayer. EurAgEng Paper No. 98A-017, AgEng 98 International Conference, Oslo, Norway.
Berk, P., Hočevar, M., Stajnko, D., Belšak, A. (2016). Development of alternative plant protection product application techniques in orchards, based on measurement sensing systems: A review. Computers and Electronics in Agriculture, 124: 273–288.
Berk, P., Belšak, A., Stajnko, D., Lakota, M., Muškinja, N., Hočevar, M., Rakun, J. (2019) Intelligent automated system based on a fuzzy logic system for plant protection product control in orchards. International journal of agricultural and biological engineering, 12, 3, 92-102.
Byers, R.E., Lyons Jr. C.G., Yoder, K.S., Horsburgh, R.L., Barden, J.A., Donohue, S.J. (1984). Effect of apple tree size and canopy density on spray chemical deposit, Hortscience, 19, 93-94.
Caldera, S., Realini, E., Barzaghi, R., Reguzzoni, M., Sansò, F. (2016). Experimental study on low-cost satellite-based geodetic monitoring over short baselines. J. Surv. Eng., 142, 04015016.
Escolà, A., Camp, F., Solanelles, F., Llorens, J., Planas, S., Rosell, J. R., Gràcia, F., Gil, E., Val, L. (2007). Variable dose rate sprayer prototype for dose adjustment in tree crops according to canopy characteristics measured with ultrasonic and laser LIDAR sensors, Proceedings ECPA-6th European Conference on Precision Agriculture, 563–571.

D. Stajnko, P. Vindiš, D. Kelc, M. Lakota, J. Rakun, P. Berk
168
Giles, D.K., Delwiche, M.J., Dodd, R.B. (1989). Sprayer control by sensing orchard crop characteristics: orchard architecture and spray liquid savings. J. Agric. Eng. Res. 43, 271-289.
Ladd, T.L., Reichard, D.L. (1980). Photoelectrically-operated intermittent sprayers for insecticidal control of horticultural pests. J. Econom. Entom. 73, 525- 528.
Rosell, J.R., Llorens, J., Sanz, R., Arnó, J., Ribes-Dasi, M., Masip, J., Escolà, A., Camp, F. Solanelles, F., Gràcia, F., Gil, H., Val, L., Planas,S., Palacín, J. (2009a). Obtaining the three-dimensional structure of tree orchards from remote 2D terrestrial LIDAR scanning, Agricultural and Forest Meteorology, 149, 1505-1515.
Rosell, J. R., Sanz, R., Llorens, J., Arnó, J., Escolà, A., Ribes-Dasi, M., Masip, J., Camp, F. Gràcia, F. Solanelles, F., Pallejà, T., Val, L., Planas, S., Gil, E., Palacín, J. (2009b). A tractor-mounted scanning LIDAR for the non-destructive measurement of vegetative volume and surface area of tree-row plantations: a comparison with conventional destructive measurements, Biosystems Engineering, 102, 128-134.
Sanz, R., Llorens, J., Escolà, A., Arnó, J., Planas, S., Román, C., Rosell-Polo, J.R. (2018). LIDAR and non-LIDAR-based canopy parameters to estimate the leaf area in fruit trees and vineyard. Agric. For. Meteor. 260–261, 229–239. https://doi.org/10.1016/j.agrformet.2018.06.017.
SIGNAL. (https://gu-signal.si/), accessed on December 9, 2020. Walklate, P.J., Cross, J.V., Richardson, G.M., Murray, R.A., Baker, D.E. (2002). Comparison of
different spray volume deposition models using LIDAR measurements of apple orchards. Biosyst. Eng. 82 (3), 253-267.
Walklate, P. J. and Cross, J.V. (2013). Regulated dose adjustment of commercial orchard spraying products, Crop Protection, 54, 65–73.
48th Symposium "Actual Tasks on Agricultural Engineering", Zagreb, Croatia, 2021
169
MONITORING THE CONDITION OF RAPESEED PLANTS USING UAVs TO DETERMINE THE NDVI INDEX Damijan KELC*, Peter VINDIŠ, Erik RIHTER, Jurij RAKUN, Peter BERK,
Denis STAJNKO, Miran LAKOTA *E-mail of corresponding author: [email protected]
University in Maribor, Faculty of Agriculture and Life Sciences, Pivola 10, 2311 Hoče, Slovenija
SUMMARY
Various remote sensing systems are used to monitor the condition of rapeseed plants from sowing to harvest. The possibilities of using drones to determine the NDVI index were studied. In the experimental field, three flights during the oilseed rape growing season were performed on the property of Jeruzalem SAT d.d. at GERK Loperšice levo, which is 18.4 ha in size and is located between Ormož and Središče ob Dravi. We used Phantom 4 drone in combination with Sequoia + multispectral camera to capture photographs, which were processed using PIX4D Fields software. Photographs were combined into an orthomosaic. The values of the NDVI index were determined. Measurements confirmed the conclusions of other studies. The values obtained from the drone images were compared with the images from the Landsat-8 satellite. Our drone shots are much better and more convenient. The images are important for targeted selective fertilization and application of reduced amounts of phytopharmacy protection products. Savings and contribution to environmental protection are very important.
Key words: drone, aero photography, rapeseed, NDVI, remote sensing
INTRODUCTION
The development of technology is accelerating day by day, and modern technology is becoming more affordable for the general population. The technology needs to be adapted to the user so that it is easy to use. Population growth in the world has triggered an increased need for food. By 2050, growers will have to produce up to 50% more food to meet demand (Yin, 2018). Scientists are using technology to solve the ecological and economic problems of efficient food production. Due to their versatility, both in agriculture and livestock, drones are one of the most important technologies in precision agriculture. If we want agriculture to become more competitive, we need to introduce modern agricultural technologies into our
48. ACTUAL TASKS ON AGRICULTURAL ENGINEERING
Preliminary communication

D. Kelc, P. Vindiš, E. Rihter, J. Rakun, P. Berk, D. Stajnko, M. Lakota
170
agricultural environment. Modern technology includes satellite navigation, which is intensively used in neighbour developed countries.
With the help of modern technology, education of agricultural workers and improving of modern technologies, we can significantly change the economy and efficiency of production areas in the future. With the help of drones and sensors installed on it, we can monitor the health of plants from sowing to harvesting. Various sensors and software allow the farmer to monitor plant health, habitat, nutrient and water availability. In cooperation with more technologically advanced attachments, the farmer can practically use the obtained data in the field, where smart technology determines the amount of sprays, the place of spraying and fertilizing.
Winter oilseed rape often suffer mechanical damage in winter, which can develop infections and pests, and on the other hand, mechanical damage can be too strong for further economical rapeseed production. With the help of the NDVI index, obtained with a drone, camera and software, we can determine the places of damages and take care of them on precisely, without spending funds on parts of the surfaces where this is not necessary. For larger areas, local detection is a huge challenge. For this it could be spend many scanning hours, human eyes are also limited by the visible spectrum of light. With the help of precise technology, damaged plants could be pointed to the centimetre accuracy.
Common oilseed rape (Brassica napus subsp. napus) belongs to the cruciferous family. It originates from the Mediterranean and Southeast Asia. It grows best in warm climates, but even in colder areas grows well. Historically, rapeseed vegetable oil has been used to illuminate hanging lamps. In the 20th century, industrial extraction of oil from seeds began. During this time, cultivations of varieties with a lower concentration of harmful, fatty acids and glucosinolates were introduced, which interfere with the functioning of the heart muscle. Hybrid varieties today contain less of these harmful substances. In recent decades, rapeseed has become an economically important plant, with 36 million hectares of the world's land planted, across 25 European countries, including Slovenia. Due to the agreement between Europe and America, an individual farmer can receive direct payment for only 15% of the fields sown with this plant (Kocjan 2015), which increases the need for higher yields per hectare with the help of precision agriculture. In recent years, rapeseed production in Slovenia has increased to 4,000 to 6,000 ha of sown fields, and most of the product is exported to neighbouring countries, especially to Austria, where the seeds are processed into edible oil or biodiesel (Bavec 2000).
The optimal soil conditions for the growth of oilseed rape are structural loamy-sandy soils, riches with humus, due to poorer pumping power of the roots. Sowing of winter species in Styria takes place in September (Ačko Kocjan 1999). If sowing is done too early, damage to plants during frost is possible in the spring. These consequences have already been observed with drones in an independent study (Boașcă et al. 2017). Wintering of plants, however, depends on the density of sowing, disease infections and pest damage in the autumn and spring months. Rapeseed is less tolerant of temperature fluctuations (Bavec 2000).
It is not recommended to sow rapeseed in the same field for less than 4 years. A two-year monoculture can reduce a hectare of seed yield by up to 21%, and a multi-year monoculture by a half (Bavec 2000). The crop is economically justified only on well-drained, airy and deep soils, which makes economical production difficult for farmers without technologically
Monitoring the condition of rapeseed plants using UAVs to determine the NDVI index
171
appropriate instruments. With appropriately advanced plant control and care technology can move the scale from negative crop economy to positive.
Rapeseed oil is more and more popular in the world, as a supplement and as a technically useful oil. Due to the 10% higher oil content in the seeds, it also displaces technical oil obtained from rapeseed. The need for cold-pressed oil is increasing in the food industry due to its low value of saturated fats and is one of the most popular types of oils (Kocjan 2015).
Oilseed rape grows worse where there is a lack of nitrogen. The possibility of mechanical damage is increased, and during the winter it is exposed to a higher level of infections or even uneconomical further production after frost. For this reason, real-time detection of plant health with NDVI indexes and locating of infection is very helpful. Conventional tillage with using the plough is the most common method of rapeseed production, which is easiest for the farmer. This represents inefficient land use, without the help of modern technology and precise adjustment of hectare yield.
The adoption of modern technologies in agriculture, such as the use of drones or unmanned aerial vehicles (UAVs) can significantly enhance risk and damage assessments and revolutionize the way we prepare for and respond to disasters that affect the livelihoods of vulnerable farmers and fishers and the country’s food security. It showed the advantages of using drones over satellites. Resolution is very important in the accuracy of the data captured, and the implementation of precision farming is based on accuracy and detail. A separate study demonstrated a 3.88% more accurate crop forecast compared to data captured by satellite and drone-mounted sensors. The study states that resolution is not the only advantage. The possibility of recapture of data in case of poor resolution due to weather conditions also indicates the greater usability of drones, data can be captured more often on selected dates, and in time with the correct the preparation process takes little time and is very energy efficient (Triff et al. 2018).
Drones with attached multispectral cameras and sensors can capture multispectral images, which the software glues together and creates a field image with the help of GPS coordinates, with the possibility of filtering parameters. Proper use of sensor and software allows the production of topographic maps of various indices, such as. Normalized Difference Vegetation Index (NDVI), Leaf Area Index (LAI), Green Area Index (GAI) and others, allowing the farmer to view the field outside the visible spectrum of light. By overlapping and combining indices, the properties of the field outside the visible spectrum can be precisely determined and visibly distinguished, which enables more precise supplementary processing with adapted mechanization. With the help of drones and sensors, damage to oilseed rape plants has already been determined after wintering, which may be crucial in deciding whether to cultivate winter oilseed rape or to replace it with another crop due to the assessment of excessive damage (Boașcă 2017).
In a separate study, the nitrogen content of rapeseed plants was checked with the help of UAV. This property is very important from an economic point of view in the cultivation of oilseed rape (Shishi Liu et al. 2018). In cooperation with GPS and RTK technology, we can add geolocation. This data can be used to observe and monitor plant growth and development, record and observe long-term crop characteristics and compare them, allowing the individual to choose better production methods that are more suitable for the use of adapted hybrid species. Measured values by geolocation are the key to successful precision farming. The obtained data can be combined with technologically advanced machines, which allows us a

D. Kelc, P. Vindiš, E. Rihter, J. Rakun, P. Berk, D. Stajnko, M. Lakota
172
variety of agricultural measures with great precision in places. In this way, we improve the economic characteristics of cultivation by reducing the consumption of fertilizers and sprays. From an ecological point of view, we generally reduce our carbon footprint, reduce drift into the environment and contribute to conservation farming practices.
With the possibility of remote control, together with a wide selection of smaller and lighter sensors and data processing software, the drone can be used in almost all areas of the economy. For agricultural purposes, the drone market is expected to grow to $ 32.4 billion in the future, intended as an “eye in the air” (Corrigan, 2019).
The working hypotheses of this research are: from the captured photographs in the field we can discern parts of the land with different values of the NDVI index, and using drone images, we could obtain more accurate NDVI index values than can be obtained from the available satellite images. The aim of the work is to determine the process of obtaining the values of NDVI rapeseed indexes using drones and a multispectral camera. The obtained values of the NDVI index must be precise enough so that we can later use them as a basis for the implementation of selective technological processes.
MATERIALS AND METHODS
We performed data collection flights on the property of Jeruzalem SAT d.d. at GERK Loperšice levo, which is 18.4 ha in size and is located between Ormož and Središče ob Dravi (latitude: 46.39455892145634, longitude: 16.221794933080673). Oilseed rape of the cultivar PT200CL (Clearfield) was sown on the land, which allows the use of herbicides and is stable during wintering. The Kvarnerland s drill pro seed drill was used, which ensured a uniform sowing depth at a density of 2.28 kg / ha. We used Phantom 4 drones in combination with an attached Sequoia + multispectral camera to capture quality images. The control was performed with the help of a smart tablet and software QGIS and Pix4D Fields, which, after plotting the observed area, outlined the optimal flight path of the drone. After the captured photographs, these images were combined into an orthomosaic, on which we implemented the values of the reflection of light spectra to calculate the NDVI index.
The intensity of the photosynthesis process, where the spectrum of visible light or PAR (photo-synthetically active radiation) is absorbed (400-700 nm), shows the condition of the plant and the associated increase in biomass. The leaf surfaces reflect the light of the infrared spectrum (700-1100 nm), as the energy efficiency is too low, and the absorption of infrared light can cause the plant to overheat and denature the proteins. In the correlation of absorption and reflection of different parts of the light spectrum, the NDVI factor was developed with the following equation:
𝑁𝑁𝑁𝑁𝑁𝑁𝑁𝑁 =(NIR − RED)(NIR + RED)
NDVI - normalized difference vegetation index) [-1.0, +1.0], NIR - near infrared [µm], RED - light spectrum of red light [µm]. In the Pix4Dfields program, we mosaicked the photographs obtained with drone aerial
photographs and obtained the whole image, as shown in Figure 1.
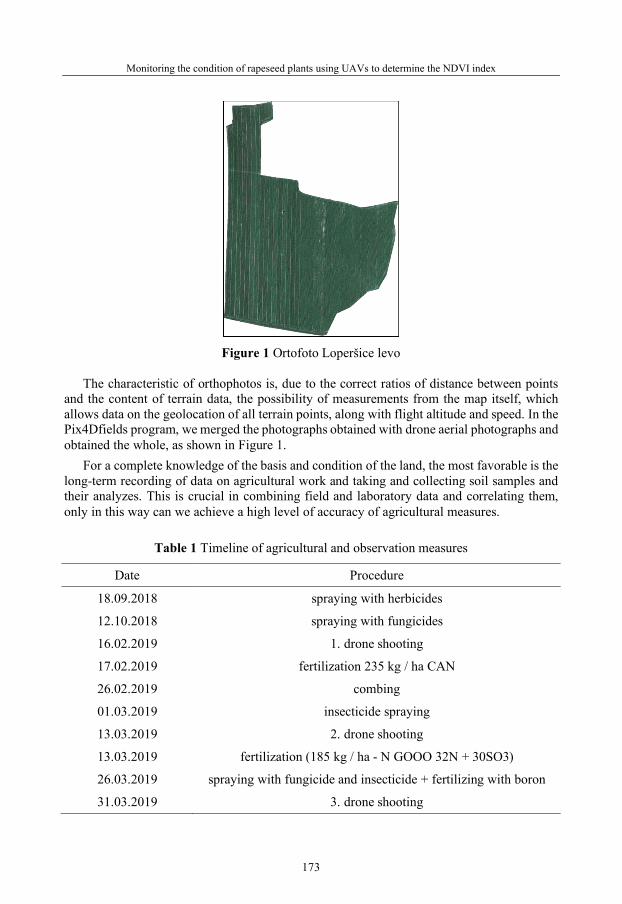
Monitoring the condition of rapeseed plants using UAVs to determine the NDVI index
173
Figure 1 Ortofoto Loperšice levo
The characteristic of orthophotos is, due to the correct ratios of distance between points
and the content of terrain data, the possibility of measurements from the map itself, which allows data on the geolocation of all terrain points, along with flight altitude and speed. In the Pix4Dfields program, we merged the photographs obtained with drone aerial photographs and obtained the whole, as shown in Figure 1.
For a complete knowledge of the basis and condition of the land, the most favorable is the long-term recording of data on agricultural work and taking and collecting soil samples and their analyzes. This is crucial in combining field and laboratory data and correlating them, only in this way can we achieve a high level of accuracy of agricultural measures.
Table 1 Timeline of agricultural and observation measures
Date Procedure
18.09.2018 spraying with herbicides
12.10.2018 spraying with fungicides
16.02.2019 1. drone shooting
17.02.2019 fertilization 235 kg / ha CAN
26.02.2019 combing
01.03.2019 insecticide spraying
13.03.2019 2. drone shooting
13.03.2019 fertilization (185 kg / ha - N GOOO 32N + 30SO3)
26.03.2019 spraying with fungicide and insecticide + fertilizing with boron
31.03.2019 3. drone shooting

D. Kelc, P. Vindiš, E. Rihter, J. Rakun, P. Berk, D. Stajnko, M. Lakota
174
The legislation sets out special rules and instructions for the safe flights of drones, as well
as the duties and rights of a drone operator. The Official List of the Republic of Slovenia (Official Gazette of the Republic of Slovenia, No. 52/2016, Decree on Unmanned Aircraft Systems, page 7838) defines in detail the concept of a drone, its placement in a category and flight restrictions with regard to drone characteristics. Every drone exceeding 1 kg must have a non-combustible identification plate. Drones are divided into 3 classes according to size: Class 5: up to and including 5 kg, Class 25: over 5 to 25 kg inclusive and Class 150: over 25 up to and including 150 kg.
RESULTS AND DISCUSSION
A drone flight is a pre-planned mission with its own plan. Before the flight, it is necessary to inspect the terrain for the possibility of obstacles, obtain special permits for flights and comply with the legislation on the use of drones. We performed the flights for three days, 16.2.2019, 13.3.2019 and 31.3.2019.
With such a method, we can monitor the field throughout the year, allow data storage and comparison of captured data, from which we can understand the effectiveness of our agricultural measures and monitor the health of plants over time. We drew a field around the ground on a smart device and determined the height of the flyover and the quality of a single pixel (the lower flyover is of better quality, but covers less area). The software itself plotted the flight path so that as few images as possible were needed to achieve the desired quality.
The images are the result of captured data from the field. The software created images with computed NDVI index from composite orthomosaics. The first recording was performed on February 16, 2019. By overlapping and calculating the NIR and RED spectra of light according to the NDVI equation, we obtained the images.
Figure 2 NDVI index, 16.02.2019 – Loperšice levo

Monitoring the condition of rapeseed plants using UAVs to determine the NDVI index
175
The figure clearly shows the areas with lower values of the NDVI index (red). We noticed that special attention should be paid to the lane along the road, where the plants are more exposed depositing dust from the road on the leaf surfaces (which can reduce the intensity of photosynthesis) and stronger sunlight due to the exposed side.
Figure 3 Legend of NDVI values and displayed colors, 16.02.2019 – Loperšice levo The legend itself shows us the amount and frequency of NDVI values. As can be seen
from Figure 2 and the legend, on 16.2.2019 the land was in medium good condition. With the naked eye, we can see the top of the curve closer to 0, which indicates poor plant health. However, when interpreting the data, we must not forget about environmental factors. Since the photos were taken on 16 February, we must take into account the fact that the plants were lower in growth, so the leaf area does not cover a large part of the plot, which can move NDVI values closer to 0. Water cover, snow and ice also give slightly negative NDVI values. which is seen across the entire graph and affects the overall picture. This is especially common in the winter-spring period, when piles of snow stagnate in the field or water is retained (Minh et al. 2013). Prior to the 1st shoot, only sprays with herbicides and fungicides were carried out, which did not directly bring nutrients into the plants. With the help of this technology, we enable the farmer to plan his work and cultivation culture. With this data, we can assess the degree of damage to plants due to frost and take appropriate action, which has already been proven in independent research (Boașcă 2017).
Figure 4 NDVI index, 13.03.2019 – Loperšice levo
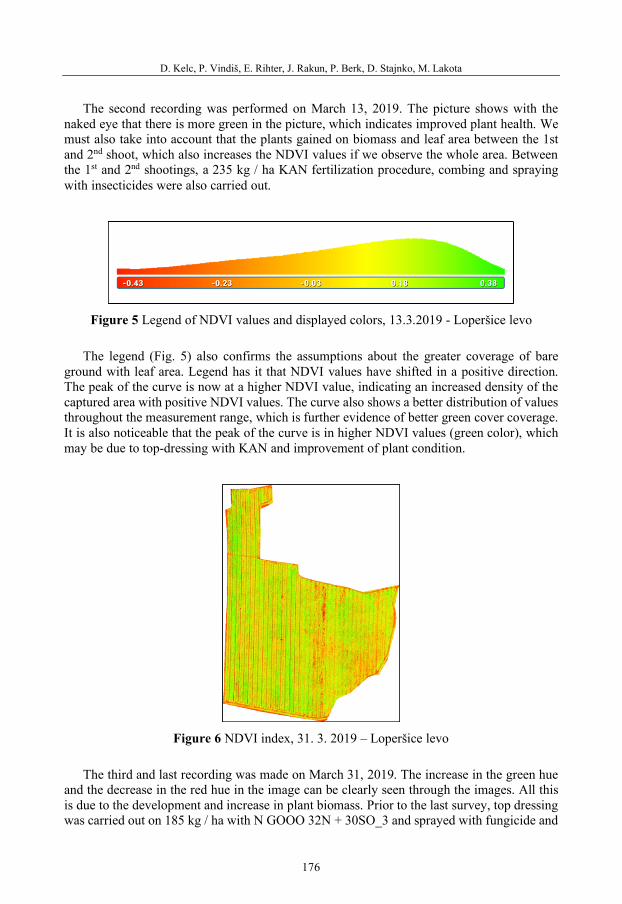
D. Kelc, P. Vindiš, E. Rihter, J. Rakun, P. Berk, D. Stajnko, M. Lakota
176
The second recording was performed on March 13, 2019. The picture shows with the naked eye that there is more green in the picture, which indicates improved plant health. We must also take into account that the plants gained on biomass and leaf area between the 1st and 2nd shoot, which also increases the NDVI values if we observe the whole area. Between the 1st and 2nd shootings, a 235 kg / ha KAN fertilization procedure, combing and spraying with insecticides were also carried out.
Figure 5 Legend of NDVI values and displayed colors, 13.3.2019 - Loperšice levo
The legend (Fig. 5) also confirms the assumptions about the greater coverage of bare
ground with leaf area. Legend has it that NDVI values have shifted in a positive direction. The peak of the curve is now at a higher NDVI value, indicating an increased density of the captured area with positive NDVI values. The curve also shows a better distribution of values throughout the measurement range, which is further evidence of better green cover coverage. It is also noticeable that the peak of the curve is in higher NDVI values (green color), which may be due to top-dressing with KAN and improvement of plant condition.
Figure 6 NDVI index, 31. 3. 2019 – Loperšice levo
The third and last recording was made on March 31, 2019. The increase in the green hue
and the decrease in the red hue in the image can be clearly seen through the images. All this is due to the development and increase in plant biomass. Prior to the last survey, top dressing was carried out on 185 kg / ha with N GOOO 32N + 30SO_3 and sprayed with fungicide and
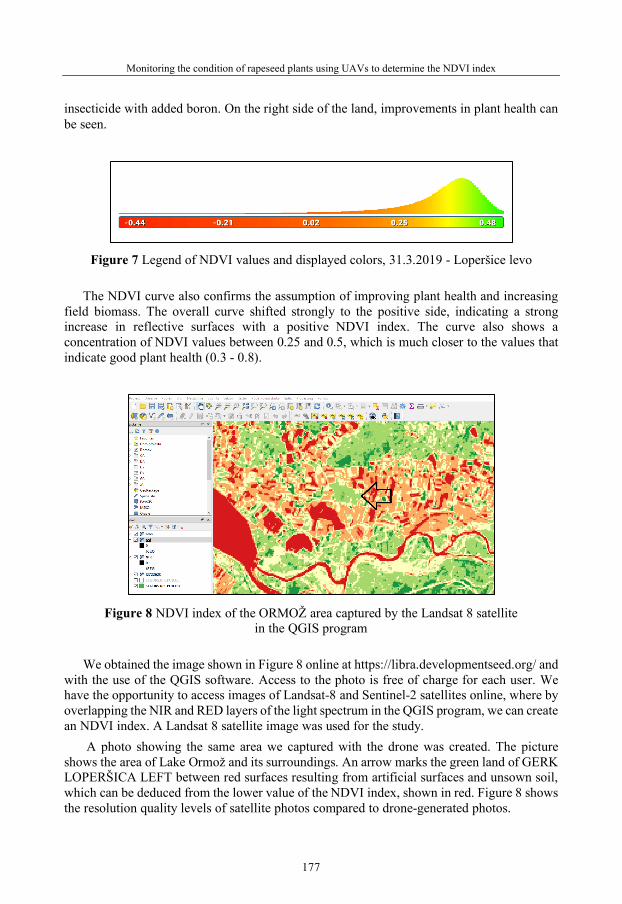
Monitoring the condition of rapeseed plants using UAVs to determine the NDVI index
177
insecticide with added boron. On the right side of the land, improvements in plant health can be seen.
Figure 7 Legend of NDVI values and displayed colors, 31.3.2019 - Loperšice levo
The NDVI curve also confirms the assumption of improving plant health and increasing
field biomass. The overall curve shifted strongly to the positive side, indicating a strong increase in reflective surfaces with a positive NDVI index. The curve also shows a concentration of NDVI values between 0.25 and 0.5, which is much closer to the values that indicate good plant health (0.3 - 0.8).
Figure 8 NDVI index of the ORMOŽ area captured by the Landsat 8 satellite
in the QGIS program We obtained the image shown in Figure 8 online at https://libra.developmentseed.org/ and
with the use of the QGIS software. Access to the photo is free of charge for each user. We have the opportunity to access images of Landsat-8 and Sentinel-2 satellites online, where by overlapping the NIR and RED layers of the light spectrum in the QGIS program, we can create an NDVI index. A Landsat 8 satellite image was used for the study.
A photo showing the same area we captured with the drone was created. The picture shows the area of Lake Ormož and its surroundings. An arrow marks the green land of GERK LOPERŠICA LEFT between red surfaces resulting from artificial surfaces and unsown soil, which can be deduced from the lower value of the NDVI index, shown in red. Figure 8 shows the resolution quality levels of satellite photos compared to drone-generated photos.
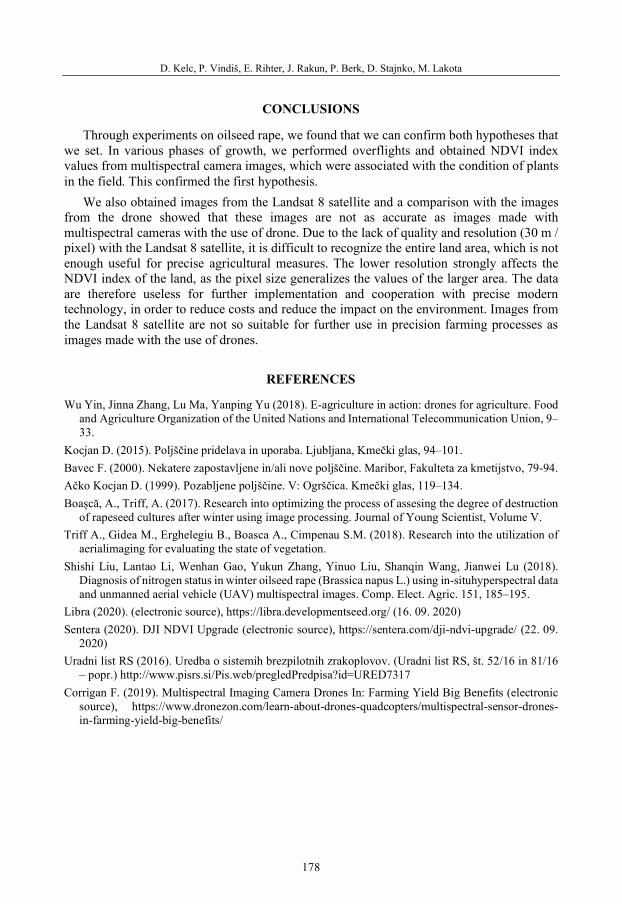
D. Kelc, P. Vindiš, E. Rihter, J. Rakun, P. Berk, D. Stajnko, M. Lakota
178
CONCLUSIONS
Through experiments on oilseed rape, we found that we can confirm both hypotheses that we set. In various phases of growth, we performed overflights and obtained NDVI index values from multispectral camera images, which were associated with the condition of plants in the field. This confirmed the first hypothesis.
We also obtained images from the Landsat 8 satellite and a comparison with the images from the drone showed that these images are not as accurate as images made with multispectral cameras with the use of drone. Due to the lack of quality and resolution (30 m / pixel) with the Landsat 8 satellite, it is difficult to recognize the entire land area, which is not enough useful for precise agricultural measures. The lower resolution strongly affects the NDVI index of the land, as the pixel size generalizes the values of the larger area. The data are therefore useless for further implementation and cooperation with precise modern technology, in order to reduce costs and reduce the impact on the environment. Images from the Landsat 8 satellite are not so suitable for further use in precision farming processes as images made with the use of drones.
REFERENCES
Wu Yin, Jinna Zhang, Lu Ma, Yanping Yu (2018). E-agriculture in action: drones for agriculture. Food and Agriculture Organization of the United Nations and International Telecommunication Union, 9–33.
Kocjan D. (2015). Poljščine pridelava in uporaba. Ljubljana, Kmečki glas, 94–101. Bavec F. (2000). Nekatere zapostavljene in/ali nove poljščine. Maribor, Fakulteta za kmetijstvo, 79-94. Ačko Kocjan D. (1999). Pozabljene poljščine. V: Ogrščica. Kmečki glas, 119–134. Boașcă, A., Triff, A. (2017). Research into optimizing the process of assesing the degree of destruction
of rapeseed cultures after winter using image processing. Journal of Young Scientist, Volume V. Triff A., Gidea M., Erghelegiu B., Boasca A., Cimpenau S.M. (2018). Research into the utilization of
aerialimaging for evaluating the state of vegetation. Shishi Liu, Lantao Li, Wenhan Gao, Yukun Zhang, Yinuo Liu, Shanqin Wang, Jianwei Lu (2018).
Diagnosis of nitrogen status in winter oilseed rape (Brassica napus L.) using in-situhyperspectral data and unmanned aerial vehicle (UAV) multispectral images. Comp. Elect. Agric. 151, 185–195.
Libra (2020). (electronic source), https://libra.developmentseed.org/ (16. 09. 2020) Sentera (2020). DJI NDVI Upgrade (electronic source), https://sentera.com/dji-ndvi-upgrade/ (22. 09.
2020) Uradni list RS (2016). Uredba o sistemih brezpilotnih zrakoplovov. (Uradni list RS, št. 52/16 in 81/16
– popr.) http://www.pisrs.si/Pis.web/pregledPredpisa?id=URED7317 Corrigan F. (2019). Multispectral Imaging Camera Drones In: Farming Yield Big Benefits (electronic
source), https://www.dronezon.com/learn-about-drones-quadcopters/multispectral-sensor-drones-in-farming-yield-big-benefits/
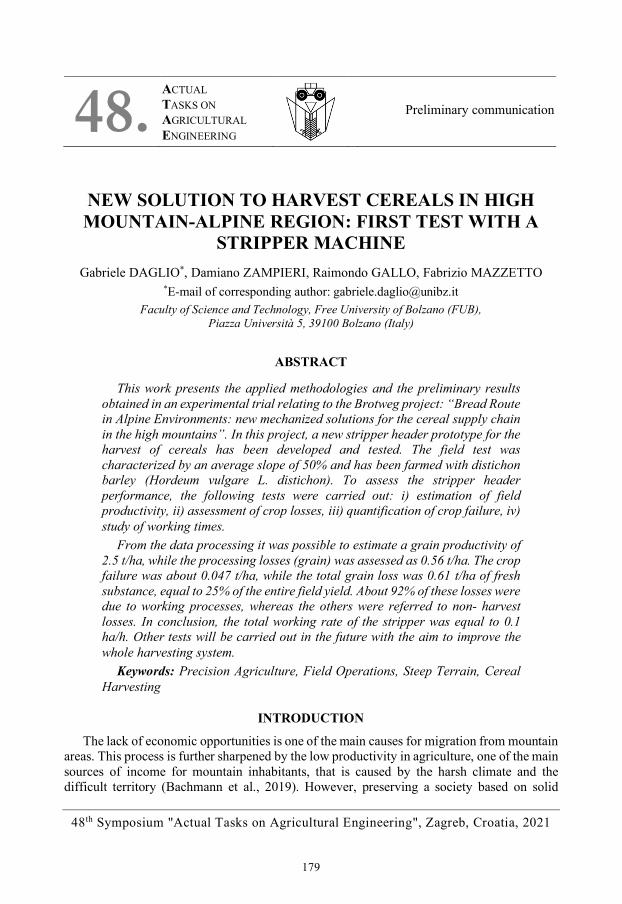
48th Symposium "Actual Tasks on Agricultural Engineering", Zagreb, Croatia, 2021
179
NEW SOLUTION TO HARVEST CEREALS IN HIGH MOUNTAIN-ALPINE REGION: FIRST TEST WITH A
STRIPPER MACHINE Gabriele DAGLIO*, Damiano ZAMPIERI, Raimondo GALLO, Fabrizio MAZZETTO
*E-mail of corresponding author: [email protected] Faculty of Science and Technology, Free University of Bolzano (FUB),
Piazza Università 5, 39100 Bolzano (Italy)
ABSTRACT
This work presents the applied methodologies and the preliminary results obtained in an experimental trial relating to the Brotweg project: “Bread Route in Alpine Environments: new mechanized solutions for the cereal supply chain in the high mountains”. In this project, a new stripper header prototype for the harvest of cereals has been developed and tested. The field test was characterized by an average slope of 50% and has been farmed with distichon barley (Hordeum vulgare L. distichon). To assess the stripper header performance, the following tests were carried out: i) estimation of field productivity, ii) assessment of crop losses, iii) quantification of crop failure, iv) study of working times.
From the data processing it was possible to estimate a grain productivity of 2.5 t/ha, while the processing losses (grain) was assessed as 0.56 t/ha. The crop failure was about 0.047 t/ha, while the total grain loss was 0.61 t/ha of fresh substance, equal to 25% of the entire field yield. About 92% of these losses were due to working processes, whereas the others were referred to non- harvest losses. In conclusion, the total working rate of the stripper was equal to 0.1 ha/h. Other tests will be carried out in the future with the aim to improve the whole harvesting system.
Keywords: Precision Agriculture, Field Operations, Steep Terrain, Cereal Harvesting
INTRODUCTION
The lack of economic opportunities is one of the main causes for migration from mountain areas. This process is further sharpened by the low productivity in agriculture, one of the main sources of income for mountain inhabitants, that is caused by the harsh climate and the difficult territory (Bachmann et al., 2019). However, preserving a society based on solid
48. ACTUAL TASKS ON AGRICULTURAL ENGINEERING
Preliminary communication

G. Daglio, D. Zampieri, R. Gallo, F. Mazzetto
180
economical basis is fundamental in mountainous regions. Mountain culture is characterized by a natural lifestyle, an original food tradition, ancient country traditions and the care for the landscape protection, appreciated by the tourism industry. Nowadays, the role of agriculture in mountain areas is a big challenge, mostly because of the steep slopes, that make farming difficult. Facing these problems with innovative solutions can allow a revitalization of mountain areas despite the physical limitations (Franco et al., 2020). This work focuses on the region of Südtirol, an Alpine region in the north-east of Italy, large parts of whose arable surface are too steep or too high for intensive farming. Indeed, the greatest part of the arable land in South Tyrol lies above 1000 m asl (79%) and has a slope higher than 20% (64%), making the use of machines difficult (Mayr et al., 2020).
Increasing the role of agricultural mechanization can help farmers to increase the productivity and their profits (Ichniarsyah and Erniati, 2020). In this work, we developed and tested a stripper header for barley, which can grow in a wide range of environmental conditions and it can be cultivated in marginal areas with relatively low maintenance (Tricase et al., 2018). Our aim is to design a reliable and efficient machine able to harvest in mountain conditions, facing the presence of extremely steep slopes. In such an environment, saving weight is fundamental, therefore is important to maximize the quantity of the grain harvested over the straw. This purpose was attained by applying the stripping process on the spike only, leaving the stalk on the field. Currently, little has done in literature on the development of collection devices such as stripper headers. In a previous work, Chegini (2013) carried out a comparative study between a harvesting machine and a stripper header to determine the performances of the two machines in terms of harvesting efficiency. Considering the environment condition where the machine is tested, still much research is needed in order to correct and optimize harvesting methods with stripper header (Chegini and Mirnezami, 2016).
MATERIALS AND METHODS
Study area The experiment was conducted on a test field in Guggenbergerhof farm, San Genesio,
Italy, located in the alpine region of Südtirol. The total farm extension is about 3 ha, 0.15 ha of which are planted with distichon barley (Hordeum vulgare L. distichon), while another small portion of the field is planted with hops. The rest of the arable field is mainly occupied by lawn managed for livestock feeding purpose (Fig. 1). All the field activities were carried out on the barley field, which has a mean inclination between 25 and 50%.
Figure 1 Aerial view of the study area. The colours in the legend indicate the slope of the field used for the test.

New solution to harvest cereals in high mountain-alpine region: first test with a stripper machine
181
The harvest system: Stripper header In this work, we propose the test of a stripper header, developed by Geier S.r.l. (Marlengo,
Bolzano, Italy) in collaboration with the Free University of Bozen-Bolzano, mounted on a Geier 85 TLY tracked vehicle (Fig. 2). The stripper header is composed of stripping combs, a stripping rotor to which the combs are mounted, a hood with a nose, followed by a conveying system. This is composed by a cochlea, that pushes the material up in the squared conveying channel. Finally, a mechanic system moves the cereals to the loading area. When the loading area is filled up, the material is unloaded using a hydraulic mechanism.
Figure 2 Stripping comb stripper head and conveying system (mechanic)
During the harvesting process, the tracked vehicle has operated using a hoist to minimize
the risk of overturning due to the terrain steepness. The hoist has been adopted for both the routes: on the way down, when the stripper was on harvesting mode, and on the way up, when no operations were carried on.
Experimental Methods Field productivity The main goal for the field productivity assessment is the characterization of the farmland
in terms of cereal production yield. Before the harvesting process, five biomass samples were randomly collected from the barley field throwing a cylinder section 4 cm long with a radius of 31 cm. This cylinder identified the Sample Area (SA). The whole biomass inside the cylinder (cereal and weed) was removed and properly stored in paper bags (Fig. 3).
Figure 3 A sampling phase: collection of the biomass used for the estimation of the total field production
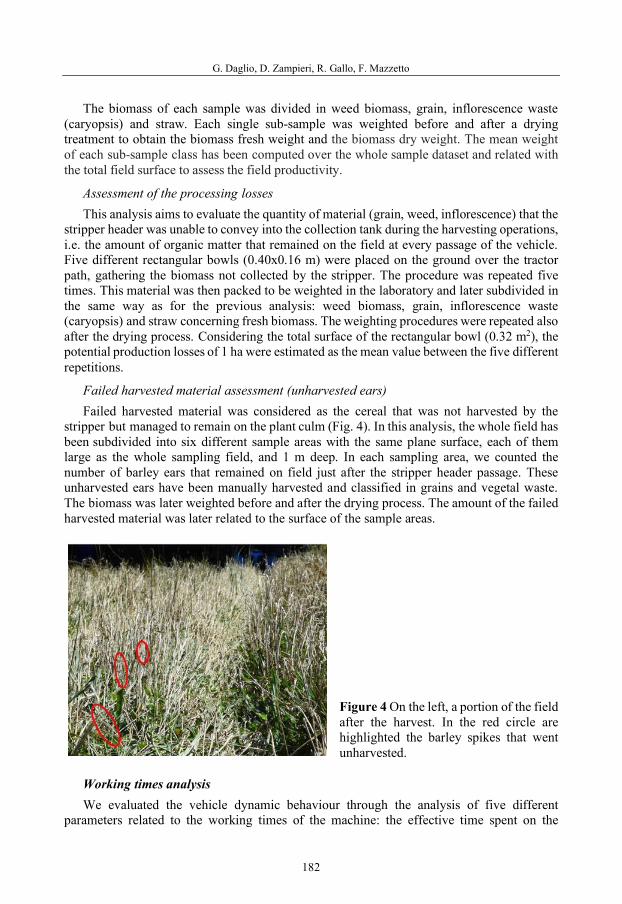
G. Daglio, D. Zampieri, R. Gallo, F. Mazzetto
182
The biomass of each sample was divided in weed biomass, grain, inflorescence waste (caryopsis) and straw. Each single sub-sample was weighted before and after a drying treatment to obtain the biomass fresh weight and the biomass dry weight. The mean weight of each sub-sample class has been computed over the whole sample dataset and related with the total field surface to assess the field productivity.
Assessment of the processing losses This analysis aims to evaluate the quantity of material (grain, weed, inflorescence) that the
stripper header was unable to convey into the collection tank during the harvesting operations, i.e. the amount of organic matter that remained on the field at every passage of the vehicle. Five different rectangular bowls (0.40x0.16 m) were placed on the ground over the tractor path, gathering the biomass not collected by the stripper. The procedure was repeated five times. This material was then packed to be weighted in the laboratory and later subdivided in the same way as for the previous analysis: weed biomass, grain, inflorescence waste (caryopsis) and straw concerning fresh biomass. The weighting procedures were repeated also after the drying process. Considering the total surface of the rectangular bowl (0.32 m2), the potential production losses of 1 ha were estimated as the mean value between the five different repetitions.
Failed harvested material assessment (unharvested ears) Failed harvested material was considered as the cereal that was not harvested by the
stripper but managed to remain on the plant culm (Fig. 4). In this analysis, the whole field has been subdivided into six different sample areas with the same plane surface, each of them large as the whole sampling field, and 1 m deep. In each sampling area, we counted the number of barley ears that remained on field just after the stripper header passage. These unharvested ears have been manually harvested and classified in grains and vegetal waste. The biomass was later weighted before and after the drying process. The amount of the failed harvested material was later related to the surface of the sample areas.
Figure 4 On the left, a portion of the field after the harvest. In the red circle are highlighted the barley spikes that went unharvested.
Working times analysis We evaluated the vehicle dynamic behaviour through the analysis of five different
parameters related to the working times of the machine: the effective time spent on the

New solution to harvest cereals in high mountain-alpine region: first test with a stripper machine
183
harvesting, the residual time spent on the way back, the unloading and the operation, the effective work capacity, machine dynamic characteristics, and the information of single movements. To monitor these parameters, the tracked vehicle has been equipped with a GNSS receiver that allowed for computing the instantaneous speed between two consecutive points, the distance between a point and a known straight line, and the ride direction. All the information gathered through the GNSS receiver has been imported on a GIS for a graphic representation.
Thanks to the application of a GNSS antenna (acquisition frequency equal to 3 s) on the tractor, it was possible to record the position of the vehicle during all the operation phases, and to associate the recorded position to the corresponding time step. In general, the phases of the process can be divided into static (unloading) and dynamic (effective harvesting phase, and accessory phase, composed by return phase and maneuver phase).
Raw data processing The processing of the data was subdivided in four different steps: - Point to point distance: At first, an arbitrary straight line positioned outside the barley
field was defined. This line served as the reference line to compute the distance of every single point of the route. Once known the distance between the points and the line, the distance between each two consecutive points was calculated.
- Recognition of the work phases and analysis of the work time: Using the computed distances, it was possible to recognize four different stages for every working cycle, two kinematic stages (machine travels) and two semi-static stages (machine positioning and unloading) (Fig. 5). This first classification allowed for defining the working time for each stage.
Figure 5 Theoretical representation of the work phases. The difference in the times recognized at the beginning and at the end of the elementary phases defines the time elapsed for its execution. Phases 1,3 and 2,4 refer to kinematic and static activities respectively.
- Recognition of the effective and the accessory phases: The effective phases concerns
the operations for which the stripper header has been developed (harvesting), whether the accessory phases are the one necessary to carry out the effective phases (return way, unloading, machine positioning). After these calculations, was possible to recognize the total distance travelled and the average speed sustained during movement for each phase.
G. Daglio, D. Zampieri, R. Gallo, F. Mazzetto
184
- Analysis and estimation of the areas covered during the harvest operations: using a GIS software, the route points (effective and accessory) have been converted to polylines obtaining the linear routes. Finally, the area over which the harvesting was carried on was computed using a geoprocessing tool
RESULTS AND DISCUSSION
Field productivity In this study was possible to estimate a productivity of 381 kg and 333 kg of fresh and dry
barley grain, referred to a field surface equal to 0.15 ha. The yield was therefore evaluated in 2.5 t/ha and 2.2 t/ha for fresh and dry barley grain, respectively.
Processing losses Considering the amount of material collected in the boxes (0.064 m2 of plain surface)
positioned along the stripper route, it was possible to calculate the losses. Considering the whole field surface, we estimated 84 kg and 72 kg of fresh and dry barley left on the field, corresponding to 0.56 t/ha and 0.48 t/ha. This means that the stripper has not been able to collect 22% of the total field productivity, although this material has been correctly stripped.
Failed harvested material The second type of losses is defined as the amount of cereal that the stripper header was
not able to tear off during the harvesting phase. An amount of 7.95 kg and 7 kg of fresh and dry barley grain was measured as left over the test field. The losses caused by the failed harvesting were then quantified as 0.053 t/ha and 0.04 t/ha for fresh and dry barley grain respectively.
Working times Point to point distance After measuring the distance between each GNSS point and the reference line, it was
possible to calculate the distance between each two consecutive points, by means of an arithmetic difference. The data were filtered by applying the moving mean to remove the spikes that were caused by holes in the signal. The point-to-point distance was smaller during the beginning and the end of the effective operations and the positioning of the vehicle, as they were carried out slowly, while during the accessory and return operations the distance was greater due to the higher forward speed. On average, the point to point distance was about 1 m for the effective operations, while for the accessory operations it was measured in about 3 m.
Time analysis and working phases identification Every threshing working phase can be considered as a set of the following elementary
operations: - Harvesting travel; - Unload; - Unloaded comeback travel; - Positioning.

New solution to harvest cereals in high mountain-alpine region: first test with a stripper machine
185
Every phase was considered as the product between the GNSS receiver position in a reference point and the time between two consecutive acquisitions. Figure 6 shows the working phases surveys during the morning and the afternoon in the harvesting day.
Figure 6 Recognition of the work phases considering the morning and afternoon route
separately The table 1 shows the results of the work phase measurements obtained by the GNSS
device mounted on the tractor and plotted according to the work session time (morning or afternoon). Due to signal drops, it was not possible to record all the working steps.
Table 1 Summary of the analysis of the effective working time
Morning Afternoon
Phase 1 2 3 4 5 6 7 8 9 10 11 12 13 14 15 16 17 18
Time(min) 8.6 9.2 8.0 9.3 8.4 8.2 / 5.3 6.0 6.3 5.0 5.3 5.0 5.2 4.9 5.3 / /
Effective working phases identification The cinematic behaviour of the vehicle has been studied using the working phases
identification. During each harvesting phase, the vehicle travelled a mean distance of 63.2 m with a mean velocity of 0.16 m/s.
Considering only the accessory phases, the distance covered by the tractor has been a little longer, around 81.0 m with greater velocity (0.31 m/s).
The differences between the effective and accessory operations in terms of distance assessment is given by the return travel for vehicle positioning at the beginning of the harvest. During the harvesting operations, the tractor was moving forward at the most appropriate operating speed, while the accessory phases and the return journey are carried at higher speeds.

G. Daglio, D. Zampieri, R. Gallo, F. Mazzetto
186
Identification of working area The analysis shows that the machine has processed about 80% of the entire field surface.
This deficit is due to the lack of part of the track recordings due to the poor quality of the signal that did not allow to track the vehicle route. The average area worked at each single pass is equal to 85.9 m².
On average, the tractor with the stripper head is capable to work 0.082 ha/h. The data is compared with the actual working capacity, calculated knowing the total area of the field (0.15 ha) and the actual time taken for harvesting measured manually (1.8 h). This comparison shows that the effective working capacity estimated by the data collected is only 1x10⁻³ ha/h smaller. Therefore, it is possible to state that the data gathered are in line with the reality.
Using a GIS software has been possible to convert the single points into polylines that define every single harvesting track.
Through a buffer of 1.35 m (that is the actual width processed by the stripper header) around the polylines, we obtained a polygon representing the surface area worked by the machine at every single harvesting passage.
CONCLUSION
In this work we are presenting a field test on a stripper head prototype for barley harvesting, which has been mounted on a tracked vehicle. For this reason, a series of analysis has been carried out to characterize the field itself and better understand the performance of the stripper header. At first, we gathered samples from the barley farmland to deduce field productivity, that has been estimated in 2.5 t/ha of fresh product, equal to 2.2 t/ha of dried barley. After the harvesting, other samples have been collected in the field to assess total production losses, estimated in 0.61 t/ha of fresh cereal (0.35 t/ha considering the dried product). These losses are attributed to harvest losses for 92% and for 8% to the barley that has not been stripped by the header.
Furthermore, a GNSS receiver has been mounted on the vehicle to collect georeferenced data, that has been later analysed through a GIS software to characterize the cinematic behaviour of the machine. We estimated the effective working capacity of the machine during the harvesting process in 0.1 ha/h, travelling at a mean velocity of 0.16 m/s and considering a working width of 1.35 m.
REFERENCES
Bachmann, F., Maharjan, A., Thieme, S., Fleiner R., and. Wymann von Dach, S. (2019). Migration and Sustainable Mountain Development: Turing Challenges into Opportunities. Bern, Switzerland, Centre for Development and Environment (CDE), University of Bern, with Bern Open Publishing (BOP). pp 72.
Chegini, G. R. (2013). Determine of Optimum Operating Conditions of Combine Harvester with Stripper-Header. World Appl. Sci. J. 23 (10):1399–1407.
Chegini, G., Mirnezami., S.V. (2016). Experimental Comparison of Combine Performance with Two Harvesting Methods: Stripper Header and Conventional Header. Agricultural Engineering International: CIGR Journal 18 (1):192–200.

New solution to harvest cereals in high mountain-alpine region: first test with a stripper machine
187
Walter, F., Barbera, F., Bartolucci, Luigi., Felizia T., Focanti, F. (2020). Developing Intermediate Machines for High-Land Agriculture. Development Engineering 5:100050.
Ichniarsyah, A. N., Erniati. (2020). The Role of Mechanization in Agricultural Development on Border Areas. IOP Conference Series: Earth and Environmental Science 542(1).
Klima, K., Kliszcz, A., Puła, J., Lepiarczyk, A., (2020). Yield and Profitability of Crop Production in Mountain Less Favoured Areas. Agronomy 10(5).
Sabrina, M., Brozzi, R., Cervellieri, A., Desaler, T., Gallo, R., Gamper, J., Geier, B., Holzner, L., Sacco P., Mazzetto. F. (2020). Brotweg—A Path of Bread in an Alpine Environment: New Mechanical Solutions for Grain Processing in Steep Mountain Slopes. Vol. 67. In: Innovative Biosystems Engineering for Sustainable Agriculture, Forestry and Food.
Tricase, C., Lamonaca E., Ingrao, C., Bacenetti, J., Lo Giudice, A. (2018). A Comparative Life Cycle Assessment between Organic and Conventional Barley Cultivation for Sustainable Agriculture Pathways. Journal of Cleaner Production 172:3747–59.

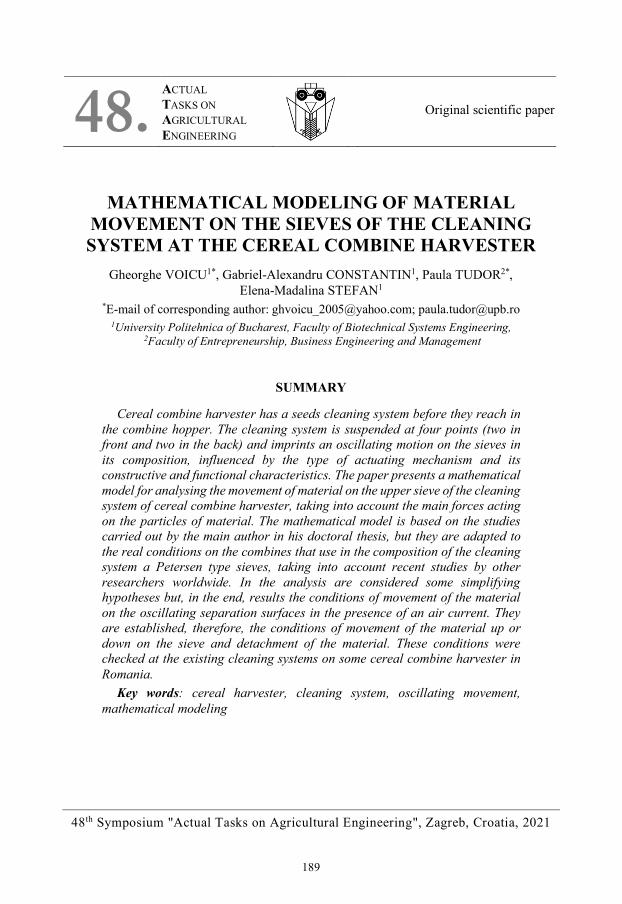
48th Symposium "Actual Tasks on Agricultural Engineering", Zagreb, Croatia, 2021
189
MATHEMATICAL MODELING OF MATERIAL MOVEMENT ON THE SIEVES OF THE CLEANING SYSTEM AT THE CEREAL COMBINE HARVESTER
Gheorghe VOICU1*, Gabriel-Alexandru CONSTANTIN1, Paula TUDOR2*, Elena-Madalina STEFAN1
*E-mail of corresponding author: [email protected]; [email protected] 1University Politehnica of Bucharest, Faculty of Biotechnical Systems Engineering,
2Faculty of Entrepreneurship, Business Engineering and Management
SUMMARY
Cereal combine harvester has a seeds cleaning system before they reach in the combine hopper. The cleaning system is suspended at four points (two in front and two in the back) and imprints an oscillating motion on the sieves in its composition, influenced by the type of actuating mechanism and its constructive and functional characteristics. The paper presents a mathematical model for analysing the movement of material on the upper sieve of the cleaning system of cereal combine harvester, taking into account the main forces acting on the particles of material. The mathematical model is based on the studies carried out by the main author in his doctoral thesis, but they are adapted to the real conditions on the combines that use in the composition of the cleaning system a Petersen type sieves, taking into account recent studies by other researchers worldwide. In the analysis are considered some simplifying hypotheses but, in the end, results the conditions of movement of the material on the oscillating separation surfaces in the presence of an air current. They are established, therefore, the conditions of movement of the material up or down on the sieve and detachment of the material. These conditions were checked at the existing cleaning systems on some cereal combine harvester in Romania.
Key words: cereal harvester, cleaning system, oscillating movement, mathematical modeling
48. ACTUAL TASKS ON AGRICULTURAL ENGINEERING
Original scientific paper

Gh. Voicu, G-A. Constantin, P. Tudor, E-M. Stefan
190
INTRODUCTION
The movement of oscillating systems is of particular importance in the work process when it comes to separating impurities from the mass of harvested grain or when dealing with oscillating conveyors for granular materials. But the oscillations and vibrations of these systems have a negative impact on the structure of the system if elastic elements are not used to insulate the structure. Therefore, vibrations can have both a positive impact, as well as a negative one, in the operation of specific equipment used in agriculture and the food industry, but also other branches of activity (Xu et al., 2019; Tang et. al., 2018, Kailash and Himanshu, 2017, Lawinska and Modrzewski, 2017).
Frames with sieve of combine harvester or seed cleaning equipment have a series of mechanisms with eccentric or unbalanced rotating masses (Moise et al., 2008).
By establishing a vibration pattern for the sieve frame of a cleaning equipment, it can be seen that additional vibrations may occur during the movement of the system and a certain difference between the natural frequency and the frequency of vibrations induced by the actuating mechanism (Peng et al., 2019; Stoicovici et al., 2009).
To find a reasonable set of parameters that can lead to the performance of a screening equipment (kinematic, dynamic, technological, energetic), it is essential to configure the vibration equations of the vibrating sieve. The second step is to determine the equation of motion of the sieve, performing the simulation and discussing the effect of the position of the actuating system on the sieve oscillation (Nguyen et al., 2019; Stoicovici et al., 2009). More, vibrations lead to the stratification of the material on the separation sieves, which is a beneficial process for the cleaning system of straw grain combine harvesters or for cleaning equipment in milling units (Delaney et al., 2009; Voicu et al., 2018).
At combine harvesters, the separation of the seeds on the sieves of the cleaning system takes place under the effect of the relative movement of the layer on the surface of the sieve, imprinted by its oscillation, but also the air flow coming from the main fan of the system. The character of the relative movement of the material on the sieve surface, in the presence of air current, depends on: the kinematic regime of the sieve (frequency and amplitude of oscillations); the angle of the sieve with the horizontal α; the angle of the oscillation direction of the sieve δ; the friction angle of the material with the sieve; speed and direction of air flow, va, respectively the angle β; properties of material particles (dimensions, density, individual mass, coefficient of aerodynamic resistance etc.) (Voicu et al, 2007; Nguyen et al., 2019). The values of these parameters can cause the particle to rest relative to the sieve or move up or down on the sieve, with or without detachment.
Theoretical and experimental data (Voicu et al., 2007) with regard to the relative displacement of the layer on the sieve shows that an efficient separation of the seeds through the orifices of the sieve takes place when the material is provided with a relative movement in both directions on the sieving surface prone to detachment and a resulting displacement movement to the opposite end of the sieve feed.
In addition to the forces directly applied to an individual particle on the separating surface with oscillating motion and the connecting ones, generally known: weight force (mg), force of inertia (Fi), normal surface reaction (N), friction force (Ff), Coriolis force (Fc)was also considered in the analysis of particle motion, but also the force with which the air current is

Mathematical modeling of material movement on the sieves of the cleaning system at the cereal combine harvester
191
applied under the sieve by the fan of the cleaning system on the material (Fa) - aerodynamic force (Voicu et al., 2007; Moise et al., 2008; Gebrehiwot et al., 2010; Korn et al., 2013.
Relative displacement of layer components (the mixture of seeds and other materials), which reaches the cleaning system of the combine, it depends so much on the movement of the separating surfaces, as well as the constructive and functional parameters of these surfaces.
The present paper aims to bring some additions on the mathematical model for analysing the movement of material on the upper Petersen type sieve of the cleaning system of the grain harvesters subjected to the simultaneous action of the sieve oscillations, by taking into account the inclination of the sieve slats and the aerodynamic force of the inclined upward airflow passing through the sieve orifices and the material layer, especially important by its distribution along the length of the sieve, but also through the direction it takes with the sieve plan.
MATERIALS AND METHODS
Frame with sieves from the composition of the seed cleaning system of the grain combine is suspended on an articulated quadrilateral mechanism and is actuated in oscillating motion by a connecting rod - crank - rocker mechanism, as shown schematically in figure 1.
Figure 1 Oscillating system for cleaning seeds in straw grain combine harvesters
(Voicu et al., 2007) Under the influence of the actuating mechanism, through its constructive and functional
parameters, the various situations that occur in the configuration of the forces acting on a particle, for positions corresponding to a complete rotation of the drive mechanism crank for the sieve frame, are synthesized in fig.2, in which the corresponding direction of the acceleration of the sieve was also represented (Voicu et al., 2007).
The two main forces, the inertia force Fi and the force Coriolis Fc, change their value and direction during a complete rotation of the crank, but also along the sieve (from one end to the other) (Voicu et al., 2007; Moise et al., 2008). For the aerodynamic force Fa (eq 1), a hyperbolic distribution along the sieve was considered, independent by the operating mechanism rotation angle of the sieve block.

Gh. Voicu, G-A. Constantin, P. Tudor, E-M. Stefan
192
a. Fi in quadrant III (δ ∈ [0, π/2]); b. Fi in quadrant IV (δ ∈ [π/2, π]); c. Fi in quadrant I (δ ∈ [π, 3π/2]); d. Fi in quadrant II (δ ∈ [3π/2, 2π])
Figure 2 The configuration of forces on a particle in its relative motion relative to the sieve (Voicu et al., 2007)
However, the aerodynamic force Fa depends on the dimension of the sieve openings, as
the upper sieve of the combine's cleaning system has adjustable openings (Zewdu, 2007; Korn et al., 2010; Gebrehiwot et al., 2013; Shahbazi et al., 2014):
𝐹𝐹𝑎𝑎 =34 ξ
ρ𝑎𝑎υ𝑚𝑚ρ𝑣𝑣𝑎𝑎3
𝑅𝑅𝑅𝑅 (1)
in which: ξ is a global coefficient of aerodynamic resistance; Re – Reynolds number; ρa, υ – density, respective, the kinematic viscosity of the air (υ = 15.1⋅10-6 m2 s-1, at 20oC); va – air velocity; m, ρ - mass, respectively, particle density.
Analysis of the relative motion of particles on the surface of the sieves of the cleaning system, can be done, therefore, only on distinct quadrants, depending on the position of the force support Fi, which is the main force acting on the particles.
In paper (Voicu et al., 2007) the conditions for the movement of the material on the surface of the sieves are presented taking into account the most important forces acting on the particles on the sieve and giving a more accurate description of their movement on the separation surface.
Our mathematical model proposes to take into account the Coriolis force Fc and establishing the movement conditions of the material according to the constructive and

Mathematical modeling of material movement on the sieves of the cleaning system at the cereal combine harvester
193
functional parameters of the sieve actuation mechanism, by the coefficient of friction of the material with sieve ϕ and the size and direction of the aerodynamic force Fa.
For the convenient expression of mathematical relations, all forces acting on the particle have been transformed into specific forces, by relating them to the mass of the particle.
a) For the configuration of the forces on the particle from fig.2a, when δ < π/2, the tendency
of the material to move is down on the sieve, with reduced possibility of detachment because the normal component of the inertial force Fin it is directed under the sieve. In order to make the downward movement on the surface of the sieve blade, the condition must be met:
𝐹𝐹𝑖𝑖𝑠𝑠(𝑗𝑗) > 𝑔𝑔𝑠𝑠𝑠𝑠𝑠𝑠(ϕ− α− α ′)𝑐𝑐𝑐𝑐𝑠𝑠(δ − α ′ + ϕ) +
𝐹𝐹𝑎𝑎𝑚𝑚𝑐𝑐𝑐𝑐𝑠𝑠(β − α ′ + ϕ)𝑐𝑐𝑐𝑐𝑠𝑠(δ− α ′+ ϕ) +
𝐹𝐹𝑐𝑐𝑚𝑚
𝑠𝑠𝑠𝑠𝑠𝑠(α ′ − ϕ)𝑐𝑐𝑐𝑐𝑠𝑠(δ − α ′ + ϕ) (2)
where Fis represents the specific force of inertia (Fi/m) (in m s-2), which actually means
sieve acceleration (or of point on the sieve where the material particle is at any given time). Fi
s(j) represents the condition of relative movement of the material particle down on the sieve. Detachment of the particle from the sieve surface (N = 0) it can be achieved theoretically
when the condition is met:
𝐹𝐹𝑖𝑖𝑠𝑠(𝑗𝑗, 𝑑𝑑) <𝐹𝐹𝑎𝑎𝑚𝑚𝑠𝑠𝑠𝑠𝑠𝑠(β− α ′)𝑠𝑠𝑠𝑠𝑠𝑠(δ− α ′) +
𝐹𝐹𝑐𝑐𝑚𝑚
𝑐𝑐𝑐𝑐𝑠𝑠(α ′)𝑠𝑠𝑠𝑠𝑠𝑠(δ − α ′)− 𝑔𝑔
𝑐𝑐𝑐𝑐𝑠𝑠(α+ α ′)𝑠𝑠𝑠𝑠𝑠𝑠(δ − α ′) (3)
condition that, for δ < π/2, it is not realized because Fin it is directed under the sieve, and its value is, in general, bigger than Fa⋅sinβ , from which it follows that the movement takes place, in this case, without detachment.
b) For the angle δ ∈ (3π/2, 2π) (when the accelerator support is in quadrant IV), the
configuration of the forces on the particle in relative motion looks like in fig.2d and also corresponds to its downward displacement (Fit < 0 and Fin > 0). Proceeding in analogy with the other case analysed, the same condition is obtained for the displacement of the particle on the sieve surface as for the angle δ in quadrant I (eq. 2 and 3), but in this case the possibility of detachment of the particle from the surface of the sieve is more obvious, because the force of inertia is directed above the sieve (Fin > 0).
c) For crank positions leading to angles δ of the sieve acceleration support between π/2
and π, the configuration of the forces on the particle in relative motion to the sieve is that of fig.2b. In this situation, the movement trend is up on the sieve (Fit > 0), the possibility of detachment being extremely low (Fin < 0), and the condition of the existence of motion is:
𝐹𝐹𝑖𝑖𝑠𝑠(𝑠𝑠) >𝐹𝐹𝑎𝑎𝑚𝑚𝑐𝑐𝑐𝑐𝑠𝑠(β− α ′ − ϕ)𝑐𝑐𝑐𝑐𝑠𝑠(δ − α ′ − ϕ) − 𝑔𝑔
𝑠𝑠𝑠𝑠𝑠𝑠(ϕ + α + α ′)𝑐𝑐𝑐𝑐𝑠𝑠(δ− α ′ − ϕ) −
𝐹𝐹𝑐𝑐𝑚𝑚
𝑠𝑠𝑠𝑠𝑠𝑠(α ′ + ϕ)𝑐𝑐𝑐𝑐𝑠𝑠(δ− α ′ − ϕ) (4)
which is the condition of the movement of the material upwards on the sieve.

Gh. Voicu, G-A. Constantin, P. Tudor, E-M. Stefan
194
The condition of detachment of particles from the surface of the sieve is given by the relation:
𝐹𝐹𝑖𝑖𝑠𝑠(𝑠𝑠, 𝑑𝑑) <𝐹𝐹𝑎𝑎𝑚𝑚𝑠𝑠𝑠𝑠𝑠𝑠(β − α ′)𝑠𝑠𝑠𝑠𝑠𝑠(δ− α ′) −
𝐹𝐹𝑐𝑐𝑚𝑚
𝑐𝑐𝑐𝑐𝑠𝑠(α ′)𝑠𝑠𝑠𝑠𝑠𝑠(δ − α ′) − 𝑔𝑔
𝑐𝑐𝑐𝑐𝑠𝑠(α + α ′)𝑠𝑠𝑠𝑠𝑠𝑠(δ− α ′) (5)
which, as in the previous case, usually, it is not realized (Fi being directed under the sieve), which involves a movement without detachment of the material.
d) If the angle of support of the sieve acceleration δ is in quadrant III (π,3π/2) the
configuration of the forces acting on the particle is that of fig.2,c (cu Fin > 0 and Fit > 0), which implies a tendency of the material to move upwards on the sieve, and after performing force projections, in the direction of the sieve and in the direction perpendicular to it, and performing the calculations, the condition of the particle displacement is obtained, same as for the configuration of the forces in fig.2,b.
In this situation, however, the possibility of the particle detaching from the surface of the sieve is more obvious (Fin > 0), when the condition (5) is met.
Eq. (2) and (4), which represents the conditions of motion of the particles on the surface of the sieve (downward or upward), respective eq. (3) and (5), which represent the conditions of detachment of particles from the surface of the sieve, were obtained for where the angular velocity of the sieve ωs has positive value (the direction of rotation of the crank to the left).
If the angular velocity from the sieve transport movement ωs has a negative value (direction of rotation to the right) configuration of forces on the particle, for all positions of the crank of the actuator corresponding to a complete rotation, it changes by changing the direction of the Coriolis force, so that in the previously established equations it will appear with the sign (–).
The research showed that that the angular velocity of the plane-parallel motion of the sieve has very small values (0.1-0.3 s–1), so that the Coriolis force can be neglected, it being much smaller compared to the other forces acting on the particles (Voicu et al., 2007). The angles ϕi, from fig.1, are the angles in the calculation model applied in the computer program, each of the angles ϕ2,..,4 depending on the position of the actuating mechanism OA, ϕ1.
To demonstrate the influence of air flow on the movement of the material on the sieve, experimental determinations were performed under the same conditions, namely: oscillation frequency 280 osc. min-1, orifices opening 9 mm (measured perpendicularly between the general plane of the sieve and the upper edge of a blind), for a time of seed collection under the sieve of 6 seconds, in boxes arranged at intervals of 0.15 m (the other parameters being those mentioned above).
The main characteristics of the material used in the experiments were: bulk density of seeds 775-800 kg m-3; mass of 1000 seeds 38.6-43.5 g; seed moisture 11.3-12.5%; bulk density of straw components 62.3-65.9 kg m-3; straw part / seed ratio pp/s 0.23. It should be mentioned that tests were carried out in nominal loading of the sieve, that is, after the sieve has been filled with material from one end to the other.

Mathematical modeling of material movement on the sieves of the cleaning system at the cereal combine harvester
195
RESULTS AND DISCUSSION
Using eq. (2) – (5) the relative movement of the material on the upper sieve of the cleaning system can be determined, in the presence of air current.
Research carried out on an experimental installation with the characteristics of the drive system (fig.1): OA=35 mm; AB=728 mm; O1B=150 mm; O1C=90 mm; α/γ=35/145o; CD=1158 mm; O2D=110 mm; ψ=28.5o; θ=-9.35o; Ls=1200 mm; αs=7o, α’=15o (the angle of the Petersen sieve blinds), ϕ=20o, β=20o, va=10 m s-1, eq.(2) and (4) are met at all points on the sieve, for oscillation frequencies from 240-335 rpm, which means that the relative movement in both directions on the surface of the sieve is ensured, for all crank positions in a complete rotation (table 1). Regarding the detachment of particles on the sieve, it is found that the eq. (5) it is not fulfilled for any characteristic position of the crank, at no point along the length of the sieve, which assumes that the movement of the material takes place without detachment, if the aerodynamic force of the airflow is not taken into account.
Table 1 The forces values related to the angle of the eccentric from the driving mechanism,
for an oscillating frequency at 280 osc min-1 (in units of force relative to mass)
Angle ϕ1
Sieve initial point Sieve midpoint Sieve endpoint Fi Fa Ft Fn Fi Fa Ft Fn Fi Fa Ft Fn
0 17.38
15.81
28.91 -4.78 17.13
2.11
15.10 -6.59 16.90
1.45
14.29 -7.25 30 15.15 26.87 -6.51 15.03 13.12 -8.06 14.92 12.37 -8.48 60 9.96 21.42 -9.97 9.96 7.80 -11.06 9.96 7.17 -11.01 90 4.41 12.97 -11.82 4.06 -0.57 -12.61 3.73 -1.12 -12.28
120 8.91 3.05 -9.50 8.77 -10.51 -10.38 8.63 -11.09 -10.12 150 16.86 -4.79 -4.34 16.86 -18.45 -5.57 16.86 -19.12 -5.66 180 19.90 -7.27 -1.74 19.89 -20.98 -3.17 19.89 -21.70 -3.48 210 16.07 -4.03 -4.58 16.07 -17.69 -5.80 16.07 -18.35 -5.88 240 8.69 3.26 -9.44 8.55 -10.30 -10.32 8.41 -10.87 -10.07 270 4.20 12.47 -11.72 3.84 -1.07 -12.52 3.48 -1.62 -12.18 300 9.71 21.15 -10.03 9.71 7.54 -11.11 9.72 6.91 -11.05 330 15.32 27.04 -6.51 15.20 13.30 -8.07 15.09 12.54 -8.49 360 17.38 28.91 -4.78 17.13 15.10 -6.59 16.90 14.28 -7.25
Figure 3 shows the variation of the forces acting on the material on the sieve, taking into
account the air flow made by the fan under the sieve, but with a hyperbolic distribution of its speed along the length of the sieve, at an oscillation frequency of the mechanism of 280 osc min-1.
The figure shows the areas where the material can move up or down on the sieve or if it is at rest relative to the sieve (for a friction angle of 20o).
It is found that the tangential forces on the material particles are much higher at the front end of the sieve, compared to its middle and posterior end, especially due to the hyperbolic distribution of airflow velocity. It is therefore particularly important to create a relatively uniform distribution of the air flow under the sieve so that the chaff particles and the straw

Gh. Voicu, G-A. Constantin, P. Tudor, E-M. Stefan
196
components of the layer can be effectively discharged. On the other hand, a higher air force at the beginning of the sieve is important, both for blowing the straw parts of the grain mixture when it falls from the oscillating conveyor on the top sieve of the cleaning system, as well as for the immediate stratification of the layer on the sieve surface, in order to properly separate the cereal seeds through the sieve orifices.
Figure 3 Variation of the inertial forces acting on the material along the sieve surface, at each end and in the middle of the sieve (the friction cone for a 20o angle),
in units of force reported at units of mass (uf/um)
The upward movement on the sieve is important for the material remaining on the sieve to be discharged at its rear end, instead the downward movement on the sieve is important for cereal seeds that have to pass through the vertical holes of the Petersen sieve blinds (as seen in the schemes from fig.2).
The data obtained in the experiments are presented in Table 2.
Table 2 Distribution of the separated seeds along sieve length, at 280 osc min-1
va, m⋅s-1
The middle of the sieve interval from where the seeds are collected (m) Over sieve 0.075 0.225 0.375 0.525 0.675 0.825 0.975 1.125
0 44.7 30.4 15.3 4.8 2.1 1.7 0.9 0.1 0 5.2 6.7 18 28.7 21.3 14 5.2 3.4 2.4 0.3 8 1.0 3.0 10.6 15.6 20 20.8 19.7 7.1 2.2
10 2.4 4.5 7.2 8.1 12.5 19.4 19.6 20.8 5.5 8* 0.5 1.05 1.4 1.7 2.2 1.9 1.2 0.1 0.05
* without the operation of the drive mechanism

Mathematical modeling of material movement on the sieves of the cleaning system at the cereal combine harvester
197
Figure 4 The influence of air velocity on wheat seed separation
at an oscillation frequency of 280 osc. min-1
The chart in figure 4 shows, one more time, how important is the airflow under the sieve,
not only in the separation of the straw parts from the grain mixture, but also in the movement of the material along the sieve. If the cleaning system fan does not work, the material will agglomerate and separate on the first half of the sieve, instead, at higher and faster air speeds, the material also moves along the length of the sieve, and the maximum collection point moves to the rear end.
If the actuator does not work, the material arriving from the oscillating conveyor only a small part falls on the sieve, mostly falling into the space between the fan mouth and the sieve frame or even in the fan exhaust window, which further worsens the operation. It is therefore understandable that both components of the cleaning system, both the frame with oscillating moving sieve, as well as the fan that directs the air flow under the sieve, have a very decisive role in the operation of the system and therefore of the separation of the seeds from the layer that arrives from the threshing machine of the combine, via the oscillating layer conveyor.
CONCLUSIONS
In the analysis of the relative motion of the material on the sieve with oscillating motion, the forces of inertia acting on it must be taken into account, with their normal and tangential components to the sieve, as well as the aerodynamic force of the air current if a prediction as close as possible to the reality of the motion and the conditions to be met for the existence of the relative motion is desired.
All the research undertaken demonstrates that the actuating mechanism of the sieve frame influences the dynamics of the material movement on the sieve surface through its constructive and functional characteristics. Particularly important is the size and direction of the speed of the air that passes through the orifices of the sieve and which gives the size of the aerodynamic force acting on the material. This is done by properly adjusting the fan speed and airflow damper to the cleaning system sieve.
The analysis shows that the movement of particles on the screen surface of the combine cleaning system using a connecting rod - crank - rocker drive mechanism it is made in both
0
5
10
15
20
25
30
35
40
45
50
0 0.2 0.4 0.6 0.8 1 1.2 1.4Sepa
rate
d se
eds u
nder
the
sieve
(%)
Collection points along the length of the sieve (m)
va = 0 m/s va = 5.2 m/sva = 8 m/s va = 10 m/s

Gh. Voicu, G-A. Constantin, P. Tudor, E-M. Stefan
198
directions on the sieve, usually without detachment, predominantly upwards, at the front end, and further down to the rear end, which means that the separation process intensifies as the material is transported for disposal. Furthermore, the downward movement on the sieve is also attenuated by the existence of steps that are on its surface, formed by the sieve blades themselves, the material remaining on the sieve gaining, still, a resulting movement towards its posterior end.
To determine the type of movement of the material on the upper sieve of the cleaning system of a combine harvester, when its constructive and functional characteristics are known, the relationships presented in this paper can be used successfully.
ACKNOWLEDGEMENT
The work has been funded by Ministry of National Education and Research through the Executive Agency for Higher Education, Research, Development and Innovation Funding, within the project entitled "Sustainable development of the base of agro-mechanical applications in gardens, solariums, vineyards and orchards (DEZDURPRA)", CNFIS-FDI-2020-0184.
REFERENCES
Delaney G.W., Cleary P.W., Hilden M., Morrison R.D. (2009). Validation of dem predictions of granular flow and separation efficiency for a horizontal laboratory scale wire mesh screen, Seventh Int. Conference on CFD in the Minerals and Process Industries, CSIRO, Melbourne, Australia, 6 pages.
Gebrehiwot M.G., De Baerdemaeker J., Baelmans M. (2010). Numerical and experimental study of a cross-flow fan for combine cleaning shoes, Biosystems Engineering, 106(4), p.448-457.
Kailash C. and Himanshu C. (2017), Optimum balancing of slider-crank mechanism using equimomental system of point-masses Department of Mechanical Engineering, Malaviya National Institute of Technology Jaipur, Jaipur, India
Korn C., Hübner R., Herlitzius T., Rüdiger F., Fröhlich J. (2013). Numerical study of air flow in a combine cleaning shoe, Landtechnik, 68 (2), p.83-88.
Lawinska K., Modrzewski R. (2017). Analysis of sieve holes blocking in a vibrating screen and a rotary and drum screen, Physicochemical Problems of Mineral Processing, 53(2), p.812−828.
Moise V., Voicu Gh., Maican E. (2008). Structural, kinematical and kinetostatic analysis of the cleaning system from cereal harvesters, Actual tasks on agricultural engineering, Opatija, Croatia, vol.36, p.221-232.
Nguyen V.X., Nguyen K.L., Dinh G.N. (2019). Study of the dynamics and analysis of the effect of the position of the vibration motor to the oscillation of vibrating screen, Journal of Physics: Conference Series, 1384, 012035.
Peng L., Feng H., Wang Z., Wang H., Yang H. (2019). Huang H., Screening mechanism and properties of a cantilevered vibrating sieve for particles processing, Applied Sciences, 9, p.4911.
Shahbazi F., Valizadeh S., Dowlatshah A. (2014). Aerodynamic properties of Makhobeli, triticale and wheat seeds, International Agrophysics, 28, p.389-394
Stoicovici D.I., Ungureanu M., Ungureanu N, Banica M. (2009). Computer model for sieves’ vibrations analysis, using an algorithm based on the false-position method, American Journal of Applied Sciences 6 (1): 48-56.

Mathematical modeling of material movement on the sieves of the cleaning system at the cereal combine harvester
199
Tang Z., Zhang H., and Y. Zhou (2018), Unbalanced vibration identification of tangential threshing cylinder induced by rice threshing process, Shock and Vibration, vol. 2018, Article ID 4708730, 14 pages
Voicu Gh., Toma M.L., Stefan E.M., Tudor P., Dutu M.F. (2018). Grain pile stratification process on sieves of harvester cleaning system, Actual Tasks on Agricultural Engineering, Opatija, Croatia, Vol.46, p.139-148.
Voicu Gh., Casandroiu T., Toma M.L. (2007). Predictions regarding the influence of the material movement along the sieve on seeds separation in cleaning systems from the cereal combine, Actual tasks on agricultural engineering, Opatija, Croatia, vol.35, p.155-166.
Xu L., Liang Z., Wei C., Chai X., Li Y. (2019). Vibration suppression and isolation for rapeseed grain cleaning loss sensor, Journal of Sensors, Article ID 6108297, 8 pages
Zewdu A.D. (2007). Aerodynamic properties of tef grain and straw material, Biosystems Engineering, 98: 304– 309.


48th Symposium "Actual Tasks on Agricultural Engineering", Zagreb, Croatia, 2021
201
GINGER PRODUCTION IN EUROPE AND ASIA – A COMPARISON OF CULTIVATION METHODS
Theresa ERTL*, Maximilian TREIBER, Heinz BERNHARDT * E-Mail of corresponding author: [email protected]
Technical University of Munich, Agricultural Systems Engineering, Dürnast 10, D-85354 Freising, Germany
ABSTRACT
Ginger is a valued spice crop, for which there is an increasing demand in Germany. While ginger is mainly produced in its countries of origin, such as India and Taiwan, recent trends, for example to consume regional food, leads us to consider how ginger can be produced in Germany, where the production knowledge is at an embryonic state at the moment.
Three qualitative case-studies investigated ginger production methods in India, Taiwan and Germany. Results from Indian and Taiwan show that ginger is a crop with high requirements. Furthermore, bank cultivation stood out as a main part of the cultivation process. In Germany, ginger is currently cultivated on open land, in unheated foil tunnels and in heated greenhouses, all under compliance of ecological regulations.
The results serve to compare ginger production in these countries and to estimate its potential in Germany as well as the possibility of mechanization in terms of production. Ultimately, a high level of knowledge and the fulfilment of the crop’s growing demand are necessary to produce ginger successfully in Germany.
Keywords: ginger, case-study, root crop, mechanization, knowledge transfer
INTRODUCTION
Consumer demands for a wide product range in the food sector increased in the last decades (Kearney, 2010). Therefore, imported goods such as ginger are an established product on the supermarket shelves (Hedrich and Rascher, 2018). For ginger in particular, there is an increasing demand in Germany, with a ginger import of nearly 23,000 tons in 2018 in contrast to 9,000 tons in 2010 (Statista, 2020). In the entirety of Europe, the import amount of ginger doubled from 2012 to 2018 (Eurostat, 2019).
48. ACTUAL TASKS ON AGRICULTURAL ENGINEERING
Preliminary communication

T. Ertl, M. Treiber, H. Bernhardt
202
In addition to a high demand for wide product range, a trend to consume regionally produced food is clearly visible (Seitz and Roosen, 2015). Because of this, many agricultural and horticultural firms have the possibility to diversify and increase their market opportunities (Steiner, 2011). Taking these points into account, the question of if and how ginger can be produced in Germany emerges. As ginger is an originally tropical crop, its establishment in a European country with a temperate seasonal climate provides various challenges. Hence, the conditions and cultivation methods under which ginger is produced in countries of origin, for example India or Taiwan, need to be considered. Although ginger is a long-standing cultivated crop, limited literature exists on this topic, with nearly no data found on ginger cultivation within humid European climates. Therefore, farmers and experimental stations need to research single production steps within the production process. The aim of this research, is to compare ginger production in between different countries, thus establishing starting points for knowledge transfer between them. Furthermore, this thesis estimates the potential of ginger production in Germany, including a focus on options for mechanization in terms of production.
MATERIALS AND METHODS
The purpose of this thesis is to provide a qualitative and exploratory analysis of ginger production methods in India, Taiwan and Germany, presented in three case-studies. Based on appointed parameters the entire cultivation process is examined. To optimally cover the full production process the examination starts with the chosen parameters of tillage and planting as well as the particular cropping system of bank cultivation. The essential parameters during the period of growth: fertilization, pest management, irrigation, and usage of mulch material as well as crop shading are incorporated. The final production process is displayed with the parameter harvesting process, post-harvest treatment and storage. Additionally, the options for further processing and marketing are covered. Finally, the challenges in ginger production are included. A comprehensive literature review provided preliminary information regarding country specific ginger production methods, and interviews with experts, e.g. production managers of the firms and experimental stations, supplied addition- al information about growing parameters. Furthermore, three farm visits in Taiwan as well as five in Germany allowed for a more in-depth understanding of local ginger production across sites. The emerging results serve to achieve a comparison of ginger production in the different countries, showing starting points for knowledge transfer between them. Further- more the thesis facilitates to estimate the potential of ginger production in Germany, as well as the possibility of mechanization in terms of production.
RESULTS AND DISCUSSION
As India is the world’s largest ginger producer and Taiwan has a long history of producing the plant, Asian ginger producing countries clearly exhibit a knowledge edge, while German ginger production remains in an embryonic state. Because of this, producers in Germany must look to Asia as a starting point for an international transfer of knowledge. Nevertheless, European further development and research within this field may also contribute essential findings that have the potential to fill gaps in current production methods, ultimately boosting the knowledge of ginger growing requirements on a global scale.

Ginger production in Europe and Asia – a comparison of cultivation methods
203
Essential findings of case-studies from India and Taiwan include information regarding the planting process, growing period, and the maturity of the harvested ginger, as well as the subsequent processing and storage opportunities. In both countries, pieces of root stalk material (rhizome) approximately 5cm and 30g, with at least one or two vital buds, are used as a planting material (Council of Agriculture Executive Yuan, 2005; Jayashree et al., 2016). Before planting, the rhizomes are mostly treated with a fungicide, to minimize the disease sensitivity of the plant (Jayashree et al. 2016; Chen, 2019). Planting time can occur from December to May, depending upon the production location, climate, as well as an aimed end-product maturity. In addition to direct planting there is also a recommendation to produce young plants in advance. Within this method, even smaller rhizome pieces are planted, decreasing the amount of needed production material and thus overall cost. Additionally, the options for environmental control during the plant’s young growing stage can increase the chances for a successful upbringing, and thus the quality of produced plant material. (Jayashree et al., 2016)
In Asian countries a distinction is made between “young” and “old” ginger. Young ginger is harvested after approximately 4-7 months of growing, at which the rhizome is not fully matured and has a soft skin. Due to this condition the storage time is very limited, resulting commonly in the direct processing of young ginger following harvest. (Tsai and Hsiao, 2011; Bag, 2018). Ginger beverages as well as ginger sweets or direct cooking use are just a few capabilities for young ginger (FAO, 2019; Jayashree ET AL., 2016). On the other hand, old ginger is characterized by a mature rhizome, with harder skin, more fibrous tissues, and an intensified taste, which tends to occur between approximately 8 to 12 months of growing. Furthermore, old ginger can be stored for a longer period of time (Tsai and Hsiao, 2011; Bag, 2018). This finding is essential, as it gives clear hint as to which kind of ginger can be produced in Germany in regard to existing vegetation period. The different end products can also influence the production process. This is depicted in the following section, covering the ginger cropping system in the examined Asian countries.
With regards to planting and field management, bank cultivation stands out as an important main part of the on-field production process in India as well as Taiwan. However, the method differs between the two countries. In India, rhizome pieces are planted in raised beds, upon which additional soil is added throughout the cultivation period (Jayashree et al., 2016). In contrast to that, the Taiwanese method is to plant rhizome pieces instead into furrows, which are then systematically filled over the course of the growing process, leading to a final banked structure that contains the ginger plant. This is an essential procedure that ultimately influences the rhizome shape and improves the channel flow of the water, as ginger reacts negatively on waterlogging (Tsai and Hsiao, 2011; Chen, 2019).
Returning to the differences between old and young ginger, the Taiwanese production shows a differentiation between the two distinctive maturity products. To influence the aimed characteristics of the ginger rhizomes, the depths of the planting furrows and the plant spacing are different. Hence, two different production lines are created, with the young ginger production line aiming high yields, while the old ginger production line focuses on producing ginger with high spice quality (Chen, 2019). The differences in the Taiwanese bank cultivation are shown in image one and two, summarizing the results from Council of Agriculture Executive Yuan, 2005, Tsai and Hsiao, (2011) and Chen (2019).

T. Ertl, M. Treiber, H. Bernhardt
204
Image one includes the planting depth as well as the distance between the rows. In the second image the distances within the planting rows between the planted rhizomes are plotted. Additionally, the image includes arrows to display the further cultivation process of pilling up.
Figure 1 Furrow depth and distance between rows for the different ginger producing lines
young and old ginger in cm
Figure 2 Different in row planting distances between the production lines young and old
ginger in cm
In Germany, the limiting factor of production is the temperate climate and therefore limited vegetation period. Because of this, an ideal production site would allow for general control of the main growing parameters, temperature and water. In this context, heated green houses could provide the best opportunity for the facilitation of environment requirements specific to ginger production. Nevertheless, next to green house production, current methods exist that utilize unheated foil tunnels as well as open land. However, the latter uses micro tunnels, covered with plant fleece and perforated foil, in order to provide some protection to the plants (Eibl, 2020). The main differences between these production methods are the accessible end product as well as the risk. As the environment in heated green houses is nearly completely controllable, the production of fully matured ginger is possible. At the same time, the technical equipment is cost intensive and the use of energy is high. On the other hand, producing ginger on open-land is less costly, but only allows for a very limited environmental control, despite the use of protective equipment such as micro tunnels. While unheated foil tunnels allow influencing the temperature to a certain point, they are able to fully protect the plants from water and wind. Likewise, the implementation of crop rotation is relatively easy, when relying upon open land production methods and the use of unheated foil tunnels. Taking the depicted aspects into account, a production of ginger in unheated foil tunnels seems worthwhile in regards of product quality and the necessary equipment. Due to the high water requirements of ginger, irrigation is necessary on every production site. No matter which growing method is used, in Germany seedlings must be produced in advance, including temperature management to ensure optimal growth. The ginger rhizomes for planting require a temperature of approximately 22-25°C for germination (Nirmal Babu and Ravindran, 2005), which is practically implemented with heated planting tables, for example.
At the moment the ginger in Germany is produced under compliance of ecological regulations. Considering this, other results of the case-studies India and Taiwan, namely that ginger is an intensive, non self-tolerant and pest susceptible crop need to be a focus for future

Ginger production in Europe and Asia – a comparison of cultivation methods
205
development of the production process. A crop rotation as well as an elaborate pest management is needed, to enable a long-term cultivation. At the moment there is no to limited crop rotation in German ginger production, which is not sustainable. Furthermore, suitable crops need to be found, that work in a crop rotation with ginger. E.g. Jayashree et al. (2016) states that tomatoes are not suitable, as it is a host for a bacterium, which causes bacterial wilt. This is an essential information, because it makes ginger less attractive for widening the crop rotation in heated green houses, as tomatoes are often one of the main greenhouse crops in Germany.
After harvesting, the ginger produced in Germany is marketed directly, via wholesale as well as retail. Depending on the sales channel, farmers are paid between 10 € kg -1 up to 30 € kg -1 for their ginger (Eibl, 2020; Niedermaier, 2020; Dorka, 2020), whereas a minimum price of 10 € kg -1 allows for profitable production (Rascher, 2020). However, considering the high effort and amount of resources needed to produce fully matured ginger in heated green houses, German ginger production cannot compete with international im- ports. Therefore, it is questionable if this should be the goal. Instead, a new ginger product, which would be immature, freshly harvested and seasonably available, could be produced in unheated foil tunnels, ultimately providing an attractive product for the German market.
Taking into account the aforementioned aspects, ginger production in Germany is possible. Nevertheless, remaining challenges to establish it successfully have to be faced. At present, in Germany, the ginger production still lacks information as well as experience. In particular, more details about the health maintenance of the plant under compliance of ecological cultivation regulations are necessary. Moreover, more in-depth knowledge of ideal fertilization and storage opportunities is essential. Besides these factors, there are overarching challenges in ginger production, both for Germany and for the other two countries examined, despite their different stages of experience in ginger cultivation. The lack of work force, for example, is a shared issue. Hence, the mechanization potential is vital for a successful future development. Although existing literature shows that there are machines for nearly every production step available, the farm visits and expert interviews show a production process, which is mainly based on manual work.
Two limiting factors need to be considered to examine the mechanization potential of the ginger production process: first, the sensitivity of the rhizome, and second, the profitability of specialized machines. For small-scale agricultural and horticultural firms, the acquisition of highly specialized machines that are only useable for a special crop, for example, is often not economically viable. In this regard, a comprehensive analysis of existing farm operations must be conducted, to find multiple uses of the machines, e.g. planting machines that can be used for ginger but also for other crops like potatoes. Furthermore, the sensitivity of the rhizome must be a major point of consideration in the development and acquisition of new machines. However, an adaption of the marketing structure might also be an option for some firms. If there is, for instance, an instant further processing of the harvested rhizome to e.g. ginger syrup, rhizome injuries are negligible. Hence, the mechanization potential needs to be analysed operationally. Nevertheless, ginger, especially if regionally produced in Germany, is a costly high quality product, which will mainly rely on manual work.

T. Ertl, M. Treiber, H. Bernhardt
206
CONCLUSIONS
In the long term, both a high level of knowledge and the fulfilment of the crop’s growing demands are necessary to grow ginger successfully. In India and Taiwan ginger production is well established, with bank cultivation as the essential cropping system. Ginger production in Germany is possible, but it is in its infancy. A production of young ginger in unheated foil tunnels, which would be a new product to the German market, is promising. However, also the production in green houses and on open land might be options for some producers. Although manual work will presumably remain a part of ginger production, the mechanization potential needs to be further explored, regarding individual solutions for some production sites as well as marketing arrangements. Despite the challenges that come with its production, ginger is an exciting and promising crop. Nevertheless, to fulfil its potential, more research needs to be conducted. In this context, prospective international cooperation and knowledge transfer should greatly contribute to achieving the required progress.
REFERENCES
Bag, B. (2018). Ginger Processing in India (Zingiber officinale): A Review. International Journal of Current Microbiology and Applied Sciences 2018 (7), S. 1639–1651.
Chen, R.-J. (2019). Production Process in Taiwanese ginger production. Expert interview to Theresa Ertl on the 01.11.2019. Mingjian Township, Taiwan.
Council of Agriculture Executive Yuan (Hg.) (2005). Ginger. In: Taiwan Agricultural Encyclopaedia. Farming II. Taiwan.
Dorka, R. (2020). German ginger production in heated green houses, marketed over retail sale. Expert interview to Theresa Ertl on the 23.04.2020. Germany.
Eibl, D. (2020). Ginger cultivation on open land. Expert interview to Theresa Ertl on the 20.04.2020. Geisenhausen, Germany.
Eurostat (2019). Ginger and paprika from China, pepper from Vietnam. Hg. v. European Commission. Online available under https://ec.europa.eu/eurostat/web/products-eurostat- news/-/DDN-20191220-1-.
FAO (2019). Ginger value chain study in Nueva Vizcaya, Philippines. Food and Agriculture Organization of the United Nations, Bangkok.
Hedrich, T.; Rascher, B. (2018). Ingweranbau im Gewächshaus erfolgreich - 4 kg/m² Ertrag möglich. Versuche im deutschen Gartenbau 2018, Ökologischer Gemüsebau. Hg. v. Bayerische Landesanstalt für Weinbau und Gartenbau. Versuchsbetrieb für GemüseBau Bamberg der Bayerischen Landesanstalt für Weinbau und Gartenbau. Bamberg, Germany.
Jayashree, E.; Kandiannan, K.; Prasath, D.; Pervez, R.; Sasikumar B, Senthil Ku- Mar C.M., Srinivasan V., Suseela Bhai R., Thankamani, C. K. (2016). Ginger (extension pamphlet). ICAR-Indian Institute of Spices Research. Kerala, India.
Kearney, J. (2010). Food consumption trends and drivers. In: Philosophical Transactions of the Royal Society (365(1554)), S. 1793–2807.
Niedermaier, M. (2020). Ginger production in unheated foil tunnels with direct marketing of the ginger rhizomes. Expert interview to Theresa Ertl on the 01.07.2020. Bamberg, Germany.
Rascher, B. (2020). Appraisal and further development of the ginger cultivation in Germany based on the results of the ginger experimental station. Expert interview to Theresa Ertl on the 01.07.2020. Bamberg, Germany.
Ginger production in Europe and Asia – a comparison of cultivation methods
207
Seitz, C., Roosen, J. (2015). From Global to Local? The Power of Domestic Markets. European Association of Agricultural Economists, 145th Seminar, April 14 – 15, 2015. Parma, Italy.
Statista (Hg.) (2020). Importmenge von Ingwer in Deutschland | Statista. Online available under https://de.statista.com/statistik/daten/studie/545929/umfrage/importmenge-von- ingwer-in-deutschland/.
Steiner, L. K. (2011): Multifunktionale Landwirtschaft durch kreative Diversifizierung. Eine taxonomische Studie in Mittel- und Süddeutschland. Universität Hohenheim, Germany.
Tsai (蔡), C.-H. (正.); Hsiao (蕭), C.-H. (政.) (2011). Ginger production in Taiwan. Agri- cultural Journal of Taichung District (台中區農情月刊) 2011, 11.04.2011 (104).

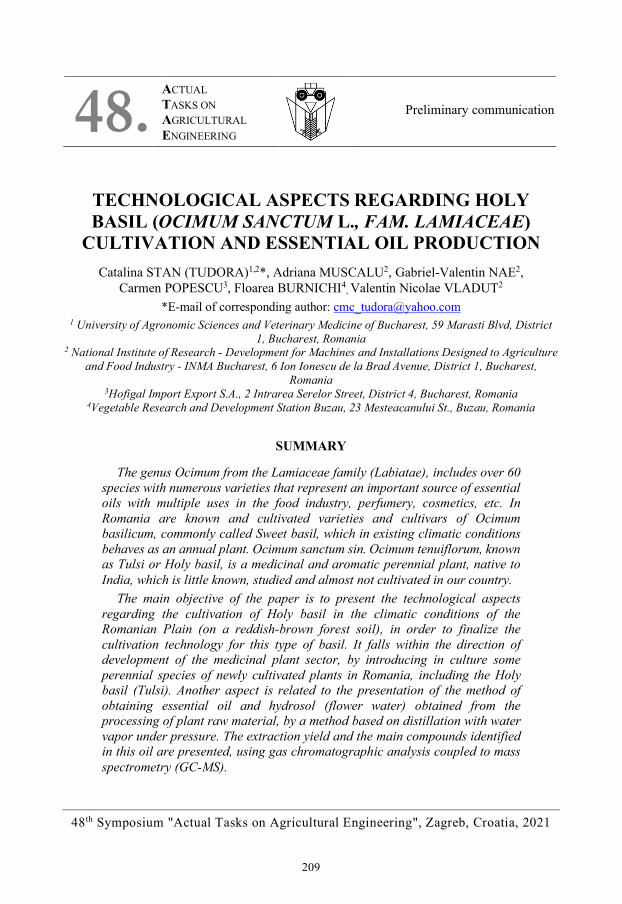
48th Symposium "Actual Tasks on Agricultural Engineering", Zagreb, Croatia, 2021
209
TECHNOLOGICAL ASPECTS REGARDING HOLY BASIL (OCIMUM SANCTUM L., FAM. LAMIACEAE)
CULTIVATION AND ESSENTIAL OIL PRODUCTION Catalina STAN (TUDORA)1,2*, Adriana MUSCALU2, Gabriel-Valentin NAE2,
Carmen POPESCU3, Floarea BURNICHI4, Valentin Nicolae VLADUT2
*E-mail of corresponding author: [email protected] 1 University of Agronomic Sciences and Veterinary Medicine of Bucharest, 59 Marasti Blvd, District
1, Bucharest, Romania 2 National Institute of Research - Development for Machines and Installations Designed to Agriculture
and Food Industry - INMA Bucharest, 6 Ion Ionescu de la Brad Avenue, District 1, Bucharest, Romania
3Hofigal Import Export S.A., 2 Intrarea Serelor Street, District 4, Bucharest, Romania 4Vegetable Research and Development Station Buzau, 23 Mesteacanului St., Buzau, Romania
SUMMARY
The genus Ocimum from the Lamiaceae family (Labiatae), includes over 60 species with numerous varieties that represent an important source of essential oils with multiple uses in the food industry, perfumery, cosmetics, etc. In Romania are known and cultivated varieties and cultivars of Ocimum basilicum, commonly called Sweet basil, which in existing climatic conditions behaves as an annual plant. Ocimum sanctum sin. Ocimum tenuiflorum, known as Tulsi or Holy basil, is a medicinal and aromatic perennial plant, native to India, which is little known, studied and almost not cultivated in our country.
The main objective of the paper is to present the technological aspects regarding the cultivation of Holy basil in the climatic conditions of the Romanian Plain (on a reddish-brown forest soil), in order to finalize the cultivation technology for this type of basil. It falls within the direction of development of the medicinal plant sector, by introducing in culture some perennial species of newly cultivated plants in Romania, including the Holy basil (Tulsi). Another aspect is related to the presentation of the method of obtaining essential oil and hydrosol (flower water) obtained from the processing of plant raw material, by a method based on distillation with water vapor under pressure. The extraction yield and the main compounds identified in this oil are presented, using gas chromatographic analysis coupled to mass spectrometry (GC-MS).
48. ACTUAL TASKS ON AGRICULTURAL ENGINEERING
Preliminary communication

C. Stan (Tudora), A. Muscalu, G.-V. Nae, C. Popescu, F. Burnichi , V. N. Vladut
210
In conclusion, the paper aims to promote the implementation in culture of a new species of Basil (Ocimum sanctum L.), in order to acclimatize and cultivate it on a large scale, then identify modern technical solutions for the extraction of essential oil to obtain high added-value products, which can prove their effectiveness in various fields.
Keywords: Tulsi, cultivation technology, hydrodistillation, essential oil, compounds.
INTRODUCTION
The Holy basil (Tulsi) - Ocimum sanctum sin. Ocimum tenuiflorum, Fam. Lamiaceae, is known and cultivated, having a large distribution covering the entire Indian subcontinent (India, Nepal,) and the whole Southeast Asia. Tulsi is considered to be the second plant in the world (after ginseng) in the top of adaptogenic plants, with positive effects on the mental state and health of the whole body. The plant has been used in Asia for over 5.000 years for the preparation of tea, as a spice, for the prevention and treatment of a very wide range of diseases.
Three main types of Tulsi are known: - Rama Tulsi – known as Tulsi with green leaves, it is found in certain regions of China,
Nepal, India, but also southern South America. It has purple flowers with a light, sweet clove scent, due to the chemical component of eugenol.
- Krishna Tulsi – known as Shyama Tulsi or Tulsi with purple leaves, it grows in many parts of India. It grows more slowly than the other types of Tulsi, and this property contributes to the smell and spicy aroma of hawthorn and pepper. This type of Tulsi is less bitter and astringent than other tulsi.
- Vana Tulsi – known as wild leaf Tulsi, it is the hardest-to-find variety, growing wild in many areas of Asia (Himalayas). It is a bright green plant, with more lemon flavour.
Tulsi is a perennial shrub with a pleasant smell, the plant is branched, with soft hairs all over the surface and can grow to a height of 30 - 75 cm. The leaves are entire, serrate, pubescent on both sides, the purple or red flowers are grouped in racemes, the fruits are subglobular or ellipsoidal, slightly compressed, almost smooth, pale brown or reddish with small black markings (Gingade et al., 2014). The plant grows and develops well in humid conditions, in areas with large amounts of precipitation. Long days and high temperatures favour the growth of plants and the accumulation of essential oil. It can grow up to an altitude of 900 m and has a moderate tolerance to drought and frost. It can be grown even in partial shading, but has a low oil content. The main constituents of the essential oil obtained from Tulsi are: eugenol (70%), b-bisabolene (13-20%), methyl chavicol (3-19%), 1,8-cineole (9-33%), (E)-α-bisabolene (4-7%) and α-terpineol (1.7-7%) (Singh et. al., 2010). The literature describes that the essential oils of Ocimum sanctum with different origins, contain large amounts of sesquiterpenes such as eugenol, methyl eugenol (Mondello et al., 2002). Eugenol (27-83%) is the main component of essential oils obtained from Tulsi plants in the USA, India, Cuba or Brazil. Some of these oils contain large amounts of methyl eugenol (3-24%), methyl chavicol (10-15%) and/or sesquiterpene hydrocarbons (Wakchaure et. Al., 2017). Tulsi leaves contain 0.7% essential oil, consisting mainly of 71% eugenol and 20% methyl eugenol (Singh et al., 2012).

Technological aspects regarding Holy basil (Ocimum sanctum L., fam. Lamiaceae) cultivation and essential oil...
211
The paper aimed to present the research conducted on the cultivation of Holy basil (Tulsi), in the climatic conditions of 2019 in the Romanian Plain, on a reddish-brown forest soil, in order to finalize the cultivation technology for this type of basil.
Another important aspect was related to presenting the method of obtaining essential oil and hydrosol (flower water), both obtained from the processing of plant material obtained from Tulsi plant cultivation, through a process based on hydrodistillation. The extraction yield and the main compounds identified by chromatograms for both essential oil and hydrosol (flower water), using gas chromatography-mass spectrometry (GC-MS), are presented.
MATERIAL AND METHODS
Plant material - in order to obtain the plant material necessary for the establishment of the culture and extraction of essential oil and hydrosol (flower water), on the existing lands within INMA Bucharest, in the climatic conditions of 2019, on a reddish-brown forest soil, the culture was established. The plant material used for the establishment of the culture was represented by seedlings produced by SCDL Buzău from seeds of Indian origin.
Since Tulsi is not an indigenous plant, it is little known and almost not cultivated, very few aspects are known related to the cultivation technology of this type of basil, how this plant adapts to climatic conditions in Romania, yields, variation of compounds in essential oil and flower water, etc.
Obtaining essential oil and hydrosol (flower water) from Tulsi - Hydrodistillation (distillation with water vapor under pressure, coming from a separate generator) was used as a method, using a plant of french origin (AURA DISTILLATEUR), with 130 l the capacity of the main tank. The extraction yield was calculated using the formula:
Extraction yield = V / M (mL kg-1) where: V – volume of essential oil obtained from the plant sample (ml); M – mass of the medicinal plant sample (kg). The institution where the research was conducted was HORTING Bucharest, and the
research method used to obtain the volatile oils was hydrodistillation. Method for determining the chemical composition of essential oil and hydrosol (flower
water) - gas chromatography-mass spectrometry (GC-MS) was used. The conditions for performing the gas-chromatograph analysis were the following: Gas-chromatograph Agilent Technologies type 7890 A GC system; MS Agilent Technologies type 5975 C Mass Selective Detector; Column Macrogol 20,000 R (film thickness 0.25 µm; l = 30 m; Ø = 0.25 mm); Carrier gas - helium for R chromatography with a flow rate of 1.5 mL min-1; Temperature regime - 250ºC (10 degrees/min) up to 280ºC (const. 5.5 min); Injector temperature 220ºC, Detector temperature 235ºC; Mobile phase - helium 1mL min-1; Split injector; Split ratio - 1:100; Injected volume - 1µL essential oil.
Tulsi essential oil - 1mL oil was diluted with hexane R to 100 mL, dried over anhydrous sodium sulphate R and filtered through a 0.45 μm filter. The obtained solution represented the test solution for tracing the chromatogram.

C. Stan (Tudora), A. Muscalu, G.-V. Nae, C. Popescu, F. Burnichi , V. N. Vladut
212
The hydrosol (flower water) obtained from Tulsi Basil - 25mL of flower water had been extracted into the separatory funnel with 10 mL of hexane R, for 10 minutes. After separation, the hexane layer was transferred to a 10 mL volumetric flask and filled up to the mark with hexane R. The hexane extract from the volumetric flask was dried over anhydrous sodium sulphate R and then filtered through a 0.45 μm filter. The obtained solution represented the test solution for tracing the chromatogram.
RESULTS AND DISCUSSION
From an agroclimatic point of view, 2019 was one of the hottest and driest years, with the average air temperature exceeding by 1.5°C the climate normal in force (multiannual average 1981-2010). In 2019 there were 9 months with positive monthly thermal deviations between 0.4 and 4.9°C, compared to the period 1981–2010, important in terms of the vegetation period of the plants, being: May (+2.5°C), June (+1.0°C), August (+1.9°C), September (+1.3°C), October (+2.2°C). The amount of precipitation for this year was 69 mm lower, 10% than the climate normal (1981–2010). The deviation of the monthly amount of precipitation was negative, oscillating between 6% in November and 65% in April. The quality of the water used to irrigate the culture was an important factor in preventing its pollution with different types of pesticides, salts, sediments and other pollutants, being an important factor in preventing soil degradation. For this reason, samples of water used for culture irrigation were collected, and the results of the analyses performed are presented in table 1.
Table 1 The results of the chemical analysis for the water sample used to irrigate the Tulsi culture
Indicator U.M./Test code Water sample (A0151)
pH unit. pH 7.55 (23.8) Conductivity µS cm-1 314 Ammonium mg L-1 0.001 Nitrites mg L-1 0.014 Nitrates mg L-1 4.47 Phosphates mg L-1 0.052 CCOMn mg O2 L-1 0.96 Ca mg L-1 48.1 Mg mg L-1 6.8 Chlorides mg L-1 15.9 Sulphates mg L-1 28.3 Bicarbonates mg L-1 143.4 Carbonates mg L-1 0 Total hardness German degrees 8.29

Technological aspects regarding Holy basil (Ocimum sanctum L., fam. Lamiaceae) cultivation and essential oil...
213
The obtained results show that the water used for culture irrigation meets the requirements of drinking water, being recorded normal values without exceeding the exceptional values allowed for pH, conductivity, phosphates, nitrites and nitrates, CCOMn, calcium, magnesium and hardness, according to STAS 1342- 91-Drinking water.
The cultivation technology applied to the culture, included the following technological links (figure 1).
Production of seedling material - propagation by seeds of Indian origin, sown directly for seedling production in the germination bed in the second half of March (mixture of soil, peat, sand 3:3:1) and transplanted into peat, in alveolar pallets of 4/4 /4cm (after April 20). The maintenance work applied to the seedlings until planting in the field was the usual one.
Soil basic fertilization - was done at the same time with the deep autumn ploughing, when organic fertilizers (40 t/ha manure) and mineral fertilizers (phosphorus 40-50 kg/ha a.s. and potassium 30-40 kg/ha a.s.) were administered and incorporated into the soil.
Soil tillage - started in the spring before planting, when the land was worked using cultivator and harrow, to maintain soil moisture and to remove ephemeral weeds, so that the soil is loose and well mobilized.
Planting of seedlings in the field - was done in the second half of May, using the planting scheme: 1.00 m/between rows (for the mechanization of maintenance works) and 40 cm between plants on the row, so that on an area of 200 m2 were planted manually 500 pieces of holy basil (Tulsi) seedlings. Immediately after planting the seedling was watered to ensure rooting.
Maintenance works - consisted of manual and mechanical hoeing. The first manual hoeing was carried out after the planting operation (to combat soil compaction), and the following hoeing works were carried out whenever necessary, both to control weeds between rows of plants/between plants in a row, but also for loosening the soil and combating the crust formed around the plants.
The main weeds found in the culture were the summer ones: Foxtail - Setaria sp., Cockspur grass - Echinochloa crus-galli; Red-root - Amarantuhus retoflexus; Field bindweed - Convolvulus arvensis, Purslane - Portulaca oleracea. They were the main problem in the culture and were combated by manual (2) and mechanical (3) hoeing, the crop being kept "clean" without applying synthetic chemicals.
Watering was done whenever necessary (especially in August which was a month with rainfall deficit), with watering norms = 350 - 400m3 of water, using sprinklers.
Disease and pest control - although the literature (Gingade et.al., 2014; Mondali et. Khatua, 2016) mentions a number of diseases and pests found in Tulsi culture, the culture established here has not had such problems.
Harvesting - the plant must be harvested in the full flowering stage to obtain a maximum yield and good quality essential oil. Harvesting should usually be done on sunny days, by cutting the plants 15-20 cm above ground level. It is not desirable to harvest the plants if it rained the day before. In the climatic conditions of 2019, 2 harvests were obtained, the first after 60 days from planting, and the second at the end of September, obtaining a total production of 5t/ha. The harvesting work was carried out by machine, in sunny weather, using the Medicinal plant harvesting equipment (ERPM) - experimental model, created by the Testing Department within INMA Bucharest.
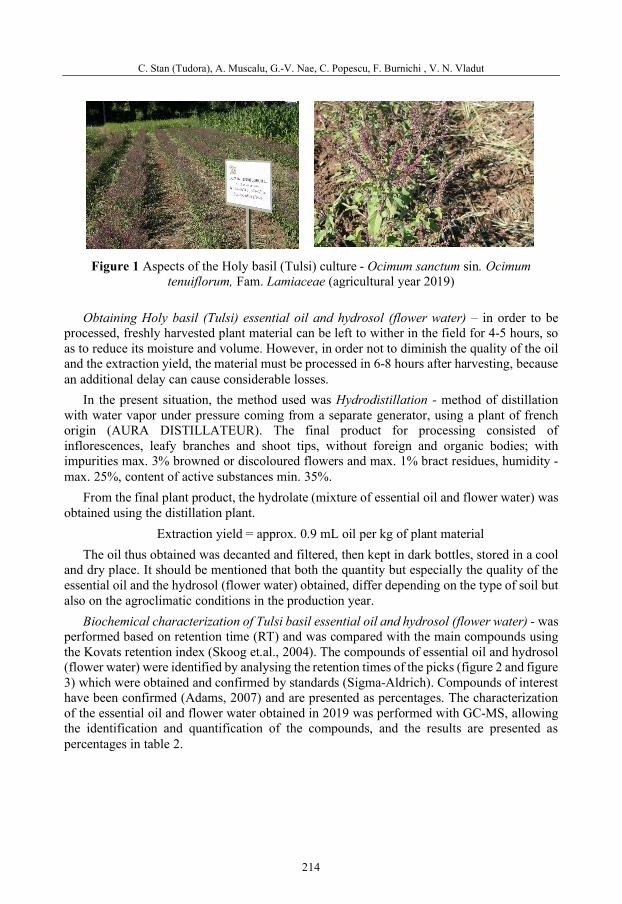
C. Stan (Tudora), A. Muscalu, G.-V. Nae, C. Popescu, F. Burnichi , V. N. Vladut
214
Figure 1 Aspects of the Holy basil (Tulsi) culture - Ocimum sanctum sin. Ocimum tenuiflorum, Fam. Lamiaceae (agricultural year 2019)
Obtaining Holy basil (Tulsi) essential oil and hydrosol (flower water) – in order to be
processed, freshly harvested plant material can be left to wither in the field for 4-5 hours, so as to reduce its moisture and volume. However, in order not to diminish the quality of the oil and the extraction yield, the material must be processed in 6-8 hours after harvesting, because an additional delay can cause considerable losses.
In the present situation, the method used was Hydrodistillation - method of distillation with water vapor under pressure coming from a separate generator, using a plant of french origin (AURA DISTILLATEUR). The final product for processing consisted of inflorescences, leafy branches and shoot tips, without foreign and organic bodies; with impurities max. 3% browned or discoloured flowers and max. 1% bract residues, humidity - max. 25%, content of active substances min. 35%.
From the final plant product, the hydrolate (mixture of essential oil and flower water) was obtained using the distillation plant.
Extraction yield = approx. 0.9 mL oil per kg of plant material The oil thus obtained was decanted and filtered, then kept in dark bottles, stored in a cool
and dry place. It should be mentioned that both the quantity but especially the quality of the essential oil and the hydrosol (flower water) obtained, differ depending on the type of soil but also on the agroclimatic conditions in the production year.
Biochemical characterization of Tulsi basil essential oil and hydrosol (flower water) - was performed based on retention time (RT) and was compared with the main compounds using the Kovats retention index (Skoog et.al., 2004). The compounds of essential oil and hydrosol (flower water) were identified by analysing the retention times of the picks (figure 2 and figure 3) which were obtained and confirmed by standards (Sigma-Aldrich). Compounds of interest have been confirmed (Adams, 2007) and are presented as percentages. The characterization of the essential oil and flower water obtained in 2019 was performed with GC-MS, allowing the identification and quantification of the compounds, and the results are presented as percentages in table 2.

Technological aspects regarding Holy basil (Ocimum sanctum L., fam. Lamiaceae) cultivation and essential oil...
215
Figure 2 Chromatogram of essential oil obtained from Holy basil (Tulsi) - Ocimum sanctum L., fam. Lamiaceae (year 2019)
Figure 3 Chromatogram of hydrosol (flower water) obtained from Holy basil (Tulsi) - Ocimum sanctum L., fam. Lamiaceae (year 2019)
According to the chromatogram in figure 2 and table 2, in the Holy basil (Tulsi) essential
oil were identified 27 compounds, which represent 98.45% of the whole oil. The main compound identified in the oil is ß – Caryophyllene (natural bicyclic sesquiterpene - 47.97%), followed by Eugenol (monoterpene - 20.52% and Eudesmane (sesquiterpene) 11.76%. The composition suggests that Tulsi essential oil could be classified as a eugenol type. In the literature it is mentioned that Tulsi leaves contain 0.7% essential oil, comprising about 71% eugenol and 20% methyl eugenol (Singh et.al., 2012). Caryophyllene (3.39%) and Caryophyllene Oxide (2.23% - natural bicyclic sesquiterpene) are also found in the oil, in smaller quantities.
The qualitative and quantitative composition of this essential oil confirms part of the literature that reports that eugenol and caryophyllene are the main components for this type of oil. (Mondello et. al., 2002, Yamani et. al., 2016).
The compounds of the hydrosol (flower water) obtained from the Holy basil (Tulsi) were identified by analysing the retention times of the picks (fig.3) that were obtained and confirmed by standards (Sigma-Aldrich) and are presented as percentages. The characterization of the flower water was performed by GC-MS, allowing the identification and quantification of the compounds, and the results are presented as percentages in table 2. Approximately 13 compounds were identified by gas chromatography-mass spectrometry (GC-MS), which represents 98.05% of the whole oil. Eugenol was predominant - 93.54% but also 3-Propanone - 2.04%, a compound that is found in a much smaller amount (2.04%).
RT: 0.00 - 76.03 SM: 7G
0 10 20 30 40 50 60 70Time (min)
0
200000000
400000000
600000000
800000000
Relat
ive Ab
unda
nce
27.15
39.33
31.00
35.66
18.38
43.87
5.41
14.68
67.24
9.08
49.24
73.87
70.80
59.76
63.34
54.11
56.49
NL:9.78E8TIC F: MS TusliUVAnpe50INMA5
RT: 0.00 - 76.04 SM: 7G
0 10 20 30 40 50 60 70Time (min)
0
50000000
100000000
150000000
200000000
250000000
300000000
350000000
Relat
ive Ab
unda
nce
39.31
25.75
74.18
69.11
66.13
63.52
60.36
57.56
54.39
51.42
31.86
14.67
4.02
18.37
21.50
6.52
8.86
11.43
NL:4.00E8TIC F: TulsiApralaAn3A12I5p
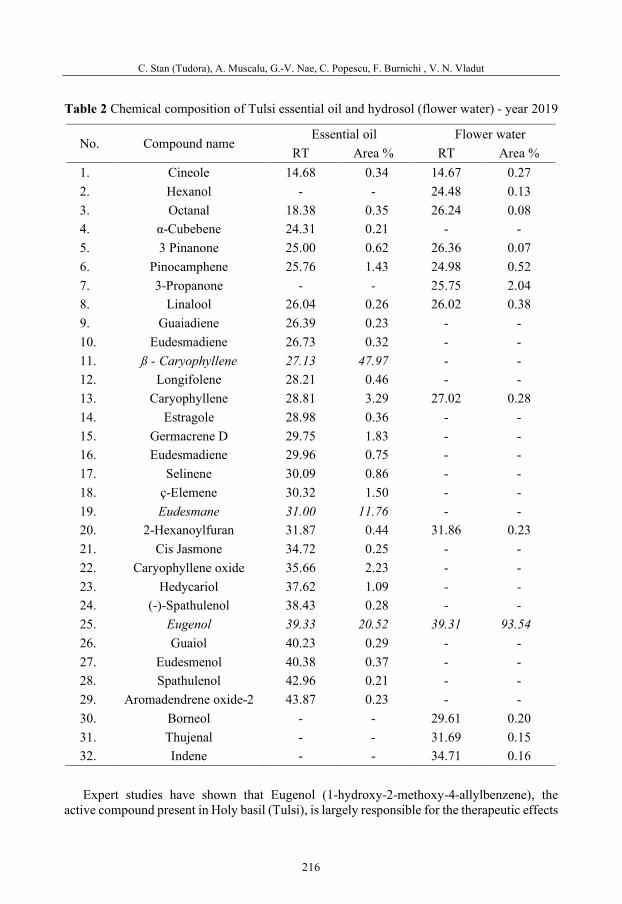
C. Stan (Tudora), A. Muscalu, G.-V. Nae, C. Popescu, F. Burnichi , V. N. Vladut
216
Table 2 Chemical composition of Tulsi essential oil and hydrosol (flower water) - year 2019
No. Compound name Essential oil Flower water
RT Area % RT Area % 1. Cineole 14.68 0.34 14.67 0.27 2. Hexanol - - 24.48 0.13 3. Octanal 18.38 0.35 26.24 0.08 4. α-Cubebene 24.31 0.21 - - 5. 3 Pinanone 25.00 0.62 26.36 0.07 6. Pinocamphene 25.76 1.43 24.98 0.52 7. 3-Propanone - - 25.75 2.04 8. Linalool 26.04 0.26 26.02 0.38 9. Guaiadiene 26.39 0.23 - - 10. Eudesmadiene 26.73 0.32 - - 11. ß - Caryophyllene 27.13 47.97 - - 12. Longifolene 28.21 0.46 - - 13. Caryophyllene 28.81 3.29 27.02 0.28 14. Estragole 28.98 0.36 - - 15. Germacrene D 29.75 1.83 - - 16. Eudesmadiene 29.96 0.75 - - 17. Selinene 30.09 0.86 - - 18. ç-Elemene 30.32 1.50 - - 19. Eudesmane 31.00 11.76 - - 20. 2-Hexanoylfuran 31.87 0.44 31.86 0.23 21. Cis Jasmone 34.72 0.25 - - 22. Caryophyllene oxide 35.66 2.23 - - 23. Hedycariol 37.62 1.09 - - 24. (-)-Spathulenol 38.43 0.28 - - 25. Eugenol 39.33 20.52 39.31 93.54 26. Guaiol 40.23 0.29 - - 27. Eudesmenol 40.38 0.37 - - 28. Spathulenol 42.96 0.21 - - 29. Aromadendrene oxide-2 43.87 0.23 - - 30. Borneol - - 29.61 0.20 31. Thujenal - - 31.69 0.15 32. Indene - - 34.71 0.16 Expert studies have shown that Eugenol (1-hydroxy-2-methoxy-4-allylbenzene), the
active compound present in Holy basil (Tulsi), is largely responsible for the therapeutic effects

Technological aspects regarding Holy basil (Ocimum sanctum L., fam. Lamiaceae) cultivation and essential oil...
217
of this plant (Sailaja et.al., 2010, Borah et al., 2018). Due to the bioactive compounds, this plant has various properties (anti stress, antiseptic, analgesic, anti-inflammatory, immunomodulatory, hypoglycaemic, hypotensive, cardioprotective) but also antioxidant, antimicrobial and insecticidal activity (Tanwar et.al., 2015, Borah et. al., 2018). Although the main classes of volatile compounds identified in this study (monoterpenes and sesquiterpenes) are also found in other studies, there are important quantitative differences in the distribution of these compounds in the cultivated plant, depending on geographical areas. In a previous paper it was reported that Tulsi essential oil contains volatile compounds from the class of monoterpenes such as linalool, estragole, eugenol, in variable amounts but also small amounts of methyl cinnamon, cineole, tannins, camphor, etc. (Prakash and Gupta, 2005). However, the number of volatile compounds identified, the major and minor compounds in terms of quantity, varied in different studies. The experiments performed by Singh et al. (2010) showed that extracts from fresh Tulsi leaves and stems contain a number of sesquiterpenes and monoterpenes (α-Elenene, Bornyl Acetate, α- and β-Pinene, Campesterol and Camphene, but the composition and amounts differ. These differences could be related to the geographical origin of cultivated Tulsi plants, environmental factors, or the method of extraction and analysis, which significantly influences the composition and percentage of compounds identified in Tulsi essential oil.
CONCLUSIONS
The strategy for the sustainable use of medicinal and aromatic plants aims to promote and introduce new medicinal and aromatic plants in culture, in order to satisfy the ever-increasing demand on the market and to offer new income opportunities to farmers.
The Holy basil (Tulsi) considered in culture is a valuable medicinal plant, which in the climatic conditions of 2019 in the Romanian Plain behaved as an annual plant, and the applied cultivation technology did not involve high costs or problems in terms of crop maintenance. The production that can be obtained from this plant per unit area is over 5t/ha.
By the method of hydrodistillation, high quality essential oil and hydrosol (flower water) were obtained. The extraction yield varies and depends on the type of plant used, the distillation time, the development stage of the plant at harvest, the pedoclimatic conditions, and 1 litre of hydrolate is obtained per 1 kg of plant. Extraction yield: about 0.9 ml essential oil/1 kg plant material.
The biochemical characterization of essential oil and hydrosol (flower water) performed with the help of GC-MS, showed the presence of 27 (98.45%) and 13 compounds (98.05%), respectively, and the dominant compounds were ß-Caryophyllene (47.97%) and Eugenol (20.52%) in essential oil, and Eugenol (93.54%) in hydrosol (flower water).
ACKNOWLEDGMENTS
This work was supported by one founding source the NUCLEU Programme, carried out with the support of ANCSI, Project PN 5N/07.02.2019 "Research on the superior valorisation of some new plant species cultivated in Romania".
The work was supported by a grant of the Romanian Ministry of Agriculture and Rural Development, Funding contract no. 25.1.2/27.09.2019, project ADER 25.1.2: " Research on
C. Stan (Tudora), A. Muscalu, G.-V. Nae, C. Popescu, F. Burnichi , V. N. Vladut
218
the development and testing of technical equipment for harvesting medicinal and aromatic plants, used in small farms".
This work was supported by a grant of the Romanian Research and Innovation Ministry, through Programme 1 - Development of the national research-development system, sub-programme 1.2 - Institutional performance - Projects for financing excellence in RDI, Contract no. 16PFE.
REFERENCES
Adams, R. P. (2007). Identification of essential oil components by gas chromatography/mass spectrometry, Allured Publishing Corporation, SUA.
Borah R., Biswas S. P., (2018). Tulsi (Ocimum sanctum), excellent source of phytochemicals. Intern. Journal of Environment, Agriculture and Biotechnology (IJEAB), 3(5):1732-1738.
Gingade, S., Manivel, P., Varghese, T. S. (2014). Cultivation of Ocimum. ICAR - Directorate of Medicinal and Aromatic Plants Research, Boriavi, Anand-387 310, Gujarat, Extension Bulletin:1-31.
Mondali, B., Khatua, D.C. (2016). Web blight of Tulsi (Ocimum sanctum L.) - a new report. Journal of Plant Protection and Environment, 13 (1):70-71.
Mondello, L., Zappia, G., Cotroneo, A., Bonaccorsi, I., Chowdhury, J.U., Yusuf M., Dugo G. (2002). Studies on the essential oil-bearing plants of Bangladesh. Part VIII. Composition of some Ocimum oils O. basilicum L. var. purpurascens; O. sanctum L. green; O. sanctum L. purple; O. americanum L., citral type; O. americanum L., camphor type. Flavour and Fragrance Journal. 17: 335-340.
Prakash, P., Gupta, N. (2005). Therapeutic uses of Ocimum sanctum Linn (Tulsi) with a note on eugenol and its pharmacological actions: a short review. Indian J. Physiol. Pharmacol, 49:125–131.
Sailaja, I., Shaker, I.A., Ratna, Y.K., (2010). Antioxidant activity and phenolic contents in Ocimum sanctum and Ocimum bascilicum. Asian Journal of Bio Science, 5(1):1-5.
Singh, J., Sethi, J., Sood, S. (2010). Ocimum sanctum: An Updated Review. Journal of Pharmaceutical Research, 9(3): 97-103.
Singh, V., Amdekar, S., Verma, O. (2010). Ocimum Sanctum (Tulsi): Bio-pharmacological Activities. Webmed Central Pharmacol. 1:WMC001046. doi: 0.9754/journal.wmc.2010.001046
Singh, N., Verma, P., Pandey, B.R., Bhalla, M. (2012). Therapeutic potential of Ocimum sanctum in prevention and treatment of cancer and exposure to radiation: An overview, Int. J. Pharm. Sci. Drug. Res., 4(2):97- 104.
Skoog, D. A., West, D.M., Holler, F. J., Crouch, S., R., (2004). Fundamentals of analytical chemistry, 8th. Edition, Ed. Thomson. ISBN-10: 0030355230, ISBN-13: 9780030355233
Tanwar, R., Pahare, A., Naqvi, S. M. A. (2015). Ocimum sanctum (Tulsi), excellent source of phytochemicals. Indo American Journal of Pharmaceutical Research, 12(5):2231-6876.
Yamani, H. A., Pang, E. C., Mantri, N., Deighton, M. (2016). Antimicrobial activity of Tulsi (Ocimum tenuiflorum) Essential Oil and their major constituents against three species of bacteria. Frontiers in Microbiology, 7:1-7.
Wakchaure, R., Ganguly, S., Praveen, K. (2017). Ocimum sanctum (Tulsi), the Queen of Herbs: A Review. Biochemistry and Therapeutic Uses of Medicinal Plants, Discovery Publishing House Pvt. Ltd., 166-173, New Delhi, India. ISBN: 978-93-5056-866-8

48th Symposium "Actual Tasks on Agricultural Engineering", Zagreb, Croatia, 2021
219
PLANTING ERRORS IN THE EXPLOITATION OF SEEDLING PLANTERS, CAUSES AND IMPROVEMENT
SOLUTIONS Petru CARDEI1*, Radu CIUPERCA2, Adriana MUSCALU2, Sebastian MURARU3
*E-mail of corresponding author: [email protected] 1Computerised Engineering, INMA, 6, Ion Ionescu de la Brad Blv., Sector 1, Bucharest, Romania
2RDI, 3DTBI, INMA, 6, Ion Ionescu de la Brad Blv., Sector 1, Bucharest, Romania
ABSTRACT
The article presents the results of research conducted on the causes of planting errors of seedling planting machines. Solutions are given for improving the parameters that characterize the quality of the working process of seedling planting machines. The main factors that contribute to the intensity of planting error are the efficiencies of the drive wheel and chain drives. There are also other sources of error, which have random characteristics, the variation of the working speed, the condition and the nature of the terrain, which can lead to the drive wheel sliding, etc. The paper addresses the identification of variation limits of planting error in order to reduce the length of the variation interval. The basic relationships between input, control, and adjustment parameters and output parameters are the basis of improvement and optimization solutions for the seedling planting machine. Finally are given solutions for improvement and optimization for the working process of the seedling planter.
Keywords: planting errors, precision planting, seedling, gear transmission
INTRODUCTION
According to (Dexonline, 2020) the planting error is the difference between the projected and actual planting distance and direction. The planting precision manifested in the operation of any machine or equipment, are few present in the literature of agricultural machines, although the specialized literature in the field of agriculture already has many approaches that use in this aim modern approaches, like the systems theory (Schiere et al., 2004). However, the problem of the planting precision is very important for the design and operation of this type of machines, (Murray et al., 2006, Fu et al., 2018, Ani et al., 2016, Reis et al. 2002, Yazgi and Degirmenencioglu, 2006, and Wanzhi et al., 2020). The precision of sowing and planting is currently an important chapter of precision agriculture, about the importance of which is
48. ACTUAL TASKS ON AGRICULTURAL ENGINEERING
Preliminary communication
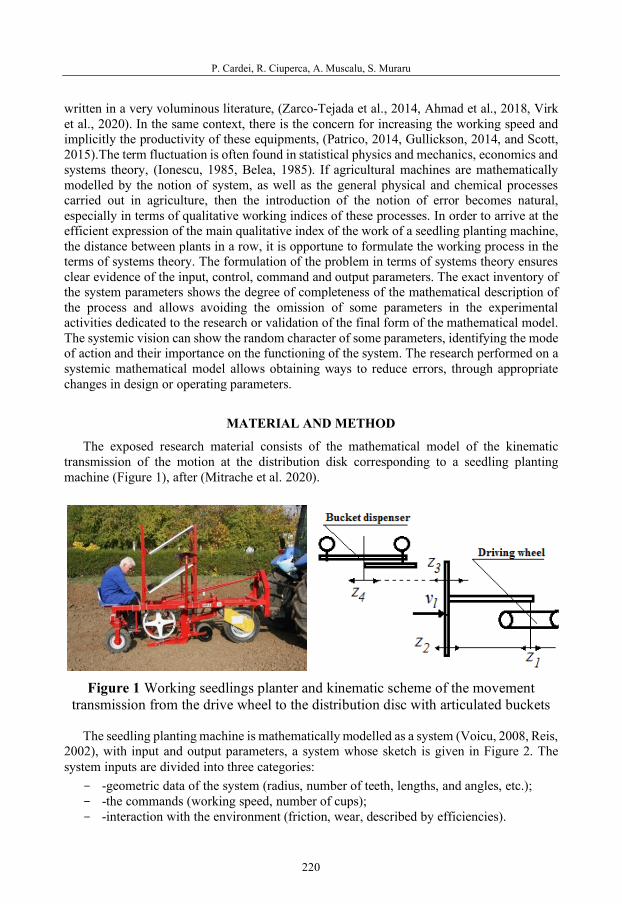
P. Cardei, R. Ciuperca, A. Muscalu, S. Muraru
220
written in a very voluminous literature, (Zarco-Tejada et al., 2014, Ahmad et al., 2018, Virk et al., 2020). In the same context, there is the concern for increasing the working speed and implicitly the productivity of these equipments, (Patrico, 2014, Gullickson, 2014, and Scott, 2015).The term fluctuation is often found in statistical physics and mechanics, economics and systems theory, (Ionescu, 1985, Belea, 1985). If agricultural machines are mathematically modelled by the notion of system, as well as the general physical and chemical processes carried out in agriculture, then the introduction of the notion of error becomes natural, especially in terms of qualitative working indices of these processes. In order to arrive at the efficient expression of the main qualitative index of the work of a seedling planting machine, the distance between plants in a row, it is opportune to formulate the working process in the terms of systems theory. The formulation of the problem in terms of systems theory ensures clear evidence of the input, control, command and output parameters. The exact inventory of the system parameters shows the degree of completeness of the mathematical description of the process and allows avoiding the omission of some parameters in the experimental activities dedicated to the research or validation of the final form of the mathematical model. The systemic vision can show the random character of some parameters, identifying the mode of action and their importance on the functioning of the system. The research performed on a systemic mathematical model allows obtaining ways to reduce errors, through appropriate changes in design or operating parameters.
MATERIAL AND METHOD
The exposed research material consists of the mathematical model of the kinematic transmission of the motion at the distribution disk corresponding to a seedling planting machine (Figure 1), after (Mitrache et al. 2020).
Figure 1 Working seedlings planter and kinematic scheme of the movement transmission from the drive wheel to the distribution disc with articulated buckets
The seedling planting machine is mathematically modelled as a system (Voicu, 2008, Reis,
2002), with input and output parameters, a system whose sketch is given in Figure 2. The system inputs are divided into three categories:
- -geometric data of the system (radius, number of teeth, lengths, and angles, etc.); - -the commands (working speed, number of cups); - -interaction with the environment (friction, wear, described by efficiencies).

Planting errors in the exploitation of seedling planters, causes and improvement solutions
221
The system outputs include the planting error (Figure 2, top right) and ideal and actual plant locations in a row (Figure 2, bottom right). The mathematical model of the system contains the calculation relations for the planting error and the abscissas of the ideal and real planting locations on the row (Figure 2, (1-7)). The diagram of the motion transmission mechanism appears in Figure 2, bottom left, and how to choose the optimal number of teeth of the wheel 3 can be seen in Figure 2, top left.
The system parameters are explained in Table 1 Mitrache et al., 2020. In this paper, a reduced version of Table 1 from Mitrache et al., 2020 is given.
Table 1 System parameters that mathematically model the seedling planting
Parameter name and units Notation Working speed, ms-1 vl Dynamic radius of the drive wheel, m ra Dynamic cup gripping radius on the distributor disc, m rdr Number of sprocket teeth with the label i, i= 1,...,4 zi Drive wheel efficiency ηa Transmission efficiency between gears 1 - 2 η12 Transmission efficiency between gears 2 - 3 η23 Transmission efficiency between gears 3 - 4 η34 Transmission efficiency between the drive wheel and the gear 1, 1-a ηa1
Transmission efficiency between the bucket disc and the gear 4 η4dr Gear splitting radius i, i= 1,...,4, mm r1 Number of cups attached to the distribution disc Nc Planting error, m εpl The length of the cup articulation circle on the distribution disc, m Ldr0
The complete mathematical relations of the system are given in Mitrache et al., 2020 and
we do not reproduce them in this article. The important result used in this article is the expression of the optimal radius and the optimal teeth's number of the wheel 3, depending on the radius or teeth's number of the wheel 2 and the efficiencies involved in the operation of the mechanism:
a
rr
ηηη 3412
23 = (1)
respectively:
a
zz
ηηη 3412
23 = . (2)
where [ ] means the floor function symbol. It has been shown in Mitrache et al., 2020 why the efficiencies are fixed:
14231 === dra ηηη .

P. Cardei, R. Ciuperca, A. Muscalu, S. Muraru
222
Figu
re 2
The
syste
m th
at m
odel
s the
wor
king
pro
cess
of t
he se
edlin
g pl
ante
r
Planting errors in the exploitation of seedling planters, causes and improvement solutions
223
RESULTS AND DISCUSSION
Limits of variation of the radius and number of the sprocket teeth The wheel 3 will be called the control wheel, and his teeth number will be calculated
according to the number of teeth of the wheel 2. Supposing that the minimum and maximum values of the efficiencies involved in
equations (1) and (2) are known:
maxminmax3434min34max1212min12 0,0,0 aaa ηηηηηηηηη ≤≤<≤≤<≤≤< (3) then the next inequality occurs:
maxmax343412minmin34min12 aaaa x ηηηηηηηηη ≤≤ . (4) From (4) is obtained the next inequalities:
minmin34min123412maxmax34
111
aaaa x ηηηηηηηηη≤≤ (5)
Multiplying the series of inequalities (5) by z2, is obtained:
minmin34min12
2
3412
2
maxmax34
2
aaaa
zzx
zηηηηηηηηη
≤≤ (6)
or:
minmin34min12
23
maxmax34
2
aaa
zz
xz
ηηηηηη≤≤ (7)
conclusion reached if the theory of interval algebra is used Alefeld and Herzburger, 2012.
Dependence of number teeth of the wheel 3, by the teeth number of the wheel 2 and the efficiencies
We consider that the minimum values of the three efficiencies are: η12min = 0.96, η34min = 0.96, ηamin = 0.9, and the maximum ones are ideal, i.e. equal to 1. The variation of the number of teeth of wheel 3 depending on the number of teeth of wheel 2, for the ideal efficiencies and a real combination of efficiencies, is represented graphically in Figure 3. It is observed that as the efficiencies decrease, the number of teeth of the wheel 3 must be increased compared to that of the wheel 2, in order to achieve the condition of good functioning of the planting mechanism. For a number of teeth of the wheel 2 comprised between 20 and 30, in the case of the real efficiencies from Figure 3, the difference in teeth between wheel 3 and wheel 2, increases from 4 to 6 teeth.
A graphical image of the dependence of the number of teeth of the wheel 3 on the number of teeth of the wheel 2 and on the efficiency of the drive wheel is given in Figure 4. One can observe the linear dependence (abstraction of the steps of the floor function) on the number

P. Cardei, R. Ciuperca, A. Muscalu, S. Muraru
224
of teeth of the wheel 2 and nonlinear on the efficiency of the drive wheel. The non-linear dependence on the efficiency of the driving wheel is better observed if the surface of the above-mentioned dependence is represented for lower values of efficiency (below 0.7), which are, however, unlikely to be encountered in the operation of the car.
Figure 3 Dependence of the number of teeth of wheel 3, by the number of teeth of wheel 2, for two combinations of efficiencies (one ideal and the other real)
Figure 4 Dependence of the number of teeth of the wheel 3, by the number of teeth of wheel 2 and by the drive wheel efficiency

Planting errors in the exploitation of seedling planters, causes and improvement solutions
225
Planting error The calculation method of the planting error was given in (Mitrache et al., 2020). If the
working speed is constant and the chain transmission efficiencies are constant, the planting error receives a simple expression:
−⋅=
2
33412
0 1zz
NL
ac
drpl ηηηε (8)
Formula (8) shows that the absolute value of the planting error increases with the length of the articulation circle of the cups but decreases with the number of articulated cups. Also, the absolute error increases with the ratio between the number of teeth of the gear 3 and that of the number of teeth of the wheel 2.
Figure 5 Variation of the absolute planting error with the number of teeth of the wheel 2
The variation of the absolute planting error with the number of teeth of the gear 2, for three
values of the number of teeth of the gear 3, is represented graphically in Figure 5. It is observed that there are values of the number of teeth of wheels 2 and 3 that lead to the decrease of the absolute error until the cancellation (unlikely cases). This aspect is more easily noticeable in the graph in Figure 6.
Figure 6 Variation of the absolute planting error with the number of teeth of wheel 2

P. Cardei, R. Ciuperca, A. Muscalu, S. Muraru
226
Figure 7 Variation of the planting error with the number of teeth of wheel 2 (detail)
Figure 8 Variation of the planting error with the number of teeth of wheel 2 (detail)
In Figures 7 and 8 is graphically represented the variation of the planting error depending
on the number of teeth of the wheel 2. In this way the sign of the error can be noticed. In the literature, it is accepted that the efficiency of chain transmission is satisfactory if its
efficiency value is included in the range between 0.96 and 0.98. The efficiency value decreases with the wear of the mechanism. It is expected that during the planting of a plot or even a planting season, this yield will not vary significantly (and after revisions, will be brought to maximum values). The efficiency of the drive wheel can vary significantly over time (actually in space), because the interaction between the wheel and the ground produces variations, due to the inhomogeneity of the structure and soil moisture or possible variations in working speed.
CONCLUSIONS
The main conclusions of the study are: Theoretically, there is the possibility of establishing an optimal point in the space of the
parameters of the mathematical model of the seedling planter. The argument of this statement consists in the fact that the objective function (the planting error) can be minimized by choosing the right number of teeth of wheel 3 depending on the number of teeth of wheel 2

Planting errors in the exploitation of seedling planters, causes and improvement solutions
227
and the yields involved in the process. This conclusion was mentioned in [1] and is now being verified.
The optimal integers for wheel 3 depend on the number of teeth of the wheel 2 and by the values of the efficiencies involved in the process.
The optimal choice of the number of teeth of the wheel 2 (free parameter in the optimization process), is influenced by the number of teeth and the diameter of the division of the wheel 1. It is recommended that through the transmission thus made, the yield loss must be reduced.
Precision fluctuations are influenced by the efficiency of the drive chain, but especially by the efficiency of the drive wheel. The efficiency of the drive wheel can vary greatly over short sections of the trajectory and can lead to significant variations in the sign of planting error. A classification of the causes of planting errors is as follows:
- - functional causes: they are produced by the variation of the transmission efficiencies with chains and drive wheels;
- - causes of process management: variations in working speed, shocks due to variation in soil structure, system supply shocks in the system, vertical or lateral random movements of the aggregate.
Modelling seedling planting machines as systems (in the sense of systems theory), facilitates the identification of all parameters that influence their work process. The systemic vision leads to a classification of the intensity of the influence of the input parameters on the output parameters, especially of the qualitative ones. Applications are easily obtained as well as variants of their capitalization.
Proposals to improve planting accuracy Considering the results and conclusions, the following solutions can be used to improve
the planting precision: - -reducing the wear of the transmission chains; - -reducing the wear of the sprockets; - -equipment of the drive wheel with sticks of variable size; - -introduction of elements to stretch the chains to improve efficiency; - -the introduction instead of wheel 3 of a cogset (as in competition bikes), with a
suitable number of sheets, to adjust the precision in the real conditions of the field. The number of teeth of the cogset will differ by one, maximum of two teeth between the gears.
Ways to continue improving the seedling planting machine One of the interesting directions for the development of the study is to increase the planting
speed (within the limits of the possibility of the feeder). This would increase productivity, (Patrico, 2014), (Gullickson, 2014). To achieve this goal, the effects of increasing working speed on the planting error and yields involved must be studied. Interesting studies concern the effects of wheel diameter 1 on drive wheel slip, respectively of the wheel diameter 4 on planting accuracy.
P. Cardei, R. Ciuperca, A. Muscalu, S. Muraru
228
REFERENCES
Ahmad, L., Mahdi, S.S. (2018). Satellite Farming, An information and Technology Based Agriculture. Springer Nature Switzerland AG.
Alefeld G., Herzberger J. (2012). Introduction to Interval Computation. Academic Press. Ani O., Uzoejinwa B.B., Anochili N.F. (2016). Design, construction and evaluation of a vertical plate
maize seed planter for gardens and small holder farmers. Nigerian Journal of Technology 35, 647-655.
Belea C. (1985). Teoria Sistemelor, Sisteme neliniare. Editura Didactica si Pedagogica, Bucuresti. Dexonline. (2020). https://dexonline.ro/definitie/fluctua%C8%9Bie Fu W., Gao N., An X., Zhang J. (2018). Study on Precision Application Rate Technology for maize no-
tillage planter in North China Plain. ScienceDirect, IFAC PapersOnLine 51, 412-417. Gullickson G. (2018). 8 ways to set your planter for success. SF Successful Farming. Ionescu V. (1985). Teoria Sistemelor, Sisteme liniare. Editura Didactica si Pedagogica, Bucuresti. Mitrache P., M., Cardei P., Ciuperca R., Sfiru R., Saracin I. (2020). Analysis and modelling of the
transmission of a seedling machine. International Symposium: 10th Edition ISB INMA TEH, Agricultural and Mechanical Engineering. Bucuresti, 701-711.
Murray J.R., Tullberg J.N., Basnet B.B. (2006). Planters and their Components. Elect Printing, Canberra. Patrico J. (2014). Planter Speeds: How Fast is Too Fast?-DTN. AgFax.
https://agfax.com/2014/03/13/planter-speeds-fast-fast-dtn/ Reis A.V., Forcellini F.A. (2002). Functional analysis in the evaluation of four concepts of planters.
Ciencia Rural, 32, 969-975. Schiere J.B., Groenland R., Vlug A.H., Van Keulen H. (2004). System thinking in agriculture: an
overview. System Thinking in Agriculture an overview. Emerging Challenges for farming systems - lessons from Australian and Dutch agriculture. Rural Industries Research and Development Corporation. P.O. Box 4776, Kingston Act 2604.
Scott J. (2015). 10 tips for High-speed planting. SF Successful Farming. https://www.agriculture.com/machinery/farm-implements/planters/10-tips-f-highspeed-plting_231-ar47375
Virk, S.S., Fulton, J.P., Porter, W.M. (2020). Row-crop planter performance to support variable-rate seeding of maize. Precision Agriculture 21, 603–619.
Voicu M. (2008). Teoria sistemelor. Editura Academiei Romane, Bucuresti Zarco-Tejada P., Hubbard J. N., Loudjani P. (2014). Precision agriculture:an opportunity for EU
farmers-potential support with the CAP 2014-2020. Joint Research Centre (JRC) of the European Commission; Monitoring Agriculture Resources (MARS) Unit H04.
Wanzhi Z., Chenglong L., Zhaoqin L., Xieteng Q., Haoyu L., Jialin H. (2020). Optimized Design and Experiment on Novel Combination Vacuum and Spoon Belt Metering Device for Potato Planters. Mathematical Problems in Engineering, 2, 1-12.
Yazgi A., Degirmenencioglu A. (2006). Optimization of the Performance of a Precision Planter Metering Cotton Seed Using Response Surface Methodology. Conference: Portland, Oregon. In: Turk J Agric For, 36, 133-144.
48th Symposium "Actual Tasks on Agricultural Engineering", Zagreb, Croatia, 2021
229
RESEARCH OF PEA SEED SORTING IN THE SLOPING AIR FLOW
Edvardas VAICIUKEVIČIUS1*, Rolandas DOMEIKA1, Egidijus ŠARAUSKIS1, Algirdas JASINSKAS1, Paulius JASEVIČIUS1, Kęstutis ROMANECKAS2
*E-mail of corresponding author: [email protected] 1 Institute of Agricultural Engineering and Safety, Faculty of Agricultural Engineering,
Vytautas Magnus University, Studentu 15, Akademija, LT-53362, Kaunas distr., Lithuania 2 Institute of Agroecosystems and Soil Sciences, Faculty of Agronomy, Vytautas Magnus University,
Studentu 11, Akademija, LT-53361, Kaunas distr., Lithuania
ABSTRACT
Laboratory tests of pea seeds sorting in sloping air flow were performed in the laboratory of the Institute of Agricultural Engineering and Safety of Vytautas Magnus University. Research of pea seeds sorting in the air flow have been carried out with the aim of sowing the sorted pea seeds as catch crops. The main goal of the research was to determine the possibilities of pea seeds sorting in the air flow and to justify rational sorting parameters.
Investigations of pea seeds sorting in sloping air flow were performed with a pneumatic seeds separator designed and manufactured in the laboratory. Pea seed moisture and aerodynamic properties were determined and the air flow velocity dispersion in the seed sorting chamber was measured. This dispersion depended on the position of the air flow guides as well as the air flow velocity. The pea seed feed was altered from 90 to 110 kg min-1 by changing the air flow velocity and the angle of the air flow position.
It was found that pea seeds are evenly distributed in the sloping flow of the sorting chamber when the position angle of the air flow guides is 45˚. The sloping air stream could separate 80% of the larger pea seeds suitable for sowing.
Key words: pea seeds, sorting, air flow.
INTRODUCTION
Vertical, horizontal and inclined air flow is used for cleaning and sorting the seeds. Regularity of movement of seeds and impurities in the air flow is influenced by aerodynamic properties, which are influenced by seed mass, shape, and surface properties (Srivastava et al., 2006; Choszcz et al., 2020). Seed sorting is greatly influenced by the air flow velocity
48. ACTUAL TASKS ON AGRICULTURAL ENGINEERING
Original scientific paper
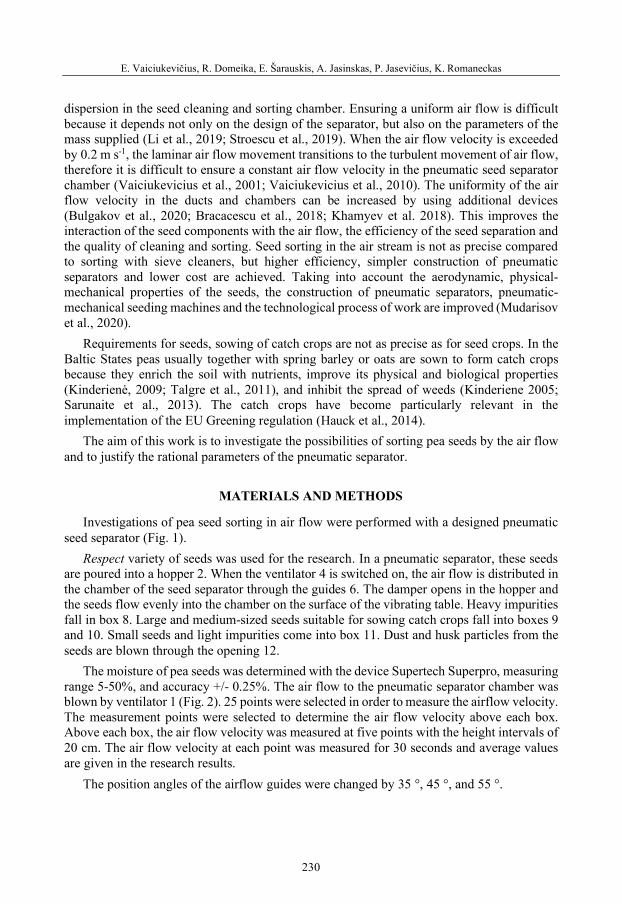
E. Vaiciukevičius, R. Domeika, E. Šarauskis, A. Jasinskas, P. Jasevičius, K. Romaneckas
230
dispersion in the seed cleaning and sorting chamber. Ensuring a uniform air flow is difficult because it depends not only on the design of the separator, but also on the parameters of the mass supplied (Li et al., 2019; Stroescu et al., 2019). When the air flow velocity is exceeded by 0.2 m s-1, the laminar air flow movement transitions to the turbulent movement of air flow, therefore it is difficult to ensure a constant air flow velocity in the pneumatic seed separator chamber (Vaiciukevicius et al., 2001; Vaiciukevicius et al., 2010). The uniformity of the air flow velocity in the ducts and chambers can be increased by using additional devices (Bulgakov et al., 2020; Bracacescu et al., 2018; Khamyev et al. 2018). This improves the interaction of the seed components with the air flow, the efficiency of the seed separation and the quality of cleaning and sorting. Seed sorting in the air stream is not as precise compared to sorting with sieve cleaners, but higher efficiency, simpler construction of pneumatic separators and lower cost are achieved. Taking into account the aerodynamic, physical-mechanical properties of the seeds, the construction of pneumatic separators, pneumatic-mechanical seeding machines and the technological process of work are improved (Mudarisov et al., 2020).
Requirements for seeds, sowing of catch crops are not as precise as for seed crops. In the Baltic States peas usually together with spring barley or oats are sown to form catch crops because they enrich the soil with nutrients, improve its physical and biological properties (Kinderienė, 2009; Talgre et al., 2011), and inhibit the spread of weeds (Kinderiene 2005; Sarunaite et al., 2013). The catch crops have become particularly relevant in the implementation of the EU Greening regulation (Hauck et al., 2014).
The aim of this work is to investigate the possibilities of sorting pea seeds by the air flow and to justify the rational parameters of the pneumatic separator.
MATERIALS AND METHODS
Investigations of pea seed sorting in air flow were performed with a designed pneumatic seed separator (Fig. 1).
Respect variety of seeds was used for the research. In a pneumatic separator, these seeds are poured into a hopper 2. When the ventilator 4 is switched on, the air flow is distributed in the chamber of the seed separator through the guides 6. The damper opens in the hopper and the seeds flow evenly into the chamber on the surface of the vibrating table. Heavy impurities fall in box 8. Large and medium-sized seeds suitable for sowing catch crops fall into boxes 9 and 10. Small seeds and light impurities come into box 11. Dust and husk particles from the seeds are blown through the opening 12.
The moisture of pea seeds was determined with the device Supertech Superpro, measuring range 5-50%, and accuracy +/- 0.25%. The air flow to the pneumatic separator chamber was blown by ventilator 1 (Fig. 2). 25 points were selected in order to measure the airflow velocity. The measurement points were selected to determine the air flow velocity above each box. Above each box, the air flow velocity was measured at five points with the height intervals of 20 cm. The air flow velocity at each point was measured for 30 seconds and average values are given in the research results.
The position angles of the airflow guides were changed by 35 °, 45 °, and 55 °.

Research of pea seed sorting in the sloping air flow
231
Figure 1 Pneumatic seed separator: 1 – valve; 2 – bunker; 3 – motoreductor; 4 – ventilator;
5 – screw feeder; 6 – air flow deflectors; 7 – control panel; 8 – heavy impurity box; 9 – largest seed box; 10 – medium-sized seed box; 11 – light seed box;
12 – seed husk discharge opening.
Figure 2 Scheme for measuring the air flow velocity of a pneumatic seed separator:
1 – fan; 2 – hole; I, II, III, IV, V – boxes.

E. Vaiciukevičius, R. Domeika, E. Šarauskis, A. Jasinskas, P. Jasevičius, K. Romaneckas
232
Ventilator 1 was used to blow the air pumped from the environment into a separator chamber where the seeds were sorted into separate boxes.
Above each box, the air flow velocity was measured with a device GM816 with an error of 2–3%, at five points with the intervals of 200 mm from the air flow guides and every 200 mm from the seed outlets. Each test was replicated three times and the obtained measurement results were processed statically.
RESULTS AND DISCUSSION
The influence of the dispersion of air flow velocity on pea seed sorting was investigated at air flow velocities of 10.5 m·s-1, 11.5 m s-1 and 12.5 m s-1 by changing the position angles of the guides by 35 °, 45 ° and 55 °.
The study found that with the air flow velocity of 10.5 m s-1, the air flow at a height of 0.4 m and 0.6 m prevailed at a distance of 0.6 m from the guides. Under the influence of the guides, the air flow was directed to a height of 0.8 m and 1 m. The highest air flow velocity was at the distance of 0.2 cm from the guides at the height of 0.6 m – it reached 10.43 m s-1.
After increasing the air flow velocity to 11.5 m s-1 in the seed sorting chamber (Fig. 3), the highest speed was reached at the distance of 0.2 m from the guides at the height of 0.6 m – it was 11.36 m s-1. Behind the guides higher air flow velocity prevailed at the height of 0.4 m and 0.6 meters, above further boxes – at the height of 0.8–1.0 meters.
Figure 3 Air flow velocity dispersion in the sorting chamber when the air flow velocity is
11.5 m s-1, pea seed moisture – 15.6%, average critical seed velocity – 11.28 m s-1, guide position angle – 45 °
3.3
2.10.1
0 0
7.4 8.7
6.9
2.9
0
11.4 10.9
8.67.7
2.8
0
5.6
11.1
9.5 9.4
0
1.9
10.6
10.7 10.8
0
2
4
6
8
10
12
0.2 0.4 0.6 0,8 1
Air
flow
vel
ocity
in (m
s-1)
Distance between the boxes (m)
Air flow velocity dispersion at the height of 0.2 metersAir flow velocity dispersion at the height of 0.4 metersAir flow velocity dispersion at the height of 0.6 metersAir flow velocity dispersion at the height of 0.8 metersAir flow velocity dispersion at the height of 1 meter

Research of pea seed sorting in the sloping air flow
233
When the air flow velocity exceeded 11.5 m s-1, most of the pea seeds were blown into the boxes further.
The air flow velocity dispersion in the seed sorting chamber is influenced by the position of the guides. By tilting the guides at a 35˚ angle in the seed sorting chamber (Fig. 4), it was found that the highest air flow rate velocity was in the lower part of the sorting chamber, above the boxes. The pea seeds then collide with the rear wall of the sorting chamber, collapsing unevenly into the boxes. Due to the impact of the smaller vertical component of the air flow, the majority of the pea seeds fell into the first boxes. Consequently, it can be stated that the air flow blown at an angle of 35˚ is not suitable for sorting pea seeds.
With an angle of air flow guides of 45˚ in the seed sorting chamber (Fig. 3), the highest air flow velocity was with the distance of 0.2 meters from the guides at a height of 0.6 m. Large unadulterated pea seeds entered the second box, medium-sized seeds – the third, small seeds – the fourth, and impurities – the fifth box. We can argue that setting the angle of air flow guides of 45 °allowed cleaning and sorting the pea seeds rationally.
Figure 4 Air flow velocity dispersion in the sorting chamber when the angle of guides’ position is 35°, pea seed moisture – 15.6%, average critical seed velocity – 11.3 m s-1
Examination of the air flow velocity dispersion in the seed sorting chamber at the 55˚
guide position angle (Fig. 5) showed that the highest air flow velocity was in the upper part of the seed sorting chamber. Valuable pea seeds and some medium-value seeds got into the third box. The fourth box contained about 74% of the medium-value seeds, together with fine
3.62.6
0.3 0.1 0.1
7.8 8.5
7.3
2.9
0.1
11.511.2
9.28.4
6.9
0
4.9
10.2 9.9 9.5
01.3
8.77.2 7.1
0
2
4
6
8
10
12
14
0.2 0.4 0.6 0.8 1Distance between the boxes (m)
Air flow velocity dispersion at the height of 0.2 metersAir flow velocity dispersion at the height of 0.4 metersAir flow velocity dispersion at the height of 0.6 metersAir flow velocity dispersion at the height of 0.8 metersAir flow velocity dispersion at the height of 1 meter
Air
flow
vel
ocity
(m
s-1)

E. Vaiciukevičius, R. Domeika, E. Šarauskis, A. Jasinskas, P. Jasevičius, K. Romaneckas
234
impurities it accounted for about 26%, as the air flow rate decreases to almost zero above the last boxes.
The flow of pea seeds supplied varied from 90 to 110 kg min-1 (Fig. 5). Previous studies found that increasing the flow of supplied seeds created smaller gaps between the seeds in the air flow, and more light impurities were released in the seed environment due to the increased air flow velocity (Khamyev et al., 2016).
With a pea seed flow of 90 kg min-1, the majority of pea seeds entered the third box. Even heavier impurities were blown into the second box. In the third and fourth boxes, about 83% of the total weight of impurities fell together with the seeds.
After determining the flow of pea seeds of 100 kg min-1, it was observed that most of the pea seeds entered the second and third boxes (about 78%). Heavy impurities fell into the first box, the largest seeds – into the second, medium-sized seeds – into the third box. Small and light seeds and impurities fell into the fourth and fifth boxes.
Figure 5 The influence of pea seed flow on seed distribution in boxes when the
pea seed moisture is 15.6%, average critical seed velocity is 11.3 m s-1, air flow velocity – 11.5 m s-1, angle of guides’ position is 45°
After increasing the flow of pea seeds to 110 kg min-1, most of the large and medium-sized
seeds got into the second box. Together with the seeds in the second and third boxes, there was about 78% of the total weight of impurities, so such a flow of peas supplied is too high. It was found that the most effective flow of pea seeds supplied is 100 kg min-1.
The air flow velocity in the seed sorting chamber was altered from 10.5 to 12.5 m s-1 (Fig. 6). With the air flow velocity of 10.5 m s-1, about 87% of the seeds entered the second and third boxes due to the fact that the air flow velocity was too low to pull out the pea seeds in the sorting chamber. The second box contained a large amount of medium-sized pea seeds, while the third box – about 62% of small impurities together with the seeds.
-10
0
10
20
30
40
50
60
70
80
1 2 3 4 5
Air
flow
vel
ocity
(m
s-1)
Boxes90 kg min⁻¹ 95 kg min⁻¹ 100 kg min⁻¹ 105 kg min⁻¹ 110 kg min⁻¹
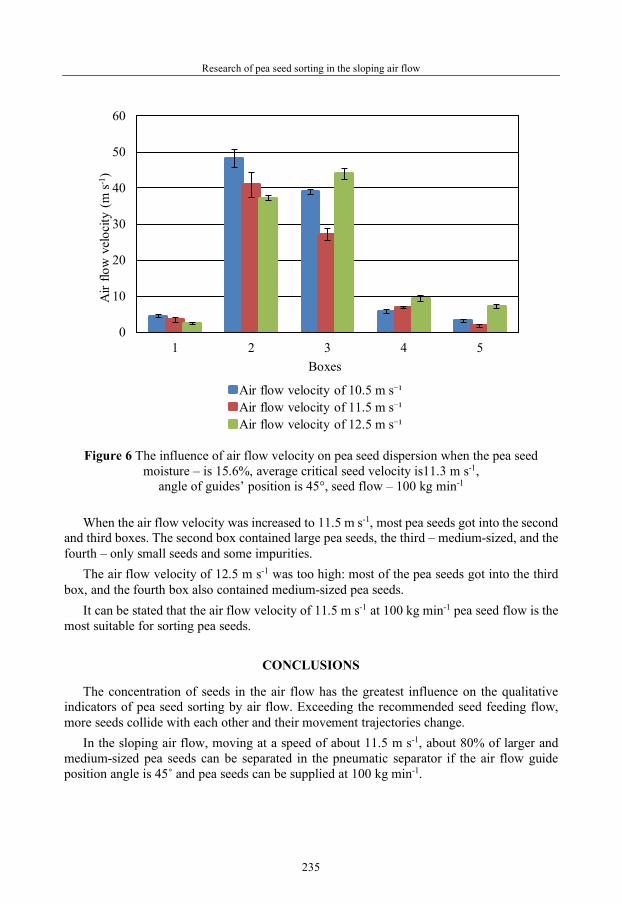
Research of pea seed sorting in the sloping air flow
235
Figure 6 The influence of air flow velocity on pea seed dispersion when the pea seed
moisture – is 15.6%, average critical seed velocity is11.3 m s-1, angle of guides’ position is 45°, seed flow – 100 kg min-1
When the air flow velocity was increased to 11.5 m s-1, most pea seeds got into the second
and third boxes. The second box contained large pea seeds, the third – medium-sized, and the fourth – only small seeds and some impurities.
The air flow velocity of 12.5 m s-1 was too high: most of the pea seeds got into the third box, and the fourth box also contained medium-sized pea seeds.
It can be stated that the air flow velocity of 11.5 m s-1 at 100 kg min-1 pea seed flow is the most suitable for sorting pea seeds.
CONCLUSIONS
The concentration of seeds in the air flow has the greatest influence on the qualitative indicators of pea seed sorting by air flow. Exceeding the recommended seed feeding flow, more seeds collide with each other and their movement trajectories change.
In the sloping air flow, moving at a speed of about 11.5 m s-1, about 80% of larger and medium-sized pea seeds can be separated in the pneumatic separator if the air flow guide position angle is 45˚ and pea seeds can be supplied at 100 kg min-1.
0
10
20
30
40
50
60
1 2 3 4 5
Air
flow
vel
ocity
(m
s-1)
Boxes
Air flow velocity of 10.5 m s⁻¹Air flow velocity of 11.5 m s⁻¹Air flow velocity of 12.5 m s⁻¹

E. Vaiciukevičius, R. Domeika, E. Šarauskis, A. Jasinskas, P. Jasevičius, K. Romaneckas
236
REFERENCES
Choszcz, D. J., Reszczy, P., S., Kolankowska, E., Stanisław Konopka, S., Lipinski, A. (2020). The Effect of Selected Factors on Separation Efficiency in a Pneumatic Conical Separator. Sustainability 12, 3051: 2-12.
Srivastava, K., Carroll, E. Goering, Roger, P. Rohrbach, Dennis, R. Buckmaster. (2006). Grain Harvesting. Chapter 12 in Engineering Principles of Agricultural Machines, 2nd ed., Asabe, St. Joseph, Michigan, 403-435.
Bulgakov, V., Nikolaenko, S., Holovach, I., Boris, A., Kiurchev, S., Ihnatiev, Ye., and Olt, J. (2020). Theory of motion of grain mixture particle in the process of aspiration separation. Agronomy Research 18(S2): 1177-1188.
Vaiciukevicius, E., Urba, A., Spokas, L. (2001). Research of Chaf Separation in a Sloping Air Flow. Agricultural engineering 33(4): 17-38. (in Lithuanian)
Bracacescu, C., Gageanu, P., Bunduchi, G., Zaica, A. (2018). Considerations on Technical Equipment Used for Cleaning and Sorting Seed Mixtures Based on Aerodynamic Principle. In: Engineering for Rural Development, Jelgava, 39-44.
Khamyev, V., Gulyev, A. and Boiko, A. (2018). Justification of the Design of Pneumatic Sorting Machine for the Preparation of Selection Seeds. In: International Conference on Modern Trends in Manufacturing Technologies and Equipment, Sevastopol, 224, 05008.
Vaiciukevicius, E. Sarauskis, E., Jasinskas, A., Sakalauskas, A., Butkus, V., Straksas, A. (2010) Consistent patterns of detail movement in variable free air flow. Journal of Food, Agriculture & Environment 8, 2: 370-374.
Li, X., J., Zhang, J. Ji (2019). Analysis of Airflow Velocity Field Characteristics of an Oat Cleaner Based on Particle Image Velocimetry Technology. American Society of Agricultural and Biological Engineers, 35(2): 193-203.
Khamuev, V.G. (2016). Intensity of Light Impurities Separation in Vertically Ascending Air Flow. Agricultural Machinery and Technologies 5, 12-16.
Stroescu, G., Pӑun, A, Voicu, G., Brӑcӑcescu, C., Popa, R. and Popa, V. (2019). Researches on the separation of impurities from a seed flow based on the aerodynamic principle. E3S Web of Conferences; Les Ulis, Vol. 112, 1-7.
Mudarisov, S., Badretdinov, I., Zinnur Rakhimov, Z., Lukmanov, R., Nurullinb, E. (2020). Numerical simulation of two-phase “Air-Seed” flow in the distribution system of the grain seeder. Computers and Electronics in Agriculture. 168, 105151: 1-7.
Kinderienė, I. (2005). The influence of catch crops on the composition, number and frequency of weeds growing in cereal crops on hilly soils. Agriculture 91(3): 40-54.
Kinderienė, I. (2009). The effect of organic fertilizers and catch crops on the physical properties of eroded soil. Zemdirbyste-Agriculture 96(4): 15-31.
Sarunaite, L., Deveikyte, I., Arlauskiene, A., Kadziuliene, Z., Maiksteniene, S. (2013). Pea and spring cereal intercropping system: Advantages and suporession of broad-leaved weeds. Pol. J. Environ. Stud. 22(2): 541-551.
Talgre, L., Lauringson, E., Makke, A., Lauk, R. (2011). Biomass production and nutrient binding of catch crops. Žemdirbyste (Agriculture) 98(3): 251-258.
48th Symposium "Actual Tasks on Agricultural Engineering", Zagreb, Croatia, 2021
237
THE USAGE MOTOR DRILL IN FORESTRY PLANTING Adrian Doru PICA1, Florinel BOJA2, Alin TEUŞDEA3, Ciprian FORA4, Mihaela
MOATAR4, Nicuşor BOJA2*
*E-mail of corresponding author: [email protected] 1Department Forest Engineering Forest Management Planning and Terrestrial Measurements,
Faculty of Silviculture and Forest Engineering,Transilvania University of Brasov 2Department Engineering and Informatics, Faculty of Economics, Informatics and Engineering,
“VasileGoldiş” Western University of Arad, LiviuRebreanu Street nr. 91-93, 310414 Arad, Romania 3Department of Animal Husbandry and Agro-tourism, Faculty of Environmental Protection,
University of Oradea, Gen. Magheru 26, 410396 BH, Oradea, Romania 4Department Forestry, Banat University of Agricultural Sciences and Veterinary Medicine `King
Mihai I, 119 Aradului Avenue, Timisoara, Romania
SUMMARY
The objectives of the research were to make a comparative determination, on different types of soil, of the qualitative parameters, among which the most important ones are: timing of drilling holes, fuel consumption for the drilling of the hole, evacuate ratio, degree of evacuation of the soil from the hole, medium range scattering, settlement angle, resistance to penetration, resistance to shearing, degree of scattering of the soil taken out from the hole, degree of loosening of the soil taken and left in the hole, using the Stihl BT 121 auger in order to establish its technical efficiency.
We started by measuring the particle size distribution and the main physical properties of the soil (moisture, bulk density and total porosity) and then, we determined the duration of drilling holes, split times (duration of movement from one hole to the other) and the fuel consumption when using a Stihl BT 121 auger equipped with a 150/200 mm diameter drill.
Keywords: ground auger, physical properties, timing of drilling holes
INTRODUCTION
The need to afforest greater and greater surfaces in Romania as a result of widely known causes, together with the development of forestry nurseries that are able to produce a certain quantity of saplings to cover the production needs, imply an enormous work volume in the afforestation sector which is difficult to carry out only by manual means.
48. ACTUAL TASKS ON AGRICULTURAL ENGINEERING
Original scientific paper
A. D. Pica, F. Boja, A. Teuşdea, C. Fora, M. Moatar, N. Boja
238
In the future, the afforestation activity will become compulsory in even greater surfaces. For this reason, we consider that the optimal solution in this case is the mechanization of hole digging for planting saplings by using ground augers.
From this point of view, there is a wide range of ground augers able to mechanically dig holes for saplings, which are available on the market. In order to comparatively observe the performance rate, we used a Stihl ground auger. From the very many types of machinery available in Romania, we have chosen for the study regarding the auger performance in terms of fuel consumption: the Stihl BT 121 auger (Popescu et al., 2013).
The research was carried out to observe the auger efficiency and to make measurements regarding the quantity and auger performance in a shift (8 hours) (Popescu, 2006; Boja et al., 2018a).
The soil is the environment of the growth and development of the saplings, because in it and through it there are the nutritive elements and the activity of the micro-organisms in the context of a normal thermo-aero-hydro regime. It can be penetrated by the roots of the plants, it is stirred, it contains water, air and living matter (flora and fauna) and it represents the necessary support for the growth and development of the saplings (Boja, N., and Borz, SA., 2020).
The characteristic of the soil as a growth and development environment for the plans is given by a series of properties (texture, structure, porosity, compaction, reaction, humus content and nutritive elements), expressed globally through the notion of fertility (Popescu and Derczeni, 2006; Boja et al., 2018b).
Because of the compaction, while digging holes for planting saplings, there are several phenomena of friction occurring which increase the resistance to penetration through the walls of the hole. For the same reason, the soil offers resistance to some mechanical, exterior forces, presenting resistance to compression, shearing and penetration (Onet et al., 2016).
An intermediate option is that of motor-manually assisted planting operations, which have the potential to overcome the effort required to prepare the holes while preserving the quality of planting. To this end, augers may be used to prepare planting pits, as they are more consistent in producing well-shaped clean holes in a wide range of soil conditions. Given the equipment used, which is based on two-stroke internal combustion engines, auger planting may result, similar to other motor-manual operations, in a significant exposure to noise and vibration (Boja et al., 2018a; Luoranen et al.,2018; Ersson et al.,2018).
MATERIALS AND METHODS
The experimental research was conducted in two forest divisions in the plains (Fig. 1). For this purpose, we chose the soils which are most frequently spread in those areas. In this respect, we made measurements in order to determine the moisture, the bulk density, the total porosity and the particle size analysis of the soils. The particle size analysis of the soils was carried out in a specialized laboratory.

The usage motor drill in forestry planting
239
Figure 1 Experimental field map
We determined the fuel consumption and digging duration for each hole, but also the split
times (duration of movement from one hole to the other). The digging duration and the split times were determined by using a timer; for determining the fuel consumption, we placed inside the tank a precise quantity of fuel and after depleting it, we related it to the digging duration and we multiplied it with the digging time allotted for each hole, according to the relation (1):
Qn = Q∑T
∙ tn (1)
where: Qn is the fuel quantity needed for each hole, Q – total quantity of fuel placed in the tank, ∑T – total sum of digging duration of the holes tn – duration of digging of a hole
The technical characteristics of the ground auger Stihl BT 121 are given in Table 1.
Table 1 Technical data of the ground auger Stihl BT 121(www.stihl.ro)
Cylindrical capacity 30,8 cm³ Weight 9,4 kg Power 1,3/1,8 kW/CP Level of vibrations left/right 2,2/2,5 m/s² Speed of rotation 190 1/min Level of acoustic pressure 103,0 dB(A) Level of acoustic pressure 109,0 dB(A)
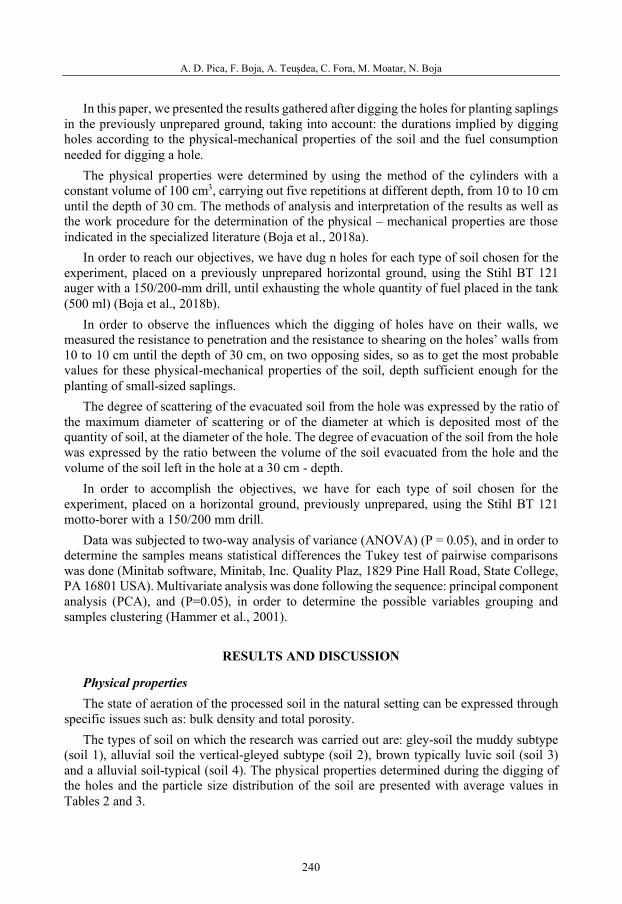
A. D. Pica, F. Boja, A. Teuşdea, C. Fora, M. Moatar, N. Boja
240
In this paper, we presented the results gathered after digging the holes for planting saplings in the previously unprepared ground, taking into account: the durations implied by digging holes according to the physical-mechanical properties of the soil and the fuel consumption needed for digging a hole.
The physical properties were determined by using the method of the cylinders with a constant volume of 100 cm3, carrying out five repetitions at different depth, from 10 to 10 cm until the depth of 30 cm. The methods of analysis and interpretation of the results as well as the work procedure for the determination of the physical – mechanical properties are those indicated in the specialized literature (Boja et al., 2018a).
In order to reach our objectives, we have dug n holes for each type of soil chosen for the experiment, placed on a previously unprepared horizontal ground, using the Stihl BT 121 auger with a 150/200-mm drill, until exhausting the whole quantity of fuel placed in the tank (500 ml) (Boja et al., 2018b).
In order to observe the influences which the digging of holes have on their walls, we measured the resistance to penetration and the resistance to shearing on the holes’ walls from 10 to 10 cm until the depth of 30 cm, on two opposing sides, so as to get the most probable values for these physical-mechanical properties of the soil, depth sufficient enough for the planting of small-sized saplings.
The degree of scattering of the evacuated soil from the hole was expressed by the ratio of the maximum diameter of scattering or of the diameter at which is deposited most of the quantity of soil, at the diameter of the hole. The degree of evacuation of the soil from the hole was expressed by the ratio between the volume of the soil evacuated from the hole and the volume of the soil left in the hole at a 30 cm - depth.
In order to accomplish the objectives, we have for each type of soil chosen for the experiment, placed on a horizontal ground, previously unprepared, using the Stihl BT 121 motto-borer with a 150/200 mm drill.
Data was subjected to two-way analysis of variance (ANOVA) (P = 0.05), and in order to determine the samples means statistical differences the Tukey test of pairwise comparisons was done (Minitab software, Minitab, Inc. Quality Plaz, 1829 Pine Hall Road, State College, PA 16801 USA). Multivariate analysis was done following the sequence: principal component analysis (PCA), and (P=0.05), in order to determine the possible variables grouping and samples clustering (Hammer et al., 2001).
RESULTS AND DISCUSSION
Physical properties The state of aeration of the processed soil in the natural setting can be expressed through
specific issues such as: bulk density and total porosity. The types of soil on which the research was carried out are: gley-soil the muddy subtype
(soil 1), alluvial soil the vertical-gleyed subtype (soil 2), brown typically luvic soil (soil 3) and a alluvial soil-typical (soil 4). The physical properties determined during the digging of the holes and the particle size distribution of the soil are presented with average values in Tables 2 and 3.
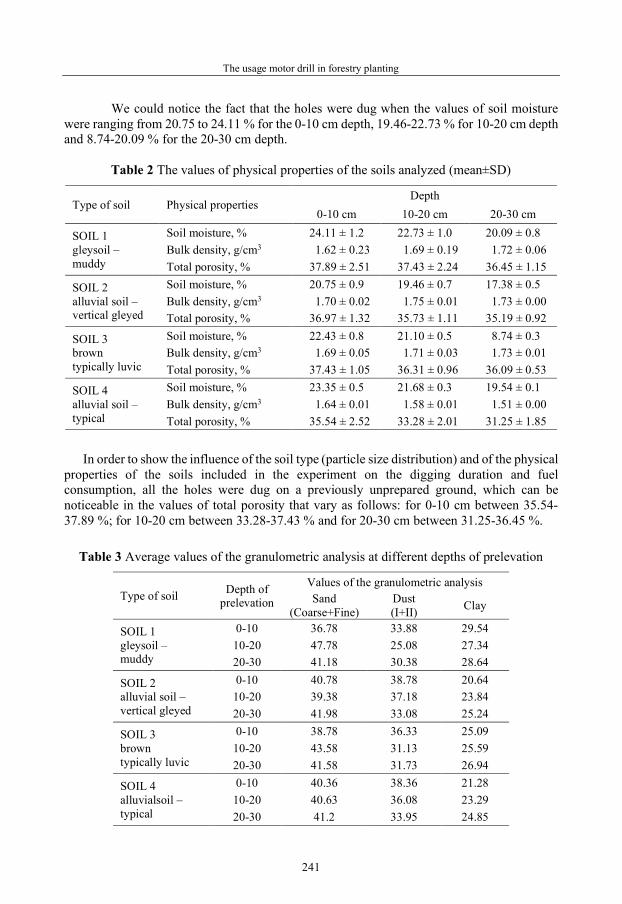
The usage motor drill in forestry planting
241
We could notice the fact that the holes were dug when the values of soil moisture were ranging from 20.75 to 24.11 % for the 0-10 cm depth, 19.46-22.73 % for 10-20 cm depth and 8.74-20.09 % for the 20-30 cm depth.
Table 2 The values of physical properties of the soils analyzed (mean±SD)
Type of soil Physical properties Depth
0-10 cm 10-20 cm 20-30 cm
SOIL 1 gleysoil – muddy
Soil moisture, % 24.11 ± 1.2 22.73 ± 1.0 20.09 ± 0.8 Bulk density, g/cm3 1.62 ± 0.23 1.69 ± 0.19 1.72 ± 0.06 Total porosity, % 37.89 ± 2.51 37.43 ± 2.24 36.45 ± 1.15
SOIL 2 alluvial soil – vertical gleyed
Soil moisture, % 20.75 ± 0.9 19.46 ± 0.7 17.38 ± 0.5 Bulk density, g/cm3 1.70 ± 0.02 1.75 ± 0.01 1.73 ± 0.00 Total porosity, % 36.97 ± 1.32 35.73 ± 1.11 35.19 ± 0.92
SOIL 3 brown typically luvic
Soil moisture, % 22.43 ± 0.8 21.10 ± 0.5 8.74 ± 0.3 Bulk density, g/cm3 1.69 ± 0.05 1.71 ± 0.03 1.73 ± 0.01 Total porosity, % 37.43 ± 1.05 36.31 ± 0.96 36.09 ± 0.53
SOIL 4 alluvial soil – typical
Soil moisture, % 23.35 ± 0.5 21.68 ± 0.3 19.54 ± 0.1 Bulk density, g/cm3 1.64 ± 0.01 1.58 ± 0.01 1.51 ± 0.00 Total porosity, % 35.54 ± 2.52 33.28 ± 2.01 31.25 ± 1.85
In order to show the influence of the soil type (particle size distribution) and of the physical
properties of the soils included in the experiment on the digging duration and fuel consumption, all the holes were dug on a previously unprepared ground, which can be noticeable in the values of total porosity that vary as follows: for 0-10 cm between 35.54-37.89 %; for 10-20 cm between 33.28-37.43 % and for 20-30 cm between 31.25-36.45 %.
Table 3 Average values of the granulometric analysis at different depths of prelevation
Type of soil Depth of prelevation
Values of the granulometric analysis Sand
(Coarse+Fine) Dust (I+II) Clay
SOIL 1 gleysoil – muddy
0-10 36.78 33.88 29.54 10-20 47.78 25.08 27.34 20-30 41.18 30.38 28.64
SOIL 2 alluvial soil – vertical gleyed
0-10 40.78 38.78 20.64 10-20 39.38 37.18 23.84 20-30 41.98 33.08 25.24
SOIL 3 brown typically luvic
0-10 38.78 36.33 25.09 10-20 43.58 31.13 25.59 20-30 41.58 31.73 26.94
SOIL 4 alluvialsoil – typical
0-10 40.36 38.36 21.28 10-20 40.63 36.08 23.29 20-30 41.2 33.95 24.85

A. D. Pica, F. Boja, A. Teuşdea, C. Fora, M. Moatar, N. Boja
242
Qualitative parameters Significant differences between the borer type and between the four types of soils studied
in relation to the physical and mechanical properties of the soil were assessed using two-way ANOVA (Figs. 2–9), principal component analysis (PCA), linear discriminant analysis (LDA) (Figs. 10-11) and multivariate analysis of variance (MANOVA) (Boja et al., 2016)
The highest value for the duration of digging was registered for the 2nd type of soil (17,708 s), while the lowest value appeared in the case of the 1st type of soil (8,553 s). Taking into account the diameter of the drill and the type of soil, the maximum digging duration was noted with the 15-cm diameter drill on the 2nd type of soil (D15*Soil02=23,420 s), while the minimum one was found with the 15-cm diameter drill on the 1st type of soil (D15*Soil01=5,407 s).
Analysed only from the perspective of the type of soil, the fuel consumption reached maximum values on the 2nd type of soil (5,649 ml) and minimum ones on the 1st type of soil (4,513 ml). Analysed both from the perspective of the type of soil and the type of drill, the fuel consumption reached maximum values with the 15-cm diameter drill on the 4th type of soil (D15*Soil04=6,863 s) and minimum ones with the 20-cm diameter drill on the 4th type of soil (D20*Soil01=3,486 s). In the present case, the amplitude of variance of fuel consumption can reach values of ±3,377 ml in the same pedological conditions.
Figure 2 Interaction plots (two-way ANOVA) for the factors soils type and borer type for
the investigated timing of drilling holes (Time)
The volume of the earth removed reached maximum values in case of the 4th type of soil (0,180 m3) and minimum ones with the 1st type of soil (0,005 m3). The same values also apply when we take into account both the type of soil and drill: a maximum value was acquired in the case of the 15-cm diameter drill on the 4th type of soil (D15*Soil04=0,352 m3) and a minimum one with the 15-cm diameter drill on the 1st type of soil (D15*Soil01=0,003 m3).
The removal ratio acquires maximum values for the holes dug in the 3rd type of soil and minimum ones for the 2nd type. However, when we analyse both the type of soil and drill,

The usage motor drill in forestry planting
243
maximum values appear with the 20-cm diameter drill on the 4th type of soil (D20*Soil04=6,012) and minimum ones with 15-cm diameter drill on the 4th type of soil (D15*Soil04=2,903).
The average radius of scattering of the earth removed had maximum values in the case of the 4th type of soil (34,355 cm), and miminum ones with the 2nd type of soil (13,495 cm). The same situation occurs when we analyse both the type of soil and drill: a maximum value is reached with the 15-cm diameter drill on the 4th type of soil (D15*Soil04=36,125 cm) and a minimum one with the 20-cm diameter drill on the 2nd type of soil (D20*Soil02=12,899 cm).
The angle of placement of the earth removed reaches maximum values in the case of the 3rd type of soil (22,578o), and minimum ones in the 1st type of soil (11,213o). By analysing this qualitative index both from the point of view of the type of soil and drill, a maximum value is reached with the 20-cm diameter drill on the 2nd type of soil (D20*Soil02=32,399o and a minimum one with the 15-cm diameter drill on the 1st type of soil (D15*Soil01=9,597o).
By analysing the values of the penetration resistance, only from the point of view of the soil, the highest value is met in the case if the 4th type of soil (2,557 daN∙cm-2) and the lowest one in the 3rd type (1,734 daN∙cm-2). Thus, there is a very low risk that saplings could experience a physiological unbalance due to the fact that their roots cannot penetrate the sides of the holes (as a result of the fact that they were pressed during execution).
Figure 3 Interaction plots (two-way ANOVA) for the factors soils type and borer type for
the investigated fuel consumption (Gas) The same situation also occurs in the case of the analysis based on both the type of soil
and drill, as we run a very low risk of pressing the sides of the holes: a maximum value appears with a 20-cm diameter drill on the 4th type of soil (D20*Soil04=2,822 daN∙cm-2) and a minimum one with the 15-cm diameter drill on the 3rd type of soil (D15*Soil03=1,232 daN∙cm-2).

A. D. Pica, F. Boja, A. Teuşdea, C. Fora, M. Moatar, N. Boja
244
Figure 4 Interaction plots (two-way ANOVA) for the factors soils type and borer type for
the investigated degree of evacuation (Evac_Vol) A similar situation also occurred in the case of the shear resistance measured in the holes:
the highest value was acquired in the 2nd type of soil (2,658 daN∙cm-2) and a minimum one in the 3rd type (2,236 daN∙cm-2). The quotas are maintained for the values involving both the type of soil and drill, as the maximum value was reached with a 20-cm diameter drill on the 2nd type of soil (D20*Soil02=3,016 daN∙cm-2 and a minimum one with the 15-cm diameter drill on the 3rd type of soil (D15*Soil03=1,530 daN∙cm-2).
Figure 5 Interaction plots (two-way ANOVA) for the factors soils type and borer type for
the investigated evacuate ratio (Evac_Ratio)

The usage motor drill in forestry planting
245
Figure 6 Interaction plots (two-way ANOVA) for the factors soils type and borer type for
the investigated medium range scattering (meanR)
PCA analysis was calculated using the correlation matrix of the variables and the between group algorithm. First two principal components explain 65,24% from the total variance of the data. The first three principal components explain 81,89% from the total variance of the data (Fig. 10). To alleviate the samples groups overlapping in PCA biplot, there was used the linear discriminant analysis (LDA) which uses canonical projections similar with the PCA method but aims to increase the linear distance between the samples groups (i.e. to get a better discrimination). Figure 11 presents the 3D representation of the samples groups using the first three canonical axes of LDA.
Figure 7 Interaction plots (two-way ANOVA) for the factors soils type and borer type for
the investigated settlement angle (Sett_Angl)
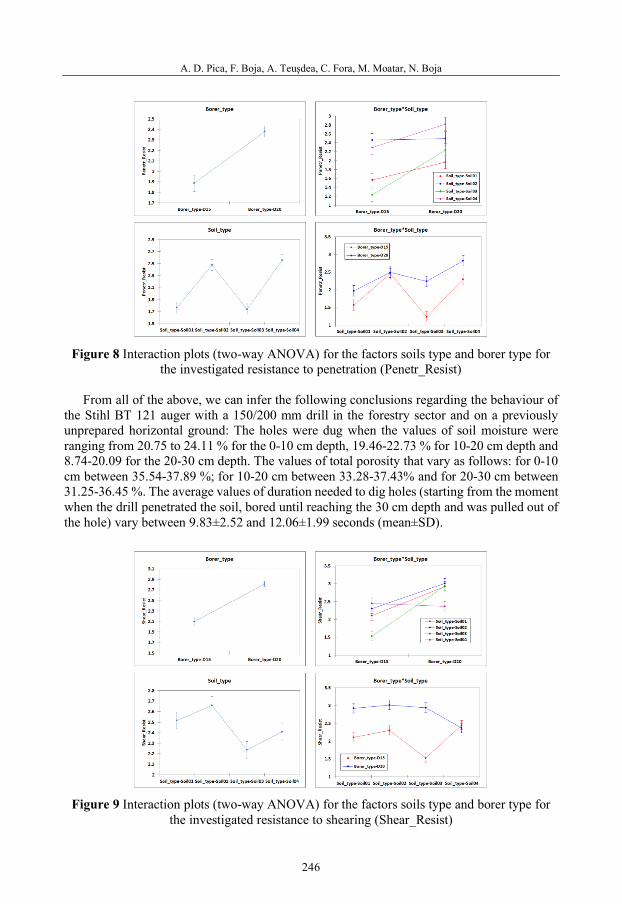
A. D. Pica, F. Boja, A. Teuşdea, C. Fora, M. Moatar, N. Boja
246
Figure 8 Interaction plots (two-way ANOVA) for the factors soils type and borer type for
the investigated resistance to penetration (Penetr_Resist)
From all of the above, we can infer the following conclusions regarding the behaviour of the Stihl BT 121 auger with a 150/200 mm drill in the forestry sector and on a previously unprepared horizontal ground: The holes were dug when the values of soil moisture were ranging from 20.75 to 24.11 % for the 0-10 cm depth, 19.46-22.73 % for 10-20 cm depth and 8.74-20.09 for the 20-30 cm depth. The values of total porosity that vary as follows: for 0-10 cm between 35.54-37.89 %; for 10-20 cm between 33.28-37.43% and for 20-30 cm between 31.25-36.45 %. The average values of duration needed to dig holes (starting from the moment when the drill penetrated the soil, bored until reaching the 30 cm depth and was pulled out of the hole) vary between 9.83±2.52 and 12.06±1.99 seconds (mean±SD).
Figure 9 Interaction plots (two-way ANOVA) for the factors soils type and borer type for
the investigated resistance to shearing (Shear_Resist)
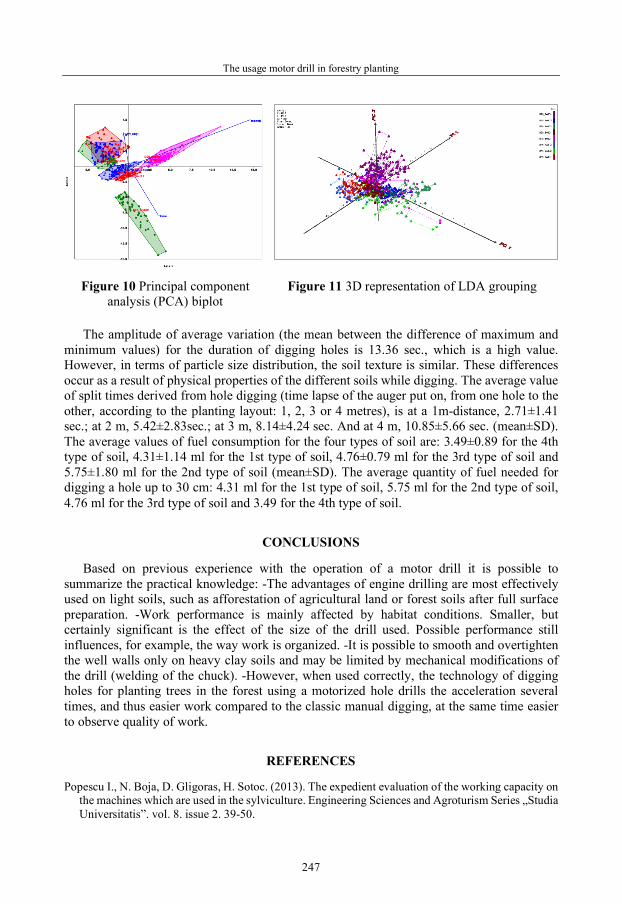
The usage motor drill in forestry planting
247
Figure 10 Principal component analysis (PCA) biplot
Figure 11 3D representation of LDA grouping
The amplitude of average variation (the mean between the difference of maximum and
minimum values) for the duration of digging holes is 13.36 sec., which is a high value. However, in terms of particle size distribution, the soil texture is similar. These differences occur as a result of physical properties of the different soils while digging. The average value of split times derived from hole digging (time lapse of the auger put on, from one hole to the other, according to the planting layout: 1, 2, 3 or 4 metres), is at a 1m-distance, 2.71±1.41 sec.; at 2 m, 5.42±2.83sec.; at 3 m, 8.14±4.24 sec. And at 4 m, 10.85±5.66 sec. (mean±SD). The average values of fuel consumption for the four types of soil are: 3.49±0.89 for the 4th type of soil, 4.31±1.14 ml for the 1st type of soil, 4.76±0.79 ml for the 3rd type of soil and 5.75±1.80 ml for the 2nd type of soil (mean±SD). The average quantity of fuel needed for digging a hole up to 30 cm: 4.31 ml for the 1st type of soil, 5.75 ml for the 2nd type of soil, 4.76 ml for the 3rd type of soil and 3.49 for the 4th type of soil.
CONCLUSIONS
Based on previous experience with the operation of a motor drill it is possible to summarize the practical knowledge: -The advantages of engine drilling are most effectively used on light soils, such as afforestation of agricultural land or forest soils after full surface preparation. -Work performance is mainly affected by habitat conditions. Smaller, but certainly significant is the effect of the size of the drill used. Possible performance still influences, for example, the way work is organized. -It is possible to smooth and overtighten the well walls only on heavy clay soils and may be limited by mechanical modifications of the drill (welding of the chuck). -However, when used correctly, the technology of digging holes for planting trees in the forest using a motorized hole drills the acceleration several times, and thus easier work compared to the classic manual digging, at the same time easier to observe quality of work.
REFERENCES
Popescu I., N. Boja, D. Gligoras, H. Sotoc. (2013). The expedient evaluation of the working capacity on the machines which are used in the sylviculture. Engineering Sciences and Agroturism Series „Studia Universitatis”. vol. 8. issue 2. 39-50.

A. D. Pica, F. Boja, A. Teuşdea, C. Fora, M. Moatar, N. Boja
248
Boja, N., Boja, F., Teusdea, A., Vidrean, D., Marcu, M.V., Iordache, E., Duţă, C.I., Borz, S.A. (2018a). Resource Allocation, Pit Quality, and Early Survival of Seedlings Following Two Motor-Manual Pit-Drilling Options. Forests, 9, 665.
Popescu I. (2006). Technological Variants of Mechanization for Digging Holes for Planting Saplings in Cavities. Proceedings of the Biennial International Symposium. Forest and Sustainable Development. 159-164.
Boja, N., Borz, S.A. (2020). Energy Inputs in Motor-Manual Release Cutting of Broadleaved Forests: Results of Twelve Options. Energies, 13, 4597.
Popescu I., R. Derczeni. (2006). Technical Means and Procedures to Dig Holes with Protecting Cavities for the Saplings. Proceedings of the Biennial International Symposium. Forest and Sustainable Development. 153-158.
Boja N., Boja F., Vidrean D., Teusdea A., Bungescu S., Borz SA., (2018b). Soil compression degree by using the vibro-combinator. INMATEH-Agricultural Engineering vol. 55, no.2. 77-86.
Onet A., A. Teusdea, N. Boja, C. Domuta, C. Onet. (2016). Effects of common oak (Quercus robur L.) defolition on the soil properties of an oak forest in Western Plain of Romania. Annals of Forest Research. Volume 59. Issue 1. 33-47.
Luoranen, J.; Saksa, T.; Lappi, J. (2018). Seedling, planting site and weather factors affecting the success of autumn plantings in Norway spruce and Scots pine seedlings. For. Ecol. Manag., 419, 79–90.
Ersson, B.T.; Laine, T.; Saksa, T. (2018). Mechanized tree planting in Sweden and Finland: Current state and key factors for future growth. Forests, 9, 370.
*** www.stihl.ro. Hammer O., D. A. T. Harper, P. D. Ryan. (2001). Past: Paleontological Statistics Software Package for
Education and Data Analysis. Palaeontologia Electronica, 4(1) 9. Boja N., F. Boja, A. Teusdea, P.A. Dărău, C. Maior. (2016). Soil porosity and compaction as influenced
by tillage methods. Journal of Environmental Protection and Ecology (JEPE). vol. 17. no. 4. 1315–1323.
48th Symposium "Actual Tasks on Agricultural Engineering", Zagreb, Croatia, 2021
249
OIL EXTRACTION FROM RAPESEED WITH SCREW PRESS FOR SMALL SCALE PRODUCTION
Tomaž POJE*, Viktor JEJČIČ
*E-mail of corresponding author: [email protected] Agricultural Institute of Slovenia, Department of Agricultural Engineering and Energy,
Hacquetova ulica 17, SI – 1000 Ljubljana, Slovenia
ABSTRACT
For constructor and for final user the performances of screw press are very important. The work studies performance of cold pressing of rapeseed with screw press for use on farms. For pressing of oilseeds, a screw press Hocem PHS 100 was used. Nozzle diameters 8 and 12 mm were used and 10, 20 and 40 rpm of screw. At 8 mm nozzle diameter and 10 rpm of screw was found 24.85 % oil extraction, 460 W of average electric power consumption and specific energy consumption 349.8 kJ/kg of oil. At 12 mm nozzle diameter and 10 rpm of screw was found 20.4 % oil extraction, 420 W of average electric power consumption and specific energy consumption 389.1 kJ/kg of oil. It was also found that the required electrical power increases with increasing speed of screw. Higher electrical power is also required for press to compress the seeds with a nozzle of smaller diameter. The specific energy per kilogram of extracted oil also increases with greater speed of the screw. The yield of oil decreases with the greater speed of screw and with the larger diameter of the nozzle.
Keywords: rapeseed, screw press, electric power, specific energy, oil yield
INTRODUCTION
The production of cold-pressed oil is based on the extraction of oils by mechanical extraction of seeds. Mechanical seed extrusion is performed with mechanical continuous screw-type presses. Compression of oilseeds can be done in one or two stages. Two-stage pressing of oilseeds means that the oil cake from the first stage of pressing goes back into the press and is pressed again. Compression is usually performed in only one stage. Two-stage pressing is used to get the highest possible yield of a certain oilseed (variety) or to test the performance of the press. Typically, the second stage is energy consuming compared to the amount of oil obtained in the second stage of pressing.
There are definitions of cold pressed oil that are related to the temperature of the pressed oil. 50 °C is most often mentioned as the limit temperature. In some literature, like book “Oils
48. ACTUAL TASKS ON AGRICULTURAL ENGINEERING
Preliminary communication

T. Poje, V. Jejčič
250
for Nutrition, Health and Body Care” author states that the oil should not be heated above 40 °C during the pressing process (Merljak and Merljak, 2014). Slovenian producer of edible oil GEA d.o.o., states that for cold-pressed oils, the oil temperature should not exceed 50 °C (GEA, 2020).
According to the Statistical Office of the Republic of Slovenia, in 2019 in Slovenia were 8709 hectares sown with oilseeds. Of this, 37.7% of the area was devoted to oil pumpkins. It is immediately followed by oilseed rape with almost the same share (37.4 %). Soybeans were sown on 16.5 % of the area and sunflower on 3.8 % of the areas intended for oilseeds. Other oilseeds were sown on only 413 hectares, which represents a 4.7 % share among oilseeds. The most oilseeds, namely 11,787 ha, were in Slovenia in the year 2010 (SURS, 2020). Oilseeds are grown for their oil and by product - oil cakes. Edible oil is obtained in oil mills on family farms, small enterprises or in oil companies with industrial edible oil production. In recent years in Slovenia rising number of oil mills with cold pressing all types of oilseeds. Hot pressing oil from pumpkins has long been present on Slovenian market. According to available data, Slovenia does not have a comprehensive list of oil mills that press oil on a cold basis.
Zanetti et al. (2013) compared twenty-four oilseed species relative to oil composition and potential adaptability to different regions of Europe. Widely cultivated species, such as oilseed rape (Brassica napus L.), sunflower (Helianthus annuus L.), and flax (Linum usitatissimum L.), are compared with new species, some of which are well documented in literature, while others are still underdeveloped. The possible geographical allocation in Europe is discussed taking into account physiological and agronomical constraints. Zdanowska et al. (2019) determined the impact of preliminary ultrasound treatment on performance indicators of the process of continuous oil from rape. Processing of seeds with ultrasound at the frequency of 40 kHz increased oil flow rate and energy efficiency. Oil yield was at the same level for the ultrasound method; however, the pressing temperature was much lower after the processing. Bogaert et al. (2018) studied oil seeds mechanical expression in a screw press. For this purpose, a pilot-scale screw press (0–40 kg/h) was instrumented by installing sixteen pressure sensors and three temperature probes throughout the screw. Their results showed that increasing the rotation speed enhances the press capacity and decreases the passage time, reduces the extraction yield and the specific energy consumption. Romero-Guzmán et al. (2020) the oleosome extraction yield predominantly depends on the mechanical forces. These shear forces are able to break the cell walls and release the cellular material while maintaining the integrity of oleosomes. The oleosomes extracted with twin-screw press have similar characteristics than those obtained by the blending process. Mizera et al. (2018) focused on the analysis of optimize the pressing process of rapeseeds (Brassica napus L.) using screw press Farmet Farmer 20 – duo. Oil recovery efficiency and specific mechanical energy were decreased when the seed material throughput was increased. It has been found that the optimal operation point for screw press Farmer 20 – duo was at 20 kg h- 1 rapeseed throughput. The specific mechanical energy at the optimal operation point was 0.61 kWh kg-1 oil. Maximum oil recovery efficiency 82.6% was found at the lowest screw speed. Kasote et al. (2013) studied quality of linseed oil. The yield of linseed oil pressed with a single screw expeller was progressively increased with application of presses. Singh and Bargale (2020) stated that the mechanical oil expellers (screw presses) leave about 8–14% of the expressible oil in the deoiled cake, so that a large quantity of edible oil is not available for human consumption. They designed and developed a modified oil expeller with a novel principle of single feed

Oil extraction from rapeseed with screw press for small scale production
251
double stage compression. They evaluated the performance of the developed expeller. In two passes it recovered over 90% of the available oil. The throughput capacity of the expeller was 25 kg/h while its effective capacity (two passes) was found to be 15 kg/h.
The aim of this study was to analyse the pressing process at different screw rotation speed and different nozzle diameter for rapeseeds pressing with domestic screw press Hocem PHS 100.
MATERIALS AND METHODS
The experiments were carried out on mechanical screw press Hocem PHS 100, which allows continuous compression of oilseeds. The screw press is powered by a 2.2 kW electric motor. Frequency inverter connected to the electric motor allows controlling the frequency of the electric current, and as a consequence of the motor speed and the screw speed. Nozzle diameter and screw speed were varied as the processing parameters. Two size of nozzles (nozzle diameter 8 mm and 12 mm) and three screw speeds (10, 20 and 40 rpm.) were used. Rotation speed of screw, electric power, mass of seed, mass of oil and mass of cake were measured. Rapeseeds (Brassica napus L.) were used for this experiment. Rapeseed had 8 % of the moisture content. The obtained results were analysed using appropriate statistical methods.
RESULTS AND DISCUSSION
This investigation analysed cold pressing of rapeseed with screw press. The speed of the screw for transporting and compressing the seed and also nozzle diameter were changed on screw press. Measurements were performed at 10, 30 and 40 rpm of screw and at 8 and 12 mm nozzle diameter.
Figure 1 shows the average electrical power for the selected pressing parameters. The electric power increases with increasing screw speed at both nozzle diameters. Two linear regressions for the required power with respect to the screw speed are calculated. For seed compression using an 8 mm nozzle, the linear regression is y = 46.143 x - 19 (R2 = 0.997). The required electrical power is lower for a nozzle with a larger diameter (12 mm). The highest electric power was reached by the 8 mm of nozzle diameter at 40 rpm speed of screw.
Figure 2 shows the specific energy for the input seed and the extruded oil according to the screw speed and the nozzle diameter. The specific energy consumption calculated per kilogram of oil extracted increases with increasing screw speed. With a nozzle diameter of 8 mm, the specific energy calculated per kg of extruded oil increases according to the linear regression y = 9.5718 x + 296.15 (R2 = 0.9994), and with a nozzle with 8 mm the linear regression y = 6.7998 x + 274.72 (R2 = 0.9918).
Figure 3 shows the oil yield as a percentage with respect to changing speed and nozzle size. It was found that oil yield decreases with increasing screw speed and larger nozzle diameter. Linear regression was also calculated for both nozzle sizes. The highest yields when producing rapeseed oil were reached by the 8 mm of nozzle diameter at 10 rpm speed of screw. It was found, that in the oil cake remain some expressible oil. For the better extraction of oil, it is necessary to press the rapeseed with smaller nozzle diameter than we had or put the oilcake into second stage of pressing.

T. Poje, V. Jejčič
252
Figure 1 Electrical power for pressing of rapeseed with different screw speeds and different
nozzles diameter
Figure 2 Specific energy for pressing of rapeseed with different screw speed and different
nozzle diameter
y = 46,143x - 10R² = 0,9997
y = 42xR² = 1
0
200
400
600
800
1000
1200
1400
1600
1800
2000
0 5 10 15 20 25 30 35 40 45
Pow
er (
W)
Rotational speed (rpm)
Nozzle diameter 8 mm Nozzle diameter 12 mm
Linearna (Nozzle diameter 8 mm) Linearna (Nozzle diameter 12 mm)
y = 6,7998x + 274,72R² = 0,9918
y = 9,5718x + 296,15R² = 0,9994
0
100
200
300
400
500
600
700
800
0 5 10 15 20 25 30 35 40 45
Spec
ific
ener
gy (k
J/kg
)
Rotational speed (rpm)
Oil, nozzle diameter 8 mm Seed, nozzle diameter 8 mm Oil, nozzle diameter 12 mm
Seed, nozzle diameter 12 mm Linearna (Oil, nozzle diameter 8 mm) Linearna (Oil, nozzle diameter 12 mm)

Oil extraction from rapeseed with screw press for small scale production
253
Figure 3 Extraction yield of oil for pressing of rapeseed with different screw speeds and
different nozzle diameters Results show that nozzle diameter used on screw press has a big influence on required
power, specific energy and yield of oil. For optimisation of energy input and mass flow it is better to have many different diameters of nozzles, especially when pressing different kind of oilseed. The temperature of extracted oil is also depending on nozzle diameter and screw speed. These results can be used only for the given screw speed and given nozzle diameter of screw press Hocem PHS 100.
Similar trends of results were also determined for other manufacturer and type of screw press and other oil seed (Mizera 2018, Chapuis et al 2014)). Bogaert et al (2018) also studied the impact of the screw rotation speed on the press performances. Their results with Reinartz AP08 screw press show that increasing the rotation speed enhances the press capacity and decreases the passage time and reduces the extraction yield. On the screw press were used rapeseeds and flax and screw speed in the range of 0 – 18 rpm. Singh and Bargale (2020) also stated that some types of screw presses leave about 8–14 % of the expressible oil in the de-oiled cake.
CONCLUSIONS
When pressing the oilseed rape with a cold oil press PHS 100, by this investigation was determined the required power to drive the press at the nozzle diameter of 8 and 12 mm and at three different revolutions of the press screw. It was found that the required electrical power increases with increasing screw speed. Greater electrical power is also required to compress the seeds with a nozzle of smaller diameter. The specific energy per kilogram of extracted oil also increases with greater speed of the screw. The yield of oil decreases with the greater
y = -0,2911x + 27,625R² = 0,9984
y = -0,275x + 22,65R² = 0,9758
0
5
10
15
20
25
30
0 5 10 15 20 25 30 35 40 45
Estr
actio
n yi
eld
(%)
Rotational speed (rpm)
Nozzle diameter 8 mm Nozzle diameter 12 mm
Linearna (Nozzle diameter 8 mm) Linearna (Nozzle diameter 12 mm)
T. Poje, V. Jejčič
254
speed of screw and with the larger diameter of the nozzle. Such measurements, where the operating parameters of the press can be changed, are necessary for the correct design of the press construction, such as determining the size of the gearbox and the electric motor, as well as for optimizing the press assembly. The data are also useful and necessary for the user of the press from the energy optimization, productivity, yield of oil etc. point of view.
REFERENCES
Bogaert, L., Mathieu, H., Mhemdi, H., Vorobiev, E. (2018). Characterization of oilseeds mechanical expression in an instrumented pilot screw press. Industrial Crops and Products, Volume 121, Pages 106-113, ISSN 0926-6690, https://doi.org/10.1016/j.indcrop.2018.04.039.
Chapuis,A., Blin, J., Carré, P., Lecomte, D. (2014) Separation efficiency and energy consumption of oil expression using a screw-press: The case of Jatropha curcas L. seeds, Industrial Crops and Products, Volume 52, 2014, Pages 752-761
Kasote, D., K., Badhe, Y., S., Hegde M., V., (2013). Effect of mechanical press oil extraction processing on quality of linseed oil, Industrial Crops and Products, Volume 42, Pages 10-13, ISSN 0926-6690, https://doi.org/10.1016/j.indcrop.2012.05.015.
Merljak. M., Merljak J.P., (2014). Olja za prehrano, zdravje in nego telesa. ČZD Kmečki glas, Ljubljana. 202 str.
Mizera, Č., Herák, D., Hrabé, P., Kabutey, A. (2018). Extraction of oil from rapeseed using duo screw press. Agronomy Research, vol. 16, Special Issue 1, pp. 1118-1123, https://doi.org/10.15159/AR.18.059
Romero-Guzmán, M.J., Jung, L., Kyriakopoulou, K., Boom, R.M., Nikiforidis, C.V. (2020). Efficient single-step rapeseed oleosome extraction using twin-screw press. Journal of Food Engineering, Volume 276, 109890, ISSN 0260-8774, https://doi.org/10.1016/j.jfoodeng.2019.109890
Singh, J., Bargale, P.C. (2000). Development of a small capacity double stage compression screw press for oil expression, Journal of Food Engineering, Volume 43, Issue 2, Pages 75-82, ISSN 0260-8774, https://doi.org/10.1016/S0260-8774(99)00134-X.
SURS Statistični urad RS. (2020). Pridelava poljščin (ha, t, t/ha), Slovenija, letno. https://pxweb.stat.si/SiStatData/pxweb/sl/Data/-/1502402S.px
Tovarna olj GEA. (2020). Proizvodnja olja. https://gea.si/olja-od-a-z/#proizvodnja-olja Zanetti, F, Monti, A., Berti, M.T. (2013). Challenges and opportunities for new industrial oilseed crops
in EU-27: A review, Industrial Crops and Products, Volume 50, Pages 580-595, ISSN 0926-6690, https://doi.org/10.1016/j.indcrop.2013.08.030.
Zdanowska, P., Dróżdż, B., Janakowski, S., Derewiaka, D. (2019) Impact of preliminary ultrasound treatment of rape seeds on the pressing process and selected oil characteristics. Industrial Crops and Products, Volume 138, 111572, ISSN 0926-6690, https://doi.org/10.1016/j.indcrop.2019.111572

48th Symposium "Actual Tasks on Agricultural Engineering", Zagreb, Croatia, 2021
255
THE FUTURE OF PASTURE MANAGEMENT IN GERMANY – ASPECTS OF TECHNOLOGY AND
REGULATION Josef J. BAUERDICK*, Berenike KRÖCK, Maximilian TREIBER, Heinz BERNHARDT
*E-mail of corresponding author: [email protected] Chair of Agricultural Systems Engineering, Technical University of Munich, Dürnast 4,
85354 Freising, Germany
ABSTRACT
According to experts, pasturing in Europe has been decreasing for many years. Nevertheless, due to different factors, in Germany as well as in other European countries, pasturing is on the rise again, mainly due to consumer awareness. Moreover, the governmental aim of an increasing number of organic farms, leads to a higher amount of pasturing as this is mandatory in EU regulations. Today, a lot of different pieces of regulation in Germany, as well as in Europe exist, affecting farmers when they bring their cows to pasture. Furthermore, there are social requirements for pasturing which need to be considered. Factors like increasing relevance of animal welfare, environmental protection or the recreational use of the environment and aesthetics of landscape come into play.
Therefore, scientific research and new solutions are needed. Those solutions can either be embodied in improved management practices or in the development and implementation of new technologies.
This paper aims to give an overview across selected pasture related regulation affecting Farmers in Germany and Europe. Furthermore, aspects which are not directly regulated by government but are expectations of society will be highlighted. Concluding from this, technological possibilities -already on market and in the pipeline of scientific research- which may help future farmers gain legal certainty and simplify work on pastures, will be described.
Results show that today several different attempts are given to improve pasturing. Most of these attempts are focusing on improvement of management tasks. On one side software-based improvements are in focus, to bring up and improve already existing Grassland Management Systems for German conditions. On the other side attempts are directly focusing on technological improvements. Known examples are focusing on growth and quality of
48. ACTUAL TASKS ON AGRICULTURAL ENGINEERING
Review paper

J. J. Bauerdick, B. Kröck, M. Treiber, H. Bernhardt
256
grassland or virtual fencing. It can be concluded that new tools for pasturing can increase productivity and simultaneously decrease management tasks. Nevertheless, pricing of these tools as well es the amount of bureaucracy will be the most crucial factor for their adaption.
Key words: pasturing, digitization, regulations, digital transformation, cattle
INTRODUCTION
Pasturing in Europe has been decreasing for many years (Reijs et al., 2013; van den Pol-van Dasselaar et al., 2020). Recently however, there is a “renaissance” (LfL, 2020) in Bavaria, Germany. Other countries, like the Netherlands also report slight increases (van den Pol-van Dasselaar et al., 2020).
Pasturing is connected to considerable expenditure for farmers. Schoof et al. (2019) categorize different expenses of pasturing. These range from pasture-management, choice of adequate livestock and genetics, as well as the correct time of bringing the cows to the pasture and back. Further factors to take into consideration are stocking density, pasture division, care measures of the pasture, as well as veterinary control and additional feeding. Next to this management related aspects, economic and social aspects have an impact on dairy farmers in decision making of whether or not to bring their livestock to pasture. Reijs et al. (2013) name different pros and cons of pasturing, listed below.
Aspects which will have a negative impact on pasturing are for example: - increasing costs for labor, capital, and technology, - milk price, which is expected not to increase in the same way as the before mentioned
costs - positive developments in the livestock technology sector, like Automated Milking
Systems (AMS), - due to economic aspects, farms expand in size, leading to limited grazing areas around
a farm and a need for more efficient management. Aspects with positive impact can be: - cost reduction due to reduction in necessary machinery equipment or hours and due to
lower housing costs during grazing season, - animal welfare can be strengthened as cows can express their natural behavior on a
pasture, - the health of animals is expected to be better when pasturing is offered. In conclusion, the image of a farm and of a whole product can be increased when grazing
is offered (Reijs et al., 2013). Despite the above-mentioned facts, governmental regulations need to be considered as
well, when farmers decide to do pasturing. One of the most important things within these regulations is that a farmer must provide documentation in case of any accident.
Figure 1 shows legal and social requirements of pasturing based on a literature review. Natural requirements as a further factor will be described in plain text, following the graphs.

The future of pasture management in Germany – aspects of technology and regulation
257
Figure 1 Legal (numbers) and social (letters) requirements of pasturing
(Kröck, 2020, modified)
Legal requirements About 13 different general categories can be classified when screening legal aspects of
pasturing. These 13 categories can then be divided into 42 different factors. Within this publication only the most crucial aspects will be considered. Farmers (1) must insure their farm for any upcoming liability issues. Next to this, due to the “Animal welfare ordinance” of Germany (TierSchNutztV, 2006) a farmer is forced to inspect animals and their supplies (like water (5) or fodder (6)) once a day. Another crucial aspect is shown with (2). Especially in the alps, close encounters between hikers and animals happen, as hikers must walk through pastures. In Germany, there is a right of free movement in nature for everyone, so people can get very close to the animals which leads to fatalities in extreme cases. A farmer has to ensure that fences are adequate for the fenced animals and state of the art. Depending on the kind of animal which has to be fenced, different requirements are given by Priebe et al. (2016). Furthermore, a farmer must ensure that the fence is always working properly. In case of an incident, he has to prove that he took care for these points for example with a “pasture diary” (Priebe et al., 2016). (4) shows aspects of animal health. Regarding aspects like epidemic protection and animal health different regulations like the “Animal Welfare Act” (TierSchG, 2006), the „Animal welfare ordinance“ and others, exist in Germany. Since the return of the wolf (canis lupus lupus) (13) to the middle of Europe, losses of grazing livestock increase. In 2019 in Germany more than 2800 grazing animals were harmed by wolves (DBBW, 2019).
J. J. Bauerdick, B. Kröck, M. Treiber, H. Bernhardt
258
Social requirements on pasturing Figure 1 summarizes socio-economic and environmental aspects, shown in capital letters.
Letters A – J show different social requirements of pasturing. Animal welfare and environmental protection are the most crucial points for society. This is shown in (A) with rejection of genetically modified plants, (C) protecting grassland as a CO2 sink and (D)+(E) with reduced fertilizer and reduced phytosanitary products, regarding environment. The protection of wildlife (G) can be achieved through regulations of the mowing time for example. Regarding animal welfare a late separation of cows and calves is demanded (B). Consumers expect high quality, high standards of animal welfare or environmental protection as a given when buying agricultural products (Gassler et al., 2018). This is why a large proportion of consumers want pasturing, but still prefer a low price at the supermarket (Weinrich et al., 2014). For a higher willingness to pay, transparent and trustworthy standards for the production process are needed, which for example can be achieved due to clearly defined Labels (H) (Gassler et al., 2018). Farmers have a large influence on balanced landscape structures and the associated recreational value for the population (I) (Spittler, 2001). Furthermore, they have to take care, that hikers or other people in the landscape are protected against agricultural hazards (J).
This research identifies the influencing factors that change pasturing in the future and offers insights on how new technologies can be used to help farmers cope with these changes.
MATERIALS AND METHODS
This paper is based on a literature review. During this review, chosen innovative methods have been listed in tabular form. Within this publication, legal frameworks are summarized. More detailed information will be given on innovative tools and technologies.
RESULTS
Digital tools for future pasturing Table 1 shows selected technologies and management tools, which will be described
further. According to Gabriel (2020) an estimate of 68 % of German farmers are already using smart-farming technologies like Automated Feeding Systems, GPS-Guidance or Farm Management Information Systems. In Germany, only few “smart” pasturing systems are established, while Ireland for example is pioneering this sector. Nevertheless, research is done in this area. Several different projects try to gain data of pasturing to make them available to farmers, like the “Schleswig Holstein Chamber of Agriculture (LWK)” which are currently working on an adaption of Grassland Management Systems on German conditions (EIP, 2018). Also the “Christian-Albrechts-Universität zu Kiel” was working on a project, called “Optimized Pasturemanagement – smart grazing” in which the performance potential of pasture within northern Germany shall be assessed (CAU, 2017). Despite other services, like a “grassland information ticker” for farmers in Luxemburg (Klöcker et al., 2018; WWW-Gréngland, 2020) also the „Riswicker Weideplaner“ as Excel-Sheet for calculating required space for grazing cows are existent. The last-mentioned tool is based on historical grassland data for prediction. However, there are innovative solutions on the market already, that help to reduce the costs and risks of pasturing.

The future of pasture management in Germany – aspects of technology and regulation
259
Table 1 Selected technologies and management tools to improve future pasturing (adapted from Kröck, 2020)
Technologies Product/Function Company Special Function
Growth measurement
Grass Master Pro Novel Ways
GrassHopper True North Technology
Fencing Virtual Fencing
Vence, Agersens, Nofence
Grazeway Lely Barn-Pasture-traffic with automated doors
Animal wealth management
SmaXtec, CowManager, RumiWatch
SmaXtec, CowManager, ITIN+Hoch
Detection of oestrus, diseases, locomotion, feeding issues, etc.
Potions management Blue Level La Buvette
Automated water level measuring for pasture-tanks
Tracking System GPS-based Blaupunkt Telematics, Tecsag
Animal position, walking routes, georeferencing
Management Product/Function Company Special Function
Fertilizer management
“Wann wächst das Gras?” (when does the grass grow?)
LWK Schleswig Holstein
Optimization of spring fertilization, vegetation period forecast
Pasture management
PastureBaseIreland, Kingswood Computing Agrinet
Teagasc, Kingswood Computing, Agrinet
Comprehensive planning and documentation of pasture management at desktop computer (Decision support systems)
Riswicker Weideplaner LWK NRW Optimization of stocking
density
Grünlandticker Grass10
WWW-Gréngland Teagasc
Newsletter, growth data, recommendations for pasture management
Fencing himps horizont Fence control (voltage etc.)

J. J. Bauerdick, B. Kröck, M. Treiber, H. Bernhardt
260
One of the most crucial points of pasturing is to have precise information about growth and quality of grassland (Isselstein & Horn, 2019) to know how many and which kind of livestock can be fed on it. Of late, a trend to focus on this aspect can be seen in scientific practice. Therefore, different handheld equipment is available, like the “Grass Master Pro” by Novel Ways, or the “GrassHopper” rising plate-meter by True North Technologies. The Grass Master Pro measures the dry matter content in kg/ha via capacitance method. Data can be transferred for example into an own software or a Microsoft Excel sheet. The Grass-Hopper does this by a plate, laying on the grass. With the height of the plate in relation to the ground, density and gras height are measured, stored and can be transferred via Bluetooth to a mobile phone app. Within this app, georeferenced information is stored so that future measurements can automatically be related to a specific pasture. The so gained information can also be used in a Grassland Management Software like “AgriNet”. Within this software, for example paddock rotation and reseedings of paddocks can be planned. With this data, also predictions can be made, whether the yield will be sufficient or not (O´Donovan & McEvoy, 2019).
The project “Green Grass” by several scientific and agricultural organizations comes up to evaluate different technologies to bring pasturing into the future. With remote sensing via satellite, the amount and quality of grasslands shall be recorded and predicted. Within a new management tool, mainly this information can be used to bring the animals purposefully to specific parts of a pasture. The coordinators also hope to be able to distribute nutrients better across the pasture (GLZ, n.y.).
Even though the yield of grassland may be the most important factors for feeding the cow, beforementioned legal and social aspects as well as management aspects are also taken into consideration, when it comes to new technological ideas. Fencing is of utmost importance to protect the outer environment as well as the animals inside a pasture. As already mentioned, the functionality of a fence must always be guaranteed. To prevent trouble, the fence has to be checked daily. As farmers sometimes are not able to control all fences daily, first digital assistants are available for this. Electric fences can be monitored and if the current drops or the energizer shows complications, an alarm can be sent via GSM Band (LUDA FARM). Within the “Green Grass” project, also virtual fences shall be tested and made ready for legal use in Germany. While other regions, like Norway, Australia or the USA already legalized and commercialized this kind of fencing (Agersens, 2019; CSIRO, n.y.; Nofence, 2020; VENCE, 2018) in Germany no commercialization is given yet. With a virtual fence, the management of single paddocks would be simplified very much (GLZ, n.y.). In combination with an animal identification system, single animals could be guided to different spots of a pasture, according to their current requirements for feed. But also natural aspects, like small biotopes within a pasture or habitats can be fenced easily with this technology (GLZ, n.y.). These partly automated systems could also be used for controlling and documentation against any insurance cases. In combination with other technologies, like the cow selection box “Grazeway” by Lely, the gap between stable and pasture can be closed. With an integrated cow registration, the operator always knows if a cow is in the stable or on pasture.
As already mentioned, animal welfare is crucial while pasturing. Enough fodder as well as water must be accessible for livestock at all times. Water is often supplied in mobile water barrels. As these barrels are mostly within the pasture, it is cumbersome to control the water level inside. For this, sensors like the “Blue Level” by “La Buvette” can be used. With ultrasonic sensors the water level can be transmitted via LoRa Wan or Sigfox and within a mobile phone app, average consumption and days to refill can be shown and forecasted (La

The future of pasture management in Germany – aspects of technology and regulation
261
Buvette, 2020). Despite this, several manufacturers can be found, which use sensors for animal controlling. These sensors gain data for oestrus control, diseases, or rumen problems. Companies offering sensors for these purposes are CowManager, Ceres Tag, HerdDogg, MooMonitor+, Digitanimal, RumiWatch, Cowlar or smaXtec. Also, animal trackers for pastures are available. For example, Blaupunkt Telematics offers a GPS based tracking system with an alert function. If a tracked animal comes to critical zones like streets or railways, the farmer receives an alert (Blaupunkt Telematics, n.y.). In corporation with the Bavarian Sate Research Center for Agriculture, this company is currently working on a monitoring system for dairy cattle on pastures. When deciding to bring cows to grasslands, also the pressure of parasites will increase. To help farmers understand which kind of parasites can evolve and how to protect the herd as good as possible, the Thuenen-Institute brought out a small onlinetool. Within this tool, farmers can walk through a decision tree to estimate the hazard potential of parasites.
DISCUSSION
Regulations are not going to decrease in future and climate change is going to evolve further. This will force farmers to adapt to changing situations. Considering herds threatened by wolves, as an example, the number of animals killed by wolves will increase in Germany. Even though wolf-proof fences can be built, this leads to higher costs and higher amounts of management tasks. The decision for pasturing will increase the management tasks in many ways compared to in-barn production, and this can keep farmers from pasturing in the first place. Due to societal pressure, also more regulations regarding animal welfare can be expected. Within this paper only potential innovative use cases and scientific research is shown. Costs and benefits are not evaluated and must be taken into further consideration. Limits of some of the named innovations can be listed. Umstätter and Adrion (2020) for example state that animal tracking systems at the moment have weaknesses regarding energy consumption, accuracy and stability. Moreover van den Pol-van Dasselaar et al. (2020) see a lack of knowledge of such applications by the farmers. Furthermore, an unawareness of the usage of such technologies as well as practical use of gained data are a big problem. In future, not only innovative or smart technologies have to be taken into consideration, when thinking about pasturing. Also breeding for climate change adapted animals can help farmers in future. First attempts for cattle to accomplish this are taken for example by König et al. (2019). At present, it is doubtful whether new technologies and methods will be able to increase the number of animals on pasture. As an example, van den Pol-van Dasselaar et al. (2020) state that also in Ireland the numbers of grazing animals are decreasing, even though those farmers already use a lot of technologies on their farms. Therefore, it can be seen that also other actions like governmental regulations have a big impact on the actual development.
CONCLUSION
European regulation for pasturing is very complicated in particular. It is not possible to compare all pieces of regulation of a single state to other states. Moreover, it can be shown that a lot of different aspects and rights have to be taken into consideration when the decision is made to pasture or not. For the future of pasturing, many technological tools can help farmers be more productive and reduce management tasks. Reducing mentioned management

J. J. Bauerdick, B. Kröck, M. Treiber, H. Bernhardt
262
tasks will be the most important point. Tools to improve pasturing are already on market or in research like decision support systems (forecasts, stocking densities, pasture management improvement). Also, some technologies like virtual fences or tracking systems are already available but legal aspects have to be clarified to make them usable in Germany. Whether these implementations will come into practice will also be a matter of pricing. As the prices for the products are high at the moment and not enough information is transferred to the farmers, they are not facing a wide adoption around Europe.
REFERENCES
Agersens. (2019). eShepherd. Retrieved from http://agersens.com/ Blaupunkt Telematics. (n.y.). GPS-Weidemanagement. Retrieved from https://www.blaupunkt-
telematics.com/Weidemanagement.html#Formular_Details/articles/SIM-Karte_in_Ortungssystem.html
BMEL (2006). Tierschutz-Nutztierhaltungsverordnung in the version of the announcement from August 22, 2006 (BGBl. I S.2043), which was last changed by article 3 paragraph 2 of the law from June 30, 2017 (BGBl. I S. 2147).
La Buvette. (2020). BLUE LEVEL Angeschlossene Füllstandsanzeige. Retrieved from https://www.traenkebecken-labuvette.de/jauge-connectee-blue-level.html
CAU. (2017). Operationellen Gruppe (OG) „Optimiertes Weidemanagement – smart grazing“. Retrieved from https://www.grassland-organicfarming.uni-kiel.de/de/forschung/eip-weide
CSIRO. (n.y.). Virtual fencing. DBBW. (2019). Wolfsverursachte Schäden, Präventions- und Ausgleichszahlungen in Deutschland
2018. Retrieved from https://www.dbb-wolf.de/mehr/literatur-download/berichte-zu-praevention-und-nutztierschaeden
Deutscher Bundestag und Bundesrat (2006). Animal Welfare Act in the version of the announcement from 18 May 2006 (BGBl. I S. 1206, 1313), which was last changed by article 280 of the regulation from 19 June 2020 (BGBl. I p. 1328)
EIP. (2018). Weidemanager SH. Retrieved from http://www.eip-agrar-sh.de/eip-innovationsprojekte/projektdetails-call-2/?tx_wqeipinnovationsprojekte_pi1%5Binnovationsprojekt%5D=59&tx_wqeipinnovationsprojekte_pi1%5Baction%5D=show&tx_wqeipinnovationsprojekte_pi1%5Bcontroller%5D=Innovationsprojekt&cHash=f9a0f1cbe81ed0bb49e147e80ca2a51d
Gabriel, A. (2020). Digitale Landwirtschaft in Bayern. Retrieved from https://www.lfl.bayern.de/mam/cms07/ilt/dateien/ilt6_poster_by_2390.pdf
Gassler, B., Xiao, Q., Kühl, S., & Spiller, A. (2018). Keep on grazing: factors driving the pasture-raised milk market in Germany. British Food Journal, 120(2), 452–467. https://doi.org/10.1108/BFJ-03-2017-0128
GLZ. (n.y.). Green Grass: Innovative Nutzung des Grünlands für eine nachhaltige Intensivierung der Landwirtschaft im Landschaftsmaßstab. Retrieved from https://www.gruenlandzentrum.org/projekte/green-grass
Isselstein, J., & Horn, J. (2019, August). Nutztiersysteme auf dem Prüfstand: Mehr Nachhaltigkeit in der Weidebewirtschaftung durch einen integrativen Ansatz. In LfL (Ed.): Vol. 20. Mitteilungen der Arbeitsgemeinschaft Grünland und Futterbau, Grünland 2050 (pp. 101–104). Freising.
Klöcker, D., Boonen, J., Conter, G., Felten, C., Hoffmann, M., Kohnen, H., . . . Zeimens, I. (2018). Der „Grünlandticker“ - Entscheidungshilfe für ein effizientes Weidemanagement mit Milchkühen. In CAU (Ed.), Leistungen von Gras und Klee-Gras auf Acker und Grünland (pp. 187–190).

The future of pasture management in Germany – aspects of technology and regulation
263
König, S., Halli, K., & Kipp, C. (2019). Strategien in der Nutztierzüchtung zur Anpassung an den Klimawandel. In BMEL & FLI (Eds.), Klimawandel - Herausforderungen für die Tierernährung (pp. 18–19).
Kröck, B. (2020). Die Zukunft der Weide- und Almwirtschaft in Deutschland: Anforderungen und Unterstützungsmöglichkeiten. Technical University of Munich, Freising.
Lely. (o. J.). Lely Grazeway - Für effiziente Beweidung. Retrieved from https://www.lely.com/de/losungen/melken/grazeway/
LfL. (2020). Wir bringen Landwirtschaft und Forschung zusammen: Jahresbericht 2019 Schwerpunktthema „Nutztiere“. Freising. Retrieved from https://www.lfl.bayern.de/mam/cms07/verschiedenes/dateien/lfl-jahresbericht-2019-nutztiere.pdf
LUDA FARM. Luda.FenceAlarm. Retrieved from https://www.luda.farm/product/luda-fence/ Nofence. (2020). The world’s first virtual fencing system. Retrieved from https://nofence.no/en/ Novel Ways. (o. J.). GrassMaster Pro Drymatter Instrument. Retrieved from
https://www.novel.co.nz/product/356250 O´Donovan, M., & McEvoy, M. (2019). Managing your Grass. Retrieved from
https://www.teagasc.ie/media/website/animals/dairy/ManagingGrass.pdf Priebe, R., Leitner, P.-J., Spilker, B., Feuerstacke-Schäfer, A., Kulmann, J., Klewe, J., . . . Jahnke, W.
(2016). Sichere Weidezäune (No. 1132/2016). Bonn. Retrieved from https://www.ble-medienservice.de/1132/sichere-weidezaeune
Reijs, J. W., Daatselaar, C.H.G., & Helming, J. F. M. (2013). Grazing dairy cows in North-West Europe: Economic farm performance and future developments with emphasis on the Dutch situation (Report / LEI). Den Haag. Retrieved from http://edepot.wur.nl/265398
Schoof, N., Luick, R., Beaufoy, G., Jones, G., Einarsson, P., Ruiz, J., . . . Ukhanova, M. (2019). Grünlandschutz in Deutschland: Treiber der Biodiversität, Einfluss von Agrarumwelt- und Klimamaßnahmen, Ordnungsrecht, Molkereiwirtschaft und Auswirkungen der Klima- und Energiepolitik. Bonn. Retrieved from https://www.researchgate.net/publication/335577268_Grunlandschutz_in_Deutschland_Treiber_der_Biodiversitat_Einfluss_von_Agrarumwelt-_und_Klimamassnahmen_Ordnungsrecht_Molkereiwirtschaft_und_Auswirkungen_der_Klima-_und_Energiepolitik
Spittler, R. (2001). Anforderungen eines landwirtschaftsorientierten Tourismus an die Landwirtschaft in Westfalen. In K. Ditt, R. Gudermann, & N. Rüsse (Eds.), Forschungen zur Regionalgeschichte: Vol. 40. Agrarmodernisierung und ökologische Folgen: Westfalen vom 18. bis zum 20. Jahrhundert (pp. 627–655). Paderborn: Schöningh. Retrieved from http://www.aube-tourismus.de/Dokumente/Artikel_Landschaft
True North Technologies. (o. J.). Grasshopper. Retrieved from http://moregrass.ie/truenorth-products/grasshopper
Umstätter, C., & Adrion, F. (2020). Tierortungssysteme - heutiger Nutzen und zukünftige Weiterentwicklung. Darmstadt. Retrieved from https://www.ktbl.de/fileadmin/user_upload/Artikel/Tierhaltung/Allgemeines/Tierlokalisation/Tierlokalisation.pdf
Van den Pol-van Dasselaar, A., Hennessy, D., & Isselstein, J. (2020). Grazing of Dairy Cows in Europe: An In-Depth Analysis Based on the Perception of Grassland Experts. Sustainability, 12(3), 1098. https://doi.org/10.3390/su12031098
VENCE. (2018). Livestock Production. Reinvented. Virtual fencing and autonomous animal control. Retrieved from http://vence.io/

J. J. Bauerdick, B. Kröck, M. Treiber, H. Bernhardt
264
Weinrich, R., Kühl, S., Zühlsdorf, A., & Spiller, A. (2014). Consumer Attitudes in Germany towards Different Dairy Housing Systems and Their Implications for the Marketing of Pasture Raised Milk. International Food and Agribusiness Management Review, 17(4), 1–18. Retrieved from https://www.ifama.org/resources/Documents/v17i4/Weinrich-Kuhl-Spiller.pdf
WWW-Gréngland. (2020). Grünland-Ticker. Retrieved from http://www.grengland.lu/downloads-grunland-ticker

48th Symposium "Actual Tasks on Agricultural Engineering", Zagreb, Croatia, 2021
265
DEVELOPMENT OF SUSTAINABLE SOLUTIONS FOR THE CONSTRUCTION OF COWSHEDS IN BAVARIA
Christoph KREITENWEIS-EISGRUBER*, Heinz BERNHARDT *E-mail of corresponding author: [email protected] Lehrstuhl für Agrarsystemtechnik, Technische Universität München,
Dürnast 4, D-85354 Freising, Germany
ABSTRACT
The structural change in agriculture, that has been ongoing since the 1950s (Gindele, 2016), has significantly changed German and, in particular, Bavarian agricultural society and the cultural landscape. For this, farms have developed various strategies in order to be able to survive economically. The average number of cattle kept per farm in Bavaria increased from 16 in 1970 to 68 in 2017 (StmELF, 2018). In order to be able to house these cattle, also with the aim of better animal welfare, modern cowsheds have been built in Bavaria over the past decades. Many of these new cowsheds are located in the external district under building law due to a lack of space and emission restrictions (Wendl, 2011). Cowsheds are increasingly in an area of conflict between animals, humans, ecology and economy. This leads to the question of how cowsheds can be built in Bavaria in the future in order to be considered a sustainable building.
The aim of the work is to develop solutions for cowsheds in Bavaria. On the one hand, there is interest in sustainable construction in terms of the choice of location, the use of building materials and the design. On the other hand, the life cycle of a cowshed should be carefully considered, from planning to the various forms of possible use and dismantling.
The solution is based on a detailed and interlinked consideration of the planning stage of a cowshed construction. For this purpose, recordings of agricultural conversion and new building solutions for cowsheds in Bavaria are made. The planning stage is analyzed with regard to all functional areas and stakeholder groups as well as the future operational change potential.
It is to be expected that there will be a farm-specific, individual solution for cowshed construction in Bavaria. For this purpose, areas are to be determined in which post- agricultural subsequent uses are possible with regard to the building law situation, whereby cowshed life cycle phases can be extended. The
48. ACTUAL TASKS ON AGRICULTURAL ENGINEERING
Preliminary communication

C. Kreitenweis-Eisgruber, H. Bernhardt
266
use of wood as a regional building material in the context of sustainable building can be seen as another important component.
Keywords: Cowsheds, planning stage, sustainable building
INTRODUCTION
The structural change in agriculture has been a problem and a challenge, at least since the 1950s (Gindele, 2016), in equal measure in Germany and especially in Bavaria, which at that time was important characterized by agriculture. Growth has established itself as an essential strategy for farms in order to be able to survive under world market conditions. These changes in the structure of agricultural society can also be seen in cattle farming in Bavaria. In addition, there have been increasing political and social efforts in recent years to raise the animal welfare factor in agricultural cattle husbandry (Gröner and Bergschmidt, 2019).
The average number of cattle that a Bavarian farm kept in 1970 is 16. In 2017 the number of cattle per farm rose to 68 (StmELF, 2018). In a similar period of time, the number of farms has decreased from 332,924 (1970) to 83,100 (2019) (StmELF, 2020). This means that a smaller number of farms keep a larger number of cattle.
In the past decades, new cowsheds, conversions and extensions to existing cowsheds were necessary in order to be able to house cattle from an economic, economic and animal welfare point of view. In particular, large new cowsheds in recent years (Pöhlmann and Neser, 2014) create a considerable potential for conflict between agriculture and other social groups (Schlecht et al., 2008).
Due to a lack of space and restrictions under emissions legislation, cowsheds are often no longer connected to the existing agricultural farms (Wendl, 2011). Because of to the agricultural privileges (§ 35 BauG), agricultural construction takes place in many cases in the sensitive external district (Köhne, 2013).
If the already existing development of farms and the renunciation from cattle farming or agricultural production progresses, there is a risk of considerable problems for the Bavarian cultural landscape and thus also for many industries that are only subordinately affected, such as tourism. Older cowsheds with smaller dimensions, which are usually built for tethering and are connected to a farm, can be converted into a new use depending on the state of preservation and the building fabric (Lütkemeier, 2000). There are possible uses of other forms of agricultural production, storage, right up to upgrading the building through residential use (Körnig-Pich, 2017). In this context, former cowsheds can offer an alternative income (Dorfner, 2018).
The biggest challenge now lies in the fact that farms that have built new, generously dimensioned cowsheds, stop their cattle farming in the following decades, for example due to a lack of successors. There remain vacant buildings, which, due to their structural substance, floor plan and size, can only be re-used to a limited extent. So, the question arises as to how cowsheds should be built in Bavaria in the future in order to be considered a sustainable solution due to the longevity of the possible uses.

Development of sustainable solutions for the construction of cowsheds in Bavaria
267
MATERIALS AND METHODS
Since the goal is not an ideal solution that can be used for all Bavarian cowsheds, but rather an individual solution, all factors relating to the problem must be detected. For this purpose, recordings of newly built or converted cowsheds are made in Bavarian regions with a high proportion of cattle farming. These are examined, especially under the principle of sustainability, with regard to the choice of material, floor plan, construction, spatial and functional connection to the existing agricultural buildings on the farm as well as the various possibilities of secondary or tertiary subsequent use. For this purpose, forms of up- or downcycling are considered.
The entire life cycle of the building must be included in the considerations. In addition to the various forms of conversion, the planning of future dismantling is also part of the construction of a cowshed. A further basis for the investigation is the building law framework. On this basis, development principles can then be derived from the existing cowshed structures. From these, in turn, patterns for future sustainable buildings can be derived.
Another point of investigation is the consideration of alternative courses of action. It must be examined whether a networked consideration of the concept phase would have led to a different, more sustainable cowshed. In addition to the documentation of built cowsheds, guided interviews with experts also provide a further basis for the investigations. For this purpose, experts from the areas of public-state construction consultation, the agricultural office and private construction consultation, construction specialists and farmers are selected.
RESULTS UND DISCUSSION
The aim of the work should be a farm-specific individual solution. The biggest part is to set up an evaluation catalog for cowshed construction measures in Bavaria. This should give a holistic overview of cowshed construction measures in Bavaria from the point of view of the concept phase.
All forms of usage including reconstruction are already part of the planning. A secondary or tertiary use downstream of cattle farming must already be part of the planning through floor plan and building design, choice of materials and location.
Expert interviews that have already been carried out and documented new cowsheds in the Bavarian foothills of the Alps have shown that for many newly built cowsheds the option of a later conversion is denied solely from the point of view of current building permits. Due to the clearance areas to existing residential developments as a result of emission regulations as well as building facilities with generous dimensions from an economic point of view, cowsheds are in the majority of cases planned and built in the outdoor area under building planning law without spatial and situational connection to the existing farm.
A later change of use to non-agricultural use is excluded by the agriculturally privileged outdoor area permit in § 35 (1) BauGB. Consequently, for such cowsheds, which will no longer be used for agricultural purposes in the future, this means vacancy and decay. On the other hand, various forms of subsequent use in the area of downcycling or upcycling are conceivable in the interior area under building law or in the spatial-functional context of a farm.

C. Kreitenweis-Eisgruber, H. Bernhardt
268
The simplest form of downcycled use is the parking space and storage space. In many empty stables there are already caravans today.
The goal of sustainable subsequent use is to use the gray energy built into the cowshed in the form of longer-term and, above all, higher-quality use. The establishment of residential use is also conceivable. In the form of holiday homes, these could represent an alternative source of income for the farm after giving up cattle farming. Since the Corona summer 2020, Bavaria has also gained in importance as a holiday destination. In addition, a significant correspondence can be established between grassland regions with a high proportion of cattle farms and areas that are heavily frequented by tourists.
But permanent living space for heirs to retire, retirees or rented apartments are also possible. In order to keep the possibilities of such forms of conversion open, it is crucial to pay attention to the location and, associated with it, to the requirements of Bavarian building law in the concept phase.
The last point in the cowshed life cycle is rebuilding and disposal. In order to keep building costs low, many builders use the cheapest possible materials. In many cases, however, the disposal costs are more expensive as the use of asbestos-containing building materials in the cowsheds over the past decades shows.
The amendment to the “Bayerische Bauordnung” in 2021 underscores the state's desire to use more wood in new buildings. Nevertheless, the documented cowsheds have shown that, due to state subsidies for the construction of new cowsheds, it has so far not been profitable from a financial point of view for farms to use wood from their own forests.
In order to provide a comprehensive picture of the concept phase, the requirement areas, stakeholder groups and interests of the stakeholders of a cowshed must also be examined. All points affecting a cowshed, animals, people, economy and ecology must be examined in detail and weighed up in terms of their mutually influencing effects. A cowshed that is ideally built from an economic and ecological point of view can appear just as ethologically and economically optimal, but nevertheless lead to conflicts. This happens when the cowshed is in an area that is sensitive for tourists and therefore also for the community and residents.
CONCLUSION
The structural change in agriculture and the associated change in agricultural society has shown that cowsheds are no longer built for future generations. In order to build a cowshed sustainably, operational change contingencies must already be part of the planning. It can be assumed that short-sighted and poor planning of cowsheds not only has economic effects on the agricultural business but can also pose a problem for an entire cultural landscape as a result of empty and decaying building shells.
REFERENCES
Bayerisches Staatsministerium für Ernährung, Landwirtschaft und Forsten (2018). Bayerischer Agrarbericht 2018.
Bayerisches Staatsministerium für Ernährung, Landwirtschaft und Forsten (2020). Bayerischer Agrarbericht 2020.

Development of sustainable solutions for the construction of cowsheds in Bavaria
269
Dorfner, G. (2018). Ökonomische Herausforderungen für die bayerischen Milchviehhalter. In: Wendl, G. (eds) Milchviehhaltung - Lösungen für die Zukunft. Landtechnisch-bauliche Jahrestagung 2018, Grub, Germany, 9-20.
Gindele, N. (2016). Wandel des Unternehmertums in der Landwirtschaft. Doctoral thesis. Universität Hohenheim, Germany.
Gröner, C., Bergschmidt, A. (2019). Tierwohl-Förderprämien der Bundesländer: Ausgestaltung, Inanspruchnahme und Reichweite, Thünen Working Paper, No. 125, Johann Heinrich von Thünen-Institut, Germany.
Köhne, M. (2013). Der leistungsfähige Betrieb in der Agrarökonomie und im Recht. In: Der Schutz des leistungsfähigen landwirtschaftlichen Betriebes (Martinez, J., eds), Nomos- Verlag, Baden-Baden, 13-22.
Körnig-Pich, R. (2017). Landwirtschaftliche Konversion – Chancen der Umnutzung ehemaliger Landwirtschaftsbetriebe an den Siedlungsrändern. In: Schrenk, M., Popoviche v., V., Zeile, P., Elisei, P., Beyer, C. (eds) Real Corp 2017, Vienna, Austria, 345-351.
Lütkemeier, H. (2000). Umnutzung landwirtschaftlicher Gebäude. Landtechnik 1, 56-57. Pöhlmann, K., Neser, S. (2014). Stallgebäude erfolgreich errichten - Ein Leitfaden für die
Landwirtschaft. Bayerische Landesanstalt für Landwirtschaft, Freising. Schlecht, S., Albersmeier, F., Spiller, A. (2008). Konflikte bei landwirtschaftlichen Stallbauprojekten:
eine empirische Untersuchung zum Bedrohungspotential kritischer Stakeholder, Diskussionsbeitrag, No. 0808, Georg-August- Universität Göttingen, Department für Agrarökonomie und Rurale Entwicklung (DARE), Germany.
Wendl, G. (2011). Entwicklungstendenzen in der Haltungstechnik für die Milchviehhaltung. In: Wendl, G. (eds) Tierhaltung in Bayern – Quo vadis?, Landtechnisch-bauliche Jahrestagung und Eröffnung der Lehrschau am 25. Oktober in Grub, Germany, 23-42.

48th Symposium "Actual Tasks on Agricultural Engineering", Zagreb, Croatia, 2021
271
HEATSTRESS INDICES FOR AUTOMATED CLIMATE CONTROL SYSTEMS DAIRY COWSHED
Martin HÖHENDINGER1,2*, Agnes SIXT1, Maximilian TREIBER1, Heinz BERNHARDT1 *E-mail of corresponding author: [email protected]
1 Technische Universität München, Lehrstuhl für Agrarsystemtechnik, Am Staudengarten 2, D-85354 Freising
2 Hochschule Weihenstephan-Triesdorf, Lehrstuhl für Landtechnik, Am Staudengarten 1, D-85354 Freising
ABSTRACT
Increasing temperatures over the last years, lead to more heat stress days in dairy cowsheds in Germany. Additionally, a decreasing development of the thermoneutral zone of dairy cows must be assumed due to increasing milk yields.
Besides changing the architecture of dairy cowsheds, different technological solutions have the potential to reduce heat stress in modern dairy farming.
This research is intended to elaborate on the theoretical requirements for an automatic climate control system for dairy farms. The focus is set on dynamic climate regulation systems to reduce heat stress.
Different heat stress indices are analyzed and evaluated according to the usability in an automatic climate control system.
Depending on different heat stress levels, various technological reactions are derived. In consideration of the indicated effects on the climate conditions, the stability of the system is evaluated.
Different criteria are necessary for the selection of a suitable index. As the dynamic technological reactions for climate conditioning are possibly determining themselves, it is important to consider an appropriate system inertia to prevent system failures.
Indices based on animal data are an alternative approach, which requires solutions for the measurement of animal data.
Subsequent investigations should target the technical aspects of the data measurement, sensors and where these sensors should be installed as well as the data transmission and processing.
Key words: dairy farming, precision livestock farming, heat stress, cyber-physical system, animal welfare, automatization
48. ACTUALTASKS ONAGRICULTURAL ENGINEERING
Review paper

M. Höhendinger, A. Sixt, M. Treiber, H. Bernhardt
272
INTRODUCTION
The development of the last years shows an increasing trend of days with potential heat stress for dairy cows in Germany (Hansen, 2020).
Dairy cows with an average milk yield output of 25 kg per day reach the upper limit of their comfort zone already at an air temperature of 12 °C, while animals with correspondingly higher milk quantities already reach this threshold at cooler temperatures (Figure 1) (Hansen, 2020). Hence, the definition of the thermoneutral zone is crucial for effective climate control systems in dairy cowsheds (Sanz, 2018).
Figure 1 Thermoneutral zone of dairy cows according to the milk yield (Tober, 2020)
Due to the smooth transition of the thermoregulatory mechanisms of the animals, the definition of limits often are imprecise (Pedersen and Sällvik, 2002). The Situation is further complicated by the fact that the exact definition of the thermoneutral zone depends on the dry bulb temperature (Tdb). The relative humidity (RH) and the air velocity (u) additionally determine the heat release and thus the temperature perception as well (Zucker, 2016).
Static impacts on the climate control are determined by the constructional details of the cowshed itself. According to Stötzel (2018) the heat input via the roof essentially determines the climate parameters, whereas with constant air exchange rates there is no influence of the air volume on the heat load inside the cowshed (Stötzel, 2018).
Sufficiently large air intake and exhaust air openings without any air-impeding attachments are essential for free ventilation (CIGR, 2014). In this context, the temperature difference between outside and inside the cowshed as well as the wind speed outside are Crucial for free ventilation.
Recirculation fans can either be used to increase air speed and air exchange or to improve air movement in the cowshed. Compared to axial fans, they cause a reduced horizontal flow velocity (Heidenreich et al., 2005), which however is decisive for more effective cooling (Wang, Zhang, and Choi, 2018).
The throwing distances and air speeds of the fans are controlled by stepless or stepped change of speed (Heidenreich, 2009). Individual large fans can be controlled by a transformer, electronically or via a frequency controller (Zentner, 2010).
The use of water enables adiabatic cooling caused by evaporation, which reduces the drying temperature and increases the relative humidity (Heidenreich et al., 2005).
-10 -8 -6 -4 -2 0 2 4 6 8 10 12 14 16 18
20
30
40
50
Tdb [°C]
milk
yie
ld
[kg/
cow
and
day
]
Heatstress indices for automated climate control systems dairy cowshed
273
For the control of sprinklers, a time control is suggested, which is sprinkled for 3 minutes and then switched off for 12 minutes, so that a complete evaporation of the water is possible (Heidenreich et al., 2005; Zahner, 2020). Short spraying times are also referred to for fogging systems (Zentner, 2010). Usually thermostats activate the timer between 24 and 26.6 °C (Holmes et al., 2015). Therefore, in addition to simply increasing the air movement, a sufficiently high ventilation rate through the fans is important for functionality (Zentner, 2010).
Heat stress indices are a method to evaluate different impact factors on the heat load and the potential of heat stress for cows. However, there are different indices, which use different parameters and weight them differently. According to this, the indices defined for application in different climate zones, breeds and keeping conditions. This study is intended to evaluate heat stress indices and deliver heat stress indices that are suitable as a basis for the application in southern Germany.
MATERIAL AND METHODS
Selection of the relevant indices Qualitative literature research provides a detailed review of the individual and interactive
effects of climate regulators in the cowshed. The databases Scopus, ASABE, Google Scholar, TUMOpac, Web of Science and AgTecCollection are used.
Indices relevant for climate control are determined by comparing the animal comfort indices and systematically evaluating them with regard to the consideration of the required climate parameters. In this context, only indices that are suitable for year-round housing of dairy cows in the temperate climate zone of southern Germany are considered. Further, the automated measurement of the required climate parameters must be feasible. Indices that are based on animal related data are considered.
Subsequently, the necessary climate parameters are identified, which are necessary for a targeted regulation. Threshold values for the control of climate regulators are deductively derived for each selected index by way of example.
Model assumptions Due to the numerous factors influencing the climate in the cowshed, some Basic
assumptions and framework conditions for the cowshed building and for the control of climate-regulating measures are defined. The location is assumed to be the temperate climate zone (Bavaria, Germany). Further, the dairy cowshed is defined as an outdoor climate cowshed with a thermally insulated roof and sufficiently large roof overhangs. Hence, an energy input from direct sunshine is not necessary to consider.
Dynamic climate regulation systems of model farm Wall closure systems for adjusting the facade opening on the long sides of the cowshed as
well as fans and water sprinkling systems are the intended systems to regulate the climate conditions inside the cowshed.
Regarding the modification of the ventilation openings, the following will be limited to the control of the eaves openings that are controlled simultaneously. To adjust the artificially generated air speed, the speed of the fans is assumed to be a variable input variable with three

M. Höhendinger, A. Sixt, M. Treiber, H. Bernhardt
274
stages. Level 0 means that the fans are off. At level 1, an air movement of at least 1 m/s is generated in the animal area, while at level 2, at maximum speed, an air movement of at least 2 m/s is generated in the animal area.
The short spraying times of the water sprinkling system are controlled by a timer during operation. The necessary interval length is not discussed in detail, as different optimum spraying and evaporation times are considered depending on the system. Only the commissioning of the spray misting system is controlled.
RESULTS
Potential heat stress indices for south German dairy farming The best indices to monitor heat stress in southern Germany are THIadj (adjusted-
Temperature Humidity Index), the CCI (Comprehensive Climate Index) and the ETIC (Equivalent-Temperature Index for Dairy Cattle). These indices are particularly suitable for use in dairy farming with cowshed management in the temperate climate zone. Other indices are rather unsuitable, as they were developed for grazing on pastures or other climate zones. The above indices are calculated using formulas 1 – 7.
The indices take into account the climatic parameters dry temperature (Tdb), relative
humidity (RH), air velocity (u) and solar radiation (S). Regarding the physiological and
𝑇𝑇𝑇𝑇𝑇𝑇 = 0,8 𝑇𝑇𝑑𝑑𝑑𝑑 + (𝑅𝑅𝑇𝑇 ÷ 100) (𝑇𝑇𝑑𝑑𝑑𝑑 – 14,4) + 46,4 (1)
𝑇𝑇𝑇𝑇𝑇𝑇𝑎𝑎𝑑𝑑𝑎𝑎 = 4,51 + 𝑇𝑇𝑇𝑇𝑇𝑇4 − 1,992 𝑢𝑢 + 0,0068 𝑆𝑆 (2)
(Fournel et al., 2017; Gaughan et al., 2012; Herbut and Angrecka, 2018; Li et al., 2009; Mader et al., 2006)
𝐶𝐶𝐶𝐶𝑇𝑇 = 𝑇𝑇𝑑𝑑𝑑𝑑 + (𝑅𝑅𝑇𝑇 + 𝑢𝑢 + 𝑆𝑆)𝑎𝑎𝑑𝑑𝑎𝑎𝑎𝑎𝑎𝑎𝑎𝑎𝑎𝑎𝑎𝑎 (3)
𝑅𝑅𝑇𝑇𝑎𝑎𝑑𝑑𝑎𝑎𝑎𝑎𝑎𝑎𝑎𝑎𝑎𝑎𝑎𝑎 = 𝑒𝑒(0,00182 𝑅𝑅𝑅𝑅 + 1,8 𝑇𝑇𝑑𝑑𝑑𝑑 𝑅𝑅𝑅𝑅)(0,000054 𝑇𝑇𝑑𝑑𝑑𝑑2 + 0,00192 𝑇𝑇𝑑𝑑𝑑𝑑 − 0,0246) (𝑅𝑅𝑇𝑇 − 30)
(4)
𝑢𝑢𝑎𝑎𝑑𝑑𝑎𝑎𝑎𝑎𝑎𝑎𝑎𝑎𝑎𝑎𝑎𝑎 =−6,56
𝑒𝑒( 1(2,26𝑢𝑢+2,23)0,45)
∗ �2,9 + 1,14 ∗ 10−6 ∗ 𝑢𝑢2,5 − 𝑙𝑙𝑙𝑙𝑙𝑙0,3(2,26 ∗ 𝑢𝑢 + 0,33)−2�− 0,00566𝑢𝑢2 + 3,33
(5)
𝑆𝑆𝑎𝑎𝑑𝑑𝑎𝑎𝑎𝑎𝑎𝑎𝑎𝑎𝑎𝑎𝑎𝑎 = 0,0076 𝑆𝑆 − 0,00002 ∗ 𝑆𝑆 𝑇𝑇𝑑𝑑𝑑𝑑 + 0,00005 𝑇𝑇𝑑𝑑𝑑𝑑2 ∗ √𝑆𝑆 + 0,1𝑇𝑇𝑑𝑑𝑑𝑑 − 2 (6)
(Wang et al., 2019; Wang et al., 2018b; Wang et al., 2018d)
𝐸𝐸𝑇𝑇𝑇𝑇𝐶𝐶 = 𝑇𝑇𝑑𝑑𝑑𝑑 − 0,0038 𝑇𝑇𝑑𝑑𝑑𝑑 (100− 𝑅𝑅𝑇𝑇) − 0,1173 𝑢𝑢0,707(39,20− 𝑇𝑇𝑑𝑑𝑑𝑑) + 1,86∗ 10−4𝑇𝑇𝑑𝑑𝑑𝑑 𝑆𝑆 (7)
(Wang et al., 2019, Wang et al., 2018c; Wang et al., 2018d)

Heatstress indices for automated climate control systems dairy cowshed
275
behavioral reactions of the animals, the selected indices sometimes show the highest correlations.
The comparison based on the main studies of Da Silva, Roberto Gomes da et al., 2007 Li et al., 2009 und Da Silva et al., 2015 provides an overview on the quality of the correlation between the index and the physiological responses respiratory rate, rectal temperature and skin temperature, and thus the assessment of heat stress. The indices BGHI (Black-Globe Humidity Index), THIadj (adjusted-Temperature Humidity Index) and CCI (Comprehensive Climate Index) show good performance in comparison (Wang, Bjerg et al., 2018), where the ETIC (Equivalent-Temperature Index for Dairy Cattle) index can be identified as the index with the highest predictive power after comparison with THIadj, HLI (Heat Load Index), CCI and DHLI (Dairy Heat Load Index) (Wang, Gao, Gebremedhin, Bjerg, Os et al., 2018).
Differences between indices On the basis of the dry temperatures, at which wall closure systems, fans and spray fogging
systems are controlled in the respective environmental situation (variable air speed and relative humidity), the control can be compared with the conventional THI, which has proven itself in practice, by means of the THIadj and ETIC indices. While THI takes into account the dry temperature and the relative humidity only, THIadj, CCI and ETIC can additionally include the cooling effect of a variable air speed, thus enabling a more precise evaluation of the thermal environment and the effect of the climate controllers. Microclimatic differences can be identified and the influence of free ventilation or the interaction between free and mechanical ventilation can be included. In addition, the selected indices evaluate the cooling or heating effect and the interactions between the climate parameters differently. For example, the ETIC evaluates the cooling effect of a measured air velocity higher and closes the eaves at higher dry temperatures compared to the THIadj.
Reactions of dynamic climate regulation The first regulatory action regarding an increasing heat stress level is the adjustment of
the eaves openings. The ventilation openings influence the natural air exchange by thermal lift and wind-induced pressure. This affects the dry bulp temperature, relative humidity and air velocity.
In the second step, the air exchange is supported by the use of fans. An effective cooling effect is achieved at air speeds of 1 m/s (C. Loebsin et al., 2014), while the highest cooling effect is achieved at about 2.5 m/s. Therefore, the operation levels consider these air speeds. In order to adjust the artificially generated air speed, the air speed has to be considered as a variable input parameter in stepped or continuously form.
The last step is the misting or sprinkling. The evaporation of the water causes an increase in the relative air humidity with a simultaneous reduction of the dry bulp temperature. In this way, a cooling effect of 4 to 5 °C (Arbel, 2006), and in the case of high-pressure fogging systems even 8 to 10 °C, is possible in relation to the outside air (Zucker, 2016).
DISCUSSION
Selection of indices that consider more climate parameters The climate control serves the environmental control in a dairy cattle shed, which is
characterized by a thermally insulated roof and sufficiently large roof overhangs, so that the
M. Höhendinger, A. Sixt, M. Treiber, H. Bernhardt
276
solar energy input can be neglected in the present work (S = 0 W/m²) (Hempel et al., 2020). Nevertheless, sun protection, especially in north-south oriented cowsheds in the morning and evening hours, is not always guaranteed in practice (Stötzel, 2016), which significantly influences the microclimate in the cowshed (Herbut and Angrecka, 2013). The solar energy input entering via open side facades or light ridges should therefore be taken into account in the climate control system if necessary. In contrast to the THI the selected indices THIadj, and ETIC can consider these in the control of the climate conditions.
Furthermore, the duration of the heat load and the period of the recovery phase are not taken into account. Nevertheless, it should be emphasized that the timely application of climate-regulating measures (THI < 65) can counteract the accumulation of heat in advance (Pinto et al., 2020). However, heat accumulation and nightly cooling phases are decisive for recovery (Gaughan et al., 2008). In addition to the assessment of whether acute or chronic stress is present, it is also necessary to subdivide it into cyclical or continuous heat stress (Sanz, 2018).
Consideration of animal data necessary Although animal comfort indices evaluate the effects of climate parameters on the basis
of physiological measurements, they cannot include current physiological reactions of individual animals in the evaluation, but can only estimate the environmental situation at herd level. Threshold values for the incipient heat stress and the thermoneutral zone (4 °C to 16 °C) are thus assumed for the entire dairy herd. However, animal-specific differences in thermal well-being and adaptation mechanisms cause great uncertainty in the determination of these threshold values. Physiological and ethological animal reactions under consideration of animal-specific influencing factors must therefore be considered urgently (Hempel et al., 2020). Also Hahn et al. (2009) emphasizes the necessity of combining an animal comfort index with the immediate physiological reactions for the decision of tactical management measures. The recording of physiology, behavior and productive reactions during climate control can be a useful criterion for this purpose, in order to evaluate the efficiency of climate regulation and to optimize threshold values in control (Sanz, 2018). However, as confirmed by systematic literature research, recognized threshold values for thermoregulatory animal reactions are not yet known (Hoffmann et al., 2019). Therefore, the focus of the work is on index-based decision rules, which are proposably based on the threshold values defined in the literature for the comfort zone and the incipient heat stress caused by the indices. Nevertheless, due to the uncertainty these thresholds are not to be considered as fixed limits but as a proposal that can be adapted depending on the definition of the thermoregulatory limits.
In this context, the predominant cowshed management in Central Europe creates challenges, but also opportunities, to alleviate the heat stress of the dairy cow by means of constructional and technical measures (Bianca, 1976). Both climatic parameters and the individual physiology of the dairy cow in the cowshed must be taken into account in order to provide effective measures for the reduction of heat stress. In the present work, this challenge for an autonomous climate control is considered in detail regarding the relation to smart farming technologies. It is intended to elaborate on the theoretical requirements for an automatic climate control system for dairy farms. The focus is set on dynamic climate regulation systems to reduce heat stress.

Heatstress indices for automated climate control systems dairy cowshed
277
CONCLUSIONS
The heat load increasing in intensity and duration while simultaneously increasing susceptibility to heat stress the dairy cow shows the urgency, but also the challenge of Cowshed air conditioning on. Within the framework of smart farming, therefore, sensor-based real-time monitoring and control system index-based decision rules which are to enable effective and precise climate control. THIadj, CCI and ETIC are used as suitable animal comfort indices for climate control.
On the basis of the dry temperatures at which wall closure systems, fans and spray or fogging systems in the respective environmental situation (variable air speed and relative humidity) react, the regulation can be controlled by the indices THIadj, CCI and ETIC can be compared with THI, which has already proven itself in practice. During THI takes into account the drying temperature and relative humidity, THIadj, CCI and ETIC additionally include the cooling effect of a variable air speed and thus a more precise evaluation of the thermal environment and the effect of the climate regulators enable. For example, ETIC evaluates the cooling effect a measured air speed higher and closes the side wall panels already at higher drying temperatures compared to THIadj. However, in practice it should be noted that for a different climate zone or dairy cows with different thermal requirements to use other indices and threshold values if necessary are.
The animal-specific differences above all the milk yield, the thermal well-being of the individual animal and thus individually influence the necessary limit value. Thus, measurements show that physiological and behavioral reactions in real time are necessary to be able to use single animal reactions to get a direct conclusion on the thermal comfort. The literature search showed that especially the respiratory rate is a suitable indicator animal heat load. On the other hand, thresholds for the use as climate indicators still be cannot be derived. Affected Assumptions regarding the air conditioning technology (e.g. fan output) must be taken into account when transferring to the practice must be taken into account. Here the practical check of an adjustment of the thresholds is necessary.
The exemplary derived steps regarding animal comfort indices can be used as a valuable tool for decision support in the context of an autonomous climate control, which is why further research is being conducted on the basis of this should be made for intelligent climate control.
REFERENCES
Arbel, A. (2006). Cooling livestock buildings by integrated high pressure fogging system with air ventilation and circulation systems: Israel’s solution. In I. d. A. Nääs, D. J. Moura (Eds.), Animal Housing in Hot Climates: A multidisciplinary view. Workshop of CIGR Selection II. Horsens: Research Centre Bygholm, Danish Institute of Agricultural Sciences, 23–27.
Bianca, W. (1976). The signifiance of meterology in animal production. International Journal of Biometeorology, 20(2), 139–156.
CIGR. (2014). The Design of Dairy Cow and Replacement Heifer Housing: CIGR Recommendations of Dairy Cow and Replacement Heifer Housing. Report of the CIGR Section II Working Group N° 14 Cattle Housing.
Da Silva, R. G., Maia, A. S. C., Macedo Costa, L. L. de. (2015). Index of thermal stress for cows (ITSC) under high solar radiation in tropical environments. International Journal of Biometeorology, 59(5), 551–559.

M. Höhendinger, A. Sixt, M. Treiber, H. Bernhardt
278
Da Silva, Roberto Gomes da, Morais, D. A. E. F., Guilhermino, M. M. (2007). Evaluation of thermal stress indexes for dairy cows in tropical regions. Revista Brasileira De Zootecnia, 36(4), 1192–1198.
Fournel, S., Rousseau, A. N., Laberge, B. (2017). Rethinking environment control strategy of confined animal housing systems through precision livestock farming. Biosystems Engineering, 155, 96–123.
Gaughan, J. B., Mader, T. L., Gebremedhin, K. G. (2012). Rethinking Heat Index Tools for Livestock. In R. J. Collier, J. L. Collier (Eds.), Environmental Physiology of Livestock. John Wiley Sons, Inc., Oxford, UK, 243–265.
Gaughan, J. B., Mader, T. L., Holt, S. M., Lisle, A. (2008). A new heat load index for feedlot cattle. Journal of Animal Science, 86(1), 226–234.
Hahn, L. G., Gaughan, J. B., Mader, T. L., Eigenberg, R. A. (2009). Chapter 5: Thermal Indices and Their Applications for Livestock Environments. In Livestock Energetics and Thermal Environmental Management. St. Joseph Mi: American Society of Agricultural and Biological Engineers (ASABE), 113–130.
Hansen, C. (2020). Entwicklung der Stallklimadaten in einem freigelüfteten Milchviehstall. In Beiträge zum Thema Stallklima in der Tierhaltung 2020. Dummerstorf: Landesforschungsanstalt für Landwirtschaft und Fischerei Mecklenburg-Vorpommern, 6–12.
Heidenreich, T. (2009). Luftführung und energietechnische Aspekte zur Verringerung von Hitzestress in Rinderstallanlagen. In LFZ Raumberg-Gumpenstein (Ed.), Bautagung Raumberg-Gumpenstein 2009: Technik in der Rinderhaltung, Emissionen, Rahmenbedingungen für die Schweinehaltung. gemäß des Fortbildungsplan des Bundes, 29–32.
Heidenreich, T., Büscher, W., Cielejewski, H. (2005). Vermeidung von Wärmebelastungen für Milchkühe. Merkblatt 336. Frankfurt am Main.
Hempel, Sabrina, Hoffmann, Gundula, Müschner-Siemens, T., Heinicke, J., Pinto, S., Amon, Thomas. (2020). Diagnostizierte und prognostizierte tierspezifische Hitzestressbelastungen bei steigenden Temperaturen und erhöhter Klimavariabilität. In Beiträge zum Thema Stallklima in der Tierhaltung 2020. Dummerstorf: Landesforschungsanstalt für Landwirtschaft und Fischerei Mecklenburg-Vorpommern, 30–39.
Herbut, P., Angrecka, S. (2013). Forecasting Heat Stress in Dairy Cattle in Selected Barn Zones with the Help of Thi and Thiadj Indexes / Prognozowanie Stresu Cieplnego U Bydła Mlecznego W Wybranych Strefach Obory Za Pomocą Wskaźników Thi I Thiadj. Annals of Animal Science, 13(4), 837–848.
Herbut, P., Angrecka, S. (2018). Relationship between THI level and dairy cows’ behaviour during summer period. Italian Journal of Animal Science, 17(1), 226–233.
Hoffmann, Gundula, Herbut, P., Pinto, S., Heinicke, J., Kuhla, B., Amon, Thomas. (2019). Animal-related, non-invasive indicators for determining heat stress in dairy cows. Biosystems Engineering.
Holmes, B. J., Massie, L. R., Janni, K. A. (2015). Low Pressure Sprinkler and Fan Cooling System Design for Dairy Facilities.
Li, S., Kifle, G. G., Chin, L. N., Robert, C. J. (2009). Evaluation of Thermal Stress Indices for Cattle. Paper Number: 096003. St. Joseph, Michigan (USA).
Loebsin, C., Fiedler, M., Tober, O., Hoffmann, G., Hempel, S., Amon, T. (2014). Minderungsmöglichkeiten von Hitzestress am Beispiel von Zusatzlüftung. In Beiträge zum Thema Stallklima in der Tierhaltung. Dummerstorf: Arbeitsgruppe „Stallklima und Emissionen“ der Koordinierungsgruppe Tierhaltung, 31–42.
Mader, T. L., Davis, M. S., Brown-Brandl, T. (2006). Environmental factors influencing heat stress in feedlot cattle. Journal of Animal Science, 84(3), 712–719.
Pedersen, S., Sällvik, K. (2002). 4th Report of Working Group on Climatization of Animal Houses: Heat and moisture production at animal and house levels. Dänemark.

Heatstress indices for automated climate control systems dairy cowshed
279
Pinto, S., Hoffmann, Gundula, Ammon, C., Amon, Thomas. (2020). Critical THI thresholds based on the physiological parameters of lactating dairy cows. Journal of Thermal Biology, 88, 102523.
Sanz, S. C. (2018). Defining upper critical temperatures for an effective climate control to reduce heat stress. Agricultural Engineering International: CIGR Journal.
Stötzel, P. (2016). Bauliche Einflussfaktoren auf das Temperaturverhalten eines Milchviehstalls. In Bayerische Landesanstalt für Landwirtschaft (Ed.), Möglichkeiten zur Reduzierung von Hitzestress im Milchviehstall: LfL-Information, Freising-Tüntenhausen, 28–52.
Stötzel, P. (2018). Einfluss baulicher Maßnahmen zur Reduzierung von Hitzestress in Milchviehställen. In Bayerische Landesanstalt für Landwirtschaft (Ed.), Automatisierung im Milchviehstall, LfL-Information, LfL-Tier und Technik. Freising-Weihenstephan, 43–44.
Tober, Olaf. (2020). Abhängigkeit der Vormagentemperatur von der Stalltemperatur bei laktierenden Kühen in einem frei gelüfteten Stall. In Beiträge zum Thema Stallklima in der Tierhaltung 2020. Dummerstorf: Landesforschungsanstalt für Landwirtschaft und Fischerei Mecklenburg-Vorpommern, 13–22.
Wang, X., Bjerg, B. S., Choi, C. Y., Zong, C., Zhang, G. (2018). A review and quantitative assessment of cattle-related thermal indices. Journal of Thermal Biology, 77, 24–37.
Wang, X., Gao, H., Gebremedhin, K. G., Bjerg, B. S., Os, J. V., Tucker, C. B., Zhang, G. (2018). A predictive model of equivalent temperature index of dairy cattle (ETIC). Journal of Thermal Biology, 76, 165–170.
Wang, X., Gao, H., Gebremedhin, K. G., Bjerg, B. S., van Os, J., Tucker, C. B., Zhang, G. (2018). A predictive model of equivalent temperature index for dairy cattle (ETIC). Journal of Thermal Biology, 76, 165–170.
Wang, X., Gao, H., Gebremedhin, K. G., Bjerg, B. S., van Os, J., Tucker, C. B., Zhang, G. (2019). A predictive model of equivalent temperature index for dairy cattle (ETIC). Journal of Thermal Biology, 82, 252–253.
Wang, X., Zhang, G., Choi, C. Y. (2018). Effect of airflow speed and direction on convective heat transfer of standing and reclining cows. Biosystems Engineering, 167, 87–98.
Zahner, J. (2020). Technische Maßnahmen zur Reduzierung von Hitzestress in Rinderställen. In Beiträge zum Thema Stallklima in der Tierhaltung 2020. Landesforschungsanstalt für Landwirtschaft und Fischerei Mecklenburg-Vorpommern, Dummerstorf, 40–44.
Zentner, E. (2010). Stallklima im Rinderstall. In Lehr- und Forschungszentrum für Landwirtschaft Raumberg-Gumpenstein (Ed.), 3. Tierärztetagung Raumberg-Gumpenstein 2010: Tierärztliche Bestandsbetreuung für Milchviehbetriebe. Lehr- und Forschungszentrum für Landwirtschaft Raumberg-Gumpenstein, Irding, 57–64.
Zucker, B.-A. (2016). Kompendium der Tierhygiene 5., vollständig überarbeitete und erweiterte Auflage. lehmanns media, Berlin.


48th Symposium "Actual Tasks on Agricultural Engineering", Zagreb, Croatia, 2021
281
ASSESSMENT OF THE CONSTRUCTIVE PROPERTIES OF SOME MILKING LINERS AND THEIR EFFECT
OVER THE PULSATION CYCLE Radu ROŞCA*, Petru CÂRLESCU, Virgil VLAHIDIS
*E-mail of corresponding author: [email protected] Agricultural Machinery Dept., University of Agricultural Sciences and Veterinary Medicine
"Ion Ionescu de la Brad" Iaşi, Sadoveanu St., no. 3, Iaşi, Romania
ABSTRACT
The liner of the teatcup is the only part of the milking system which comes in direct contact with the teat; therefore, it represents one of the key elements in order to ensure a quick, complete and comfortable milking.
Numerous experiments have proved that the construction properties of the teatcup have a significant effect over the mechanical milking parameters. As an example, experiments performed in Ireland have shown that, depending on the type of liner, liner slip may occur, the duration of the milking cycle phases is affected and the milk yield may vary significantly.
The paper presents the results of the investigations performed over four different types of milking teatcups, equipped with rubber and silicone liners. The teatcups used in this study were: Westfalia ClassicPro (part no. 7029-2725-010), Westfalia Classic (part no. 7021-2725-350), BouMatic R-1C and Sezer (part no.154-035-001).
The following mechanical properties were taken into account: pressure difference for collapsing the liner, height of the mouthpiece, barrel bore at 75 mm from the mouthpiece lip, liner elongation and tension, elasticity modulus of the liner.
In order to evaluate the parameters of the milking cycle an artificial teat, made in accordance with the specifications of the ISO 6690 standard was inserted into the teatcup, and the vacuum in the short pulse tube of the liner was recorded.
The experimental results showed that liner properties and material have a significant effect over the parameters of the milking cycle (durations of the cycle phases and pulsation frequency).
Keywords: teatcup liner, milking cycle
48. ACTUAL TASKS ON AGRICULTURAL ENGINEERING
Preliminary communication
R. Roşca, P. Cârlescu, V. Vlahidis
282
INTRODUCTION
The liner of the teatcup is the only part of the milking system which comes in direct contact with the teat; therefore, it represents one of the key elements in order to ensure a quick, complete and comfortable milking.
According to Butler and Hillerton (1989), variations in teatcup liner design affect the milking performance of dairy cows; differences in liner wall movement influence the forces applied to the cow's teat.
Reinemann (2012) concluded that liner compression depends on the physical dimensions, material properties and mounting characteristics (e.g. mounting tension) of the liner, in addition to pressure difference applied across the collapsed liner during the d-phase of pulsation. It also depends on teat dimension and liner-teat fit.
Other authors (Hamann et al., 1994; Muthukumarappan and Reinemann, 1993; Reinemann et al., 1994) also emphasized the effect of some liner constructive and operating characteristics (such as the pressure difference between liner vacuum and pulsation chamber vacuum, liner tension, liner wall thickness, liner hardness) on the compressive load exerted by the liner.
On the other hand, the characteristics of the milking cycle are of outmost importance because, as all the researchers agree, they have a direct effect over the milk yield and the health of the animals; different pulsation settings can influence both teat condition and teat tissue condition (Demba S. et al., 2018).
According to Bade et al. (2009), the pulsation rate and ratio, the vacuum level and the compressive load applied to the teat when the liner collapses are the factors affecting the peak milk flow rate: the flow rate increases when the vacuum applied to the teat end and the duration of the b phase increases; in the meantime, the liner compression should increase in order to relieve tissue congestion due to the higher milking vacuum. Adley and Butler (1994) stated that inadequate liner collapse could lead to high infection levels. Mein and Reinemann (2009) also concluded that the liner compression should increase when the milking vacuum is increased, but also mentioned that an increased liner compression has negative effect over the teat-end condition, leading to the development of teat-end hyperkeratosis. They also showed that an increased duration of the b phase led to a higher peak milk flow rate.
In a paper presented at the NMC 47th Annual Meeting by Kochman et al. (2008) the importance of the c phase was emphasized; the authors stated that, for a shorter c phase, the increased closing speed of the liner could cause physical discomfort to the cow, with negative results over the milking performance.
Billon and Gaudin (2001) showed that the milking time and milk flow rates were affected by the duration of the "a" and "c" phases; shorter phases led to longer milking times and lower flow rates.
Some of these findings provided the scientific basis for the requirements of the ISO 5707:2007 standard, which states that, for cows, the b phase shall not be less than 30% of a pulsation cycle and phase d shall be not less than 150 ms.
Taking into account all these elements, the present the paper presents the results of the investigations performed over four different types of milking teatcups, equipped with rubber

Assessment of the constructive properties of some milking liners and their effect over the pulsation cycle
283
and silicone liners. Some mechanical properties were first measured and their effect over the milking cycle parameters was then studied.
MATERIALS AND METHODS
Four types of milking teatcups were tested: - Westfalia ClassicPro (part no. 7029-2725-010) – fig. 1a; - Westfalia Classic (part no. 7021-2725-350) – fig. 1b; - BouMatic R-1C – fig. 1d; - Sezer (part no. 154-035-001) – fig. 1c.
Figure 1 Tested teatcups
Table 1 presents the main specifications of the teatcups.
Table 1 Specifications for the tested teatcups
Parameter
Teatcup type
Westfalia ClassicPro
(cod 7029-2725-010)
Westfalia Classic (cod 7021-2725-
350) BouMatic R-1C
Sezer (cod 154-035-
001)
Orifice diameter [mm] 23 23 21 25
Liner material silicone rubber rubber rubber
Teat diameter [mm] 21-28 20-27 - -
Liner thickness [mm] 2,5 2 2 2

R. Roşca, P. Cârlescu, V. Vlahidis
284
The following operating parameters were investigated: - liner touch point pressure; - liner mouthpiece depth; - liner bore; - liner elongation and mounting tension; - liner elasticity modulus; - milking cycle parameters (pulsation rate and ratio, duration of the phases). According to the ISO 3918:2007 standard the liner touch point pressure difference is the
pressure difference between the pulsation chamber and the inside of the liner barrel at which the opposing walls of the liner start to touch each other when it is mounted in its shell (fig. 2).
The mouthpiece depth was measured using a special device, as shown in fig. 3, at different values of the vacuum in the liner barrel (20, 30, 40 and 50 kPa).
The liner bore was measured at 75 mm from the mouthpiece, as recommended by ISO 3918:2007 standard, using gauges (fig. 4) with different diameters (D = 20 - 25 mm).
Liner elongation was calculated using the equation:
[ ]%100Ln
LnLpD% ⋅−
= (1)
where Ln is the unstretched length of the liner and Lp is the length of the liner when it is mounted in its shell.
Figure 2 Liner at touch point pressure difference (ISO 3918:2007)
Figure 3 Measuring the mouthpiece depth
1-conical plug; 2-cylindrical rod; 3-ruler; 4-teatcup

Assessment of the constructive properties of some milking liners and their effect over the pulsation cycle
285
Figure 4 Gauge for measuring the liner bore at 75 mm depth
The liner elasticity modulus of the liner was calculated with the equation
(Muthukumarappan and Reinemann, 1993):
π⋅⋅=
DgFME (2)
where F is the mounting tension, g is the thickness of the liner wall and D is liner bore; the liner mounting tension is the force required to stretch the liner from Ln to Lp.
The parameters of the milking cycle were recorded for a vacuum level of 40 kPa;
SMARTEC SPD015AAsil absolute pressure sensors were mounted on the short pulse tube and short milk tube, as shown in fig. 5. Artificial teats, made according to the recommendations of the ISO 6690:2007 standard (fig. 6) were inserted into the teatcups for the duration of the tests.
The cycle phases, pulsation rate and pulsation ratio were defined according to the specifications of the ISO 5707: 2007 standard (fig. 7): "a" is the increasing vacuum phase, "b" is the maximum vacuum phase, "c" is the decreasing vacuum phase and "d" is the minimum vacuum phase. The pulsation ratio is defined as the ratio between the duration of the a + b phases and the duration of the entire cycle; the pulsation rate is the number of pulsations per minute: 60/(a+b+c+d).
Figure 5 Absolute pressure sensors mounted on the short pulse tube and short milk tube
Figure 6 Artificial teat (ISO 6690:2007)

R. Roşca, P. Cârlescu, V. Vlahidis
286
Figure7 The pulsation cycle (ISO 5707: 2007)
The tests were performed on a bucket milking machine, equipped with a BRK type
pneumatic pulsator. A hand operated vacuum pump was used in order to obtain the liner touch point pressure.
RESULTS AND DISCUSSION
Table 2 summarizes the results regarding the measured parameters for the tested liners.
Table 2 Measured parameters for the tested liners
Parameter
Teatcup type
Westfalia ClassicPro (p.n. 7029-2725-010)
Westfalia Classic
(p.n. 7021-2725-350)
BouMatic R-1C
Sezer (p.n. 154-035-001)
elongation, D% [%] 5.7 3.5 11.9 12.7
mounting tension, F [N] 2.9 3.4 5.6 7.35
liner bore at 75 mm depth [mm] 22 22 20 24
elasticity modulus, ME [N/mm2] 0.0168 0.0246 0.0446 0.0487
touchpoint pressure difference [kPa] 14 9,5 13 15
mouthpiece depth [mm] for different
vacuum levels
20 kPa 46 43 44 49
30 kPa 41 38 38 43
40 kPa 36 34 32 39
50 kPa 31 30 29 35

Assessment of the constructive properties of some milking liners and their effect over the pulsation cycle
287
Liner bore According to the ISO 5707:2007 standard the liner bore should be measured at a depth of
75 mm; from this point of view, the liners may be classified as narrow bore (less than 21 mm), medium (21 - 24 mm) and large (over 24 mm). According to this criterion, the Sezer and Wesfalia teatcups are equipped with medium bore liners and the BouMatic teatcup has a small liner.
The measurements of the liner orifice diameter and liner bore confirmed the tapered shape of the liners; this solution has the potential to diminish the teatcup slip rate and to increase milk yield (O’Callaghan, 1997; Mein and Reinemann, 2009).
Mouthpiece depth The data presented in Table 2 show that, when the mouthpiece depth is taken into account,
the liners are divided in two groups: the Westfalia and BouMatic teatcups have small heights (43...46 mm at a vacuum level of 20 kPa), while the mouthpiece depth of the Sezer teatcup is higher (49 mm at a vacuum level of 20 kPa). As a result, the first three teatcups are recommended for cows with shorter teats (Reinemann, 2012).
Fig. 8 presents the results concerning the mouthpiece depth for the four liners and four vacuum levels; it is clear that the mouthpiece depth has a linear variation, decreasing with the vacuum level. This decrease is less significant for the Westfalia Classic liner then for the Classic Pro liner, probably because of the higher mounting tension (3.4 N for the Classic liner and 2.9 N for the Classic Pro liner).
Elongation, mounting tension and elasticity modulus Table 2 shows that the elongation of the liners was comprised between 3.5% and 12.7% -
values which are within the recommended limits (Boast et al., 2008)-, while the mounting tension was comprised between 2.9 and 7.35 N.
As a general rule, it was expected that a higher elongation would lead to a higher mounting tension and this behaviour was indeed confirmed for the liners made from similar materials (rubber): the elongation has increased from 3.5% for the Classic liner (with a mounting tension of 3.4 N) to 12.7% for the Sezer type liner (with a mounting tension of 7.35 N); higher mounting tensions will lead to the decrease of the duration of the liner opening phase (a phase, fig. 7).
For the relatively similar Westfalia liners, due to the different type of materials, with different elasticity moduli, the higher elongation value of the Classic Pro silicone liner (5.7%) compared with the one of the Classic rubber liner (3.5%) did not cause a significantly higher mounting tension (2.9 N for Classic Pro, respectively 3.4 N for Classic). The lower mounting tension is expected to lead to a lower teat-liner contact pressure (Reinemann et al., 1994; Leonardi et al., 2015).

R. Roşca, P. Cârlescu, V. Vlahidis
288
Figure 8 Effect of vacuum level over the mouthpiece depth
Touchpoint pressure difference The values obtained for the touchpoint pressure difference are within the range reported
by other authors (Muthukumarappan and Reinemann, 1993). The general rule is that a higher mounting tension will cause a higher touchpoint pressure
difference; the tests confirmed this behaviour for the liners made from similar materials (rubber): 9.5 kPa for the Classic liner (3.4 N mounting tension), 13 kPa for the BouMatic liner (5.6 N mounting tension) and 15 kPa for the Sezer liner (7.35 N mounting tension).
The effect of the different materials used for the liners was clear when comparing the Classic and Classic Pro liners (made from rubber and silicone, respectively): 14 kPa touchpoint pressure difference for the Classic Pro liner and 9.5 kPa for the Classic liner. As a result, one would expect to record a lower liner-teat contact pressure for the silicone made liner.
Milking cycle parameters Table 3 summarizes the milking cycle parameters for the teatcups equipped with rubber
liners. Table 3 Milking cycle parameters (rubber liners)
Item Westfalia Classic teatcup
BouMatic teatcup
Sezer teatcup
phase a [s] 0.147 0.123 0.100 phase b [s] 0.513 0.553 0.563 phase c [s] 0.116 0.120 0.138 phase d [s] 0.410 0.393 0.388
cycle duration [s] 1.186 1.189 1.189 pulsation rate [cycles/min] 50.60 50.46 50.46
pulsation ratio [%] 55.60 56.80 55.70
20
25
30
35
40
45
50
55
10 20 30 40 50 60
h [m
m]
vacuum level [kPa]
ClassicProClassicBouMaticSezer

Assessment of the constructive properties of some milking liners and their effect over the pulsation cycle
289
As far as the "a" phase is concerned, the results show that an increased mounting tension and elongation led to the decrease of the duration of the liner opening phase, which means faster opening of the liner when vacuum is applied to the pulsation chamber of the teatcup.
As a result of a decreased "a" phase, the "b" phase has increased; moreover, according to Worstoff and Bilgery (2002), an increased touchpoint pressure difference will lead to the increase of the overall liner open phase duration, which would also lead to the increase of the "b"phase.
The results presented in Table 3 show that, for the teatcups equipped with rubber liners, there were no significant differences regarding the pulsation rate and ratio. In order to evaluate the effect of the liner material, Table 4 presents the comparative results for the Classic and Classic Pro teatcups (with rubber and respectively silicone liners).
Table 4 Milking cycle parameters for the Westfalia teatcups
Cycle Classic ClassicPro phase a [s] 0.147 0.140 phase b [s] 0.513 0.520 phase c [s] 0.116 0.180 phase d [s] 0.410 0.396
cycle duration [s] 1.186 1.236 pulsation rate [cycle/min] 50.60 48.50
pulsation ratio [%] 55.60 53.40 These results clearly show that liner material has affected the pulsation rate (significant
differences, p≤ 0.05): lower pulsation rate (longer cycle duration) for the teatcup equipped with silicone made liner; as the dimensions of the two liners are relatively equal, it results that these differences are only due to the different mechanical properties of the liners (elasticity modulus, mounting tension, elongation).
CONCLUSIONS
Four types of milking teatcups were investigated in order to evaluate the impact of the mechanical properties over the milking cycle parameters. The teatcups were different with respect of liner bore and material.
For the liners made of the same material (rubber), liner elasticity modulus, mounting tension, elongation and touchpoint pressure difference were related to one another: higher elasticity modulus led to higher elongation, mounting tension and touchpoint pressure difference.
For liners with relatively similar dimensions and from the same manufacturer (Westfalia) but made from rubber and silicone, respectively, the use of silicone has led to the increase of the touchpoint pressure difference; as a result, lower teat-liner contact pressures are to be expected.

R. Roşca, P. Cârlescu, V. Vlahidis
290
As far as the milking cycle are concerned, the increased mounting tension and elongation resulted in the decrease of the duration of the "a" phase of the cycle and increase of the "b" phase.
The material the liner is made of has affected the pulsation rate; as a result, a lower pulsation rate (longer cycle duration) was recorded for the teatcup equipped with silicone made liner.
Additional experiments are needed, aiming to evaluate the average teat-liner contact pressure and liner compression.
REFERENCES
Adley, N.J.D., Butler, C. (1994). Evaluation of the use of an artificial teat to measure the forces applied by a milking machine teatcup liner. Journal of Dairy Research, 61, 467-472.
Bade, R. D., Reinemann, D. J., Zucali, M., Ruegg, P.L., Thompson, P.D. (2009). Interactions of vacuum, b-phase duration and liner compression on milk flow rates in dairy cows. Journal of Dairy Science, 92, 913-921.
Billon, P., Gaudin, V. (2001). Influence of the duration of the a and c phases of pulsation on the milking characteristics and on udder health of dairy cows. ICAR Technical Series, 7, 105-111.
Boast, D., Hale, M., Turner, D., Hillerton, J.E. (2008). Variation in rubber chemistry and dynamic mechanical properties of the milking liner barrel with age. Journal of Dairy Science, 91, 2247-2256.
Butler, M.C., Hillerton, J.E. (1989). Methods of assessing teatcup liner performance. Journal of Agricultural Engineering Research, 44, 77-86.
Demba, S., Ammon, C., Rose-Mierhöfer, S.R. (2018). The influence of different milking settings on the measured teat load caused by a collapsing liner. Computer and Electronics in Agriculture, 153, 54-61.
Hamann J., Osteras, O., Mayntz, M., Woyke, W. (1994). Functional parameters of milking units with regard to teat tissue treatment. Bulletin of the International Dairy Federation, 27 (Teat Tissue Reactions to Machine Milking and New Infection Risk), 23-34.
ISO 3918:2007. Milking machine installations – Vocabulary. International Organization for Standardization, Geneva, Switzerland.
ISO 5707:2007. Milking machine installations - Construction and performance. International Organization for Standardization, Geneva, Switzerland.
ISO 6690:2007. Milking machine installations – Mechanical tests. International Organization for Standardization, Geneva, Switzerland.
Kochman, A.K., Laney, C., Spencer, S.B. (2008). Effect of the duration of the c phase of pulsation on milking performance. Presented at the 47th National Mastitis Council Conference (avilable on-line at: http://www.laurenagrisystems.com/PDF/Research/EffectsOfDurationOfCPhaseOfPulsation.pdf
Leonardi, S., Penry, J.F., Tangorra, P.D., Thompson, P.D., Reinemann, D.J. (2015). Methods of estimating liner compression. Journal of Dairy Science, 98, 6905-6912.
Mein, G.A., Clough, P.A., Westgarth, D.R., Thiel, C.C. (1970). A comparison of milking units with regard to teat tissue treatment. Journal of Dairy Research, 27, 535-548.
Mein, G.A., Reinemann, D.J., Ohnstad, I., O’Callaghan, E. (2004). 100 years with liners and pulsators: where the rubber meets the teat and what happens to milking characteristics. Bulletin of the International Dairy Federation, 388, 28-34.
Mein, G.A., Reinemann, D.J. (2009). Biomechanics of milking: teat-liner interactions. ASABE Paper no. 09743.

Assessment of the constructive properties of some milking liners and their effect over the pulsation cycle
291
Muthukumarappan, K., Reinemann, D.J. (1993). Compressive load applied by the teatcup liner to the bovine teat. ASAE Paper no. 933538 presented at the 1993 International Winter Meeting of ASAE, Chicago, Illinois, ASAE, 2950 Niles Rd., St. Joseph, Michigan
O’Callaghan, E. (1997). Comparison of testing systems for evaluating milking machine components. Proceedings International Conference on Machine Milking and Mastitis, Moorepark, Fermoy, Ireland.
Reinemann, D.J., Mein. G.A., Muthukumarappan K. (1994). Forces applied to the bovine teat by the teatcup liner during machine milking. Report n.94-D-052, presented at the XII CIGR World Congress and AGENG’94 Conference on agricultural engineering, Milano, Italy
Reinemann, D.J. (2012). The smart position on teat condition. Proceedings of the New Zealand Milk Quality Conference, 17.14.1-17.14.8 (available at: http://www.sciquest.org.nz/node/139527)
Worstorff, H., Bilgery, H. (2002). Effects of buckling pressure and teat length on calculated liner-open phases. Milchwissenschaft, 57, 243-246.


48th Symposium "Actual Tasks on Agricultural Engineering", Zagreb, Croatia, 2021
293
CONCEPT STUDY OF A COOLING SYSTEM FOR FATTENING PIGS WITH HEAT RECOVERY BY
CONDUCTIVITY Kathrin L. M. ZIEGLER*, Jochen G. WIECHA, Heinz BERNHARDT
*E-Mail of corresponding author: [email protected] Technical University of Munich, Chair of Agricultural Systems Engineering,
Dürnast 4, 85354 Freising, Germany
ABSTRACT
Animal husbandry has a major impact on climate change. Due to the accumulating heat periods, appropriate technical adjustments are required in animal production. Especially in fattening pigs, the arising heat stress has a negative impact on the quality of the market product meat. In modern fat stores it is not possible to enable animal-specific heat regulation by wallowing, consequently the animals prefer heat conducting materials to cool themselves down. Our investigations using a thermal imaging camera showed a remaining heat shadow on the resting places of the animals. Therefore, this paper presents the concept study of a cooling system, able to be integrated into the lying areas of the animals in the pen without additional space requirements and thus improves the welfare of the animals. The principle of conductivity of the material used should be used for additional energy retrieval through conduction.
Keywords: animal welfare, cooling system, fattening pig, heat stress, energy efficiency
INTRODUCTION
Due to climate change and facing the increasing demands on animal welfare and the higher temperatures in summer, it will be necessary to adapt conventional pig husbandry systems (Opderbeck et al. 2020). Fulfilling the basic needs of animal welfare is also in the focus of livestock husbandry these days. These needs are the consequence of the body's functional systems. In the case of the pig as a farm animal, such an essential requirement is the external regulation of body temperature. In addition to latent heat, convection to air and radiation to other surfaces, conduction to the ground is an important measure for thermoregulation in pigs. This also makes it difficult to be categorical about specific temperatures for different weights
48. ACTUAL TASKS ON AGRICULTURAL ENGINEERING
Review paper

K. L. M. Ziegler, J. G. Wiecha, H. Bernhardt
294
of pig (Medojevic et al. 2017). But since the animals have only a few sweat glands and a comparatively small lung volume, cooling in wallows in boggy ground depressions alone is effective (Kelly 1954).
In modern postures on slatted concrete floors, however, the dissipation of body heat through the skin can only be implemented to a limited extent (Weber 2003). Due to the manifesting climate change with its increasing periods of heat, there is great potential for heat stress. This manifests itself in symptoms such as panting, reduced feed consumption, increased lying in moist compartment corners or under drinking stations, as well as in round stone troughs and in the general avoidance of body contact (Goodland and Appendix 2009, Thornton et al. 2009, Gerber et al. 2013, Mitkovits et al. 2019). From temperatures of 25-30 ° C, the circulatory system, metabolism, immune system and fertility are negatively affected and accordingly a deterioration in animal production performance and thus the quality of the end product meat is likely (Lucas et al. 2000, Schauberger et al. 2000, Haeussermann et al. 2007).
Existing systems such as ventilation and sprinkler systems mostly use the indirect cooling effect created by the generated air flow or circulation or the evaporation cooling. Studies further confirm that the animals accept an additional cooling option in the floor of the fattening house and cooling pads in the hot summer months (Huynh et al. 2004, Shi et al. 2006, Valino et al. 2010). However, it should be noted here that the costs for the systems must be within a financially acceptable range in order to remain economical for operation.
In order to offer the animals and owners a regulation system that is better adapted to their respective needs and that can be easily retrofitted, an innovative cooling system with efficient, energetic heat recovery is presented in this project, which is integrated into the lying areas. This should to a large extent take into account the animal welfare in livestock stalls.
MATERIALS AND METHODS
In §22 of the Animal Welfare and Livestock Keeping Ordinance, a device is required to “reduce the heat load on pigs at high barn air temperatures”, but without defining an exact value of when the animals are exposed to heat (BMELV 2009). If the ambient temperature is very high, the heat transfer from the animal to the environment is reduced to the same extent. Since thermoregulation through evaporation of water through the skin in pigs is only possible to a limited extent and therefore does not make a significant contribution to cooling, evaporation through the lungs is the most important source of heat release from around 24 ° C (Wegner 2014). Through conduction, pigs are able to transfer heat to e.g. to hand over the lying surface. The heat exchange with the surface depends on the temperature of the surface and its conductivity (Fialho et al. 2004). It is assumed that around 20% of the animal's body surface rests on the surface that it is supposed to cool (Wegner 2014). Hot and humid climates promote the development of heat stress. This begins when the upper critical temperature of the thermo-neutral zone is exceeded and influences both productivity and the reproduction of livestock (Fuquay 1981, Zumbach 2009). As the temperature rises, the voluntary feed intake of pigs decreases, which can be explained physiologically by the reduction in metabolic heat production.
Since there are no options in modern pig husbandry due to unstructured husbandry conditions, we determined that the animals preferred the metal or plastic walls that border the

Concept study of a cooling system for fattening pigs with heat recovery by conductivity
295
pens, i.e. material that dissipates heat as much as possible, when they are exposed to heat stress. Using a thermal imaging camera, it was then possible to determine that after standing up, a heat shadow remains on the material, which slowly fades (see Fig. 2-4). The project idea, on the one hand to offer the animals a chance to cool and, in return, to use the body heat left there by the principle of conduction, led to the development of the design drawings of the cooling system presented in the following chapter. They are based on ventilation with heat recovery, such as those used as standard in passive houses in structural engineering (Holle 2009).
Thermal Imaging The thermal imaging camera Pro ™ Vue 640 from Flir® Systems, Inc. (Wilsonville, USA)
was used toproduce the thermal images, which functions both as a measuring instrument and as a data recorder. The experimental setup was as follows:
Figure 1 Experimental Design for Thermal Imaging Test, © Chair of Agricultural Systems
Engineering, 2018 The target area and image processing elements could be set to an external device using an
app. The measurements in the test facility in Thalhausen were made with a frequency of one image every five seconds. The camera settings were made using the associated app on a Galaxy Tab 2 8.0 “, 32 GB (Wi-Fi) from Samsung (Seoul, South Korea). Two groups of animals in different fattening stages were observed on two different experimental farms (TUM experimental farm Thalhausen near Freising and Lfl experimental center in Schwarzenau near Würzburg).
RESULTS AND DISCUSSION
Pretests Thermal Imaging In advance, the produced thermal images provided information about the lying behavior
and the warmth shadows left behind by the animals on the outer walls of the box. Figure 2

K. L. M. Ziegler, J. G. Wiecha, H. Bernhardt
296
shows the animals in the Thalhausen test farm, as they come to lie mainly in the cool areas of the box, such as under the drinking trough or in the foreground on the stone trough. Nevertheless, a warm shadow behind the animal can already be seen on the material here (indicated by the red circle below).
Figure 2 (left), 3 (right) and 4 (below): Thermal Images of the pens Thalhausen (2,3) and
Schwarzenau (4) with red framed warmth shadow, © Chair of Agricultural Systems Engineering, 2018
In Figure 3, the animals got up because of the feeding and the corresponding warmth shadows can be seen on the previous lying areas. Similar images could be observed in the Schwarzenau test farm. Here, too, clear heat shadows can be seen on the heat-dissipating material after the animals stand up (Fig. 4).
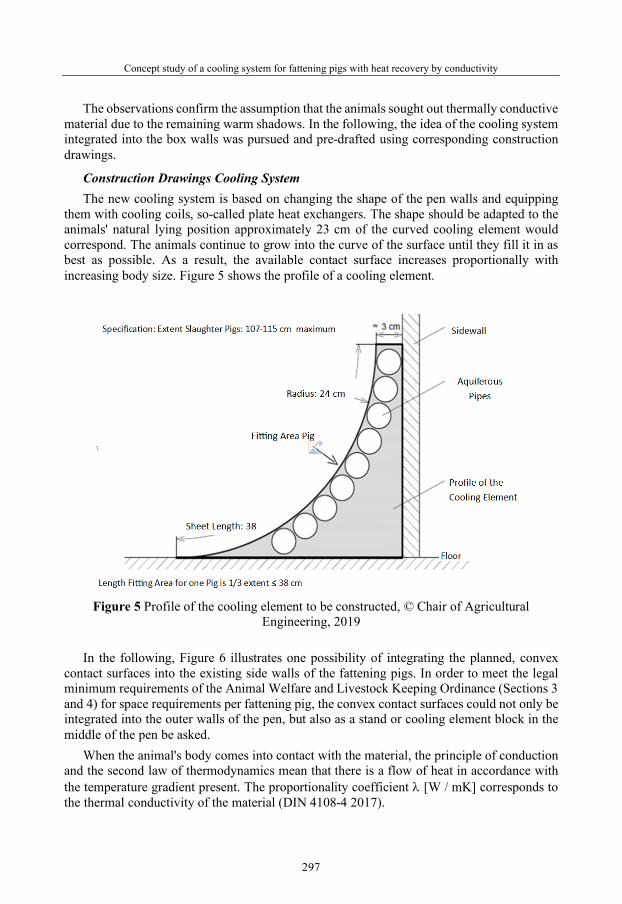
Concept study of a cooling system for fattening pigs with heat recovery by conductivity
297
The observations confirm the assumption that the animals sought out thermally conductive material due to the remaining warm shadows. In the following, the idea of the cooling system integrated into the box walls was pursued and pre-drafted using corresponding construction drawings.
Construction Drawings Cooling System The new cooling system is based on changing the shape of the pen walls and equipping
them with cooling coils, so-called plate heat exchangers. The shape should be adapted to the animals' natural lying position approximately 23 cm of the curved cooling element would correspond. The animals continue to grow into the curve of the surface until they fill it in as best as possible. As a result, the available contact surface increases proportionally with increasing body size. Figure 5 shows the profile of a cooling element.
Figure 5 Profile of the cooling element to be constructed, © Chair of Agricultural
Engineering, 2019 In the following, Figure 6 illustrates one possibility of integrating the planned, convex
contact surfaces into the existing side walls of the fattening pigs. In order to meet the legal minimum requirements of the Animal Welfare and Livestock Keeping Ordinance (Sections 3 and 4) for space requirements per fattening pig, the convex contact surfaces could not only be integrated into the outer walls of the pen, but also as a stand or cooling element block in the middle of the pen be asked.
When the animal's body comes into contact with the material, the principle of conduction and the second law of thermodynamics mean that there is a flow of heat in accordance with the temperature gradient present. The proportionality coefficient λ [W / mK] corresponds to the thermal conductivity of the material (DIN 4108-4 2017).

K. L. M. Ziegler, J. G. Wiecha, H. Bernhardt
298
Figure 6 Position of the cooling element to be constructed on the existing side walls of the
pen, © Chair of Agricultural Systems Engineering, 2019 Therefore, different materials have to be tested for the project, depending on their thermal
conductivity and the acceptance of the animals, as well as their costs for the installation or conversion. The heat flow density can be determined accordingly.
In addition, the materials to be tested must be easy to clean. Food safety is also desirable in the best case. Table 1 lists the materials that come into question due to their hygienic suitability, including their corresponding thermal conductivity.
Table 1 Thermal Conductivity of the eligible materials,, following the work of: Gobrecht
(2009) and Hopmann et al. (2015)
Material λ [W/m K] Stainless Steel 21 Siliciumnitride (SSN) 100 Siliciumaluminiumoxinitride (SIALON) 20 Aluminium (alloy) 75-235 Plastics (Polyurethan, PUR) 0,021-0,035 Plastics (Polytherimid, PEI) 0,24 Polythylenterephthalat (PET) 0,24 Polyvinylchlorid (PVC) 0,17 Carbon (Carbon Fibre) 17 Steel alloy/ non-alloy 15-42 / 48-58

Concept study of a cooling system for fattening pigs with heat recovery by conductivity
299
The amount of heat transported during conduction depends on the thermal conductivities and the temperature differences. The best heat conductors are metals, with λ decreasing with increasing temperature for most metals. Values of λ that are less than 0.1 W / mK (amount of heat / meter * Kelvin) are classed as thermal insulation materials.
CONCLUSIONS
The installation of a cooling system can bring a decisive advantage in terms of regulating their body temperature, especially for fattening pigs kept in pens. Due to the small structural changes and efficient heat transfer with a small footprint and built-up area, the system will be well accepted by the animals.
The additional recovery of heat from the cooling system achieves both optimal use of energy resources and optimization of total costs. This results in the following advantages of the system at a glance:
- Imitation of the natural lying position, therefore high acceptance of the animals; - Efficient heat transfer with a small footprint / installation area; - Optimal use of energy resources through heat recovery and thus; - Optimization of costs by reducing energy consumption and harmful emissions; - Waste heat can be stored and used profitably in other areas (e.g. staff showers). There would also be the additional option of integrating the cooling / heating coils into the
concrete slatted floor in order to make the system even more effective. The system presented serves to lower the body temperature and thus avoids the development of heat stress and is therefore classified as positive for animal welfare.
REFERENCES
Bundesministerium für Ernährung, Landwirtschaft und Verbraucherschutz (BMELV) (2009): Verordnung zum Schutz landwirtschaftlicher Nutztiere und anderer zur Erzeugung tierischer Produkte gehaltener Tiere bei ihrer Haltung (TierSchNutztV) vom 22.08.2006
DIN 4108-4: 2017-03: Wärmeschutz und Energie-Einsparung in Gebäuden – Teil 4: Wärme- und feuchteschutztechnische Bemessungswerte. DOI: https://dx.doi.org/10.31030/2609701
Fialho, F.B.; Bucklin, R.A.; Zazueta, F.S. und Myer, R.O. (2004): Theoretical model of heat balance in pigs. Animal Science 79 (1), S. 121.134, https://doi.org/10.1017/S135772980005459X
Fuquay, J. (1981): Heat stress as it affects animal production. Journal of Animal Science 52 (1), S. 164-174, https://doi.org/10.2527/jas1981.521164x
Gerber, P. J.; Steinfeld, H.; Henderson, B.; Mottet, A.; Opio, C.; Dijkman, J.; Falucci, A. und Tempio, G. (2013): Tackling climate change through livestock – A global assessment of emissions and mitigation opportunities. Food and Agriculture Organization of the United Nations (FAO), Rome. URL: http://www.fao.org/3/i3437e/i3437e00.htm
Gobrecht, J. (2009): Werkstofftechnik – Metalle. Oldenbourger Lehrbücher für Ingenieure. Oldenbourg Verlag
Goodland, R. und Anhang, J. (2009): Livestock and climate change: What if the key actores in the climate change are… cows, pigs and chickens? Woldwatch Institute, Washington, URL: http://www.worldwatch.org/files/pdf/Livestock%20and%20Climate%20Change.pdf
K. L. M. Ziegler, J. G. Wiecha, H. Bernhardt
300
Haeussermann, A.; Hartung, E.; Jungbluth, T., Vranken, E.; Aerts, J.-M. und Berckmans, D. (2007): Cooling effects and evaporation characteristics of fogging systems in an experimental piggery. Biosystems Engineering 97 (3), S. 395-405, https://doi.org/10.1016/j.biosystemseng.2007.03.019
Holle, H. J. (2009): Der Passivhaus-Standard als Zukunftstechnologie des energieoptimierten Bauens–Konsequenzen für die Facharbeit und die berufliche Bildung. In: Berufsarbeit von morgen in gewerblich-technischen Domänen: Forschungsansätze und Ausbildungskonzepte für die berufliche Bildung, Band 2, Hg: Claudia Fenzl, Verlag: W. Bertelsmann Verlag
Hopmann, C.; Michaeli, W.; Greif, H. und Wolters, L. (2015): Technologie der Kunststoffe: Lern- und Arbeitsbuch für die Aus- und Weiterbildung. Carl Hanser Verlag GmbH Co KG.
Huynh, T. T. T.; Aarnink, A. J. A.; Spoolder, H. A. M.; Verstegen, M. W. A. und Kemp, B. (2004): Effects of floor cooling during high ambient temperatures on the lying behavior and productivity of growing finishing pigs. Transactions of the American Society of Agricultural Engineers, Vol. 47 (5), S. 1773-1782, 10.13031/2013.17620
Kelly, C.; Bond, T. und Heitman, H.J. (1954): The role of thermal radiation in animal ecology. Ecology 35 (4), S. 562-569, https://doi.org/10.2307/1931045
Lucas, E.M.; Randall, J.M. und Meneses, J.F. (2000): Potential for evaporative cooling during heat stress periods in pig production in Portugal (Alentejo). Journal of Agricultural Engineering Research 76 (4), S. 363-371, https://doi.org/10.1006/jaer.2000.0550
Medojević, M., Zong, C., Zhang, G., & Medić, N. (2017). The selection and design of the air conditioning system in the facilities for fattening pig production depending on the conditions of thermal comfort: with focus on hot climate. Zbornik Međunarodnog kongresa o KGH, 46(1), 326-335.
Mitkovits, C. et al. (2019): Impacts of global warming on confined livestock systems for growing-fattening pigs: simulation of heat stress for 1981 to 2017 in Central Europe. In: International Journal of Biometeorology 63, p.221–230, https://doi.org/10.1007/s00484-018-01655-0.
Opderbeck, S. et al. (2020): Influence of A Cooled, Solid Lying Area on the Pen Fouling and Lying Behavior of Fattening Pigs. In: Agriculture 10 (307), Online verfügbar unter: www.mdpi.com/journal/agriculture (zuletzt geprüft am 16.10.2020 um 11:30 Uhr), doi:10.3390/agriculture10070307.
Schauberger, G.; Piringer, M. und Petz, E. (2000): Steady-state balance-model to calculate the indoor climate of livestock buildings, demonstrated for finishing pigs. International Journal of Biometeorology 43 (4), S. 154-162, https://doi.org/10.1007/s004840050002
Shi, Z.; Li, B; Zhang, X.; Wang, C.; Zhou, D. und Zhang G. (2006): Using floor cooling as an approach to improve the thermal enivronment in the sleeping area in an open pig house. Biosystems Engineering, 93 (3), S. 359-364, https://doi.org/10.1016/j.biosystemseng.2005.12.012
Thornton, P. K.; van de Steeg, J.; Omer Notenbaert, A. M. und Herrero, M. (2009): The Impacts of climate Change on Livestock and Livestock Systems in Developing countries: A Review of what we know and what we need to know. Agricultural Systems 101 (3), S. 113-127, https://doi.org/10.1016/j.agsy.2009.05.002
Valino, V.; Perdigones, A.; Iglesias, A. und García, J.L. (2010): Effect of temperature increase on cooling systems in livestock farms. Climate Research, 44 (1), S. 107-114, https://doi.org/10.3354/cr00915
Weber, E.F. (2003): Wohlbefinden von Mastschweinen in verschiedenen Haltungssystemen unter besonderer Berücksichtigung ethologischer Merkmale. Dissertation. Universität Hohenheim.
Wegner, K. (2014): Untersuchung zu klimatischen Bedingungen in Sauenställen in Norddeutschland und deren Einfluss auf ausgewählte Fruchtbarkeitsparameter von Sauen. Dissertation. Fachbereich Veterinärmedizin, Universität Gießen.

Concept study of a cooling system for fattening pigs with heat recovery by conductivity
301
Zumbach, B.; Misztal, I.; Tsuruta, S.; Sanchez, J. P., Azain, M.; Herring, W.; Holl, J.; Long, T. und Culbertson, M. (2009): Genetic components of heat stress in finishing pigs: Parameter estimation. Journal of Animal Science 86 (9), S. 2076-2081, https://doi.org/10.2527/jas.2007-0282


48th Symposium "Actual Tasks on Agricultural Engineering", Zagreb, Croatia, 2021
303
THE EFFECT OF OZONE ON CERTAIN YEASTS IN WASTEWATER
Mariana FERDEȘ, Bianca - Ștefania ZĂBAVĂ*, Mirela DINCĂ, Georgiana MOICEANU, Mariana IONESCU
*E-mail of corresponding author: [email protected] Department of Biotechnical Systems, University Politehnica of Bucharest,
Splaiul Independentei no. 313, Sector 6, Romania
SUMMARY
Disinfection is considered to be the primary mechanism for the inactivation/destruction of pathogenic organisms to prevent the spread of waterborne diseases to downstream users and the environment. The effect of ozone on three yeast strains potentially present in wastewater was studied using a OZONFIX 8G generator, with the following characteristics: ozone production 8 g·h-1, power 16 W. The ozone was bubbled into the cell suspensions of Rhodotorula rubra, Candida rugosa and Saccharomyces cerevisiae, between 1 and 60 minutes. The samples collected were analyzed in terms of cell viability and by cultivation in liquid medium on a rotary incubator for 3 days. Absorbance was measured at 600 nm in malt extract cultures and the results were recorded on a growth curve. The microscopic appearance of the yeast cells was assessed by staining with methylene blue to highlight dead and living cells. It was found that bubbled ozone caused a decrease in cell viability depending on the exposure time.
Key words: disinfection, wastewater, ozone, yeast strains
INTRODUCTION
Wastewater reuse has become an attractive option for protecting the environment and extending available water resources (Xu et al., 2002). Disinfection is considered to be the primary mechanism for the inactivation/destruction of pathogenic organisms to prevent the spread of waterborne diseases to downstream users and the environment. It is important that wastewater be adequately treated prior to disinfection in order for any disinfectant to be effective (Rodríguez et al., 2008).
Ozonation is typically efficient, fast, and regarded as a promising disinfection method for water treatment, especially for the inactivation of microorganisms (Ding et al., 2019). Ozone
48. ACTUAL TASKS ON AGRICULTURAL ENGINEERING
Original scientific paper

M. Ferdeș, B. – Ș. Zăbavă, M. Dincă, G. Moiceanu, M. Ionescu
304
is an extremely reactive oxidizing agent characterized by disinfection efficiencies higher than the disinfection with chlorine (Collivignarelli et al., 2018). It has been proved to be one of the most effective disinfectants and is widely used to inactivate pathogens in drinking water, especially in Europe, USA and Canada (Savoye et al., 2001). Ozone is a highly oxidative agent, reacting directly or via a hydroxyl radical mechanism with organic and inorganic compounds. It has been found that ozone may increase the biodegradability of organic pollutants (including natural organic matter) and induce the efficient inactivation of a wide range of microorganisms (Zouboulis et al., 2007). Also, ozone is a powerful oxidant that has been accepted as a food sanitizer, mainly in organic farming because it safely and spontaneously decomposes without forming hazardous residues (De Almeida Monaco et al., 2016).
Ozone (O3) is an unstable gas comprising three atoms of oxygen. It is unstable because the gas will readily degrade back to its stable state, diatomic oxygen (O2) with the formation of free oxygen atoms or free radicals.
Because of its oxidizing properties, ozone is considered one of the fastest and most efficient known microbicides. It can break cell membrane or protoplasm, inhabilitating cellular reactivation of bacteria, coliforms, viruses and protozoa, removing up to 99 % of bacteria and viruses at 10 mg·L-1 in 10 minutes, attacking mainly unsaturated fatty acids, lipid fatty acids, glycoproteins, glycolipids, amino acids and sulfhydryl groups of some enzymes; DNA is nor ozone resistant (Rojas-Valencia et al., 2011). For ozone generation, there are four recognized methods: corona discharge, ultraviolet radiation, electrolysis and radiochemical method. The use of electrical power to generate ozone by corona discharge is the most commercially viable method (Smith, 2020).
Two mechanisms for ozone disinfection occur: a direct oxidation of compounds by the ozone molecule and a reaction involving the radical products of ozone decomposition, principally believed to be the hydroxyl radical. This radical is highly reactive and has a life span only of few microseconds in water. The predominant reaction will depend on wastewater characteristics (Lazarova et al., 2013).
In this research, three different species of yeasts that can enter wastewater from fermentation or biotechnological processes related to the food industry were chosen. S cerevisiae reaches wastewater as a yeast surplus resulting from brewery, bakery and winery most often in water used to wash and clean equipment and facilities (Fillaudeau et al., 2008). Candida rugosa is used in the biotechnological processes of biosynthesis of lipolytic enzymes (Benjamin et al., 2001), and Rhodotorula rubra is used to obtain carotenoid pigments with antioxidant value such as torularhodin, torulene, and β-Carotene (Moline et al., 2012).
The aim of the research was to evaluate the effect of ozone on three yeast strains potentially present in wastewater from the food industry and biotechnological processes.
MATERIALS AND METHODS
The ozone effect was tested on three yeast strains from the collection of the microbiology laboratory of the ISB Faculty, University Politehnica of Bucharest. These strains are represented by: Rhodotorula rubra ICCF 209 (from the collection of the Institute of Chemical and Pharmaceutical Research), Candida rugosa DSM 70761 (isolated from beer) and a strain
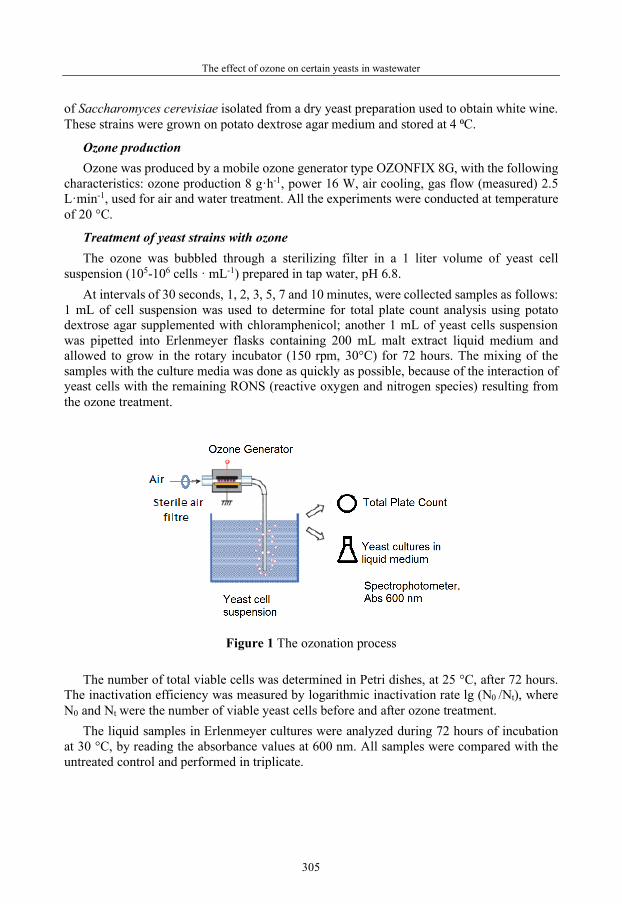
The effect of ozone on certain yeasts in wastewater
305
of Saccharomyces cerevisiae isolated from a dry yeast preparation used to obtain white wine. These strains were grown on potato dextrose agar medium and stored at 4 ⁰C.
Ozone production Ozone was produced by a mobile ozone generator type OZONFIX 8G, with the following
characteristics: ozone production 8 g·h-1, power 16 W, air cooling, gas flow (measured) 2.5 L·min-1, used for air and water treatment. All the experiments were conducted at temperature of 20 °C.
Treatment of yeast strains with ozone The ozone was bubbled through a sterilizing filter in a 1 liter volume of yeast cell
suspension (105-106 cells · mL-1) prepared in tap water, pH 6.8. At intervals of 30 seconds, 1, 2, 3, 5, 7 and 10 minutes, were collected samples as follows:
1 mL of cell suspension was used to determine for total plate count analysis using potato dextrose agar supplemented with chloramphenicol; another 1 mL of yeast cells suspension was pipetted into Erlenmeyer flasks containing 200 mL malt extract liquid medium and allowed to grow in the rotary incubator (150 rpm, 30°C) for 72 hours. The mixing of the samples with the culture media was done as quickly as possible, because of the interaction of yeast cells with the remaining RONS (reactive oxygen and nitrogen species) resulting from the ozone treatment.
Figure 1 The ozonation process
The number of total viable cells was determined in Petri dishes, at 25 °C, after 72 hours.
The inactivation efficiency was measured by logarithmic inactivation rate lg (N0 /Nt), where N0 and Nt were the number of viable yeast cells before and after ozone treatment.
The liquid samples in Erlenmeyer cultures were analyzed during 72 hours of incubation at 30 °C, by reading the absorbance values at 600 nm. All samples were compared with the untreated control and performed in triplicate.
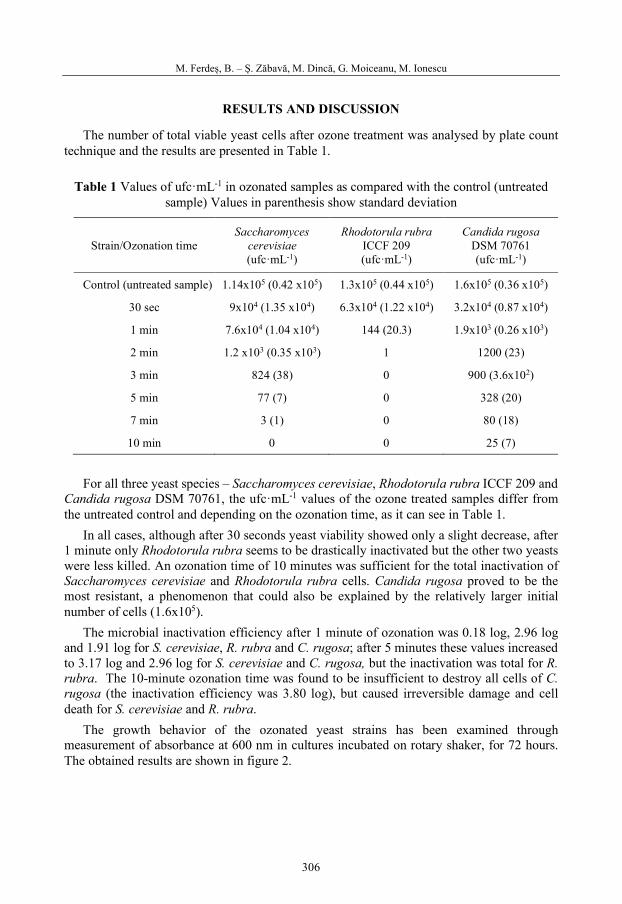
M. Ferdeș, B. – Ș. Zăbavă, M. Dincă, G. Moiceanu, M. Ionescu
306
RESULTS AND DISCUSSION
The number of total viable yeast cells after ozone treatment was analysed by plate count technique and the results are presented in Table 1.
Table 1 Values of ufc·mL-1 in ozonated samples as compared with the control (untreated sample) Values in parenthesis show standard deviation
Strain/Ozonation time Saccharomyces
cerevisiae (ufc·mL-1)
Rhodotorula rubra ICCF 209 (ufc·mL-1)
Candida rugosa DSM 70761 (ufc·mL-1)
Control (untreated sample) 1.14x10⁵ (0.42 x10⁵) 1.3x10⁵ (0.44 x10⁵) 1.6x10⁵ (0.36 x10⁵)
30 sec 9x10⁴ (1.35 x10⁴) 6.3x10⁴ (1.22 x10⁴) 3.2x10⁴ (0.87 x10⁴)
1 min 7.6x10⁴ (1.04 x10⁴) 144 (20.3) 1.9x10³ (0.26 x10³)
2 min 1.2 x10³ (0.35 x10³) 1 1200 (23)
3 min 824 (38) 0 900 (3.6x10²)
5 min 77 (7) 0 328 (20)
7 min 3 (1) 0 80 (18)
10 min 0 0 25 (7)
For all three yeast species – Saccharomyces cerevisiae, Rhodotorula rubra ICCF 209 and
Candida rugosa DSM 70761, the ufc·mL-1 values of the ozone treated samples differ from the untreated control and depending on the ozonation time, as it can see in Table 1.
In all cases, although after 30 seconds yeast viability showed only a slight decrease, after 1 minute only Rhodotorula rubra seems to be drastically inactivated but the other two yeasts were less killed. An ozonation time of 10 minutes was sufficient for the total inactivation of Saccharomyces cerevisiae and Rhodotorula rubra cells. Candida rugosa proved to be the most resistant, a phenomenon that could also be explained by the relatively larger initial number of cells (1.6x10⁵).
The microbial inactivation efficiency after 1 minute of ozonation was 0.18 log, 2.96 log and 1.91 log for S. cerevisiae, R. rubra and C. rugosa; after 5 minutes these values increased to 3.17 log and 2.96 log for S. cerevisiae and C. rugosa, but the inactivation was total for R. rubra. The 10-minute ozonation time was found to be insufficient to destroy all cells of C. rugosa (the inactivation efficiency was 3.80 log), but caused irreversible damage and cell death for S. cerevisiae and R. rubra.
The growth behavior of the ozonated yeast strains has been examined through measurement of absorbance at 600 nm in cultures incubated on rotary shaker, for 72 hours. The obtained results are shown in figure 2.

The effect of ozone on certain yeasts in wastewater
307
Figure 2 Growth curves for ozonated yeast samples compared with the untreated control
a) Saccharomyces cerevisiae; b) Rhodotorula rubra; c) Candida rugosa

M. Ferdeș, B. – Ș. Zăbavă, M. Dincă, G. Moiceanu, M. Ionescu
308
As expected, the appearance of growth curves was consistent with the results obtained by total count plates for all three yeast species. As shown in the figure, the culture obtained by using untreated yeast cells had the fastest increase, the absorbance values at 600 nm being increasing from the first 20 hours.
The characteristic appearance of growth curves for the three yeast strains showed a lag phase of 16-20 hours for the control and cell cultures treated 30 seconds and 1 minute.
For longer ozonation time, the cultures had delayed lag phases, depending on the exposure time. In figure 1 c), in culture of C. rugosa, after 7 and 10 minutes of ozonation, the exponential growth phase started after 40 hours. This can be explained both by the lower number of survivors in ozonated samples and also by the cellular lesions that occur and are repaired in a longer time.
For an ozonation time of more than 5-10 minutes, depending on the yeast species, the cell damage was too great and could not be repaired.
From the obtained data it results that the absorbance values were dependent of the ozonation time, and the lag phase was as long as the duration of treatment was greater.
a) b)
Figure 3 The microscopic appearance of the cells of Rhodotorula rubra a) before ozonation and b) after 10 minutes of ozonation
Alterations at the cellular level were also highlighted on microscopic preparations,
especially for the species Rhodotorula rubra, by staining with methylene blue. After 10 minutes of ozone treatment, unlike the control culture, clusters of dark blue colored cells were observed, suggesting inactivation of oxido-reductases and cell death, as seen in Figure 3.
Studies on the effect of ozone on yeasts are quite few and refer mainly to pathogenic yeasts. Ozone has been shown to be highly effective in killing Candida albicans in yeast form and inhibition of germ tube formation during 210 s and 180 s, respectively (Zargaran et al., 2017).
Several investigations illustrate the effect of ozone on food-related microorganisms. Yeasts seem to be more sensitive to ozone than molds, but more resistant than bacteria (Brodowska, 2018; Varga, 2016). Restaino et al. (1995) demonstrated that counts of Candida albicans and Zygosaccharomyces bailii were reduced by more than 4.5 log units in ozonated water.

The effect of ozone on certain yeasts in wastewater
309
Watanabe et al. demonstrated that an ozone concentration of 0.1 ppm in mineral water determined the inactivation of S. cerevisiae in 1.75 minutes, and at a concentration of 0.6 ppm, the inactivation time was 0.32 minutes (Watanabe et al., 2010).
CONCLUSIONS
The ozonation of contaminated water has considerable antimicrobial effect due to the strong oxidizing properties of oxidative reactive species formed by corona discharge.
CFU·mL-1 analysis of suspensions containing ozone-treated yeast cells showed that the most sensitive species was Rhodotorula rubra, which was completely inactivated after 3 minutes of treatment. The Saccharomycea cerevisiae strain had an inactivation time of 10 minutes, while the Candida rugosa species was the most resistant, with viable cells and after a time of 10 minutes.
In the rotary incubator cultures, the growth curves showed different absorbance values, depending on the yeast species and the ozone treatment time. For an ozonation time of more than 5-10 minutes, in the case of Rhodotorul rubra and Saccharomyces cerevisiae, the cell damage was too great and could not be repaired.
From the obtained data it results that the absorbance values were dependent of the ozonation time, and the lag phase was as long as the duration of treatment was greater.
REFERENCES
Benjamin, S., Pandey, A. (2001). Isolation and Characterization of Three Distinct Forms of Lipases from Candida rugosa Produced in Solid State Fermentation. Braz. arch. biol. technol. 44, 2, 213-221
Brodowska, A.J., Nowak, A., Śmigielski, K. (2018). Ozone in the food industry: Principles of ozone treatment, mechanisms of action, and applications: An overview, Critical Reviews in Food Science and Nutrition, 58:13, 2176-2201, doi: 10.1080/10408398.2017.1308313
Collivignarelli, M.C., Abbà, A., Benigna, I., Sorlini, S., Torretta, V. (2018). Overview of the Main Disinfection Processes for Wastewater and Drinking Water Treatment Plants.Sustainability 10, 86; doi:10.3390/su10010086.
De Almeida Monaco, K., Costa, S.M., Minatel, I.O., Correa, C.R., Calero, F.A., Vianello, F. (2016). Lima Influence of ozonated water sanitation on postharvest quality of conventionally and organically cultivated mangoes after postharvest storage. Postharvest Biology and Technology, vol. 120, pp. 69–75.
Ding, W., Jin, W., Cao, S., Zhou, X., Wang, C., Jiang, Q., Huang, H., Tu, R., Han, S.F., Wang, Q. (2019). Ozone disinfection of chlorine-resistant bacteria in drinking water, Water Research, Volume 160, 339-349.
Fillaudeau, L., Bories, A., Decloux, M. (2008). Brewing, winemaking and distilling: an overview of wastewater treatment and utilization schemes (Part IV - Chapter 35). Improving Water and Energy Management in Food Industry, Woodhead Publishing Limited.
Lazarova, V., Liechti, P.A., Savoye, P., Hausler, R. (2013). Ozone disinfection: main parameters for process design in wastewater treatment and reuse, Journal of Water Reuse and Desalination, DOI: 10.2166/wrd.2013.007.
Moline, M., Libkind, D., van Brook, M. (2012). Production of Torularhodin, Torulene, and β-Carotene by Rhodotorula Yeasts. Methods in molecular biology. 898:275-83 doi:10.1007/978-1-61779-918-1_19

M. Ferdeș, B. – Ș. Zăbavă, M. Dincă, G. Moiceanu, M. Ionescu
310
Restaino, L., Frampton, E.W., Hemphill, J.B., Palnikar P. (1995). Efficacy of ozonated water against various food-related microorganisms. Appl. Environ. Microbiol. 61(9):3471–3475.
Rodríguez, A., Rosal, R., Perdigón-Melón, J.A., Mezcua, M., Agüera, A., Hernando, M.D., Letón, P., Fernández-Alba, A.R., García-Calvo, E. (2008). Ozone-Based Technologies in Water and Wastewater Treatment, Hdb Env Chem Vol. 5 DOI 10.1007/698_5_103.
Rojas-Valencia, M.N. (2011). Research on ozone application as disinfectant and action mechanisms on wastewater microorganisms, Science against microbial pathogens: communicating current research and technological advancesA. Méndez-Vilas (Ed.).
Savoye, P., Janex, M.L., Lazarova, V. (2001) Wastewater disinfection by low-pressure UV and ozone: a design approach based on water quality, Wat. Sci. Tech., 43(10) 163-171.
Smith, W. (2020). Principles of ozone generation. Watertec Engineering Pty Ltd, Australia. Available: http://watertecengineering.com/TZ000002%20Principles%20of%20Ozone%20Generation.pdf.
Varga L., Szigeti J. (2016). Use of ozone in the dairy industry: A review. Internat. Journal of Dairy Technology, 69, 2, 157-168, doi.org/10.1111/1471-0307.12302
Watanabe, M., Masaki, H., Mori, T., Tsuchiya, T., Konuma, H., Hara-Kudo, Y., Takatori, K. (2010). Inactivation Effects of UV Irradiation and Ozone Treatment on the Yeast and the Mold in Mineral Water, Journal of Food Protection, 73, 8, 1537–1542
Xu, P., Janex, M.L., Savoye, P., Cockx, A., Lazarova, V. (2002). Wastewater Disinfection by Ozone: Main parameters for Process Design. Water Res., 36(4), 1043-1055.
Zouboulis, A., Samaras, P., Ntampou, X., Petala, M. (2007). Potential Ozone Applications forWater/Wastewater Treatment', Separation Science and Technology, 42: 7, 1433 — 1446.
Zargaran, M., Fatahinia, M., Zarei Mahmoudabadi, A. (2017). The efficacy of gaseous ozone against different forms of Candida albicans, Curr Med Mycol. 3(2): 26–32, doi: 10.29252/cmm.3.2.26

48th Symposium "Actual Tasks on Agricultural Engineering", Zagreb, Croatia, 2021
311
TECHNICAL PERFORMANCES OF A PORTABLE UV-C DEVICE USED FOR THE DECONTAMINATION OF
VARIOUS WORKING SPACES Cristian SORICĂ1*, Valentin VLĂDUŢ1, Ion GRIGORE1, Mario CRISTEA1,
Elena SORICĂ1, Ion PIRNĂ2, Dragoș PREDA3, Bogdan DURAN3 *E-mail of corresponding author: [email protected]
1 Testing Department, INMA Bucharest, B-dul Ion Ionescu de la Brad, No. 6, 1st District, Bucharest, Romania
2 Section of Agriculture Mechanization, The Academy of Agricultural and Forestry Sciences „Gheorghe Ionescu-Șișești”, B-dul. Mărăști, No. 61, 1st District, Bucharest, Romania
3 Rolix Impex Series SRL, B-dul Basarabia, No. 256, Gate 2, 3rd District, Bucharest, Romania
SUMMARY
The spaces where various activities take place (production, storage, transport, sales etc.), as well as the equipment and installations operating within these spaces, must be periodically cleaned, and where appropriate, sanitized. On the surfaces and inside these working spaces there may be a series of microorganisms such as bacteria, yeasts, molds and viruses that can adversely affect the activities carried out in those spaces, with direct implications on the health of the staff serving them, on the quality of the products obtained and finally on the health of the human consumer. The research undertaken and presented within this paper, focuses on the evaluation of the technical performances of a portable UV-C device for the decontamination of various working spaces, as a complementary measure to the cleaning and sanitizing of these spaces, in order to reduce the risk of contamination. There were made determinations of radiation intensity at different distances and positions from the radiation source, depending on the geometry of the equipment and the arrangement of UV-C generators inside the equipment. Considering the results obtained experimentally, it can be considered that within a radius of 2 m around the equipment, the device can ensure a radiation dose which assures a 99 % reduction rate (2-log), qualifying it for use in various working spaces, decontaminating surfaces and nearby air, as a complementary measure to the cleaning and sanitizing of these spaces.
Keywords: working spaces, storage facility, UV-C decontamination.
48. ACTUAL TASKS ON AGRICULTURAL ENGINEERING
Preliminary communication
C. Sorică, V. Vlăduţ, I. Grigore, M. Cristea, E. Sorică, I. Pirnă, D. Preda, B. Duran
312
INTRODUCTION
The spaces where various activities take place (production, storage - floors, walls, ceilings, doors, windows, vents, lighting systems etc.), as well as the equipment and installations operating within these spaces, must be periodically cleaned, and where appropriate, sanitized.
Cleaning and sanitation are important operations in food processing because of the significant contributions to product hygiene and food safety. The transfer of residues from surfaces into a product and the contamination with adhering microorganisms must therefore be avoided with sufficient certainty (Otto et. al., 2011).
Cleaning and sanitation must perform removal of all visible deposits from surfaces (from a physical point of view), eliminating traces of chemical substances from washing or disinfection solutions (from a chemical point of view) and minimizing the existing microflora (from a microbiological point of view).
The use of water and physical and mechanical means are not sufficient to remove all deposits and residues that adhere to the surface. To increase the effectiveness of these means, chemical washing agents or detergents are used in order to weaken the forces of attraction between the dirt and the surface to which it adheres.
In order to be accepted for use in the food industry a chemical washing agent must meet the following characteristics: to be non-toxic and safe to use; to be easily and completely soluble; to be free of corrosive action on the surfaces on which it is used; not to precipitate calcium and magnesium salts in water; to have penetrating and wetting power; to be able to saponify and emulsify fats and dissolve organic or inorganic solid particles; to be easily removed by rinsing and keep dirt particles in suspension and not to have strong and persistent odors to transmit to food.
As cleaning and washing does not completely remove the microbial load from the surfaces, the washed surfaces must be disinfected. Disinfection is the action that aims to decontaminate the environment of pathogenic and potentially pathogenic germs.
Disinfection can be achieved by physical and chemical means. Within the food industry, commonly used chemical disinfectants are almost entirely part of two categories of substances, namely halogens and cationic surfactants. Among the halogens, chlorine and its compounds are the most commonly used disinfectants, and among the surfactants with germicidal properties used in the food industry we mention the cationic surfactants, which are quaternary ammonium salts and ampholytic surfactants.
Within the cleaning and sanitation activity, as a complementary measure to the disinfection of these spaces by physical and chemical means, in order to reduce the risk of contamination, further disinfection can be applied using non-ionizing ultraviolet radiation UV-C. Non-ionizing ultraviolet radiation UV-C is used as an alternative to chemical sterilization and microbial reduction in food products and has been approved for use as a disinfectant for surface treatment of food.
It is already used successfully in various fields such as packaging industry (decontamination of packaging for various food products), postharvest technologies (Peng et al., 2017, Boas et al., 2017) including cold storage illumination (Promyou and Supapvanich, 2016), ecology (wastewater treatment) (Aguilar et al., 2017), medicine (decontamination of

Technical performances of a portable UV-C device used for the decontamination of various working spaces
313
air and medical equipment) (Warren et al., 2020, Cadnum et al., 2019, Boyce and Donskey, 2019) etc.
The wavelength range that varies between 200 and 280 nm, which is considered lethal to most types of microorganisms, affects the DNA replication of these microorganisms (Bintsis et al., 2000; Char et al., 2010). Non-Ionizing UV radiation can cause breaks of molecular chemical bonds and can induce photochemical reactions. The DNA damage by irradiation to undesirable microorganisms, leads to their inactivation. The biological effects of UV radiation depend on the wavelength and the exposure time (Yousra et al., 2013).
In the spectrum of electromagnetic radiation, the ultraviolet radiation is between X-rays and visible radiation with wavelengths between 40 and 400 nm, and the energy varies from 3 to 30 eV. UV spectrum comprises five distinct regions: extreme-UV (40…190 nm), far-UV (190…220 nm), UV-C (220…290 nm), UV-B (290…320 nm) and UV-A (320…400 nm). The UV radiations from the extreme-UV, far-UV and UV-C are almost nonexistent in nature, because they are completely absorbed in the atmosphere. Artificial sources of UV light are produced by the lamps of low pressure or high / medium pressure. Low pressure lamps produce, essentially, monochromatic light at a wavelength of 253.7 nm, very close to the peak of germicidal efficiency, respectively 264 nm. These lamps are available as ozone generating lamps and ozone free lamps. Medium pressure lamps produce a polychromatic light on a broader spectrum. Ultraviolet-C (UV-C) radiation is effective in killing a wide range of viral and bacterial pathogens. However, high-intensity UV-C devices commonly used for room disinfection cannot be used when people are present (Shaikh et al. 2016).
Worldwide there are companies producing UV-C devices that could be used to disinfect surfaces and air in various spaces. Among them can be mentioned: Lumalier Corporation (USA), DDK Scientific Corporation (USA), Trojan UV (Canada), UV technology (UK), LIT Ultraviolet Technology (Russia), GLA (Netherlands), MIDAS Electronics (Romania), Biocomp (Romania), Rolix Impex Series SRL (Romania) etc.
In Romania, there is only one manufacturer of non-ionizing UV-C radiation generators, namely BIOCOMP S.R.L. and a number of distributors of external manufacturers of such decontamination devices.
The research undertaken and presented within this paper, focuses on the evaluation of the technical performances of a portable UV-C device (produced by a local company named Rolix Impex Series SRL) for the decontamination of various working spaces, as a complementary measure to the cleaning and sanitizing of these spaces, in order to reduce the risk of contamination.
MATERIALS AND METHODS
Considering the nature of the light radiation source (UV-C fluorescent tube), respectively the shape assimilated to a linear source of diffuse light radiation, uniformly emitted, within the specialized literature (Keitz, 1971) is presented a mathematical model that estimates the Radiation Intensity E, emitted by a linear source AB, at a point P having well determined coordinates with respect to the source, as follows:
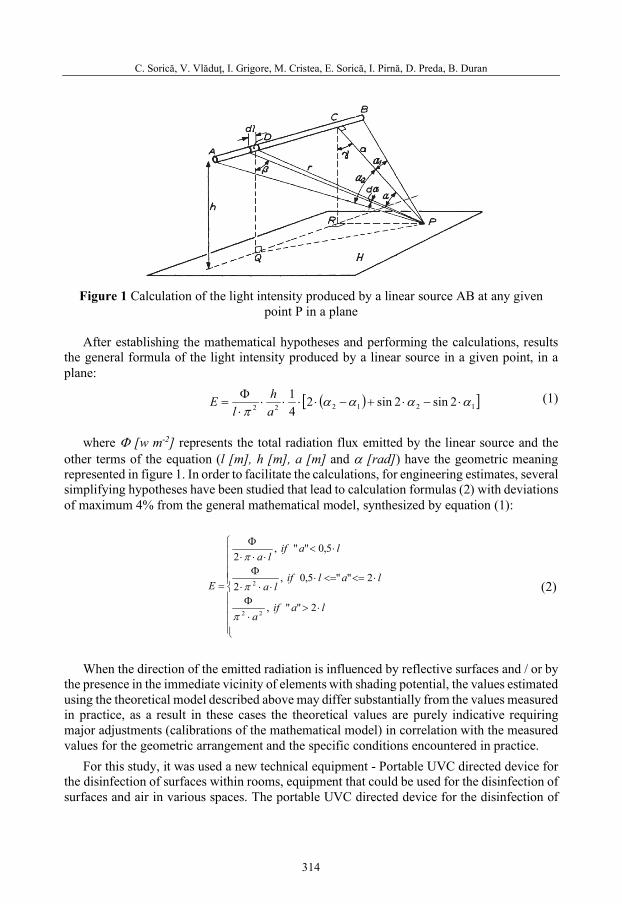
C. Sorică, V. Vlăduţ, I. Grigore, M. Cristea, E. Sorică, I. Pirnă, D. Preda, B. Duran
314
Figure 1 Calculation of the light intensity produced by a linear source AB at any given
point P in a plane
After establishing the mathematical hypotheses and performing the calculations, results the general formula of the light intensity produced by a linear source in a given point, in a plane:
( )[ ]121222 2sin2sin241 αααα
π⋅−⋅+−⋅⋅⋅⋅
⋅Φ
=ah
lE (1)
where Φ [w m-2] represents the total radiation flux emitted by the linear source and the
other terms of the equation (l [m], h [m], a [m] and α [rad]) have the geometric meaning represented in figure 1. In order to facilitate the calculations, for engineering estimates, several simplifying hypotheses have been studied that lead to calculation formulas (2) with deviations of maximum 4% from the general mathematical model, synthesized by equation (1):
⋅>⋅Φ
⋅<=<=⋅⋅⋅⋅
Φ
⋅<⋅⋅⋅
Φ
=
laifa
lalifla
laifla
E
2"",
2""5,0,2
5,0"",2
22
2
π
π
π
(2)
When the direction of the emitted radiation is influenced by reflective surfaces and / or by
the presence in the immediate vicinity of elements with shading potential, the values estimated using the theoretical model described above may differ substantially from the values measured in practice, as a result in these cases the theoretical values are purely indicative requiring major adjustments (calibrations of the mathematical model) in correlation with the measured values for the geometric arrangement and the specific conditions encountered in practice.
For this study, it was used a new technical equipment - Portable UVC directed device for the disinfection of surfaces within rooms, equipment that could be used for the disinfection of surfaces and air in various spaces. The portable UVC directed device for the disinfection of

Technical performances of a portable UV-C device used for the decontamination of various working spaces
315
surfaces within rooms, is a mobile device with an increased flow of UV-C radiation, used especially for the decontamination of surfaces and air near the equipment.
The portable UVC directed device for disinfecting the surfaces within rooms (fig. 2) has the following main subassemblies:
- Body mounted on 4 wheels with locking system; - UV-C lamps (253.7 nm) and related electronic equipment; - Fans.
Figure 2 The portable UVC directed device for disinfecting the surfaces within rooms (3D
model – left side; physical model – right side) (www.stand.ro; Sorica, 2020) The main technical characteristics of the disinfection device are: - Dimensions (LxWxH): 500x500x1545 mm; - UV Generator type: discharge lamps at low pressure
mercury vapor; - The wavelength of the emitted radiation: 253.7 nm (UV-C); - Power of an UV-C lamp: 75 W; - UV-C radiation flux of a lamp: 25.5 W; - Active length of an UV-C lamp: 1165 mm; - Number of UV-C lamps: 8 pcs; - Fan type: axial; - Fan flow: 47 mc h-1; - Mass: 29.8 kg. The experimentation was aimed to determine the qualitative working indices of the
decontamination installation. For this purpose, there were taken into account the following activities:
- determining the intensity of UV-C ultraviolet radiation; - determination of the UV-C radiation dose. In order to determine the intensity of non-ionizing ultraviolet radiation UV-C, there were
performed measurements using a set of tools, sglux brand, Germany, comprising of the
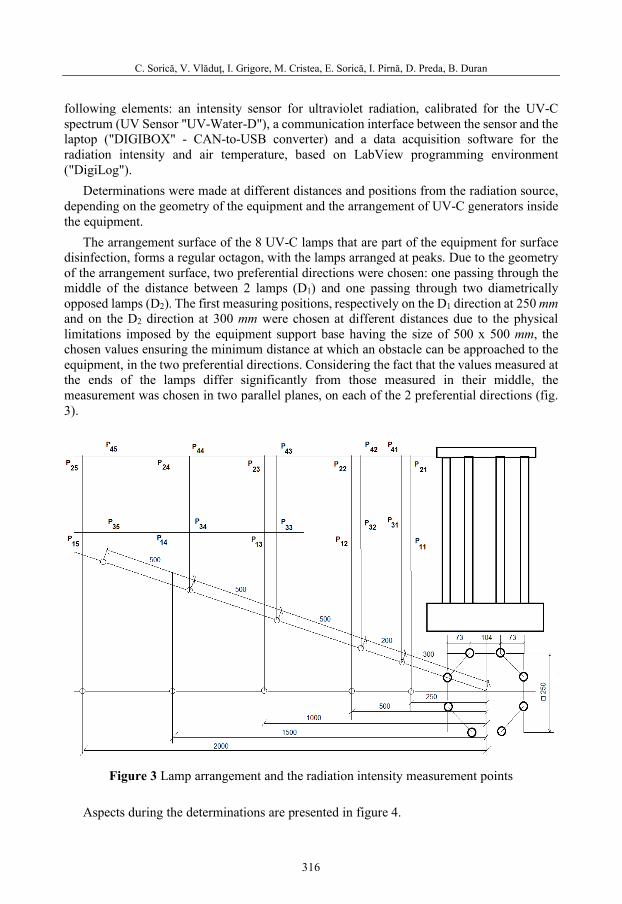
C. Sorică, V. Vlăduţ, I. Grigore, M. Cristea, E. Sorică, I. Pirnă, D. Preda, B. Duran
316
following elements: an intensity sensor for ultraviolet radiation, calibrated for the UV-C spectrum (UV Sensor "UV-Water-D"), a communication interface between the sensor and the laptop ("DIGIBOX" - CAN-to-USB converter) and a data acquisition software for the radiation intensity and air temperature, based on LabView programming environment ("DigiLog").
Determinations were made at different distances and positions from the radiation source, depending on the geometry of the equipment and the arrangement of UV-C generators inside the equipment.
The arrangement surface of the 8 UV-C lamps that are part of the equipment for surface disinfection, forms a regular octagon, with the lamps arranged at peaks. Due to the geometry of the arrangement surface, two preferential directions were chosen: one passing through the middle of the distance between 2 lamps (D1) and one passing through two diametrically opposed lamps (D2). The first measuring positions, respectively on the D1 direction at 250 mm and on the D2 direction at 300 mm were chosen at different distances due to the physical limitations imposed by the equipment support base having the size of 500 x 500 mm, the chosen values ensuring the minimum distance at which an obstacle can be approached to the equipment, in the two preferential directions. Considering the fact that the values measured at the ends of the lamps differ significantly from those measured in their middle, the measurement was chosen in two parallel planes, on each of the 2 preferential directions (fig. 3).
Figure 3 Lamp arrangement and the radiation intensity measurement points
Aspects during the determinations are presented in figure 4.

Technical performances of a portable UV-C device used for the decontamination of various working spaces
317
Figure 4 Determination of the intensity of UV-C radiation performed for the device for
disinfecting surfaces within rooms The aim was to highlight the influence of the geometric position of the
UV-C generators and the distance to the radiation source on the intensity of emitted UV-C radiation. Also, there were calculated the UV-C radiation doses, according to the measured radiation intensity and its duration of application, using the equation:
tED ⋅= , [mW s cm-2] (3)
where E is the radiation intensity [W m-2] and t – exposure time [s].
RESULTS AND DISCUSSION
After carrying out experimental researches on the disinfection device, there were achieved a series of results regarding its qualitative indices. These results are presented in Table 1.
Table 1 Intensity of UV-C radiation and dose applied for 1 s measured at different positions
Crt. No.
Cha
ract
eris
tic
U.M
.
Posi
tion
rela
tive
to
UV
-C ra
diat
ion
sour
ces Measuring positions in the two parallel planes
The value of the parameters determined in the tests
1.
Inte
nsity
/ D
ose
W m
-2 /
mW
s cm
-2
D1
P11 P12
P13 P14
P15
47.31/4.73 28.45/2.85 9.29/0.93 4.47/0.45 2.56/0.26
P21 P22
P23 P24
P25
20.16/2.02 13.76/1.38 5.69/0.57 3.23/0.32 1.99/0.20
D2
P31 P32
P33 P34
P35
42.72/4.27 24.09/2.41 9.65/0.97 4.59/0.46 2.76/0.28
P41 P42
P43 P44
P45
20.70/2.07 12.79/1.28 5.97/0.60 3.24/0.32 2.12/0.21

C. Sorică, V. Vlăduţ, I. Grigore, M. Cristea, E. Sorică, I. Pirnă, D. Preda, B. Duran
318
At short distances from a source / multiple sources of light radiation in the vicinity, due to the narrowing the view angle of the UV-C sensor, whose sensitivity decreases below 80 % for opening angles above 60 °, it is possible that the measured values of the radiation intensity be slightly lower than in reality due to the fact that not all the radiation flux emitted by the sources was captured through the "window" of the sensor. Thus, the values determined practically by measurement, using the available UV-C sensor, are minimum and certain values, in reality the intensity of the radiation emitted by the source having values at least equal to those measured in the respective points.
Figure 5 shows the variation of the radiation intensity with distance from the axis of symmetry of the device, which coincides with the center of the octagon in whose peaks the lamps are positioned.
Figure 5 Variation of UV-C radiation intensity with the distance
In both direction D1 and direction D2 there are major differences between the intensity of
radiation at the ends of the lamp and that measured in the middle of it, differences which vary between 57 % and 22 % for direction 1 and between 52 % and 23 % for direction 2, decreasing on as the distance from the radiation source increases.
Starting with a distance of 100 cm from the radiation source (vertical axis of symmetry of the device), the differences in intensity between the two preferential directions become negligible, although there are still differences in intensity, with a tendency to decrease, between the ends and the middle of a lamp.
Considering the fact that in the specialized literature (scientific articles, studies, etc.) most germs require a dose for count reduction by 99 % (2-Log), between 0.7 ... 330 mW s cm-2, and those requiring doses above 100 mW s cm-2 have a very small weight in relation to the number

Technical performances of a portable UV-C device used for the decontamination of various working spaces
319
of those requiring doses below 100 mW s cm-2, it was considered that a dose of 100 mW s cm-
2 is representative to evaluate the decontamination capability of the equipment under test. As a result, in order to reach the proposed dose, respectively 100 mW s cm-2, the most unfavorable position of those analyzed was taken into account, having a minimum intensity of UV-C radiation and the maximum exposure time was calculated. The results obtained from the determinations are also presented in table 1.
CONCLUSIONS
Analyzing the values in the table, it is found that the equipment is able to apply at a distance between 2 m and 0.25 m, a dose between 0.20...4.73 mW s cm-2, depending on the height and distance from UV-C radiation sources. For the most unfavorable position of those analyzed, respectively at the ends of UV-C radiation sources, in the D1 direction at a distance of 2 m from the axis of symmetry of the equipment, the maximum exposure time to reach the dose of 100 mW s cm-2 is 500 s. In this context, the equipment could decontaminate a volume of 14.6 m3 with a ground footprint of 12.5 m2, arranged in a circle around the equipment, every 8.3 minutes.
Considering the results obtained experimentally, it can be considered that within a radius of 2 m around the equipment, it can provide a radiation dose at least equal to the dose determined in the most unfavorable position analyzed, qualifying it for use in various fields for the purpose of decontamination of surfaces and air in the immediate vicinity.
REFERENCES
Aguilar S., Rosado D., Moreno-Andrés J., Cartuche L., Cruz D., Acevedo A. and Nebot-Sanz E. (2017). Inactivation of a wild isolated Klebsiella pneumoniae by photo-chemical processes: UV-C, UV-C/H2O2 and UV-C/H2O2/Fe3+, Catalysis Today. 10.1016/j.cattod.2017.10.043.
Bintsis T., Litopoulou-Tzanetaki E. and Robinson R. (2000). Existing and potential applications of ultraviolet light in the food industry – a critical review. J. Sci. Food Agric. 80: 637–645.
Boas A., Nassur R., Freire J., Neto A. and Lima L. (2017). Quality characteristics and antioxidant activity of juices produced with irradiated grapes, Revista Brasileira de Fruticultura. 39. 10.1590/0100-29452017188.
Boyce J. and Donskey C. (2019). Understanding ultraviolet light surface decontamination in hospital rooms: A primer, Infection Control & Hospital Epidemiology. 40. 1-6. 10.1017/ice.2019.161.
Cadnum J., Jencson A., Gestrich S., Livingston S., Karaman B., Benner K., Wilson B. and Donskey C. (2019). A comparison of the efficacy of multiple ultraviolet light room decontamination devices in a radiology procedure room, Infection Control & Hospital Epidemiology. 40. 158-163. 10.1017/ice.2018.296.
Char C., Mitilinaki E., Guerrero S. and Alzamora S.M. (2010). Use of high intensity ultrasound and UV-C light to inactivate some microorganisms in fruit juices, Food Bioprocess Technol. 3: 797–803.
Keitz H.A.E. (1971). Light Calculations and Measurements. Philips Technical Library. Palgrave, London, print ISBN 978-1-349-00014-2, e-ISBN 978-1-349-00012-8, DOI https://doi.org/10.1007/978-1-349-00012-8_8
Otto C., Zahn S., Rost F., Zahn P., Jaros D. and Rohm H. (2011). Physical methods for cleaning and disinfection of surfaces, Food Engineering Reviews, Volume 3, Issue 3-4, pp. 171-188, DOI 10.1007/s12393-011-9038-4.
C. Sorică, V. Vlăduţ, I. Grigore, M. Cristea, E. Sorică, I. Pirnă, D. Preda, B. Duran
320
Peng J, Huanyu W., Yu Z., Yuping H., Li W. and Yonghua Z. (2017). UV-C enhances resistance against gray mold decay caused by Botrytis cinerea in strawberry fruit, Scientia Horticulturae. 225. 106-111. 10.1016/j.scienta.2017.06.062.
Promyou S. and Supapvanich S. (2016). Physicochemical changes in 'Kaew Kamin' mango fruit illuminated with UltraViolet-C (UV-C) during storage, Lournal of Agricultural Science and Technology, Volume 18, Issue 1, pp. 145-154.
Shaikh A., Ely D, Cadnum J., Koganti S., Alhmidi H., Sankar T., Jencson A., Kundrapu S., Donskey C. (2016). Evaluation of a low-intensity ultraviolet-C radiation device for decontamination of computer keyboards, American Journal of Infection Control, Volume 44, Issue 6, pp. 705-707. (https://doi.org/10.1016/j.ajic.2015.11.025)
Sorică C. (2020). Scientific research report - Experimental researches to determine the technical-functional performances of UV-C decontamination equipment, private experimental research contract performed for Rolix Impex Series SRL.
Warren B., Masker J., Brown G., Gamez I., Smith B., Anderson D. and Turner N. (2020). Efficacy of UV-C disinfection in hyperbaric chambers, Infection Control & Hospital Epidemiology. 1-4. 10.1017/ice.2020.248.
Yousra T., Ines M., Hanene C., Abdennaceur H. and Imene O. H. (2013). African Journal of Microbiology Research Effect of biological treatment and ultraviolet (UV)-C radiation disinfection process on wastewater bacterial community as assessed by denaturing gradient gel electrophoresis (DGGE) fingerprints, African Journal of Microbiology Research. 7. 4927-4933. 10.5897/AJMR2013.5675.

48th Symposium "Actual Tasks on Agricultural Engineering", Zagreb, Croatia, 2021
321
CORN STOVER MANAGEMENT ON FAMILY FARM Željko JUKIĆ1*, Igor KOVAČEV2, Nikola BILANDŽIJA2, Zlatko KORONC2,
Ivan SMILJANOVIĆ3 *E-mail of the corresponding author: [email protected]
1 Department of Field Crops, Forage and Grassland, University of Zagreb, Faculty of Agriculture, Svetošimunska cesta 25, 10000 Zagreb, Croatia
2 Department of Agricultural Engineering, University of Zagreb, Faculty of Agriculture, Svetošimunska cesta 25, 10000 Zagreb, Croatia
3 Graduated student, University of Zagreb, Faculty of Agriculture
ABSTRACT
Corn stover represents an important source of organic matter and has an important influence on the biological, chemical, and physical properties of the soil. Also, corn stover is a highly acceptable energy source from the standpoint of environmental impact. The aim of this paper is to determine the possibilities of collecting corn stover from a certain area at different plant population densities of corn hybrid with machinery used on the family farm for collecting aboveground mass in the field. The collection was performed with a round baler in three different strategies: (I) baling, (II) collecting in windrows + baling, and (III) mulching + collection in windrows + baling. Corn stover yield was in the range of 12,389 to 13,118 kg ha-1
Collection efficiency was from 49 to 78% depending on collection strategies. The strategy, which consisted of collecting corn stover in windrows and baling, achieved significantly higher collection efficiency than the strategy consisting of only baling and higher but not significantly higher efficiency than the strategy consisting of mulching, collecting in windrows, and baling. To obtain even more precise data on the efficiency of collecting aboveground residues by different strategies after corn grain harvest, it is necessary to conduct additional research on different hybrids, in different climatic conditions, at different levels of applied agrotechnology, using different machines and equipment and of course over a longer period.
Keywords: corn stover, harvest index, collection efficiency
INTRODUCTION
With the depletion of fossil fuels, especially oil and gas, biomass is becoming an increasingly important source of energy. Matin et al. (2016) stated that maize biomass,
48. ACTUAL TASKS ON AGRICULTURAL ENGINEERING
Expert paper

Ž. Jukić, I. Kovačev, N. Bilandžija, Z. Koronc, I. Smiljanović
322
regardless of hybrid and quantity, represents energy-efficient lignocellulosic biomass. Except for the leaf, all parts of the corn burn well. The cob has the best energy properties compared to other crop residues. The capability of the cob replacing oil as fuel depends on the number of ear-bearing plants per area unit and water content in the cob (Jukić et al., 2005).
Biomass is a renewable resource that is appropriate to produce ethanol and chemicals. In contrast to the production of bioethanol from starch, cellulosic biomass is not used as a food source (Rosales-Calderon and Arantes, 2019). The importance of corn stover to the emerging cellulosic ethanol industry makes it an important benchmark crop for comparison against biofuel produced from other candidate biomass crops (Sanford et al., 2017). One of the most critical aspects of profitable lignocellulosic bioenergy facilities is having access to biomass feedstocks of predictable composition and quality (Emerson et al., 2014). Variability in feedstock properties impacts feeding, handling, equipment operations, and conversion performance. Feedstock quality attributes, and their variations, are often overlooked in assessing feedstock value and utilization for conversion to fuels, chemicals, and products (Ray et al., 2020). If harvest residues are planned to be collected and used in further production, it is necessary to determine what quantities will be taken out of the field. This is determined based on research, current scientific knowledge, and practical experience. Factors to be considered include the crop harvested, the crop planted, climate, planting equipment, age of the residue, and the amount of residue remaining directly over the emerging plant. Before harvesting crop residues, the fact that their removal can increase erosion and reduce yields (Graham et al., 2007). When determining the amount of crop residues to be removed from the field, there must be a balance between the potential impact on the environment (soil erosion), the level of organic matter in the soil, and the productivity of the soil (Wilhelm et al., 2004). The sustainable amount that can be removed depends on soil, topography, crops, crop rotation, tillage practice, and environmental constraints (Glassner et al., 1998). In some cases, removal of crop residues in the fall may be desirable because it allows the soil to warm up more quickly in the spring and thus allow for earlier sowing. However, this may incur additional costs associated with nutrients found in harvest residues (Perlack and Turhollow, 2003). According to Vukadinović and Vukadinović (2016) crop residues are the most important source of organic matter in the soil and have a significant impact on the properties of all agricultural soils and should not be considered waste. The problem with storing corn harvest residues is the moisture content, which is much higher than the moisture in the grain at the time of harvest. Corn stover is one of the primary agricultural residues available for producing bioenergy, but there are challenges associated with dry storage as a result of available harvest techniques (Wendt et al., 2018). Huang et al. (2012) (according to Pordesimo et al., 2004) stated that the moisture in the maize crop residues was 2 to 2.5 times higher than the grain moisture when the grain moisture was in the range of 18 to 31% (on a wet basis). These data refer to conditions in the state of Tennessee, USA. Huang et al. (2012) (according to Shinners and Binversie, 2007) stated that the moisture of corn harvest residues was 2.15 times higher than that of grain during the harvest period in the state of Wisconsin, USA. The high moisture content in the crop residues makes its artificial drying economically unprofitable (Huang et al., 2012 (according to Kaminsky, 1989). It is common to harvest corn residues on the ground in the field before harvesting. However, this approach has several drawbacks, namely: lower collection efficiency, increased amount of soil particles in crop residues, and higher presence of various harmful insects in residues (Huang et al., 2012).

Corn stover management on family farm
323
When performing operations related to the collection of crop residues, there may be increased trampling of the soil, which in turn can cause soil compaction. Wilhelm et al., (2004) stated that removal of corn stover for energy production normally requires at last three additional field operations: concentrating stover into rows, consolidating loose fluffy material, and transporting across/from the field. Kiran et al. (2002) state USDA guidelines for the disposal of crop residues in which states that all who participate in crop residue management programs must leave at least 30% of crop residues on the surface due to the threat of erosion and that it is environmentally friendly and sustainable if up to 40% of crop residues taken out of the field. How much harvest residue will be able to be collected also depends on the machines used to collect the mass in the field. Around the world, several technologies are used to collect crop residues, which differ according to the number of operations or procedures applied in a particular technology and the number and size of machines used to collect crop residues. In the available literature can be found data on a conventional collection of crop residues, crop residues collecting in one pass, and the collection of crop residues in two passes (Keene et al., 2013; Shinners et al., 2012). Although there is equipment and there are different technologies for collecting crop residues, it is still not possible to collect the entire amount of crop residues.
The aim of this paper is to determine the possibilities of collecting corn stover from a certain area at different plant population densities of corn hybrid with machinery used on the family farm for collecting aboveground mass in the field. The term corn stover refers to the stalk, leaves and husks, and cobs that remain in the field after the maize is harvested.
MATERIAL AND METHODS
The research was conducted on a family farm near Križevci (northwestern Croatia). The size of the plot on which the research was conducted was 1,9 hectares. For the experiment, an experimental field with an area of 200 m x 50,4 m or 1.008 ha was determined due to the irregularity of the shape of the plot. A protective plot (belt) was made around the experimental field, which consisted of 8 rows along the eastern and western edges of the plot and 16 rows of corn on the upper (northern) edge. The area of the protective plot (belt) is not included in the area of the experiment. If the plot is observed from the south to the north, the altitude of the terrain is constantly increasing slightly, and in the middle of the plot, there is a sharp increase in altitude. Also, if viewed from east to west the altitude of the terrain decreases over the entire width of the plot. The position and slope of the plot are important in terms of the distribution of precipitation on the plot because with higher precipitation there is a runoff of water from the higher parts to the lower ones. The preceding crop in the experimental field was Italian Ryegrass, which was sown in the autumn of 2017. A detailed description of the applied agricultural practices and operations is shown in Table 1. Planting of corn was done on May 8, 2018. using a pneumatic 4-row planter (Monosem Inc). Planter is equipped with dry fertilizers hoppers and insecticide hoppers and dry fertilizers and insecticide were added during planting. Row spacing was 70cm and planting depth was between 4 and 5cm. The target plant densities ranged from 60,000 to 90,000 plants ha-1 in the harvest.
The required number of plants in harvest was determined based on literature data (Milander et al., 2016, 2017) and data from Corteva Pioneer company. Since the plant densities were planned according to the number of plants at harvest, they were increased by
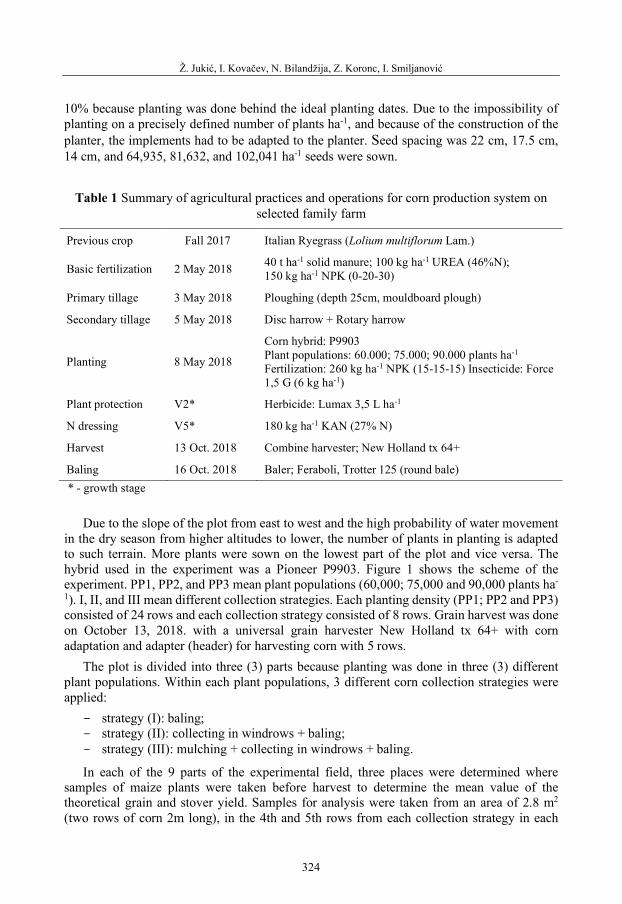
Ž. Jukić, I. Kovačev, N. Bilandžija, Z. Koronc, I. Smiljanović
324
10% because planting was done behind the ideal planting dates. Due to the impossibility of planting on a precisely defined number of plants ha-1, and because of the construction of the planter, the implements had to be adapted to the planter. Seed spacing was 22 cm, 17.5 cm, 14 cm, and 64,935, 81,632, and 102,041 ha-1 seeds were sown.
Table 1 Summary of agricultural practices and operations for corn production system on
selected family farm
Previous crop Fall 2017 Italian Ryegrass (Lolium multiflorum Lam.)
Basic fertilization 2 May 2018 40 t ha-1 solid manure; 100 kg ha-1 UREA (46%N); 150 kg ha-1 NPK (0-20-30)
Primary tillage 3 May 2018 Ploughing (depth 25cm, mouldboard plough)
Secondary tillage 5 May 2018 Disc harrow + Rotary harrow
Planting 8 May 2018
Corn hybrid: P9903 Plant populations: 60.000; 75.000; 90.000 plants ha-1
Fertilization: 260 kg ha-1 NPK (15-15-15) Insecticide: Force 1,5 G (6 kg ha-1)
Plant protection V2* Herbicide: Lumax 3,5 L ha-1
N dressing V5* 180 kg ha-1 KAN (27% N)
Harvest 13 Oct. 2018 Combine harvester; New Holland tx 64+
Baling 16 Oct. 2018 Baler; Feraboli, Trotter 125 (round bale) * - growth stage
Due to the slope of the plot from east to west and the high probability of water movement
in the dry season from higher altitudes to lower, the number of plants in planting is adapted to such terrain. More plants were sown on the lowest part of the plot and vice versa. The hybrid used in the experiment was a Pioneer P9903. Figure 1 shows the scheme of the experiment. PP1, PP2, and PP3 mean plant populations (60,000; 75,000 and 90,000 plants ha-
1). I, II, and III mean different collection strategies. Each planting density (PP1; PP2 and PP3) consisted of 24 rows and each collection strategy consisted of 8 rows. Grain harvest was done on October 13, 2018. with a universal grain harvester New Holland tx 64+ with corn adaptation and adapter (header) for harvesting corn with 5 rows.
The plot is divided into three (3) parts because planting was done in three (3) different plant populations. Within each plant populations, 3 different corn collection strategies were applied:
- strategy (I): baling; - strategy (II): collecting in windrows + baling; - strategy (III): mulching + collecting in windrows + baling.
In each of the 9 parts of the experimental field, three places were determined where samples of maize plants were taken before harvest to determine the mean value of the theoretical grain and stover yield. Samples for analysis were taken from an area of 2.8 m2 (two rows of corn 2m long), in the 4th and 5th rows from each collection strategy in each

Corn stover management on family farm
325
plant population at 3 places (1-1 to 3-3 are marks for places where samples were taken, Figure 1).
PP3 PP2 PP1
II I III I III II III II I
1-3 1-2 1-1 1-3 1-2 1-1 1-3 1-2 1-1
2-3 2-2 2-1 2-3 2-2 2-1 2-3 2-2 2-1
3-3 3-2 3-1 3-3 3-2 3-1 3-3 3-2 3-1
Figure 1 Scheme of planting and sampling before grain harvest and before collecting corn stover
At selected places, before harvest, the plants were hand-cut at ground level and brought to
the edge of the experimental field where further testing was performed. The following parameters were determined in the plant samples: number of plants ha-1, number of ears ha-1, the weight of above-ground biomass ha-1, ear weight ha-1, cob weight ha-1, kernel weight ha-
1, kernel moisture, cob moisture, and moisture of residual above-ground mass (stem + leaf + tassel). Weight of aboveground biomass, ear weight, cob weight, and kernel weight adjusted to a moisture content of 14%. Corn stover collection was done on October 16, 2018. Before baling samples of corn stover were taken to determine moisture because grain harvest and collecting of stover were not performed on the same day. A Massey Ferguson 6290 (105kW) tractor was used to drive the baler. The used baler is a Feraboli, Trotter 125. This baler presses corn stover into cylindrical bales (125 x 125 cm). After baling, bales were marked and moved to the edge of the experimental field where the weighing was done. The obtained data were statistically analysed.
RESULTS AND DISCUSSION
Immediately before harvest, the average number of plants and the number of ears in all given plant populations were determined and all the obtained results are shown in Table 2. In plant population PP1 (60,000 plants ha-1), the number of plants was 68,254 ha-1. This is more than the expected number of plants in the harvest. On average, 69,841 ha-1 ears were found, which means that 1.587 more ears were found than there were plants. In plant population PP2 (75,000 plants ha-1), an average of 80,952 plants ha-1 were found before harvest, which is less than expected at harvest (82,500 plants ha-1). In this plant population, an average of 80,159 ears ha-1 were found, which means that 793 fewer ears were found than were plants. The average determined number of plants in plant population PP3 (90,000 plants ha-1) was 99,603 ha-1, which is more than the expected number of plants in the harvest (99,000 plants ha-1). The number of ears in this plant population was on average 96,825, which means that the number of ears was lower by an average of 2.778 compared to the determined number of plants.

Ž. Jukić, I. Kovačev, N. Bilandžija, Z. Koronc, I. Smiljanović
326
Table 2 Targeted and achieved number of plants and ears in the harvest in all plant populations
Parameters Plant populations PP1 PP2 PP3
The targeted number of plants in harvest, ha-1 60,000 75,000 90,000
Number of seeds in planting, ha-1 64,935 81,632 102,041
Number of plants in harvest, ha-1 68,254 80,952 99,603
Number of ears in harvest, ha-1 69,841 80,159 96,825
As can be seen from Table 3, the average determined weight of stems with leaves did not
differ significantly between the plant populations. The highest weight of stems with leaves was determined on average in PP3 but was only slightly higher than that determined in PP1. The lowest average weight of stems with leaves was determined in PP2 (table 3). Cob weight differed significantly between plant populations and was significantly lower in PP3 compared to PP1 and PP2. Kernel weight did not differ between plant populations and was the highest on average in PP2. On average, the highest weight of total above-ground biomass was determined in PP1, but it was not significantly higher than the weight of total above-ground biomass determined in the PP2 and PP3. The average value of the harvest index was not significantly different between plant populations, although the highest value of the harvest index was in PP2 (Table 3).
Table 3 Average values of investigated parameters in all plant populations
Parameters Plant populations
LSD P value PP1 PP2 PP3
Weight of stems with leaves, kg ha-1 11,145.3 ± 1,553.1
10,486.9 ± 2,145.2
11,219.7 ± 2,436.6 2,021.50 0.7157
Cob weight, kg ha-1 1,972.6 a ± 150.6
1,902.1 a ± 181.1
1,698.2 b ± 186.9 168.93 0.0074
Kernel weight, kg ha-1 14,244.1 ± 1,123.0
14,422.1 ± 1,461.8
13,523.2 ± 1,899.7 1,486.90 0.4305
Weight of total above-ground biomass, kg ha-1
27,362.0 ± 1,491.5
26,811.1 ± 3,464.2
26,441.1 ±3,691.8 2,964.60 0.8135
Weight of above-ground biomass (without grain), kg ha-1
13,117.9 ± 1,516.0
12,388.9 ± 2,293.6
12,917.9 ± 2,564.4 2,111.90 0.7649
Harvest indeks (HI) 0.52 ± 0.04 0.54 ± 0.04 0.51 ± 0.04 0.0398 0.3687
Ratio between kernel weight and weight of above-ground biomass (without grain)
1.10 ± 0.20
1.19 ± 0.18
1.07 ± 0.17 0.1786 0.3827
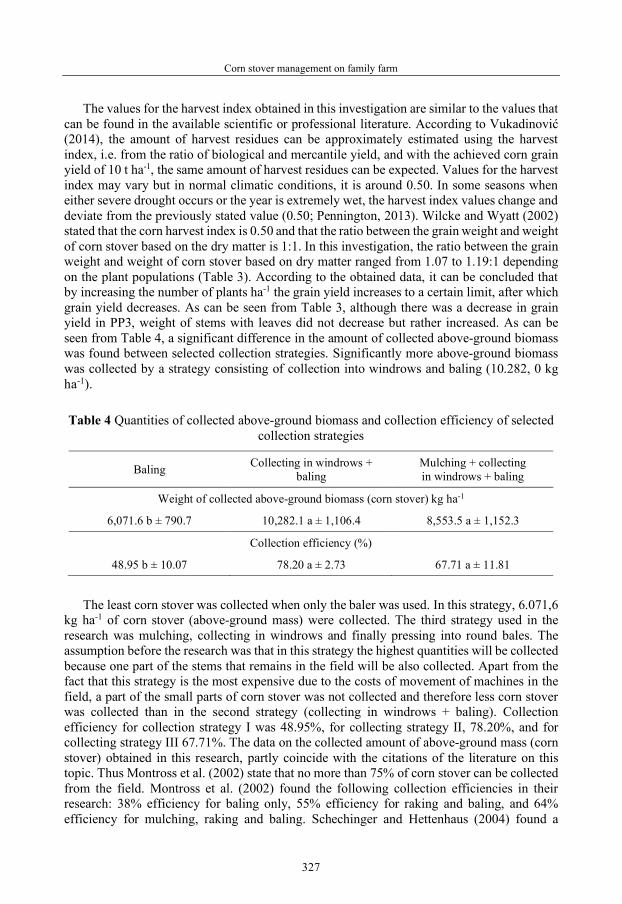
Corn stover management on family farm
327
The values for the harvest index obtained in this investigation are similar to the values that can be found in the available scientific or professional literature. According to Vukadinović (2014), the amount of harvest residues can be approximately estimated using the harvest index, i.e. from the ratio of biological and mercantile yield, and with the achieved corn grain yield of 10 t ha-1, the same amount of harvest residues can be expected. Values for the harvest index may vary but in normal climatic conditions, it is around 0.50. In some seasons when either severe drought occurs or the year is extremely wet, the harvest index values change and deviate from the previously stated value (0.50; Pennington, 2013). Wilcke and Wyatt (2002) stated that the corn harvest index is 0.50 and that the ratio between the grain weight and weight of corn stover based on the dry matter is 1:1. In this investigation, the ratio between the grain weight and weight of corn stover based on dry matter ranged from 1.07 to 1.19:1 depending on the plant populations (Table 3). According to the obtained data, it can be concluded that by increasing the number of plants ha-1 the grain yield increases to a certain limit, after which grain yield decreases. As can be seen from Table 3, although there was a decrease in grain yield in PP3, weight of stems with leaves did not decrease but rather increased. As can be seen from Table 4, a significant difference in the amount of collected above-ground biomass was found between selected collection strategies. Significantly more above-ground biomass was collected by a strategy consisting of collection into windrows and baling (10.282, 0 kg ha-1).
Table 4 Quantities of collected above-ground biomass and collection efficiency of selected
collection strategies
Baling Collecting in windrows + baling
Mulching + collecting in windrows + baling
Weight of collected above-ground biomass (corn stover) kg ha-1
6,071.6 b ± 790.7 10,282.1 a ± 1,106.4 8,553.5 a ± 1,152.3
Collection efficiency (%)
48.95 b ± 10.07 78.20 a ± 2.73 67.71 a ± 11.81 The least corn stover was collected when only the baler was used. In this strategy, 6.071,6
kg ha-1 of corn stover (above-ground mass) were collected. The third strategy used in the research was mulching, collecting in windrows and finally pressing into round bales. The assumption before the research was that in this strategy the highest quantities will be collected because one part of the stems that remains in the field will be also collected. Apart from the fact that this strategy is the most expensive due to the costs of movement of machines in the field, a part of the small parts of corn stover was not collected and therefore less corn stover was collected than in the second strategy (collecting in windrows + baling). Collection efficiency for collection strategy I was 48.95%, for collecting strategy II, 78.20%, and for collecting strategy III 67.71%. The data on the collected amount of above-ground mass (corn stover) obtained in this research, partly coincide with the citations of the literature on this topic. Thus Montross et al. (2002) state that no more than 75% of corn stover can be collected from the field. Montross et al. (2002) found the following collection efficiencies in their research: 38% efficiency for baling only, 55% efficiency for raking and baling, and 64% efficiency for mulching, raking and baling. Schechinger and Hettenhaus (2004) found a

Ž. Jukić, I. Kovačev, N. Bilandžija, Z. Koronc, I. Smiljanović
328
collection efficiency between 40 to 50% without raking and 70% efficiency with raking. Petrolia (2006) found that the efficiency of collecting corn stover was 30% when only a press was used, while with the use of a mulcher, rake, and baler (press) the efficiency was higher and amounted to 40%. Prewitt et al. (2007) determined that collection efficiency (ratio of stover collected to the total above-ground stover excluding grain) varied between 32.1% and 94.5%, depending on the applied harvesting treatments. Six different harvesting treatments, using traditional hay equipment, authors used to harvest corn stover. Karlen et al. (2012) explored how much corn stover can be collected. The research was conducted over four years and the authors tested 7 different collection methods. The percentage of collected mass from the total amount of above-ground biomass ranged from 12 to 60% depending on the applied collection method.
CONCLUSION
Based on the obtained results, it was determined that in the highest plant population (PP3) (99603 plants ha-1) the lowest values were determined for kernel weight, cob weight, total above-ground biomass, harvest index, and the ratio between kernel weight and weight of above-ground biomass (without grain). The highest kernel weight, harvest index, and ratio between kernel weight and weight of above-ground biomass (without grain) was determined in PP2, ie in the density of 80,952 plants ha-1, while the highest weight of total above-ground biomass was determined in PP1. A significant difference was found between the applied collection strategies, in the amount of collected corn stover. A strategy consisting of mulching, then collecting in windrows, and baling did not achieve the best efficiency. For this technology which is both the most expensive and takes place in multiple passes, it was assumed that it would achieve the best efficiency. The strategy, which consisted of collecting corn stover in windrows and baling, achieved significantly higher collection efficiency than the strategy consisting of only baling and higher but not significantly higher efficiency than the strategy consisting of mulching, collecting in windrows, and baling. The data obtained in this study, which relate to the efficiency of collection are different than found by other authors, which can be attributed to the fact that not all authors in their research did not use the same collection strategy and equipment and did not do research in the same climate and conditions the same levels of applied agrotechnology. Data related to the harvest index and the ratio between kernel weight and weight of above-ground biomass (without grain) are in accordance with the existing scientific and professional literature and can be used to determine the quantities of corn that can be taken out of the field. The measurements carried out as part of this research are applicable and easy to perform in the field. To obtain even more precise data on the efficiency of collecting aboveground residues by different strategies after corn grain harvest, it is necessary to conduct additional research on different hybrids, in different climatic conditions, at different levels of applied agrotechnology, using different machines and equipment and of course over a longer period.
REFERENCES:
Emerson, R., Hoover, A., Ray, A. Lacey, J., Cortez, M., Payne, C., Karlen, D. L.., Birrell, S., Laird, D., Kallenbach, R., Egenolf, J., Sousek, M., Voigt, T. (2014). Drought effects on composition and yield for corn stover, mixed grasses, and Miscanthus as bioenergy feedstocks. Agronomy & Horticulture -- Faculty Publications. 859. http://digitalcommons.unl.edu/agronomyfacpub/859

Corn stover management on family farm
329
Glassner, D.A., Hettenhaus, J.R., Schechinger, T.M. (1998). Corn Stover Collection Project. BioEnergy '98: Expanding BioEnergy Partnerships https://www.agmrc.org/media/cms/bio98paper_CA9EFF13F9159.pdf
Graham, R.L., Nelson, R., Sheenan J., Perlack, R.D., Wright, L.L. (2007). Current and Potential U.S. Corn Stover Supplies. Agronomy Journal 99: 1-11.
https://www.corteva.hr/proizvodi/sjeme/kukuruz.html Huang, H., Faulkner, D.B., Berger, L.L., Eckhoff, S.R. (2012). Harvest Date Influence on Dry Matter
Yield and Moisture of Corn and Stover. Transactions of the ASABE. Vol. 55(2):593-598. https://arizona.pure.elsevier.com
Jukic, Ž., Kricka, T., Matin, A. (2005). Energy value of the cob of different corn hybrids. “Energy – saving technologies for drying and hygrothermal processing”- DHTP; October 11-14, 2005, Moscow; Proceedings, Vol. 1, pp. 258-261.
Karlen, D.L., Birrell, S.J., Wirt, A., Schock, N. (2012). Corn stover harvest strategy effects on grain yield and soil quality indicators. Agricultural and Biosystems Engineering Publications. 558. https://lib.dr.iastate.edu/abe_eng_pubs/558
Keene, J.R., Shinners, K.J., Hill, L.J., Stallcop, A.J., Wemhoff, S.J., Anstey, H.D., Bruns, A. J., Johnson, J.K. (2013). Single-pass baling of corn stover. Transactions of the ASABE, 56(1):33-40. (doi: 10.13031/2013.42583) https://elibrary.asabe.org
Kiran, L. Kadam, James, D. McMillan. (2003). Availability of corn stover as a sustainable feedstock for bioethanol production. Bioresource Technology 88 (2003) 17–25. https://doi.org/10.1016/S0960-8524(02)00269-9
Matin, A., Krička, T., Jurišić, V., Voća, N., Antonović, A., Bilandžija, N., Grubor, M., Miličević, I. (2016). Iskoristivost biomase kukuruza za proizvodnju toplinske energije. Proceedings 51st Croatian and 11th International Symposium on Agriculture. Opatija. Croatia (489-492).
Milander, J.J., Jukić, Ž., Mason, S.C., Galusha, T.D., Kmail, Z. (2016). Plant population influence on maize yield components in Croatia and Nebraska. Crop Sci. 56:1-9.
Milander, J.J., Jukić, Ž., Mason, S.C., Galusha, T.D., Kmail, Z. (2017). Hybrid maturity influence on maize yield and yield component response to plant populations in Croatia and Nebraska. Cereal Res. Comm. 45(2):326-335.
Montross, M.D., Prewitt, R., Shearer, S.A., Stombaugh, T.S., McNeil, S.G., Sokhasanj, S. (2002). Economics of collection and transportation of corn stover. ASAE Paper 036081 presented at the Annual International Meeting of the American Society of Agricultural Engineers, Las Vegas, NV. 27 - 31 July 2003. ASAE, St. Joseph, MI.
Pennington, D. (2013.). Harvest index: A predictor of corn stover yield. Michigan State University. https://www.canr.msu.edu/news/harvest_index_a_predictor_of_corn_stover_yield (Accesed:11.3.2019).
Perlack, R.D.; Turhollow, A.F. (2003). Feedstock cost analysis of corn stover residues for further processing. Energy 28: 1395 – 1403. https://doi.org/10.1016/S0360-5442(03)00123-3
Petrolia, D. R. (2006). The Economics of Harvesting and Transporting Corn Stover for Conversion to Fuel Ethanol: A Case Study for Minnesota. Department of Applied Economics College of Food, Agricultural, and Natural Resource Sciences University of Minnesota, Staff Paper P06-12. https://conservancy.umn.edu/bitstream/handle/11299/151688/P06
Prewitt, R.M., Montross, M.D., Shearer, S.A., Stombaugh, T.S., Higgins, S.F., McNeill, S.G., Sokhansanj, S. (2007). Corn stover availability and collection efficiency using typical hay equipment. Transactions of the ASABE. 50(3): 705-711. (doi: 10.13031/2013.23124)@2007

Ž. Jukić, I. Kovačev, N. Bilandžija, Z. Koronc, I. Smiljanović
330
Ray, A.E., Williams, C.L., Hoover, A.N., Li, C., Sale, K. L., Emerson, R.M., Klinger, J., Oksen, E., Narani, A., Yan, J., Beavers, C.M., Tanjore, D., Yunes, M., Bose, E., Leal, J.H., Bowen, J.L., Wolfrum, E.J.,Resch, M.G., Semelsberger, T.A., Donohoe, B.S. (2020). Multiscale Characterization of Lignocellulosic Biomass Variability and Its Implications to Preprocessing and Conversion: a Case Study for Corn Stover. ACS Sustainable Chem. Eng. 2020, 8, 3218−323. https://pubs.acs.org/doi/pdf/10.1021/acssuschemeng.9b06763
Rosales-Calderon, O., Arantes, V. (2019). A review on commercial-scale high-value products that can be produced alongside cellulosic ethanol. Biotechnol Biofuels 12, 240 (2019). doi.org/10.1186/s13068-019-1529-1 https://biotechnologyforbiofuels.biomedcentral.com/articles/10.1186/s13068-019-1529-1
Sanford, G.R., Oates L.G., Roley, S.S., Duncan, D.S., Jackson, R.D., Robertson, G.P., Thelen, K.D. (2017). Biomass Production a Stronger Driver of Cellulosic Ethanol Yield than Biomass Quality. Agron. J. 109:1911–1922.doi:10.2134/agronj2016.08.0454 https://acsess.onlinelibrary.wiley.com/doi/pdf/10.2134/agronj2016.08.0454
Schechinger, T. M., Hettenhaus, J. (2004). Corn stover harvesting: on corn stover harvest experiences in Iowa and Wisconsin for the 1997-98 and 1998-99 crop years. ORNL/SUB- 0404500008274-01. NTIS, Springfield, VA.
Shinners, K.J., Bennett, R.G.; Hoffman, D.S. (2012). Single and two-pass corn grain and stover harvesting. Transaction of the ASABE. 55(2): 341-350. www.agriculturalmachineryengineeringweebly.com
Vukadinović, V. (2014). Zaoravati ili spaljivati ţetvene ostatke?. Agroklub. https://www.agroklub.com/ratarstvo/zaoravati-ili-spaljivati-zetvene-ostatke/15244/ (Accesed 11.3.2019.)
Vukadinović, V., Vukadinović, V. (2016). Tlo, gnojidba i prinos, Što sve poljoprivrednik mora znati o tlu, usjevu, gnojidbi i tvorbi prinosa. www.Ishrana bilja.com.hr
Wendt, L.M., Murphy, J.A., Smith, W.A., Robb, T., Reed, D.W., Ray, A.E., Liang, L., He, Q., Sun, N., Hoover, A.N., Nguyen, Q.A. (2018). Compatibility of High-Moisture Storage for Biochemical Conversion of Corn Stover: Storage Performance at Laboratory and Field Scales. Front Bioeng Biotechnol.; 6: 30. doi: 10.3389/fbioe.2018.00030
Wilcke, W., Wyatt, G. (2002). Grain storage tips: Factors and formulas for crop drying, storage, and handling. Univ of Minnesota Extension Service, St. Paul, MN. www.extension.umn.edu/distribution/cropsystems/M1080-FS.pdf Univ. of Minnesota Extension Service, St. Paul, MN.
Wilhelm, W.W., Johnson, J.M.F., Hatfield, J.L., Voorhees, W.B., Linden, D.R. (2004). Crop and Soil Productivity Response to Corn Residue Removal: A Literature Review. Agronomy Journal, Vol. 96, No. 1, pp 1-17.

48th Symposium "Actual Tasks on Agricultural Engineering", Zagreb, Croatia, 2021
331
POTENTIAL AND ACTUAL QUANTITIES OF WHEAT STRAW THAT CAN BE COLLECTED ON FAMILY
FARM Željko JUKIĆ1*, Igor KOVAČEV2, Lepomir ČOGA3, Zlatko KORONC2,
Ana MATKOVIĆ1, Antun ZMAIĆ4 *E-mail of the corresponding author: [email protected]
1 Department of Field Crops, Forage and Grassland, University of Zagreb, Faculty of Agriculture, Svetošimunska cesta 25, 10000 Zagreb, Croatia
2 Department of Agricultural Engineering, University of Zagreb, Faculty of Agriculture, Svetošimunska cesta 25, 10000 Zagreb, Croatia
3 Department of Plant Nutrition, University of Zagreb, Faculty of Agriculture, Svetošimunska cesta 25, 10000 Zagreb, Croatia
4 Graduated student, University of Zagreb, Faculty of Agriculture
ABSTRACT
Wheat is an important source of biomass, which the world is paying attention, due to the increasing exhaustion of non-renewable energy sources. Wheat takes part in the production of biofuels, where grain and straw are raw materials for liquid (ethanol) and solid biofuels (briquettes/pellets). Straw represents an important source of organic matter, has a significant impact on the biological, chemical and, physical properties of agricultural soils, and does not need to be considered as waste. The objective of this study was to determine the possibilities of collecting wheat straw from a certain area after harvest with machinery and equipment used on the family farm. The field experiment was conducted at one family farm in 2018. Two wheat cultivars were used for the field experiment. The theoretical yield of straw was in the range of 8,900.9 kg ha-1 (cultivar Sofru) to 9,648.8 kg ha-1 (cultivar Kraljica). The amount of straw that was collected with machinery and equipment used on the family farm, was from 1,857.0 (cultivar Sofru) to 2,234.0 kg ha-1 (cultivar Kraljica). Collection efficiency varied from 21.5% (cultivar Sofru) to 23.7% (cultivar Kraljica). No significant difference was found between the cultivars in collection efficiency. The data obtained in this study indicated problems that may arise in determining the amount of straw that can be taken out of the field by a particular piece of equipment.
Keywords: wheat, straw, collection efficiency
48. ACTUAL TASKS ON AGRICULTURAL ENGINEERING
Expert paper

Ž. Jukić, I. Kovačev, L. Čoga, Z. Koronc, A. Matković, A. Zmaić
332
INTRODUCTION
Recently, wheat straw has become a valid source for energy production or as raw material for industrial processes. The biochemical properties of lignocellulosic materials, like straw, make them suitable for further industrial processing (Suardi et al., 2020). To assess the potential biomass contribution from agriculture, several scenarios were evaluated. These scenarios include various combinations of changes in the following: yields of crops grown on active cropland, crop residue-to-grain or-seed ratios, annual crop residue collection technology and equipment, crop tillage practices, land-use change to accommodate perennial crops (i.e., grasses and woody crops), biofuels (i.e., ethanol and biodiesel), and secondary processing and other residues. Crop yields are of particular importance because they affect the amount of residue generated and the amount of land needed to meet food, feed, and fibre demands (Perlack et al., 2005). Karlen and Huggins (2014) stated that agronomic considerations for determining supplies of wheat straw that can be harvested sustainably include: (1) annual wheat straw yield and its stability; (2) straw harvesting efficiencies; (3) crop rotation and tillage practices for assessing soil conservation and sustainability factors; (4) nutrient removal and fertilizer replacement values; (5) site-specific field evaluations including economic factors that inform decision support systems; and (6) competing economic uses for harvested cereal straw. Today’s wheat varieties have shorter stems, mature earlier, have higher yields, and produce a higher proportion of grain compared to straw than older cultivars (Capper, 1988). Regular removal or incineration of crop residues increases the risk of erosion on sloping terrain and lighter soils, disrupts the nutrient cycle in the soil, affects the deterioration of the structure and increase soil density, decrease humus content and retention and filtration capacity for water. The microbiological activity in the soil also decreases markedly, i.e. its biogenicity deteriorates, the cation exchange capacity decreases and the yield finally decreases (Vukadinović and Vukadinović, 2016). Removal of crop residues accelerates evaporation, increases daily fluctuations in soil temperature, and reduces the soil’s ability to retain water (Blanco-Canqui and Lal, 2009). The same authors state that the amounts of crop residues that will be removed from the field depend on the specifics of the location and the system of agricultural production (crop rotation). According to research on the Danish peninsula of Jutland conducted over 30 years, the positive effect of returning straw ploughing to the soil on the soil's carbon content has been proven. This has been found on several different soil types. During this period (30 years), by returning 4 to 5 t ha-1 of crop residues into the soil, the amount of carbon in the soil increased by an average of 13% (Gobin et al., 2011).
Tarkalson et al. (2009) state that straw should not be taken out of the field when the wheat grain yield is less than 3,128 kg ha-1. When the grain yield is higher than 6,800 kg ha-1, up to 4,000 kg ha-1 of straw can be removed without impoverishment of soil organic carbon. The research conducted by Jaćimović et al. (2017) showed that returning crop residues significantly increases wheat yield. The grain yield achieved on the variant of the experiment in which the crop residues are ploughed for a longer period was 830 kg ha-1 higher compared to the variant in which the crop residues were not ploughed. Climatic and weather conditions have a direct impact on the use and availability of straw. A lot of rainfall during the harvest makes the straw collection particularly difficult (Kretschmer et al., 2012). Exposure of straw to precipitation can ultimately lead to the production of higher quality energy sources due to the leaching of substances such as chlorine.

Potential and actual quantities of wheat straw that can be collected on family farm
333
However, this is not the goal for farmers because the price of straw is based only on the mass and water content (Skøtt, 2011). Scarlat et al. (2010) estimate that between 15 and 60% of wheat straw can be removed from the field without adversely affecting the soil. This assessment was made by the authors based on available literature data. Wheat cultivars have been bred for increased grain yield; however, with the development of second‐generation biofuel production, utilization of straw biomass provides the potential for ‘food and fuel’ and the development of dual‐purpose wheat cultivars optimized for food grain and straw biomass production (DPC). An ideal DPC would be characterized by high grain and straw yields, high straw digestibility (i.e. biofuel yield potential), and good lodging resistance (Townsend et al., 2017). However, several different factors show a large influence on the yield and properties of straw in potential dual-use varieties. Wheat straw management is often accompanied by doubts about how to proceed because the difference is in how much straw can and should be collected. How much straw can be collected depends on the machinery used in the collection, while the properties and condition of the soil affect the amount that should be collected. Science advocates the obligatory returning of crop residues, although in certain situations this may present a certain technical problem.
The objective of this study was to determine the possibilities of collecting wheat straw from a certain area after harvest with machinery and equipment used on the family farm.
MATERIALS AND METHODS
The research was conducted on the family farm near Slavonski Brod (eastern Croatia; 93,0 m altitude) on the wetland gley soil or eugley. The size of the experimental field used for the study was 5.3 ha. At the 1.5 ha was sown cultivar Kraljica (Agricultural Institute Osijek, Croatia) and at the 3.8 ha was sown cultivar Sofru (RWA Raiffeisen Agro, Croatia). In the narrower area where the experimental field is located, a temperate continental climate prevails, the general character of which is the uneven distribution of precipitation by months. The previous crop on the experimental field was soybean. A summary of the applied agricultural practices and operations through the vegetation season is presented in table 1. Before grain harvesting, six sampling sites for each cultivar were randomly selected. The size of each sampling site was 0.135m2 and the whole above-ground biomass on each sampling site was hand-harvested at the ground level to score potential total yield (grain + chaff + straw + stubble). Immediately after harvest, the height of the stubble (from the soil to the height of the cut) was determined and samples (six per cultivar) were randomly taken to determine the amount of straw left after the passage of the combine, which cannot be collected by the baler (sampling sites was 0.135m2). Sampling close to the border of the experimental field was avoiding to prevent the edge effect. The wheat varieties used in the study were Kraljica and Sofru. The main properties of these wheat varieties are shown in table 2.
Further processing of taken above-ground biomass samples, made on the family farm. The above-ground biomass of wheat plants was separated into spikes and stems with leaves. By hand threshing, wheat kernels were removed from spikes and spikelets. The chaff was separated from the kernel and after that three fractions of above-ground biomass were obtained: kernel, chaff and stems with leaves. The total mass of all above-ground biomass fractions determined in each sample. Losses were estimated as the difference between the theoretical biomass of grains, straw, and chaff collectible before the harvest and the effective amount collected. Losses also included the amount of biomass lost as stubble. The
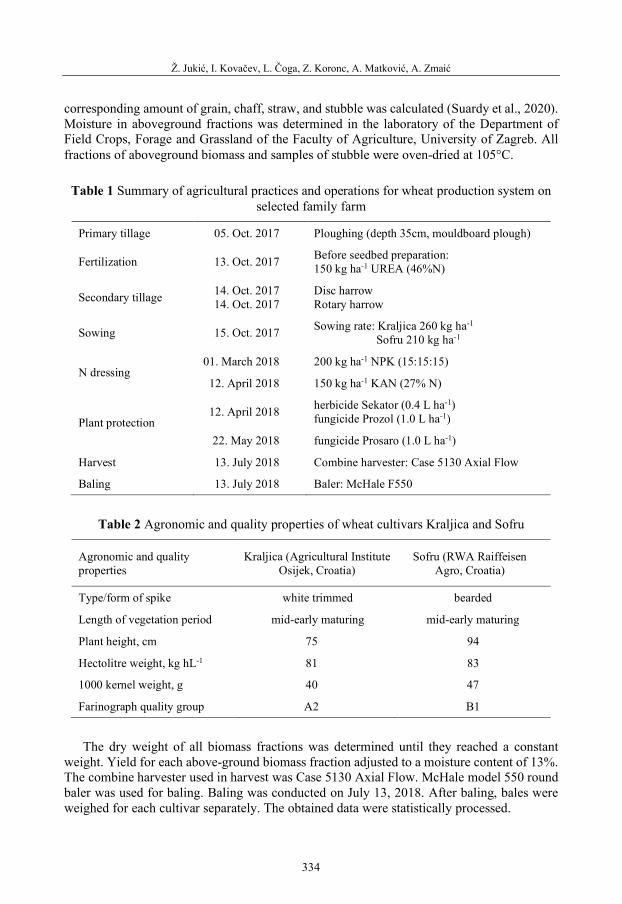
Ž. Jukić, I. Kovačev, L. Čoga, Z. Koronc, A. Matković, A. Zmaić
334
corresponding amount of grain, chaff, straw, and stubble was calculated (Suardy et al., 2020). Moisture in aboveground fractions was determined in the laboratory of the Department of Field Crops, Forage and Grassland of the Faculty of Agriculture, University of Zagreb. All fractions of aboveground biomass and samples of stubble were oven-dried at 105°C.
Table 1 Summary of agricultural practices and operations for wheat production system on
selected family farm
Primary tillage 05. Oct. 2017 Ploughing (depth 35cm, mouldboard plough)
Fertilization 13. Oct. 2017 Before seedbed preparation: 150 kg ha-1 UREA (46%N)
Secondary tillage 14. Oct. 2017 14. Oct. 2017
Disc harrow Rotary harrow
Sowing 15. Oct. 2017 Sowing rate: Kraljica 260 kg ha-1
Sofru 210 kg ha-1
N dressing 01. March 2018 200 kg ha-1 NPK (15:15:15)
12. April 2018 150 kg ha-1 KAN (27% N)
Plant protection 12. April 2018 herbicide Sekator (0.4 L ha-1)
fungicide Prozol (1.0 L ha-1)
22. May 2018 fungicide Prosaro (1.0 L ha-1)
Harvest 13. July 2018 Combine harvester: Case 5130 Axial Flow
Baling 13. July 2018 Baler: McHale F550
Table 2 Agronomic and quality properties of wheat cultivars Kraljica and Sofru
Agronomic and quality properties
Kraljica (Agricultural Institute Osijek, Croatia)
Sofru (RWA Raiffeisen Agro, Croatia)
Type/form of spike white trimmed bearded
Length of vegetation period mid-early maturing mid-early maturing
Plant height, cm 75 94
Hectolitre weight, kg hL-1 81 83
1000 kernel weight, g 40 47
Farinograph quality group A2 B1 The dry weight of all biomass fractions was determined until they reached a constant
weight. Yield for each above-ground biomass fraction adjusted to a moisture content of 13%. The combine harvester used in harvest was Case 5130 Axial Flow. McHale model 550 round baler was used for baling. Baling was conducted on July 13, 2018. After baling, bales were weighed for each cultivar separately. The obtained data were statistically processed.

Potential and actual quantities of wheat straw that can be collected on family farm
335
RESULTS AND DISCUSSION
Wheat cultivars were ready for harvest on June 20, but heavy rains delayed harvest until July 13, 2018, and by then there had already been a reduction in grain and straw quality. The stems with the leaves changed colour under the influence of heavy rains and lost their elasticity. The mean annual quantity of precipitation in 2018, in Slavonski Brod, was 739.8mm which is 30 mm less compared to the multi-annual average (1963-2018). In January, February, March, May, June, and July 2018, more precipitation was found than in the multi-annual average. In the period from June 20 to July 13, 2018, which is 24 days, approximately 90mm of precipitation fell, which is 37% of the total precipitation that fell in June and July 2018. In the multi-annual average (1963-2018), in June and July (a total of 61 days) usually falls 167mm precipitation, while in 2018 in the two before mentioned months, fell 243mm or 76mm more precipitation than the multi-annual average. For 24 days, an average of 7 mm of precipitation fell every two days. From this point, it can be concluded that it was almost impossible to organize wheat harvest because as soon as the grain dried a little, new amounts of precipitation fell. In such conditions and with the use of a combine with an axial threshing apparatus, there was a large breakage of the stems with leaves, which can be seen from Figure 1. This resulted in a relatively small amount of straw that could be collected using a baler. In this research, expected higher collection efficiency and a higher proportion of above-ground biomass (without grain) that could be collected with a baler.
Figure 1 Straw after passing through a rotary (left) and conventional (right) thresher drum (photo: A. Zmaić)
Table 3 shows the data obtained for both wheat cultivars that were in the study. The
average grain yield of the cultivar Kraljica was higher than the average grain yield of the cultivar Sofru by 785 kg ha-1. The difference was not significant but may affect the choice of the cultivar. Namely, if we take into account that the price of wheat grain in the harvest is 1 kn kg-1, it means that the farmer earned 785 kn ha-1 more by sowing the cultivar Kraljica compared to the cultivar Sofru. By increasing the area under the cultivar Kraljica, the profit increases. The sowing rate for the cultivar Kraljica is indeed higher than for the cultivar Sofru,
Ž. Jukić, I. Kovačev, L. Čoga, Z. Koronc, A. Matković, A. Zmaić
336
which could have affected the grain yield. However, it is necessary to set aside more money in sowing, because 50 kg more seeds of the cultivar Kraljica are sown compared to the cultivar Sofru per hectare. So, these are the facts that should be taken into account when choosing a cultivar. On average, a higher amount of stem and leaves and the amount of chaff that remained in the grain mass were determined for cultivar Kraljica, which ultimately caused a higher value for the average total above-ground biomass for the cultivar Kraljica compared to the cultivar Sofru (the difference between cultivars was greater than 1,500 kg ha-1). The harvest index for both cultivars is similar and from table 3 it can be seen that for both cultivars ratio between grain yield and amount of stems, leaves and chaff is almost the same. The amount of stubble obtained by taking samples after grain harvest is also higher for the cultivar Kraljica, but the difference between the cultivars is not significant. The amount of total aboveground residues (without grain) that can be collected by the baler is again higher for the cultivar Kraljica, but no statistically significant difference between the cultivars was found. The amount of straw collected by the baler for the cultivar Kraljica was 2,234.0 kg ha-1, and for the cultivar Sofru 1,857.0 kg ha-1, and from table 3 it can be seen that the collection efficiency was 2% higher for the cultivar Kraljica. Percent of the total amount of residues that can be collected by the baler was also higher for the cultivar Kraljica, but the difference between the cultivars was not significant. Straw yields from 2.7 to 4.2 t ha-1 and from 3.4 to 4.6 t ha-1 were determined in two studies by Larsen et al., (2012). The authors stated that the straw yield was the amount of straw that was baled and removed from the field. Boyden et al. (2001) believe that up to 40% of harvest residues can realistically be collected because part of the straw will remain in the field as stubble, while leaves and chaff will be lost during harvesting and baling. In general, there is limited straw yield data available as straw yields are rarely quantified (Townsend et al., 2017). The authors stated which are the two main reasons for this: first is that straw is seen as a by-product to the more important grain, with less incentive for it to be quantified as its economic value is much lower. The second reason is that straw yields are more difficult to quantify than grain yields, particularly on trial plots, due to straw losses and movement between combining and baling, as well as the need for special equipment to take account of topography to have an even level of stubble for each plot (Townsend et al. 2017).
The obtained harvest index (HI) was almost completely the same for both cultivars and it was 0.5. Similar data on the harvest index are presented by other authors. Dai et al., (2016) conducted a study on five wheat cultivars and obtained an average harvest index of 0.45, with values for the harvest index varying from 0.33 to 0.61. In studies conducted by White and Wilson (2006), values for the harvest index ranged from 0.496 to 0.539 in different wheat cultivars. Based on data obtained at several locations and through several years of investigation, Karlen and Huggins (2014) state that the average harvest index was 0.44. Golub et al. (2013) found that the harvest index for wheat was 0.48 and 0.49, respectively.
The efficiency of the straw collection in the investigation was 23.69% (cultivar Kraljica) and 21.53% (cultivar Sofru). Comparing the obtained data with the data from the available literature, it can be seen that the obtained values for efficiency are lower. Golub et al. (2013) obtained collection efficiencies of 50% (for the season 2011) and 39.3% (for the season 2012) and Lafond et al. (2009) found that the proportion of total aboveground residues other than grain removed with baling ranged from 22 to 35% or 26 to 40% depending on the method of calculation (authors evaluated three harvesting systems and their impact on straw removal with baling).

Potential and actual quantities of wheat straw that can be collected on family farm
337
Table 3 Average grain yield and average values of other parameters (SE) for wheat cultivars in the investigation (kg, 13% H2O)
Parameters KRALJICA SOFRU LSD P-value
BEFORE BALING
Grain yield (a) 9,661.0 ± 1,703.6
8,876.1 ± 1,497.2 2.063.1 0.4165
Amount of stems and leaves (b) 7,259.3 ± 1,206.0
6,496.5 ± 1,247.5 1.578.3 0.3069
Amount of chaff (c) 2,358.5 ± 467.2
2,374.8 ± 447.4 588.4 0.9518
Amount of chaff remaining in the grain mass (d)
31.08 ± 16.75
29.52 ± 31.05 32.09 0.9158
Total above-ground biomass (e) e = a + b + c + d
19,309.8 ± 3,331.9
17,777.0 ± 3,076.4 4.125.1 0.427
Amount of leaves and stems + amount of chaff (f); f = b + c + d
9,648.8 ± 1,648.6
8,900.9 ± 1,711.9 2.161.8 0.4586
Harvest index (HI); HI = a /( a + b + c + d) 0.5001 ± 0.0106
0.5002 ± 0.028 0.0272 0.9976
Ratio between grain yield and amount of stems, leaves and chaff (g) g = a / (b + c + d)
1.0012 ± 0.0419
1.006 ± 0.1157 0.112 0.9258
Amount of stubble (h) 2,121.5 ± 558.1
1,893.0 ± 419.4 635.0 0.4414
AFTER BALING
Amount of total aboveground residues (without grain) which cannot be collected by the baler (i) i = c + d + h
4,511.0 ± 875.4
4,297.4 ± 439.0 890.82 0.6047
Amount of straw collected by the baler (j) 2,234.0 1,857.0
Proportion of total aboveground residues (without grain) removed with baling (k) (%) k = j / f ∙100
23.69 ± 3.78
21.53 ± 4.15 5.11 0.3694
Amount of total aboveground residues (without grain) which can be collected by the baler (l); l = b - g
5,137.8 ± 1,186.9
4,603.5± 1,504.1 1,742.9 0.5101
Proportion of total aboveground collectable residues (without grain) removed with baling (m) (%); m = j / b – h ∙ 100
45.8 ± 12.22
44.76 ± 16.82 18.91 0.9054

Ž. Jukić, I. Kovačev, L. Čoga, Z. Koronc, A. Matković, A. Zmaić
338
Perlack et al. (2005) stated that on average about 40% of straw can be collected. According to the author, it is due to the following factors: limitations of harvesting equipment, irregularities of arable land, economics, and environmental protection requirements. The slightly lower efficiency of the straw collection was influenced by unfavorable climatic conditions, which led to a delay in the harvest. Then, there is the influence of the mode of operation of the used combine or threshing system. Namely, as stated by Zimmer et al., (2009) according to the method of grain separation, there are three threshing systems. These are: tangential, axial, and tangential-axial. The axial threshing system was used in this study (a Case 5130 Axial- Flow combine was used). Zimmer et al. (2009), state that the axial threshing device damages the grains less but this threshing system requires more power and shreds the straw more strongly. Axial combines are very suitable for harvesting corn and soybeans, and they have proved to be good both when harvesting cereals in dry conditions and with a small proportion of straw. From the weather data it can be determined that the conditions in the harvest were not dry but just the opposite-wet. There was as much straw as there was grain, so the proportion of straw was not small and therefore it could be argued that in the conditions under study perhaps an axial threshing system should not be used but a tangential one. According to Zimmer et al. (2009), in the tangential threshing system, the proportion of short straw in the chaff is reduced and the straw treatment is very gentle.
This means that the results obtained in this research would certainly have been different if a tangential threshing system and could be expected more collected straw. To be able to check this, the following research must compare the tangential and axial threshing system, but in unfavourable weather conditions at harvest and different sowing densities of different wheat cultivars. When talking about the efficiency of straw collection, it is necessary to point out that the cutting height affects the amount of straw collected. The average cutting height was 17.3cm (cultivar Sofru) and 18.3cm (cultivar Kraljica). It is interesting to point out that the lower cutting height, did not lead to greater straw collection efficiency.
CONCLUSION
Based on the results obtained in the investigation, the following can be concluded: - Of the total amount of above-ground residues (without grain), 2,234.0 kg ha-1 (cultivar
Kraljica) and 1,857.0 kg ha-1 (cultivar Sofru) were harvested using machinery and equipment on the farm. The efficiency of straw collection for the cultivar Kraljica was 23.69%, and 21.53% for the cultivar Sofru. The difference between cultivars in straw collection efficiency was not statistically significant.
- The results obtained in the investigation, which relate to the efficiency of straw collection, are lower than those determined by other authors, and this can be attributed to the different mechanization used in harvesting and straw collection and relatively poor climatic conditions during the investigation.
- Values of most of the investigated parameters were higher in the cultivar Kraljica. However, none of the parameters was significantly higher or better than the parameters of the cultivar Sofru. The data obtained in this study indicated problems that may arise in determining the amount of straw that can be taken out of the field by a particular piece of equipment. Namely, it can theoretically be determined based on the harvest index how much straw is left in the field after the wheat harvest and how much straw could be collected in favourable climatic conditions. However, in poor climatic

Potential and actual quantities of wheat straw that can be collected on family farm
339
conditions, quite different data will be obtained, which in turn can help in making as realistic a calculation as possible of how much straw can be collected by particular equipment.
REFERENCES
Blanco-Canqui, H., Lal, R. (2009). Crop residue removal impacts on soil productivity and environmental quality. Critical reviews in plant science, 28(3), 139-163.
Boyden, A., Hill, L., Leduc, P., Wassermann, J. (2001). Field tests to correlate biomass, combine yield, and recoverable straw. Prairie Agricultural Machinery Institute. Project No. 5000H
Capper, B. S. (1988). Genetic variation in the feeding value of cereal straw. Animal Feed Science and Technology, 21(2-4), 127-140.
Dai, Jing, Bean, B.W., Brown, B., Bruening, W., Edwards, J., Flowers, M., Karow, R., Lee, C., Morgan, G., Ottman, M., Ransom, J., Wiersma, J. (2016.). Harvest index and straw yield of five classes of wheat. Biomass and Bioenergy, 85: 223-227. DOI: 10.1016/j.biombioe.2015.12.023
Gobin, A., Campling, P., Janssen, L., Desmet, N., van Delden, H., Hurkens, J., Lavelle, P., Berman, S. (2011). Soil organic matter management across the EU – best practices, constraints, and trade-offs. Final Report for the European Commission’s DG Environment, September 2011.
Golub, M., Martinov, M., Višković, M., Ðatkov, Ð., Veselinov, B., Bojić, S. (2013). Harvestable and on-field remaining crop residues of wheat and soybean. In Actual Tasks on Agricultural Engineering. Proceedings of the 41. International Symposium on Agricultural Engineering, Opatija, Croatia, 19-22 February 2013(pp. 301-312). University of Zagreb Faculty of Agriculture.
https://rwa.hr/sofru-vladarica-hrvatskih-polja (Accessed in October 2020) https://www.poljinos.hr/proizvodi-usluge/psenica-jecam/psenica/kraljica (Accessed in October 2020) http://meteo.hr (Accessed in October 2020) http://envi.azo.hr (Accessed in October 2020) Jaćimović, G., Aćin, V., Crnobarac, J., Latković, D., Manojlović, M. (2017). Efekti zaoravanja žetvenih
ostataka na prinos pšenice u dugotrajnom poljskom ogledu. Letopis naučnih radova, 41(1), 1-8. Karlen, D. L., Huggins, D. R. (2014). Crop residues. In: Karlen, D.L., editor. Cellulosic Energy
Cropping Systems. Hoboken, NJ: John Wiley & Sons. p. 131-148. https://core.ac.uk/download/pdf/188117187.pdf
Kretschmer, B., Allen, B., Hart, K. (2012). Mobilizing cereal straw in the EU to feed advanced biofuel production. Institute for European Environmental Policy.
Lafond, G. P., Stumborg, M., Lemke, R., May, W. E., Holzapfel, C. B., Campbell, C. A. (2009). Quantifying straw removal through baling and measuring the long‐term impact on soil quality and wheat production. Agronomy Journal, 101, 529-537.
Larsen, S. U., Bruun, S., Lindedam, J. (2012). Straw yield and saccharification potential for ethanol in cereal species and wheat cultivars. Biomass and bioenergy, 45, 239-250.
Perlack, R.D., Wright, L.L., Turhollow, A., Graham, R.L., Stokes, B., Erbach, D.C. (2005). Biomass as feedstock for a bioenergy and bioproducts industry: the technical feasibility of a billion-ton annual supply. Oak Ridge National Laboratory. http://www.osti.gov/bridge
Scarlat, N., Martinov, M., Dallemand, J.F. (2010). Assessment of the availability of agricultural crop residues in the European Union: potential and limitations for bioenergy use. Waste Management, 30, 1889–1897.
Skøtt, T. (2011). Straw to Energy: Status, Technologies, and Innovation in Denmark 2011. Innovation Network for Biomass, Agro Business Park A/S, Tjele, Denmark.
Ž. Jukić, I. Kovačev, L. Čoga, Z. Koronc, A. Matković, A. Zmaić
340
Suardi, A., Stefanoni, W., Bergonzoli, S., Latterini, F., Jonsson, N., Pari, L. (2020). Comparison between Two Strategies for the Collection of Wheat Residue after Mechanical Harvesting: Performance and Cost Analysis. Sustainability 2020, 12(12), 4936; https://doi.org/10.3390/su12124936
Tarkalson, D. D., Brown, B., Kok, H., Bjorneberg, D. L. (2009). Impact of removing straw from wheat and barley fields: a literature review. Better Crops, 93(3), 17-19.
Townsend, T., Sparkes, D., Wilson, P. (2017). Food and Bioenergy: Reviewing the Potential of Dual-Purpose Wheat Crops. Global Change Biology-Bioenergy. Doi:10.1111/gcbb.12302.https://onlinelibrary.wiley.com/doi/full/10.1111/gcbb.12 302
Vukadinović, V., Vukadinović, V. (2016). Tlo, gnojidba i prinos. Vlastita naklada, Osijek. http://tlo-i-biljka.eu/Gnojidba/eKnjiga_Tlo-gnojidba-prinos.pdf
White, E. M., Wilson, F. E. A. (2006). Responses of grain yield, biomass, and harvest index and their rates of genetic progress to nitrogen availability in ten winter wheat varieties. Irish Journal of Agricultural and Food Research, 85-101.
Zimmer, R., Košutić, S., Zimmer, D. (2009). Poljoprivredna tehnika u ratarstvu. Sveučilište J.J. Strossmayera u Osijeku, Poljoprivredni fakultet u Osijeku.
48th Symposium "Actual Tasks on Agricultural Engineering", Zagreb, Croatia, 2021
341
THE USE OF SENSOR TECHNOLOGY IN CROP PROTECTION
Davor PETROVIĆ*, Đuro BANAJ, Anamarija BANAJ, Dario KNEŽEVIĆ, Vjekoslav TADIĆ
*E-mail corresponding author: [email protected] University of Josip Juraj Strossmayer in Osijek, Faculty of Agrobiotechnical Sciences in Osijek,
Department for Agricultural Engineering and Renewable Energy Sources, Vladimira Preloga 1, 31000 Osijek, Croatia
ABSTRACT
The papers present a review of different sensory systems used in crop protection resulting in a decreased risk of environmental contamination, cost reduction and increased biological effect of pesticides. For this reasons, modern agricultural science and word trends begin to include sensor application in different ways of precision agriculture using ultrasonic, LIDAR and infrared sensors. In sensor approach, data collecting or GPS mapping it is not necessary, because real-time sensors read and accept the current situation in the field, and therefore determine the current dosage – variable rate technology (VRT). In modern agriculture sensors become a link between technological processes, agricultural machinery and computers. Daily development of sensors for agricultural processes will improve overall technology with reduced production costs, human labour and increased concern for agroecosystem.
Keywords: crop protection, field sprayers, orchard sprayers, sensors, variable rate
INTRODUCTION
Today’s agricultural production demands a uniform application of pesticides through the whole treated area, resulting in a decreased risk of environmental contamination, cost reduction and increased biological effect of pesticides. For this reasons, modern agricultural science and world trends begin to include sensor application in different ways of precision agriculture due to rational use of pesticides. In accordance, in future agricultural production and crop protection, sensors will become the main component for the collection and transmission of information (Petrović et al., 2018).
48. ACTUAL TASKS ON AGRICULTURAL ENGINEERING
Expert paper
D. Petrović, Đ. Banaj, A. Banaj, D. Knežević, V. Tadić
342
Devices for detection, registration and electromagnetic energy (own or reflected) measuring are called by a common name sensor. There are different types of sensors used in agriculture and they are divided according to: construction, the range of electromagnetic spectrum they can register, detection mode, registration mode and measurements, display of detected energy, etc. Sensors convert the measured physical quantity (height, width, volume, etc.) into analogue electrical (current, voltage, resistance) or digital information. The principle of sensor operation is based on the interaction with the surrounding objects, and they convert the reaction into an output signal with which they control the technological process. There are many physical phenomena, ways of transformation, as methods of energy conversion which can be applied in the sensor production. The measurement of nonelectric signals (optical, infrared, inductive, etc.) begins by conversion to electrical signals, after which processing is performed. The final choice of sensors application depends on the desired accuracy, so in cases where high accuracy is not required, it is not economical to use expensive and precise sensors.
Currently in serial production, or in experimental use, many producers of agricultural machinery are installing different systems of ultrasonic sensors on orchard sprayers primarily used for the detection and geometrical characterization of a canopy (Stajnko et al., 2012; Llorens et al., 2010, 2011; Doruchowski et al., 2011; Perry et al., 1995; Koch et al., 2000) or in field sprayer boom levelling (Chafer, 2020; Househam, 2020; Norac, 2020). The use of RGB cameras for weed control are still in early experimental development, while this system can be effective in weed volume estimation (Andujar et al., 2016).
SENSOR SYSTEMS
Ultrasonic sensors Very often in highly intensive fruit growing and viticulture, orchard sprayers are equipped
with ultrasonic sensors which provide data of canopy geometrics or even about of the canopy presence. That is why it is very important to know the geometric properties of permanent crops and the possibility of applying a variable rate dosage with respect to the optimum dose required to control pests, with the least impact on the environment. Due to this problem, research on new technologies and the possibility of reducing spray rates are intensified with the aim of rational use of pesticides, reduction of production costs and protection of the entire agro-ecosystem. Most commonly for this purpose ultrasonic sensors are used.
Ultrasonic sensors serve to determine the distance and function according to the principle of the difference in the time interval required for the ultrasonic wave to pass from the sensor to the detected object and back (Petrović et al., 2018). This type of sensors can be used in many different unfavourable weather conditions: high humidity, high/low temperature, fog or dirty air occurrences (Bernsten et al., 2006). Balsari and Tamagnone (1998) state that during the research, sensors have had the ability to recognize branch diameters of 3 to 4 cm, while the minimum void they could detect was 35 cm. Therefore, the most negative thing with ultrasonic sensors systems is approx. 30 cm minimum and approx. 100 m maximum range of measurement. On Figure 1 is shown the installation of ultrasonic sensors on Agromehanika orchard sprayer (Petrović, 2018).

The use of sensor technology in crop protection
343
Figure 1 Ultrasonic sensors on Agromehanika orchard sprayer
The great advantage of ultrasonic sensor usage in permanent crops is significant drift
reduction with pesticides savings up to 30 % (Petrović, 2018). Ultrasonic sensors in arable farming, have found their purpose in boom height levelling. With increased working width of sprayers, often sprayers boom touches the ground with part breakage and nozzle obstruction. To avoid this, ultrasonic sensors are installed on several places on the boom, to “soil copy” and to level the boom (Figure 2).
Figure 2 Ultrasonic sensor on sprayers boom (Source: Pepperl+Fuchs, 2020)
LIDAR sensors LIDAR (Light Detection and Ranging) is an optical measuring instrument for laser
dispersion which is repelled by very small particles in the Earth's atmosphere (aerosols, clouds, etc.), and then registered in an optical receiver. The principle of operation is based on changing the parameters of the optical signal with a change in physical size, and these sensors do not have galvanic or magnetic connections (Petrović, 2018). These sensors are often called optical sensors, and they are shown in Figure 3.
This type of sensor can be used under all conditions of a strong magnetic field, high temperature, electric noise and chemical corrosion, and are much more flexible and reliable than ultrasonic sensors. The bad sides are: the complexity of signal production and its processing, demand for the optical visibility between the receiver and the transmitter, and the sensitivity to mechanical vibration (Petrović, 2018). Their ability to quickly measure the

D. Petrović, Đ. Banaj, A. Banaj, D. Knežević, V. Tadić
344
distance between the sensors and the objects allows 3D images of the treetop shape (x, y and z axis) and applying the appropriate algorithms, allowing the digital display of the treetop structure (Rosell, et al., 2009).
Figure 3 LIDAR sensors on orchard sprayer (Osterman et al., 2014)
Infrared sensors Infrared sensors are one more type of active sensors, used to determine the treetop distance
and presence and they work on the transmitting and receiving light flux principle. This sensor type research has been being carried out in different directions, hence a system consisting of five, sprayer located, infrared sensors that recognize treetop presence, shape and density (Petrović, et al., 2018).
Table 1 Main characteristics of sensors (Petrović, et al., 2018)
Characteristics/Sensors LIDAR Ultrasonic Infrared
Range measurement: < 2 m o ++ +
Range measurement: 2 - 30 m ++ - +
Range measurement: 30 - 100 m + - - +
Angle measurement: < 10° ++ - ++
Angle measurement: < 30° ++ o ++
Angular Resolution ++ - ++
Direct Velocity Information - - o - -
Operation in rain o o o
Operation in Fog or Snow - + o
Operation if dirt on Sensor o ++ - -
Night vision n.a. n.a. ++ ++ ideally suited; + good performance; o possible, but drawbacks to be expected; − only possible with large additional effort; - - impossible; n.a. not applicable

The use of sensor technology in crop protection
345
By using this information from infrared sensors, manipulation of sprayer fan causes a decrease or increase of airflow. Based on this, we can save pesticides in vineyards up to 40% at the beginning of vegetation, with decreased drift up to 71% (Gregorio, et al., 2016). Some researches included the infrared sensors’ usage, mounted on the sprayer with an electrostatic spraying system. This system achieved pesticide savings up to 75% (Xiongkui, et al., 2011). An overview of the main characteristics of sensors is shown in Table 1.
VARIABLE RATE TECHNOLOGY (VRT)
Based on sensor technology, next task is to optimize input resources in agricultural production through variable rate of used pesticides, mineral fertilizers, irrigation, etc., according to current needs of specific permanent or arable crop. In sensor approach, data collecting or GPS mapping it is not necessary, because real-time sensors read and accept the current situation in the field, and therefore determine the current dosage. The application of new technologies in agriculture is growing rapidly as the need for a more precise application leads to a reduction in the use of chemical products (pesticides and mineral fertilizers), and remarkable savings are achieved by taking care of the ecological aspect, i.e the sustainability of agricultural production. The best example of the application of variable rate technology (VRT) in agriculture is the use of different sensory systems for crop protection in permanent crops. The use of different sensor types (ultrasonic, infrared and optical) through the application of variable rate technology represents the future of crop protection for permanent crops in mind of ecological, economic and exploitation improvement (Petrović, et al., 2018).
CONCLUSION
With the overall technological progress of all worlds trends, agricultural production also is galloping with great progress, connecting all technical sciences in multidisciplinary unity. Sensors are the main example where is network represented between used materials with micromechanics and microelectronics. Sensors become a link between technological processes, agricultural machinery and computers. Due to this, the daily development of sensors for agricultural machinery is noticeable. The sensors’ cost price decreases as well, which is why they become more accessible for use on a wide range of agricultural machines and systems. Currently in wide use for variable rate technology are ultrasonic sensors installed on orchard sprayers in a function of canopy detection and on field sprayers in a function of boom levelling, while LIDAR and infrared sensors are still in experimental stages of development.
REFERENCES
Andujar, D., Dorado, J., Fernandez-Quintnilla, C., Ribeiro, A. (2016). An approach to the use of depth cameras for weed volume estimation. Sensors 16(7), 972.
Balsari, P., Tamagnone, M. (1998). An ultrasonic airblast sprayer. Proceedings of the International Conference on Agricultural Engineering, 585-586.
Berntsen, J., Thomsen, A., Schelde, K., Hansen, O. H., Knudsen, L., Broge, N., Hougaard, H., Hørfarter, R. (2006). Algorithms for sensor-based redistribution of nitrogen fertilizer in winter wheat. Precision Agriculture, 7, 65-83.

D. Petrović, Đ. Banaj, A. Banaj, D. Knežević, V. Tadić
346
Chafer (2020). Norac boom levelling system, (https://www.cropsprayers.com/36m-crop-sprayer-with-the-latest-norac-boom-levelling-system/). Accessed: November 2020.
Doruchowski, G., Swiechowski, W., Godyn, A., Holownicki, R. (2011). Automatically controlled sprayer to implement spray drift reducing application strategies in orchards, Journal of Fruit and Ornamental Plant Research 19, 175-182.
Gregorio, E., Torrent, X., Planes de Marti, S., Solanelles, F., Sanz, R., Rocadenbosch, F., Masip, J., Ribes-Dasi, M., Rosell-Polo, J. (2016). Measurement of spray drift with a specifically designed lidar system. Sensors, 16(4), 499.
Househam (2020). Advance Sprayers, Healthier crops – Norac boom levelling, (https://househamsprayers.co.uk/technologies/norac-boom-levelling-2/) Accessed: November 2020.
Koch, H., Weisser, P., Cross, J., Gilbert, A., Glass, C., Taylor, W., Walklate, P., Western, N. (2000). Sensor equipped orchard spraying-efficacy, savings and drift reduction. Pesticide application, University of Surrey, Guildford, UK, 17-18, 357-362
Llorens, J., Gil, E., Llop, J., Escola, A. (2010). Variable rate dosing in precision viticulture: Use of electronic devices to improve application efficiency, Crop Protection 29, 239-248.
Llorens, J., Gil, E., Llop, J. (2011). Ultrasonic and Lidar sensors for electronic canopy characterization in vineyards: Advances to improve pesticide application methods. Sensors 11(2), 2177-2194.
NORAC (2020). UC4+ Spray Height Control System, Hardi AutoHeight or AutoSlant End-User Manual, (http://www.norac.ca/media/shared_language/en/manual/UC4+BC+HD4-INSTEe.pdf). Accessed: November 2020.
Osterman, A., Hočevar, M., Godeša, T. (2014). LIDAR-based control of automated orchard sprayer. Proceedings International Conference of Agricultural Engineering Ag-Eng, Zurich, C0223.
Pepperl + Fuchs (2020). Detecting Boom Height on Agricultural Machine, (https://www.pepperl-fuchs.com/global/en/22494.htm). Accessed: November 2020.
Perry, R., Cordero, R. (1995). Sensor controlled orchard sprayers. Proceedings of the National Conference on Pesticide Application Technology, Guelph, 164-171.
Petrović, D., Jurišić, M., Tadić, V., Plaščak, I., Barač, Ž. (2018). Different sensor systems for the application of variable rate technology in agriculture. Tehnički Glasnik 12(3), 188-195.
Petrović, D. (2018). The relation between selective and conventional spraying and their influence on spray deposit and drift. PhD thesis, University of J.J. Strossmayer in Osijek, Faculty of Agrobiotechnical Sciences in Osijek
Rosell, J. R., Sanz, R., Llorens, J., Arnó, J., Escolà, A., Ribes-Dasi, M., Masip, J., Camp, F., Gràcia, F., Solanelles, F., Pallejà, T., Val, L., Planas, S., Gil, E., Palacín, J. (2009). A tractor-mounted scanning LIDAR for the non-destructive measurement of vegetative volume and surface area of tree-row plantations: A comparison with conventional destructive measurements. Biosystems Engineering, 102(2), 128-134.
Stajnko, D., Berk, P., Lešnik, M., Jejčič, V., Lakota, M., Štrancar, A., Hočevar, M., Rakun, J. (2012). Programmable ultrasonic sensing system for targeted spraying in orchards. Sensors, 12, 15500-15519.
Xiongkui, H., Aijun, Z., Yajia, L., Jianli, S. (2011). Precision orchard sprayer based on automatically infrared target detecting and electrostatic spraying techniques. International
Journal of Agricultural and Biological Engineering, 4, 35-40.
48th Symposium "Actual Tasks on Agricultural Engineering", Zagreb, Croatia, 2021
347
PLANT DIFFERENTIATION WITH TRUECOLOR ARRAYS FOR ONLINE PRECISION PLANT
PROTECTION Andreas CHRIST*, Oliver SCHMITTMANN, Peter SCHULZE LAMMERS
*E-mail of corresponding author: [email protected] Institut für Landtechnik, Nußallee 5, 53115 Bonn, Germany
ABSTRACT
The reduction of pesticides in agriculture is being driven forward due to negative environmental impacts, high costs, political requirements, and declining social acceptance. Depending on weed population, a plant-specific application can save up to 90 % herbicides.
Current studies of digital plant recognition mostly focus on camera-based systems, a technology that is usually associated with significant limitations in terms of working speed and disruptive impacts. In contrast to currently available techniques, arrays suit for high spatial resolution and promise significant progress for specific weed detection. In our study, the array includes five single sensors with lenses each, as well as TrueColor (CIELab) and IR diodes as defined active light sources. With a detection width of 50 cm, the array fits to the spray width of a conventional sprayer nozzle. This compact technology can be extended to any working width by cascading them. Due to the fast signal processing, the sensor principle meets the high demands on working speed, spatial resolution and price structure of practical plant recognition systems.
A database of reflection properties (L, a, b, IR) is build up in greenhouse and field trials. A spectrometer was used to reference the reflection values of the sensor array. According to our study, the sensor array can detect weeds from a minimum size of 125 mm. To underline the sensitivity of the array, the increase of leaf area and IR value of the array correlate with R² = 0.97 for the plant development of daisy (Bellis perennis L.) from cotyledon- to three-leaf-stage. The differentiation of sugar beet (Beta vulgaris L.) and cleaver (Galium aparine L.), as well as daisy, is clearly possible for different growth stages using the CIELab color space sensor.
Keywords: TrueColor Sensors, Pesticide Reduction, Plant Classification, Weed Management
48. ACTUAL TASKS ON AGRICULTURAL ENGINEERING
Original scientific paper
A. Christ, O. Schmittmann, P. Schulze Lammers
348
INTRODUCTION
In the following, fundamental relationships of electromagnetic radiation are first explained, which forms the basis for the reflection behavior of plants and their differentiation. Subsequently, the advantages and disadvantages of color spaces recorded using sensor arrays are presented and the objectives of the present study on plant differentiation are explained.
A prerequisite for the representation of color spaces is visible light. Its electromagnetic oscillations have wavelengths of about 380 nm to 780 nm. This wavelength range is located between ultraviolet (UV) and infrared (IR) and has only a narrow frequency range compared to the rest of the electromagnetic spectrum (Smaniotta, 2006). Color is neither a property nor the condition of an object, but a subjective sensory perception. For this reason, the detection and display of colored objects depend on environmental conditions and lighting (Marggraf, 2019). Technical measuring methods serve to convert subjectively perceived light into physical quantities. In photography as well as in spectroscopy the influence of the illumination spectrum is eliminated by white balance (Marggraf, 2019). Color values in different display modes take brightness and saturation into account in different ways, which will be discussed in more detail below.
XYZ tristimulus values The light-sensitive cones on the retina of the human eye react sensitively to the incident
light to the primary colors red, green and blue, which are known as raw color values (Gegenfurtner, 2012). Depending on the wavelength of the imitating light, mixed color results from the tristimulus values X, Y, Z. With the exception of the raw color value X(λ), the gradients of Y(λ) and Z(λ) have only one peak each. The raw color value Z has a maximum intensity of around 450 nm, whereas the characteristic wavelength range for the maximum intensity of the Y tristimulus is 550 nm (Lang, 1998).
CIELab color space In the color system developed in 1931 by the CIE (Commission Internationale de
l'Éclairage), the color space is defined by a three-dimensional coordinate system. The luminance L (brightness) is displayed on the applicate, with values between L = 0 (black) and L = 100 (diffuse white). The abscissa has a value range from a = -128 (green) to a = +127 (red). Correspondingly, the opposite colors from b = -128 (blue) to b = +127 (yellow) are plotted on the ordinate (DIN Deutsches Institut für Normung e.V.). In contrast to the tristimulus values X, Y and Z, this type of color representation differs in the consideration of brightness and is, therefore, more similar to the color perception of the human eye (Ganesan et al. 2010). From the CIE's 1931 procedure for measuring the color valence of a light source, statements can be made about the brightness sensitivity of an observer.
Ambient light has a high influence on field measurements. The advantage of using the CIELab color space is the consideration of the brightness through the L-channel. Fluctuations in brightness result from characteristic leaf positions of the examined plants and are reflected by the L-value. Thus, the color values in the a- and b-channel are recorded independent of ambient light and represent the true color values of the test objects to be examined (Schmittmann and Schulze Lammers 2017).

Plant differentiation with truecolor arrays for online precision plant protection
349
Systematization of plant-specific applications and their use in practice Plant differentiation places minimum demands on the resolution accuracy of the used
sensor array. The differentiation of covered to uncovered soil, as well as the influence of the background has been investigated in detail in past studies (Bioucas-Dias et al. 2012) (Jacobi et al. 2006) (Ma et al. 2014) (Schmittmann and Schulze Lammers 2017). The challenge with all technical solutions in the field of plant detection is a certain minimum size of the objects to generate a sufficient contrast between plant and background. Limitations arising from this when using the present TrueColor sensor array are discussed in the first part of the results.
Plant differentiation implies a distinction between crop and weed plants. While in row crops the seed is deposited by singling organs in predetermined rows (Schmittmann et al. 2010), the seed is deposited in area crops by drill sowing without singling technology. This results in different demands on the technique for plant differentiation. Systems such as AmaSelect (Amazonen-Werke H. Dreyer, Hasbergen-Gaste, Deutschland), Selective Spraying (GeoLine, Reggio Emilia, Italien), or See & Spray (BlueRiver, Sunnyvale, Kalifornien) are able to differentiate weeds from crops in row cultures. In geo-referenced sowing, the position of the planted rows is known. If there are plants with a certain deviation near the deposited rows, the evaluation algorithm assigns them to the crop plants. Registered plants between the rows are thus directly classified as weeds, only weeds in the row must be differentiated.
For weed control in row crops, mechanical measures in the form of sensor-controlled hoes are used in addition to the above-mentioned techniques for selective pesticide application. The direction of movement of the actuators can be used as a distinguishing feature. All mentioned hoeing tools, the Robocrop (Garford, Peterborough, Great Britain), as well as the IC-Weeder (Steketee, Stad aan 't Haringvliet, Netherlands), and the actuators of the Robovator system (F. Poulsen Engineering, Hvalsø, Denmark) have a vertical rotation axis. The only difference is the hydraulic or electric drive. Across manufacturers, the soil between the rows is treated with conventional hoeing tools.
The Robocrop system has disc-shaped rotary chopping tools that are equipped with a bulge. Detecting a crop plant, the chopping tool is activated and the disc rotates around the crop in accordance with the forward speed. The image processing technology includes an RGB camera with a resolution of 320 x 240 pixels, which communicates with the on-board computer via a serial interface. The weed reduction of this system is evaluated by means of a concentric circle with radius r = 240 mm around the crop plant. An algorithm based on two-dimensional wavelet transformations is used to detect the individual plant (Schmeelk 2002). The reduction rate is calculated from the number of weeds before the crossing and the number of plants that have reappeared within two weeks. Depending on the weather conditions, the weed reduction in this system is between 66 % and 74 %. (Tillett et al. 2008).
With the camera-controlled IC-Weeder chipping system, sickle-shaped rotary chipping tools are used for mechanical weed control in the row, similar to the Robocrop. The main distinguishing features are the position and shielding of the camera against environmental influences. They use one RGB camera per row, which is shielded from natural sunlight by housing and illuminated by a white light-emitting diode (LED). The image processing is based on Fast Fourier Transformations (FFT) (Bontsema et al. 1991). The system offers possibilities for crop documentation by recording the number of detected weeds, measuring the degree of green coverage, and determining color differences within the crop (Hemming et al. 2018).

A. Christ, O. Schmittmann, P. Schulze Lammers
350
The company F. Poulsen has developed the third camera-controlled hoe under the brand name Robovator. Analog to the IC-Weeder, they installed one camera per row. In this system, the hoeing tools are designed in the form of curved round bars. Two round rods per row are moved hydraulically out of the row when the system detects a useful plant. To distinguish between weeds and crops, different reflective properties are used due to differences in size. For this reason, either different growth stages or differences in plant-specific size between weeds and crops are necessary conditions for the use of this chopping technique. This approach is also adopted in the present study and is explained in more detail in Results and Discussion. Their influence on yield development as well as the comparison with manual weed control and herbicide application is investigated in (Lati et al. 2016).
By contrast, the camera system from Bilberry (Gentilly, France) is also able to identify weeds not only in row crops but also in field crops. Up to now, this system has mainly been used in grassland, for example for the detection of sorrel (Bilberry 2020). The advantage here is the striking appearance of broad-leaved dock plants (Rumex L.) in narrow-leaved grass (Schmittmann and Schulze Lammers 2017).
The appearance of the plants has a significant influence on infrared value, luminance as well as on true color values. Therefore, this study describes the developed TrueColor sensor array with visual and NIR signal outputs. The aim of the present investigation is the classification of the reflective properties of crops and weeds. The suitability of the individual reflection channels is evaluated by reference measurements using a spectrometer. These investigations serve as a basis for practical field applications, where spraying of plant protection products is applied online.
MATERIALS AND METHODS
TrueColor sensor array The measuring method of the used sensor array is based on the principle of reflection
measurement of true color values (Schmittmann and Schulze Lammers, 2017). This was developed in array design under the type designation PR0262 together with the company Premosys GmbH (Kalenborn-Scheuern, Germany). Five individual sensors, each with its light source and a segment width of 10 cm, are arranged next to each other (see Figure 1). The frequency-controlled light sources perform a constant light-dark adjustment, which is necessary for daylight-independent color measurement of the sensor. The system is supplied with a 24 V DC voltage source.
LED light sources with a color temperature of 5700 Kelvin (daylight white) form the active illumination of the measuring objects for the acquisition of the true color values. Furthermore, this sensor is equipped with an infrared (IR) channel which is sensitive at a wavelength of λ = 850 nm. This results in four output quantities per sensor with the tristimulus values X, Y, Z and IR = 850 nm. With a housing width of 492 mm, the detection range of an array corresponds to the usual nozzle distance range for field sprayers of 500 mm. In practical application, an array can thus control a single nozzle valve. So-called master arrays can be connected to the computer via a communication cable with USB interface. A master can be connected with up to four slaves and transmit the recorded reflection data to the computer.

Plant differentiation with truecolor arrays for online precision plant protection
351
Figure 1 Arrangement of the single sensors/ light sources of the used TrueColor sensor
array With the software developed by Institut für Landtechnik, the measured reflection values
can be converted into different output options. The measured data can be graphically displayed and stored. Within the scope of these investigations, the color values were converted from the tristimulus values X, Y, Z into the CIELab color space and stored as a .csv file together with the recorded IR channel.
Spectrometer Parallel to the color measurements using the TrueColor sensor array, a spectrometer
determined the spectral signature of the examined plant material. These data serve as a reference for the validation of the results from the tested sensor array. To cover as broad spectrum as possible and to detect differences between weed and arable crop, two systems from OceanOptics (Orlando FL, USA) were used, whose measurement methodology is based on the reflection measurement principle.
In the wavelength range between 188 nm and 1026 nm the Flame-S-XR1-ES model was used. With a resolution of 0.5 nm, spectral results are obtained from the UV to the VIS to the NIR range. With a wavelength range from 898 nm to 2514 nm and a resolution of 3 nm, the detectable range of OceanOptics' NIRQuest512-2.5 extends from the NIR to the MIR spectral range. An overlapping of the two spectrometers ensures the lowest possible losses in the marginal area of the systems. The optical component ISP-REF can be used with both spectrometers. The focus of these investigations is on the visual and near infrared wavelength range. Due to its design as an integrating sphere with Helmholtz geometry, the optics has a very high reflectance of more than 98 % in this range. From a circular cross-section with an area of 78.5 mm², the light from the integrating sphere strikes the target. The configuration of the spectrometers as well as the operation during the measuring process is accomplished with the software OceanView, likewise by the company OceanOptics.
Camera Technology The image capture was done with a webcam type C922 PRO from Logitech (Lausanne,
Switzerland) and a resolution of 1080 x 720 pixels. From this, the leaf area was determined with the help of the software ImageJ (Public Domain).
75 m
m
Sensors
LED light source
Segment
492 mm
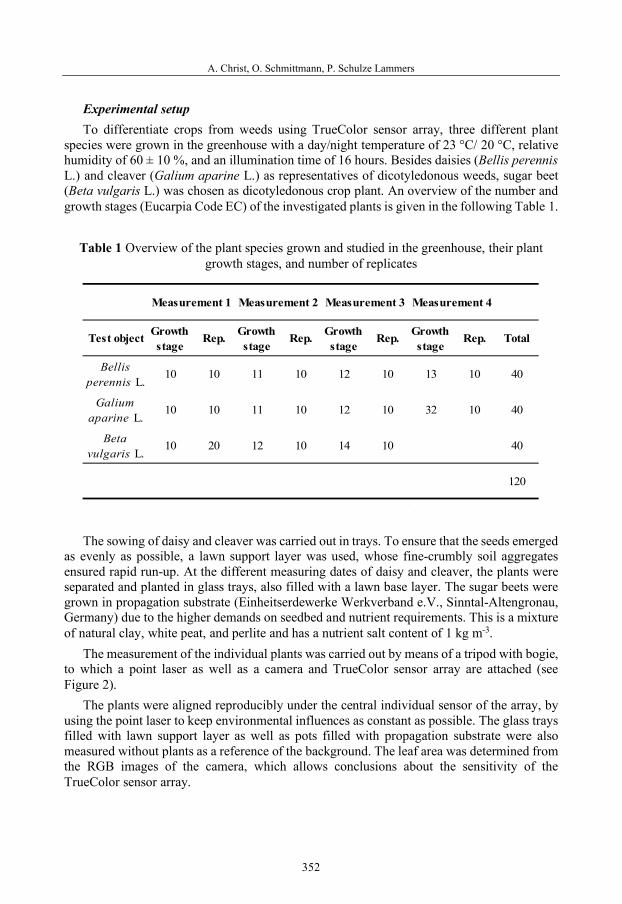
A. Christ, O. Schmittmann, P. Schulze Lammers
352
Experimental setup To differentiate crops from weeds using TrueColor sensor array, three different plant
species were grown in the greenhouse with a day/night temperature of 23 °C/ 20 °C, relative humidity of 60 ± 10 %, and an illumination time of 16 hours. Besides daisies (Bellis perennis L.) and cleaver (Galium aparine L.) as representatives of dicotyledonous weeds, sugar beet (Beta vulgaris L.) was chosen as dicotyledonous crop plant. An overview of the number and growth stages (Eucarpia Code EC) of the investigated plants is given in the following Table 1.
Table 1 Overview of the plant species grown and studied in the greenhouse, their plant
growth stages, and number of replicates
Test object Growth stage
Rep. Growth stage
Rep. Growth stage
Rep. Growth stage
Rep. Total
Bellis perennis L.
10 10 11 10 12 10 13 10 40
Galium aparine L.
10 10 11 10 12 10 32 10 40
Beta vulgaris L.
10 20 12 10 14 10 40
120
Measurement 1 Measurement 2 Measurement 3 Measurement 4
The sowing of daisy and cleaver was carried out in trays. To ensure that the seeds emerged
as evenly as possible, a lawn support layer was used, whose fine-crumbly soil aggregates ensured rapid run-up. At the different measuring dates of daisy and cleaver, the plants were separated and planted in glass trays, also filled with a lawn base layer. The sugar beets were grown in propagation substrate (Einheitserdewerke Werkverband e.V., Sinntal-Altengronau, Germany) due to the higher demands on seedbed and nutrient requirements. This is a mixture of natural clay, white peat, and perlite and has a nutrient salt content of 1 kg m-3.
The measurement of the individual plants was carried out by means of a tripod with bogie, to which a point laser as well as a camera and TrueColor sensor array are attached (see Figure 2).
The plants were aligned reproducibly under the central individual sensor of the array, by using the point laser to keep environmental influences as constant as possible. The glass trays filled with lawn support layer as well as pots filled with propagation substrate were also measured without plants as a reference of the background. The leaf area was determined from the RGB images of the camera, which allows conclusions about the sensitivity of the TrueColor sensor array.
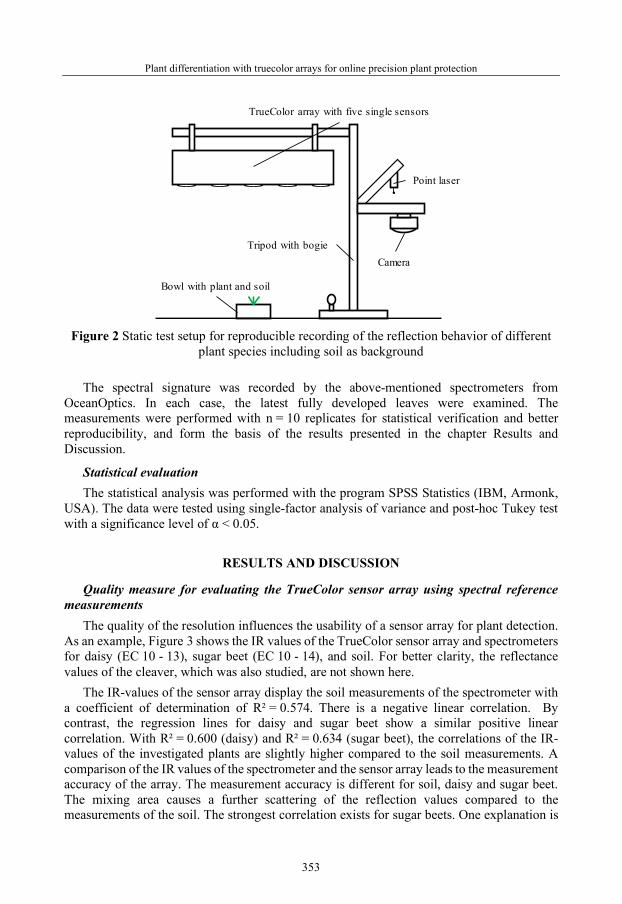
Plant differentiation with truecolor arrays for online precision plant protection
353
Figure 2 Static test setup for reproducible recording of the reflection behavior of different
plant species including soil as background The spectral signature was recorded by the above-mentioned spectrometers from
OceanOptics. In each case, the latest fully developed leaves were examined. The measurements were performed with n = 10 replicates for statistical verification and better reproducibility, and form the basis of the results presented in the chapter Results and Discussion.
Statistical evaluation The statistical analysis was performed with the program SPSS Statistics (IBM, Armonk,
USA). The data were tested using single-factor analysis of variance and post-hoc Tukey test with a significance level of α < 0.05.
RESULTS AND DISCUSSION
Quality measure for evaluating the TrueColor sensor array using spectral reference measurements
The quality of the resolution influences the usability of a sensor array for plant detection. As an example, Figure 3 shows the IR values of the TrueColor sensor array and spectrometers for daisy (EC 10 - 13), sugar beet (EC 10 - 14), and soil. For better clarity, the reflectance values of the cleaver, which was also studied, are not shown here.
The IR-values of the sensor array display the soil measurements of the spectrometer with a coefficient of determination of R² = 0.574. There is a negative linear correlation. By contrast, the regression lines for daisy and sugar beet show a similar positive linear correlation. With R² = 0.600 (daisy) and R² = 0.634 (sugar beet), the correlations of the IR-values of the investigated plants are slightly higher compared to the soil measurements. A comparison of the IR values of the spectrometer and the sensor array leads to the measurement accuracy of the array. The measurement accuracy is different for soil, daisy and sugar beet. The mixing area causes a further scattering of the reflection values compared to the measurements of the soil. The strongest correlation exists for sugar beets. One explanation is
Point laser
TrueColor array with five single sensors
Tripod with bogie
Bowl with plant and soil
Camera

A. Christ, O. Schmittmann, P. Schulze Lammers
354
the sensitivity of NIR radiation to plant cell compartments (Nelson and Yocum 2006). In contrast to daisy plants, sugar beet plants have significantly larger leaf areas in the same growth stage (see Figure 5). The accuracy of the sensor array increases with the increasing leaf area.
Figure 3 Correlation between the IR values of the TrueColor sensor array and spectrometer
for daisy, sugar beet and soil
Studies on the resolution accuracy of the TrueColor sensor array Figure 4 compares the measurement results of the spectrometer and the TrueColor sensor
array. As an example, the measurements on daisies (Bellis perennis L.) and sugar beets (Beta vulgaris L.) at the growth stages EC 10 to EC 14 are compared as well as the reflectance values of the soil. The type of diagram was chosen so that no distortion of the column diagrams results from the range of values on the ordinate. Thus, the actual column heights between spectrometer and array can be compared. This graph shows the influence of the blind range of the sensor on the possible applications for plant detection. Blind range means the reflection values of plants that are within the standard deviation around the arithmetic mean of the soil reflection. In this range, the reflection values of plant and soil do not differ significantly, so a differentiation is not effectively possible.
While the reflection values of the IR channel (λ = 850 nm) recorded by the sensor array only differ from the background (ground reflection) in daisies with growth stage EC 13 (3rd leaf fully unfolded), detection by the spectrometer is possible from EC 11 (1st leaf fully unfolded) onwards. A differentiation between the individual growth stages of daisy is possible by IR values of the spectrometer. The differentiation of daisy (EC 13) and sugar beet (EC 14) is possible by comparing the L-, a- or b-channel. All of these reflection channels distinguish strongly for higher growth stages. This fact is an important advantage compared with the spectrometer. Not only the color of leaves, but also reflection properties of the mixed area are important for plant classification. Therefore, the optical element of spectrometer is not
Daisy:y = 0.672x – 41.265
R² = 0.600
Sugar beet:y = 0.739x – 47.030
R² = 0.634
Soil:y = -0.830x + 86.288
R² = 0.574
12
14
16
18
20
22
24
75 80 85 90 95
IR a
rray
[-]
IR spectrometer [-]
GB IR-Kanal
ZR IR-Kanal
Boden IR-Kanal
Linear (GB IR-Kanal)Linear (ZR IR-Kanal)Linear (Boden IR-Kanal)
Daisy: IR channel
Sugar beet: IR channel
Soil: IR channel
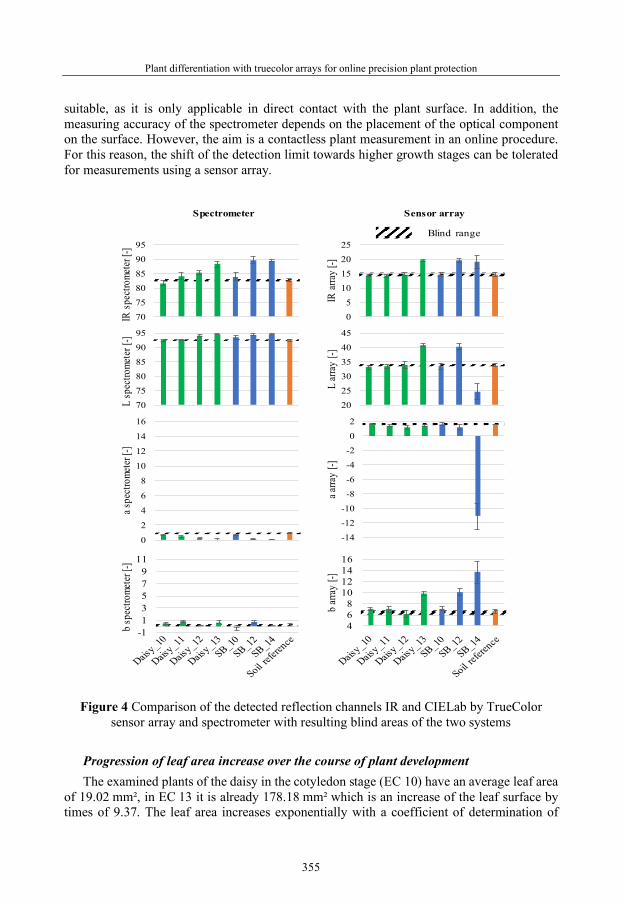
Plant differentiation with truecolor arrays for online precision plant protection
355
suitable, as it is only applicable in direct contact with the plant surface. In addition, the measuring accuracy of the spectrometer depends on the placement of the optical component on the surface. However, the aim is a contactless plant measurement in an online procedure. For this reason, the shift of the detection limit towards higher growth stages can be tolerated for measurements using a sensor array.
Figure 4 Comparison of the detected reflection channels IR and CIELab by TrueColor sensor array and spectrometer with resulting blind areas of the two systems
Progression of leaf area increase over the course of plant development The examined plants of the daisy in the cotyledon stage (EC 10) have an average leaf area
of 19.02 mm², in EC 13 it is already 178.18 mm² which is an increase of the leaf surface by times of 9.37. The leaf area increases exponentially with a coefficient of determination of
707580859095
IR s
pect
rome
ter[
-]
05
10152025
IR a
rray
[-]
202530354045
L ar
ray
[-]
707580859095
L sp
ectro
mete
r[-]
0
2
4
6
8
10
12
14
16
a spe
ctro
mete
r[-]
-14
-12
-10
-8
-6
-4
-2
0
2
a arra
y[-]
Blind range
Spectrometer Sensor array
468
10121416
b ar
ray
[-]
-113579
11
b sp
ectro
mete
r[-]
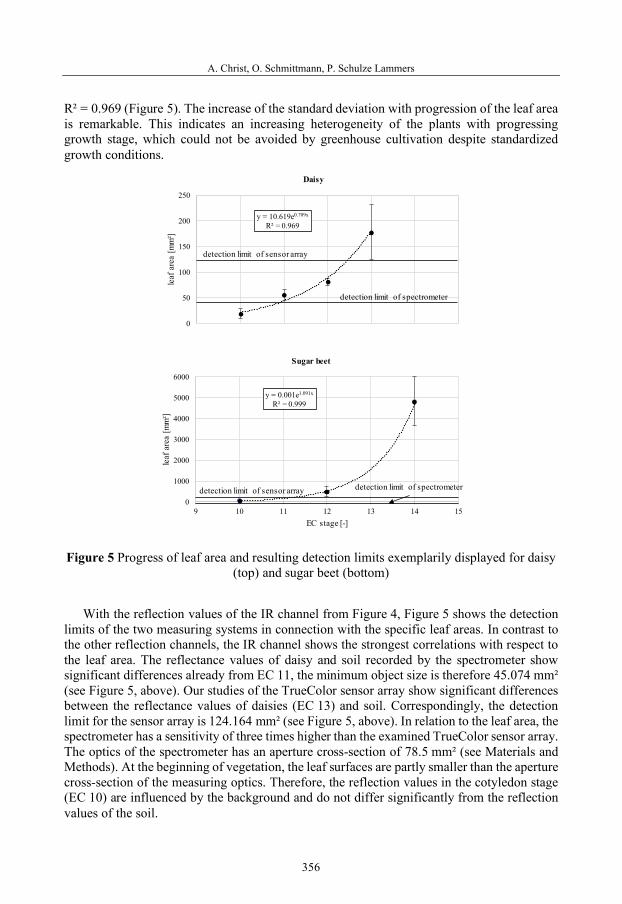
A. Christ, O. Schmittmann, P. Schulze Lammers
356
R² = 0.969 (Figure 5). The increase of the standard deviation with progression of the leaf area is remarkable. This indicates an increasing heterogeneity of the plants with progressing growth stage, which could not be avoided by greenhouse cultivation despite standardized growth conditions.
Figure 5 Progress of leaf area and resulting detection limits exemplarily displayed for daisy
(top) and sugar beet (bottom)
With the reflection values of the IR channel from Figure 4, Figure 5 shows the detection limits of the two measuring systems in connection with the specific leaf areas. In contrast to the other reflection channels, the IR channel shows the strongest correlations with respect to the leaf area. The reflectance values of daisy and soil recorded by the spectrometer show significant differences already from EC 11, the minimum object size is therefore 45.074 mm² (see Figure 5, above). Our studies of the TrueColor sensor array show significant differences between the reflectance values of daisies (EC 13) and soil. Correspondingly, the detection limit for the sensor array is 124.164 mm² (see Figure 5, above). In relation to the leaf area, the spectrometer has a sensitivity of three times higher than the examined TrueColor sensor array. The optics of the spectrometer has an aperture cross-section of 78.5 mm² (see Materials and Methods). At the beginning of vegetation, the leaf surfaces are partly smaller than the aperture cross-section of the measuring optics. Therefore, the reflection values in the cotyledon stage (EC 10) are influenced by the background and do not differ significantly from the reflection values of the soil.
y = 10.619e0.709x
R² = 0.969
0
50
100
150
200
250
9 10 11 12 13 14 15
leaf
area
[mm
²]
EC-Stadium [-]
Daisy
detection limit of sensor array
detection limit of spectrometer
y = 0.001e1.091x
R² = 0.999
0
1000
2000
3000
4000
5000
6000
9 10 11 12 13 14 15
leaf
area
[mm
²]
EC stage [-]
Sugar beet
detection limit of sensor array detection limit of spectrometer

Plant differentiation with truecolor arrays for online precision plant protection
357
Plant differentiation within one growth stage Plant detection is not only dependent on the growth stage but requires a plant species-
specific approach, as shown in Figure 6 using sugar beets and cleaver. While the reflectance values recorded by the spectrometer for both sugar beets and cleaver already differ from the soil in EC 10, the TrueColor sensor array only succeeds in doing so for cleaver. This is due to the different leaf surfaces of the arable crops at the same EC stage.
Figure 6 Dependence of the detection capacity of different plant species on the example of sugar beet (Beta vulgaris L.) and cleaver (Galium aparine L.) in EC 10 at a wavelength of
λ = 850 nm
While the average leaf area of cleaver in EC 10 is already 202.71 mm², it is only 61.37 mm² for sugar beets. Thus, it is primarily the leaf area rather than the characteristic spectrum of the individual plants that influence the detection capacity of the sensor array. Weed control measures can thus make use of significant differences in size between crop and weed, as it is the case with sugar beet and cleaver. A plant differentiation is not necessary if a suitable threshold value is designed for this application.
CONCLUSIONS
In this study, fundamentals for plant classification in the cultivation of sugar beet by a low cost CIELab sensor were studied. The reflection properties from a combination of the CIELab color space and an IR channel (λ = 850 nm) cover the wavelength range of the visual and near-infrared spectrum. The test setup served as a basic investigation of the general suitability of a TrueColor sensor array for selective herbicide treatment in sugar beet cultivation. In contrast to the practical application, the described measurements were carried out under controlled conditions without dynamic influence. The evaluation of the sensor's suitability was based on reference measurements using a spectrometer. With correlations of up to 0.634, the array measurements map the reflection values of the spectrometer. The IR channel shows particularly good properties with regard to differentiation between crop and weed plants at the cotyledon stage. Taking the L- or a-channel into account, plant differentiation in later growth stages is also possible.
0
5
10
15
20
IR v
alue
[-]
ZR_10 KL_10 Bodenreferenz
70
75
80
85
90
IR v
alue
[-]
ZR_10 KL_10 Bodenreferenz
ab
c
aab
Spectrometer Sensor array
SB_10 CL_10 Soil reference SB_10 CL_10 Soil reference
A. Christ, O. Schmittmann, P. Schulze Lammers
358
The objective of classifying the reflection properties of different plant material aiming at creation of a database was achieved. The next steps are the extension of the plant species and the implementation of the sensor array in an experimental field vehicle. The results of the present investigation will be incorporated into the testing of the functional model over the vegetation period of 2021.
ACKNOWLEDGEMENTS
We would like to thank the Deutsche Bundesstiftung Umwelt (DBU) and the Federal Ministry of Education and Research (BMBF) for funding this project. In particular, our appreciation goes to Premosys GmbH (Kalenborn-Scheuern, Germany) for their technical support during the development of the tests and the staff of the Dienstleistungsplattform Pflanzenversuche for facilitating the experiments.
REFERENCES
Bilberry. (2020). Intelligent Agriculture Technology for a better Environment. https://bilberry.io.
Bioucas-Dias, J. M., Plaza, A., Dobigeon, N., Parente, M., Du, Q., Gader, P., et al. (2012). Hyperspectral Unmixing Overview: Geometrical, Statistical, and Sparse Regression-Based Approaches. IEEE Journal of Selected Topics in Applied Earth Observations and Remote Sensing, 5, 354–379. doi:10.1109/JSTARS.2012.2194696.
Bontsema, J., Grift, T., & Pleijsier, K. (1991). Mechanical weed control in sugar beet growing: The detection of a plant in a row. IFAC Mathematical and Control Applictions in Agriculture and Horticulture, 24, 207–211. doi:10.1016/B978-0-08-041273-3.50041-0.
DIN Deutsches Institut für Normung e.V. DIN EN ISO 11664-4:2012-06, Farbmetrik_- Teil_4: CIE_1976 L*a*b* Farbenraum (ISO_11664-4:2008); Deutsche Fassung EN_ISO_11664-4:2011. Berlin: Beuth Verlag GmbH. doi:10.31030/1892692.
Ganesan, P., Rajini, V., & Rajkumar, R. I. (Eds.). (2010) 2010 International Conference on Emerging Trends in Robotics and Communication Technologies (INTERACT 2010), Chennai, India, 12/3/2010 - 12/5/2010. Piscataway, NJ: IEEE.
Gegenfurtner, K. R. (2012). Farbwahrnehmung und ihre Störungen. In H.-O. Karnath & P. Thier (Eds.), Kognitive Neurowissenschaften (pp. 45–52). Berlin, Heidelberg: Springer Berlin Heidelberg.
Hemming, J., Jong, H. de, Struik, L., van Meer, J., & van Henten, E. J. (Eds.). (2018) Proceedings of the European Conference on Agricultural Engineering AgEng2018 : Wageningen University & Research.
Jacobi, J., Backes, M., Kühbauch, W., & Plümer, L. (2006). Identifikation von Unkräutern in Zuckerrüben anhand spektraler Refelxionsunterschiede in Fernerkundungsaufnahmen. Journal of Plant Diseases and Protection, 241-248.
Lang, H. (1998). Color Displays. In K. Nassau (Ed.), Color for science, art and technology (Vol. 1, pp. 423–472, Azimuth (Amsterdam, Netherlands), v. 1). Amsterdam: Elsevier.
Lati, R. N., Siemens, M. C., Rachuy, J. S., & Fennimore, S. A. (2016). Intrarow Weed Removal in Broccoli and Transplanted Lettuce with an Intelligent Cultivator. Weed Technology, 30, 655–663. doi:10.1614/WT-D-15-00179.1.

Plant differentiation with truecolor arrays for online precision plant protection
359
Ma, W.-K., Bioucas-Dias, J. M., Chan, T.-H., Gillis, N., Gader, P., Plaza, A. J., et al. (2014). A Signal Processing Perspective on Hyperspectral Unmixing: Insights from Remote Sensing. IEEE Signal Processing Magazine, 31, 67–81. doi:10.1109/MSP.2013.2279731.
Marggraf, U. (2019). Ermittlung der Prozessqualität bei der Vermischung der Wirkstoffe in Pflanzenschutzspritzen (1st ed., Forschungsberichte aus dem Institut für mobile Maschinen und Nutzfahrzeuge). Düren: Shaker.
Nelson, N., & Yocum, C. F. (2006). Structure and function of photosystems I and II. Annual review of plant biology, 57, 521–565. doi:10.1146/annurev.arplant.57.032905.105350.
Schmeelk, J. (2002). Wavelet transforms on two-dimensional images. Mathematical and Computer Modelling, 36, 939–948. doi:10.1016/S0895-7177(02)00238-8.
Schmittmann, O., Kam, H., & Schulze Lammers, P. (Eds.). (2010) 2nd International Conference on Machine Control & Guidance, Bonn .
Schmittmann, O., & Schulze Lammers, P. (2017). A True-Color Sensor and Suitable Evaluation Algorithm for Plant Recognition. Sensors (Basel, Switzerland), 17(8).
Smaniotta, P. (2006). Licht und Elektromagnetismus. Dental Dialogue, 7, 92–105. Tillett, N. D., Hague, T., Grundy, A. C., & Dedousis, A. P. (2008). Mechanical within-row
weed control for transplanted crops using computer vision. Biosystems Engineering, 99, 171–178. doi:10.1016/j.biosystemseng.2007.09.026.


48th Symposium "Actual Tasks on Agricultural Engineering", Zagreb, Croatia, 2021
361
POTATO WEED MANAGEMENT IN CONDITION OF TECHNOLOGY OF DESTONED RIDGES
Jaroslav ČEPL*, Pavel KASAL, Andrea SVOBODOVA
*E-mail of corresponding author: [email protected] Research Institute, Dobrovského 2366, 580 01 Havlíčkův Brod, Czech Republic
ABSTRACT
The study was aimed at verification of an effect of weed management in potatoes under conditions of de-stoning technology in the Czech Republic. Potato Research Institute in Havlíčkův Brod realized a three-year field trial that involved active ingredients of herbicides applied pre-emergently (flurochloridone, metribuzin + clomazone, metribuzin + flufenacet, metribuzin + prosulfocarb, metobromuron + prosulfocarb, aclonifen) and post-emergently(metribuzin + rimsulfuron and bentazone) into potatoes. The efficacy wasobserved on present weeds Fallopia convolvulus, Matricaria chamomilla,Chenopodium album, Viola arvensis, Capsella bursa pastoris and Lamiumpurpureum in comparison to non-treated variant and further on total andmarketable potato yield. All active ingredients reached weed control efficacyin the range from 56 % (bentazone) to 100 % (metobromuron + prosulfocarb)across the years. Fallopia convolvulus was determined as the most distributedweed. The most effective combinations against this weed species involved pre-emergently applied metribuzin + flufenacet and metobromuron + prosulfocarb.Pre-emergently applied herbicides indicated higher efficacy compared to post-emergent applications. The combinations of metribuzin + clomazone,metribuzin + prosulfocarb and metobromuron + prosulfocarb indicated asignificant effect on the highest total and marketable potato yield.
Keywords: weed management, potato, herbicides, yield
INTRODUCTION
Weeds are very important harmful agents in potato crops. Depending on their range and occurrence intensity weeds have a negative impact especially on potato yield. When lower and intermediate weed infestation occurs, weeds cause at least 20-30 % yield reduction, but high weed infestation can result in up to 90 % yield reduction. For example, Zarzecka et al. (2020) refer an increase of marketable potato yield based on applied herbicides in the range
48. ACTUALTASKS ONAGRICULTURAL ENGINEERING
Original scientific paper
J. Čepl, P. Kasal, A. Svobodova
362
of 27.5-61 %. Weeds compete with potato plants considering all growth and developmental conditions. They take moisture and nutrients and this results in much faster growth of weeds and also a higher competition ability, they shade young potato plants and deprive them of sunlight, complicate harvest, increase risk of mechanical tuber damage at harvest. For these reasons, weed management belongs to the key technological measures in potato growing.
For weed control in potatoes, mechanical measures have been always used and continue to be used, consisting in the system of earthing-up, harrowing and hoeing (Ivany et al., 2002). Other alternatives could be also used, e.g. mulching, covering with various biodegradable materials and application of natural herbicides (Shehata et al., 2019). From the current view of sustainable agriculture and application of EU Green Deal rules and Farm to Fork strategy, it is even very in place, however, under conditions of big specialized enterprises with higher potato concentration, it is unreal. Use of herbicides into potatoes has begun since the 1960s. Since 1990s herbicides have become the only option for weed control in the Czech Republic. It was caused by the fact that agricultural enterprises began to use almost exclusively so-called de-stoning technology (Misener et al., 1986). De-stoning technology substantially changed direct control measure against weeds. After planting no cultivation measure is possible and weed control only concentrates to herbicide application (Čepl and Kasal, 2001, Vejchar et al., 2019). On de-stoned fields, high weed infestation intensity occurs and therefore appropriate attention should be paid to herbicide selection and applications.
MATERIALS AND METHODS
The trial was established in 2017, 2018 and 2019 on the fields of Potato Research Station belonging to Potato Research Institute Havlíčkův Brod, located at an altitude of 465 m. The soil type was cambisol, pseudogley and medium sandy loam, potato cultivars Dali were planted at a spacing of 750 x 290 mm. Planting was done on 3 May 2017, 28 April 2018 and 25 April 2019. Trial plot size was 20.9 m2 (2.25 x 9.3 m) involving 96 plants based on the randomized complete block system. Trial variants are given in Table 1.
Application of herbicide active ingredients was done based on methodological recommendations and herbicide labels:
- Var. 2 (pre-emergent, PRE) 8 May 2017, 1 May 2018, 29 April 2019 (3-5 days after planting)
- Var. 3-7 (pre-emergent, PRE) 23 May 2017, 18 May 2018, 17 May 2019 (emerging weeds – cotyledons)
- Var. 8-9 (post-emergent, POST) 15 June 2017, 18 June 2018, 12 June 2019 (BBCH 25, potato height below 15 cm, weeds having 2-6 leaves).
Efficacy (%) on individual weed species was evaluated 21 days after herbicide application using estimation compared to non-treated control based on standards EPPO PP1/51 (2007). Weed occurrence and coverage of non-treated control variant on date of efficacy evaluation for pre-emergent herbicides is given in Table 2. Following weed species were evaluated: Fallopia convolvulus (based on EPPO global database POLCO), Matricaria chamomila (MATCH), Chenopodium album (CHEAL), Viola arvensis (VIOAR), Capsella bursa pastoris (CAPBP) and Lamium purpureum (LAMPU).

Potato weed management in condition of technology of destoned ridges
363
Table 1 Basic data for applied variants
Var. Herbicide applied Product applied Contents of a.i.
Application rate
Application method*
1 Non-treated control variant
2 Flurochloridon Racer 25 EC 250 g l-1 2,0 l ha-1 PRE
3 Metribuzin Clomazone
Sencor Liquid Command 36 CS
600 g l-1
360 g l-1 0,6 l ha-1 0,2 l ha-1 PRE
4 Metribuzin Flufenacet Plateen 41,5 WG 175 g kg-1
240 g kg-1 2,5 kg ha-1 PRE
5 Metribuzin Prosulfocarb Arcade 880 EC 80 g l-1
800 g l-1 4,0 l ha-1 PRE
6 Metabromuron Prosulfocarb
Proman Roxy 800 EC
500 g l-1
800 g l-1 2,0 l ha-1
2,0 l ha-1 PRE
7 Aclonifen Bandur 600 g l-1 4,0 l ha-1 PRE
8 Metribuzin Rimsulfuron
Sencor Liquid Titus 25 WG
600 g l-1
250 g kg-1 0,2 l ha-1
40 g ha-1 POST
9 Bentazone Basagran 480 g l-1 2,0 l ha-1 POST
* PRE – Herbicide applied at the pre-emergency stage POST – Herbicide applied at the post-emergence stage of crop and weeds
The trial studied the efficacy of herbicides on individual weed species (%), total potato
yield (t ha-1) and marketable yield (tubers more than 35 mm, t ha-1).
Table 2 Weed coverage of non-treated control variant (%)*
Year Weed species **
Total POLCO MATCH CHEAL VIOAR CAPBP LAMPU
2017 20 15 15 12 10 10 82 2018 8 10 10 5 12 5 50 2019 30 15 8 6 25 15 99
x� 19 13 11 8 16 10 77 * EPPO standards (2017) **EPPO global database (2020)
RESULTS AND DISCUSSION
Table 2 shows that the highest coverage was recorded for POLCO (19 %), CAPBP (16 %), MATCH (13 %), CHEAL (11 %), LAMPU (10 %) and VIOAR (8 %). These are typical and the most common weeds in the Czech Republic (Čepl and Kasal, 2010). Total coverage of

J. Čepl, P. Kasal, A. Svobodova
364
these species reached 50-99 % in individual trial years. It indicates really high values, the highest occurrence intensity was found in 2019 (99 %).
Efficacy of herbicides is given in Table 3.
Table 3 Efficacy of investigated herbicides (% of damaged weed plants)*
Var. Year Weed species** Efficacy
x� POLCO MATCH CHEAL VIOAR CAPBP LAMPU
2
2017 85 90 93 100 100 100 95 2018 62 100 83 100 97 100 90 2019 73 100 100 100 100 100 96
x� 73 97 92 100 99 100 94
3
2017 93 100 100 100 100 100 99 2018 100 100 100 100 100 100 100 2019 93 100 100 100 100 100 99
x� 95 100 100 100 100 100 99
4
2017 93 100 100 100 100 100 99 2018 100 100 100 100 100 100 100 2019 97 100 100 100 100 100 99
x� 97 100 100 100 100 100 99
5
2017 97 100 100 100 100 100 99 2018 100 100 100 100 100 100 100 2019 92 100 100 100 100 100 99
x� 96 100 100 100 100 100 99
6
2017 92 100 93 100 100 100 99 2018 100 100 100 100 100 100 100 2019 98 100 100 100 100 100 100
x� 97 100 98 100 100 100 100
7
2017 75 100 100 100 100 63 90 2018 100 100 100 100 100 100 100 2019 82 100 100 100 100 100 100
x� 86 100 100 100 100 88 97
8
2017 90 88 72 73 77 100 83 2018 60 52 50 73 63 30 55 2019 82 92 65 50 60 100 75
x� 77 77 62 65 67 77 71
9
2017 23 13 75 67 90 83 59 2018 32 30 13 60 80 92 51 2019 67 23 23 78 60 90 57
x� 41 22 37 68 77 88 56 * EPPO standards (2017) ** EPPO global database (2020)

Potato weed management in condition of technology of destoned ridges
365
All tested active ingredients had 100% efficacy on Lamium purpureum that had the lowest coverage on control variant (8 %). On contrary, the lowest efficacy was generally recorded for Fallopia convolvulus that had the highest coverage on control variant, on average of 19 %. No tested active ingredient showed 100 % efficacy on this species across trial years.
Current effect: F(8, 72)=8,3668, p=,00000
1 2 3 4 5 6 7 8 9Variant
0
5
10
15
20
25
30
35
40
45
50
55
60
t.ha
-1
Figure 1 Total potato yield (t ha-1)
As expected, the lowest total potato yield (Figure 1) was determined in non-treated variant
(27.2 t ha-1). A significant difference was found to all variants, where post-emergent herbicide application was done, to an average of this group by 49.1 % and to the highest yield in variant 5 (42.2 t ha-1) even by 55.2 %. These values were higher than 32 % increase, which was recorded by e.g. Ilic et al. (2016). Post-emergent herbicide application brought insignificant differences of yield increase compared to non-treated control, namely by 18.6 %. It confirms our previous hypothesis (Čepl and Kasal, 2013) regarding increased efficacy of pre-emergently applied herbicides, in contrast to the results of Jovovic et al. (2013), who reached higher yields for post-emergent applications. However, in this case it depends on specific conditions and infestation intensity of individual weed species. It is also valid for marketable potato yield (Figure 2) and it means that tested variants did not have an effect on the distribution of weight categories of marketable tubers and tubers below 35 mm.

J. Čepl, P. Kasal, A. Svobodova
366
Current effect: F(8, 72)=8,0391, p=,00000
1 2 3 4 5 6 7 8 9
Variant
0
5
10
15
20
25
30
35
40
45
50
55
60
t.ha-1
Figure 2 Marketable potato yield (t ha-1)
Differences were found in efficacy, potato yields and marketable yields between
individual active ingredients. Flurochloridon (var. 2) had the lowest efficacy from all pre-emergent herbicides,
especially on Fallopia convolvulus (73 %). It was generally reflected in decreased potato yield, incl. marketable yields. Jovovic et al. (2013) determined during their study of range of active ingredients satisfying efficacy, but also with the support of active ingredient acetochlor, which is already prohibited in EU nowadays.
Metribuzin was contained in three tested PRE herbicides, with clomazone (var. 3), flufenacet (var. 4) and prosulfocarb (var. 5). The efficacy of all three variants was very high and also in case of the most distributed Fallopia convolvulus (based on variants 95 %, 97 % and 96 %). Gitsopoulos et al. (2014) also refer to the high efficacy of metribuzin and prosulfocarb combination on Fallopia convolvulus and they achieved 87 % efficacy. It was certainly reflected in potato yields, which also belonged to almost the highest ones. These findings are also confirmed by many authors, since metribuzin belongs to the most used active ingredients worldwide. For example, Luz et al. (2018) found that the greatest “total” yields were observed in treatments with metribuzin. Murray et al. (1994) also confirm that treatments with metribuzin tended to have high potato yields.
Metobromuron with prosulfocarb (var. 6) achieved the highest efficacy on studied weed species (97-100 %) and it was the reason that total potato yield and also marketable yield were the highest (42.2 t ha-1), although the difference was only 0.1 t ha-1 to var. 5.
Potato weed management in condition of technology of destoned ridges
367
Aclonifen as the last post-emergently applied active ingredient had conventional efficacy and potato yields, which were tendentiously lower than in var. 3-7.
Post-emergently applied metribuzin plus rimsulfuron (var. 8) generally achieved lower efficacy on all weed species (62-77 %). It was also expressed with significantly lower yields (33.0 t ha-1) compared to var. 3, 5 and 6. Such trends could also be found for the other pre-emergent treatments, on the other hand, Boydston (2007) found that rimsulfuron applied alone at 18 or 26 g ha-1 controlled hairy nightshade and large crabgrass without potato injury and resulted in the greatest potato yields. It depends on weed range and these findings could be also used under conditions of our country, since within the climatic change weed range is also changing and above-mentioned hairy nightshade begins to spread very fast. The combination of metribuzin and rimsulfuron was also tested by Robinson, et al. (1996), who found that reduced rates of 9 g ha-1 rimsulfuron plus 69 g ha-1 metribuzin, applied pre- and post-emergently, controlled all weeds 100% except jimsonweed, fall panicum and large crabgrass. For complete control of these weeds, rimsulfuron at 35 g ha-1 plus metribuzin at 280 g ha-1 was required. In case of post-emergently applied metribuzin varietal sensitivity must be also considered, which is known and which is referred by many authors, e.g. Arsenault and Ivany (1996), it is also valid for combined applications with rimsulfuron, where Ackley (1996) refers that these combinations did not affect potato tuber yield and quality, but caused slight to moderate chlorosis and new terminal growth of potato, but chlorosis disappeared within 3 weeks.
Bentazon (var. 9), which was also POST applied, had the lowest efficacy from all tested variants (based on weed species 22-88 %); it was also expressed in significantly the lowest potato yields (31 5 t ha-1) in the same sense as previous variant.
CONCLUSION
De-stoning technology has changed weed management options in potato growing. The control measures only consist in the application of herbicides and it has higher requirements for herbicide selection and verification of herbicide efficacy. In a three-year field trial, selected herbicide active ingredients were used against weeds pre-emergently (flurochloridone, metribuzin + clomazone, metribuzin + flufenacet, metribuzin + prosulfocarb, metobromuron + prosulfocarb, aclonifen) and post-emergently (metribuzin + rimsulfuron and bentazone). The efficacy on present weeds Fallopia convolvulus, Matricaria chamomilla, Chenopodium album, Viola arvensis, Capsella bursa pastoris and Lamium purpureum compared to non-treated variant and further an effect was studied on total and marketable potato yield. All active ingredients reached weed control efficacy between 56 % (bentazone) and 100 % (metobromuron + prosulfocarb) across the trial years. Fallopia convolvulus was determined as the most distributed weed species. The combination of pre-emergently applied active ingredients metribuzin + flufenacet and metobromuron + prosulfocab had the highest efficacy on this species. Pre-emergently applied herbicides indicated higher efficacy compared to post-emergent applications. The combinations of metribuzin + clomazone, metribuzin + prosulfocarb and metobromuron + prosulfocarb indicated a significant effect on the highest total and marketable potato yield.
J. Čepl, P. Kasal, A. Svobodova
368
ACKNOWLEDGEMENTS
The study was supported in the framework of Long-term concept of research organization development RO1620.
REFERENCES
Ackley, J., Wilson H., Hines, T. (1996). Efficacy of Rimsulfuron and Metribuzin in Potato (Solanum Tuberosum). Weed Technology 10, 475–480.
Arsenault, W.J., Ivany, J.A. (1996). Response of three potato cultivars to metribuzin. Journal of Production Agriculture 9, 86 – 88.
Boydston, R.A. (2007). Potato and weed response to postemergence-applied halosulfuron, rimsulfuron, and EPTC. Weed Technology 21, 465 – 469.
Čepl, J., Kasal, P. (2001). Effects of various ways of pre-plant soil preparation on potato tuber yields and soil physical properties and soil temperature. Rostlinna Vyroba 47, 475-481.
Čepl, J., Kasal, P. (2010). Weed Mapping - A Way to Reduce Herbicide Doses, Potato Research 53, 359–371.
Čepl, J., Kasal, P. (2013). Effect of stress conditions induced by herbicide damage of potato plants on yield and selected quality parameters. In: Michalak, T, Czerko, Z (eds.). Book of Abstracts of International Conference Post Harvest EAPR Section Meeting Warszawa, Poland, 22-24 October 2013. Warszawa: IHAR, 64-65
EPPO, Bulletin 37, 44-47, 2007, https://doi.org/10.1111/j.1365-2338.2007.01074.x EPPO global database, 2020, https://gd.eppo.int Gitsopoulos, T.K., Damalas, C.A., Georgoulas, I. (2014). Herbicide Mixtures for Control of Water
Smartweed (Polygonum amphibium) and Wild Buckwheat (Polygonum convolvulus) in Potato. Weed Technology 28, 401–407.
Ilic, O., Nikolic, L., Ilin, Z., Miskovic, A., Vujasinovic, V., Kukic, B. (2016). Effect of cultural practices on weeds community in function of potato yield. Acta Scientiarum Polonorum Hortorum 15, 31 – 43.
Ivany, J.A. (2002). Banded herbicides and cultivation for weed control in potatoes (Solanum tuberosum L.). Canadian Journal of Plant Science 82, 617 – 620.
Jovovic, Z., Popović, T., Velimirovic, A., Milić, V., Željko, D., Silj, M., Poštić, D. (2013). Efficacy of Chemical Weed Control in Potato (Solanum tuberosum L.). Agro Knowledge 14, 487-495.
Luz, J.M.Q., Fonseca, L.F., Duarte, I.N. (2018). Selectivity of pre-emergence herbicides in potato cv. Innovator. Horticultura Brasileira 36, 223 – 228.
Misener, G.C., McLeod, C.D. (1986). The effect of stone windrowing on potato harvesting. American Potato Journal 63, 495–499.
Murray, M., W., Arnold, R., N., Gregory, E., J., Smeal, D. (1994). Early brodleaf weed – control in potato (Solanum tuberosum) with herbicides. Weed Technology 8, 165 – 167.
Robinson, D.K., Monks, D.W., Monaco, T.J. (1996). Potato (Solanum tuberosum) tolerance and susceptibility of eight weeds to rimsulfuron with and without metribuzin Weed Technology 10, 29 – 34.
Shehata, S.A., Abouziena, H.F., Abdelgawad, K.F., Elkhawaga, F.A. (2019). Weed Control Efficacy,Growth and Yield of Potato (Solanum tuberosum L.) as Affected by Alternative Weed Control Methods. Potato Research 62, 139-155
Potato weed management in condition of technology of destoned ridges
369
Vejchar, D., Vacek, J., Hájek, D., Bradna, J., Kasal, P., Svobodová, A. (2019). Reduction of surface runoff on sloped agricultural land in potato cultivation in de-stoned soil. Plant, Soil and Environment 65, 118-124.
Zarzecka, K., Gugala, M., Sikorska, A., Grzywacz, K., Nieweglowski, M. (2020). Marketable Yield of Potato and Its Quantitative Parameters after Application of Herbicides and Biostimulants. Agriculture, 10, 49.


48th Symposium "Actual Tasks on Agricultural Engineering", Zagreb, Croatia, 2021
371
TIME AND COSTS ANALYSIS OF DIFFERENT NON-CHEMICAL WEED CONTROL METHODS
IN SUGAR BEET Indrė BRUČIENĖ*, Domantas ALELIŪNAS, Egidijus ŠARAUSKIS
*E-mail of corresponding author: [email protected] Vytautas Magnus University, Agriculture Academy, Institute of Agricultural Engineering and Safety,
Studentu 15A, LT-53362 Akademija, Kaunas Reg., Lithuania
ABSTRACT
Sugar beet is very sensitive to weed competition. Even at low weed densities, significant losses in sugar beet yield are observed. This problem is especially relevant in organic crops because weeds not only reduce the yields, but also stifle the crops and deplete the plant nutrients. In order to solve these problems in organic crops, it is necessary to use non-chemical weed control methods that are often expensive and time-consuming. The aim of this study was to evaluate the efficiency of working time utilization and to carry out an economic evaluation of non-chemical weed control methods in organic sugar beet growing. Four mechanical methods of inter-row loosening for non-chemical weed control were analyzed in this study: T1 (automated), T2 (robot-diesel powered), T3 (robot-electric powered) and T4 (conventional, control). The efficiency of working time utilization and economic performance were assessed by using the combined analysis of working time and performing the cost-benefit analysis, respectively.
Comparison of non-chemical weed control systems showed that the largest share of machinery labor time costs (18.76 h ha-1) was used by an electric robot, and the lowest – by an automated method (9.07 h ha-1). The results of the economic evaluation showed that the cheapest non-chemical weed control was T2 (robot-diesel powered) and the most expensive – T3 (robot-electric powered).
In addition, weed control methods using robots reduce the negative impact on the soil because of their lower mass. In addition, they eliminate tedious monotonous work of a farmer. To sum up, robotic weed control machines could be an economically viable alternative to conventional mechanical inter-row equipment of loosening.
Keywords: inter-row loosening, robot, working time, costs, yield
48. ACTUAL TASKS ON AGRICULTURAL ENGINEERING
Original scientific paper
I. Bručienė, D. Aleliūnas, E. Šarauskis
372
INTRODUCTION
Organic farming and the production of healthier food raw materials are becoming increasingly important throughout the European Union. Among the three Baltic States, white sugar is only produced in Lithuania, so sugar beet is an important crop in the local agricultural industry. Lithuania produces about 4,000 tons of organic sugar every year (Romaneckas et al., 2020).
Weed control is one of the most important factors in sugar beet cultivation, ensuring crop yield and quality (Sabanci and Aydin, 2017), but at the same time it’s the most expensive and has a significant impact on the environment. Weeds compete with sugar beet for water, nutrients, and light (Cioni and Maines, 2010; Cook et al., 2019). Weed competition could reduce the sugar beet root yields from 26 to 100% (Cioni and Maines, 2010; Majidi et al., 2017; Gerhards et al., 2017; Cook et al., 2019; Bhadra et al., 2020).
Weed control is usually performed using herbicides (Kunz et al., 2015; Gerhards et al., 2017; Majidi et al., 2017), but it is an expensive and environmentally harmful method. Mechanical weed control may be an alternative to chemical weed control (Cioni and Maines, 2010; Kunz et al., 2016; Peruzzi et al., 2017; Cook et al., 2019). This is especially important in the production of organic sugar beet.
Mechanical weed control is most commonly used to control weeds in rows, but the advent of smart technologies such as cameras, visual sensors, and RTK-GNSS in agriculture has made it possible to control weeds in crop rows (Kunz et al., 2018; Cook et al., 2019). Self-propelled robots can separate crop plants from weeds and mechanically weed the exact crop location or along the crop rows. It is not uncommon for agricultural robots to use electricity, which reduces their negative impact on the environment.
An aging society, seasonality of jobs, rural areas, and negative public attitudes are factors contributing to the growing shortage of workers (Relf-Eckstein et al., 2019). One way to reduce the need for workers is to automate the production of agricultural products by using robots. Robots not only allow more precise row spacing of sugar beet, but also save 50 to 80% of a farmer’s working time compared to traditional mechanical row spacing (Lampridi et al., 2019; Vasconez et al., 2019). The robot needs to be transported to and from the field, supervised while working, refueled, but at the same time the farmer is able to do other, more important farm work. It is important mentioning that the operator’s health is spared by avoiding long tiresome working hours in the tractor cabin (Lu et al., 2020), not needing to concentrate intensively on work and giving a chance to spend more time planning activities, organizing work or resting.
Researchers from Germany (Kunz et al., 2015) have found that mechanical row crop cultivators with row recognition cameras and high-precision RTK steering systems allow inter-row loosening at double speed. This reduces labor costs and increases productivity. Reduced labor costs can offset investment in precision farming technologies.
Thus, the aim of this study was to determine the working time and the economic parameters of effective non-chemical weed control methods for organically grown sugar beet in order to use the available energy efficiently and economically.
Time and costs analysis of different non-chemical weed control methods in sugar beet
373
MATERIALS AND METHODS
Case study description In this study, analytical evaluations of different weed control methods in organic sugar
beet crops were performed. Four mechanical methods of inter-row loosening for non-chemical weed control were analyzed: T1 (automated), T2 (robot-diesel powered), T3 (robot-electric powered) and T4 (conventional, control). Technological indicators of different weed control methods are presented in Table 1. Data from the control mechanical loosening between the rows (T4) were taken from field trials by other researchers (Romaneckas et al., 2020). Three-year (2015–2018) experimental field trials were performed in a 20 ha field at the Experimental Station of Vytautas Magnus University, Agriculture Academy, Lithuania. This region is characterized by light loam. Meteorological conditions were mixed. In June 2015, the rainfall was 16.4 mm, which is 4.5 times lower than the perennial average. Meanwhile, spring was dry in 2016, but July and August were unusually humid (162.9 and 114.9 mm, respectively). In 2017, the average temperatures were about 1.0 oC lower than the perennial average practically every month, and the distribution of precipitation in different months was uneven, ranging from 10.5 to 87.1 mm (Kaunas Meteorological Station).
Assessment of working time The operating time of the machines in the field was calculated for the technological
operation, but without taking into account the travel to and from the field, downtime due to failures, adjustment and calibration of the implement. For the traditional loosening of organic sugar beet rows, working hours were adopted based on the data of the Lithuanian Institute of Agricultural Economics (LIAE, 2018). When using an automated row cultivator with chambers and robots for mechanical inter-row loosening, labor time costs were calculated based on the formula (Butkus et al., 2001):
𝑊𝑊ℎ = 0,1𝐵𝐵𝑎𝑎𝑉𝑉𝑑𝑑𝜏𝜏𝜏𝜏 (1)
where: Ba – implement’s width in m; Vd – operating speed of the implement in km h-1; τ – shift time utilization factor (0.89); β – the utilization factor of the working width of the implement (1.0).
A commercially available 3 meter working width row cultivator (F Poulsen Engineering, 2020) with cameras and an image analysis system for crop row recognition was selected for modeling the automated inter-row loosening. The implement was equipped with an 83 kW tractor. When calculating the performance of an automated row crop cultivator, the working speed was assumed to be 7.2 km h-1 based on a study provided by German researchers (Kunz et al., 2015).
After evaluating the robots available on the market, it was decided to choose one diesel-powered robot for this work and another with a battery and solar modules as a power source. The first robot can work with a variety of implements and matches a low-power tractor. Equipped with a 3 meter working width mechanical row crop cultivator, the 54 kW robot (Agrointelli, 2020) works fully without human intervention as it has obstacle detection, row tracking, weed recognition, RTK-GPS precision positioning and other systems. The operating speed of 5.5 km h-1 was chosen for the calculations because, according to the manufacturer, such speed is within optimal limits.

I. Bručienė, D. Aleliūnas, E. Šarauskis
374
Another robot for mechanical inter-row loosening is completely CO2 neutral. Four solar modules generate electricity for the battery module, which allows the unit to operate continuously for up to 24 hours a day. The robot weighs 800 kg and the working width with the row cultivator is 3 meters (Farmdroid, 2020). The operating speed of the machine was calculated to be 1.0 km h-1.
Economic assessment The economic evaluation of organic sugar beet growing technologies was performed only
for crop maintenance technological operations, estimating the price of agricultural machinery, fuel and lubricants, staff wages and other direct costs related to weed control. Direct costs included the cost of refurbishing, repairing and maintaining machinery, fuel and lubricants, electricity, wages and the environmental pollution tax. Indirect operating costs were not estimated. Value added tax is not included in the cost.
Power, working width, productivity, working time and fuel consumption of agricultural machinery are presented in Table 1.
Table 1 Technological indicators of weed control methods (calculated by authors,
according to (LIAE, 2018))
Weed control practice Machinery
power (kW)
Working width (m)
Field capacity (ha h-1)
Fuel consumption
(L ha-1) Inter-row loosening
Conventional 54 3.00 0.80 5.04
Automated 83 3.00 1.92 3.71
Robot-diesel powered 54 3.00 1.50 5.19
Robot-electric powered 1 3.00 0.27 3.00* * kWh ha-1
Different economic indicators were calculated on the basis of the current cost of inputs
and output: Production value (€ ha-1) = sugar beet yield (t ha-1) × sugar beet price (€ ha-1) (2) The average price of sugar beet in 2020 is 27 euros per ton of roots (LRŽŪM, 2019),
excluding subsidies. In the method of traditional mechanical row loosening (T4), the yield was determined experimentally and expressed in tons per hectare (t ha-1). For automatic mechanical inter-row loosening (T1), it was assumed that the yield of sugar beet due to automation was 11% higher (Kunz et al., 2015), and in the case of inter-row loosening by robots, methods T2 and T3, due to lower soil compaction, the yield of sugar beet was increased by an additional 7%. (Shockley and Dillon, 2018) compared with T4.
Benefit/cost ratio = Total production value (€ ha-1) / Total cost value (€ ha-1) (3)

Time and costs analysis of different non-chemical weed control methods in sugar beet
375
Expenses for diesel fuel have been calculated by applying a reduced price of fuel specially designed for farmers in Lithuania – 0.51 € L-1 (LŽŪMPRIS, 2020). The price of lubricants was assumed to be 10% of fuel consumption (Lampridi et al., 2019). The fee for environmental pollution from mobile pollution sources was calculated in accordance with the approved Description of the procedure for calculation and payment of the environmental pollution tax (LRS, 2018).
Worker working time in robotic weed control methods (T2, T3) has been reduced to 50% compared to normal practice, as the robot works independently and the worker is only needed to start, maintain, install and disassemble the robot (Lampridi et al., 2019). The hourly rate adopted for calculating the worker’s salary is 9.20 € h-1 (LSD, 2020).
When estimating the robot’s electricity consumption, the electricity price is assumed to be 0.14 € kWh-1 (Ignitis, 2020). When calculating the depreciation costs of agricultural machinery and implements, the residual value was estimated at 1.0%.
During the economic assessment, according to the established practice in Lithuanian agriculture, the economic age of 10 years is adopted.
Statistical analysis Statistical analysis was performed using single-factor analysis of variance (ANOVA).
Tukey’s HSD test was used to determine significant differences between the means. Different letters indicate significant difference between the methods of weed control (p <0.05).
RESULTS AND DISCUSSION
Technological parameters After a comparative assessment, 4 different mechanical inter-row loosening technologies
were examined. There was the difference not only in the power of used machines but also in their efficiency and the cost of labor. The lowest power machine was a solar-powered robot (T3) as its operating speed is only 1.0 km h-1. Meanwhile, the automated row crop cultivator with cameras for row tracking (T1) had the highest demand for power, but this also resulted in the highest performance compared to other weed control technologies.
Efficiency of machinery working time utilization The labor costs of machines differed significantly in the application of different weed
control methods for the maintenance of organic sugar beet crops. These differences are illustrated in Figure 1. The most labor-intensive sugar production technology was application of the T3 method with the total cost of 18.76 h ha-1, of which as much as 60% of the total working time was dedicated for loosening between rows with an electric robot. This was due to the lowest productivity (0.27 ha h-1), which directly depends on the working speed of the robot. The lowest total working time costs were 9.07 h ha-1, of which 1.56 h ha-1 was dedicated for weed control using an automated row cultivator. It accounted for 17.2% of the total working time costs. Significant differences in working time costs (p<0.05) were found by comparing the T4 and T3 inter-row loosening methods with all the others. Pankova et al. (2020) found that labor costs for agricultural production account for 17% of total costs. The differences in costs between the crops such as winter wheat, peas or sugar beet are not significant. In comparison, the average labor costs for growing wheat and sunflowers are 13.5 and 11.4 h, respectively (Unakıtan and Aydın, 2018).

I. Bručienė, D. Aleliūnas, E. Šarauskis
376
Figure 1 The impact of different weed control methods on labor time costs in organic sugar
beet crops. T1 – inter-row loosening (automated), T2 – inter-row loosening (robot-diesel powered), T3 – inter-row loosening (robot-electric powered), T4 – inter-row loosening
(control)
Crop yield and economics The yield of organic sugar beet (t ha-1) is presented in Figure 2. Analytical calculations
showed that the best average sugar beet yields (65.22 t ha-1) were predicted in the options that used robotic weed control methods (T2, T3) when mechanical inter-row loosening is performed with diesel and electric robots. This was influenced by smart precision technologies and lower soil compaction due to lower weight of the robots. The lowest average sugar beet yield (55.27 t ha-1) was obtained by conventional inter-row loosening (T4). Majidi et al. (2017) got similar results for sugar beet yield: when using chemical weed control methods, root yield ranged from 27.21 to 73.66 t ha-1. However, the lowest root yield, obtained in the control method (20.66 t ha-1), was much lower than in our case. This may have been influenced by different soil, climatic conditions, and weed control times.
Figure 2 Sugar beet yield using different weed control methods
0 2 4 6 8 10 12 14 16 18 20
T1
T2
T3
T4
Working time hours per ha-1
Wee
d co
ntro
l met
hods
Stubble cultivation Manure distributionPloughing Pre-sowing cultivationConventional sowing Inter-row loosening (conventional) (x3)Inter-row loosening (automated) (x3) Inter-row loosening (robot-diesel powered) (x3)Inter-row loosening (robot-electric powered) (x3) Harvesting
c
ba
a
0
20
40
60
80
100
T1 T2 T3 T4
Suga
r be
et y
ield
,t h
a-1
Weed control metods
2015
2016
2017
Average
61.35 65.22 65.2255.27

Time and costs analysis of different non-chemical weed control methods in sugar beet
377
The costs of different weed control methods used in sugar beet growing technology are presented in Table 2. Economic analysis of different weed control methods showed that the costs for this operation range from 26.80 to 88.90 € ha-1. The cost of the weed control method T2 was 69.85% lower compared to the weed control method T3. This difference was influenced by the most time-consuming electric robot. However, it should be noted that in all weed control options, human labor time accounted for the largest share of costs from 34.54 (T2) to 58.99% (T4). Perez-Ruiz et al. (2015) calculated very similar costs for routine weed control (52 € ha-1).
Table 2 Economic indicators and costs associated with different weed control practices
Parameters Unit Inte
r-ro
w
loos
enin
g (a
utom
ated
)
Inte
r-ro
w
loos
enin
g (r
obot
-die
sel
pow
ered
)
Inte
r-ro
w
loos
enin
g (r
obot
-ele
ctric
po
wer
ed)
Inte
r-ro
w
loos
enin
g (c
onve
ntio
nal)
T1 T2 T3 T4
Machinery price € 81,498.4 84,120.0 75,000.0 70,436.9
Implement price € 100,323.6 11,495.0 - 11,495.0
Labor € ha-1 14.4 9.2 51.8 34.5
Diesel fuel € ha-1 5.6 7.9 - 7.6
Lubricants € ha-1 0.6 0.8 - 0.8
Electric energy € ha-1 - - 1.2 - Environmental pollution tax € ha-1 0.1 0.1 - 0.1
Depreciation costs of machines
€ ha-1 9.4 6.3 27.8 10.1
Repair and Maintenance € ha-1 3.0 2.4 8.1 5.3
Total production cost € ha-1 33.0 26.8 88.9 58.5
Production value € ha-1 1,656.5 1,760.9 1,760.9 1,492.3
Benefit/cost ratio - 50.2 65.8 19.8 25.5
Although in the case of an automated inter-row cultivator (T1) the investment in machines
is the highest, the cost per hectare is probably the lowest (33 € ha-1). The best benefit ratio was achieved in option T2 (65.8), where weed control was
performed with a diesel-powered robot, while the worst – in option T3 (19.8).
I. Bručienė, D. Aleliūnas, E. Šarauskis
378
Pedersen et al. (2006) performed an economic comparison of autonomous robotic vehicles with conventional systems in three different areas: robotic weeding in high value crops (particularly sugar beet), crop scouting in cereals and grass cutting on golf courses (robotic weeding in sugar beet crops, crop exploration in cereals and grass cutting on golf courses). The results showed that in all three cases, robotic systems are more cost-effective than conventional ones.
In order to support analytical studies, future field studies should be carried out to determine the impact of weed control methods on economic performance.
CONCLUSIONS
Analysis of working time efficiency showed that the lowest total working time costs for the production of 9.07 h ha-1 organic sugar beet were when automated mechanical inter-row loosening was applied.
The weed control method in many cases had a significant impact on the total labor costs of organic sugar beet production.
The results of the economic assessment showed that the lowest costs for non-chemical weed control were T2 (robot-diesel powered) – 26.8 € ha-1, and the highest – 88.9 € ha-1 – for T3 (robot-electric powered). This was due to high labor costs, depending on the performance of the robot and the investment in machinery.
The best Benefit/cost ratio was achieved in option T2 (65.8), where weed control was performed with a diesel-powered robot. This was due to the high production value and low costs compared to other weed control methods.
REFERENCES
Agrointelli Robotti. (2020). Available at: https://www.agrointelli.com/robotti/ (accessed 01.10.2020). Bhadra, T., Mahapatra, C. K., Paul, S. K. (2020). Weed management in sugar beet: A review.
Fundamental and Applied Agriculture 5(2): 147–156. Butkus, V., Domeika, R., Sakalauskas, A. (2001). Metodiniai patarimai individualiam namų ir kursiniam
darbui. Traktorinių agregatų sudarymas, Akademija, 12-14. Cioni, F., Maines, G. (2010). Weed Control in Sugarbeet. Sugar Tech, 12(3–4):243–255. Cook, S. K., Davies, L. R., Pickering, F., Tatnell, L. V., Huckle, A., Newman, S., Whiteside, C., White,
C., Talbot, D., Holmes, H., Turnbull, P. E., Buckley, D. C., Scrimshaw, J., Chambers, P. (2019). Weed control options and future opportunities for UK crops. Research Review No. CP 182/1807258.
F. Poulsen Engineering. ROBOVATOR mechanical. (2020). Available at: http://www.visionweeding.com/robovator-mechanical/ (accessed 05.10.2020).
Farmdroid. (2020). Available at: https://farmdroid.dk/en/welcome/ (accessed 07.10.2020). Gerhards, R., Bezhin, K., Santel, H. J. (2017). Sugar Beet Yield Loss Predicted by Relative Weed Cover,
Weed Biomass and Weed Density. Plant Protect. Sci., 53: 118–125. Ignitis. (2020). Available at: https://www.ignitis.lt/lt/tarifo-planas-standartinis (accessed 15.10.2020). Khelifi, M. (2001). Energy use and time requirements for different weeding strategies in grain corn.
Canadian Biosystems Engineering / Le Genie des biosystems au Canada. 43.

Time and costs analysis of different non-chemical weed control methods in sugar beet
379
Kunz, C., Weber, J. F., & Gerhards, R. (2015). Benefits of precision farming technologies for mechanical weed control in soybean and sugar beet—comparison of precision hoeing with conventional mechanical weed control. Agronomy, 5(2), 130–142.
Kunz, C., Weber, J. F., Gerhards, R. (2016). Conference: 27. Deutsche Arbeitsbesprechung über Fragen der Unkrautbiologie und -bekämpfung, 23-25 Februar 2016 in Braunschweig.
Kunz, C., Weber, J. F., Peteinatos, G. G., Sokefeld, M., Gerhards, R. (2018). Camera steered mechanical weed control in sugar beet, maize and soybean. Precision Agric, 19:708–720.
Lampridi, M. G., Kateris, D., Vasileiadis, G., Marinoudi, V., Pearson, S., Sørensen, C. G., Bochtis, D. (2019). A case-based economic assessment of robotics employment in precision arable farming. Agronomy, 9(4), 175.
Lietuvos Respublikos Seimas. (2018). Available at: https://e-seimas.lrs.lt/portal/legalAct/lt/TAD/TAIS.324459 (accessed 10.10.2020).
Lietuvos Respublikos žemės ūkio ministerija. 2019 m. gruodžio 30 d. įsakymas Nr. 3D-731. (2019). Available at: https://e-seimas.lrs.lt/portal/legalAct/lt/TAD/ed4a06b22c0d11ea8f0dfdc2b5879561 (accessed 11.10.2020).
Lietuvos statistikos departamentas. (2020). Available at: https://osp.stat.gov.lt/informaciniai-pranesimai?articleId=7655601 (accessed 12.10.2020).
Lietuvos žemės ūkio ir maisto produktų rinkos informacinės sistemos portalas. (2020). Available at: https://www.vic.lt/zumpris/2020/10/23/degalu-kainos-lietuvos-rinkoje-2020-m-43-savaite/ (accessed 12.10.2020).
Lithuanian Institute of Agrarian Economics. Tariffs for mechanized agricultural services (2018). Available at: https://www.laei.lt/?mt=leidiniai&metai=2018 (accessed 14.10.2020).
Lu, W., Wei, Y., Yuan, J., Deng, Y., & Song, A. (2020). Tractor Assistant Driving Control Method Based on EEG Combined With RNN-TL Deep Learning Algorithm. IEEE Access, 8, 163269-163279.
Majidi, M., Heidari, Gh., Emam, Y. (2017). Qualitative characteristics of sugar beet as affected by different broadleaf herbicides combinations. Iran Agricultural Research, 36 (2), 1–6.
Pánkova, L., Aulová, R., & Jarolímek, J. (2020). Economic Aspects of Precision Agriculture Systems. AGRIS On-line Papers in Economics and Informatics, 12(3), 59–67.
Pedersen, S. M., Fountas, S., Have, H., & Blackmore, B. S. (2006). Agricultural robots—system analysis and economic feasibility. Precision Agriculture, 7(4), 295–308. Available at: https://doi.org/10.1007/s11119-006-9014-9 (accessed 14.10.2020).
Perez-Ruiz, M., Gonzalez-de-Santos, P., Ribeiro, A., Fernandez-Quintanilla, C., Peruzzi, A., Vieri, M., Tomic, S., Agüera, J. (2015). Highlights and preliminary results for autonomous crop protection. Computers and Electronics in Agriculture, 110, 150–161.
Peruzzi, A., Martelloni, L., Frasconi, C., Fontanelli, M., Pirchio, M., Raffaelli, M. (2017). Machines for non-chemical intra-row weed control in narrow and wide-row crops: a review. Journal of Agricultural Engineering, XLVIII:583.
Relf-Eckstein, J. E., Ballantyne, A. T., & Phillips, P. W. (2019). Farming Reimagined: A case study of autonomous farm equipment and creating an innovation opportunity space for broadacre smart farming. NJAS-Wageningen Journal of Life Sciences, 90, 100307.
Romaneckas, K., Adamavičienė, A., Šarauskis, E., & Balandaitė, J. (2020). The Impact of Intercropping on Soil Fertility and Sugar Beet Productivity. Agronomy, 10(9), 1406.
Sabanci, K., Aydin, C. (2017). Smart Robotic Weed Control System for Sugar Beet. J. Agr. Sci. Tech., 19, 73–83.

I. Bručienė, D. Aleliūnas, E. Šarauskis
380
Shockley, J. M., Dillon, C. (2018). An Economic Feasibility Assessment for Adoption of Autonomous Field Machinery in Row Crop Production. In: Proceedings of the 14th International Conference on Precision Agriculture, Monticello, IL: International Society of Precision Agriculture.
Unakıtan, G., Aydın, B. (2018). A comparison of energy use efficiency and economic analysis of wheat and sunflower production in Turkey: A case study in Thrace Region. Energy, 149, 279–285.
Vasconez, J. P., Kantor, G. A., & Cheein, F. A. A. (2019). Human–robot interaction in agriculture: A survey and current challenges. Biosystems engineering, 179, 35–48.

48th Symposium "Actual Tasks on Agricultural Engineering", Zagreb, Croatia, 2021
381
INFLUENCE OF DIFFERENT WEED CONTROL METHODS ON SOYBEAN YIELD
Josip LAKIĆ, Igor KOVAČEV, Dubravko FILIPOVIĆ, Klara BARIĆ, Ana PINTAR, Mateja GRUBOR*
*E-mail of corresponding author: [email protected] University of Zagreb Faculty of Agriculture, Svetošimunska cesta 25, 10000 Zagreb, Croatia
ABSTRACT
Weed management is one of the most important steps in soybean production. Weeds in soybean cause the yield losses, varying from 20 to 80% in different agro-climatic conditions. The application of herbicides is the most common way of control, but it has negative effect on the environment. Last few decades, mechanical weed control method plays a crucial role in weed management. Due to above mentioned, the aim of the paper is to determinate the influence of different weed control methods (conventional tillage, chemical weed control method, green fertilization, mulching, subsoiling + chisel cultivator) on soybean yield at 5 locations. Observing the obtained data of weed mass in this research the best weed control was at the location D, and the most effective weed control method was green fertilization. The highest soybean yield was observed at location A, especially after mechanical weed control method (subsoiling + chisel cultivator) when yield was 3.82 t ha-1. From the results it can be concluded that the weeds influence on yield is only one of the factors and it is necessary to pay attention to other agro-technical measures, and for determination of the most efficient weed control method it is necessary to conduct longer investigation.
Key words: Soybean yield, chemical weed control, mechanical weed control.
INTRODUCTION
One of the most important and expensive steps in soybean production is weed management (Reis and Vivian 2011). Weeds have long been recognized as a source of considerable economic loss in agro- and natural ecosystems. In agroecosystems, the nature and extent of weed interference vary from crop to crop and from location to location (Sanyal et al., 2008). Weed and crop plants are very similar in their demand for carbon dioxide and nitrogen from the atmosphere, water and minerals from the soil and light from the sun for their growth and development (Oerke 2006; Daramola et al., 2020). By utilization of these components weeds
48. ACTUAL TASKS ON AGRICULTURAL ENGINEERING
Preliminary communication

J. Lakić, I. Kovačev, D. Filipović, K. Barić, A. Pintar, M. Grubor
382
drastically restricted the growth of crop plant and reduce the yield. Weeds are important component of the agroecosystem, they provide functions such as nutrient cycling and reduction of soil erosion (Marshall et al. 2003), but agricultural experts and growers throughout the world consistently indicate that weeds are one of the most economically important pest of soybean. Due to weed interference yield losses in soybean vary from 20 to 80% in different agro-climatic conditions (Kurchania et al., 2001; Labrada 2003).
Weeds undoubtedly cause great damage to agricultural production and it is important not to allow insemination of them in the field and on uncultivated areas (canals, lazy, neglected lands), because they are a source of infection (Bilandžić et al., 2003).
Weed control in soybeans has a particularly important role. The application of herbicides is the most common and most effective way of control. Due to the imperatives of sustainable use of pesticides (protection of human health, environment and biodiversity) and due to the limited choice of herbicides, in weed control in soybean cultivation it is necessary to rely on non-chemical (alternative) measures (Barić et al., 2019). In general, non-chemical weed control measures are numerous and aim to control weeds by mechanical tillage.
Until the realization of the negative effect of herbicides on the environment, weed control was mainly focused on the application of herbicides. During their intensive application (“chemicalization era”), weed surveillance in the context of agroecosystems has been neglected and control strategies that simultaneously include economic, environmental and sociological factors have not been developed (Barić et al., 2014).
Historically, weed control was mostly incidental to tillage and to growing of densely planted crops for many centuries (Timmons 2005). Last few decades, various methods of cultivation for improving the different crops yield potential (Swanton and Weise, 1991) which, at the same time, have the ability to enhance ecosystem services (e.g., increases in soil organic matter, soil water retention capacity and soil biodiversity) (Lal, 2013) have been examined. In this context crucial role plays a soil tillage, as it determines both the productivity of the cropping system in terms of yield as well as its environmental impacts, such as soil erosion or carbon sequestration (Weber et al., 2017). Soil tillage has been performed for millennia because it reduces weed density while positively affecting water and nutrient availability (Lal, 2009).
Due to the above mentioned the aim of the paper is to find optimal weed control methods (conventional tillage, chemical weed control method, green fertilization, mulching, subsoiling + chisel cultivator) to ensure soybean growth and yield.
MATERIALS AND METHODS
Soybean cultivation was carried out in the surroundings of Zagreb on 5 family farms. Table 1 shows names, locations and soil type at each family farm.
On each family farm, 5 experimental plots were set up on which different methods of weed control were monitored. The first plot was control plot and it was based on conventional classical tillage (plowing + harrowing) without additional weed control. On the second plot, a chemical weed control method was used, spraying in the generative phase of weeds with 2% glyphosate (200 L ha-1). On other plots, non-chemical methods of weed control were carried out, namely green fertilization (TG14 mixture of green fertilization and mulching), mulching (2 times seasonally when weeds reached the generative phase) and destruction of

Influence of different weed control methods on soybean yield
383
weeds by mechanical weed control method (after wheat harvesting subsoiling was applied, and when the weeds have reached the generative stage chisel cultivator was used).
Table 1 Family farms locations and soil types
Location Family farm Coordinate Soil type
A Marković 45°50'53.2"N 16°11'12.0"E
pseudogley-gley pH 7.8
B Čižmek 45°50'48.8"N 16°11'19.2"E
pseudogley-gley pH 7.8
C Godec 45°50'06.7"N 16°11'38.9"E
pseudogley-gley pH 5.2
D Granđa-Kovač 45°52'01.6"N 16°08'38.9"E
pseudogley-gley pH 7.8
E Balšić 45°53'03.5"N 16°10'16.8"E
pseudogley-gley pH 5.2
On family farms, an area of 3,000 m2 was prepared for the experiment, i.e. for each weed
control method plots 6x100 m arranged side by side in width. All conducted agro-technical measures are shown in table 2.
Table 2 Conducted agro-technical measures
Agro-technical measures
Used mechanization
Conventional tillage
Chemical method
Green fertilization Mulching
Subsoiling + chisel
cultivator
Ploughing Khun 152 December 2017
Subsoiling Awemak GMR 7 August
2017 Chisel cultivator
Gruber InterTech September
2017 Harrow Kuhn 3002 April 2018
Spraying Hovard 440 September 2017
Direct TG14 sowing
combined tillage tool* August
2017
Mulching Technos 300 August 2017;
September 2017
Direct soybean sowing
pneumatic seed drill
OLT PSK 4 April 2018 April
2018 April 2018 April 2018 April 2018
Harvest Deutz Fahr 1002
October 2018
October 2018
October 2018
October 2018
October 2018

J. Lakić, I. Kovačev, D. Filipović, K. Barić, A. Pintar, M. Grubor
384
Sowing was carried out directly at all locations except on the control plot where the classic soil was prepared by plowing and harrowing. Sowing was carried out with a 4-row OLT seed drill with a row spacing of 50 cm, i.e. 500,000 plants were sown per hectare. The cultivar 000 Ema (Osijek) was used in the experiment.
Weed plants were removed from the m2 area at the full age of weeds at the end of July, they are identified and weed weight values were obtained by weighing.
Before harvesting, 10 plants were sampled from the surface and the number of pods was counted on them. Harvesting was done at full maturity of soybeans with a combine and the grain yield was calculated in t ha-1 according to the standard (13% water and 2% impurities).
RESULTS AND DISCUSSION
To determine the impact of the weed control method, it is most important to study the number of weeds per m2 after the applied control methods. Therefore, table 3 shows the mass of weeds per m2 at all investigated locations after applying different control methods, while table 4 shows a list of identified weed at family farms.
Table 3 Weeds mass at 5 experimental locations (kg m-2)
Method Location
Conventional tillage
Chemical method
Green fertilization Mulching
Subsoiling + chisel
cultivator
A 1.26 0.47 1.48 1.26 1.48
B 1.85 0.46 1.78 1.62 1.55
C 1.91 2.25 0.57 1.14 2.07
D 1.65 1.72 0.26 1.14 0.61
E 1.85 1.59 1.22 1.41 1.07
ẋ 1.70 1.30 1.06 1.31 1.36
From table 3 it can be seen that weed emergence is affected by the location, as well as the previous used agro-technical measures. At the location A and B, the chemical method of control proved to be the best, at the location C and D green fertilization, while at the location E the destruction of weeds by tillage (subsoiling + chisel cultivator) proved to be the most effective. The difference in weed emergence with regard to the applied control methods, although identical experimental conditions were created on the plots, is possible with regard to the previous agro-technical measures used and weed seeding on family farms.
As expected, tables 2 and 3 show that the number of pods is related to soybean grain yield. The highest yield was observed at the location A after weeding with tillage (subsoiling + chisel cultivator), also increased yield after weeding by tillage is visible at the location C and D. At the location B, the highest yield was achieved after the chemical method of weedcontrol.

Influence of different weed control methods on soybean yield
385
Table 4 List of identified weed at family farms
Location
A B C D E
Echinochloa crus-galli, Setaria spp. Panicum spp. Abutilon theophrasti Cirsium arvense Convolvulus arvensis Chenopodium album Polygonum persicaria Sorghum halepense
Echinochloa crus-galli, Setaria spp. Panicum spp. Ambrosia artemisiifolia Cirsium arvense Convolvulus arvensis Chenopodium album Polygonum persicaria Lipandra polysperma Sorghum halepense
Echinochloa crus-galli, Setaria spp. Panicum spp. Ambrosia artemisiifolia Chenopodium album
Echinochloa crus-galli, Setaria spp. Panicum spp. Ambrosia artemisiifolia Cirsium arvense Convolvulus arvensis Mentha arvensis
Abutilon theophrasti Ambrosia artemisiifolia Cirsium arvense Sorghum halepense
Table 5 shows the soybean yield and table 6 shows number of pods after conducted weed control methods
Table 5 Soybean yield at 5 experimental locations (t ha-1)
Method Location
Conventional tillage
Chemical method
Green fertilization Mulching
Subsoiling + chisel
cultivator
A 2.47 1.47 1.91 1.21 3.82
B 0.46 1.75 0.82 0.99 0.72
C 1.77 1.65 2.19 1.44 2.53
D 1.03 1.17 2.24 0.77 2.57
E 0.08 2.14 0.77 0.09 0.87
ẋ 1.16 1.64 1.59 0.90 2.10
At the location E, a significantly lower yield was observed, which was the result of dense and high weed flora, so no pods developed. In mulching, a lower yield was observed at all locations, because after the destruction of weeds, the lower flora of weeds remains and it still draws nutrients from the soil and prevents the development of pods.

J. Lakić, I. Kovačev, D. Filipović, K. Barić, A. Pintar, M. Grubor
386
Table 6 Number of pods from 10 soybean plants at 5 experimental locations
Method Location
Conventional tillage
Chemical method
Green fertilization Mulching
Subsoiling + chisel
cultivator
A 264 169 193 144 387
B 83 217 92 131 83
C 240 194 238 175 281
D 133 135 222 105 302
E 13 231 107 13 106
ẋ 147 189 170 114 232
From the above mentioned it can be concluded that the weeds influence on yield is only one of the factors and it is necessary to pay attention to other agro-technical measures. Other factors influencing yield are variety, year, and location (Taylor-Lovell et al., 2002). A number of authors have researched the influence of the environment, soil type and variety on yield heights. Similar research on soybean grain yield was conducted by Sudarić and Vratarić (2001), Jukć et al. (2007), Sudarić et al. (2009). The results obtained by these authors show that the differences in grain yield between the examined varieties at all research sites are statistically significant.
CONCLUSION
Although identical weed control measures were used on all family farms, their emergence was encouraged by the previously used agro-technical measures and insemination. Therefore, many years of research into the application of identical agronomic conditions are needed to determine which weed control method is more effective. It can also be concluded that weed control is one of the factors for soybean yield, but it is necessary to pay attention to other agro-technical growing conditions that equally affect the yield.
REFERENCES
Barić, K., Ostojić, Z., Šćepanović, M. (2014). Integrirana zaštita bilja od korova. Glasilo biljne zaštite, 14(5), 416-434.
Bilandžić, M., Sudarić, A., Duvnjak, T., Mijić, A. (2003). Učinkovitost različitih načina suzbijanja korova u soji. Fragmenta phytomedica et herbologica, 28(1-2), 33-40.
Daramola, O.S., Adeyemi, O.R., Adigun, J.A., Adejuyigbe, C.O. (2020). Influence of row spacing and weed control methods on weed population dynamics in soybean (Glycine max L.). International Journal of Pest Management, 1-16.
Jukić, G., Guberac, V., Marić, S., Dunković, D. (2007). Ekonomski aspekti proizvodnje soje u Istočnoj Hrvatskoj. Poljoprivreda, 13(2), 23-28.
Influence of different weed control methods on soybean yield
387
Kurchania, S.P., Rathi, G.S., Bhalla, C.S., Mathew, R. (2001). Bioefficacy of Post-emergence Herbicides for Weed Controlin Soybean [Glycine max (L.) Merr.]. Indian Journal of Weed Science, 33(1and2), 34-37.
Labrada, R. (2003). The need for improved weed management in rice. Sustainable rice production for food security. Proceedings of the 20th Session of the International Rice Commission; Bangkok, Thailand: FAO.
Lal, R. (2009). The plow and agricultural sustainability. Journal of sustainable agriculture, 33(1), 66-84. Lal, R. (2013). Enhancing ecosystem services with no-till. Renewable agriculture and food
systems, 28(2), 102-114. Marshall, E.J.P., Brown, V.K., Boatman, N.D., Lutman, P.J.W., Squire, G.R., Ward, L.K. (2003). The
role of weeds in supporting biological diversity within crop fields. Weed research, 43(2), 77-89. Oerke, E.C. (2006). Crop losses to pests. The Journal of Agricultural Science, 144, 31. Reis, A.R., Vivian, R. (2011). Weed competition in the soybean crop management in brazil. In In
Soybean-Applications and Technology. InTech. Sanyal, D., Bhowmik, P.C., Anderson, R.L., Shrestha, A. (2008). Revisiting the perspective and progress
of integrated weed management. Weed Science, 161-167. Sudarić, A., Vratarić, M. (2001). Stabilnost i adaptabilnost nekoliko OS-kultivara soje u urodu
zrna. Poljoprivreda, 7(1), 18-24. Sudarić, A., Vratarić, M., Duvnjak, T., Klarić, J. (2009). Fenotipska stabilnost uroda zrna nekoliko
OS-kultivara soje. Poljoprivreda, 9(2), 5-12. Swanton, C.J., Weise, S.F. (1991). Integrated weed management: the rationale and approach. Weed
technology, 657-663. Taylor-Lovell, S., Wax, L.M., Bollero, G. (2002). Preemergence Flumioxazin and Pendimethalin and
Postemergence Herbicide Systems for Soybean (Glycine max) 1. Weed technology, 16(3), 502-511. Timmons, F.L. (2005). A History of Weed Control in the United States and Canada1. Weed
Science, 53(6), 748-761. Weber, J.F., Kunz, C., Peteinatos, G.G., Zikeli, S., Gerhards, R. (2017). Weed control using
conventional tillage, reduced tillage, no-tillage, and cover crops in organic soybean. Agriculture, 7(5), 43.


48th Symposium "Actual Tasks on Agricultural Engineering", Zagreb, Croatia, 2021
389
EFFICIENCY OF ALTERNATIVE WEED CONTROL SYSTEMS IN THE VINEYARD
Peter BERK1*, Andrej PAUŠIČ1, Denis STAJNKO1, Andreja URBANEK KRAJNC1, Peter VINDIŠ1, Damijan KELC1, Aleš BELŠAK2, Danijela KOSI1, Mario LEŠNIK1
*E-mail of corresponding author: [email protected] 1University of Maribor, Faculty of Agriculture and Life Sciences, Pivola 10, 2311 Hoče, Slovenia 2Department of Engineering Design, University of Maribor, Faculty of Mechanical Engineering,
Smetanova 17, 2000 Maribor, Slovenia
ABSTRACT
In the presented study we investigated alternative methods of weed control in the vineyard under 'Sauvignon' vines and compared them with conventional herbicides. Weed control was performed at the experimental site with the following treatments: 1) conventional chemical control using herbicide glyphosate and herbicide flumioxazine (pre- and post-em.) in two different dosages; 2) alternative chemical control based on pelargonic acid, citrus essential oil, vinegar and 3) weed control by flame burning. In addition, 4) mechanical weed control under vines was carried out with a grass cutter (llama), a rotating star hoe (roll hoe) and a vine trunk cleaner, while at the same time additional mulching was carried out in the belts between the rows. While carrying out the chemical and mechanical control, we analysed the weed coverage, grape yield, yield loss, total soluble sugars and titratable acids. Pearson's correlations coefficient was calculated between the evaluated parameters and the results showed moderate negative correlations between weed coverage and grape yield, whereas the correlations between weed coverage and yield loss were significantly positive. Grape yield was highest for weed-free control plots, followed by plots where ploughshare llama and glyphosate were used. Yield loss was lowest when using ploughshare llama and burning, while the highest loss was observed when using fluomixazine regardless of concentration. In addition to the weed-free plot, weed coverage was lowest when glyphosate was used. Among the alternative chemical treatments, pelargonic acid was most effective, while mechanical treatments resulted in significantly lower weed cover with llama ploughshare and rotary hoe.
Keywords: citrus essential oil, fluomixazine, mechanical control, pelargonic acid, vinegar, weed coverage, yield loss
48. ACTUAL TASKS ON AGRICULTURAL ENGINEERING
Original scientific paper
P. Berk, A. Paušič, D. Stajnko, A. Urbanek Krajnc, P. Vindiš, D. Kelc, A. Belšak, D. Kosi, M. Lešnik
390
INTRODUCTION
Weed control is one of the basic technological operations in vineyards to ensure the appropriate quantity and quality of crop yield (Cirujeda et al., 2012). For this purpose, weed control practices can be achieved through cultural or chemical practices or a combination or both methods (Balsari et al., 2006). EU policy for sustainable use of pesticides is aimed to reduce the use of pesticides for agricultural production in accordance with the guidelines of the new "Green deal" development strategy. Of all pesticides, herbicides are most frequently used chemicals, whereby stakeholders have the greatest public pressure and demand to achieve a significant reduction in seasonal rates applied to agricultural production areas. The symbol of chemical agriculture is the herbicide glyphosate, used once or twice a year as the most frequent weed control practice that the EU policy wants to ban in the near future (Antier et al., 2020). All countries are conducting research on the environmental and economic consequences of discontinuing the use of glyphosate and are testing alternative weed control methods (e.g. mechanical control, burning with flame or water vapour, etc.) or alternative chemical control that implicates plant based organic herbicides (e.g. organic acids) or non-synthetic products (e.g. vegetable oils, etc.) (Tourte et al., 2008; Manzone et al., 2020). Research should take into account the economic and environmental aspects of different weed control techniques. Mechanical control increases energy consumption, farmer working time load as well as erosion risks in vineyards on slopes (Tamagnone et al., 2011). Hugh investment in new machines is needed. There are also some obstacles in using alternative chemical control. The effectiveness of alternative chemicals is often lower than the effectiveness of glyphosate and more applications are required annually. When using alternative classical herbicides (e.g. flumioxazine, flazasulfuron, MCPA, etc.) we increase the total annual input of herbicides into the vineyard ecosystem. Furthermore, alternative organic herbicides are expensive and the annual cost of purchasing of weed control chemicals can increase 3 to 5 times (Tourte et al., 2008; Shrestha et al., 2013).
The presented article shows the effectiveness of different weed control measures by comparing the standard use of conventional herbicide, alternative chemical herbicides, burning, and three methods of mechanical weed control by analyzing the weed coverage (%), total soluble solids, sum of titratable acids (STA), grape yield and yield loss.
MATERIAL AND METHODS
Experimental plot design The experiment was conducted in the vineyard of the agricultural farm Vinko Šerbinek
located in Plač, nortestern Slovenia. The size of the vineyard experiment area was 2000 m2, the GIS location of vineyard was 46°40'10.2" N, 15°35'57.7" E. Vines of cultivar ‘Sauvignon’ grown in an intensive 16-year old vineyard plantation were grafted on Kober 5BB rootstock and spacing was 2.3 m x 0.85 m. The height of vine stocks steam was 0.7 m and plants were fixed in vertical trellis and trained accaording to standard unilateral Guyot with single-spawning (spar with up to ten buds) with a plug (one to two buds on the plug). In the past, weed management undernith the vines was always done by application of glyphosate based herbicides and by mulching the grass strip between the vine rows.
Efficiency of alternative weed control systems in the vineyard
391
Weed community under wine rows was composed of the following species: a) dominant species: Lolium perenne, Elymus repens, Poa annua, Cirsium arvense, Taraxacum officionale, Urtica dioica, Glechoma hederacea b) species with medium abundance: Setaria glauca, Digitaria sanguinalis, Aegopodium podagraria, Convolvolus arvensis, Daucus carota, Polygonum aviculare, Potentilla reptans, Senecio vulgaris, Ajuga reptans, Veronica persica, Sonchus asper, Ranunculus repens, Conyza canadensis, Achilea millefolium, Agrosits alba c) species with low abundance: Bromus sp., Medicago lupolina, Cerastium sp., Stenactis annua, Trifolium repens, Galium verum, Galium aparine, Plantago sp., Stellaria media, Prunella vulgaris, Lisimachia nommularia. The research was carried out on site using the methods overviewed in Table 1: 1) herbicide
glyphosate, 2) herbicide flumioxazine in different doses, 3) alternative chemicals based on pelargonic acid, citrus essential oil, vinegar (9% or 20% acetic acid) and 4) burning (use of 60-70 kg ha-1 of propane-butane gas). First four listed methods were compared with mechanical control methods carried out with three different tractor attachments from BRAUN Maschinenbau GmbH: a grass cutter (llama), a rotating star hoe (roll hoe) and a vine trunk cleaner.
Individual plot represented a 0.5 m wide and 10 m long stripe. Statistical design was randomised block with 4 repetitions of plots. Plots with mechanical weed control treatments were arranged in separate vine rows, whereby a 90 m row was managed by use of a specific tool. Rows were than devided in sections which were statistically considered as repetitions.
Viticultural tools for alternative mechanical weed control We used three Braun tools (Figure 1 a, b) to control weeds under vines. Namely the Braun
LUV Perfect grass trimmer (ploughshare blade undercuter; locally called Lama), rotating wheel or star hoe tiller and trunk cleaner monuted on side of mulcher. The Braun LUV Perfekt trimmer is used for efficient and environmentally friendly cultivation in the vineyard. That is, to cultivate a strip of soil undernith the vines. In fact the blade undercuts and lifts the weed and turf cover and facilitetes loosening of soil. Tool blade was equipped with lifting adopters that allow better "dissolution" of soil and grass turf. In our case ploughshare trimmer was mounted at the side of tractor attached in the middle bracket with two hydraulic cylinders that allow the transverse movement of the tool in a row near the vine. This bracket is integrated on the left and right bracket for various tools (working elements). Above the working element – the grass trimmer, there is a sensor – a mechanical lever which is movable in parallel with respect to the grass trimmer. When bumping into a trunk of a vine or tree or bumping into a pillar the mechanical lever activates the control valve and the hydraulic cylinder moves grass trimmer away from these obstacles. We need two hydraulic connections for operation, pressure and return line. In front of the grass trimmer, a plate is also placed on a fixed bracket, which cuts the ground or grass. On the frame lifting system is also mounted, which with a hydraulic cylinder allows precise adjustment of the vertical position of the working element. We always lowered the grass trimmer to the working depth while driving. In the experiment we worked shallower, that suggested by manufacturer between 7 and 10 cm deep, with the set working depth being maintained without difficulty. The grass trimmer was installed only on one side of the tractor and the rotating wheel on the other. For tool operation (grass trimmer) the oil flow was 7 to 12 L min-1.

P. Berk, A. Paušič, D. Stajnko, A. Urbanek Krajnc, P. Vindiš, D. Kelc, A. Belšak, D. Kosi, M. Lešnik
392
Table 1 Overview of the chemical and mechanical treatments.
Treatment Application dose Treatment date
V1 Glyphosate Tajfun (glyphosate 36%) 6 L ha-1
Tajfun (glyphosate 36%) 6 L ha-1 May 5th July 28th
V2 Pelargonic acid Beloukha (pelargonic acid 68%) 18 L ha-1
Beloukha (pelargonic acid 68%) 40 L ha-1
Beloukha (pelargonic acid 68%) 60 L ha-1
May 5th
May 29th July 28th
V3 Acetic acid Vinigar (9%) 80 L ha-1
Acetic acid (80%) 80 L ha-1
Acetic acid (80%) 80 L ha-1
May 5th
May 29th
July 28th
V4 Citrus oil LDC – coconut soup
Oranol (90% citrus oil) 15 L ha-1
Oranol 30 l/ha + LDC 2 L ha-1
Oranol 45 l/ha + LDC 3 L ha-1
May 5th
May 29th
July 28th
V5 Flaming of weeds by handheld torch
Gas butane/propane 60 kg ha-1
Gas butane/propane 60 kg ha-1
Gas butane/propane 60 kg ha-1
May 5th
May 29th
July 7th
V6 Control plot Without any treatment
V7 Control weed free plots Hand hoeing and weeding Hand hoeing 8 times
V8 Star hoe Tractor driven, operated at 5 km h-1 April 24th, June 30th, August 26th
V9 Ploughshare llama Tractor driven, operated at 5 km h-1 April 24th, June 30th, August 26 th
V10 Vine trunk cleaner Tractor driven mulcher attached, 5 km h-1 April 24th, June 30th, August 26th
V11 Flumioxazine + glyphosate
Pledge (50% flumioxazine) 90 g ha-1 + Tajfun (36 % glyphosate) 1 L ha-1 May 11th
V12 Flumioxazine post-emergence
Pledge (50% flumioxazine) 90 g ha-1 May 11th
V13 Flumioxazine pre-emergence
Pledge (50% flumioxazine) 90 g ha-1 May 11th
V14 Flumioxazine post-emergence
Pledge (50% flumioxazine) 1200 g ha-1 May 15th
V15 Flumioxazine pre-emergence
Pledge (50% flumioxazine) 1200 g ha-1 May 15th

Efficiency of alternative weed control systems in the vineyard
393
a) b) Figure 1 Braun tools for control of weeds undernith vines in the vineyard a) LUV Perfect
grass trimmer - ploughsare undercuter mounted on side of tractor (locally called llama) and trunk cleaner attached on side of mulcher, b) rotating star hoe.
Another weeding tool was the rotating star hoe called in german Rollhacke (Figure 1 b)
used for loosening the soil along the vine and for mechanical weed control in the row space. The principle of operation is the same as by disc plates. The circular star perch has two star plates, the teeth of these stars are curved. These teeth scrape small grooves from the surface during rolling. Compared to disc plates, circular star hoes achieves good performance even at low operating speeds (from 4.5 km h-1 onwards). It does not leave a flat cutting edge, which significantly reduces the risk of water erosion of the slope. Therefore, use of this tool is also recommended on steep vineyards. The inclination angle of the working elements is adjusted without tools, only by selecting the appropriate hole on the bracket. There are as many as 43 of these holes. By selecting the setting angle, we also determine the aggressiveness of tool operation of the star plates.
The third tool was hydraulic driven vine trunck cleaner Braun RP W1 mounted on side of Braun Alpha sensorthronic mulcher with primary function to remove water shoots – suckers from vine trunk. Rotating rubber paddles on single rotating shaft (30 cm long) cut away weeds and mulch them. In our case mulched stripe was 20 cm wide belt on each side of vine trunk. Overview of treatment variants for herbicide and mechanial application is shown in Table 1.
Herbicide application method and control method efficiancy evaluation Herbicides were applied in concentrations as shown in Table 1. They were applied with
backpack sprayer Solo 425 equipped with nozzle Hypro VP 110 – 03 using 300 L of spray per hectare. Droplet VMD value was close to 240 µm. Herbicides were applied on 50 cm wide stripe under vines.
Efficacy of herbicides and of machine control measures was estimated by visual scoring of level of damage done to weeds. In this publication we show just data on coverage values for 4 evaluations a season. Coverage % represents the share of soil area covered by living weeds. Data on % efficacy for individual weed species are not shown.
Statistics The weed coverage, yield traits and quality parameters of grapes were presented by means
and standard errors and were statistically evaluated by one-way analysis of variance (ANOVA). Significant differences (P < 0.05) between the mean values of each biochemical trait were determined using the post hoc Tukey’s HSD test. Significant differences (P < 0.05)
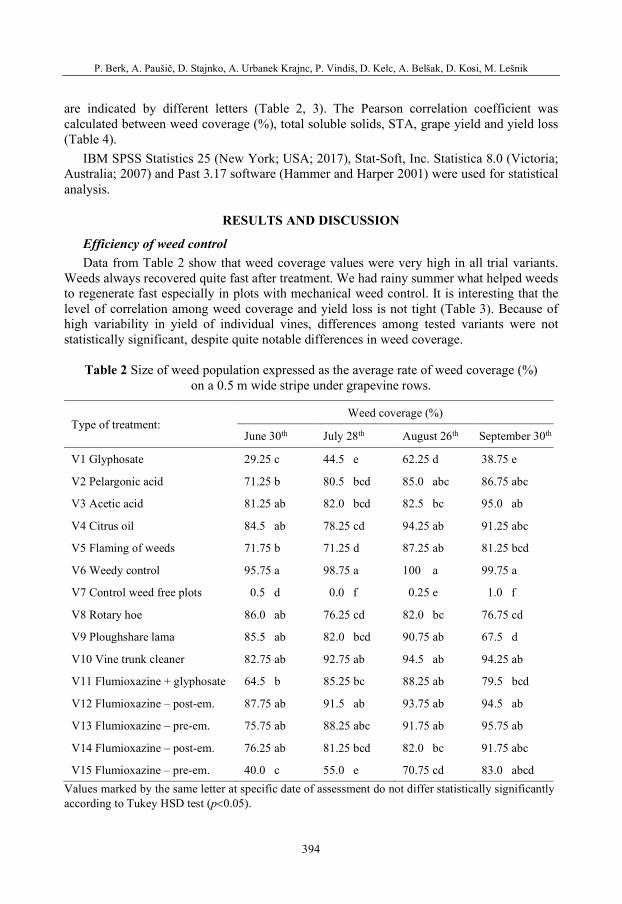
P. Berk, A. Paušič, D. Stajnko, A. Urbanek Krajnc, P. Vindiš, D. Kelc, A. Belšak, D. Kosi, M. Lešnik
394
are indicated by different letters (Table 2, 3). The Pearson correlation coefficient was calculated between weed coverage (%), total soluble solids, STA, grape yield and yield loss (Table 4).
IBM SPSS Statistics 25 (New York; USA; 2017), Stat-Soft, Inc. Statistica 8.0 (Victoria; Australia; 2007) and Past 3.17 software (Hammer and Harper 2001) were used for statistical analysis.
RESULTS AND DISCUSSION
Efficiency of weed control Data from Table 2 show that weed coverage values were very high in all trial variants.
Weeds always recovered quite fast after treatment. We had rainy summer what helped weeds to regenerate fast especially in plots with mechanical weed control. It is interesting that the level of correlation among weed coverage and yield loss is not tight (Table 3). Because of high variability in yield of individual vines, differences among tested variants were not statistically significant, despite quite notable differences in weed coverage.
Table 2 Size of weed population expressed as the average rate of weed coverage (%)
on a 0.5 m wide stripe under grapevine rows.
Type of treatment: Weed coverage (%)
June 30th July 28th August 26th September 30th
V1 Glyphosate 29.25 c 44.5 e 62.25 d 38.75 e
V2 Pelargonic acid 71.25 b 80.5 bcd 85.0 abc 86.75 abc
V3 Acetic acid 81.25 ab 82.0 bcd 82.5 bc 95.0 ab
V4 Citrus oil 84.5 ab 78.25 cd 94.25 ab 91.25 abc
V5 Flaming of weeds 71.75 b 71.25 d 87.25 ab 81.25 bcd
V6 Weedy control 95.75 a 98.75 a 100 a 99.75 a
V7 Control weed free plots 0.5 d 0.0 f 0.25 e 1.0 f
V8 Rotary hoe 86.0 ab 76.25 cd 82.0 bc 76.75 cd
V9 Ploughshare lama 85.5 ab 82.0 bcd 90.75 ab 67.5 d
V10 Vine trunk cleaner 82.75 ab 92.75 ab 94.5 ab 94.25 ab
V11 Flumioxazine + glyphosate 64.5 b 85.25 bc 88.25 ab 79.5 bcd
V12 Flumioxazine – post-em. 87.75 ab 91.5 ab 93.75 ab 94.5 ab
V13 Flumioxazine – pre-em. 75.75 ab 88.25 abc 91.75 ab 95.75 ab
V14 Flumioxazine – post-em. 76.25 ab 81.25 bcd 82.0 bc 91.75 abc
V15 Flumioxazine – pre-em. 40.0 c 55.0 e 70.75 cd 83.0 abcd Values marked by the same letter at specific date of assessment do not differ statistically significantly according to Tukey HSD test (p<0.05).

Efficiency of alternative weed control systems in the vineyard
395
In glyphosate treated plots the coverage was varied from 30 to 50% throughout most of the season. This was due the successive emergence of perennial weeds. Despite two treatments some weed cover was always present. Among alternative chemical solutions the best result was achieved by application of pelargonic acid, but it was still far away from expected. Despite bigger dose of this product (40 L ha-1) we were not able to control weeds successfully. A part of a problem represents the size of weeds at the time of pelargonic acid application. Especially grasses were not damaged substantially by tested dose. The same goes for application of acetic acid and citrus oil. From economic reasons, we decided to limit weed control on just 3 applications per season, but three applications were not enough.
Table 3 Grape yield, yield loss (%)*, total soluble solids and sum of titratable acids
(STA, g L-1).
Treatment Grape yield (kg h-1)
Yield loss (%)*
Total soluble solids TSS (oOe 25 oC)
STA (g L-1)
V1 Glyphosate 16,559.4 a 15.6 ab 79.8 a 10.48 ab
V2 Pelargonic acid 15,575.6 ab 12.5 b 85.5 a 11.25 a
V3 Acetic acid 14,151.9 ab 17.4 ab 89.0 a 10.77 ab
V4 Citrus oil 12,667.5 ab 26.5 ab 83.8 a 10.94 ab
V5 Flaming of weeds 15,648.8 ab 9.6 b 89.5 a 10.91 ab
V6 Weedy control 9,973.1 b 38.1 a 82.5 a 9.39 ab
V7 Control weed free plots 17,192.5 a / 86.3 a 10.85 ab
V8 Rotary hoe 15,426.6 ab 14.9 a 82.5 a 10.24 ab
V9 Ploughshare lama 16,647.2 a 10.1 b 89.5 a 9.24 b
V10 Vine trunk cleaner 13,626.6 ab 25.3 ab 84.3 a 9.66 ab
V11 Flumioxazine + glyphosate 12,763.7 ab 28.7 ab 89.9 a 10.03 ab
V12 Flumioxazine – post-em. 11,207.8 ab 34.6 a 85.6 a 11.19 ab
V13 Flumioxazine – pre-em. 11,156.6 ab 36.3 a 87.9 a 11.05 ab
V14 Flumioxazine – post-em. 14,439.4 ab 21.3 ab 87.3 a 10.03 ab
V15 Flumioxazine – pre-em. 11,854.7 ab 28.7 a 86.8 a 10.48 ab Values marked by the same letter at specific parameter do not differ statistically significantly according to Tukey HSD test at (α<0.05). * compared to V7
Alternative herbicides should be applied earlier and more frequently. To achieve high
efficacy, the preparations should be applied 4 to 5 times a season. We got a relatively good result when using fire. According to coverage values, the burning was comparable or slightly
P. Berk, A. Paušič, D. Stajnko, A. Urbanek Krajnc, P. Vindiš, D. Kelc, A. Belšak, D. Kosi, M. Lešnik
396
better than using mechanical weed control tools. Among the three mechanical tools, we achieved the best result when using a rotary hoe. The coverage ranged between 70 and 80%. When using a grass trimmer, the coverage ranged between 80 and 90%, and when using a vine trunk cleaner, the coverage was above 90% for most of the season. In mechanical suppression, we did not achieve the desired efficiencies because soil of the vineyard was always too wet and the tools did not work optimally. Besides, we used them at too low speed. For more thorough weed control, the tools should be used 4 to 5 times at a higher working speed. According to literature sources we shell achieve higher efficacy and better efficacy when using of organic herbicides (Shrestha et al., 2013; Manzone et al., 2020). In study of (Manzone et al., 2020) the residual efficacy of mechanical control operations (cultivator and mulcher) was much longer, but they performed trial in summer season with less rain on drier soil. When using the herbicide flumioxazine, we achieved a good result only in the treatment where we used 1.2 kg of preparation per hectare before emergence. In other treatments, the weeds recovered very quickly. When treated with 1.2 kg of Pledge after weed emergence, the coverage was below 70% for only a short time. A single application of Pledge alone cannot achieve comparable efficacy to that when using Tajfun 6 L ha-1. The use of mechanical methods has been shown to be equivalent to the use of alternative herbicides or the use of the herbicide flumioxazine. None of the tested methods is equivalent in efficacy with a twice annual application of the glyphosate at tested dose.
Grape yield The 2020 season was very favourable for the development of the grapevine and we had a
high grape yield. Due to the rainy summer and the very well supplied soil with nutrients, the weeds had a very lush development. In none of the tested weed control methods, we achieved complete weed control and yield losses were assumed to be large. A medium positive correlations were obtained between weed coverage and yield loss. Consequently, the correlations between weed coverage and grape yield were moderately negative (Table 4).
In the weedy control, we lost 7,219.37 kg of grapes per hectare, which is 38.1% of the crop yield when compared to weed free control (Table 3). Yield loss in plots treated with the herbicide glyphosate amounted 633 kg of grapes per ha (i.e. 15.6%) (Table 3). Glyphosate has been used in experimental vineyard for a long time and some weeds may already be quite tolerant to it (e.g. ground elder, bull thistle, perennial ryegrass, bindweed and moneywort). It should also be noted that we used a relatively small dose of glyphosate, only 2,160 g ha-1 of pure glyphosate per individual treatment. Alternative herbicides interesting for organic grape production had low efficiency but crop losses were not as high as expected. 12.5% of yield was lost in plots where pelargonic acid was applied and 17.4% yield loss was determined when using acetic acid. When using citrus oil, the loss was much higher and amounted 26.5% when compared to weed free control. Our findings on organic herbicides are in line of findings of Californian researchers (Shrestha et al., 2013). Efficiency of similar products in their trials were a little bit higher. We were surprised by the high yield on the vines treated by fire, because the yield loss was only 9.6%, despite the weed coverage value being 80% and the weeds recovered quite quickly after being burned. We achieved a good result with mechanical suppression tools, too. At rotary hoe cultivated plots, the loss was only 14.9% and at plots cultivated with grass trimmer it was only 10.1%, while for plots managed by use of trunk cleaner the loss was high and amounted 25.3% (Table 3).

Efficiency of alternative weed control systems in the vineyard
397
Tabl
e 4
Pear
son’
s cor
rela
tion
coef
ficie
nts b
etw
een
wee
d co
vera
ge (%
), to
tal s
olub
le so
lids,
STA
, gra
pe y
ield
and
yie
ld lo
ss.
Stro
ng a
nd m
oder
ate
corr
elat
ions
bet
wee
n th
e m
easu
red
char
acte
ristic
s are
mar
ked
in b
old,
neg
ativ
e co
rrel
atio
ns a
re m
arke
d in
red.
w
eed
cove
rage
(%
) w
eed
cove
rage
(%
) w
eed
cove
rage
(%
) w
eed
cove
rage
(%
) TS
S pH
ST
A
grap
e yi
eld
yiel
d lo
ss
30
.06.
2020
28
.07.
2020
26
.08.
2020
30
.09.
2020
(O
e)
(g
L-1
) (k
g ha
-1)
(%)
wee
d co
vera
ge (%
) 30
.06.
20
8,
75*1
0-17
0,
0 2,
76*1
0-11
0.72
6 0.
615
0.47
5 0.
001
0.00
2
wee
d co
vera
ge (%
) 28
.07.
20
0.88
4
0,0
3,56
*10-1
8 0.
700
0.39
0 0.
313
0.00
1 0.
001
wee
d co
vera
ge (%
) 26
.08.
20
0.84
8 0.
925
2,
29*1
0-15
0.75
2 0.
614
0.53
0 0.
003
0.00
1
wee
d co
vera
ge (%
) 30
.09.
20
0.81
4 0.
887
0.86
8
0.41
3 0.
800
0.58
1 0.
001
0.00
1
tota
l sol
uble
solid
s TS
S (O
e)
0.04
6 0.
050
0.04
1 0.
107
0.
550
0.45
8 0.
440
0.54
6
pH
0.06
6 0.
112
0.06
6 0.
033
0.07
8
1,53
*10-2
0 0.
667
0.69
3
STA
(g L
-1)
-0.0
94
-0.1
32
-0.0
82
-0.0
72
-0.0
97
-0.9
15
0.
704
0.78
0
grap
e yi
eld
(k
g ha
-1)
-0.3
96
-0.4
45
-0.3
74
-0.4
70
-0.1
01
0.05
6 -0
.049
1,90
*10-
13
yiel
d lo
ss (%
) 0.
387
0.46
3 0.
404
0.43
6 0.
079
-0.0
51
0.03
6 -0
.845

P. Berk, A. Paušič, D. Stajnko, A. Urbanek Krajnc, P. Vindiš, D. Kelc, A. Belšak, D. Kosi, M. Lešnik
398
When commenting results for a trunk cleaner, we must take into account that the tool was attached to mulcher and in the sense of technical design, it was not primarily designed for control of weeds but to remove shoots from the vine trunk. The rubber elements did not hit the weeds at the optimal angle and therefore the weeds were not severely damaged and cut off as supposed to be in case of classical weed trimmers.
As an alternative to the herbicide glyphosate, we tested the herbicide flumioxazine. At V14 post-emergence herbicide (Pledge 1.2 kg ha-1) was applied on bare ground, we had a residual effect for 1.5 months later on the intensive development of perennial weeds was visible. Perennial grasses renewed successfully. Yield loss was 21.3% (Table 3). At the same dose of flumioxazine applied on the weed green mass, the yield loss was 28.7%. This shows that even at a dose of 600 g of flumioxazine per ha in the vineyard, where weed population is composed from perennial weeds, it is not possible to provide complete control of weeds and to prevent crop losses with just one herbicide application.When using preparation Pledge at a dose of 90 gha-1, there was a moderate residual effect for three weeks, but the vegetation soon recovered and the yield loss was almost the same as it was on control parcel. With such a small dose, we cannot guarantee any significant control effect on weeds. The combination of Pledge 90 gha-1 with the addition of 1 L ha-1 of herbicide Tajfun is useless. Namely, the amount of glyphosate was too small to stop the development of weeds and therefore a large crop loss occurred.
Despite, we detected some differences in STA values, which were significantly lower when using ploughshare llama, all composition had no significant effect on TSS values. It is interesting that at glyphosate variant TSS was quite lower than at variants with alternative chemicals or with mechanical weeding (Table 3). We can see that most quality of all plots with mechanical weed control is equal to plots with chemical weed control. At alternative chemical methods (acids, oil) most quality does not differ a lot from most quality at weed free control parcel.
CONCLUSIONS
The use of alternative chemical herbicides for weed control based on pelargonic acid, acetic acid or citrus oil in the doses tested cannot guarantee comparable weed control efficiency to that achieved with glyphosate-based herbicides. More than three treatments per year are required. Even if mechanical weed control is carried out three times per season, it is not possible to guarantee comparable effectiveness to that achieved with the use of glyphosate-based herbicides. Mechanical weed control should be started early in the season when the weeds are still small, and control should be repeated 4 to 5 times, resulting in 3 to 4 times higher costs of weed control than by using herbicide glyphosate twice. The tested tools did not work properly when used in wet soils at speeds below 6 to 7 km h-1. The advantages of this tool are precise vertical lifting, changing settings without tools, efficient operation at high working speeds, reduced risk of erosion, easy handling, large range for tilt angle adjustment plates and environmentally friendly work (Kehlenbeck et al., 2015; Steinkellner, 2019; MacLaren et al., 2020). Pledge is only a partial alternative to the herbicide glyphosate for vineyard weed control when applied at a high dose of 1.2 kg ha-1 on bare soil. If we apply 600 g of flumioxazine after emergence to weeds in the 4 to 5 leaf stage, we have only had a short-term effect 80 to 90 % for a period of 1 month, after which the effect diminishes very

Efficiency of alternative weed control systems in the vineyard
399
quickly. The grasses recover quickly. From the application of low doses on bare soil (below 60-80 g ha-1 flumioxazine) or after weed emergence, we cannot expect any actual residual effect on perennial weeds and also on some annual weeds (knotweed, horseweed, annual fleaweed, willowherb, crabgrass).
ACKNOWLEDGEMENTS
The authors acknowledge the Ministry of Agriculture, Forestry and Food for granting the EIP project No. 33117-3002/2018, Chamber of Agriculture and Forestry of Slovenia - Agricultural and Forestry Institute Maribor (Simona Hauptman, Roman Štabuc) for technical support in carrying out the experiments and company INTEREXPORT D.O.O. (Slovenia) for all technical support in mechanical weed control.
REFERENCES
Antier, C., Kudsk, P., Reboud, X., Ulber, L., Baret, P. V., Messéan, A. (2020). Glyphosate use in the European agricultural sector and a framework for its further monitoring. Sustainability, 12(14), [5682]. https://doi.org/10.3390/su12145682
Balsari, P., Marucco, P., Vidotto, F., Tesio, F. (2006). Assessment of different techniques for weed control in vineyard. In Proceedings of Giornate Fitopatologiche, 529-534.
Cirujeda, A., Aibar, J., Anzalone, A., Martin-Closas, L., Meco, R., Moreno, M.M., Pardo, A., Pelacho, A.M., Rojo, F., Royo-Esnal, A., Suso, M.L., Zaragoza, C. (2012). Biodegradable mulch instead of polyethylene for weed control of processing tomato production. Agron. Sustain. Develop., 32, 889-97.
Kehlenbeck, H., Saltzmann, J., Schwarz, J., Zwerger, P., Nordmeyer, H., Roßberg, D., Karpinski, I., Strassemeyer, J., Golla, B., Freier, B. (2015). Folgenabschätzung für die Landwirtschaft zum teilweisen oder vollständigen Verzicht auf die Anwendung von glyphosathaltigen Herbiziden in Deutschland. Julius Kühn-Institut, Bundesforschungsinstitut für Kulturpflanzen, Julius-Kühn-Archiv, 451, 1–150.
MacLaren, C., Storkey, J., Menegat, A., Metcalfe, H., Dehnen-Schmutz, K. (2020). An ecological future for weed science to sustain crop production and the environment. A review. Agronomy for Sustainable Development. DOI: https://doi.org/10.1007/s13593-020-00631-6
Manzone, M., Demeneghi, M., Marucco, P., Grella, M., Balsari, P. (2020). Technical solutions for under-row weed control in vineyards: Efficacy, costs and environmental aspects analysis. Jour. of Agric. Eng., 51(1), 36-42. https://doi.org/10.4081/jae.2020.991
Shrestha, A., Kurtural, S.K., Fidelibus, M.W., Dervishian, G., Konduru, S. (2013). Efficacy and Cost of Cultivators, Steam, or an Organic Herbicide for Weed Control in Organic Vineyards in the San Joaquin Valley of California. Article in HortTechnology. DOI: 10.21273/HORTTECH.23.1.99
Steinkellner, S. (2019). Nationale machbarkeitsstudie zum glyphosatausstieg, Endbericht zum forschungsprojekt nummer 101347. Universität für Bodenkultur Wien, 1–257. (https://www.bmlrt.gv.at/land/land-bbf/Forschung/machbarkeitsstudie.html).
Tamagnone, M., Balsari, P., Manzone, M., Bozzer, C. (2011). Comparison of different spraying equipment used for weed control in vineyards and in orchards. In 11° Workshop SuProFruit 2011, 136-138.
Tourte, L., Smith, R., Bettiga, L., Bensen, T., Smith, J., Salm, D. (2008). Post-emergence herbicides are cost effective for vineyard floor management on the Central Coast. California agriculture, 62(1), 19-23.

48th Symposium "Actual Tasks on Agricultural Engineering", Zagreb, Croatia, 2021
401
TECHNICAL INSPECTION OF CROP PROTECTION MACHINES ACCORDING TO HRN EN ISO 16122:2015
Vjekoslav TADIĆ1*, Đuro BANAJ1, Dario KNEŽEVIĆ1, Anamarija BANAJ1, Davor PETROVIĆ1, Juraj SABLJAK2
*E-mail corresponding author: [email protected] 1University of Josip Juraj Strossmayer in Osijek, Faculty of Agrobiotechnical Sciences in Osijek,
Department for Agricultural Engineering and Renewable Energy Sources, Vladimira Preloga 1, 31000 Osijek, Croatia
2 Student – Undergraduate study (BSc) of Agricultural Machinery
ABSTRACT
By joining the European Union, the Republic of Croatia had to adapt to European laws, which were mandatory to fulfil an action plan for the establishment of sustainable use of pesticides. With the listed, should have been implemented a system for education of farmers and technical inspection of plant protection machines according to European standard EN 13790-1;2:2005 (1 - Agricultural machinery - Sprayers - Inspection of sprayers in use - Part 1: Field crop sprayers; 2 - Air-assisted sprayers for bush and tree crops). During the past years of application for the mentioned standard, shortcomings have been noticed and an improved version has been made, according to which inspections conduct technical inspection. Standard has been made during 2015. under mark HRN EN ISO 16122:2015 and has four chapters. Regular technical inspection must be performed for arable sprayers, orchard sprayers, fixed and semi-mobile sprayers. Based on a risk assessment for human, animal and environmental health and frequency of use, a technical inspection for hand sprayers and knapsack sprayers on hand, battery and motor drive as well as knapsack motor orchard sprayers, is not required. In mentioned standard, it is specified the inspection procedure and the necessary equipment for implementation of testing. Due to the reduction of pollution and environment preservation, a need to review mentioned standard is occurred, to set procedure for technical inspection for all machines who apply chemical agents. In this category belong: foggers, devices for seed treatment, devices for application slurry and solid fertilizers and various types of granular or powder applicators. Therefore, a revision of the standard can be expected.
Key words: technical inspection, HRN EN ISO 16122:2015, arable sprayers, orchard sprayers, pesticides
48. ACTUAL TASKS ON AGRICULTURAL ENGINEERING
Expert paper
V. Tadić, Đ. Banaj, D. Knežević, A. Banaj, D. Petrović, J. Sabljak
402
INTRODUCTON
Technical inspection of plant protection machines in EU Member States became mandatory with announcement of European Directive 2009/128/CE in November 2009. By joining the European Union, the Republic of Croatia had to adapt to European regulations, so it was obliged to bring in an action plan for the establishment of sustainable use of pesticides. This action plan regulates the use of pesticide in agriculture, mandatory education of farmers, and the technical inspection of plant protection machines according to European standard EN 13790-1;2:2005. By implementing directive 2009/128/EC in EU legislation, poor results of the technical correctness for plant protection machines have been determined. Banaj et al. (2012) state that main reason of technical incorrectness are defective pressure gauges and nozzles (up to 60%). Defective nozzles most often are realized with wear and clogging of the outlet, and defective pressure gauges often had incorrect measuring scales and sizes. A slight deviation from the required operating pressure results in pesticide application incorrectness, which is reflected with excessive/insufficient consumption, which leads to the appearance of diseases, weeds and pests or higher input in production with unnecessary pollution of the agroecosystem. According to Declercq et al. (2012), in fifth cycle of technical inspection in Belgium (from 2008 to 2010 in Flamania), 1557 orchard sprayers has inspected and only 9.7% (152) of them did not satisfy technical inspection. Number of tested machines in Spain through 2015-2016 was 11 639 (5 291 arable sprayers – 39.6%, 5 761 orchard sprayers – 39.4%, 677 machines for seed treatment – 20.2% and others – 20.0%). According to a study conducted by Solanelles et al. (2018), the most common errors with inspected sprayers were safety - 24%, defective liquid tank - 7%, pressure gauge - 28%, filtering system - 13%, nozzles - 13% and other errors - 15%. By analysing these errors, it is concluded that 40% of these machines do not fulfil the demands of technical inspection.
This paper presents the advantages and disadvantages of the standard HRN EN ISO 16122:2015 for technical inspection of plant protection machines, as well as the suggestions for technical inspection for all machines and devices who use pesticides and other chemicals in their exploitation.
CROATIAN STANDARD HRN EN ISO 16122:2015
General part - HRN EN ISO 16122-1:2015 Due to the observed shortcomings in the application of European standard EN 13790-
1;2:2005, an improved version was made according to which the technical inspection is performed. Mentioned standard was made during 2015. with mark HRN EN ISO 16122:2015 and consists of 4 parts. With this standard, mandatory technical inspection must carry out all arable and orchard sprayers, as well as fixed and semi-mobile sprayers. On the evaluation of risk assessment for human, animal and environment health, still is not required to carry out technical inspection for hand sprayers and knapsack sprayers on hand, battery or motor drive as well as knapsack motor orchard sprayers. Owners of these machines are obligatory to report all similar machines and devices to an authorized test station in order to be entered in the special register (in Croatia: phytosanitary system – FIS).
HRN EN ISO 16122:2015 standard specifies the inspection procedure, the necessary equipment for testing performance and the software in which all the necessary data will be reported. This software prints technical inspection report, of which one goes to technical
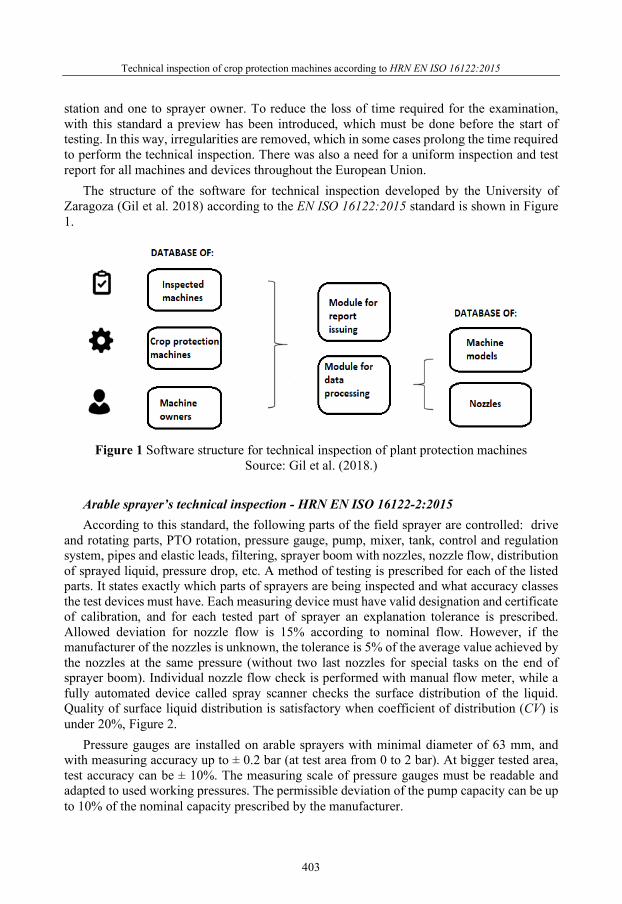
Technical inspection of crop protection machines according to HRN EN ISO 16122:2015
403
station and one to sprayer owner. To reduce the loss of time required for the examination, with this standard a preview has been introduced, which must be done before the start of testing. In this way, irregularities are removed, which in some cases prolong the time required to perform the technical inspection. There was also a need for a uniform inspection and test report for all machines and devices throughout the European Union.
The structure of the software for technical inspection developed by the University of Zaragoza (Gil et al. 2018) according to the EN ISO 16122:2015 standard is shown in Figure 1.
Figure 1 Software structure for technical inspection of plant protection machines
Source: Gil et al. (2018.)
Arable sprayer’s technical inspection - HRN EN ISO 16122-2:2015 According to this standard, the following parts of the field sprayer are controlled: drive
and rotating parts, PTO rotation, pressure gauge, pump, mixer, tank, control and regulation system, pipes and elastic leads, filtering, sprayer boom with nozzles, nozzle flow, distribution of sprayed liquid, pressure drop, etc. A method of testing is prescribed for each of the listed parts. It states exactly which parts of sprayers are being inspected and what accuracy classes the test devices must have. Each measuring device must have valid designation and certificate of calibration, and for each tested part of sprayer an explanation tolerance is prescribed. Allowed deviation for nozzle flow is 15% according to nominal flow. However, if the manufacturer of the nozzles is unknown, the tolerance is 5% of the average value achieved by the nozzles at the same pressure (without two last nozzles for special tasks on the end of sprayer boom). Individual nozzle flow check is performed with manual flow meter, while a fully automated device called spray scanner checks the surface distribution of the liquid. Quality of surface liquid distribution is satisfactory when coefficient of distribution (CV) is under 20%, Figure 2.
Pressure gauges are installed on arable sprayers with minimal diameter of 63 mm, and with measuring accuracy up to ± 0.2 bar (at test area from 0 to 2 bar). At bigger tested area, test accuracy can be ± 10%. The measuring scale of pressure gauges must be readable and adapted to used working pressures. The permissible deviation of the pump capacity can be up to 10% of the nominal capacity prescribed by the manufacturer.

V. Tadić, Đ. Banaj, D. Knežević, A. Banaj, D. Petrović, J. Sabljak
404
Figure 2 Surface distribution check with spray scanner (left) and individual nozzle flow
check (right)
Orchard sprayer’s technical inspection - HRN EN ISO 16122-3:2015 Due to design differences, the correctness of some parts of the orchard sprayer differs from
the arable sprayers. One of the main differences is with vertical liquid distribution. According to the mentioned standard, the check is performed in a visual way, because the check method with a vertical liquid collector is still in the test phase. Nozzle flow check is possible in two ways: nozzle check on machine itself (Figure 3) or on test table. In both cases, the permissible deviation of nozzle flow is +/- 10% of the flow prescribed by the manufacturer at a certain operating pressure. The pressure drop on the nozzle must not exceed 15% of the operating pressure indicated by the pressure gauge. The specificity of the orchard sprayer is radial or axial fan, which must have protection of rotating parts, it must be possible to turn on/off fan, and fan blades must not be damaged.
Figure 3 Nozzle flow check (left) and pressure differences check (right)
Technical inspection of fixed and semi-mobile sprayers - HRN EN ISO 16122-4:2015 Through recent years with procedures of technical inspection, it is noticed that there is a
need to test certain specific devices that apply pesticides in specific conditions. In this group of machines belong fixed and semi-mobile sprayers, which are used in greenhouses. This equipment is still not standardized and there are various designs. Parts of these devices are equipped with two basic systems: fixed parts with sprayer’s tank and pump; and mobile parts

Technical inspection of crop protection machines according to HRN EN ISO 16122:2015
405
with devices for pesticide application (hand applicator, vertical or horizontal boom). Technical inspection procedure is similar to arable sprayer testing with few differences and extra checks. These extra checks are directed to tightness of sprayer’s tank at the maximum allowable pressure prescribed by the manufacturer and its components. If these systems had hand sprayer instead boom, a pressure gauge must be installed in accordance with the recommended pressures. Allowed pressure gauge diameter in this case is 40 mm unlike arable sprayer where is minimal size 63 mm. If this system had direct injection of pesticides or fertilizers, the deviation from the applied dose must not exceed 10%. Of course, on these systems it must not be uncontrolled leakage and dripping. Figure 4 shows semi-mobile devices for pesticide application in greenhouses (Source: https://medari.by).
Figure 4 Semi - mobile devices for pesticide application in greenhouses
FUTURE TRENDS FOR TECHNICAL INSPECTIONS
Applicators for powder pesticides and mineral fertilizers According to Croatian standard HRN EN ISO 16122:2015, it is not yet listed mandatory
technical inspection for applicators of micro granules and manure fertilizers pellets. These devices can applicate herbicides, manure fertilizer pellets, powder pesticides and mineral fertilizers. On such devices, the general condition, measuring systems, pipelines, supports and pneumatic system should be checked first. Deviations of the measured application values must not exceed +/- 10% of the average application value. Mineral fertilizer spreaders belong to this group of machines. Check of mineral fertilizer spreaders is based on review of declared maximum working range and uniformity of fertilizer spreading between the left and right side, which must not exceed +/- 15%. The suggestion for technical inspection for this kind of machines is period of every six years (Forman, 2016). Figure 5 shows the procedure of testing for mineral fertilizer spreader with test boxes.
Fogging devices All types of machines used in pesticide application must be checked through technical
inspection according to European directive. This includes devices and equipment for fogging, used in greenhouses and in other special indoor or outdoor applications. With specificity of

V. Tadić, Đ. Banaj, D. Knežević, A. Banaj, D. Petrović, J. Sabljak
406
the construction and use of these machines, a recommendation was issued on how to perform technical inspection (Issue was provided on SPISE 2016. - Standardized Procedure for the Inspection of Sprayers in Europe) – Declerq et al., 2016. Technical inspection would include a general condition check, a check of the liquid tank, filtration, fans, measuring instruments and an air compressor. Since most of these devices are powered by electricity, it is necessary to check the condition of the cables, connectors, grid leak, switches and control panel. Also, should be inspected: tank tightness, liquid level markings, filling and emptying functions, the possibility of changing and cleaning the filter. On fan should be safety net, and nozzle flow must be in range +/- 10% according to nominal flow. There must be a table on the device with the flow of different nozzles prescribed by the manufacturer in order to determine the required dose of application.
Figure 5 Mineral fertilizer spreader testing with test boxes
Devices for seed treatment The different designs of seed treatment devices make it difficult to adopt a procedure for
testing their exploitation correctness. There are stationary and mobile devices, equipment for laboratory use (samples - 50 g) and industrial systems with a capacity greater than 30 t h-1. On Figures 6 and 7 is shown different types of machines for seed treatment.
Source: https://www.cimbria.com
Source: https://www.agrotrend.hu
Figure 6 Stationary unit Figure 7 Mobile unit

Technical inspection of crop protection machines according to HRN EN ISO 16122:2015
407
For the procedure of technical inspection of seed treatment devices at the level of the entire European Union, uniform regulations and training of test station staff should be adopted, as well as the deadline by which the inspection must be performed. Equipment for technical inspection of these devices must also be defined and adapted at EU level. The method of correct and safe inspection of seed treatment machines was presented at 6th SPISE Symposium in Barcelona (Kole, 2016). During the inspection, the accuracy of pesticide dosage, the tightness of the equipment, the safety and the accuracy of the measuring instruments used must be checked. Testing is performed with a pesticide, and therefore the personal protective equipment of the employee who inspects the correctness of the seed treatment device must be strictly observed. Some of the guidelines for developing a testing rulebook are as follows: the seed storage tank must be large enough to allow one hour of continuous operation; when machines are stopped down, the seed flow must be stopped automatically; it must be possible to dose the amount of seed; the dust suction port must be of sufficient capacity and connected to the outdoor unit; etc.
CONCLUSION
According to all mentioned in this paper, it could be concluded that the application of Croatian standard HRN EN ISO 16122:2015 has significantly improved procedure for technical inspection of all plant protection machines. However, due to the reduction of pollution and improvement of environment protection, there is a need to review the correctness of all devices that apply chemical agents in agriculture. Hand sprayers and knapsack sprayers on hand, battery or motor drive and knapsack motor orchard sprayers, should be also inspected and registered in the phytosanitary system. In this group of machines should be included: foggers, devices for seed treatment, applicators for liquid and solid fertilizers, and different kinds of devices for application of granulated and powder pesticides. Therefore, it is necessary to amend and modify Croatian standard HRN EN ISO 16122:2015, when new procedure for technical inspection is adopted at EU level.
REFERENCES
Banaj. Đ., Tadić, V., Petrović, D. (2012).Testiranje tehničkih sustava u zaštiti bilja u Republici Hrvatskoj. Proccedings of Actual Tasks on Agricultular Engineering, Košutić (ur.), Agronomski fakultet u Zagrebu, 305-310.
Declercq, J., Huyghebaert, B., Nuyttens, D. (2012). An overview of the defects on tested orchard sprayers in Belgium. Fourth European Workshop on Standardised Procedure for the Inspection of Sprayers in Europe, 182.
Declercq,J., Nuyttens, D., Defays, G., Huyghebaert, B. (2016). Belgian trial inspection protocol for the inspection of cold atomizers. 7th European Workshop on Standardised Procedure for the Inspection of Sprayers in Europe. SPISE 7, Session 3.
Forman, I. (2016). Test methods not yet covered by EN 16122 Micro granular applicators and slug pellet applicators. 7th European Workshop on Standardised Procedure for the Inspection of Sprayers in Europe. SPISE 7, Session 3.
Gil, E., Campos J., Ortega P. (2018). Spanish’s experience on improving inspection of sprayers: official manual for ISO 16122 and ISO 16119. European Workshop on Standardised Procedure for the Inspection of Sprayers in Europe. SPISE 8, Session 6.

V. Tadić, Đ. Banaj, D. Knežević, A. Banaj, D. Petrović, J. Sabljak
408
https://medari.by/produkciya/uxod-za-urozhaem-zashhita-i-dezinfekciya/sistema-ximicheskoj-obrabotki-i-dezinfekcii-meto/ - visited at: 24th september, 2020.
https://www.cimbria.com/products/seed-processing/centricoater - visited at: 24th september, 2020. Kole, J. (2016). EN-ISO 16122:4 (2015) Periodical inspection of fixed and semi-mobile sprayers. 7th
European Workshop on Standardised Procedure for the Inspection of Sprayers in Europe. SPISE 7, Session 3.
HRN EN ISO 16122-1:2015 - Poljoprivredna i šumarska mehanizacija - Inspekcija prskalica u upotrebi 1. dio: Općenito / Agricultural and forestry machinery – Inspection of sprayers in use - Part 1: General
HRN EN ISO 16122-2:2015 - Poljoprivredna i šumarska mehanizacija - Inspekcija prskalica u upotrebi 2. dio: Prskalice s horizontalnom armaturom / Agricultural and forestry machinery – Part 2: Horizontal boom sprayers
HRN EN ISO 16122-3:2015 - Poljoprivredna i šumarska mehanizacija - Inspekcija prskalica u upotrebi 3. dio: Prskalice za grmlje i drveće / Agricultural and forestry machinery - Inspection of sprayers in use - Part 3: Sprayers for bush and tree crops
HRN EN ISO 16122-3:2015 - Poljoprivredna i šumarska mehanizacija - Inspekcija prskalica u upotrebi 4. dio: Nepoimične i polupokretne prskalice Prskalice za grmlje i drveće / Agricultural and forestry machinery - Inspection of sprayers in use - Part 4: Fixed and semi-mobile sprayers
Solanelles, F. Camp, F. Fillat, A. Gracia, F. (2018). Assessment of the sprayer inspection results in Catalonia. 7th European Workshop on Standardised Procedure for the Inspection of Sprayers in Europe. SPISE 7, Session 1.

48th Symposium "Actual Tasks on Agricultural Engineering", Zagreb, Croatia, 2021
409
INFLUENCE OF DRYING AIR TEMPERATURE ON MAIZE GRAIN BREAKAGE
Tajana KRIČKA1, Mateja GRUBOR1*, Dijana VICAN2, Ana MATIN1 *E-mail of corresponding author: [email protected]
1University of Zagreb Faculty of Agriculture, Svetošimunska cesta 25, 10000 Zagreb, Croatia 2University of Zadar, Ulica Mihovila Pavlinovića 1, 23000 Zadar, Croatia
ABSTRACT
Along with wheat, maize is the most represented crop in Croatia. Due to the moisture in the drying process and big variety of hybrids, major technological changes are needed for utilisation of drying process. In order to determine the correct process for the dryer, the grain of FAO group 400 maize is used as a basis. This paper analysed 5 FAO 400 hybrids, single-phase dried at temperatures of 110 °C and 130 °C, with the grain moisture content of 24.89% to 36.26%. It was observed that the drying period depends on the hybrid regarding its morphological characteristics. Furthermore, grain damage in the study of dynamic fracture toughness ranged from 27.6% to 70.8% at an air temperature of 110 °C, and at an air temperature of 130 °C the fracture ranged from 30.4% to 74.0%, indicating that the strength of the grain depends on its morphological structure.
Keywords: maize grain, drying, breakage, FAO group
INTRODUCTION
Harvesting maize with a combine intended for drying usually begins when the grain moisture is between 28-32% in this part of Europe (Wall et al., 1975, Henry and Kettlewell, 2012), or when black layer is completely formed above the top of the germ. Namely, the higher the grain moisture, the increased in grain breakage is higher in the process of combining which lead to the loss in the process of drying, and later in storage (Peplinski et al., 1994; Krička et al., 2019).
Drying as a way of preserving grain, which due to climatic factors could not be done naturally, is a continuation and completion of the natural ripening of grain. The main goal of drying is to remove excess water from the grain, i.e. to preserve only the amount of water that the grain needs for latent life, which is reduced to minimal biological activity of the present microorganisms on the grain surface (Krička et al., 2018, Munkvold et al, 2019).
48. ACTUAL TASKS ON AGRICULTURAL ENGINEERING
Original scientific paper

T. Krička, M. Grubor, D. Vican, A. Matin
410
The speed and quality of grain drying depends on the drying method itself. Thus, for example, in natural drying, the ambient air temperature is close to the grain temperature, so drying process is slow. However, when the drying air is heated, the drying of the grain takes place faster. As the temperature of the air increases, its relative humidity decreases, so the difference in humidity between the grain and the air increases, and faster drying (Malumba et al., 2010) is promoted. The drying efficiency is influenced by the air with its thermal intensity, relevant humidity, flow rate and the design of the drying machine.
The maize grain that is dried in the dryer is delivered simultaneously from different plots. Such grain is of different hybrids with different humidity, and in the process of drying they mix with each other. During drying, this change of hybrids with different grain moisture is also reflected in the different physical properties of these grains, especially when it comes to drying speed, i.e. the ability to release water which needs to be removed by drying (Maier and Bakker-Arkema, 2002). It is known that maize hybrids differ from each other is structure, size, chemical composition, appearance, etc. (Gely and Santalla, 2000). However, one of the grain properties considered in the drying process is the rate at which the grain releases its excess water (Altay and Gunasekaran, 2006; Chung et al., 2009). Namely, by increasing the drying speed the drying capacity increases, and thus the drying costs decrease. Therefore, the drying process must be conducted in such a way as to preserve the quality of the grain with optimal drying costs. The most important factor that affects the capacity of the drying machine is the air temperature with which the grain is dried.
Due to all the above, the aim of this paper is to obtain a drying curve at a temperature of 110 °C and 130 °C based on 5 maize hybrids with different initial grain moisture. How in the last thirty years in Croatia drying machines have been tested with FAO group 400 grain, in these research FAO group 400 has also been taken as a reference group.
Furthermore, the dynamic grain load of the investigated maize hybrids will be investigated, in order to determine the strength of an individual hybrid (i.e. mechanical damage) at different drying temperatures.
As the hybrids were grown in the same area (Zagreb County) and harvested on the same day (September 29) by hand and with similar agrotechnics, from different producers, FAO group 400, dent, their names were not marked in the paper, but were guided by marks 1 to 5.
MATERIALS AND METHODS
The studies were performed on 5 maize hybrids of FAO group 400 (dent). Just before drying the maize kernels, the grain was shelled from the cob (to avoid damage and quartered for the purpose of obtaining the same samples.
After that, the grain moisture was determined by the standard method HRN ISO 6540: 2002 in the laboratory dryer INKO ST-40, Croatia.
The drying process itself was carried out in a single phase using a laboratory model of the dryer. The grain was dried by convection in a stationary layer weighing about 350 g in five repetitions. The laboratory model of the drying machine consists of an energy part (heater) and a fan. Air velocity and temperature were regulated by means of variable resistors. At the top of the dryer there is a bowl in which the grain is placed and dried. The air temperature at

Influence of drying air temperature on maize grain breakage
411
the inlet to the dryer was measured using a digital PT 100 probe, and the grain temperature in the air stream with a mercury thermometer.
In addition to the sum of the dryer, an "airflow" (anemometer) instrument was used to measure the air speed (m/s). Its accuracy is + -0.1. However, as the diameter of the anemometer head was larger than the diameter of the dryer where the sample was located, a deflector was used. Since the deflector was used, the changed air speed had to be corrected.
Furthermore, a psychrometer was used - an instrument for measuring the ambient air temperature, and indirectly for determining the relative humidity. Then the scale Libra 6000D was used for measuring the mass of samples and its accuracy is + -0.1g.
To determine the grain strength, studies were performed on a centrifugal crusher. The crusher is a centrifugal drum that accelerates the grain and directs it to a rigid wall. The housing of the centrifugal drum is made of aluminum sheet and mounted on rubber pads. In the lower part of the drum is an electric motor (220 V and 50 Hz) with a power of 300 W. The inner rotating disk is attached to a vertical central feedstock. When moving through the drum, the grain is mixed according to the laws of mechanics for relative motion. The speed at which the grain is thrown towards the roundwood can be adjusted and is proportional to the circumferential speed of the centrifuge rotor. The studies were performed at a spin speed of 1000 rpm. The speed was measured with a Smiths hand instrument. For each sample (dried at 110 °C and 130 °C) is taken 250 grains and on a precise scale the mass of the samples was analysed. After each individual bead passed through the drum, the beads were captured in a vessel at the exit of the drum. Subsequently, all grains that visually showed any visible damage were isolated. The mass of undamaged grain was weighed, and the fracture percentage was calculated.
RESULTS AND DISCUSSION
In order to determine the drying speed of maize grains, the initial moisture was determined, and the given theoretical final humidity at which the grain should be dried was 14%. The experiment was performed on a laboratory dryer, and the data were reflected on the accompanying instruments. Table 1 shows the temperature and speed of the drying air, grain temperature, temperature and relative humidity of the ambient air, and the initial and final moisture of the maize grain.
Measurement of water release rate from 5 FAO Group 400 maize hybrids was performed every 5 minutes. Table 2 shows the equations of drying to final moisture.
Comparing the drying time in percentages within the hybrid, it can be seen that at an air temperature at the inlet to the dryer of 110 °C in relation to the air temperature at the inlet to the dryer of 130 °C in the hybrid:
- OSSK 430 drying time lasts longer by 40.0%; w1 = 36.26% - Pajdaš drying time lasts longer by 56.25%; w1 = 33.67% - Bc 424 drying time lasts longer by 125.0%; w1 = 28.53% - Bc 415 drying time lasts longer by 12.5%; w1 = 27.39% - OSSK 403 drying time lasts longer by 66.67%; w1 = 24.89%

T. Krička, M. Grubor, D. Vican, A. Matin
412
Table 1 Display of average values of maize hybrids
Hybrid tad (°C) v (m/s) θg (°C) tar (°C) t0 (°C) ϕ0 (%) w1 (%) w2 (%)
OSSK 430 110 2.41 91.1 111.0 21.2 51.6 36.26 13.95
130 2.86 89.9 130.2 24.2 36.8 36.26 13.70
Pajdaš 110 2.5 88.8 110.4 21.9 35.8 33.67 13.59
130 2.57 103.6 130.4 22.4 46.6 33.67 13.05
Bc 424 110 2.34 91.8 111.3 20.2 30.7 28.53 13.48
130 2.50 114.8 130.4 22.0 28.0 28.53 13.52
Bc 415 110 2.43 95.6 110.6 23.2 30.1 27.39 12.95
130 2.17 109.3 131.0 23.0 30.0 27.39 13.57
OOSK 403 110 2.29 89.8 110.8 24.0 32.6 24.89 13.34
130 2.19 106.2 131.2 22.8 33.2 24.89 12.93
ẋ 110 2.39 91.4 110.8 22.1 36.2
130 2.46 104.8 130.6 22.9 34.9
s 110 0.08 2.6 0.4 1.5 8.9
130 0.29 9.3 0.4 0.8 7.3 Legend: tad-default air temperature; v- air velocity at the dryer exit; θg-grain temperature; tar-real air temperature; t0- ambient air temperature; ϕ0- relative air humidity; w1- initial moisture content; w2- moisture content after drying
Table 2 Maize grain drying equations for 5 maize hybrids
Hybrid tad (°C) w1 (%) Exponential equation Correlation coefficient
OSSK 430 110 36.26 w = 31.63e-0.008τ 0.9718
130 36.26 w = 34.904e-0.013τ 0.9888
Pajdaš 110 33.67 w = 30.641e-0.007τ 0.9777
130 33.67 w = 31.436e-0.011τ 0.9860
Bc 424 110 28.53 w = 26.653e-0.008τ 0.9824
130 28.53 w = 27.333e-0.017τ 0.9883
Bc 415 110 27.39 w = 26.236e-0.016τ 0.9925
130 27.39 w = 26.127e-0.016τ 0.9875
OOSK 403 110 24.89 w = 23.598e-0.011τ 0.9876
130 24.89 w = 23.908e-0.02τ 0.9872 Legend: tad-default air temperature; w1- initial moisture content

Influence of drying air temperature on maize grain breakage
413
The initial humidity of the samples varied and ranged from 24.89% to 36.26%. The air speed varied by 110 °C (air temperature) from 2.29 m/s to 2.5 m/s, and by 130°C (air temperature) from 2.17 m/s to 2.86 m/s, which gave average air velocities of 2.39 m/s and 2.46 m/s, respectively, caused by different porosity of maize grains. The grain temperature ranged for 110 °C (air temperature) from 88.8 °C to 95.6 °C, and for 130 °C (air temperature) from 89.9 °C to 114.8 °C, while the average grain temperature was 91.42 °C that is 104.8 °C. This all gave different drying lengths. From table no. 2. it is seen that the drying of hybrid grains with the highest humidity does not take the longest, both for the drying air temperature of 110 °C and for the drying air temperature of 130 °C. In samples with moisture w1 = 33.67%, within the hybrid itself, the drying time of the grain at the air temperature at the inlet to the dryer of 130 °C lasts longer by 56.25%. The same data for humidity samples w1 = 36.26% is 40.0%. The same data are interesting for hybrids with very small humidity differences, which amount to moisture w1 = 28.53%; 125.0%, and for the hybrid moisture w1 = 27.39%; 12.5%. These data lead to the conclusion that the drying period depends on the hybrid, i.e. on the morphology of its air.
After drying the maize grain, the dynamic damage (fracture) was examined using a centrifugal crusher. Table 3 shows all visual grain damage and the measured mass of undamaged grain to calculate the fracture percentage.
Table 3 Damage to maize grain with respect to its dynamic strength
Hybrid tad (°C)
breakage (%)
whole grain
%
t0 (°C)
ϕ (%)
mass of 1000
grain (g)
w2 (%)
OSSK 430 110 27.6 72.4 22.0 36.0 280.8 13.95
130 30.4 69.6 22.0 36.0 273.6 13.70
Pajdaš 110 70.8 29.2 22.0 36.0 309.6 13.59
130 74.0 26.0 22.0 36.0 308.8 13.05
Bc 424 110 61.6 38.4 24.0 31.0 300.8 13.48
130 53.6 46.4 24.0 31.0 285.2 13.52
Bc 415 110 49.2 50.8 24.0 31.0 326.8 12.95
130 65.6 34.4 24.0 31.0 343.6 13.57
OOSK 403 110 66.4 33.6 24.0 31.0 230.0 13.34
130 72.0 28.0 24.0 31.0 228.4 12.93 It is noticed that the drying temperatures (110 °C and 130 °C) do not affect the grain
breakage to a greater extent, although the breakage is slightly higher at drying temperatures of 130 °C. However, according to the mass of 1000 grains, it is seen that the hybrid with the highest mass has a lower percentage of refraction compared to the hybrid with the lowest mass. Thus, although it was expected that the hybrid with the largest grain would also have the highest percentage of refraction, the opposite happened. From this it can be concluded that the main problem is in the morphology of maize grains.

T. Krička, M. Grubor, D. Vican, A. Matin
414
CONCLUSION
Although research is being conducted on FAO 400 maize grain harvested on the same day, their humidity differed by almost 10%, which indicates that when testing the dryer, it should be more precisely defined which hybrids should be used. Within the hybrids themselves, it is observed that the drying period depends on the hybrid or its morphological characteristics. Analysing the damage of maize grain with regard to its strength, there are large differences in fracture between hybrids, a slightly higher fracture is observed at an air temperature of 130 °C compared to 110 °C.
ACKNOWLEDGMENTS
This research was funded by the European Regional Development Fund, under the Operational programme competitiveness and cohesion 2014-2020, project no. KK.05.1.1.02.0016, “Production of food, biocomposites and biofuels from cereals in a circular bioeconomy”.
REFERENCES
Altay, F., Gunasekaran, S. (2006). Influence of drying temperature, water content, and heating rate on gelatinization of corn starches. Journal of Agricultural and Food Chemistry, 54, 4235–4245.
Chung, H.-J., Liu, Q., Hoover, R. (2009). Impact of annealing and heat-moisture treatment on rapidly digestible, slowly digestible and resistant starch levels in native and gelatinized corn, pea and lentil starches. Carbohydrate Polymers, 73(3), 436–447.
Gely, M.C., Santalla, E. M. (2000). Effect of some physical and chemical properties of oilseeds on drying kinetics parameters. Drying Technology, 18(9), 2155-2166.
Henry, R., & Kettlewell, P. (Eds.). (2012). Cereal grain quality. Springer Science & Business Media. Krička, T., Grubor, M., Matin, A. (2019). Utjecaj FAO grupe hibrida kukuruza na brzinu otpuštanja
vode sušenjem i hranidbenu vrijednost zrna. In Proceedings of the 47 International Symposium Actual Tasks on Agricultural Engineering, 323-332.
Krička, T., Matin, A., Horvatić, T., Kiš, G., Voća, N., Jurišić, V., Grubor, M. (2018). Nutritivni sastav oljuštenog zrna ječma nakon termičke dorade sušenjem i uparavanjem. Krmiva: Časopis o hranidbi životinja, proizvodnji i tehnologiji krme, 59(2), 51-60.
Maier, D. E., Bakker-Arkema, F. W. (2002). Grain drying systems. In Proceedings of the 2002 Facility Design Conference of the Grain Elevator & Processing Society, St. Charles, Illinois, USA, July, 28-31.
Malumba, P., Janas, S., Roiseux, O., Sinnaeve, G., Masimango, T., Sindic, M., Deroanne, C., Béra, F. (2010). Comparative study of the effect of drying temperatures and heat-moisture treatment on the physicochemical and functional properties of corn starch. Carbohydrate polymers, 79(3), 633-641.
Munkvold, G. P., Arias, S., Taschl, I., Gruber-Dorninger, C. (2019). Mycotoxins in corn: Occurrence, impacts, and management. In Corn (pp. 235-287). AACC International Press.
Peplinski, A.J., Paulis, J.W., Bietz, J.A., Pratt, R.C. (1994). Drying of high-moisture corn: Changes in properties and physical quality. Cereal Chemistry, 71(2), 129-132.
Wall, J.S., James, C., Donaldson, G.L. (1975). Corn proteins: Chemical and physical changes during drying of grain. Cereal Chem, 52, 779-790.

48th Symposium "Actual Tasks on Agricultural Engineering", Zagreb, Croatia, 2021
415
INFLUENCE OF DRYING ON PHYSICAL AND ENERGY PROPERTIES OF PISTACHIO SHELL
Ana MATIN1, Tajana KRIČKA1, Tugomir MAJDAK2, Astrid SARAPA1, Mateja GRUBOR3*, Igor KOVAČEV3
*E-mail of corresponding author: [email protected] 1University of Zagreb Faculty of Agriculture, Department of Agricultural Technology,
Storage and Transport, Svetošimunska cesta 25, 10000 Zagreb, Croatia 2Ministry of Agriculture, Ulica grada Vukovara 78, 10000 Zagreb, Croatia
3University of Zagreb Faculty of Agriculture, Department of Agricultural Engineering, Svetošimunska cesta 25, 10000 Zagreb, Croatia
ABSTRACT
Pistachio (Pistacia vera L.) is one of the most popular edible nuts in the world and an important agricultural goods for a number of countries. Due to their high nutritional value, pistachios are an increasingly important crop that can be eaten raw, salted or baked. Most often, the pistachio shell remains unused, although it represents usable agricultural biomass. The aim is to determine whether different temperatures and different drying times affect on the physical and energy properties of pistachios shell before and after drying. Pistachio was dried by conductive drying – roasting at 110°C, 130°C and 150°C for 20 and 40 minutes. The research is divided into determination of physical (length, width and thickness) and energy properties (moisture, ash, coke, fixed carbon, volatile substances, C, H, N, S, heating values, Na, K, Ca and Mg) of shell. The results obtained by the research showed that conductive drying-roasting slightly affects the physical properties, and that after treatment there is still enough biomass for energy production, and the energy properties of pistachio shell showed high values in content coke, C and H and heating values within the expected value and have good energy properties that are improved by heat treatment.
Key words: Pistachio, drying, shell characteristics
INTRODUCTION
Pistachio (Pistacia vera L.) is one of the popular nuts tree (Kashaninejad et al., 2006). Several species of the genus Pistacia are referred to as pistachio, but only the fruits of P. vera attain a large enough size to be acceptable to consumers as edible nuts (Shokraii and Esen,
48. ACTUAL TASKS ON AGRICULTURAL ENGINEERING
Original scientific paper

A. Matin, T. Krička, T. Majdak, A. Sarapa, M. Grubor, I. Kovačev
416
1988). It is mostly grown in Iran, the United States, the Mediterranean regions of Europe, North Africa, the Middle East and China (Polat et al., 2007). There has been a big increase in production of pistachio in these countries during the past 30 years. According to FAOSTAT data for 2018, pistachios are grown on 1.17 million hectares worldwide with a production of 1.38 million tons. Most pistachios are grown in Asia 65.5%, America 1.5%, Europe 33%, Africa 0.4% and Oceania 0.1% (FAO, 2020). Due to its high nutritional value, pistachios are an increasingly important crop that can be consumed raw, salted or baked. Pistachios in shell are a favorite for snacking, in cosmetics, because of the deep green color of pistachio kernels can also be used as a flavor for pudding and for the preparation of ice cream, candy and bakery products (Kashani et al., 2003). Pistachio is characterized by a crack in the shell. This division usually appears on the tree about a month before harvest. The fruit is shelled and remains intact throughout the harvest. In mature pistachios, there is a space between the kernel and the outside of the shell, so the shell can be disassembled without damaging the kernel. The creck of the shell allows the unimpeded passage of spores of mold to the kernel, which are present in the air, and insects or other small animals such as mites (Sommer et al., 1986). Thus, the mold, Aspergillus flavus, was found in pistachios before harvest (Thomson and Mehdy, 1978). Knowledge of this physical properties of pistachios influences the selection of appropriate equipment for drying, transport, sorting, separation and storage. Choosing the most accurate equipment prevents losses. Therefore, the determination and consideration of these properties plays an important role. Physical properties of every biological material are shape, size, mass, bulk density, actual density, porosity and static friction coefficient against various surfaces (Mohsenin, 1980). Many researchers have studied physical properties for various grains and seeds: pistachio nuts (Kashaninejad et al., 2006), coffe (Krička et al., 2018), hazelnut (Matin et. al., 2013), cashew nuts (Balasubramanian, 2001) and others. Physical properties are also closely related to the energy properties of a biomass (raw material).
Drying is one of the oldest methods of food preservation (Doymaz, 2007). The efficiency of drying is influenced by air, its heat intensity, relative humidity, air flow velocity and dryer design (Krička, 2009). It is probably the main and the most expensive step in post-harvest operations (Mirzaee et al., 2009). The main purpose of drying is to separate excessive water from the product without deteriorating its quality in the process (Matin et. al. 2019). Generally, drying implies application of heat on the treated material by use of external heat source (Mujumdar, 2000). The drying procedure ensures that pistachium fruit remain unchanged for a certain period of time and that can be used throughout the year (Krička et al., 2003; Matin et al., 2017; Matin et al., 2019). Most often, the pistachio shell remains unused, although it represents usable agricultural biomass. In EU, agricultural residues represent an energy potential (around 250 million tonnes per year) for development of the bioenergy industry (Voća et al., 2016). It is the main energy source for more than a half of world population and provides about 1.25 billion tonnes of primary energy, or covers about 14% of global annual energy consumption (Zeng et al., 2010; Bilandžija et al., 2012). Biomass can be converted into useful energy forms by means of several types of processes. The choice of the conversion process depends on the type, properties and quantity of available biomass, on desired final energy form, environmental standards and economic conditions (Krička et al., 2012).
Therefore, the aim is to determine whether different temperatures and different drying times affect on energy properties of the pistachio (kernel and shell) before and after drying for direct combustion.
Influence of drying on physical and energy properties of pistachio shell
417
MATERIALS AND METHODS
The analytical investigation was conducted in the laboratory of the Department of Agricultural Technology, Storage, and Transport of the Faculty of Agriculture, University of Zagreb on the culture of Pistacia vera. The investigation was conducted on naturally dried and dried pistachio shell.
The drying was performed by laboratory roster (conduction drying). The drying was carried out at temperatures 110ºC, 130ºC and 150ºC. The pistachio was dried twice, the first time for 20 minutes and the second time for 40 minutes.
Physical analysis The main values of pistachio size (length, width and thickness) of the selected samples
after quartering, were determined by a Digital Caliper 0-150 mm. The values were taken in 30 replications, both in the natural samples and in those samples that were subjected to conduction drying.
Energy analysis The energy analyses of pistachio shell included determination of the moisture, ash, coke,
fixed carbon and volatile matter content, C, H, N, S the content and the higher (HHV) and lower (LHV) heating values. The proportion of macroelements Na, K, Ca and Mg in the pistachio shell were also determined.
Moisture content is determined according to protocol (HRN EN 18134-2:2015) in laboratory dryer (INKO ST-40, Croatia). Ash content (HRN EN ISO 18122:2015) and coke content (CEN/TS 15148:2009) were analyzed in muffle furnace (Nabertherm B170, Lilienthal, Germany). Fixed carbon and volatile matter content were determined according to protocol (EN 15148:2009) by calculation. The content of nitrogen (N) is determined according to protocol (HRN EN ISO 16948:2015), carbon (C) and hydrogen (H) (HRN EN ISO 16948:2015) and sulfur (S) (HRN EN ISO 16994:2015) in CHNS analyzer (Elementar Analyzensysteme GmbH, Germany), while oxygen (O) was calculated as the rest of the C, H, N, S elements. The heating values, HHV and LHV, was determined according to protocol (HRN EN 14918:2010) using an IKA C200 oxygen bomb calorimeter (IKA Analysentechnik GmbH, Heitersheim, Germany). Macroelements sodium (Na), potassium (K), calcium (Ca) and magnesium (Mg) in the samples was determined by protocol (HRN EN ISO 16967:2015) in an atomic absorption spectrometer (Perkin Elmer, AAnalyst 400), with the samples previously prepared in a microwave oven.
RESULTS AND DISCUSSION
Physical and energy analyzes of pistachio kernel and shell before and after the drying process at different temperatures and times were measured. The results of the physical analysis are shown in Table 1, and the results of the energy analyzes are shown in Tables 2, 3, 4 and 5.
Pistachio can have different size (length, width and thickness) and these physical characteristics are conditioned by agro-meteorological conditions for growth and development of plants, which consequently influence the development and formation of fruits.

A. Matin, T. Krička, T. Majdak, A. Sarapa, M. Grubor, I. Kovačev
418
Table 1 Pistachio size (length, width and thickness) of naturally dried and dried samples
Drying temperature (˚C) Time (min) Length (mm) Width (mm) Thickness (mm)
Naturally dried 19.91 13.32 12.52
110 °C 20 19.07 12.81 12.51
40 19.10 12.42 11.95
130 °C 20 19.20 12.86 12.32
40 19.55 12.96 12.67
150 °C 20 19.19 12.67 13.07
40 19.22 12.87 12.31 According to the obtained results, it is evident that the increase in temperature and the
duration of the drying process affect the change in dimensions. The highest value of length and width have natural dried samples, while the highest value of thickness have samples that were dried at 150°C for 20 minutes. Samples that were dried at 110°C for 20 min have the lowest value, while samples dried at 110°C for 40 min have the lowest value of width and thickness. Galedar et al., (2009) also determined the dimensions of pistachios in their research and obtained lower values of the investigated parameters, length between 9.92 and 14.07 mm, width between 9.42 and 10.27 mm and a thickness between 10.27 and 12.30 mm, which can be a agro-meteorological conditions characteristic. According to Kashaninejad et. al., (2006) who investigated the relationship between moisture and dimensions, 70% of pistachio had a length of 14.16 to 16.14 mm, 14% less than 14.16 mm, and 16% greater than 16.14 mm at 4.10% moisture content, which are similar results as obtained in this study.
Table 2 Content of moisture, ash, coke, fixed carbon and volatile substances of naturally
dried and dried shell
Drying temperature (˚C)
Time (min)
Moisture (%)
Ash (%)
Coke (%)
Fixed carbon (%)
Volatile matter (%)
Naturally dried 8.08 0.28 10.98 10.68 80.40
110 °C 20 2.66 0.41 11.97 11.55 85.41
40 2.31 0.42 12.69 12.25 85.20
130 °C 20 1.85 0.68 11.79 11.10 86.40
40 1.15 0.39 11.78 11.39 86.90
150 °C 20 0.91 0.59 10.75 10.16 87.83
40 0.36 0.63 12.41 11.78 86.94 The presence of ash determines the quality of fuel, since with a lower ash content the
quality of fuel increases. Ash has a catalytic influence and when a percentage share of ash is
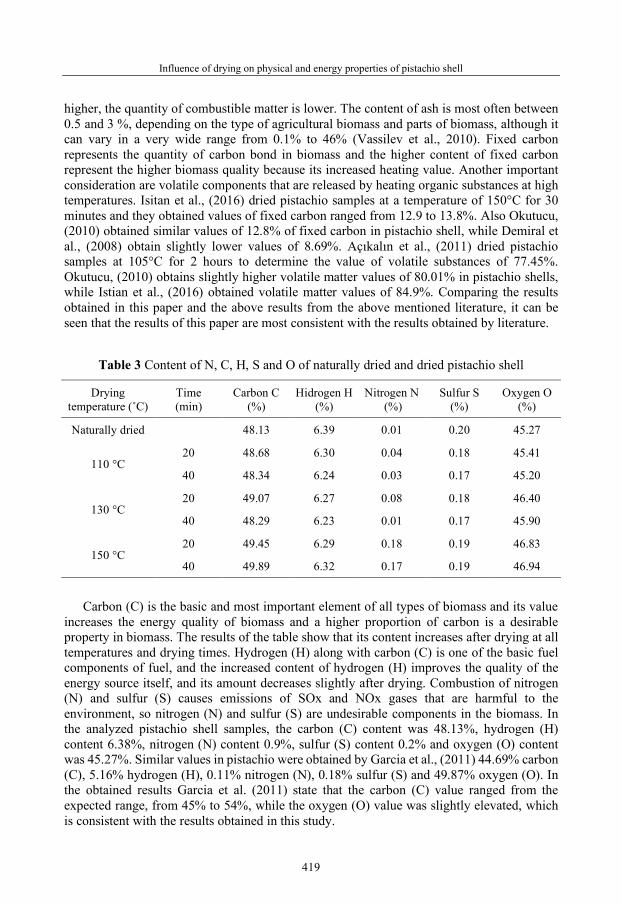
Influence of drying on physical and energy properties of pistachio shell
419
higher, the quantity of combustible matter is lower. The content of ash is most often between 0.5 and 3 %, depending on the type of agricultural biomass and parts of biomass, although it can vary in a very wide range from 0.1% to 46% (Vassilev et al., 2010). Fixed carbon represents the quantity of carbon bond in biomass and the higher content of fixed carbon represent the higher biomass quality because its increased heating value. Another important consideration are volatile components that are released by heating organic substances at high temperatures. Isitan et al., (2016) dried pistachio samples at a temperature of 150°C for 30 minutes and they obtained values of fixed carbon ranged from 12.9 to 13.8%. Also Okutucu, (2010) obtained similar values of 12.8% of fixed carbon in pistachio shell, while Demiral et al., (2008) obtain slightly lower values of 8.69%. Açıkalın et al., (2011) dried pistachio samples at 105°C for 2 hours to determine the value of volatile substances of 77.45%. Okutucu, (2010) obtains slightly higher volatile matter values of 80.01% in pistachio shells, while Istian et al., (2016) obtained volatile matter values of 84.9%. Comparing the results obtained in this paper and the above results from the above mentioned literature, it can be seen that the results of this paper are most consistent with the results obtained by literature.
Table 3 Content of N, C, H, S and O of naturally dried and dried pistachio shell
Drying temperature (˚C)
Time (min)
Carbon C (%)
Hidrogen H (%)
Nitrogen N (%)
Sulfur S (%)
Oxygen O (%)
Naturally dried 48.13 6.39 0.01 0.20 45.27
110 °C 20 48.68 6.30 0.04 0.18 45.41
40 48.34 6.24 0.03 0.17 45.20
130 °C 20 49.07 6.27 0.08 0.18 46.40
40 48.29 6.23 0.01 0.17 45.90
150 °C 20 49.45 6.29 0.18 0.19 46.83
40 49.89 6.32 0.17 0.19 46.94
Carbon (C) is the basic and most important element of all types of biomass and its value
increases the energy quality of biomass and a higher proportion of carbon is a desirable property in biomass. The results of the table show that its content increases after drying at all temperatures and drying times. Hydrogen (H) along with carbon (C) is one of the basic fuel components of fuel, and the increased content of hydrogen (H) improves the quality of the energy source itself, and its amount decreases slightly after drying. Combustion of nitrogen (N) and sulfur (S) causes emissions of SOx and NOx gases that are harmful to the environment, so nitrogen (N) and sulfur (S) are undesirable components in the biomass. In the analyzed pistachio shell samples, the carbon (C) content was 48.13%, hydrogen (H) content 6.38%, nitrogen (N) content 0.9%, sulfur (S) content 0.2% and oxygen (O) content was 45.27%. Similar values in pistachio were obtained by Garcia et al., (2011) 44.69% carbon (C), 5.16% hydrogen (H), 0.11% nitrogen (N), 0.18% sulfur (S) and 49.87% oxygen (O). In the obtained results Garcia et al. (2011) state that the carbon (C) value ranged from the expected range, from 45% to 54%, while the oxygen (O) value was slightly elevated, which is consistent with the results obtained in this study.

A. Matin, T. Krička, T. Majdak, A. Sarapa, M. Grubor, I. Kovačev
420
Table 4 Content of HHV and LHV of naturally dried and dried pistachio shell
Drying temperature (˚C)
Time (min)
Higher heating value HHV (MJ kg-1)
Lower heating value LHV (MJ kg-1)
Naturally dried 17.75 16.38
110 °C 20 18.85 17.11
40 18.91 17.40
130 °C 20 19.15 17.66
40 18.89 17.58
150 °C 20 19.29 17.81
40 19.32 17.89 According to the results from Table 4, it can be seen that the HHV in the naturally dried
shell is 17.78 MJ kg-1, while after the drying it increases and is the highest at 150°C for 40 minutes, 19.32 MJ kg-1. Thus, during the drying process, the heating value is increasing. The lowest LHV was in naturally dried shell (16.38 MJ kg-1). Pistachio shells dried at 150°C for 40 minutes have the highest LHV. The obtained results have similar data in comparison with the obtained results from the literature. Okutucu, (2010) states an upper calorific value of pistachios shell of 17.88 MJ kg-1. Isitan et al., (2016) state an upper pistachio shell calorific value of 18.02 MJ kg-1, while Yin, (2010) states that a pistachio upper calorific value is 18.57 MJ kg-1.
Table 5 Content of Na, K, C and Mg of naturally dried and dried pistachio shell
Drying temperature (˚C)
Time (min)
Sodium Na (mg kg-1)
Potassium K (mg kg-1
Calcium Ca (mg kg-1)
Magnesium Mg (mg kg-1)
Naturally dried 63.90 681.40 544.73 106.80
110 °C 20 30.10 746.80 517.30 138.53
40 31.17 691.50 630.01 114.42
130 °C 20 26.03 784.70 742.80 159.92
40 32.61 727.60 591.90 113.02
150 °C 20 31.74 743.31 515.92 136.72
40 63.30 720.70 470.23 139.82 It is obvious that there are large differences in the content of all investigated
macronutrients in pistachio shell regardless of thermal processing or not. These elements, after the combustion process, form the composition of the resulting ash. All of them, like ash, occur during biomass combustion, and some of them can cause a number of serious problems in combustion plants, causing slag, corrosion, and dirt (Cuiping et al., 2004; Cassida et al.,

Influence of drying on physical and energy properties of pistachio shell
421
2005). Given that the composition of biomass affects the composition of ash, it is desirable to keep the share as low as possible, primarily for the final, environmentally friendly disposal of ash after combustion (Krička et al., 2017). Ling et al., (2016) conducted a study in which they examined the content of macronutrients in dried pistachio shell at a temperature of 160°C for 20 minutes. They obtained Na content 3.02 mg kg-1, Ca content 191, 16 and Mg content 159.02 mg kg-1. Comparing the obtained results and the results reported in the literature, it can be concluded that the obtained results are much higher than the results from the literature, which can be attributed to different agroclimatic conditions during cultivation.
CONCLUSIONS
Based on the results obtained from naturally dried and dried pistachio shells after conduction drying-rosting at three temperatures and two times can be concluded that temperature rise and drying time slightly affects on physical properties and pistachio size. Also, it can be determined that conduction drying has a positive effect on the energy properties, which confirms the high content of carbon and hydrogen, and higher and lower heating values. The obtained data proved that pistachio shell has a high energy potential for energy production compared to other agricultural biomass.
REFERENCES
Açıkalın, K., Karaca, F., Bolat, E. (2012). Pyrolysis of pistachio shell: Effects of pyrolysis conditions and analysis of products. Fuel, 95, pp.169-177.
Balasubramanian, D. (2001). PH—postharvest technology: physical properties of raw cashew nut. Journal of Agricultural Engineering Research, 78(3), pp.291-297.
Bilanzdija, N., Voca, N., Kricka, T., Matin, A., Jurisic, V. (2012). Energy potential of fruit tree pruned biomass in Croatia. Spanish Journal of Agricultural Research, 10(2), 292-298.
Cassida, K. A., Muir, J. P., Hussey, M. A., Read, J. C., Venuto, B. C., Ocumpaugh, W. R. (2005). Biofuel component concentrations and yields of switchgrass in South central US environments. Crop Science, 45: 682 – 692.
Cuiping, L., Chuangzhi, W., Yanyongjie, M., Haitao, H. (2004). Chemical elemental characteristics of biomass fuels in China. Biomass and Bioenergy, 27: 119 - 130.
FAO (2020). Food and agriculture organization of the UN, Data Demiral, I., Gülmezoğlu Atilgan, N., Şensöz S. (2008). Production of biofuel from soft shell of pistachio
(Pistacia vera L.). Chemical Engineering Communications, 196:1-2, 104-115. Doymaz, I. (2007). The kinetics of forced convective air-drying of pumpkin slices. Journal of food
engineering, 79(1), pp.243-248. EN 14918:2010 Solid biofuels - Determination of calorific value. European Committee for
Standardization. EN 15148:2009 Solid biofuels - Determination of the content of volatile matter. European Committee
for Standardization. Galedar, M.N., Mohtasebi, S.S., Tabatabaeefar, A., Jafari, A., Fadaei, H. (2009). Mechanical behavior
of pistachio nut and its kernel under compression loading. Journal of Food Engineering, 95(3), pp.499-504.
García R., Pizarro C., Lavín A.G., Bueno J.L. (2011). Characterization of Spanish biomass wastes for energy use. Bioresource Technology 103. 249-258.
A. Matin, T. Krička, T. Majdak, A. Sarapa, M. Grubor, I. Kovačev
422
HRN EN 18134-2:2015 Solid biofuels - Determination of moisture content oven dry method - Part 2: Total moisture – Simplified method. Croatian Standard Institute.
HRN EN ISO 18122:2015 Solid biofuels - Determination of ash content. Croatian Standard Institute. HRN EN ISO 16948:2015 Solid biofuels - Determination of total content of carbon, hydrogen and
nitrogen. Croatian Standard Institute. HRN EN ISO 16994:2015 Solid biofuels - Determination of total content of sulfur and chlorine. Croatian
Standard Institute. HRN EN ISO 16967:2015 Solid biofuels- Determination of major elements- Al, Ca, Fe, Mg, P, K, Si,
Na and Ti. Croatian Standard Institute. Isitan, C., Ceylan, S., Topcu. Y., Hintz, C., Tefft, J., Chellappa, T., Guo J., Goldfarb, J.L. (2016). Product
quality optimization in an integrated biorefinery: Conversion of pistachio nutshell biomass to biofuels and activated biochars via pyrolysis. Energy Conversion and Management, 127. 576-588.
Kashani Nejad, M., Tabil, L. G., Mortazavi, A., Safe Kordi, A. (2003). Effect of drying methods on quality of pistachio nuts. Drying Technology, 21(5), 821-838.
Kashaninejad, M., Mortazavi, A., Safekordi, A., Tabil, L.G. (2006). Some physical properties of Pistachio (Pistacia vera L.) nut and its kernel. Journal of Food Engineering, 72(1), pp.30-38.
Krička, T., Jukić, Ž., Voća, N., Sigfild, N., Zanuškar, J., Voća, S. (2003). Nutritional characteristics of soybean after thermal processing by toasting. Acta Veterinaria 53: 191-197.
Krička, T., Tomić, F., Voća, N., Brlek Savić, T., Jurišić, V., Bilandžija, N., Matin, A. (2009). Physical and chemical properties of rapeseed after different treatments of drying temperature and storage, Journal on Processing and Energy in Agriculture, 13 (3): 210-215.
Kricka, T., Bilandžija, N., Jurisic, V., Voca, N., Matin, A. (2012). Energy analysis of main residual biomass in Croatia. African Journal of Agricultural Research, 7(48), 6383-6388.
Krička, T., Leto, J., Bilandžija, N., Grubor, M., Jurišić, V., Matin, A., Voća, N., Dović, D., Horvat, I. (2017). Tehnologija uzgoja, dorade i skladištenja energetske kulture Sida hermaphrodita (L.) Rusby, Zagreb
Krička, T., Grubor, M., Tadić, I., Jurišić, V., Matin, A. (2018). Changes in physical and chemical characteristics of coffee beans after thermal processing by roasting. In Proceedings 46th International Symposium: Actual tasks on agricultural engineering, Opatija, Croatia, (pp. 389-396). University of Zagreb, Faculty of Agriculture.
Ling, Z., Ji, Z., Ding, D., Cao, J. and Xu, F. (2016). Microstructural and topochemical characterization of thermally modified poplar (Populus cathayaha) cell wall. BioResources, 11(1), pp.786-799.
Matin, A., Krička, T., Jurišić, V., Bilandžija, N., Voća, N., Mrkšić, J. (2013). Energy efficiency shell hazelnuts and walnuts. 48. Hrvatski i 8. Međunarodni Simpozij Agronoma, Dubrovnik, Hrvatska, 17.-22. veljač 2013. Zbornik Radova, 836-840.
Matin, A., Krička, T., Jurišić, V., Voća, N., Žunić, J., Grubor, M. (2017). Effects of different air drying temperature on sunflower seeds oil and ash content. Journal on Processing and Energy in Agriculture. 21,1; 5-8.
Matin, A., Majdak, T., Krička, T., Grubor, M. (2019). Valorization of sunflower husk after seeds convection drying for solid fuel production. Journal of Central European Agriculture, 20(1), pp.389-401.
Mirzaee, E., Rafiee, S., Keyhani, A., Djomeh, Z. (2009). Determining of moisture diffusivity and activation energy in drying of apricots. Research in Agricultural Engineering, 55(3), pp.114-120.
Mohsenin, N.N. (1980). Thermal properties of foods and agricultural materials. New York. USA. Mujumdar, A.S. (2000). Drying technology in agriculture and food sciences. Science Publishers, Inc.. Okutucu, C. (2010). Pyrolysis of pistachio shell. Master of Science Thesis. EGE University Graduate
School of Natural and Applied Sciences. Bornova – Izmir.

Influence of drying on physical and energy properties of pistachio shell
423
Polat, R., Aydin, C., Ak, B.E. (2007). Some physical and mechanical properties of pistachio nut. Bulgarian Journal of Agricultural Science, 13(2), p.237.
Shokraii, E.H., Esen, A. (1988). Composition, solubility and electrophoretic patterns of proteins isolated from Kerman pistachio nuts (Pistacia vera L.). Journal of Agricultural and Food Chemistry, 36(3), pp.425-429.
Sommer, N.F., Buchanan, J.R., Fortlage, R.J. (1986). Relation of Early Splitting and Tattering of Pistachio Nuts. Phytopathology, 76, pp.692-694.
Thomson, S.V., Mehdy, M.C. (1978). Occurrence of Aspergillus flavus in pistachio nuts prior to harvest. Phytopathology, 68(8), pp.1112-1114.
Vassilev, S.V., Baxter, D., Andersen, L.K., Vassileva, C.G. (2010). An overview of the chemical composition of biomass. Fuel, 89: 913 – 933.
Voća, N., Bilandžija, N., Jurišić, V., Matin, A., Krička, T., Sedak, I. (2016). Proximate, Ultimate and Energy Values Analysis of Plum Biomass By-products Case Study: Croatia's Potential; Journal of Agricultural Science and Technology, Vol. 18(6): 1655-1666
Yin C.Y. (2010). Prediction of higher heating values of biomass from proximate and ultimate analyses. Fuel 90 (2011) 1128-1132.
Zeng, X.Y., Ma, Y.T., Ma, L.R. (2010). Utilization of straw in biomass energy in China. Renew Sust Energ Rev 11: 7261-7266.


48th Symposium "Actual Tasks on Agricultural Engineering", Zagreb, Croatia, 2021
425
WHEAT DOUGH PROVING PROCESS ANALYSIS USING THE CARBON DIOXIDE CONCENTRATION
Adriana ISTUDOR1*, Gheorghe VOICU1, Gheorghe MUSCALU2 *E-mail of corresponding author: [email protected]
1 Polytechnic University of Bucharest, Faculty of Biotechnical Systems Engineering, 313 Splaiul Independentei, 060042, Bucharest, Romania
2 MgBiotech SRL, Str. Pucheni nr 15, Bucharest, Romania
ABSTRACT
This study presents the comparative analysis of two industrial proving processes of wheat dough with the purpose of evaluating their performance. The experimental determinations were performed using a tray prover, fully loaded with 300 g dough pieces, a conventional air treating unit and an automated parameter control unit, using the carbon dioxide concentration released during the proving cycle. The performance evaluation of the two proving processes were performed using parameter measurements for temperature, relative humidity and carbon dioxide (in the second process) and volume analysis of the finished products. The obtained results show differences between the two proving processes with significant impact on the volume of the finished products within a proving cycle and also in relation with the parameter values throughout the length of the prover. Using the conventional air conditioning unit, the relative humidity varies between 48 and 80 %. Better results were obtained using the concentration of released carbon dioxide to control the proving parameters. The parameter variation during a proving cycle does not surpass 3 %. The presented study is part of an extensive research for functionality validation of an automated control method for the working regime of industrial dough provers, using the carbon dioxide concentration as a control parameter.
Keywords: wheat dough, air conditioning, carbon dioxide concentration, dough proving
INTRODUCTION
Over the last few decades, the bread making process has become more and more automated and the standardization of low-cost products of the highest possible quality is gaining importance, (Verheyen, 2012). The proving of wheat dough is one of the most
48. ACTUAL TASKS ON AGRICULTURAL ENGINEERING
Expert paper
A. Istudor, Gh. Voicu, Gh. Muscalu
426
important stages in the bread making process. A high volume loaf with a fine crumb structure is a desirable characteristic, (Trinh, 2013). During proofing or fermentation, yeast metabolism results in carbon dioxide release and growth of air bubbles previously incorporated during mixing, (Rosell, 2011). Desirable characteristics of bread products such as volume and crumb structure are achieved only if the dough provides a favorable environment for yeast growth and gas generation, (Giannou et al., 2003, Sahlstrom et al., 2004). Different factors affect the fermentative performance of yeast cells during dough fermentation, including dough ingredients, fermentation conditions, the type of yeast strain used (Struyf et al., 2017). Optimal dough proving takes place under the strict control of three main parameters: time, temperature and relative humidity (Istudor et al., 2017). In most industrial bread making processes, the proofing time varies between 40 and 90 minutes, and the proofing parameters are: 30-40 °C and 70-90 % relative humidity. These parameters were evaluated and determined by some veterans in this field like Freilich (1949) and Pyler (1973) and have not actually changed. At industrial level, time is limited by the prover’s capacity, while temperature and relative humidity are interdependent. There are few studies regarding dough fermentation monitoring and control and fewer applicable in industrial environment. Villarino et al., (2014) use factorial experimental design to study the effects of proving time and temperature on bread’s physical attributes. Elmehdi et al., (2003) use low-intensity ultrasonic waves to monitor the changes in the dough during fermentation; Bajd et al., (2011) use magnetic resonance microscopy to control dough fermentation; Zettel et al., (2016), Ivorra et al., (2014), use optical methods to monitor dough fermentation. These methods are applicable to one dough piece, and an industrial prover has up to 10000 pcs capacity or more and is configured in layers which means there is a strong possibility of parameter differences between these layers. A newer research performed by Giefer et al., (2019) showed the possibility of automated monitoring dough fermentation using optical techniques for more than one dough piece at a time, but according to their results, the deviation from optimal was approximately 10%.
We propose a method for dough proving control using the concentration of carbon dioxide released in the proving chamber. Previous research (Istudor et al., 2020) showed that CO2 concentration can be regarded as another proving parameter and can be used to control dough fermentation level in correlation with the other proving parameters and also dough dimensions (width, length, height), according to Romanian STAS for white bread of 300 g.
In this paper, two industrial proving processes for white bread of 300 g were analyzed, one using a conventional air conditioning system with the control and monitoring of temperature and relative humidity and one using the concentration of carbon dioxide to control the proving process. The purpose of this experimental research is to verify the functionality of the proposed method in industrial environment.
MATERIALS AND METHOD
For the experimental research, a plate industrial prover (Werner Pfleiderer, Germany, 2000) was used, with a capacity of ~2500 pcs/h and 80 active plates loaded with 2 rows of 16 pcs of bread dough weighing 360 g each. The prover has an integrated air conditioning unit with command panel which can provide inside the proving chamber a temperature up to 40 °C and up to 90% relative humidity. The prover is presented in figure 1 and in figure 3 can be seen the functioning logic of the air conditioning unit using carbon dioxide concentration as

Wheat dough proving process analysis using the carbon dioxide concentration
427
a parameter control, the difference between the one presented and the conventional air conditioning unit being the command panel, the number and position of temperature and relative humidity sensors and the integration of CO2 sensor.
In figure 1, the marked parts of interest represent: 1-dough discharge area; 2- proving chamber; 3-active plates; 4- air conditioning unit ; 5-dough loading area; 6-plate; 7-chain gear system; 8-humidity sensors – 3 pcs.; 9-temperature sensors – 3 pcs.; 10- CO2 sensor; 11 inactive plates.
Figure 1 Werner Pfleiderer plates dough prover
A data logger for relative humidity and temperature measurements (presented in figure 2),
EL USB (Lascar electronics, UK, 2019) was also used to measure these parameters during the entire proving cycle, at bread dough level.
Figure 2 Data logger for temperature and relative humidity, (Lascar electronics, UK, 2019)
The automated parameter control unit (figure 3) measures the concentration of released
carbon dioxide (2) in the proving chamber (1) during the proving cycle and takes automated corrective decisions regarding temperature and relative humidity values, which are measured using sensors 3 and 4. The air in the prover (1) is recirculated using a ventilator (8) which is

A. Istudor, Gh. Voicu, Gh. Muscalu
428
integrated in an air conditioning unit (9). Based on the measurement of CO2 concentration (ppm-parts per million), the PLC (10) opens hot water (5) or cold water (6) valves for temperature regulation and steam valve (7) for humidity regulation. The PLC automatically regulates the temperature and relative humidity parameters based on real time measurements of CO2 concentration, which are permanently compared with a set value (determined previously as optimal).
Figure 3 The schematics of the automated parameter control unit: 1-proving chamber;
2- dough pieces; 3-temperature sensors; 4-humidity sensors; 5-heat exchanger for hot water; 6-heat exchanger for cold water; 7-CO2 sensor; 8-air unit control and ventilator;
9- air conditioning unit; 10-Programable Logic Controller; 11 tactile screen; 12 humidifier The standard bread recipe used in the experiments had in its composition the following
ingredients and percentages reported to flour: white flour, produced by 7Spice SA, Romania, with 0.65 extraction, water (53%), salt (1.8%) and compact yeast (2%). The main physio-chemical characteristics of the used flour are: 10,4 % protein, 28 % wet gluten and 13,4 % humidity.
In the first part, the analysis of the proving cycle using the conventional air conditioning unit was performed for comparison purposes and evaluation of proving regime. After the prover was fully loaded with dough (after 60 minutes), the EL USB data logger (fig.2) was placed in the center of a plate and measurements for temperature and relative humidity were registered for the entire proving cycle at 10 seconds intervals. The proving regime was: 60 minutes proving time, 35 °C and 75 % relative humidity. For evaluation purposes and based on the volume standard of the finished product of 560 cm3·100 g-1 (established internal in the
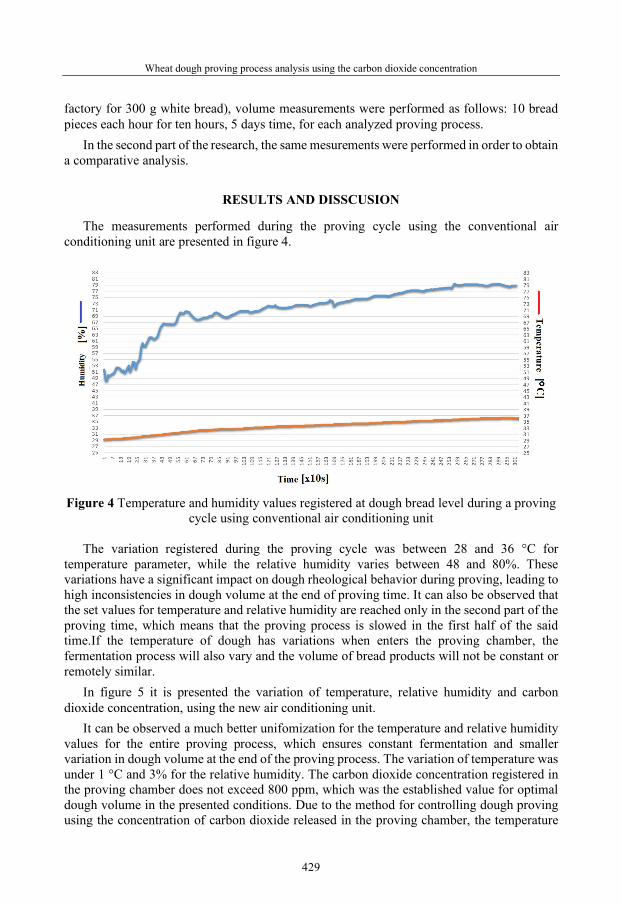
Wheat dough proving process analysis using the carbon dioxide concentration
429
factory for 300 g white bread), volume measurements were performed as follows: 10 bread pieces each hour for ten hours, 5 days time, for each analyzed proving process.
In the second part of the research, the same mesurements were performed in order to obtain a comparative analysis.
RESULTS AND DISSCUSION
The measurements performed during the proving cycle using the conventional air conditioning unit are presented in figure 4.
Figure 4 Temperature and humidity values registered at dough bread level during a proving
cycle using conventional air conditioning unit
The variation registered during the proving cycle was between 28 and 36 °C for temperature parameter, while the relative humidity varies between 48 and 80%. These variations have a significant impact on dough rheological behavior during proving, leading to high inconsistencies in dough volume at the end of proving time. It can also be observed that the set values for temperature and relative humidity are reached only in the second part of the proving time, which means that the proving process is slowed in the first half of the said time.If the temperature of dough has variations when enters the proving chamber, the fermentation process will also vary and the volume of bread products will not be constant or remotely similar.
In figure 5 it is presented the variation of temperature, relative humidity and carbon dioxide concentration, using the new air conditioning unit.
It can be observed a much better unifomization for the temperature and relative humidity values for the entire proving process, which ensures constant fermentation and smaller variation in dough volume at the end of the proving process. The variation of temperature was under 1 °C and 3% for the relative humidity. The carbon dioxide concentration registered in the proving chamber does not exceed 800 ppm, which was the established value for optimal dough volume in the presented conditions. Due to the method for controlling dough proving using the concentration of carbon dioxide released in the proving chamber, the temperature

A. Istudor, Gh. Voicu, Gh. Muscalu
430
value is automately altered (increases or decreases) in order to maintain the set level of carbon dioxide concentration. In order to avoid discordancies between temperature and relative humidity values, the relative humidity is automately scaled for the new value of determined temperature.
Figure 5 Temperature, relative humidity and carbon dioxide concentration variation during
a proving cycle Based on the volume standard of the finished product of 560 cm3·100 g-1 (established
internal in the factory for 300 g white bread), volume measurements were performed as follows: 10 bread pieces each hour for ten hours, 5 days time, for each analyzed proving process. The mean bread volume values are presented in tables 1 and 2.
Table 1 Mean values for bread volume
(cm3·100 g-1) obtained using conventional air conditioning unit
Table 2 Mean values for bread volume (cm3·100 g-1) using the concentration of
carbon dioxide for proving control
Con
vent
iona
l air
cond
ition
ing
unit
Day 1 Day 2 Day 3 Day 4 Day 5
532 542 583 586 540 527 544 535 566 542 525 539 569 570 546 530 545 567 581 539 542 538 560 570 541 538 538 563 560 539 542 539 564 570 544 542 548 576 552 544 562 544 595 540 543 540 545 570 570 539
Aut
omat
ed p
aram
eter
con
trol u
nit
Day 1 Day 2 Day 3 Day 4 Day 5
556 550 556 559 560 562 561 558 556 557 555 557 555 556 554 554 559 560 560 560 558 557 560 561 561 563 562 553 562 563 562 563 554 554 558 560 555 557 557 559 559 559 561 559 559 558 558 558 561 563

Wheat dough proving process analysis using the carbon dioxide concentration
431
In figure 6 are presented 4 analysis for the bread volume variation.
Figure 6 Bread volume variation analysis: a – deviation from standard for bread products obtained using the conventional air conditioning unit; b – comparative analysis of bread
volume obtained in different days at the same hour, using the conventional air conditioning unit; c - deviation from standard for bread products obtained using the automated parameter control unit; d - comparative analysis of bread volume obtained in different days at the same
hour, using the automated parameter control unit Figure 6a contains the deviation from the volume standard for each mean value o the the
analysed bread products obtained using the conventional air conditioning unit. The deviation interval is beteween -35 cm3·100 g-1 and + 35 cm3·100 g-1. In figure 6b, differences in bread volume for products obtained at the same hour but in different days which reach up to 12 %. In figure 6 c the same deviation is analyzed for the bread products obtained using the automated control unit. The deviation interval is between -10 cm3·100g-1 and +3 cm3·100g-1, which is considerable smaller than the previous determined data. Also, as it is presented in figure 6d, the comparison between bread volume obtained each day at the same hour does not exceed 5 %.
The statistical method ANOVA with two factors was used to analyze the obtained data regarding the volume of the bread products. The first hypothesis was that there are not significant differences between the mean volume of the finished products which surpass 5% and the second hypothesis was that there are significant differences between the two mean volume values obtained during the measurements. The results are presented in tables 3 and 4.
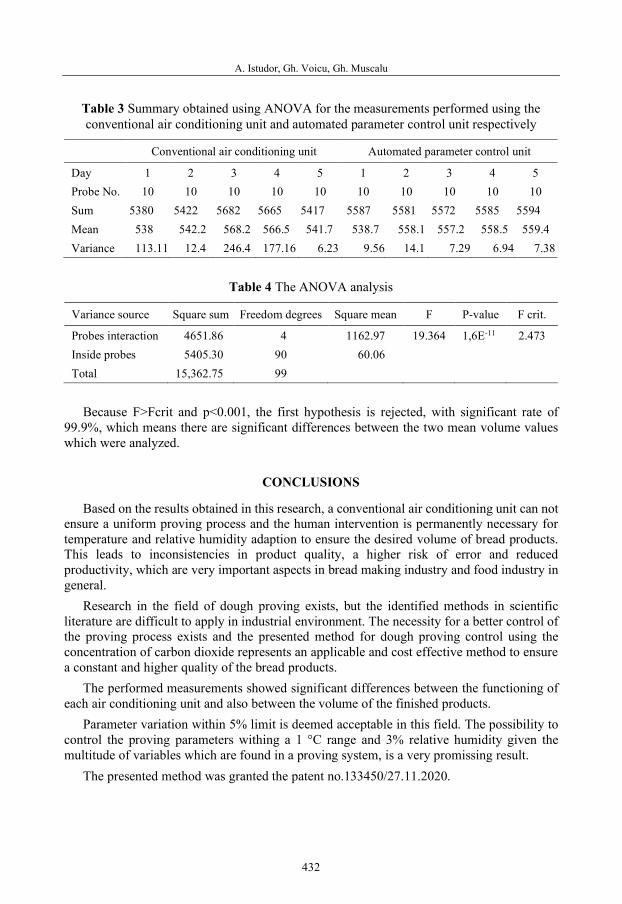
A. Istudor, Gh. Voicu, Gh. Muscalu
432
Table 3 Summary obtained using ANOVA for the measurements performed using the conventional air conditioning unit and automated parameter control unit respectively
Conventional air conditioning unit Automated parameter control unit
Day 1 2 3 4 5 1 2 3 4 5 Probe No. 10 10 10 10 10 10 10 10 10 10 Sum 5380 5422 5682 5665 5417 5587 5581 5572 5585 5594 Mean 538 542.2 568.2 566.5 541.7 538.7 558.1 557.2 558.5 559.4 Variance 113.11 12.4 246.4 177.16 6.23 9.56 14.1 7.29 6.94 7.38
Table 4 The ANOVA analysis
Variance source Square sum Freedom degrees Square mean F P-value F crit.
Probes interaction 4651.86 4 1162.97 19.364 1,6E-11 2.473 Inside probes 5405.30 90 60.06
Total 15,362.75 99
Because F>Fcrit and p<0.001, the first hypothesis is rejected, with significant rate of
99.9%, which means there are significant differences between the two mean volume values which were analyzed.
CONCLUSIONS
Based on the results obtained in this research, a conventional air conditioning unit can not ensure a uniform proving process and the human intervention is permanently necessary for temperature and relative humidity adaption to ensure the desired volume of bread products. This leads to inconsistencies in product quality, a higher risk of error and reduced productivity, which are very important aspects in bread making industry and food industry in general.
Research in the field of dough proving exists, but the identified methods in scientific literature are difficult to apply in industrial environment. The necessity for a better control of the proving process exists and the presented method for dough proving control using the concentration of carbon dioxide represents an applicable and cost effective method to ensure a constant and higher quality of the bread products.
The performed measurements showed significant differences between the functioning of each air conditioning unit and also between the volume of the finished products.
Parameter variation within 5% limit is deemed acceptable in this field. The possibility to control the proving parameters withing a 1 °C range and 3% relative humidity given the multitude of variables which are found in a proving system, is a very promissing result.
The presented method was granted the patent no.133450/27.11.2020.

Wheat dough proving process analysis using the carbon dioxide concentration
433
REFERENCES
Bajd, F.; Serša, I. (2011). Continuous monitoring of dough fermentation and bread baking by magnetic resonance microscopy. Magn. Reson. Imaging 29, 434–442;
Elmehdi, H.M., Page, J.H., Scanlon, M.G. (2003). Monitoring Dough Fermentation Using Acoustic Waves. Food Bioprod. Process 81, 217–223;
Freilich, J. (1949). Time, temperature and humidity. Factors in dough proofing. Baker’s Dig. 44, 34-38; Giannou, V., Kessoglou, V. & Tzia, C. (2003). Quality and safety characteristics of bread made from
frozen dough. Trends in Food Science and Technology 14, 99-108; Istudor, A., Voicu, G., Muscalu, G., Munteanu, M. (2017). Final bread dough fermentation –
requirements, conditions, equipment. A short review. International Symposium, INMA-TEH, Bucharest, 519-526;
Istudor, A., Voicu, G., Muscalu, G. & Tudor, P., (2020). Evaluation of carbon dioxide released by bread dough during proving stage, TE-RE-RD 9th International Conference on Thermal Equipment, Renewable Energy and Rural Development, 180;
Ivorra, E., Amat, S.V., Sánchez, A.J., Barat, J.M., Grau, R., (2014). Continuous monitoring of bread dough fermentation using a 3D vision Structured Light technique. J. Food Eng.130, 8–13;
Giefer, L. A., Lütjen, M., Rohde, A, K. & Freitag M., (2019). Determination of the Optimal State of Dough Fermentation in Bread Production by Using Optical Sensors and Deep Learning. Appl. Sci. 9, 4266;
Pyler, E. J. (1973). Final proof. Baking Science and Technology, 2. Siebel Publishing House, 672-681; Rosell C. M., (2011). The Science of Doughs and Bread Quality, in Flour and Breads and their
Fortification in Health and Disease Prevention, 3-14; Sahlstro¨m, S., Park, W., Shelton, D. R., (2004). Factors influencing yeast fermentation and the effect
of LMW sugars and yeast fermentation on hearth bread quality. Cereal Chemistry, 81, 328–335; Struyf, N., Van der Maelen, E., Hemdane, S., Verspreet, J., Verstrepen, K. J. & Courtin C. M, (2017).
Comprehensive Reviews in Food Science and Food Safety 16, 850-867; Trinh, L, (2013). Gas cells in bread dough. PhD Thesis. School of Chemical Engineering and Analytical
Science, Manchester, UK; Verheyen, C., Jekle, M., Becker, T., (2012). Influences on dough development. Research Interest,
Baking biscuit 3, 40-43; Villarino, B. J., Jayasena, V., Coorey, R., Johnson, S. K, Chakrabarti-Bell, S., (2014), The effects of
bread-making process factors on Australian sweet lupin-wheat bread quality characteristics. International Journal of Food Science & Technology 49(11), 2373-2381;
Zettel, V., Paquet, D. O., Hecker, F. & Hitzmanna B., (2016). Image analysis and mathematical modelling for the supervision of the dough fermentation process. AIP Conference Proceedings 1769 (1);
*** STAS 91/1983, available at http://www.rompan.ro/analize-de-laborator/, accesed in 22.03.2020.


48th Symposium "Actual Tasks on Agricultural Engineering", Zagreb, Croatia, 2021
435
POTENTIAL OF BIOGAS GENERATION FROM PROCESSING GRAPE BY-PRODUCTS
Neven VOĆA*, Nikola BILANDŽIJA, Anamarija PETER, Jona ŠURIĆ, Tajana KRIČKA *E-mail of corresponding author: [email protected]
University of Zagreb Faculty of Agriculture, Svetošimunska cesta 25, Zagreb, Croatia
ABSTRACT
The aim of this paper is to determine process differences of anaerobic digestion and digested residue by using different raw material input - solid by-products (bio-waste) after grape processing in wine production from varieties Žlahtina, Syrah and Debit. It was found that digested residue in all of the samples, from which all are mildly alkaline, contains a low level of dry matter, 70% of which is organic matter. Biogenic elements were present in moderate concentration while values of heavy metals were within approved limits. This analysis leads to the conclusion that digested residues of all input materials can be used in agricultural production, especially in plant production and grassland cultivation. Biogas production from wine processing by-product contributes to environmental preservation and good technological solutions in waste treatment, including waste transformation into useful energy. Therefore, biogas production from wine by-products could provide winemakers to become producers of electricity and heat energy which could reduce greenhouse-gas emissions and prevent methane emission from waste decomposition.
Keywords: grape processing, by products, biogas renewables
INTRODUCTION
From ancient times, winemakers used grape residues obtained after grape pressing to produce strong alcoholic beverages. However, very large supply of grape processing by-product resulted in significant price fall of the drinks in the worlds market. For wine producers it meant lowering additional income from grape processing and rising costs of wine production. Therefore, with increasing wine production, the treatment and usage of large quantities of wine processing residues became an imperative. If not treated in an appropriate way, grape processing by-product could carry serious potential risk for the environment, ranging from surface and deep soil pollution to unpleasant odours that are developed from the stationary grape bio-waste. Namely, large accumulations of wine processed by-product attracts pests and insects like flies and may bring to outbreak and spreading of various
48. ACTUAL TASKS ON AGRICULTURAL ENGINEERING
Expert paper

N. Voća, N. Bilandžija, A. Peter, J. Šurić, T. Krička
436
diseases. Also, tannin solution and solution of other grape residue components that are extracted from its accumulation may cause reduction of oxygen level in the soil, penetrate into soil and underground waters. In the past, these residues were considered only as waste, treated in the simplest and cheapest way, i.e., by disposal at landfills. But, because of its chemical composition, untreated waste is a danger for underground waters (Arvanitoyannis, et al., 2006a; Arvanitoyannis, et al., 2006b; Valamoti et al., 2015).
In the European union, the most used method of utilization of grape processed by-product is to plough it in the soil as fertilizer. The use of wine by-product as fertilizer derives from the fact that it contains approximately 0.5-3.3% nitrogen, 0.2-0.7% phosphoric acid and 0.5-1% potassium. However, hard decomposition of cellulose in the petiole is the biggest obstacle to using grape processed by-product as fertilizer. Therefore, this method of treatment is not desirable because of high grape waste energy potential. Furthermore, this material is unsuitable for nutrition of ruminants due to low nutritive values, poor digestibility and high content of lignin, potassium and phenol. On the other hand, due to high content of organic matter what can be used in energy production and optimal grape waste treatment is anaerobic fermentation. Anaerobic fermentation produces biogas, that is most often is made of methane, carbon dioxide and aggregate of hydrogen, nitrogen, ammonia, hydrogen sulphide, carbon monoxide, oxygen and steam (Arvanitoyannis, et al., 2006b; Guerini et al. 2018). Produced biogas is most often used for generating electricity and thermal energy by combustion in boilers, gas-fired engines or turbines. Such production leaves by-product in the form of fermented residue, which keeps its nutritive substances. As such, it can be used for fertilizing plants immediately after fermentation and in the vicinity of settlements in accordance to Regulation on ecological production in plant cultivation and production of plant products (Official Gazette 91/2001). The EU member states make efforts to encourage, by certain regulations, producers to treat such waste in a quality way, as well as to minimise environmental risks.
Introduction of new technologies for using biomass obtained after agricultural production in energy production, and protecting environment in the process, represents the most important task in the future. The production of energy from biomass can also give various socio-economic effects, especially when various sorts of waste from agricultural and food production are concerned. However, despite many advantages, energy from biomass have some shortcomings in their exploitation. These include: handling difficulties; high costs of collecting; packaging and storing of biomass; fact that biomass is not formed continuously over the year; small volume mass and low thermal power of biomass per unit of volume; it is dispersed in the space; unfavourable shape and high moisture content and significant economic investments in combustion installations (El Achkar et al, 2016).
The grape and wine production is highly demanding in terms of technical skills and know how, which are based on high level of expertise and long-time experience. The result of these expertise and technology is a high quality product. However, such production leaves waste and by-products treatment that represent a specific ecological problem. Therefore, it shows the need to introduce new technologies in this process of waste management. Increasingly, the treatment of organic waste is seen as an optimal solution for source usage of electricity and thermal energy (Celma et al., 2007). Since wine producers do not have enough experience in preparation and use of by-products in energy production, the central objective of this paper is to resolve the issue of treating the grape residue as production source of electricity and thermal energy through cogeneration power plant. For this reason, the purpose of this paper

Potential of biogas generation from processing grape by-products
437
is to highlight the new approach to the solution of the issue of grape processing by-product as wine industry bio-waste, in the context of ecological and energy benefits.
MATERIALS AND METHODS
From the location of island Krk (north Adriatic region), a sample of grape processed residue was collected. The sample was taken from a cellar in the area of Vrbnik field. Taken samples were of different grape varieties: Syrah, Žlahtina and Debit.
Žlahtina is a well-known indigenous variety at the Krk island. Its origin is not known, although it is considered as native to the sub-region of Adriatic sea. It grows specifically in the Krk vineyard area, i.e., Vrbnik field and gives quality dry white wine, Vrbnička žlahtina. Syrah is a red grape variety which was imported from France in 1971, because of its good yielding potential and because of good quality of wine it gives (intense colour, pleasant aroma, high extract content). Due to this, it is used for blending with other wines that lack such features. The variety Debit was brought in Dalmatia from Italian region Puglia (sometimes the variety is referred to as Puglia grapevine). Wines from this Debit variety (such as protected quality dry white debit wines from Šibenik and Drniš areas, or Debit wines from several North Dalmatian sub regions) usually have colour in the spectre starting from straw yellow to golden yellow, in some rare cases even greenish yellow, if the liquid phase is separated after crushing.
At the Faculty of Agriculture of the University of Zagreb, there is an installed lab-scale biogas production facility, consisting of thermostatic water bath made of inox, electromagnetic mixers and batch glass reactors, which in full reproduce the conditions of industrial biogas production facilities (Figure 1).
heater
mixing
substrate, inoculum
FERMENTOR
BIOGAS CAPTURE
biogas analysis
chemical analyses of fermented residue
Figure 1 Scheme of laboratory anaerobic fermentation system

N. Voća, N. Bilandžija, A. Peter, J. Šurić, T. Krička
438
Firstly, the process of anaerobic fermentation of grape processed by-product was undertaken using a laboratory demonstration biogas facility, and the sample was prepared for analysis before fermentation. The aggregate of samples, water and inoculum was fed in these reactors in order to start the fermenting reaction. We chose the mesophyllic anaerobic fermentation process with a running time of 50 days at fermentation temperature of 35ºC. Inoculum for initiating samples and water fermentation was active sludge from wastewater treatment units of the City of Zagreb. Analysis of produced methane, nitrogen and CO₂ was done using a gas chromatograph (Varian CP-3800).
The chemical analysis of the digested residue was conducted by means of several different chemical procedures. pH was measured directly in the sample by means of pH-meter with the combined electrode. Total nitrogen was measured according to Kjeldahl (Kjeltec system 1026 Distilling Unit); ammonia nitrogen (NH3-N) was measured by means of Nesler reagent method according to Jackson (1958) spectrophotometrically at the wavelength of 436 mm. Phosphorus was measured by means of the molybdate-blue method on a UV/VIS spectrophotometer PU 8600, potassium and sodium were measured flame-photometrically, and all the other elements (K, Ca, Mg, Na, Mn, Zn, Cu, Fe, Ni, Cd, Co and Cr) were measured by atomic absorption spectroscopy (Perkin Elmer, AAnalyst 400) (Jackson, 1958).
Total carbon, hydrogen, nitrogen and sulphur were determined simultaneously, by the method of dry combustion in a Vario Macro CHNS analyser (Elementar Analysen systeme GmbH, Germany), according to the protocols for determining carbon, hydrogen and nitrogen (EN 16948:2015) and sulphur (EN 16994:2015). Likewise, the Oxygen content was calculated by difference and ash by EN 18122:2015.
RESULTS AND DISCUSSION
The analysis performed in the framework of this paper researched nitrogen, carbon, sulphur and hydrogen content in the grape residues of the following grape varieties: Žlahtina, Syrah, Debit.
Table 1 Content of C, H, N, S elements and ash in the grape processing by-product
Variety N % C % S % H % Ash (%)
Žlahtina 1.79 47.40 0.914 6.33 5.58
Syrah 2.27 57.82 0.271 6.23 5.03
Debit 2.18 55.72 0.257 5.89 4.28 The above table shows the variations between the grape varieties, which will certainly
result in different conditions for anaerobic fermentation. It is also evident that most values are the highest in the samples obtained after production of red Syrah wines.
The goal of monitoring dynamic of biogas production is to determine a pattern during wine processing samples as a substrate for processing by anaerobic fermentation. The investigation was carried out in laboratory conditions with the aim to observe charged anaerobic fermentation of by-products at mesophyllic conditions (35°C, 40 days). Due to this,
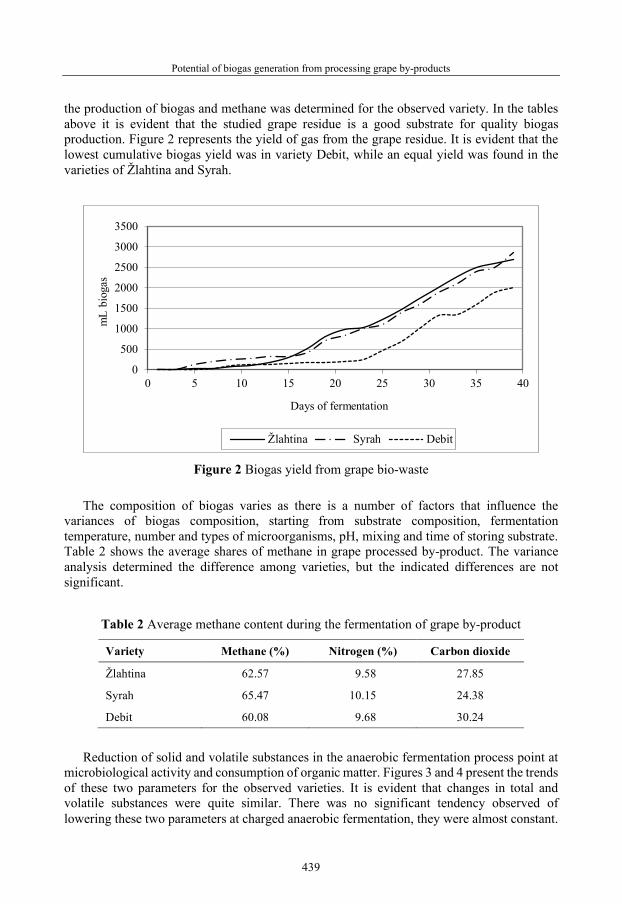
Potential of biogas generation from processing grape by-products
439
the production of biogas and methane was determined for the observed variety. In the tables above it is evident that the studied grape residue is a good substrate for quality biogas production. Figure 2 represents the yield of gas from the grape residue. It is evident that the lowest cumulative biogas yield was in variety Debit, while an equal yield was found in the varieties of Žlahtina and Syrah.
Figure 2 Biogas yield from grape bio-waste
The composition of biogas varies as there is a number of factors that influence the
variances of biogas composition, starting from substrate composition, fermentation temperature, number and types of microorganisms, pH, mixing and time of storing substrate. Table 2 shows the average shares of methane in grape processed by-product. The variance analysis determined the difference among varieties, but the indicated differences are not significant.
Table 2 Average methane content during the fermentation of grape by-product
Variety Methane (%) Nitrogen (%) Carbon dioxide
Žlahtina 62.57 9.58 27.85
Syrah 65.47 10.15 24.38
Debit 60.08 9.68 30.24 Reduction of solid and volatile substances in the anaerobic fermentation process point at
microbiological activity and consumption of organic matter. Figures 3 and 4 present the trends of these two parameters for the observed varieties. It is evident that changes in total and volatile substances were quite similar. There was no significant tendency observed of lowering these two parameters at charged anaerobic fermentation, they were almost constant.
0
500
1000
1500
2000
2500
3000
3500
0 5 10 15 20 25 30 35 40
mL
biog
as
Days of fermentation
Žlahtina Syrah Debit

N. Voća, N. Bilandžija, A. Peter, J. Šurić, T. Krička
440
Figure 3 Changes in solid matter in anaerobic fermentation of grape processing by-product
Figure 4 Changes in volatile substances in anaerobic fermentation of grape processing
by-product Furthermore, during anaerobic fermentation, no significant reduction in chemical
consumption of oxygen was observed, and the observation results show small variations in the charged fermentation between initial and final values. Methanogenic and acetogenic bacteria are sensitive to environment reaction. During anaerobic fermentation pH changes from 5.5 to 8.2, while the desirable range should be somewhat narrower. The production is regular at pH 6.6-7.6, and the optimal range is 7.0-7.2. The activity of methanogenic bacteria ceases when this value drops below 6.5. Also, wine by-product can be added to manure as an ideal substrate whose chemical content enhances anaerobic fermentation performance, i.e., contributes to more efficient biogas production. In this way, it can replace corn silage which is a costly component of biogas production.
100
140
180
220
260
0 5 10 15 20 25 30 35 40
g kg
ˉ¹
Days of fermentation
Žlahtina Syrah Debit
0
50
100
150
200
250
0 10 20 30 40
g kg
ˉ¹
Days of fermentation
Žlahtina Syrah Debit

Potential of biogas generation from processing grape by-products
441
Determining heavy metals in the fermented material is important because of methanogenic bacteria performance in anaerobic fermentation. The successful development of all methanogenic bacteria requires relatively low iron, nickel, and cobalt levels. Since the fermented residue is used as biological fertilizer, it is important to determine all harmful substances that could be present in agricultural soil in concentrations which, temporarily or permanently, bring into question the soil’s fundamental role of being a favourable habitat for cultivated and wild plants. Harmful substances include heavy metals and potentially toxic elements (Cd, Hg, Mo, As, Co, Ni. Cu, Pb. Cr and Zn) and polycyclic aromatic hydrocarbon (Voća et al., 2005). Harmful substances are also those that are introduced in the soil in an uncontrolled manner, or are applied without the necessary knowledge, in disproportionate quantities, in wrong timing or are inadequate for the specific soils, and are defined as such in the Regulation on ecological production in plant cultivation and production of plant products (OG 91/2001) in the Republic of Croatia. The Regulation allows the use of biological waste, if the zinc content in waste does not exceed 210 mg per kilogram of dry matter, the content of copper does not exceed 70 mg, lead 70 mg kgˉ¹ and cadmium 0.7 mg kgˉ¹ of dry matter. As shown in Table 3, the quantities of these heavy metals found in all samples before anaerobic fermentation of residue have concentrations lower than prescribed and meet the legislative requirements in Croatia (and thus in the EU). This material after fermentation will expectedly be freely used in the agricultural production.
Table 3 Analysis of wine processing by-product after anaerobic fermentation
Analyses (total per dry matter) Žlahtina Syrah Debit
% C 47.25 49.32 48.52
% H 6.35 6.88 6.71
% N 1.80 2.35 2.25
% S 0.35 0.31 0.30
% K2O 1.34 0.61 1.12
% Ca 0.73 0.82 0.83
% Mg 0.13 0.09 0.13
% Na 0.83 0.72 1.18
mg kgˉ¹ Mn 16.85 16.84 19.43
mg kgˉ¹ Zn 16.45 17.73 19.43
mg kgˉ¹ Cu 26.95 20.78 30.79
mg kgˉ¹ Fe 81.85 129.63 103.20
mg kgˉ¹ Ni 10.60 11.52 11.16
mg kgˉ¹ Cd 0.28 0.24 0.21
mg kgˉ¹ Co 0.08 0.08 0.12
mg kgˉ¹ Cr 0.02 0.03 0.03

N. Voća, N. Bilandžija, A. Peter, J. Šurić, T. Krička
442
Unlike fertilizing with non-fermented organic matters, activity of fermented fertilizer was faster, as shown by the analysis, because after fermentation they are already in mineralized form and in this way plants can use them more efficiently. Each plant species has specific need for nutrients with specific N:P2O5:K2O ratio. In the relevant literature it was found that N to P to K ratio in non-fermented residues varies in relation 3 to 1 to 0.3 (Panuccio et al, 2019; Barduca, et al; 2020; Koszel eta la.; 2020). This value shows that with such relations fermented residue can cover the plant’s needs for nitrogen and phosphorus, while potassium should be additionally supplied. Further, another valuation of a fertilizer is C to N ratio. In general, biofertilizers have a narrow C to N ratio, from 10:1 to 15:1. The concerned fermented residues can be applied in the agricultural production, especially in fertilizing grass or wine yard plantations under grassy mixtures. Resides have still unpleasant odour, and if diluted with water there are no further chemical reactions or gas release. Fermented residues have porous structure and high air intake capacity. After being applied on arable land, they quickly get subject to further biological disintegration by aerobic bacteria. Beside plant nutrition, they favourably influence soil microbiological activity.
Harmful substances include: heavy metals and potentially toxic elements (Cd, Hg, Mo, As, Co, Ni, Cu, Pb, Cr and Zn) and polycyclic aromatic hydrocarbon. Harmful substances are also those that are introduced in the soil in an uncontrolled manner, or are applied without necessary knowledge, in disproportionate quantities, in wrong timing or are inadequate for specific soils. The application of fermented residues is allowed on arable land, meadows and plain pastures, whose soil contains some of heavy metals and persistent organic harmful substances in amount of less than 50% of limit values set out in the Regulation on ecological production in plant cultivation and production of plant products (OG 91/2001) in the Republic of Croatia. The quality of digested residues in terms of possibility of their use on arable land was compared and interpreted in accordance with the mentioned Regulation in which the harmful substances, as well as allowed quantities of these substances in soil are set out. According to the Regulation, by-products of any production, such as fermented residue in this case-liquid manure, can be applied on agricultural land only providing that it was analysed and under expert supervision. In addition to fertilizer analysis, it is necessary to carry out the soil analysis for determining the quantity of liquid fertilizer.
CONCLUSION
Biogas production from grape residue is a way to ensure environment preservation and good technological solutions for waste treatment, by transforming waste in to useful energy. Production of biogas from processing by-product will enable winemakers to become raw material providers for biogas producers, contributing this way to reduction of greenhouse-gas emissions and preventing methane emissions which derive from wine residue decomposition.
The quantities of wine processing by-product and the method of its utilization can provide convincing evidence of economically viable use of this material as a renewable energy source. The treatment of wine processing by-product for the purpose of energy production will result in additional use of bio-waste that will become an additional source of income for winemakers. It will also contribute to a positive economic balance of wine production. Moreover, implementation of technologies of wine processing by-product production and utilization will improve energy efficiency of winemakers, increase domestic energy production, and create positive effects on the environment; open new market for equipment and, finally, it will promote a general development of rural areas.
Potential of biogas generation from processing grape by-products
443
REFERENCES
Arvanitoyannis, I.S., Ladas, D., Mavromatis, A. (2006a). Potential uses and applications of treated wine waste. a review, International Journal of Food Science and Technology, 41, 475-487.
Arvanitoyannis, I.S., Ladas, D., Mavromatis, A. (2006b). Wine waste treatment methodology, International Journal of Food Science and Technology, 41, 1117-1151.
Badruca, L.; Wentzel, S.; Schmidt, R.; Malagoli, M.; Joergesen, R.Hg: (2020). Mineralisation of distinct biogas digestate qualities directly after application to soil, Biology and fertility of soils, DOI: 10.1007/s00374-020-01521-5
Celma, A.R., Rojas, S., Lopez-Rodrigez, F. (2007). Waste to energy possibilities for industrial olive and grape by-products in Extramadura, Biomass and bioenergy 31, 522-534.
El Achkar, J.H., Lendormi, T., Hobaika, Z. (2016). Anaerobic digestion of grape pomace. Biochemical characterization of the fractions and methane production in batch and continuous digesters, Waste management 50, 275-282.
Guerini, M., Lumi, M., Hasan, C., Marder, M., Leite, L.C.S., Konrad, O. (2018). Energy recovery from wine sector wastes. A study about the biogas generation potential in a vineyard from Rio Grande do Sul, Brazil, Sustainable Energy Technologies and Assessments, 29, 44-49.
Koszel, M.; Parafiniuk, S.; Szparaga, A.; Bochniak, A.; Kocira, S.; Atanasov, A.; Kovalyshyn, S. (2020). Impact of Digestate Application as a Fertilizer on the Yield and Quality of Winter Rape Seed, Agronomy - Basel, 10(6), 878
Jackson M.L. (1958). Soil chemical analysis, Englewood Cliffs, Prentice Hall, 498. Oficial Gazzete of Croatia 91/2001. Regulation on ecological production in plant cultivation and
production of plant products (2001). Panuccio, M.R.; Papalia, T.; Attina, E.; Giufre, A.; Muscolo, A. (2019). Use of digestate as an alternative
to mineral fertilizer: effects on growth and crop quality; Archives of Agronomy and Soil Science; 65(5), 700-711.
Valamoti, S.M., Manfaga, M., Koukouli-Chrysanthaki, Ch., Malamidou. D. (2015). Grape-pressing from northern Greece. the earliest wine in the Aegean?, Antiquity 81 (311), 54-61.
Voća, N., Krička, T., Ćosić, T., Rupić, V., Jukić, Ž., Kalambura, S. (2005). Digested residue as a fertilizer after the mesophilic process of anaerobic digestion, Plant, soil and environment, 51, 262-266.


48th Symposium "Actual Tasks on Agricultural Engineering", Zagreb, Croatia, 2021
445
PROCESSING METHODS OF WINE BY-PRODUCTS TO OBTAIN GRAPE SEED OIL AND GRAPE SEED FLOUR AS
FUNCTIONAL INGREDIENTS FOR FOOD FORTIFICATION Oana-Diana CRISTEA1*, Luminiţa CATANĂ2, Carmen BRĂCĂCESCU1,
Carmen BĂLŢATU1, Laurenţiu VLADUŢOIU1, Iulia GRIGORE1, Nicoleta UNGUREANU3
*E-mail of corresponding author: [email protected] 1 National Institute for research-Development of Machines and Installations Designed for
Agriculture and Food Industry, INMA Bucharest, Romania 2 National Institute of Research and Development for Food Bioresources-IBA Bucharest, Romania
3 University POLITEHNICA of Bucharest, Romania.
ABSTRACT
Wine industry has undergone a remarkable development lately, given that the technologies and biotechnologies have registered an unprecedented progress, on the market being available more and more offers of products indispensable for modern wine technologies (yeasts, bacteria or enzymes). Following the processing of grapes to obtain the finished product, a series of by-products and waste can be recovered (bunch, pomace, tartar, yeast), and their processing can ensure a good protection of the environment. Also, by the rational processing of wine industry by-products, high value-added products with various applications in the food, cosmetic and pharmaceutical industries can be obtained. The paper presents the processing technology of wine by-products in order to obtain functional ingredients for food fortification, that was developed within the National Institute of Research – Development for Machines and Installations Designed for Agriculture and Food Industry Bucharest, the technical equipment and the preliminary results of the experimental determinations conducted in laboratory conditions to obtain oil from grape seeds, separated from pomace, concluding with the advantages of processing these wine by-products.
Keywords: wine, by-products, processing, methods, functional ingredients.
INTRODUCTION
By-products are the result of technological operations carried out during vinification or wine conditioning, and their properties vary depending on different factors (ecological,
48. ACTUAL TASKS ON AGRICULTURAL ENGINEERING
Preliminary communication

O.-D. Cristea, L. Catană, C. Brăcăcescu, C. Bălţatu, L. Vladuţoiu, I. Grigore, N. Ungureanu
446
technological, biological) or the degree of grapes ripeness. In the literature it is estimated a 25% amount of wine by-products which are obtained from recovery technologies. Pomace (seeds, bunches, skins) and wastes from vinification contain extracts rich in bioactive compounds (mainly polyphenols) that can be recovered on the market. Many experimental studies have shown that grape pomace is a valuable by-product of wine industry and its valorization demonstrates an important economic efficiency (Balteş, 2015; Skotti et al., 2018; Soceanu et al., 2020).
A better knowledge of grape pomace composition enables to find industrial uses and to evaluate the importance of the raw material variability.
Research conducted both internally and externally has shown that grape seeds have anti-allergic, anti-inflammatory, anti-cancer, immune-boosting, as well as beneficial effects in cardiovascular diseases (Dorobanţu and Beceanu, 2007; Jayaprakasha et al., 2003).
Also, wine by-products (pomace, grape seeds) have a complex biochemical composition, notable for their content in minerals, fiber, vitamin C and phenolic compounds such as tannins, phenolic acids, anthocyanins and resveratrol. The latter is a strong polyphenolic antioxidant, considered to be 4-5 times stronger than beta carotene, 50 times stronger than Vitamin E and 20 times stronger than Vitamin C, found in grape and wine and in other families of plants such as peanuts, tree bark, Polygonum cuspidatum, a well-known traditional Chinese medicine (Dan, 2001; Trifoi, 2019; Gugleva et al., 2020).
The complex recovery of by-products is determined by their large share and the substances they contain, being useful to different industries (food, chemical, pharmaceutical, textile).
Rational processing of wine industry by-products using modern green technologies and ecological measures to protect the environmental factors gives the possibility to obtain high value-added products with applications in food, cosmetics and pharmaceutical industries. Research should also be focused on the structural elucidation of other novel bioactive compounds derived from vinification residues, such as grape stems or yeast (Zitella, 2016; Vorobiev, 2020).
Grape seed oil also has nutritional properties. It is very rich in resveratrol, which is an ally in the fight against cancer and diabetes. Therefore, the correct management of by-products in the wine industry has a significant impact both on the environment, and from an economic and social point of view, through the possibility of creating additional jobs.
The processing of grape seeds to obtain oil (by cold pressing) that is further used in the development of food supplements, is usually done by screw conveyor presses (Biriş et al., 2009; Găgeanu et al., 2011; Ionescu et al., 2015) or presses with vertical piston (Ionescu et al, 2016).
MATERIALS AND METHODS
Grape seeds are among the wine by-products whose use is appreciated in all wine-producing countries. The presented method of capitalization of grape pomace (Fig. 1) it mainly concerns the separation of grape seeds from grape skins and other parts of the plant. The pulp must be unpacked to make the separation process more efficient.

Processing methods of wine by-products to obtain grape seed oil and grape seed flour as functional ingredients...
447
The pomace mixture is biphasic (solid material with high humidity) and is composed of seeds and skins that are initially compact because this material is obtained after the pressing process.
Figure 1 Functional flow diagram for the method of capitalizing grape pomace
The separation process can be compared with that of cereals, consisting of washing
followed by size separation (Brӑcӑcescu et al, 2019). The technology of processing wine by-products for the separation of grape seeds
developed by INMA (Fig. 2) consists of: equipment for primary separation equipment - ESP, equipment for pomace drying - EPD, transport system - TS, equipment for final separation of grape seeds - ESGS, all operated and monitored by a command and control unit - CCU.
During the experiments performed in laboratory conditions, the wine by-products in the form of a heterogeneous mixture (skins pulp, seeds) were subjected to primary / final separation operations. To protect the bioactive compounds (vitamins, phenols, etc.) to a moisture that allows their grinding and transformation into flours and, at the same time, their qualitative stability (sensory, physico-chemical and microbiological), a convective drying was performed using hot air in optimal conditions (temperature, degree of grate loading etc.).
Figure 2 Block diagram of technology for separation of grape seeds from pomace
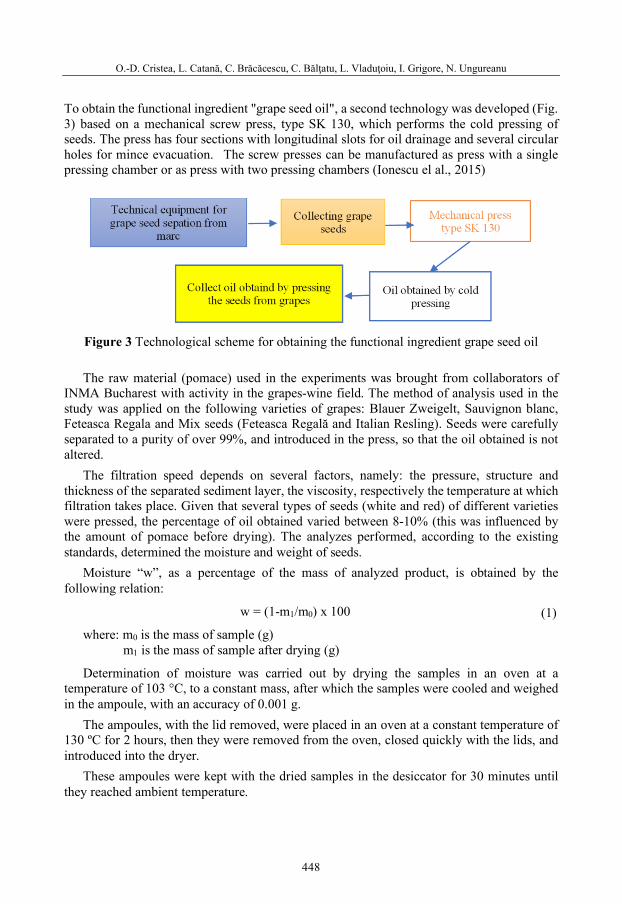
O.-D. Cristea, L. Catană, C. Brăcăcescu, C. Bălţatu, L. Vladuţoiu, I. Grigore, N. Ungureanu
448
To obtain the functional ingredient "grape seed oil", a second technology was developed (Fig. 3) based on a mechanical screw press, type SK 130, which performs the cold pressing of seeds. The press has four sections with longitudinal slots for oil drainage and several circular holes for mince evacuation. The screw presses can be manufactured as press with a single pressing chamber or as press with two pressing chambers (Ionescu el al., 2015)
Figure 3 Technological scheme for obtaining the functional ingredient grape seed oil The raw material (pomace) used in the experiments was brought from collaborators of
INMA Bucharest with activity in the grapes-wine field. The method of analysis used in the study was applied on the following varieties of grapes: Blauer Zweigelt, Sauvignon blanc, Feteasca Regala and Mix seeds (Feteasca Regală and Italian Resling). Seeds were carefully separated to a purity of over 99%, and introduced in the press, so that the oil obtained is not altered.
The filtration speed depends on several factors, namely: the pressure, structure and thickness of the separated sediment layer, the viscosity, respectively the temperature at which filtration takes place. Given that several types of seeds (white and red) of different varieties were pressed, the percentage of oil obtained varied between 8-10% (this was influenced by the amount of pomace before drying). The analyzes performed, according to the existing standards, determined the moisture and weight of seeds.
Moisture “w”, as a percentage of the mass of analyzed product, is obtained by the following relation:
w = (1-m1/m0) x 100 (1) where: m0 is the mass of sample (g) m1 is the mass of sample after drying (g)
Determination of moisture was carried out by drying the samples in an oven at a temperature of 103 °C, to a constant mass, after which the samples were cooled and weighed in the ampoule, with an accuracy of 0.001 g.
The ampoules, with the lid removed, were placed in an oven at a constant temperature of 130 ºC for 2 hours, then they were removed from the oven, closed quickly with the lids, and introduced into the dryer.
These ampoules were kept with the dried samples in the desiccator for 30 minutes until they reached ambient temperature.
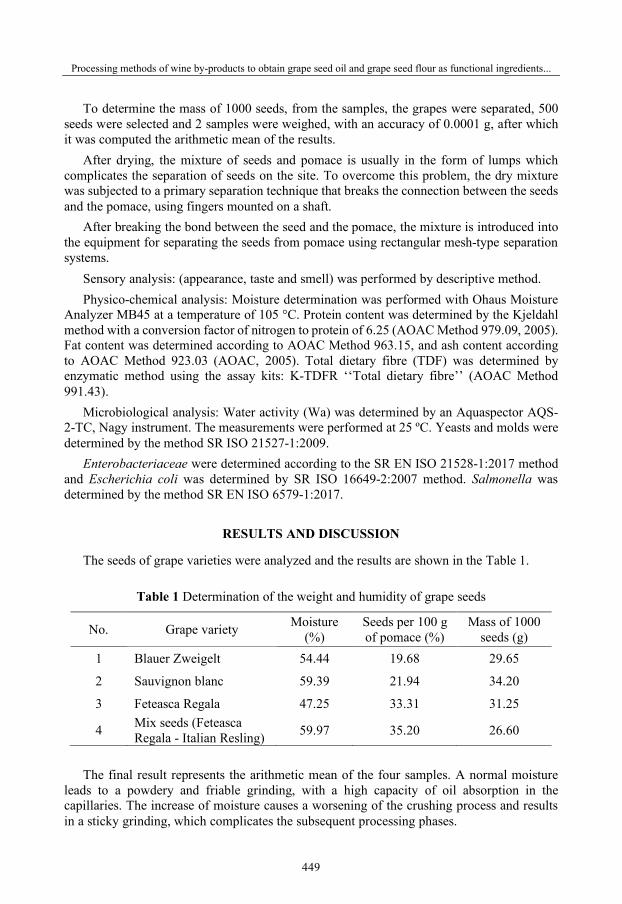
Processing methods of wine by-products to obtain grape seed oil and grape seed flour as functional ingredients...
449
To determine the mass of 1000 seeds, from the samples, the grapes were separated, 500 seeds were selected and 2 samples were weighed, with an accuracy of 0.0001 g, after which it was computed the arithmetic mean of the results.
After drying, the mixture of seeds and pomace is usually in the form of lumps which complicates the separation of seeds on the site. To overcome this problem, the dry mixture was subjected to a primary separation technique that breaks the connection between the seeds and the pomace, using fingers mounted on a shaft.
After breaking the bond between the seed and the pomace, the mixture is introduced into the equipment for separating the seeds from pomace using rectangular mesh-type separation systems.
Sensory analysis: (appearance, taste and smell) was performed by descriptive method. Physico-chemical analysis: Moisture determination was performed with Ohaus Moisture
Analyzer MB45 at a temperature of 105 °C. Protein content was determined by the Kjeldahl method with a conversion factor of nitrogen to protein of 6.25 (AOAC Method 979.09, 2005). Fat content was determined according to AOAC Method 963.15, and ash content according to AOAC Method 923.03 (AOAC, 2005). Total dietary fibre (TDF) was determined by enzymatic method using the assay kits: K-TDFR ‘‘Total dietary fibre’’ (AOAC Method 991.43).
Microbiological analysis: Water activity (Wa) was determined by an Aquaspector AQS-2-TC, Nagy instrument. The measurements were performed at 25 ºC. Yeasts and molds were determined by the method SR ISO 21527-1:2009.
Enterobacteriaceae were determined according to the SR EN ISO 21528-1:2017 method and Escherichia coli was determined by SR ISO 16649-2:2007 method. Salmonella was determined by the method SR EN ISO 6579-1:2017.
RESULTS AND DISCUSSION
The seeds of grape varieties were analyzed and the results are shown in the Table 1.
Table 1 Determination of the weight and humidity of grape seeds
No. Grape variety Moisture (%)
Seeds per 100 g of pomace (%)
Mass of 1000 seeds (g)
1 Blauer Zweigelt 54.44 19.68 29.65
2 Sauvignon blanc 59.39 21.94 34.20
3 Feteasca Regala 47.25 33.31 31.25
4 Mix seeds (Feteasca Regala - Italian Resling) 59.97 35.20 26.60
The final result represents the arithmetic mean of the four samples. A normal moisture
leads to a powdery and friable grinding, with a high capacity of oil absorption in the capillaries. The increase of moisture causes a worsening of the crushing process and results in a sticky grinding, which complicates the subsequent processing phases.

O.-D. Cristea, L. Catană, C. Brăcăcescu, C. Bălţatu, L. Vladuţoiu, I. Grigore, N. Ungureanu
450
The results of seed weight variation are shown in Figure 4.
Figure 4 Determination of seed weight variation
The amount of seeds obtained from pomace (from different grape varieties) varies between
27-49% (for a switch to 3 different frequencies), as detailed in Table 2.
Table 2 Separate amount of seeds from different grape varieties
Grape variety Frequency (Hz) Time
(min) Separate amount
of seeds * 25 35 50
Blauer Zweigelt x - - 15 3.64 - x - 4.17 4.30 - - x 3.38 2.30
Sauvignon blanc x - - 27 4.50 - x - 5.17 4.76 - - x 2.17 4.90
Feteasca Regala x - - 21 3.42 - x - 3.27 3.63 - - x 1.47 2.62
Mix seeds (Feteasca Regala - Italian Resling)
x - - 22 3.52 - x - 5.42 4.34 - - x 1.25 3.78
*from 10 kg of pomace The percentage obtained from the functional ingredient "grape seed oil" varies between 8-
10% (this being influenced by the amount of pomace before drying). From the grape pomace obtained from the Blauer Zweigelt and Fetească Regală grape
varieties, were obtained two functional ingredients: grape seed flour and grape seed oil (Fig. 5).

Processing methods of wine by-products to obtain grape seed oil and grape seed flour as functional ingredients...
451
Grape seed flour Blauer
Zweigelt variety Grape seed oil
Blauer Zweigelt variety
Grape seed flour Fetească Regală variety
Grape seed oil Fetească Regală
variety
Figure 5 Grape seed flour and grape seed oil
Table 3 Physico-chemical composition of grape seed flour
Flour/ variety Moisture (%)
Ash (%)
Protein (%)
Fat (%)
Total fibers (%)
Grape seed flour/ Blauer Zweigelt variety 4.01 3.53 8.42 11.34 59.15
Grape seed flour/ Fetească Regală variety 4.25 3.72 7.79 11.94 62.68
The physico-chemical analysis of the functional ingredient “grape seed oil” is presented
in Table 4. The refractive indices of the oil obtained from grape seeds belonging to the two grape varieties.
Table 4 Physico-chemical analysis of grape seed oil
Physico-chemical indicator Grape seed oil, Blauer Zweigelt variety
Grape seed oil, Fetească Regală variety
Refraction index 1.4745 1.4780
Iodine index (g I/100 g oil) 65.99 70.60
Acidity index (mg KOH/g oil) 3.85 1.06
Peroxide index (meq O2/kg oil) 4.41 4.23 Fetească Regală and Blauer Zweigelt have similar values. Grape seed oil from Blauer
Zweigelt variety, has a significantly higher acidity index compared to Fetească Regală grape seed oil.
The microbiological analysis showed that the functional ingredient "grape seed flour" falls within the provisions of the legislation in force (Table 5). Also, following the performed analysis, it was found that it has low values of water activity, which gives it stability from a microbiological point of view.

O.-D. Cristea, L. Catană, C. Brăcăcescu, C. Bălţatu, L. Vladuţoiu, I. Grigore, N. Ungureanu
452
Table 5 Microbiological analysis of functional ingredients
Functional ingredient/variety
Yeast and mold
(CFU/g)
Entero-bacteriaceae
(CFU/g)
Escherchia coli (CFU/g)
Salmonella (in 25 g)
Water activity
Grape seed flour/ Blauer Zweigelt variety
< 10 < 10 < 10 absent 0.216
Grape seed flour/ Fetească Regală variety
< 10 < 10 < 10 absent 0.235
Grape seed oil/ Blauer Zweigelt variety
< 10 < 10 - - -
Grape seed flour/ Fetească Regală variety
< 10 < 10 - - -
Following the microbiological analysis, it was also found that the functional ingredient
"grape seed oil", obtained from experiments, falls within the regulations in force.
CONCLUSIONS
The superior recovery of wine by-products by applying the technology presented in this paper ensures the preservation of bioactive compounds in high proportion and offers the possibility to obtain foods with high nutritional value and antioxidant potential.
The convective drying with hot air performed in the thechnology for separation of grape seeds from pomace allows the protection of bioactive components and, at the same time, their qualitative stability.
The functional ingredient „grape seed oil” obtained with the second technology corresponds to the regulations in force.
The flours obtained from various types of grape seeds have been noted for their rich content in minerals, proteins, lipids and fibers, making possible their use as functional ingredients to fortify bakery products.
Following the analysis of the two functional ingredients analyzed from a sensory, physico-chemical and microbiological point of view, it resulted that:
- the functional ingredient "grape seed flour" has appropriate sensory characteristics, retaining in a high proportion the taste, smell / aroma of the wine by-products from which they were prepared;
- the functional ingredient “grape seed oil” is a dark yellow viscous liquid (Fetească Regală variety), respectively yellowish-green to yellow (Blauer Zweigelt variety), with a specific smell and taste;
- the physico-chemical analysis revealed that the flours obtained from grape seeds, are distinguished by the content in ash (mineral elements), proteins, lipids and total fibers.
Processing methods of wine by-products to obtain grape seed oil and grape seed flour as functional ingredients...
453
ACKNOWLEDGEMENTS
This paper was financed with: - - the support of National Agency for Scientific Research and Innovation, Programme
SECTORAL PLAN (Contract no. 2 PS / 28.08.2019), project P 2.1.2 “Research on the fortification of food products with functional ingredients obtained from wine by-products”;
- - a grant of the Romanian Research and Innovation Ministry, through Programme 1 – Development of the national research-development system, subprogramme 1.2 – Institutional performance – Projects for financing excellence in RDI, contract no. 16 PFE.
REFERENCES
Balteș, M. (2015). Identification and characterization of useful sub products of grape wine products, case study: wine yeast. Proceding of the International Conference Agri-Food Sciences, Processes and Technologies, Agri-Food, Sibiu - Romania, 33-41.
Biriş, S., Manea, M., Paraschiv, G., Vlăduţ, V., Bungescu, S. (2009). Power calculus elements for oil presses. Proceedings of the 37 International Symposium on Agricultural Engineering "Actual Tasks on Agricultural Engineering", Opatija, Croaţia, 475-484.
Brӑcӑcescu, C., Ţenu, I., Mircea, C., Bunduchi, G. (2019). Experimental research on influence of functional parameters of combined installations designed at separating the impurities out of cereal seeds. Proceedings of 8th International Conference on “Thermal Equipment, Renewable Energy and Rural Development, TE-RE-RD 2019”, E3S Web-of-Conferences, Open Access proceedings in Environment, Energy and Earth Sciences, vol. 112, Tȃrgovişte, Romȃnia.
Dan, V., (2001). Microbiology of oils and derived products. Alma Publishing House, Galaţi, Romania. Dorobanţu, P., Beceanu, D. (2007). Nutritional and dietary importance of vegetable oils, Scientific paper
U.S.A.M.V., Agriculture Series 50, 44-51. Găgeanu, P., Vlăduţ, V., Păun, A., Chih, I., Biriş, S. (2011). Pure plant oil – source of alternative energy.
Proceedings of the 39 International Symposium on Agricultural Engineering "Actual Tasks on Agricultural Engineering", Opatija, Croaţia, 141-152.
Gugleva, V., Zasheva, S., Hristova, M., Andonova, V. (2020). Topical use of resveratrol: technological aspects. Farmatsiia 67(2), 89-94.
Ionescu, M., Voicu, Gh., Biriş, S., Ungureanu, N., Vlăduţ, V., Voicea, I., Persu, C. (2015). About the oil expression process using screw presses with strainers oil outlet, Proceedings of the 43 International Symposium on Agricultural Engineering "Actual Tasks on Agricultural Engineering", Opatija, Croaţia, 513-524.
Ionescu, M., Voicu, Gh., Biriş, S.Şt., Vlăduţ, V., Ungureanu, N., Ştefan, E.M., Dincă, M., Matache, M. (2016). Oil extraction using a vertical press with piston, Proceedings of the 44 International Symposium on Agricultural Engineering "Actual Tasks on Agricultural Engineering", Opatija, Croaţia, 249-258.
Jayaprakasha, G.K., Selvi, T., Sakariah, K.K. (2003). Antibacterial and antioxidant activities of grape (Vitis vinifera) seed extracts. Food Research International 36 (2), 117–122.
Skotti, E., Kalli, E., Lappa, I., Petros, A., Tarantilis, P.A. (2018). Novel application and industrial exploitation of winery by-products. Bioresources and Bioprocessing, 2-21.

O.-D. Cristea, L. Catană, C. Brăcăcescu, C. Bălţatu, L. Vladuţoiu, I. Grigore, N. Ungureanu
454
Soceanu, A., Dobrinas, S., Sirbu, A, Manea, N., Popescu, V. (2020). Economic aspects of waste recovery in the wine industry, a multidisciplinary approach. Science of the Environment, DOI: 10.1016/j.scitotenv.2020.143543.
Vorobiev, E., Lebovka, N.I. (2020). Grapes and residues of wine industry. Processing of Food and Biomass Feedstocks by Pulsed Electric Energy, 299-335, DOI: 10.1007/978-3-030-40917-3_11.
48th Symposium "Actual Tasks on Agricultural Engineering", Zagreb, Croatia, 2021
455
MISCANTHUS AND MAIZE STALK AS SOURCE FOR GREEN ENERGY PRODUCTION
Mateja GRUBOR*, Ana MATIN, Nikola BILANDŽIJA, Sandra BISCHOF, Vanja JURIŠIĆ, Mislav KONTEK, Tajana KRIČKA
*E-mail of corresponding author: [email protected] University of Zagreb Faculty of Agriculture, Svetošimunska cesta 25, 10000 Zagreb, Croatia
ABSTRACT
Rising concerns about fossil energy and its impact on the environment have accelerated the development of bioenergy on a global level since biomass is a long-term renewable and CO2 neutral. The use of biomass resources for energy purposes will reduce the dependence on fossil fuels and provide a way to mitigate climate change. Miscanthus and maize stalk will be investigated to be used for energy production by direct combustion. Maize stalk as postharvest residues and energy crop Miscanthus x giganteus belong to the second generation biomass (lignocellulosic biomass), but also to C4 plants, and such biomass is a potentially high-value source for green energy production. This study aims to determine the miscanthus and maize stalk biomass energy properties (structural, ultimate and proximate analysis and heating) as feedstock in the process of biofuel production. Namely, the characterization of these components, both qualitative and quantitative, is essential for defining the further processing of biomass into biofuels. Ash with moisture is a fundamental component of the non-combustible matter and 4,40% share for maize stalk and 1,96 for miscanthus is better than the most agricultural biomass., The most significant components of combustible matter are carbon and sulfur, and their values of approx. 47% and 0.2%) indicate good quality of the investigated raw material. The structural composition indicates the potential for use in the production of liquid fuels but also in the production of solid fuels. The lower heating value of maize stalk was 15 MJkg-1 while lower heating value of miscanthus biomass was 17 MJkg-1. Based on above results it can be concluded that investigated biomass has great potential as raw material for green energy production.
Keywords: Miscanthus x giganteus, maize stalk, energy properties, biofuel.
48. ACTUAL TASKS ON AGRICULTURAL ENGINEERING
Original scientific paper

M. Grubor, A. Matin, N. Bilandžija, S. Bischof, V. Jurišić, M. Kontek, T. Krička
456
INTRODUCTION
Rising concerns about fossil energy and its impact on the environment have accelerated the development of bioenergy on a global level since biomass is a long-term renewable and CO2 neutral (Johnson et al., 2007). The substitution of fossil energy by energy obtained from biomass is a promising and multifunctional way to protect and upgrade national energy security and improve rural economy (Zhou and Thomson, 2009). It will also reduce the dependence on fossil fuels and provide a way to mitigate climate change.
Agricultural lignocellulosic biomass has great energy potential because it is obtained from the primary agricultural production residues, as well as from food industry by-products (Krička et al., 2012). Maize stalk as postharvest residues and energy crop Miscanthus x giganteus belong to the second generation biomass (lignocellulosic biomass), but also to C4 plants, and such biomass is a potentially high-value source for green energy production.
By adopting the EU Bioeconomy Strategy, a circular economy for agriculture production is defined through food, feed, fuels, and fiber (4F) strategy. Due to mentioned miscanthus and maize stalk can be also used as fibers source for fiber reinforced composites. During the production process cellulose from the plants is removed and since the obtained residues are rich with lignin, they can be used for energy production by direct combustion.
Thermochemical conversion of biomass is an increasingly viable way to use agricultural residues and energy crops to fulfil energy needs (Tanger et al., 2013). Such biomass can be converted into a variety of energy needs such as electricity, process heat, and engine fuel (Demirbas, 2004). Generally, biomass conversion technologies are considered as environmentally friendly processes (Mladenović et al., 2018; Bilandžija et al., 2018).
Fuel properties data are foundation for valorisation of biomass in the combustion process (Tao et al., 2012). Such information is usually obtained by structural analysis (lignocellulosic composition), ultimate analysis, proximate analysis and heating values (Álvarez-Álvarez et al., 2018).
Considering the above mentioned the aim of this paper is to determine the miscanthus and maize stalk biomass energy properties (structural, ultimate and proximate analysis and heating values) as feedstock in the process of biofuel production.
MATERIALS AND METHODS
The analytical investigation of miscanthus biomass and maize stalk was conducted in the Laboratory for biomass and energy efficiency in agriculture at the University of Zagreb Faculty of Agriculture. All samples, after harvesting, were immediately transported to the laboratory and dried at room temperature in an elementary layer in order to eliminate extrinsic moisture. After drying, samples were ground in a laboratory grinder.
The structural analysis included determination of cellulose, hemicellulose and lignin content by the modified standard method ISO 5351-1:2002 in laboratory conditions.
The proximate analysis included determination of moisture content (HRN EN 18134-2:2015), ash content (HRN EN ISO 18122:2015), fixed carbon and volatile matter content (EN 15148:2009).

Miscanthus and maize stalk as source for green energy production
457
The ultimate analysis included determination of carbon, hydrogen, nitrogen (HRN EN ISO 16948:2015), and sulphur (HRN EN ISO 16994:2015) content which were determined simultaneously by dry combustion method by using the Vario Macro CHNS analyzer, while the oxygen content was calculated by difference.
The higher heating value (HHV) were determined by the EN 14918:2010 method by using an adiabatic calorimeter, while lower heating value (LHV) is obtained by calculating.
The data were analysed by means of the statistical software package SAS version 9.3 (USA).
RESULTS AND DISCUSSION
For understanding of the feedstock suitability for energy production it is important to determine its energy properties and that can be done through structural properties, ultimative and proximative analysis and heating value.
Miscanthus biomass and maize stalk belong to the second generation of raw materials for the biofuels production and they are included in the raw materials of the so-called lignocellulosic composition. Table 1 shows the structural (lignocellulosic composition) of the studied crops.
Table 1 Crops structural properties
Energy crop Cellulose (%) Hemicellulose (%) Lignin (%)
Miscanthus 53.11b* ± 0.58 13.52a ± 0.21 28.96b ± 0.52
Maize stalk 42.23a ± 0.89 25.74b ± 0.36 24.60a ± 0.33 *Different letters within a column indicate significant differences at the 5% level.
Biomass with a higher content of lignin is more suitable for energy production by the
direct combustion process, while during the production of second generation biofuels its lowest share is desirable (Hodgson et al., 2010; Bilandžija et al., 2016). Cellulose has a higher oxygen concentration compared to lignin, so the heating value of cellulose is lower than lignin (Lewandoeski et al., 2003). As a result, a lower cellulose content is desirable for the direct combustion process, and as high as possible in the production of second-generation bioethanol from lignocellulosic biomass. Like cellulose, hemicellulose has a higher oxygen concentration than lignin, so the heating value of hemicellulose is lower than lignin, so a lower proportion of hemicellulose in biomass is also desirable for the combustion process.
The obtained results of lignocellulosic composition indicate the possibility of using the investigated crops in the production of solid and liquid biofuels, and are in accordance with the literature for miscanthus (Bilandžija et al., 2016; Jurišić et al. 2018) and for maize stalk (Antonović et al., 2016; Grubor et al., 2018).
Table 2 shows the proximate analysis of the investigated crops as significant energy parameters during combustion.
Water, as a non-combustible ingredient of the fuel, has a direct effect on the heating value of biomass due to the amount of heat spent on its evaporation (Francescato et al., 2008). The water content in the studied crops was around 5% for miscanthus and 10% for maize stalk.
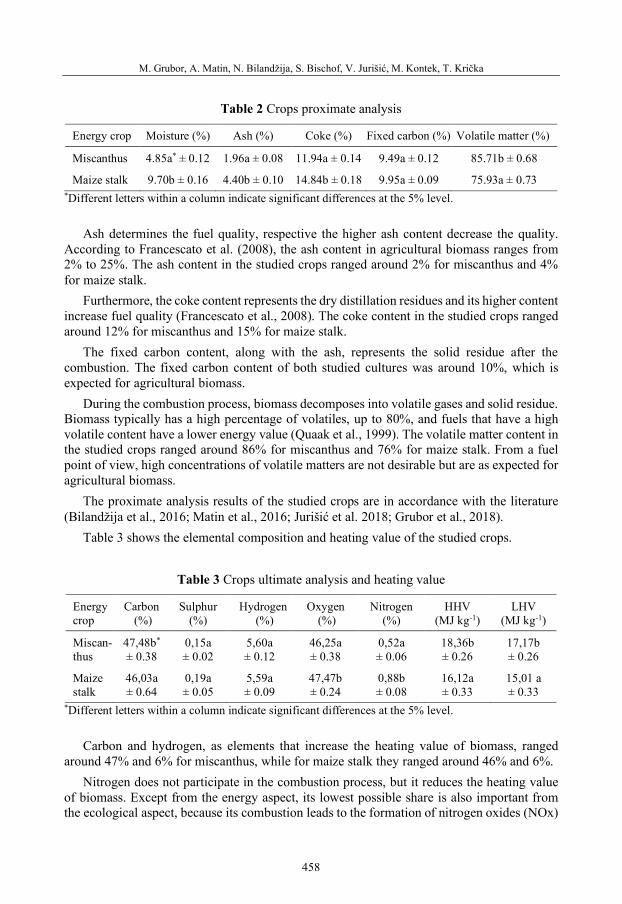
M. Grubor, A. Matin, N. Bilandžija, S. Bischof, V. Jurišić, M. Kontek, T. Krička
458
Table 2 Crops proximate analysis
Energy crop Moisture (%) Ash (%) Coke (%) Fixed carbon (%) Volatile matter (%)
Miscanthus 4.85a* ± 0.12 1.96a ± 0.08 11.94a ± 0.14 9.49a ± 0.12 85.71b ± 0.68
Maize stalk 9.70b ± 0.16 4.40b ± 0.10 14.84b ± 0.18 9.95a ± 0.09 75.93a ± 0.73 *Different letters within a column indicate significant differences at the 5% level.
Ash determines the fuel quality, respective the higher ash content decrease the quality.
According to Francescato et al. (2008), the ash content in agricultural biomass ranges from 2% to 25%. The ash content in the studied crops ranged around 2% for miscanthus and 4% for maize stalk.
Furthermore, the coke content represents the dry distillation residues and its higher content increase fuel quality (Francescato et al., 2008). The coke content in the studied crops ranged around 12% for miscanthus and 15% for maize stalk.
The fixed carbon content, along with the ash, represents the solid residue after the combustion. The fixed carbon content of both studied cultures was around 10%, which is expected for agricultural biomass.
During the combustion process, biomass decomposes into volatile gases and solid residue. Biomass typically has a high percentage of volatiles, up to 80%, and fuels that have a high volatile content have a lower energy value (Quaak et al., 1999). The volatile matter content in the studied crops ranged around 86% for miscanthus and 76% for maize stalk. From a fuel point of view, high concentrations of volatile matters are not desirable but are as expected for agricultural biomass.
The proximate analysis results of the studied crops are in accordance with the literature (Bilandžija et al., 2016; Matin et al., 2016; Jurišić et al. 2018; Grubor et al., 2018).
Table 3 shows the elemental composition and heating value of the studied crops.
Table 3 Crops ultimate analysis and heating value
Energy crop
Carbon (%)
Sulphur (%)
Hydrogen (%)
Oxygen (%)
Nitrogen (%)
HHV (MJ kg-1)
LHV (MJ kg-1)
Miscan-thus
47,48b* ± 0.38
0,15a ± 0.02
5,60a ± 0.12
46,25a ± 0.38
0,52a ± 0.06
18,36b ± 0.26
17,17b ± 0.26
Maize stalk
46,03a ± 0.64
0,19a ± 0.05
5,59a ± 0.09
47,47b ± 0.24
0,88b ± 0.08
16,12a ± 0.33
15,01 a ± 0.33
*Different letters within a column indicate significant differences at the 5% level. Carbon and hydrogen, as elements that increase the heating value of biomass, ranged
around 47% and 6% for miscanthus, while for maize stalk they ranged around 46% and 6%. Nitrogen does not participate in the combustion process, but it reduces the heating value
of biomass. Except from the energy aspect, its lowest possible share is also important from the ecological aspect, because its combustion leads to the formation of nitrogen oxides (NOx)

Miscanthus and maize stalk as source for green energy production
459
(Van Loo and Koppejan, 2008; Vassilev et al., 2010). In the studied crops nitrogen content was around 0.5% for miscanthus, while it was around 0.9% for maize stalk.
The content of sulphur, a harmful element in the biomass ranged from 0.15% for miscanthus and 0.19% for maize stalk.
Oxygen binds carbon and hydrogen to itself and thus reduces the heating value of biomass, and in miscanthus it was about 46%, while in maize stalk it was about 47%.
The ultimate analysis results of the studied crops are in accordance with the literature (Krička et al., 2012; Bilandžija et al., 2016; Jurišić et al. 2018; Grubor et al., 2018).
All of the above parameters have an impact on the biomass heating value as a measure for determining the fuel energy content (Jenkins et al., 1998) and in miscanthus it was around 17 MJ kg-1, while in maize stalk it was around 15 MJ kg-1. which is in accordance with the literature (Bilandžija et al., 2012; Bilandžija et al., 2016; Jurišić et al. 2018; Grubor et al., 2018).
CONCLUSION
The analyzed biomass of Mischantus x giganteus and maize stalk showed quality properties from the direct combustion aspect, i.e. for the production of green energy. Namely, the ash that determines the quality of the fuel, and the fuel with a higher ash content is of poorer quality, was relatively low in the investigated crops in relation to other agricultural biomass. The elemental composition also shows good energy properties. Namely, carbon and hydrogen, as elements that increase the biomass heating value, occur in a high percentage and the amount of sulphur as a source of harmful elements was relatively low. The ratio of cellulose, hemicellulose and lignin indicates an increased content of cellulose and hemicellulose, but also the quality content of lignin, which results in the proposal that the studied crops can be used for the solid as well as liquid biofuels production. Also, the lower heating value in maize stalk was around 15 MJ kg-1, which is within the expected range for agricultural biomass, while in miscanthus it was relatively high around 17 MJ kg-1, and overall the miscanthus biomass proved to be a slightly better raw material for direct combustion process.
ACKNOWLEDGMENTS
This research was funded by the European Regional Development Fund, under the Operational programme competitiveness and cohesion 2014-2020, via K.K.01.1.1.04.0091 project ‘’Design of Advanced Biocomposites from Renewable Energy Sources – BIOCOMPOSITES’’ and KK.05.1.1.02.0016 project “Production of food, biocomposites and biofuels from cereals in a circular bioeconomy”.
REFERENCES
Álvarez-Álvarez, P., Pizarro, C., Barrio-Anta, M., Cámara-Obregón, A., Bueno, J. L. M., Álvarez, A., Burslem, D. F. (2018). Evaluation of tree species for biomass energy production in Northwest Spain. Forests, 9(4), 160.

M. Grubor, A. Matin, N. Bilandžija, S. Bischof, V. Jurišić, M. Kontek, T. Krička
460
Antonović, A., Krička, T., Matin, A., Jurišić, V., Bilandžija, N., Voća, N., Stanešić, J. (2016). Biochar quantification and its properties in relation to the raw material. In: Pospišil, M; Vnučec, I. (eds.) Proceedings of 51st Croatian and 11th International Symposium on Agriculture, Opatija, Croatia, 445-449.
Bilandzija, N., Voca, N., Kricka, T., Matin, A., Jurisic, V. (2012). Energy potential of fruit tree pruned biomass in Croatia. Spanish Journal of Agricultural Research, (2), 292-298.
Bilandžija, N., Jurišić, V., Voća, N., Leto, J., Matin, A., Antonović, A., Krička, T. (2016). Lignocelulozni sastav trave Miscanthus x giganteus u odnosu na različite tehnološke i agroekološke uvjete. In: Pospišil, M; Vnučec, I. (eds.) Proceedings of 51st Croatian and 11th International Symposium on Agriculture, Opatija, Croatia, 450-455.
Bilandžija, N., Krička, T., Matin, A., Leto, J., Grubor, M. (2018). Effect of harvest season on the fuel properties of Sida hermaphrodita (L.) Rusby biomass as solid biofuel. Energies, 11(12), 3398.
Demirbas, A. (2017). Higher heating values of lignin types from wood and non-wood lignocellulosic biomasses. Energy Sources, Part A: Recovery, Utilization, and Environmental Effects, 39(6), 592-598.
Francescato, V., Antonini, E., Zuccoli Bergomi, L., Metschina, C., Schnedl, C., Krajnc, N., Stranieri, S. (2008). Priručnik o gorivima iz drvne biomase. Regionalna energetska agencija Sjeverozapadne Hrvatske, (eds.) V. Šegon, Zagreb, Hrvatska, 1-84.
Grubor, M., Krička, T., Bilandžija, N., Jurišić, V., Voća, N., Antonović, A., Matin, A. (2018). Kukuruzovina kao energent za proizvodnju krutog goriva. In: Rozman, V.; Antunović, Z. (eds.) Proceedings of 53. Croatian and 13. International Symposium on Agriculture, Vodice, Croatia, 275-279.
Hodgson, E. M., Lister, S. J., Bridgwater, A. V., Clifton-Brown, J., Donnison, I. S. (2010). Genotypic and environmentally derived variation in the cell wall composition of Miscanthus in relation to its use as a biomass feedstock. Biomass and Bioenergy, 34(5), 652-660.
Jenkins, B., Baxter, L. L., Miles Jr, T. R., Miles, T. R. (1998). Combustion properties of biomass. Fuel processing technology, 54(1-3), 17-46.
Johnson, J. M. F., Franzluebbers, A. J., Weyers, S. L., Reicosky, D. C. (2007). Agricultural opportunities to mitigate greenhouse gas emissions. Environmental pollution, 150(1), 107-124.
Jurišić, V., Krička, T., Matin, A., Grubor, M., Antonović, A., Voća, N., Bilandžija, N. (2018). Mogućnost korištenja trave Miscanthus uzgojene na tlima lošije kvalitete kao čvrstog biogoriva. In: Rozman, V.; Antunović, Z. (eds.) Proceedings of 53. Croatian and 13. International Symposium on Agriculture, Vodice, Croatia, 294-298.
Koppejan, J., Van Loo, S. (Eds.). (2012). The handbook of biomass combustion and co-firing. Routledge. London, UK
Kricka, T., Bilandzija, N., Jurisic, V., Voca, N., Matin, A. (2012). Energy analysis of main residual biomass in Croatia. African Journal of Agricultural Research, 7(48), 6383-6388.
Lewandowski, I., Clifton‐Brown, J. C., Andersson, B., Basch, G., Christian, D. G., Jørgensen, U., Teixeira, F. (2003). Environment and harvest time affects the combustion qualities of Miscanthus genotypes. Agronomy Journal, 95(5), 1274-1280.
Matin, A., Krička, T., Jurišić, V., Voća, N., Antonović, A., Bilandžija, N., Grubor, M., Miličević, I. (2016). Iskoristivost biomase kukuruza za proizvodnju toplinske energije. In: Pospišil, M; Vnučec, I. (eds.) Proceedings of 51st Croatian and 11th International Symposium on Agriculture, Opatija, Croatia, 489-492.
Mladenović, M., Paprika, M., Marinković, A. (2018). Denitrification techniques for biomass combustion. Renewable and Sustainable Energy Reviews, 82, 3350-3364.
Quaak, P., Knoef, H., & Stassen, H. (1999). Energy from biomass: a review of combustion and gasification technologies. The International Bank for Reconstruction, SAD.

Miscanthus and maize stalk as source for green energy production
461
Tanger, P., Field, J. L., Jahn, C. E., DeFoort, M. W., Leach, J. E. (2013). Biomass for thermochemical conversion: targets and challenges. Frontiers in plant science, 4, 218.
Tao, G., Lestander, T. A., Geladi, P., Xiong, S. (2012). Biomass properties in association with plant species and assortments I: A synthesis based on literature data of energy properties. Renewable and Sustainable Energy Reviews, 16(5), 3481-3506.
Vassilev, S. V., Baxter, D., Andersen, L. K., Vassileva, C. G. (2010). An overview of the chemical composition of biomass. Fuel, 89(5), 913-933.
Zhou, A., Thomson, E. (2009). The development of biofuels in Asia. Applied Energy, 86, S11-S20.


48th Symposium "Actual Tasks on Agricultural Engineering", Zagreb, Croatia, 2021
463
ENERGY UTILISATION OF BIOFIBRE PRODUCTION RESIDUES – CIRCULAR ECONOMY APPROACH
Anamarija GUDELJ VELAGA1*, Nikola BILANDŽIJA1, Mateja GRUBOR1, Zorana KOVAČEVIĆ2, Tajana KRIČKA1
*E-mail of corresponding author: [email protected] of Agriculture University of Zagreb, Svetošimunska cesta 25, Zagreb 10 000
2Faculty of textile technology University of Zagreb, Prilaz Barna Filipovića 28, Zagreb 10 000
ABSTRACT
The circular economy treats waste as a new resource, and existing products are tried to be left in circulation for as long as possible or returned to the market in some other form after the reuse of production raw materials. In modern time the textile industry is an enormous polluter. More than two-thirds of waste goes to landfills which is a big problem due to the release of greenhouse gases and pollution of land and groundwater. Textile waste is divided into industrial and post-consumer waste. This paper is oriented to industrial waste of textile biocomposites production and its disposal by incineration, thinking about the application of the principles of circular economy and sustainable development. Biocomposites are materials made up of natural fibres (a component of biological origin) and a matrix (of biological or non-biological origin). In the textile industry, there is a growing trend of biocomposites production for the different industries due to its properties. The use of biocomposites in the industry comes to the fore because biocomposites are lightweight, solid and biodegradable. The application of biocomposites in industry creates a new type of waste consisting of various polymers and natural fibres. The option for disposing of this type of waste is incineration which leads to the sustainable energy production, based on the circular economy approach.
Keywords: biocomposites, natural fibres, industry residues, sustainable development
INTRODUCTION
The circular economy considers the impact of resource consumption and waste on the environment. This leads to the creation of alternative closed loops in which resources are in the circulation of production and consumption. The goals of the circular economy are to optimize resource use and reduce pollution as much as possible. The circular economy differs
48. ACTUALTASKS ONAGRICULTURAL ENGINEERING
Review paper

A. Gudelj Velaga, N. Bilandžija, M. Grubor, Z. Kovačević, T. Krička
464
from the linear one in that the linear economy is based on the principle: extract, produce, consume and dispose without considering the impact on the environment, i.e., it is based exclusively on economic goals.
However, the use of raw materials in a circular economy is based on reducing their use and optimizing the use of by-products and waste to reduce resource utilization and the impact of production and consumption on environmental pollution (Pinjing et al. 2013). In principle, the main difference between a linear and a circular economy is adherence to the principles of sustainable development. The circular economy can be considered as a sustainable economic system in which economic growth is separated from the use of resources, by reducing and recirculating natural resources (Corona et al. 2019). As shown in figure 1 circular economy is based on using produced materials as much as possible and waste is generated only if there is no possibility of recycling.
Figure 1 Principles of circular economy Sustainable development can be defined as “development that meets the needs of the
present without compromising the ability of future generations to meet their own needs.” (World Commission on Environment and Development, 1987; Sauve et al. 2015). Applying the principles of circular economy, resources (production waste) are kept in circulation as much as possible, in order to maintain value or by conversion from waste to energy (Shirvanimoghaddam 2020). By reusing waste, the utilization of fossil fuels is reduced and thus a valuable resource is preserved, the impact of pollution is reduced because landfill waste is used for energy. Basically, some type of waste could be considered as a renewable source of energy that can be used to produce heat or electricity (Merrild et al. 2012; Sansaniwal et al. 2017; Nunes et al. 2018; Tursi 2019; Kpalo et al. 2020).
European Commissions has developed The European Green Deal which is an integral part of the Commission's strategy for implementing the United Nations Program and the Sustainable Development Goals. It is a new growth strategy that seeks to transform the EU into a justice and prosperous society with a modern, resource-efficient and competitive economy in which there will be no net greenhouse gas emissions in 2050 and in which economic growth is not linked to resource use. In addition, it pays attention to the protection,
raw materials
waste

Energy utilisation of biofibre production residues – circular economy approach
465
preservation and increase of the EU's natural capital and to the protection of the health and well-being of citizens from environmental risks and the impact of the environment on them. Achieving a climate-neutral and circular economy requires the full mobilization of industry. It takes 25 years, or one generation, for the industrial sector and all value chains to transform.
The Circular Economy Action Plan from New Green Deal will include a “sustainable products” policy to support the circular design of all products based on a common methodology and principles. Priority is to reduce and reuse materials before recycling. Although the Circular Economy Action Plan will serve for the transition of all sectors, action will focus in particular on resource-intensive sectors, such as the textile sector, construction and the electronics and plastics sector. It will also develop a regulatory framework for biodegradable and biological plastics and implement measures related to single-use plastics (New Green Deal, 2019).
In last few decades textile consumption has doubled from approximately 7 to 13 kg per person annually. More than two-thirds of this waste goes to landfill, and only 15% is recycled (Rada et al. 2018). Textile industry waste can be divided in two categories, first is industrial waste and the second is post-consumer waste (Echeverria et al. 2019). Industrial waste represents the waste generated during production process (for clothing, biocomposites or industrial purpose) and it represents significant source of secondary raw materials that are not used and can be put on market again. Post-consumer waste is fibre products that are discarded after their lifetime/use (Rada et al. 2018; Wang 2010). Waste management in European union is defined by Directive 2008/98/EC on waste in which is required that the waste be managed without endangering human health and harming the environment, especially water, air, soil, plants or animals and it is applicable in waste management hierarchy: prevention, preparing for re-use, recycling, recovery and disposal. Incineration in this case finds its application, it is a practical treatment that is widely used for the disposal of textile waste, for example a mixture of cotton and polyester has a good calorific value, i.e., HHV of 16MJ / kg (Ryu et al. 2007).
EXTRACTION METHODS FOR NATURAL FIBRES
All plant fibres are qualified separately from the part of the plant from which the fibres are extracted. Accordingly, the fibres are divided into bast / bark / stem fibres, leaf, fruit or seed fibres. The main goal of processing is to obtain the maximum amount of fibre of the highest possible quality (Zimniewska et al. 2013).
The process of obtaining fibres depends on the used method: physical mechanical, biological or chemical. Method that will be used for obtaining fibres depends on the type of plant. Therefore, some of the most commonly used procedures are: decortication, splitting using knife, various retting processes, alkali treatments, manual extraction and microwave treatment (Satyanarayana et al. 2009, Kovačević 2019). The oldest way of fibre extraction is manual extraction and it is considered as a physical method. Microwave treatment is also part of physical method for fibre extraction. This method was developed by group of scientists from Department of Textile Chemistry and Ecology, Faculty of Textile Technology in Zagreb. The method is based on low concentrated sodium hydroxide mixed with fibrous material and microwaved using Teflon reactor (Kovačević et al. 2015). Decortication as a part of mechanical method is a procedure that uses a decorticator machine to remove the bark. Splitting using knife also falls in the mechanical method and is famous for obtaining piassava and coir fibres. Retting which is microbial process for obtaining fibres, especially flax fibres,

A. Gudelj Velaga, N. Bilandžija, M. Grubor, Z. Kovačević, T. Krička
466
is considered as a biological method which relies on bacteria and moisture to break down plant parts around the fibres. There are several types of retting: dew, water and enzymatic retting. (Kumar and Sekaran 2014). The most used chemical methods are alkali and acid treatments which include alkaline extraction, bleaching and acid hydrolysis. During these methods most of the lignin and hemicellulose bonds are removed (Abraham et al. 2011; Zakikhani et al. 2014).
In recent years, there is a greater demand for the production of fibres to be used in the composite industry than for fibres to be used in the fashion technology. Production of fibres for composites (biocomposites) purposes sometimes requires usage of different extraction methods if aforementioned are not useful for a specific application. The kraft pulping process is a chemical method used for conversion of wood and non-wood plants to cellulose pulp often used as reinforcement in the composite materials. Cellulose pulp means relatively short and finer fibres compared to the fibres obtained by already described extraction methods, although pulp from non wood plants have longer and stronger fibres with lower lignin content compared to wood pulp. The kraft pulping process is carried out by mixing hot water, sodium sulfide (Na2S) and sodium hydroxide (NaOH). This mixture divides cellulose from hemicellulose and lignin. In this type of extraction, one of the residues is black liquor that is interesting for energy utilisation of production residues (van Dam 2008).
BIOCOMPOSITE PRODUCTION – NATURAL FIBRES
Composites are materials consisting of two (or more) phases, a solid reinforcement phase and a matrix. These two separate components when combined, i.e. when the solid phase is incorporated into the matrix, form a new material. The advantage of such joining of materials is manifested in the fact that high strength and stiffness of the fibres can be used to transfer the load (Fowler et al. 2006).
Biocomposites are composite materials whose phases (one or more) are derived from biological origin. This includes natural fibres from different non wood plants, wood, paper, food and energy crops. These fibres are beneficial because of it is low cost, lightweight, strength and stiffness, so the properties of composites are measured by the properties of the fibres (Fowler et al. 2006; Muthuraj et al. 2017A). Energy crops fibres are especially beneficial because of low cost, high yield, low input and short vegetation time. For example, miscanthus fibres have strong reinforcing effect, switchgrass have similar tensile strength as other natural fibres, hemp and china reed have lower cost and lower density, nevertheless energy crops end of life incineration results in energy and carbon credits (Joshi et al. 2004; Sashoo et al. 2013; Muthuraj et al. 2017B). A study conducted on the life cycle assessment of transport pallets of polypropylene (PP) and china reed fibres compared to glass fibres shows that PP / china reed fibre pallets have an environmental advantage even though they have a shorter lifespan, 3 versus 5 years from glass fibre pallets (Corbière-Nicollier et al. 2001). It is possible to use silvergrass and china reed as a substitute for wood production of plywood because they consist of cellulose, hemicellulose, lignin and extractives so their physical-chemical characteristics are similar to those of wood (Liao et al. 2012). Especially the application of biocomposites is found in the automotive, construction, packaging and furniture industries. Currently, the main markets for biocomposites are the construction and automotive sectors. Biocomposites in comparison with glass fibre composites shows that the structure of natural fibres acts better to provide insulation from noise and the effects of temperature. The

Energy utilisation of biofibre production residues – circular economy approach
467
density of natural fibres is lower compared to glass, which reduces the weight of the produced biocomposite. Also, biocomposites are used due to resistance to mechanical, electronic and thermal insulation, resistance to fire and wear, and primarily due to environmental impact (possibility of decomposition and recycling) (Riedel & Nickel 1999; Bhattacharyya & Jayaraman 2003; Hautala et al. 2004; Fowler et al. 2006; Koronis et al. 2013; Muthuraj et al. 2017A; Nagalakshmaiah et al. 2019). Replacing glass fibres with natural fibres leads to the reduction in overall car fuel consumption due to their low density and higher volume fraction which results in lightweight materials. Parts of cars made from biocomposites are panels, shelves, pedals and various external covers. The application of biocomposites in this industry is interesting because the strength and properties of the materials meet the requirements such as biodegradability, renewability and non-toxicity to the environment (Nagalakshmaiah et al. 2019). The advantages of using natural fibres in the production of composites are numerous: plant fibres are a renewable raw material, their production has less impact on the environment than the production of glass fibres, CO2 emissions after lifetime is neutral compared to the amount collected during growth. The technical advantages of using natural fibres are strength, stiffness and low density. Natural fibres have higher fibre content for the same performance, high fibre volume reduces the volume of use of the base polymer matrix which reduces the weight of the newly formed component and reduces the amount of use of the polymer that is a pollutant (Bledzki & Gassan 1999; Joshi et al. 2004).
Natural fibres used in composites with biodegradable polymer are the best option as an environmentally friendly material. However, at the end of use natural fibres (as opposed to glass) can be incinerated. The energy value of natural fibres in china reed fibres is 14 MJ/kg, which means the energy efficiency of natural fibres at the end of their life cycle is possible (Bledzki & Gassan 1999; Joshi et al. 2004).
BIOCOMPOSITES WASTE PROPERTIES AS SOLID BIOFUEL
Biofuels are fuels obtained directly or indirectly from biomass and they can be divided into three categories: solid, liquid and gaseous. Solid biofuel valorisation is based on proximate and ultimate analyses. Proximate analysis is important for understanding the combustion of biomass, and consist of the percentage of moisture content, ash, volatile matter (VM) and fixed carbon (FC) (Saidur et al. 2011). Higher heating value or calorific value is energy available in feedstock i.e., represent energy content of biomass in dry basis (Saidur 2011; Tanger 2013; Hartmann 2017). Ultimate analysis is used to study the properties of biomass, the analysis determines the ratios and percentages of elements such as: nitrogen, sulphur, chlorine, carbon, hydrogen and oxygen.
Moisture content is a measure for biomass amount of water and is expressed as a percentage (%) of the mass on a wet basis. The high moisture content affects the energy of fresh biomass because the heat released during combustion is consumed by the evaporation of moisture, therefore the preferred moisture content in the biomass is 5 - 15% (Bridgwater et al., 2002; Tanger et al. 2013). Inorganic residue that is produced by combustion of biomass fuel is called the ash (McKendry 2002; Hartman 2012). Ash content is inert material, and it reduces heating value of the material because it does not contribute to the release of total heat (Avelar et al. 2016). It lowers the value because the melting point of dissolved ash can be low and therefore causes problems with ignition and combustion (Saidur et al. 2011). VM content is mass loss as gaseous product (not including moisture) by heating. High content of VM can
A. Gudelj Velaga, N. Bilandžija, M. Grubor, Z. Kovačević, T. Krička
468
improve ignition and burning process and in that way, it affects whole combustion process (McKendry 2002; Tanger et al. 2013; Avelar et al. 2016). FC content is mass that remains after releases of volatiles, not including ash and moisture content (McKendry 2002). High values of volatile matter and fixed carbon have positive impact of overall heating value of any biomass (Saidur et al. 2011).
The replacement of polymers in more sustainable materials of biological origin as biopolymers is a growing trend in various industries such as automotive (de Moura et al. 2017), packaging (Coles & Meredith 2014) and construction (Pacheco-Torgal 2016). The result of switching to biopolymers is the creation of a new waste stream, which could be composted (but not a good option to cover demand). An option that would cover the demand for waste disposal is incineration (Al-Salem et al. 2009; Moliner et al. 2018).
Molnier et al. (2018) studied energy valorisation of biocomposites where sisal fibres were used as natural fibres with virgin poly-lactic acid (PLA). Fibres were designated to biocomposites in two groups. First group was in ratios of 10%, 20% and 30% of fibres in biocomposites, and other group with same ratios but with addition of coupling agent. Proximate analysis (ash content, volatile matter and fixed carbon) and calorific value were made and compared between PLA and group 1 and group 2 (with coupling agent). Ash content between two groups varied between 1,9 to 6%, the lowest value was found at group 2 that had 10% sisal fibres with coupling agent and highest values were found at both groups that had mixture of 30% fibres with PLA, while PLA had only 0,6% of ash content. The volatile matter did not deviate from each other with values ranging between 91,2 to 95,6%, while the control group had 98,2% of volatile matter. Values of fixed carbon differed a bit, the lowest value of 1,4% is at group 1 in 10% fibres mixture, and the highest value is 2,8% in group 2 30% with coupling agent, while PLA value was 1,2%. For all samples a calorific value was made, HHV did not deviate much from each other the lowest value was 15,06 MJ/kg and the highest 15,77 MJ/kg while PLA value was 15,73 MJ/kg.
In the research by Kovačević et al. (2019), stem residues from Spartium junceum L. (SJL) fibre production were studied for obtaining the second generation of biofuels. SJL fibres were obtained by two methods, the first is the saltwater extraction method and the second extraction method is by microwave maceration. Proximate and ultimate properties of biomass and calorific value were determined for the analysis of production residues. Moisture content in biomass is recommended to be kept below 10 to 15%, and in samples obtained by saltwater extraction moisture content is 7.46%, and in the sample obtained by microwave maceration is 6.53%. Ash content between the two samples does not have a significant difference ranging from 4.37 to 4.77%, which is in the expected range because Spartium junceum L. belongs to agricultural biomass, which otherwise has a higher percentage of ash due to chemical composition and mineral content. The values of fixed carbon in saltwater extraction are 10.47%, and the value of the sample obtained by microwave maceration is 13.22%. Calorific values were obtained using the Higher heating value HHV which is 17.23 MJ/kg for the sample extracted with salt water and 18.6 MJ/kg for the sample obtained by microwave maceration. This indicates a satisfactory biomass that can be used to obtain solid biofuel.
Considering that nowadays we are facing with frequent use of cellulose pulp as a reinforcement in biocomposite materials, it is important to pay attention at the waste liquid that remains after kraft pulping process in which lignin is separated from cellulose fibres in a digester system with NaOH and Na2S. This waste liquid that remains after rinsing (removing the cellulose pulp), is called black liquor.Black liquor is a mixture of organic and inorganic
Energy utilisation of biofibre production residues – circular economy approach
469
materials with high amount of total dissolved solids. Its chemical composition depends on the type of raw material used for kraft pulping (the process is applied to the production of wood pulp and non-wood pulp such as: bagasse, straw, grass and bamboo) (Huang et al. 2007; Cardos et al. 2009). Black liquor is a complex aqueous solution containing organic substances of plant origin (lignin, polysaccharides and resinous compounds) and inorganic compounds (soluble salt ions). Since black liquor calorific value varies from 14 to 16 MJ/kg HHV it can be used as industrial fuel which is especially the case in a paper producing countries. Incineration of black liquor is combined with the combustion of bark and other wood fuels but first the excess water needs to be removed by drying techniques (Demirbas 2002; Cardos et al. 2009). In most kraft mills black liquor is evaporated from 15 – 18 % to 55 -85% solids content so it can be burned in the recovery boiler to maximize the heat recovery (Bonhivers, J-C. et al., 2013; Bajpai, P., 2018)
CONCLUSION
Disposal of textile industry residues currently is not environmentally friendly, and it does not follow principles of circular economy and sustainable development. By applying these principles, it is possible to create more sustainable disposal solutions. Biocomposites as new eco-friendly materials create a new type of waste that is biodegradable and can be used for energy production via incineration process. Relying on the results obtained by the research of proximate analysis and calorific values of the investigated material, it can be concluded that residues after fibre production can be used for solid biofuel production. Such a way of exploiting raw materials to produce biocomposites and then exploiting the remains of raw materials to produce solid fuels corresponds to the definition and practice of circular economy and sustainable development. The possibility of use energy crops biomass in the production of biocomposites of lower weight, improved strength and resistance to burning makes these cultures interesting for further research and application, especially because of their ability to recycle and utilize production residues.
ACKNOWLEDGMENT
This research was funded by the European Regional Development Fund, under the Operational programme competitiveness and cohesion 2014-2020, via K.K.01.1.1.04.0091 project ‘’Design of Advanced Biocomposites from Renewable Energy Sources – BIOCOMPOSITES’’ and by the Croatian Science Foundation within the project "Career Development Project for Young Researchers - Training of New Doctors of Science" via European Social Fund KK.01.1.1.04.
REFERENCES
Abraham, E., Deepa, B., Pothan, L. A., Jacob, M., Thomas, S., Cvelbar, U., & Anandjiwala, R. (2011). Extraction of nanocellulose fibrils from lignocellulosic fibres: A novel approach. Carbohydrate Polymers, 86(4), 1468-1475.
Avelar, N. V., Rezende, A. A. P., Carneiro, A. D. C. O., Silva, C. M. (2016). Evaluation of briquettes made from textile industry solid waste. Renewable Energy, 91, 417-424.

A. Gudelj Velaga, N. Bilandžija, M. Grubor, Z. Kovačević, T. Krička
470
Bledzki, A. K., Gassan, J. (1999). Composites reinforced with cellulose based fibres. Progress in polymer science, 24(2), 221-274.
Bhattacharyya, D., Jayaraman, K. (2003). Manufacturing and evaluation of wood fibre–waste plastic composite sheets. Polymers and Polymers Composites, 11(6), 433–440.
Bridgwater, A. V., Toft, A. J., Brammer, J. G. (2002). A technoeconomic comparison of power production by biomass fast pyrolysis with gasification and combustion. Renew. Sustain. Energy Rev. 6, 181–246.
Cardoso, M., de Oliveira, É. D., Passos, M. L. (2009). Chemical composition and physical properties of black liquors and their effects on liquor recovery operation in Brazilian pulp mills. Fuel, 88(4), 756-763.
Communication from the Commission to the European Parliament, the European Council, the Council, the European Economic and Social Committee and the Committee of the Regions. European New Green Deal, Brussels 12/11/2019
Corona, B., Shen, L., Reike, D., Carreón, J. R., Worrell, E. (2019). Towards sustainable development through the circular economy—A review and critical assessment on current circularity metrics. Resources, Conservation and Recycling, 151, 104498.
Demirbaş, A. (2002). Pyrolysis and steam gasification processes of black liquor. Energy conversion and management, 43(7), 877-884.
Echeverria, C. A., Handoko, W., Pahlevani, F., Sahajwalla, V. (2019). Cascading use of textile waste for the advancement of fibre reinforced composites for building applications. Journal of Cleaner Production, 208, 1524-1536.
European Commission Directive 2008/98/EC on waste (Waste Framework Directive) - Environment - European Commission (europa.eu)
Fowler, P. A., Hughes, J. M., Elias, R. M. (2006). Biocomposites: technology, environmental credentials and market forces. Journal of the Science of Food and Agriculture, 86(12), 1781-1789.
Guha, A. K., Rahman, O., Das, S., Hossain, M. S. (2015). Characterization and Composting of Textile Sludge. Resour Environ, 5, 53-58.
Hautala, M., Pasila, A., Pirilä, J. (2004). Use of hemp and flax in composite manufacture: a search for new production methods. Composites Part A: Applied Science and Manufacturing, 35(1), 11-16.
Huang, G., Shi, J. X., Langrish, T. A. (2007). A new pulping process for wheat straw to reduce problems with the discharge of black liquor. Bioresource technology, 98(15), 2829-2835.
Iqbal, S. A., Mahmud, I., Quader, A. K. M. A. (2014). Textile sludge management by incineration technique. Procedia Engineering, 90, 686-691.
Joshi, S. V., Drzal, L. T., Mohanty, A. K., Arora S. (2004). Are natural fiber composites environmentally superior to glass fiber reinforced composites? Composites Part A: Applied science and manufacturing, 35(3), 371-376.
Koronis, G., Silva, A., Fontul, M. (2013). Green composites: a review of adequate materials for automotive applications. Composites Part B: Engineering 44(1), 120:127.
Kovacevic, Z., Bischof, S., Fan, M. (2015). The influence of Spartium junceum L. fibres modified with montmorrilonite nanoclay on the thermal properties of PLA biocomposites. Composites Part B: Engineering, 78, 122-130.
Kovačević, Z. (2019). Development of Advanced Polylactide Nanobiocomposite Reinforced With Spartium junceum L. Fibres (Doctoral dissertation, University of Zagreb. Faculty of Textile Technology.).
Kovačević, Z., Jurišić, V., Grubor, M., Matin, A., Krička, T., Bischof, S. (2019). Spanish broom (Spartium Junceum L.)–feedstock for bioplastic and bioenergy industry. The holistic approach to environment, 9(3), 44-52.

Energy utilisation of biofibre production residues – circular economy approach
471
Kpalo, S. Y., Zainuddin, M. F., Manaf, L. A., Roslan, A. M. (2020). A Review of Technical and Economic Aspects of Biomass Briquetting. Sustainability, 12(11), 4609.
Kumar, K. P., Sekaran, A. S. J. (2014). Some natural fibers used in polymer composites and their extraction processes: A review. Journal of Reinforced Plastics and Composites, 33(20), 1879-1892.
McKendry, P. (2002). Energy production from biomass (part 1): overview of biomass. Bioresource technology 83(1), 37-46.
Merrild, H., Larsen, A.W., Christensen, T.H. (2012). Assessing recycling versus incineration of key materials in municipal waste: The importance of efficient energy recovery and transport distances. Waste Management 32(5), 1009–1018.
Meinander, K., Niemi, M., Hakola, J. S., Selin, J. F. (1997). Polylactides‐degradable polymers for fibres and films. In Macromolecular Symposia 123(1), 147-153. Basel: Hüthig & Wepf Verlag.
Moliner, C., Badia, J. D., Bosio, B., Arato, E., Teruel-Juanes, R., Kittikorn, T., Ribes-Greus, A. (2018). Thermal kinetics for the energy valorisation of polylactide/sisal biocomposites. Thermochimica Acta, 670, 169-177.
Muthuraj, R., Misra, M., Mohanty, A. K. (2017). A. Biocomposite consisting of miscanthus fiber and biodegradable binary blend matrix: compatibilization and performance evaluation. RSC advances 7(44), 27538-27548.
Muthuraj, R., Misra, M., Mohanty, A. K. (2017) B. Reactive compatibilization and performance evaluation of miscanthus biofiber reinforced poly(hydroxybutyrate-co-hydroxyvalerate) biocomposites. Journal of Applied Polymer Science 134(21).
Nagalakshmaiah, M., Afrin, S., Malladi, R. P., Elkoun, S., Robert, M., Ansari, M. A., Karim, Z. (2019). Biocomposites: present trends and challenges for the future. In Green Composites for Automotive Applications, 197-215. Woodhead Publishing.
Nunes, L. J., Godina, R., Matias, J. C., Catalão, J. P. (2018). Economic and environmental benefits of using textile waste for the production of thermal energy. Journal of Cleaner Production, 171, 1353-1360.
Oksman, K., Skrifvars, M., Selin, J. F. (2003). Natural fibres as reinforcement in polylactic acid (PLA) composites. Composites science and technology, 63(9), 1317-1324.
Parparita, E., Uddin, M. A., Watanabe, T., Kato, Y., Yanik, J., Vasile, C. (2015). Gas production by steam gasification of polypropylene/biomass waste composites in a dual-bed reactor. Journal of Material Cycles and Waste Management, 17(4), 756-768.
Pinjing, H., Fan, L., Hua, Z., Liming, S. (2013). Recent Developments in the Area of Waste as a Resource, With Particular Reference to the Circular Economy as a Guiding Principle, Waste as a Resource. The Royal Society of Chemistry, London, UK144–161.
Rada, E. C., Ragazzi, M., Torretta, V., Castagna, G., Adami, L., Cioca, L. I. (2018). Circular economy and waste to energy. In AIP Conference Proceedings (Vol. 1968, No. 1, p. 030050). AIP Publishing LLC.
Riedel, U., Nickel, J. (1999). Natural fibre-reinforced biopolymers as construction materials: new discoveries. Die Angewandte Makromolekulare Chemie, 272(1), 34–40.
Ryu, C., Phan, A.N., Sharifi, V.N., Swithenbank, J. (2007). Combustion of textile residues in a packed bed. Experimental thermal and fluid science, 31(8), 887-895.
Saidur, R., Abdelaziz, E. A., Demirbas, A., Hossain, M. S., Mekhilef, S. (2011). A review on biomass as a fuel for boilers. Renewable and sustainable energy reviews, 15(5), 2262-2289.
Sansaniwal, S.K., Pal, K., Rosen, M.A., Tyagi, S.K. (2017). Recent advances in the development of biomass gasification technology: A comprehensive review. Renewable and sustainable energy reviews, 72, 363-384.

A. Gudelj Velaga, N. Bilandžija, M. Grubor, Z. Kovačević, T. Krička
472
Sauvé, S., Bernard, S., Sloan, P. (2016). Environmental sciences, sustainable development and circular economy: Alternative concepts for trans-disciplinary research. Environmental Development, 17, 48-56.
Sahoo, S., Misra, M., Mohanty, A. K. (2013). Biocomposites From Switchgrass and Lignin Hybrid and Poly(butylene succinate) Bioplastic: Studies on Reactive Compatibilization and Performance Evaluation. Macromolecular Materials and Engineering, 299(2), 178–189.
Satyanarayana, K. G., Ramos, L. P., Wypych, F. (2009). Comparative study of Brazilian natural fibers and their composites with others. Natural fibre reinforced polymer composites, 473-522.
Shirvanimoghaddam, K., Motamed, B., Ramakrishna, S., Naebe, M. (2020). Death by waste: Fashion and textile circular economy case. Science of The Total Environment, 718, 137317.
Tanger, P., Field, J. L., Jahn, C. E., DeFoort, M. W., Leach, J. E. (2013). Biomass for thermochemical conversion: targets and challenges. Frontiers in plant science, 4, 218.
Tursi, A. (2019). A review on biomass: Importance, chemistry, classification, and conversion. Biofuel Research Journal, 6(2), 962–979.
Van Dam, J. E. (2008). Natural fibres and the environment: environmental benefits of natural fibre production and use. In Proceedings of the Symposium on Natural Fibres: Common fund for commodities, Rome, Italy, (pp. 3-17).
Valerini, D., Tammaro, L., Di Benedetto, F., Vigliotta, G., Capodieci, L., Terzi, R., Rizzo, A. (2018). Aluminum-doped zinc oxide coatings on polylactic acid films for antimicrobial food packaging. Thin Solid Films, 645, 187-192.
Zakikhani, P., Zahari, R., Sultan, M. T. H., & Majid, D. L. (2014). Bamboo fibre extraction and its reinforced polymer composite material. Int J Chem, Mater Sci Eng, 8, 54-7.
Zimniewska, M., Frydrych, I., Mankowski, J., Trywianska, W. (2013). Process and quality control in cultivating natural textile fibres. In Process Control in Textile Manufacturing (pp. 81-108). Woodhead Publishing.

48th Symposium "Actual Tasks on Agricultural Engineering", Zagreb, Croatia, 2021
473
AIRBORNE EMISSIONS FROM AGRICULTURAL BIOMASS COMBUSTION IN THE CITY OF NOVI SAD
Aleksandar NESTEROVIC*, Djordje DJATKOV, Miodrag VISKOVIC, Milan MARTINOV
*E-mail of corresponding author: [email protected] University of Novi Sad, Faculty of Technical Sciences, Department of Environmental Engineering,
Trg Dositeja Obradovica 6, Novi Sad, Serbia
ABSTRACT
The objective of the study was to determine airborne emissions from agricultural biomass used in residential sector and compare with those from other fuels used in the City of Novi Sad. Further objective was to compare emissions from residential sector with other relevant sectors. Three sizes of heating appliances for residential sector were distinguished: small (households), medium (agriculture) and big (district heating). Balance was performed for NOx, SOx, total suspended particles (TSP), particulate matter (PM10 and PM2.5) and black carbon (BC). Analyses were also made according to the fuel type, the source of emissions in residential sector (rural or urban zones), and type of source (residential sector, road transport and on field burning). Results showed that fossil fuels contribute to more than 75% of SOx and NOx total emissions, while PM largely originates from biomass use, whereof residential sector contributes to more than 90%. Emissions of TSP, PM10, PM2.5 and BC mostly originated from biomass, whereof 1/3 from agricultural one. NOx emissions in the highest share originated from road transport, over 78%. The highest share of SOx emissions was from coal combustion (over 74%), whereby agricultural biomass contributes to the largest share among biomasses (about 18%).
Keywords: air pollutants, agricultural biomass, fuel, combustion, City of Novi Sad
INTRODUCTION
Novi Sad is the second largest city in the Republic of Serbia and is the capital of the Autonomous Province of Vojvodina, a typical agricultural region located in the southern part of the Pannonian Plain. It consists of two municipalities: Novi Sad and Petrovaradin. The City population is about 351,000, which of 81% live in urban zones (Statistical Office of the Republic of Serbia, 2016; 2020).
48. ACTUAL TASKS ON AGRICULTURAL ENGINEERING
Original scientific paper

A. Nesterović, Đ. Đatkov, M. Višković, M. Martinov
474
Awareness on air quality has been raised in previous decade due to the growing number of studies and knowledge about the impact of air quality on human health (WHO, 2013a; 2013b). According to the Annual report on the air quality in the Republic of Serbia for 2019 (Knežević et al., 2020), in the City of Novi Sad, for a period of five years (2015 – 2019) is air mostly clean (I category), except in 2015 when the air quality was moderately polluted (II category). In 2019, air quality was of the III category, i.e. over-polluted air, due to concentrations that exceeded the limit value of suspended particles РМ10. For that reason, it is necessary to determine sources of airborne emissions, i.e. air pollutants, to define and implement measures for air quality improvement.
Airborne pollutants' emissions mainly derive from energy production and use, the combustion of fossil fuels and biomass (Belis et al., 2016). Coal combustion produces the largest share of sulphur oxides’ (SOx) emissions, while nitrogen oxides’ (NOx) emissions are associated with the combustion of petroleum products (IEA, 2016). Suspended particulate matter emissions are largely derived from the biomass combustion process in households (IEA, 2016). Household energy use in 2015 caused 55% of global emissions of suspended PM2.5 particles (19.3 Tg), 5% of all NOx emissions (5 Tg) as well as 7% of SOx emissions (6 Tg) (IEA, 2016). Annual SOx and NOx emissions in Serbia in 2017 amounted to 420,200 Mg and 147,640 Mg, respectively, and were mostly from the energy sector (CEIP, 2020). The same source states that annual emissions of PM10 and PM2.5 amounted to 52,810 Mg and 38,510 Mg, respectively, and that they mostly originated from individual combustion in households’ appliances (56% for PM10 and 75% for PM2.5) (CEIP, 2020).
Previous research of pollutants’ emissions referred to the balance for the whole Serbia, conducted by the Serbian Environmental Protection Agency (SEPA), were submitted in the form of annual reports to the Centre on Emission Inventories and Projections (CEIP) (Knežević et al., 2019). In addition, there are several studies on air pollution conducted by the Joint Research Center (JRC) of the European Commission (Belis et al., 2016, 2017), which refer to the Danube and Adriatic-Ionian macro-regions, where Serbia belongs too. Belis et al. (2019) conducted a study on the impact of the main sources of PM2.5 in urban zones for the Danube Region and the Western Balkans, and stated that in Novi Sad, Belgrade and Kragujevac about 30% to 40% of PM2.5 emissions come from the energy sector. This study deals with the balances of air pollutant emissions, i.e. NOx, SOx, total suspended particles (TSP), particulate matter (PM10 and PM2.5) and black carbon (BC). These are the primary pollutants and common combustion products that are main indicators of air quality. Such investigation has not been carried out so far for the City of Novi Sad.
The objective of the study was to determine airborne emissions emerging from combustion of agricultural biomass in residential sector and compare with those from other fuels (fossil and woody biomass). Further objective was to compare emissions from residential sector with other relevant sectors (road transport and on-field burning of crop residues) and spatial allocation (urban and rural zones). The research was conducted for the City of Novi Sad in 2015. In focus was the agricultural biomass since this type is abundant and often used as a fuel in the geographical region of the City due to its lower price compared with fossil fuels and other biomass types and forms. Due to its inadequate combustion properties, it is assumed that agricultural biomass represents a significant source of airborne emissions. Although replacement of fossil fuels by biomass is desirable to mitigate climate change, it represents a source of airborne emissions that may influence air quality and thus human health, which should be considered and possibly minimized.

Airborne emissions from agricultural biomass combustion in the city of Novi Sad
475
MATERIALS AND METHODS
Materials Table 1 provides data on the primary energy of fuels used for heating purposes in the City
of Novi Sad in 2015, distinguished by type of heating appliances used, either appliances in households or agriculture, or for the needs of district heating. Appliances in agriculture are used to obtain thermal energy for processing needs, e.g. for the purpose of drying or heating of greenhouses. These data were used to calculate emissions, using defined emission factors (Table 3) and approach described in the subchapter Methods.
Table 1 Distribution of primary fuel energy in residential sector by type of
appliances in 2015
Households Agriculture District heating Baled straw, TJ a-1
SBO_STR 139.6 MBO_STR 5.1 SBO_STR_HA 41.7 MBO_STR_HA 3.1
Corn cobs, TJ a-1 STV_CON 44.5 STV_MAS 34.5 COK_SOF 21.5 SBO_CON 46.5 SBO_CON_HA 14.4
Pruning residues, TJ a-1 STV_CON 10.0 MBO_CON 29.7 STV_MAS 8.3 COK_SOF 22.1 SBO_CON 0.8 SBO_CON_HA 0.4
Firewood, TJ a-1 STV_CON 223.5 MBO_CON 5.2 STV_MAS 145.8 MBO_DWB 0.9 COK_SOF 174.9 MBO_CON_HA 2.6 SBO_CON 335.9 SBO_DWB 58.3 SBO_CON_HA 58.3 SBO_DWB_HA 19.4
Wood pellets, TJ a-1 STV_PST 55.3 SBO_WOB 129.1
Coal, TJ a-1 STV_CON 114.1 MBO_CON 12.3 STV_MAS 48.9 MBO_AFB 2.0 SBO_CON 95.1 MBO_CON_HA 6.1 SBO_CON_HA 13.6
Natural gas, TJ a-1 STV_GAS 416.9 MBO_GAS 158.4 BBO_GAS 3,248.3 COK_GAS 139.0 SBO_GAS 833.8

A. Nesterović, Đ. Đatkov, M. Višković, M. Martinov
476
The defined codes of the heating appliances considered in Table 1 are given in Table 2. The appliances are divided into stoves, cookers and boilers (small, medium and big). All appliances are divided in accordance with European Monitoring and Evaluation Programme / European Environment Agency – EMEP / EEA (EEA, 2019), i.e. to small appliances which include stoves, cookers and small boilers (SBO) used for household heating, then medium appliances (medium boilers – MBO), used in agriculture for process needs and large appliances (big boilers – BBO) used in heating plants for district heating.
Table 2 Selected appliances and their codes
Appliance name Appliance code Stoves
Conventional stoves STV_CON Masonry stoves STV_MAS Modern pellet stoves STV_PST Liquid/gas-fuelled stoves STV_GAS
Cookers Domestic cooking using solid fuel COK_SOF Cooking using gas COK_GAS
Boilers Conventional, coal/biomass boilers SBO/MBO_CON Advanced combustion boilers – Downdraught wood boilers SBO/MBO_DOW Advanced combustion boilers – Wood pellet boilers SBO_WOB Conventional, coal/biomass boilers + HA1 SBO/MBO_CON_HA Advanced combustion boilers – Downdraught wood boilers + HA SBO/MBO_DOW_HA Straw bales boilers SBO/MBO_STR Straw bales boilers + HA SBO/MBO_STR_HA Liquid/gas-fuelled small boilers – Standard boilers SBO/MBO/BBO_GAS Automatic feed boilers MBO_AFB 1Heat accumulator
The emission factors of pollutants for the respective types of appliances and fuels are given
in Table 3. The pollutants for which the balance was performed are: NOx, SOx, TSP, PM10, PM2.5 and BC. Data on emission factors were used according to EMEP / EEA (EEA, 2019), whereby corrections were made for certain fuels. For corn cobs emission factors were recalculated from own measurement results, due to the lack of data in EMEP / EEA. Available data for emission factors are in the section 1.A.4 Small combustion section in the following Tables: 3.13 – 3.16, 3.20, 3.23, 3.26, 3.40 and 3.42 – 3.44, and in the section 1.A.1 Energy industries in the Table 3.12. The correction was carried out for baled straw and pruning residues. The emission factors for baled straw were corrected due to the lower efficiency of the boilers considered in this study than specified in the EMEP / EEA. For pruning residues, emission factors were determined from the ratio of emissions of pruning residues pellets and wood pellets (Pizzi et al., 2018; Prando et al., 2016), and then this value was multiplied by the emission factor for the same type of firewood boiler. Pruning residues, in addition to firewood and wood pellets, were also classified as woody biomass in this study, due to the structure and properties of this biomass type as a fuel. Baled straw and corn cobs are classified as agricultural biomass in this study.

Airborne emissions from agricultural biomass combustion in the city of Novi Sad
477
Table 3 Emission factors by type of appliance and fuel
Appliance code NOx, g GJ-1
SOx, g GJ-1
TSP, g GJ-1
PM10, g GJ-1
PM2.5, g GJ-1
BC, g GJ-1
Households Baled straw1
SBO_STR 128.2 112 1,517.3 1,441 1,411 226 SBO_STR_HA 128.2 112 1,517.3 1,441 1,411 226
Corn cobs2 STV_CON 57.7 262.1 215.5 204.7 200.4 14.2 STV_MAS 57.7 262.1 215.5 204.7 200.4 14.2 COK_SOF 57.7 262.1 215.5 204.7 200.4 14.2 SBO_CON 57.7 262.1 215.5 204.7 200.4 14.2 SBO_CON_HA 57.7 262.1 215.5 204.7 200.4 14.2
Pruning residues1 STV_CON 115.5 25.4 1,843 1,755.6 1,709.4 170.9 STV_MAS 115.5 25.4 1,843 1,755.6 1,709.4 170.9 COK_SOF 115.5 25.4 1,843 1,755.6 1,709.4 170.9 SBO_CON 184.8 25.4 1,155 1,108.8 1,085.7 173.7 SBO_CON_HA 184.8 25.4 1,155 1,108.8 1,085.7 173.7
Agriculture Baled straw1
MBO_STR 682.8 254.6 183.8 175 171 27 MBO_STR_HA 682.8 254.6 183.8 175 171 27
Pruning residues1 MBO_CON 210.2 25.4 392.7 376.5 369.6 103.5 1EEA, 2019; partially reworked. 2Results of own measurements.
In Table 4 is given the fuel consumption for road transport in the City of Novi Sad for
2015. Fuel is distributed by vehicle types in accordance with EMEP / EEA (EEA, 2019). The values were estimated on the basis of the quantities of fuel consumed and the number of registered vehicles in the Republic of Serbia, as well as the number of registered vehicles in the City of Novi Sad for 2015. All these data are from the Statistical Office of the Republic of Serbia (2016; 2020).
Table 4 Fuel consumption for road transport in the City of Novi Sad in 2015
Fuel L-category PC LVC HDC Diesel, Mg – 40,550 3,060 32,899 Gasoline, Mg 1,150 21,863 – – LPG, Mg – 12,997 – – Natural gas, Mg – – – 285
L-category – Light category (mopeds and motorcycles); PC – Passenger Cars; LVC – Light Commercial Vehicles; HDC – Heavy-Duty Vehicles.
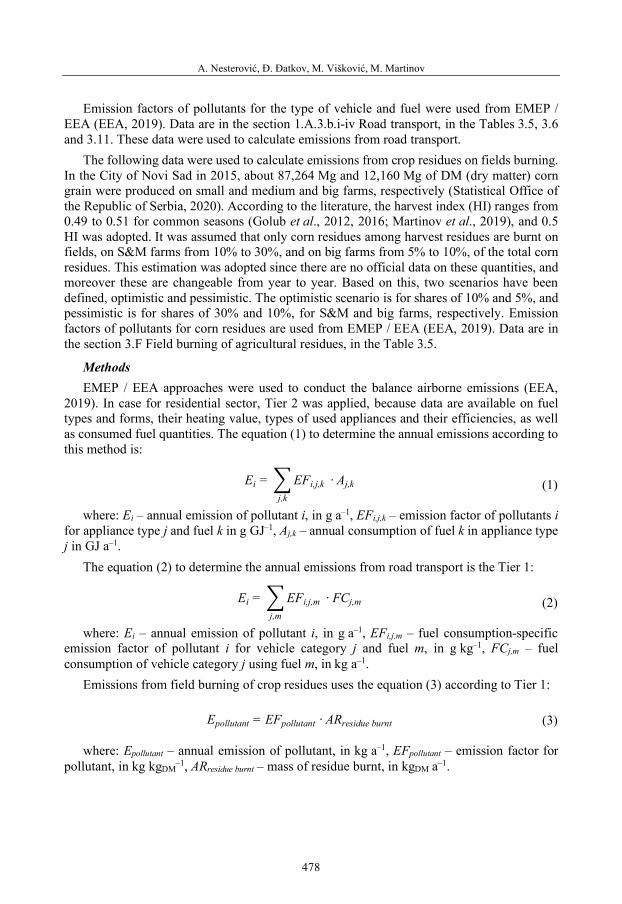
A. Nesterović, Đ. Đatkov, M. Višković, M. Martinov
478
Emission factors of pollutants for the type of vehicle and fuel were used from EMEP / EEA (EEA, 2019). Data are in the section 1.A.3.b.i-iv Road transport, in the Tables 3.5, 3.6 and 3.11. These data were used to calculate emissions from road transport.
The following data were used to calculate emissions from crop residues on fields burning. In the City of Novi Sad in 2015, about 87,264 Mg and 12,160 Mg of DM (dry matter) corn grain were produced on small and medium and big farms, respectively (Statistical Office of the Republic of Serbia, 2020). According to the literature, the harvest index (HI) ranges from 0.49 to 0.51 for common seasons (Golub et al., 2012, 2016; Martinov et al., 2019), and 0.5 HI was adopted. It was assumed that only corn residues among harvest residues are burnt on fields, on S&M farms from 10% to 30%, and on big farms from 5% to 10%, of the total corn residues. This estimation was adopted since there are no official data on these quantities, and moreover these are changeable from year to year. Based on this, two scenarios have been defined, optimistic and pessimistic. The optimistic scenario is for shares of 10% and 5%, and pessimistic is for shares of 30% and 10%, for S&M and big farms, respectively. Emission factors of pollutants for corn residues are used from EMEP / EEA (EEA, 2019). Data are in the section 3.F Field burning of agricultural residues, in the Table 3.5.
Methods EMEP / EEA approaches were used to conduct the balance airborne emissions (EEA,
2019). In case for residential sector, Tier 2 was applied, because data are available on fuel types and forms, their heating value, types of used appliances and their efficiencies, as well as consumed fuel quantities. The equation (1) to determine the annual emissions according to this method is:
Ei = �EFi,j,kj,k
· Aj,k (1)
where: Ei – annual emission of pollutant i, in g a–1, EFi,j,k – emission factor of pollutants i for appliance type j and fuel k in g GJ–1, Aj,k – annual consumption of fuel k in appliance type j in GJ a–1.
The equation (2) to determine the annual emissions from road transport is the Tier 1:
Ei = �EFi,j,mj,m
· FCj,m (2)
where: Ei – annual emission of pollutant i, in g a–1, EFi,j,m – fuel consumption-specific emission factor of pollutant i for vehicle category j and fuel m, in g kg–1, FCj,m – fuel consumption of vehicle category j using fuel m, in kg a–1.
Emissions from field burning of crop residues uses the equation (3) according to Tier 1:
Epollutant = EFpollutant · ARresidue burnt (3)
where: Epollutant – annual emission of pollutant, in kg a–1, EFpollutant – emission factor for pollutant, in kg kgDM
–1, ARresidue burnt – mass of residue burnt, in kgDM a–1.

Airborne emissions from agricultural biomass combustion in the city of Novi Sad
479
RESULTS AND DISCUSSION
The assessment results of airborne pollutant emissions for the three sources are presented in Table 5. Unlike NOx emissions, originating mostly from road transport, others are mostly from the residential sector. The results for field burning, presented in the range between the optimistic and pessimistic scenario, are lower than in the residential sector. However, these pollutants are emitted in a few weeks, so it is assumed that air quality in that period is significantly worsened.
Table 5 Results of airborne emissions in the City of Novi Sad for the 2015
Pollutants Residential sector Road transport Field burning1 NOx, Mg a-1 537 2,102 17 – 49 SOx, Mg a-1 343 0.7 × 10⁻³ 2 – 5 TSP, Mg a-1 1,170 84 59 – 173 PM10, Mg a-1 1,108 84 58 – 170 PM2.5, Mg a-1 1,082 84 57 – 167 BC, Mg a-1 134 0.5 7 – 21
1Optimistic scenario – Pessimistic scenario
Contribution to airborne emissions of fuels used in residential sector is given in Figure 1.
The results show that fossil fuels contribute to 77% and 76%, to SOx and NOx emissions, respectively. SOx emissions from coal rate about 76%, while NOx emissions from natural gas about 69%. Other pollutants originate from biomass, more than 90%. Emissions of TSP, PM10, PM2.5 and BC originate 64% from woody biomass, which of firewood has a share of about 55%. Agricultural biomass also has a significant share in emissions, at about 27% for TSP, PM10 and PM2.5, and about 32% for BC. Baled straw has a higher share in emissions if agricultural biomass is observed, i.e. TSP, PM10 and PM2.5 account for about 24%, then BC about 31% and 5% for NOx, except for SOx emissions where corn cobs are more dominant in the contribution, more than 12%.
Figure 1 Contribution of fuels used to airborne emissions in residential sector
0% 20% 40% 60% 80% 100%
NOx
SOx
TSP
PM10
PM2.5
BC
Coal Natural gas Wood pellets Firewood Pruning residues Corn cobs Baled straw
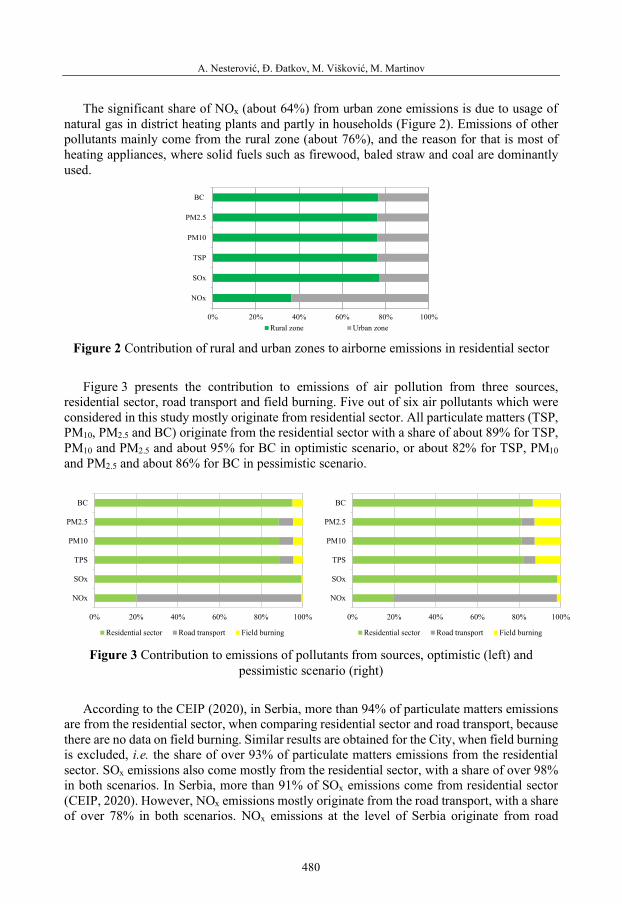
A. Nesterović, Đ. Đatkov, M. Višković, M. Martinov
480
The significant share of NOx (about 64%) from urban zone emissions is due to usage of natural gas in district heating plants and partly in households (Figure 2). Emissions of other pollutants mainly come from the rural zone (about 76%), and the reason for that is most of heating appliances, where solid fuels such as firewood, baled straw and coal are dominantly used.
Figure 2 Contribution of rural and urban zones to airborne emissions in residential sector
Figure 3 presents the contribution to emissions of air pollution from three sources, residential sector, road transport and field burning. Five out of six air pollutants which were considered in this study mostly originate from residential sector. All particulate matters (TSP, PM10, PM2.5 and BC) originate from the residential sector with a share of about 89% for TSP, PM10 and PM2.5 and about 95% for BC in optimistic scenario, or about 82% for TSP, PM10 and PM2.5 and about 86% for BC in pessimistic scenario.
Figure 3 Contribution to emissions of pollutants from sources, optimistic (left) and
pessimistic scenario (right)
According to the CEIP (2020), in Serbia, more than 94% of particulate matters emissions
are from the residential sector, when comparing residential sector and road transport, because there are no data on field burning. Similar results are obtained for the City, when field burning is excluded, i.e. the share of over 93% of particulate matters emissions from the residential sector. SOx emissions also come mostly from the residential sector, with a share of over 98% in both scenarios. In Serbia, more than 91% of SOx emissions come from residential sector (CEIP, 2020). However, NOx emissions mostly originate from the road transport, with a share of over 78% in both scenarios. NOx emissions at the level of Serbia originate from road
0% 20% 40% 60% 80% 100%
NOx
SOx
TSP
PM10
PM2.5
BC
Rural zone Urban zone
0% 20% 40% 60% 80% 100%
NOx
SOx
TPS
PM10
PM2.5
BC
Residential sector Road transport Field burning
0% 20% 40% 60% 80% 100%
NOx
SOx
TPS
PM10
PM2.5
BC
Residential sector Road transport Field burning
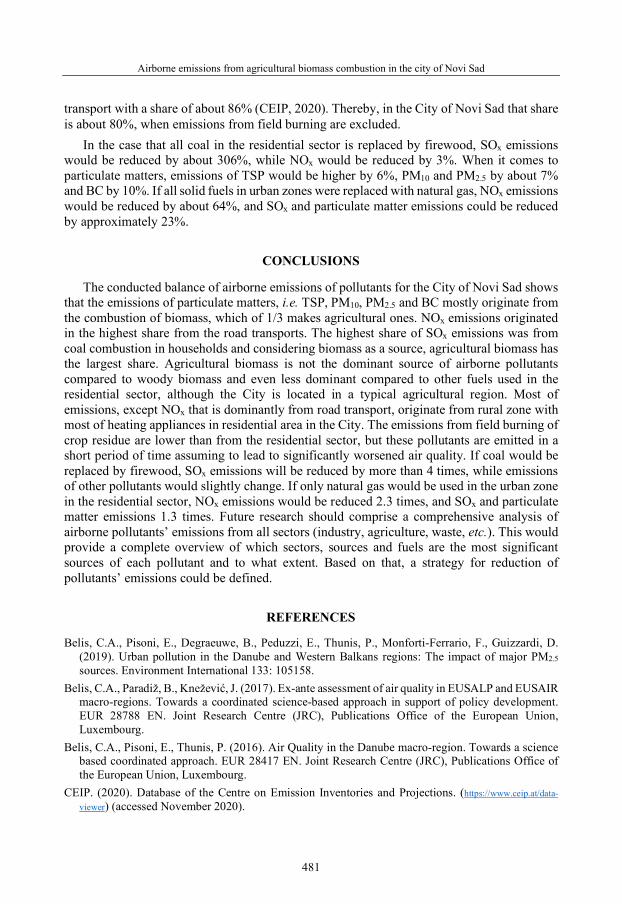
Airborne emissions from agricultural biomass combustion in the city of Novi Sad
481
transport with a share of about 86% (CEIP, 2020). Thereby, in the City of Novi Sad that share is about 80%, when emissions from field burning are excluded.
In the case that all coal in the residential sector is replaced by firewood, SOx emissions would be reduced by about 306%, while NOx would be reduced by 3%. When it comes to particulate matters, emissions of TSP would be higher by 6%, PM10 and PM2.5 by about 7% and BC by 10%. If all solid fuels in urban zones were replaced with natural gas, NOx emissions would be reduced by about 64%, and SOx and particulate matter emissions could be reduced by approximately 23%.
CONCLUSIONS
The conducted balance of airborne emissions of pollutants for the City of Novi Sad shows that the emissions of particulate matters, i.e. TSP, PM10, PM2.5 and BC mostly originate from the combustion of biomass, which of 1/3 makes agricultural ones. NOx emissions originated in the highest share from the road transports. The highest share of SOx emissions was from coal combustion in households and considering biomass as a source, agricultural biomass has the largest share. Agricultural biomass is not the dominant source of airborne pollutants compared to woody biomass and even less dominant compared to other fuels used in the residential sector, although the City is located in a typical agricultural region. Most of emissions, except NOx that is dominantly from road transport, originate from rural zone with most of heating appliances in residential area in the City. The emissions from field burning of crop residue are lower than from the residential sector, but these pollutants are emitted in a short period of time assuming to lead to significantly worsened air quality. If coal would be replaced by firewood, SOx emissions will be reduced by more than 4 times, while emissions of other pollutants would slightly change. If only natural gas would be used in the urban zone in the residential sector, NOx emissions would be reduced 2.3 times, and SOx and particulate matter emissions 1.3 times. Future research should comprise a comprehensive analysis of airborne pollutants’ emissions from all sectors (industry, agriculture, waste, etc.). This would provide a complete overview of which sectors, sources and fuels are the most significant sources of each pollutant and to what extent. Based on that, a strategy for reduction of pollutants’ emissions could be defined.
REFERENCES
Belis, C.A., Pisoni, E., Degraeuwe, B., Peduzzi, E., Thunis, P., Monforti-Ferrario, F., Guizzardi, D. (2019). Urban pollution in the Danube and Western Balkans regions: The impact of major PM2.5 sources. Environment International 133: 105158.
Belis, C.A., Paradiž, B., Knežević, J. (2017). Ex-ante assessment of air quality in EUSALP and EUSAIR macro-regions. Towards a coordinated science-based approach in support of policy development. EUR 28788 EN. Joint Research Centre (JRC), Publications Office of the European Union, Luxembourg.
Belis, C.A., Pisoni, E., Thunis, P. (2016). Air Quality in the Danube macro-region. Towards a science based coordinated approach. EUR 28417 EN. Joint Research Centre (JRC), Publications Office of the European Union, Luxembourg.
CEIP. (2020). Database of the Centre on Emission Inventories and Projections. (https://www.ceip.at/data-viewer) (accessed November 2020).
A. Nesterović, Đ. Đatkov, M. Višković, M. Martinov
482
EEA. (2019). EMEP/EEA air pollutant emission inventory guidebook 2019. European Environment Agency (EEA), Publications Office of the European Union, Luxembourg.
Golub, M., Martinov, M., Bojic, S., Viskovic, M., Djatkov, Dj., Dragutinovic, G. Dallemand, F.J. (2016): Investigation on Possibilities for Sustainable Provision of Corn Stover as an Energy Source: Case Study for Vojvodina. Agricultural Mechanization in Asia, Africa, and Latin America 47, 8-15.
Golub, M., Bojic, S., Djatkov, Dj., Mickovic, G., Martinov, M. (2012). Corn Stover Harvesting for Renewable Energy and Residual Soil Effects. Agricultural mechanization in Asia, Africa and Latin America, 43, 72-79.
IEA. (2016). Energy and Air Pollution, World Energy Outlook Special Report. International Energy Agency (IEA), Paris.
Knežević, J., Jović B., Marić Tanasković, L., Jovanović, M., Mitrović-Josipović, M., Ljubičić, A., Stamenković, D., Dimić, B. (2020). Godišnji izveštaj o stanju kvaliteta vazduha u Republici Srbiji 2019. godine (Annual report on the state of air quality in the Republic of Serbia in 2019 srp.). Ministry of Environmental Protection, Environmental Protection Agency, Belgrade.
Martinov, M., Djatkov, Dj., Viskovic, M. (2019). Potentials of crops residues – A case study for the province Vojvodina. Die Bodenkultur: Journal of Land Management, Food and Environment, 70, 181-188.
Pizzi, A., Foppa, P.E., Duca, D., Rossini, G., Mengarelli, C., Ilari, A., Mancini, M., Toscano, G. (2018). Emissions of heating appliances fuelled with agropellet produced from vine pruning residues and environmental aspects. Renewable Energy 121, 513-520.
Prando, D., Boschiero, M., Campana, D., Gallo, R., Vakalis, S., Baratieri, M., Comiti, F., Mazzetto, F., Zerbe, S. (2016). Assessment of different feedstocks in South Tyrol (Northern Italy): Energy potential and suitability for domestic pellet boilers. Biomass and Bioenergy 90, 155-162.
Statistical Office of the Republic of Serbia. (2020). Database of the Statistical Office of the Republic of Serbia. (https://data.stat.gov.rs/Home/Result/040202?languageCode=en-US) (accessed November 2020).
Statistical Office of the Republic of Serbia. (2016). Municipalities and regions of the Republic of Serbia, 2016. Statistical Office of the Republic of Serbia, Belgrade.
WHO. (2013a). Review of Evidence on Health Aspects of Air Pollution – REVIHAAP Project. Technical Report. World Health Organization (WHO), Regional Office for Europe, Geneva.
WHO. (2013b). Health Effects of Particulate Matter: Policy Implications for Countries in Eastern Europe, Caucasus and Central Asia. World Health Organization (WHO), Regional Office for Europe, Geneva.
48th Symposium "Actual Tasks on Agricultural Engineering", Zagreb, Croatia, 2021
483
SEASONAL PERFORMANCE OF SHARED AGRICULTURAL MACHINERY IN MACHINERY RING
Ranko KOPRIVICA1, Biljana VELJKOVIĆ1*, Dušan RADIVOJEVIĆ2, Zoran MILEUSNIĆ2, Dragoslav ĐOKIĆ3, Dragan TERZIĆ3, Tatjana DEDIĆ4
*E-mail of corresponding author: [email protected] 1University of Kragujevac, Faculty of Agronomy in Čačak, Cara Dušana 34, Čačak, Serbia
2University of Belgrade, Faculty of Agriculture, Nemanjina 6, Belgrade Zemun, Serbia 3University of Niš, Faculty of Agriculture in Kruševac, Kosančićeva 4, Kruševac Serbia
4UN FAO Regional Office for Europe and Central Asia, Budapest, Hungary
SUMMARY
Rational use of agricultural machinery is achieved by their joint use in machinery rings. Research in the article was conducted in the northwestern part of Montenegro in the municipality Pljevlja in 8 machinery rings with 56 farmers. In the machinery rings, the work of 33 agricultural machines was monitored: seed drill (8), narrow row seeders (7), manure spreader (5), forage harvesters - Corner machinery (5), mineral fertilizer spreader (4) and rollers (4). Listed machines were tested, cultivator or seed drills were the most used in the preparation of soil for sowing small grains, a mixture of grasses, and combined crops of peas, legumes and oats. The achieved seasonal performance of joint seed drills is 91.45 ha.
Narrow row seeders or seeders for grains were used in machine rings for sowing 14 ha of combined crops of legumes, peas and oats, as well as for sowing wheat, buckwheat, oats, rye, triticale, legumes, and grass clover mixtures. A seasonal performance of 78.65 ha was achieved. After sowing, rolling was performed with 4 rollers on area of 45 ha.
In order to increase the yield of hay and silage on lawns and arable land fertilization with manure and fertilizer was performed. Spreaders for fertilizer and manure were used jointly and a seasonal performance of 53.1 ha and 30.17 ha was achieved. Silage harvesters achieved a seasonal performance of 45.6 ha and 851 t of grass silage from natural meadows, sown meadows, alfalfa, legumes, vetch, peas and oats. Preparation of silage from listed crops was performed in 5 machinery rings, 11 farmers participated, which is 31% of the total number of farmers in the machinery rings.
Keywords: machinery ring, shared machines, seasonal performance
48. ACTUAL TASKS ON AGRICULTURAL ENGINEERING
Expert paper

R. Koprivica, B. Veljković, D. Radivojević, Z. Mileusnić, D. Đokić, D. Terzić, T. Dedić
484
INTRODUCTION
Due to the growing shortage of labor on family farms, modern highly productive and quality agricultural machinery is needed. A prerequisite for the rational use of agricultural machinery is their employment during the year, which includes: good organization of production and training of machine operators. However, this mechanization is often very expensive, and due to lack of financial resources it is inaccessible to smaller farmers. One of the ways to facilitate the procurement of machinery is appropriate direct and indirect incentive measures, from foreign donations from the EU, the UN, non-governmental and governmental associations and the Ministry of Agriculture. In the research area of the North part of Montenegro, through the UN FAO project "Assistance in the development of livestock in the mountainous areas of Montenegro and Kosovo", machinery was procured and allocated to family farms and at the same times members of the machine rings (MR) for joint use. Rational procurement of shared machines and raising the level of technological equipment of agricultural farms will reduce costs and increase revenues.
In Hungary, there are three forms of cooperation in the use of machinery, namely: working with machines based on reciprocity, mutual borrowing of machinery, and joint ownership of procurement and use of agricultural machinery. The use of technical resources on farms is usually insufficient 25-26% (Baranyai et al., 2014). In the Republic of Croatia, the equipment of farms with agricultural machinery is good, but the utilization is low due to the small size of plots. One of the solutions to increase the utilization rate and reduce the cost of using machinery can be the joint use of machines in the MR as in Germany, France, Slovenia, Hungary, USA, etc. (Šumanovac, 1996; Grgić, 1998).
Takacs and Takacs (2012) state that by associating farmers in the MR and using shared machinery, investments in agriculture have been reduced from 3,324 € ha-1 to 620 € ha-1.
In 2005, MR "Agrokrug from Bačko PetrovoSelo cultivated 70 ha with 8 tractors and 80 own and common machines, and in 2016 about 300 ha (Tot, 2013; Radić et al., 2016).
In Brčko, "Krug mašina" in 13 Machinery Ring with 41 tractors and over 300 attachments cultivated 30,000 ha of land, with 600 members and 1,500 service users (Nešić and Radić, 2003, Veljković et al., 2009).
One of the most important factors in increasing the intensity of work processes in agriculture is to raise the level of technical supply of farms and increase the volume of productivity of machines by their joint use in the MR. The aim of the research is to determine seasonal performance of surface and mass, used of shared machines in MR, namely: seed drills, seeders for grains, manure spreaders, forage harvesters, mineral fertilizer spreaders and rollers.
MATERIALS AND METHODS
The research was conducted in the area of Northwestern Montenegro in the municipality of Pljevlja in 8 machine rings with 56 farmers. As part of the project "Assistance in the development of livestock in the mountainous areas of Montenegro and Kosovo", supported by UN FAO, allocated mechanization for joint use to members in MR. A total of 33 machines were distributed: FOP Vogel-noot seed drill (8), IMT 634.773 seeders for grain (7), SIP Orion 35 R manure spreader (5), forage harvester type Corner machinery (5), Ferti 400 mineral
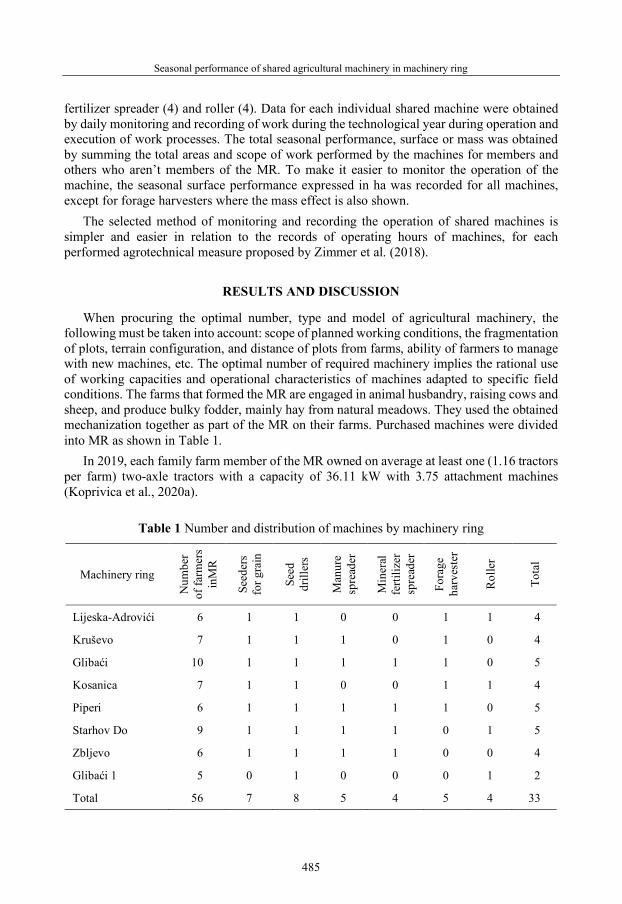
Seasonal performance of shared agricultural machinery in machinery ring
485
fertilizer spreader (4) and roller (4). Data for each individual shared machine were obtained by daily monitoring and recording of work during the technological year during operation and execution of work processes. The total seasonal performance, surface or mass was obtained by summing the total areas and scope of work performed by the machines for members and others who aren’t members of the MR. To make it easier to monitor the operation of the machine, the seasonal surface performance expressed in ha was recorded for all machines, except for forage harvesters where the mass effect is also shown.
The selected method of monitoring and recording the operation of shared machines is simpler and easier in relation to the records of operating hours of machines, for each performed agrotechnical measure proposed by Zimmer et al. (2018).
RESULTS AND DISCUSSION
When procuring the optimal number, type and model of agricultural machinery, the following must be taken into account: scope of planned working conditions, the fragmentation of plots, terrain configuration, and distance of plots from farms, ability of farmers to manage with new machines, etc. The optimal number of required machinery implies the rational use of working capacities and operational characteristics of machines adapted to specific field conditions. The farms that formed the MR are engaged in animal husbandry, raising cows and sheep, and produce bulky fodder, mainly hay from natural meadows. They used the obtained mechanization together as part of the MR on their farms. Purchased machines were divided into MR as shown in Table 1.
In 2019, each family farm member of the MR owned on average at least one (1.16 tractors per farm) two-axle tractors with a capacity of 36.11 kW with 3.75 attachment machines (Koprivica et al., 2020a).
Table 1 Number and distribution of machines by machinery ring
Machinery ring
Num
ber
of fa
rmer
s in
MR
Seed
ers
for g
rain
Seed
dr
iller
s
Man
ure
spre
ader
Min
eral
fe
rtiliz
er
spre
ader
Fora
ge
harv
este
r
Rol
ler
Tota
l
Lijeska-Adrovići 6 1 1 0 0 1 1 4
Kruševo 7 1 1 1 0 1 0 4
Glibaći 10 1 1 1 1 1 0 5
Kosanica 7 1 1 0 0 1 1 4
Piperi 6 1 1 1 1 1 0 5
Starhov Do 9 1 1 1 1 0 1 5
Zbljevo 6 1 1 1 1 0 0 4
Glibaći 1 5 0 1 0 0 0 1 2
Total 56 7 8 5 4 5 4 33

R. Koprivica, B. Veljković, D. Radivojević, Z. Mileusnić, D. Đokić, D. Terzić, T. Dedić
486
Since the family farms in the MR are engaged in animal husbandry, they have enough manure to fertilize the agricultural land.Controlled application of solid manure implies the selection of an appropriate machine which, by adjustment, can enable quantitatively and qualitatively precise distribution of manure with a coefficient of variation to 25% (Škrbić et al., 2005).In mineral fertilizer spreaders, the uniformity of distribution should be 90% (Tenu et al., 2018). This is difficult to achieve on slightly undulating, and especially hilly terrain, where steeper slopes present a difficulty, primarily for the safe movement of the wasteful aggregate (Zoranović et al., 2013). Also, Stojanović et al. (2015) expire that plot size and terrain slope significantly affect the working efficiency of a rotary mower and rotary rake.
Most of the agricultural land, primarily meadows and pastures in the Pljevlja area is located in the hilly area. In order to increase the yield of grass mass, meadows are fertilized with manure. For the safety of farmers when spreading manure, low center of gravity spreaders with wide low profile tires were procured.Spreaders worked on the distribution of manure on meadows, pastures and arable land. A total of 5 manure spreaders were used together, with a total seasonal performance of 53.1 ha. The highest seasonal effect of manure spreaders was achieved at the MR in Glibaći on the surfaces of 10 farms., where 24.5 ha of manure or 46.42% of the total seasonal effect of all spreaders were spread (Figure 1).
Figure 1 Seasonal performance of manure spreaders in machine rings in ha
Natural grasslands represent a significant resource in the production of bulky fodder in the
hilly and mountainous area. It is possible to multiply the production of bulky fodder on grasslands by applying agro-technical measures by spreading mineral fertilizers or establishing new grasslands (Tomić et al., 2018). In the MR, 4 spreaders of mineral fertilizers were procured for joint use. Spreaders are engaged in basic fertilization and fertilization of field and fodder crops and achieved seasonal performance of 30.17 ha.
On the farms, pre-sowing soil preparation was carried out in several passages with harrows and disc harrows. Procurement and joint use of seed drills have increased the areas under cultivation and shortened the time of sowing soil preparation. Also, good quality of work, large working width, seed drills performance, will reduce of the number of passages, trampling of soil and fuel consumption. By all obtained and shared machines, seed drills were the most exploited with a seasonal performance 91.45 ha (Tab. 2). The seed drills were mainly
Kruševo StrahovDo Piperi Glibaći Zbljevo Total
performance ha 3.9 15.3 2.9 24.5 6.5 53.1
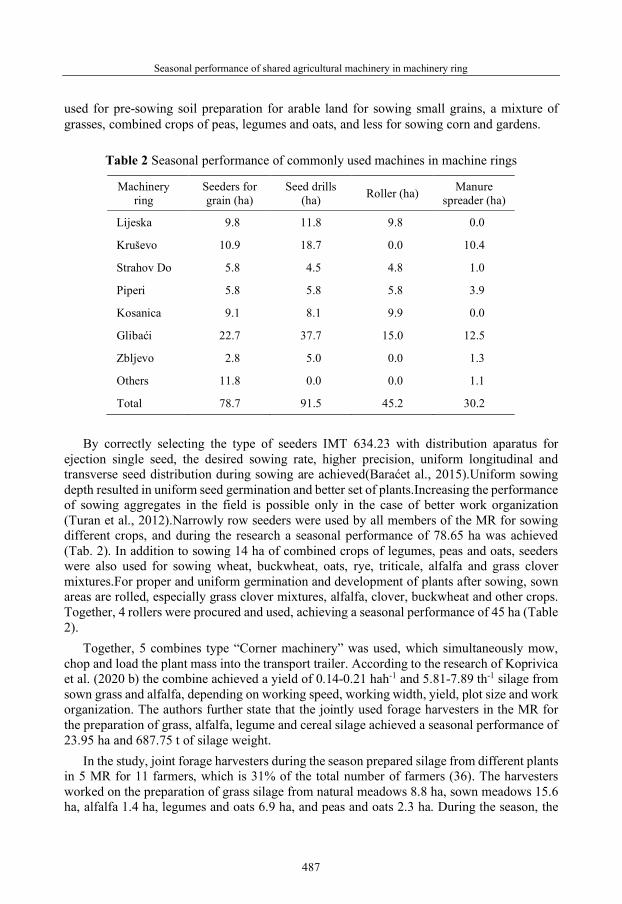
Seasonal performance of shared agricultural machinery in machinery ring
487
used for pre-sowing soil preparation for arable land for sowing small grains, a mixture of grasses, combined crops of peas, legumes and oats, and less for sowing corn and gardens.
Table 2 Seasonal performance of commonly used machines in machine rings
Machinery ring
Seeders for grain (ha)
Seed drills (ha) Roller (ha) Manure
spreader (ha)
Lijeska 9.8 11.8 9.8 0.0
Kruševo 10.9 18.7 0.0 10.4
Strahov Do 5.8 4.5 4.8 1.0
Piperi 5.8 5.8 5.8 3.9
Kosanica 9.1 8.1 9.9 0.0
Glibaći 22.7 37.7 15.0 12.5
Zbljevo 2.8 5.0 0.0 1.3
Others 11.8 0.0 0.0 1.1
Total 78.7 91.5 45.2 30.2
By correctly selecting the type of seeders IMT 634.23 with distribution aparatus for
ejection single seed, the desired sowing rate, higher precision, uniform longitudinal and transverse seed distribution during sowing are achieved(Baraćet al., 2015).Uniform sowing depth resulted in uniform seed germination and better set of plants.Increasing the performance of sowing aggregates in the field is possible only in the case of better work organization (Turan et al., 2012).Narrowly row seeders were used by all members of the MR for sowing different crops, and during the research a seasonal performance of 78.65 ha was achieved (Tab. 2). In addition to sowing 14 ha of combined crops of legumes, peas and oats, seeders were also used for sowing wheat, buckwheat, oats, rye, triticale, alfalfa and grass clover mixtures.For proper and uniform germination and development of plants after sowing, sown areas are rolled, especially grass clover mixtures, alfalfa, clover, buckwheat and other crops. Together, 4 rollers were procured and used, achieving a seasonal performance of 45 ha (Table 2).
Together, 5 combines type “Corner machinery” was used, which simultaneously mow, chop and load the plant mass into the transport trailer. According to the research of Koprivica et al. (2020 b) the combine achieved a yield of 0.14-0.21 hah-1 and 5.81-7.89 th-1 silage from sown grass and alfalfa, depending on working speed, working width, yield, plot size and work organization. The authors further state that the jointly used forage harvesters in the MR for the preparation of grass, alfalfa, legume and cereal silage achieved a seasonal performance of 23.95 ha and 687.75 t of silage weight.
In the study, joint forage harvesters during the season prepared silage from different plants in 5 MR for 11 farmers, which is 31% of the total number of farmers (36). The harvesters worked on the preparation of grass silage from natural meadows 8.8 ha, sown meadows 15.6 ha, alfalfa 1.4 ha, legumes and oats 6.9 ha, and peas and oats 2.3 ha. During the season, the

R. Koprivica, B. Veljković, D. Radivojević, Z. Mileusnić, D. Đokić, D. Terzić, T. Dedić
488
harvesters achieved a mass performance of 654 t of silage from the mentioned plants. In addition, the harvesters worked on the preparation of 10.6 ha or 197 t of silage from grass, lucerne and the combined crop of legumes and oats at two farmers non members in MR (Table 3).
Table 3 Seasonal performance of silage harvesters by types of silage in MR
Total seasonal performance of jointly used combines among MR and other farmers non-
members in MR is 45.6 ha and 851 t of silage from these plants (Figure 2 and 3). Organized use of shared machines by forming MR ensures a higher annual scope of
machinery exploitation, and their use becomes more economical, especially for owners of small farms. Farmers in MR Glibaći had a strong organizational ability to make maximum use of all joint machines, except for forage harvesters, while the largest volume of use of forage harvesters was achieved in MR Lijeska.
Mac
hine
ry
ring
Farm
de
sign
atio
n Type of silage
Natural meadow Sown meadow Lucerne Vetch and oats Peas and oats
ha t ha t ha t ha t ha t
Lijeska Adrovići
A1 0 0 2.5 70 0 0 0 0 0.7 20
A2 1.3 25 0 0 0 0 0 0 0 0
A3 0 0 4.7 90 0 0 1.8 40 0 0
Kruševo B1 0 0 4.5 90 0 0 0 0 0 0
B2 0 0 0 0 0 0 1.8 22 0 0
Glibaći
C1 0 0 0.8 23 0 0 0.6 12 0.6 20
C2 0 0 1.0 13 0 0 0 0 1.0 22
C3 0.9 10 1.1 20 0 0 0 0 0 0
Kosanica D1 0 0 1.0 15 0 0 1.5 28 0 0
Piperi
E1 3.6 41 0 0 0 0 0.6 10 0 0
E2 3.0 45 0 0 0 0 0 0 0 0
E3 0 0 0 0 1.4 25 0.6 13 0 0 Total
machinery ring
11 8.8 121 15.6 321 1.4 25 6.9 125 2.3 62
Others F1 0 0 2.3 34 0.3 6 2.8 55 0 0
F2 3.2 60 0 0 0 0 2.0 42 0 0
Total 0 12.0 181 17.9 355 1.7 31 11.7 222 2.3 62

Seasonal performance of shared agricultural machinery in machinery ring
489
Figure 2 Total surface seasonal performance of silage harvesters in MR by farms
Figure 3 Total mass seasonal performance of silage harvesters in MR by farms
CONCLUSION
The achieved surface and mass performance of commonly used machines in machinery rings show that they rationally used during the sowing and harvesting campaign. The total seasonal effect of manure spreaders was 53.1 ha. The highest seasonal effect of manure spreaders was achieved at the MR in Glibaći, where 24.5 ha of manure or 46.42% of the total seasonal effect of all spreaders were spread. Spreaders mainly worked on the distribution of manure on meadows, pastures and arable land.
By all the machines obtained for use, seed drills were exploited with a seasonal performance on 91.45 ha, for sowing small grains, a mixture of grasses, combined crops of peas and oats, and legumes and oats, and less for sowing corn and gardens.
Narrow rows seeders were used by all members of the MR for sowing different crops, and during the research a seasonal effect of 78.65 ha was achieved. In addition to sowing 14 ha of combined crops of legumes, peas and oats, seeders were also used for sowing other crops of
A1 A2 B1 B2 C1 C2 C3 D1 E1 E2 E3 MP11 F1 F2 11+
2
Ljeska AdrovićiKruševo Glibaći Kosanica Piperi Total Others Total
ha 3.2 1.3 4.5 1.8 2 2 2 2.5 4.2 3 2 35 5.4 5.2 46
A1 A2 B1 B2 C1 C2 C3 D1 E1 E2 E3 MP11 F1 F2 11+
2
Ljeska AdrovićiKruševo Glibaći Kosanica Piperi Total Others Total
t 90 25 90 22 55 35 30 43 51 45 38 654 95 102 851

R. Koprivica, B. Veljković, D. Radivojević, Z. Mileusnić, D. Đokić, D. Terzić, T. Dedić
490
wheat, buckwheat, oats, rye, triticale, alfalfa and grass clover mixtures. After sowing the mentioned crops, with 4 rollers, rolling was performed on area of 45 ha.
In order to increase the yield of hay and silage on lawns and arable land, fertilization was applied with 4 shared spreaders, and achieved performance of 30.17 ha during the season.
Joint used silage harvesters in the MR achieved a seasonal performance of 45.6 ha and 851 t of grass silage from natural meadows, sown meadows, alfalfa, legumes, peas and oats. Preparation of grass silage is a novelty in the researched area, but it is accepted by 31% of the total number of farmers. The joint obtained machines were mostly used by farmers in the MR Glibaći.
REFERENCES
Baranyai Z., Szabo G., Vasary M. (2014). Analysis of machine use in Hungarian agriculture- Is there any future for machinery sharing arrangements. Roczniki (Annals), Polish Association of Agricultural Economists and Agribusiness. Stowarzyszenie Ekonomistow Rolnictwa e Agrobiznesu (SERiA) vol. XVI (3), 24-29.
Barać S., Petrović D., Đikić A., Biberdžić M., Koprivica R. (2015). Rezultati ispitivanja mašina za obradu zemljišta i setvu heljde i raži. Savremena poljoprivredna tehnika vol. 41(1), 25-34.
Grgić Z. (1998). Iskorištenje poljoprivredne mehanizacije u voćarskoj proizvodnji obiteljskih gospodarstava. Zbornik radova 26. savjetovanja „Aktualni zadaci mehanizacije poljoprivrede“, Opatija, 49-54.
Koprivica R., Veljković B., Radivojević D., Đurišić J., Dedić T., Mileusnić Z. (2020a). Sustainable functionality of machinery rings in the northern part of Montenegro, GEA (Geo Eco-Eco Agro) International Conference, 28-31 May 2020, Montenegro Book of Proceedings, 181-189
Ranko Koprivica, Biljana Veljković, Dušan Radivojević, Tatjana Dedić, Zoran Mileusnić, Dragan Terzić, Maja Babović-Đorđević, Dragoslav Đokić (2020b). Seasonal performance of shared silage combine harvesters in a machinery ring. Acta Agriculturae Serbica, 25 (49), 89‒94.
Nešić D., Radić P. (2003). Pružanje mašinskih usluga kako to drugi rade? Traktori i pogonske mašine, 8(5), 51-56.
Radić P., Pajić M., Karolj P. (2016). The first active machinery ring inrepublic of Serbia. Proceedings, 18th Scientific Conference Current Problems and tendencies in agricultural engineering, Belgrade, 9.12.2016. Serbia, 139-143.
Stojnović M., Andreata-Koren M., Čuklić D., Horvatinčić Ž. (2015). Utjecaj nagiba i veličine parcele na učinkovitost rada strojeva za spremanje krme. Agriculture in nature and environment protection, 8th International scientific/professional conference, Vukovar, Proceedings & Abstract sp., 331- 334.
Takаcs I., Takаcs G.K. (2012). Cooperation among farmers for cost saving machinering. Proceedings, 3rd International Symposium "Agrarian Economy and Rural Development - realities and perspectives for Romania", Bucharest, Romania, Octob. 11-13, 2012, 320-335.
Tot A. (2013). Jedna mogućnost racionalnije nabavke i korišćenja poljomehanizacije. Traktori i pogonske mašine, 18(1), 86-94.
Škrbić N, Rangelov D., Ajder S. (2005). Rezultati ispitivanja rasturača stajskog đubriva sa dva horizontalna rasturačka diska. Savremena poljoprivredna tehnika, 31(1-2), 45-48.
Šumanovac L. (1996). Racionalno korištenje sredstava poljoprivredne mehanizacije na obiteljskim gospodarstvima. Doktorska disertacija. Sveučilište Josipa Jurja Strossmayera u Osijeku, Poljoprivredni fakultet u Osijeku, Osijek.

Seasonal performance of shared agricultural machinery in machinery ring
491
Tomić D., Brković D., Stevović V., Bokan N., Đurović D., Lazarević Đ. (2018). Productivity of natural grassland of the order Arrhenatheretalia depending on nitrogen fertilization level.Acta Agriculturae Serbica, Vol. XXIII, 46(2018), 187-196.
Turan J., Višacki V., Sinčić M., Findura P., Burg P., Sedlar A. (2012). Ispitivanje agregata za setvu pšenice na redukovanoj obradi. Savremena poljoprivredna tehnika, 38(4),299-306.
Tenu I., Coorduneanu O. R., Carlescu P., Rosca R. (2018). Design and construction of a fertilizer spreader for glass houses and greenhouses.Proceedings 46th International Symposium: Actual tasks on agricultural engineering, Opatija, Croatia, 27th February - 1st March, 2018, 157-167
Veljković Biljana, Koprivica R., Topisirović G., Stanimirović N. (2009). Mašinski prstenovi kao oblik udruživanja poljoprivrednih proizvođača, XIV Savetovanje o biotehnologiji, Agronomski fakultet Čačak, Zbornik radova, vol 14 (15), 505-512.
Zimmer D., Šumanovac L., Jurić T., Jurišić M., Ranogajec Ljubica, Turkalj D. (2018). Utjecaj veličine obradive površine na broj sati i snagu traktora u obiteljskim poljoprivrednim gospodarstvima. Agronomski Glasnik 2/2018, 91-105.
Zoranović M, Sedlar A, Turan J, Ivanišević M. (2013). Kinematika uređaja za bočno rasturanje čvrstog stajnjaka. Savremena poljoprivredna tehnika, 39 (1),1-10.


48th Symposium "Actual Tasks on Agricultural Engineering", Zagreb, Croatia, 2021.
493
SIMULATION MODEL OF AGRICULTURAL TRANSPORT UNITS BEHAVIOUR ON PUBLIC ROADS
Nicolae LONTIS, Dumitru TUCU*, Gabriel MALAIMARE, Ioan-Vasile GROZA *E-mail of corresponding author: [email protected]
Mechanical Machines and Transportation, Politehnica University Timisoara, No.1, Mihai Viteazu Av., RO-300011 Timisoara, Romania
ABSTRACT
Considering the high vulnerability of the activity for transportation of products and by-products, partially on public roads, exposed to the risk of road accidents, and the low level of qualification of workers (drivers), the paper proposes the use of procedures for establishing the representative parameters of displacement (structure of the units, speed, acceleration etc.), according with the road conditions (road type (coating, wear layer etc.), road geometry (width, curvature, inclination, slope etc.), and road state (dry, wet, icy, ice, potholes etc.), weather). The paper uses a simulation model for analyze the stability of transport units, on the public roads, based on commercial soft Virtual CRASH 4. The analyses simulated the stability of the transport units by the relative value of skidding (S), between zero and tipping the trailer, corresponding to 5 levels: no skidding (no considered in the analysis); S - under 10% relative skidding (skidding value divided by the difference between width of the thread and trailer gauge, corrected with wheel width); S+ - skidding between 11-49 %; S++ - skidding between 50-99 %; S+++ - skidding between 100-110 %; the trailer overturns). The model was applied for a unit consisting of a tractor FENDT 718 Vario, 180 HP, and a DOFI Full Tripper Trailer 30 t, under the following conditions: curved road at rays: 120, 160 and 200 m; the road downhill: 3, 5 and 7 degree; the tractor speed: 40, 50 and 60 Km∙h-1. The following hypotheses were considered: the trailer load is stabile (the center of gravity does not change); the road is dry (the value of the coefficient of friction is 0,78); the start position is the same every time. After simulation, next recommendations resulted: on the road downhill 3 degrees, maximum admissible speed is 40 Km∙h-1, for curved road at rays of 120 m, and maximum admissible speed is 50 Km∙h-1, for curved road at rays of 160 m and 200 m. Also, the influence of curved road rays on the stability is bigger than influence of angle of inclination of the road and the speed of transport unit. Such procedures can be integrated with other elements of remote agriculture.
Keywords: stability simulation model, safety, agricultural aggregates, transportation, road
48. ACTUAL TASKS ON AGRICULTURAL ENGINEERING
Original scientific paper

N. Lontis, D. Tucu, G. Malaimare, I.-V. Groza
494
INTRODUCTION
One of the most vulnerable activity in agriculture is the transportation of products and by-products, partially on public roads, with serious exposure to the risk of road accidents.
It is well known that using agricultural machines on slopes is very risky for operators, being impossible to instantly check the road characteristics and impact in correspondence of each wheel (Bietresato and Mazzetto, 2018). Also, generally, the perception of workers on risks at work is different (Gusetoiu and Tucu, 2012; Gusetoiu and Tucu, 2013). On the other hands, the level of qualification of workers (drivers) in agriculture is lower (Crisan et al., 2017; Tucu et al, 2019).
A lot of tests and simulation systems are developed: analysis of stability of operating machines by means of turntable platform with four weighting quadrants (Bietresato and Mazzetto, 2020), pre-fabricated steel spiral roll-over ramp with an increasing slope (from 18 to 35 degree) (Scarlet et al, 2006), using of response analysis (Fu et al, 2020), specific testing methods (eg. Istituto per la Meccanizzazione Agricola, 2000), or evolved methods, based on different mathematical models, approaching the aggregate, tractors of parts (Previati et al, 2014; Franceschetti et al. 2014; Gravalos et al, 2011, etc.).
Generally, the stability of a vehicle is referred to the overturning. In the present study the sliding/translation of the vehicle (hence, of the CoG) along the plane, is the interest, because they had not been foreseen by any international test standards dealing with the stability of a vehicle (ISO, 2015; OECD, 1990).
This paper studied the stability of transport units for agricultural products, on the public roads, using a simulation model based on commercial soft Virtual CRASH 4. The analyses simulated the stability of the transport units by the relative value of skidding (S).
MATERIAL AND METHODS
The software used for performing virtual experiments was a commercial version licensed by dongle key of Virtual CRASH 4. The simulation model analyzed the stability of the transport units by the relative value of skidding (S), between zero and tipping the trailer, corresponding to 0 and other 5 levels: no skidding, S=0; S ≤10% relative skidding; S+, when skidding is between 11-49 %; S++, skidding between 50-99 %; S+++, skidding between 100-110 %; the trailer overturns. The skidding value is computed by dividing the skidding absolute value (m), at the width of the thread, considering the width of the thread (3.5 m), and trailer gauge ((the width of the trailer is equal to the distance between the outside of the wheels), corrected with wheel width).
The model proposed in the study is composed by tractor and steered trailer with prow and three axes, respecting the overall dimensions and manufacturer specifications. The tractor chosen and modelled in Virtual CRASH 4.0 was FENDT 718 Vario, 180 HP (main specifications in table 1).
The steered trailer with prow chosen for the proposed study is a full tipping trailer manufactured by DOFI Vehicles Group. The model constructed in Virtual CRASH 4.0 has the specifications presented in table 2.

Simulation model of agricultural transport units behaviour on public roads
495
Table 1 FENDT 718 Vario specifications Table 2 Trailer main specifications
Experimental setup The complete model developed in Virtual CRASH 4.0 and run in simulations is presented
in figure 1. The simulations computed in Virtual CRASH 4.0 were performed on a curved downhill
road of 7 m width and 0.5 m road junction at three different rays of 120, 160 and 200 m. The simulations were run on the downhill road at three different degrees (3, 5 and 7), for
a specific aggregate (tractor and steered trailer) at different speeds (40, 50 and 60 km∙h-1).
Figure 1 Presentation of the simulation model
The following hypothesis were considered during the simulation’s operations: - the simulation duration is 3 s; - the computational method of the Virtual CRASH 4.0 is full integration with
integrations step of 0.005 s and pre-calculated time at 0.050 s; - the steered trailer load is stable - the center of gravity does not change; - the road is dry – the value of the coefficient of friction is 0.78; - the steering angle of the tractor is 1.7° to left, along the road; - the starting position of the assembly is the same for each test run.
No. Specification Value 1 Length 4.750 [m] 2 Width 2.570 [m] 3 Height 2.990 [m] 4 Wheelbase 2.720 [m] 5 Track width 1.920 [m] 6 Front tires 540R28 7 Rear tires 650R38 8 Mass 6985 [kg]
No. Specification Value 1 Length 9.770 [m] 2 Width 2.480 [m] 3 Height 3.480 [m] 4 Wheelbase 1 (Axle 1 – Axle 2) 4.500 [m] 5 Wheelbase 2 (Axle 2 – Axle 3) 1.310 [m] 6 Track width 2.100 [m] 7 Tyres (Axle 1,2,3) 425/65R22 8 Mass 30000 [kg]
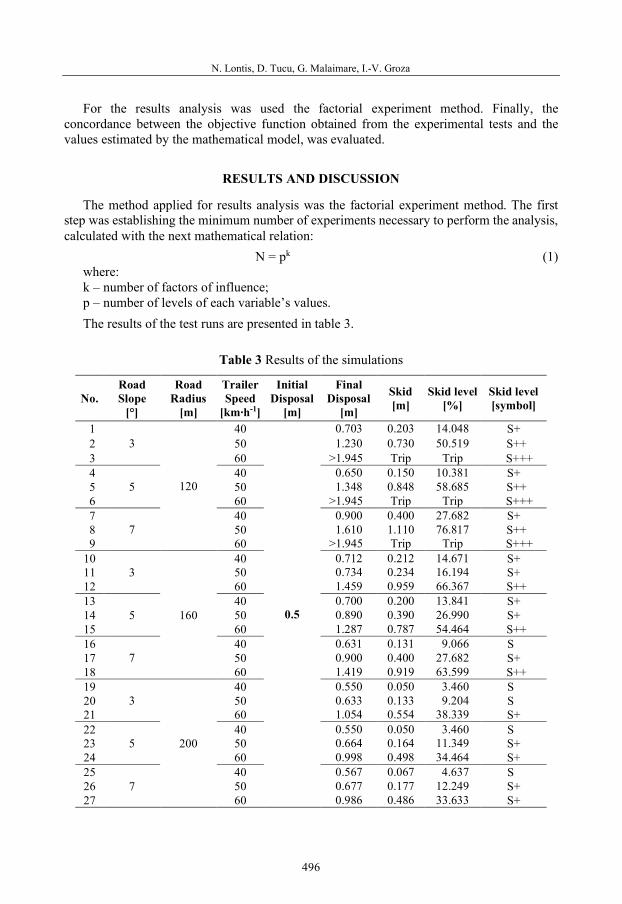
N. Lontis, D. Tucu, G. Malaimare, I.-V. Groza
496
For the results analysis was used the factorial experiment method. Finally, the concordance between the objective function obtained from the experimental tests and the values estimated by the mathematical model, was evaluated.
RESULTS AND DISCUSSION
The method applied for results analysis was the factorial experiment method. The first step was establishing the minimum number of experiments necessary to perform the analysis, calculated with the next mathematical relation:
N = pk (1) where: k – number of factors of influence; p – number of levels of each variable’s values. The results of the test runs are presented in table 3.
Table 3 Results of the simulations
No. Road Slope
[°]
Road Radius
[m]
Trailer Speed
[km∙h-1]
Initial Disposal
[m]
Final Disposal
[m]
Skid [m]
Skid level [%]
Skid level [symbol]
1 3
120
40
0.5
0.703 0.203 14.048 S+ 2 50 1.230 0.730 50.519 S++ 3 60 >1.945 Trip Trip S+++ 4
5 40 0.650 0.150 10.381 S+
5 50 1.348 0.848 58.685 S++ 6 60 >1.945 Trip Trip S+++ 7
7 40 0.900 0.400 27.682 S+
8 50 1.610 1.110 76.817 S++ 9 60 >1.945 Trip Trip S+++ 10
3
160
40 0.712 0.212 14.671 S+ 11 50 0.734 0.234 16.194 S+ 12 60 1.459 0.959 66.367 S++ 13
5 40 0.700 0.200 13.841 S+
14 50 0.890 0.390 26.990 S+ 15 60 1.287 0.787 54.464 S++ 16
7 40 0.631 0.131 9.066 S
17 50 0.900 0.400 27.682 S+ 18 60 1.419 0.919 63.599 S++ 19
3
200
40 0.550 0.050 3.460 S 20 50 0.633 0.133 9.204 S 21 60 1.054 0.554 38.339 S+ 22
5 40 0.550 0.050 3.460 S
23 50 0.664 0.164 11.349 S+ 24 60 0.998 0.498 34.464 S+ 25
7 40 0.567 0.067 4.637 S
26 50 0.677 0.177 12.249 S+ 27 60 0.986 0.486 33.633 S+

Simulation model of agricultural transport units behaviour on public roads
497
The factors of influence applied on the present study were speed of the aggregate, and road ray and slope. The number of levels were maxim and minim, thus resulting a minimum number of experiments in revealing important conclusions, N: N = 23 = 8.
The input parameters for the mathematical model were: X1 = assembly speed, v, [km∙h-1]; X2 = road ray, R, [m]; X3 = road slope, α, [degrees]. The next step was establishing of the base level of each factor and their specific range of
variation (lower level, central point and higher level), with regard on the model performances and real working conditions. The lower and upper values are shown in table 4, being taken from the base results (table 3).
Table 4 Values of the input parameters
Name/Code Parameters Speed v [km∙h-1] Road ray [m] Downhill slope α [°] Base level, 0 X0 50 160 5 Lower level, -1 XI 40 120 3 Higher level, +1 XS 60 200 7 Variation ∆X ±10 ±40 ±2
The output parameter of the system, taken into analysis, is the Skid, Y [m], representing
the sliding displacement of trailer relative to initial position. The program matrix of the mathematical model was performed with the coded values, taking into consideration certain restrictions:
- the number of values on one level is equal to the numbers of values on the next level; - a new variable will be introduced X0 = +1 for harmonization, so that the regression
coefficient calculation formula is universally valid. The program matrix with adjustable parameters (lower and upper level), related to the
simulated conditions of movement of the assembly is presented in table 5.
Table 5 The program matrix with adjustable parameters while the assembly is moved
No Speed v [km∙h-1]
Road ray R [m]
Downhill slope [°]
1 40 120 3 2 40 120 7 3 40 200 3 4 40 200 7 5 60 120 3 6 60 120 7 7 60 200 3 8 60 200 7
Table 6 Matrix program with coded parameters for the assembly
No. b0 b1 b2 b3
1 1 -1 -1 -1 2 1 -1 -1 1 3 1 -1 1 -1 4 1 -1 1 1 5 1 1 -1 -1 6 1 1 -1 1 7 1 1 1 -1 8 1 1 1 1

N. Lontis, D. Tucu, G. Malaimare, I.-V. Groza
498
The mathematical model obtained was: Y = 0,751 + 0,571 X1 – 0,461 X2 + 0,039 X3 - 0,341 X1 X2 -
- 0,016 X1 X3 - 0,049 X2 X3 -0,008X1X2X3 (2)
To control the concordance between the obtained objective function from the experimental tests and the values estimated by the mathematical model, were compared results (table 3) with calculated values by mathematical model. The compared results are presented in table 7, correlated with matrix program. The regression equations obtained allowed a detailed analysis of the influence of the studied factors, as well as of the correlation between them on the skidding of the trailer.
Table 7 Results obtained when mathematical model no.2 is applied
No. b0 b1 b2 b3 Y Yc ΔY [%] 1 1 -1 -1 -1 0.203 0.203 0.00 2 1 -1 -1 1 0.400 0.401 0.25 3 1 -1 1 -1 0.050 0.049 2.00 4 1 -1 1 1 0.067 0.067 0.00 5 1 1 -1 -1 2.052 2.053 0.05 6 1 1 -1 1 2.226 2.227 0.04 7 1 1 1 -1 0.554 0.555 0.18 8 1 1 1 1 0.486 0.485 0.21
It was observed the values obtained by mathematical model, are very close to the measured
values. This demonstrates the relevance of the obtained mathematical models, which clearly shows the degree of influence of each factor and demonstrates the existing connection between them and the studied objective function.
The greatest influence’s factor in experiment was the speed, followed by the radius of curvature of the road. If the speed has a directly proportional influence on the skid, the radius of curvature has an inversely proportional influence.
Regarding the reciprocal influence between the factors, reported on the skid, the connection between the speed and the radius of curvature of the road on the skid occupied the third position, but as inversely proportional influence. The variable road slope has minimum influence.
The method of the factorial experiment allowed to find a mathematical model that is very close to the experimental results.
CONCLUSIONS
Consulting the simulations results, a first conclusion emerges on the road downhill 3 degrees, maximum admissible speed is 40 km∙h-1, for curved road at rays of 120 m, and maximum admissible speed is 50 km∙h-1, for curved road at rays of 160 m and 200 m. Applying a mathematical model type 2n -1 could reveal another conclusions. In all cases the

Simulation model of agricultural transport units behaviour on public roads
499
skidding phenomena is present. For eliminates the skidding during transportation in aggregate, it is necessary to reduce the speed below 40 km∙h-1 while the assembly is in turn. Also, the influence of curved road rays on the transport unit stability is bigger than influence of angle of inclination of the road and the speed of transport unit. Such procedures generated by present simulation model must be integrated with other elements of remote agriculture. Such mathematical model can be applied in integrated solutions for digitalize the transport with agricultural aggregate in different conditions.
REFERENCES
Bietresato, M., Mazzetto, F. (2020). Stability Tests of Agricultural and Operating Machines by Means of an Installation Composed by a Rotating Platform (the “Turntable”) with Four Weighting Quadrants. In MDPI, Applied Sciences-Basel, Vol. 10, Iss. 11, Art. No. 3786.
Bietresato, M., Mazzetto, F. (2018). Increasing the safety of agricultural machinery operating on sloping grounds by performing static and dynamic tests of stability on a new-concept facility. In: J. of Safety and Security Eng., Vol. 8, No. 1 (2018) 77–89.
Crisan, G.C., Tucu, D., Boboescu, R. (2017). Improvement of safe & healthy work systems in agricultural SME's. In: Actual Tasks on Agricultural Engineering-Zagreb, Vol. 45, 657-666.
Franceschetti, B., Lenain, R., Rondelli, V. (2014). Comparison between a rollover tractor dynamic model and actual lateral tests. In: Biosyst. Eng., Vol. 127, 79–91.
Fu, C., Xu, Y., Yang, Y., Lu, K., Gu, F., Ball, A. (2020). Response analysis of an accelerating unbalanced rotating system with both random and interval variables. In: J. Sound Vib., 466, 115047.
Gravalos, I., Gialamas, T., Loutridis, S., Moshou, D., Kateris, D., Xyradakis, P., Tsiropoulos, Z. (2011). An experimental study on the impact of the rear track width on the stability of agricultural tractors using a test bench. In: J. Terramechanics, Vol. 48, 319–323.
Gusetoiu, I.R., Tucu, D. (2012). Influence of occupational stress in jobs in the field of nanomaterials. In: Tanger Ltd. Conference: 4th International Conference on NANOCON, Brno, Czech Republic, 531-536.
Gusetoiu, I.R., Tucu, D. (2013). Stress risk in management systems in metallurgical problems. In: Tanger Ltd. Conference: 22nd International Conference on Metallurgy and Materials (METAL), Brno, Czech Republic, 1904-1908.
Previati, G., Gobbi, M., Mastinu, G. (2014). Mathematical models for farm tractor rollover prediction. In: Int. J. Veh. Des., Vol. 64, 280–303.
Scarlett, A.J., Reed, J.N., Semple, D.A., Seward, P.C., Stockton, A.D., Price, J.S. (2006). Operator Roll-Over Protection on Small Vehicles—Research Report 432. In: HSE—Health and Safety Executive, Silsoe, UK.
Tucu, D., Crisan, G.C., Tucu, A. (2019). The use of self-assessment in occupational risk management system in SMEs from agriculture. In: Actual Tasks on Agricultural Engineering-Zagreb, vol.47, 479-485.
* * *. (2015). ISO 16231-2:2015. —Self-Propelled Agricultural Machinery—Assessment of Stability—Part. 2: Determination of Static Stability and Test Procedures; ISO: Geneva, Switzerland.
* * *. (2000). Instituto per la Meccanizzazione Agricola. Test in Accordance with the OECD Code 1 for the Official Testing of Agricultural Tractors—New Holland TL 90 4WD—OECD Approval No.: 1/1915—Report No. 2648/T/2000 Consiglio Nazionale delle Ricerche—Istituto per la Meccanizzazione Agricola: Torino, Italy.

N. Lontis, D. Tucu, G. Malaimare, I.-V. Groza
500
* * *. (1990). OECD (Organization for Economic Co-operation and Development) Code 6—OECD Standard Code for the Official Testing of Front Mounted Rollover Protective Structures on Narrow Track Wheeled Agricultural and Forestry Tractors; OECD: Paris, France.

48th Symposium "Actual Tasks on Agricultural Engineering", Zagreb, Croatia, 2021
501
ARTIFICIAL INTELLIGENCE METHODS FOR SUSTAINABLE AGRIBUSINESS INVOLVING PELLETS Ileana TOMOIAGA1, Alexandra SUTA1, Iasmina DIMCEA1, Titus SLAVICI1,2*, Roxana
BALINT1, Florin NEDELCU1, Lavinia CERNESCU MIHALI2, Cristina SIRBU1 *E-mail of corresponding author: [email protected]
1Politehnica University of Timisoara, Romania 2Ioan Slavici University of Timisoara, Romania
ABSTRACT
The agribusiness sector demands regular balanced cost-benefit solutions. To obtain complex solutions that are easily applicable in this field, we use artificial intelligence.
The objective of this paper is to use innovative instruments from the domain of artificial intelligence in order to enhance decision-making process linked to energetic crops and their usage. The field of expertise covered by this paper is directly related to current issues of sustainable development of the environment. We describe the usage of artificial neural networks (ANN) in determining the potential revenue of heating and food pellets obtained in an agricultural venture.
Our results refer to specific means to optimize the decision-making processes and the forecast of financial results in agribusiness. The article includes a case study of forecasting profits of different blends of pellets.
Keywords: agribusiness, energetic crops, neural networks, pellets
INTRODUCTION
The agricultural economic environment is one of the most important sectors which provide the mainframe of sustainable development. Moreover, this concept can be connected to the use of artificial intelligence to acquire complex solutions.
The European Union aims to develop an environmental friendly society, based on renewable energy (Ines et al, 2020), which guarantees an efficient use of the resources and makes the renewable energy sector a top priority for the EU (Anton and Afloarei Nucu, 2020) over the long run. The EU legislation incorporates The Renewable Energy Directive launched by the European Commission in 2009, which establishes a policy framework regarding the promotion of renewable energy in the European Union (Braungardt et al, 2019). The global
48. ACTUAL TASKS ON AGRICULTURAL ENGINEERING
Preliminary communication

I. Tomoiaga, A. Suta, I. Dimcea, T. Slavici, R. Balint, F. Nedelcu, L. Cernescu Mihali, C. Sirbu
502
and regional trends (Jurasz et al, 2020) show that modern society focuses its efforts on developing new techniques to preserve the environment. One important source of renewable energy is represented by biomass pellets (Martin-Gamboa et al, 2020), which are an eco-friendly alternative and play an important role in the decrease of using fossil resources (Smyth, 2013). Pellets and briquettes offer a huge potential to cover a relevant segment of the total energy supply (DiGiacomo and Taglieri, 2009) in many parts of the European Union.
Agribusiness represents a new perspective combining modern economic characteristics with the traditional sector (King, 2010). The European policies in the field of agriculture support the rural areas to increase the regional sustainable development. The production of feed pellets (Aarseth and Prestløkken, 2003) is linked to the modern perspective of agriculture. One of the most significant factors that contribute to livestock farming is the cost of food (Zenoby et al, 2014). Furthermore, the agribusiness domain can take advantage of the use of these crops for feeding. On the increase on the price of the traditional food sources (barley, corn grain) it is difficult to control the cost. To minimize the effects of feed costs, many producers search for alternative protein and energy sources (Maris et al, 2019).
In the context of dynamic development of renewable energies, it is crucial to obtain the best results, which means to create a great planning from the beginning. The artificial neural networks offer an alternative way to acquire complex solutions (Kalogirou, 2001). The difference between the theoretical part and the practical one can be lowered by artificial neural networks (ANN) (Maris et al, 2018). The artificial neural networks can be considered vital tools that can increase the research development related to biomass energy prediction (Obafemi et al, 2019).
This study analyzes several types of raw materials used for the manufacturing of heat and feed pellets. Moreover, we analyze 20 types of heat and feed pellets, each of them created by using certain percentages of several materials. Our study analyses this model to show the best price quality ratio, taking into account the increase in revenues for the last three years linked to the preferences of the targeted public. This connection is defined by using artificial neural networks and it aims to find which is considered the best combination of renewable resources to produce heat and feed pellets.
MATERIALS AND METHODS
Theoretical aspects This research concerns the use of artificial neural networks and their part in the decision
making process. This method demonstrates the economic profitability of different types of heat and feed pellets. This economic profitability is determined by examining data collected for the past 3 years, analyzing 20 different types of heat and feed pellets and the revenue generated by each of them.
The artificial neural networks forecasts which raw material offers the best quality-price ratio and decisions were made taking into consideration the costs, the revenue, the net income but also the efficiency of the crop. Moreover, this forecast offers a technical and economic framework that helps us define the efficiency of the analyzed pellets at an economic level and in the same time at a technical one. The artificial neural network sets an algorithm that generates the most reliable solution to provide the quality-price ratio.

Artificial intelligence methods for sustainable agribusiness involving pellets
503
Furthermore, the artificial neural network offers in this case economic results suitable for an accurate decision making process, which ensures the most suitable technical and economic alternative.
Database Our databases were constructed using data from our venture, but also data from our
partners in Serbia and Hungary. Thus, the collected data is relevant for a significant part of Eastern Europe.
Heat pellets The database used mirrors ten recipes of heat pellets tested and analyzed in several
factories from Western Romania, Eastern Hungary and Serbia. We have directed some experiments regarding the efficiency and the costs for pellets and also this data was correlated with the revenues and profit per each of them. The percentages analyzed are presented in table 1. The costs and the prices presented in the next table are expressed in EUR. Also, for the costs of producing pellets and the prices, we took a medium value, of the last three years.
Table 1 Economic efficiency of heat pellets
Rec
ipe
Composition of pellets
Raw
mat
eria
l pr
ice
EU
R
Costs/kg
Prod
uctio
n pr
ice/
kg
EU
R
Sale
pric
e / k
g
EUR
Net
inco
me/
kg
EUR
Pine
saw
dust
%
Stra
w
%
Ener
getic
pla
nt
%
Chi
ps
%
(ene
rgy,
m
anuf
actu
ring,
am
ortiz
atio
n)
EUR
X1 X2 X3 X4 X5 X6 X7 X8 X9
1 100 0 0 0 0.05 0.02 0.07 0.25 0.180
2 0 100 0 0 0.01 0.02 0.03 0.23 0.200
3 0 0 100 0 0.03 0.02 0.05 0.23 0.180
4 0 0 0 100 0.04 0.02 0.06 0.24 0.180
5 50 50 0 0 0.03 0.02 0.05 0.23 0.180
6 0 0 50 50 0.04 0.02 0.06 0.23 0.175
7 33.33 33.33 33.33 0 0.03 0.02 0.05 0.24 0.190
8 0 33.33 33.33 33.33 0.03 0.02 0.05 0.22 0.173
9 33.33 0 33.33 33.33 0.04 0.02 0.06 0.23 0.170
10 33.33 33.33 0 33.33 0.03 0.02 0.05 0.24 0.187 Table 1 shows the net income generated by each category of pellets. First columns of the
table contain 10 different recipes of pellets, labeled from 1 to 10 and referring to the percentage of the raw material used into the mixture. The 10 different recipes of pellets are formed by using four different raw materials. Other data in Table 1 refers to average costs and prices. The study examines 4 raw materials used to produce pellets. The four raw materials
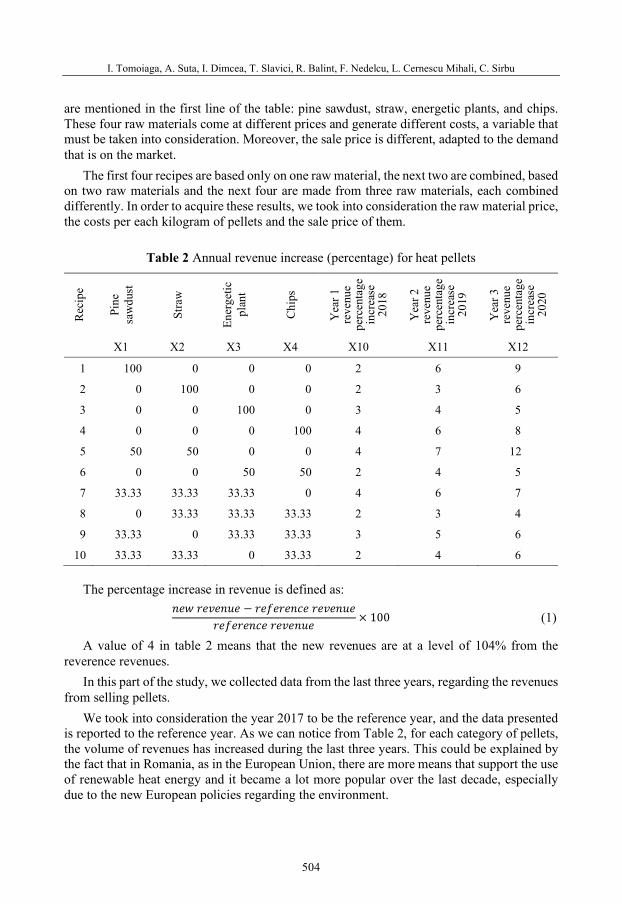
I. Tomoiaga, A. Suta, I. Dimcea, T. Slavici, R. Balint, F. Nedelcu, L. Cernescu Mihali, C. Sirbu
504
are mentioned in the first line of the table: pine sawdust, straw, energetic plants, and chips. These four raw materials come at different prices and generate different costs, a variable that must be taken into consideration. Moreover, the sale price is different, adapted to the demand that is on the market.
The first four recipes are based only on one raw material, the next two are combined, based on two raw materials and the next four are made from three raw materials, each combined differently. In order to acquire these results, we took into consideration the raw material price, the costs per each kilogram of pellets and the sale price of them.
Table 2 Annual revenue increase (percentage) for heat pellets
Rec
ipe
Pine
sa
wdu
st
Stra
w
Ener
getic
pl
ant
Chi
ps
Yea
r 1
reve
nue
perc
enta
ge
incr
ease
20
18
Yea
r 2
reve
nue
perc
enta
ge
incr
ease
20
19
Yea
r 3
reve
nue
perc
enta
ge
incr
ease
20
20
X1 X2 X3 X4 X10 X11 X12
1 100 0 0 0 2 6 9
2 0 100 0 0 2 3 6
3 0 0 100 0 3 4 5
4 0 0 0 100 4 6 8
5 50 50 0 0 4 7 12
6 0 0 50 50 2 4 5
7 33.33 33.33 33.33 0 4 6 7
8 0 33.33 33.33 33.33 2 3 4
9 33.33 0 33.33 33.33 3 5 6
10 33.33 33.33 0 33.33 2 4 6
The percentage increase in revenue is defined as: 𝑛𝑛𝑛𝑛𝑛𝑛 𝑟𝑟𝑛𝑛𝑟𝑟𝑛𝑛𝑛𝑛𝑟𝑟𝑛𝑛 − 𝑟𝑟𝑛𝑛𝑟𝑟𝑛𝑛𝑟𝑟𝑛𝑛𝑛𝑛𝑟𝑟𝑛𝑛 𝑟𝑟𝑛𝑛𝑟𝑟𝑛𝑛𝑛𝑛𝑟𝑟𝑛𝑛
𝑟𝑟𝑛𝑛𝑟𝑟𝑛𝑛𝑟𝑟𝑛𝑛𝑛𝑛𝑟𝑟𝑛𝑛 𝑟𝑟𝑛𝑛𝑟𝑟𝑛𝑛𝑛𝑛𝑟𝑟𝑛𝑛 × 100 (1)
A value of 4 in table 2 means that the new revenues are at a level of 104% from the reverence revenues.
In this part of the study, we collected data from the last three years, regarding the revenues from selling pellets.
We took into consideration the year 2017 to be the reference year, and the data presented is reported to the reference year. As we can notice from Table 2, for each category of pellets, the volume of revenues has increased during the last three years. This could be explained by the fact that in Romania, as in the European Union, there are more means that support the use of renewable heat energy and it became a lot more popular over the last decade, especially due to the new European policies regarding the environment.

Artificial intelligence methods for sustainable agribusiness involving pellets
505
The data collected shows that there is a tendency to use certain raw materials for the pellets. The practical use of pellets in heating shows that the raw material used for the production of pellets has the most important role in their combustion. Technically, the waste of materials and the ash that remains after their combustion generate the main problems that we have to solve. As a result, people tend to buy and to use for heating pellets that are most likely to generate the best correlation between the cost of the combustion and its efficiency. The technical efficiency comes indirectly from the preferences and the susceptibility of the customers to buy not only the pellets with the lowest price, but to buy the ones that give the best value for money.
As our result shows, the most profitable type of pellets is made only from straw, followed by the one made of pine sawdust, straw and energetic plant, as raw materials, each in a proportion of 33,33% of the recipe.
Food pellets The database used represents ten recipes of pellets experimented in Western Romania,
Eastern Hungary and Serbia, in several factories. We have conducted several experiments regarding the efficiency and the costs for feed pellets and also this data was correlated with the revenues and profit per each of them. The percentages analyzed are presented in table 1. The costs and the prices presented in the following table are in EUR. Also, for the costs of producing feed pellets and the prices, we took an average value, of the last three years.
Table 3 Economic efficiency of feed pellets
Rec
ipe
Bar
ley
%
Stra
w
%
Whe
at
%
Soy
%
Cor
n %
Clo
ver
%
Raw
mat
eria
l pr
ice,
EU
R Costs/kg
Prod
uctio
n pr
ice/
kg, E
UR
Sale
pric
e/kg
EU
R
Net
inco
me/
kg
EUR
(ene
rgy,
m
anuf
actu
ring,
am
ortiz
atio
n)
EUR
X1 X2 X3 X4 X5 X6 X7 X8 X9 X10 X11
1 0 0 0 0 100 0 0.17 0.02 0.19 0.19 0.000
2 0 0 0 0 0 100 0.01 0.02 0.03 0.27 0.240
3 0 0 100 0 0 0 0.19 0.02 0.21 0.26 0.050
4 0 0 0 100 0 0 0.62 0.02 0.64 0.30 -0.340
5 100 0 0 0 0 0 0.21 0.02 0.23 0.26 0.030
6 0 100 0 0 0 0 0.01 0.02 0.03 0.13 0.100
7 35 0 0 0 45 20 0.15 0.02 0.17 0.20 0.026
8 0 0 15 15 50 20 0.21 0.02 0.23 0.26 0.034
9 0 35 20 0 20 25 0.08 0.02 0.10 0.11 0.015
10 25 25 30 0 20 0 0.15 0.02 0.17 0.19 0.025

I. Tomoiaga, A. Suta, I. Dimcea, T. Slavici, R. Balint, F. Nedelcu, L. Cernescu Mihali, C. Sirbu
506
The data specified in this table shows the net income generated by each category of pellets. In table 3 are presented 10 recipes of feed pellets, numbered from 1 to 10. For these 10 different types of pellets, are used 6 different raw materials. The raw materials used for the production of feed pellets are barley, straw, wheat, soy, corn and clover. For the first six recipes of pellets is used only one raw material per each. As we can notice, the six raw materials come at different costs, they are sold at different prices and so the net income generated by them is different.
The data presented in this table contains average costs and prices from the last three years, and it helps us to forecast by using an artificial neural network the trend for the next three years. For the feed pellets of soy and corn, the process of pelleting is not justified, because the costs of production are higher than the net income generated. In order to acquire these results, we took into consideration the raw material price, the costs per each kilogram of pellets and the sale price of them.
The results of this study explain the major role that the artificial neural networks have in this process.
Neural network We constructed, trained and used two neural networks. For the three characteristic phases, there are 3 steps: training, validation and test and a
synthesis for these all. The artificial neural networks generate an accurate image of the costs and the tendencies in this sector, but it also reveals the social benefits obtained by using pellets and briquettes for heating. We can notice the fact that people tend to use pellets which are better from a technical perspective, they take into consideration the price, but they choose the better alternative showed by the quality cost ratio. Moreover, the ANN emphasizes also the estimated willingness to pay for renewable energy. This must be taken into account because it shows why the artificial neural networks are necessary to elaborate a forecast increasing in this way its accuracy.
For heat pellets, the topology of the neural network is presented in figure 1.
Figure 1 The topology of the neural net used by the system.
The inputs of the ANN are the following: - for each recipe of pellets a package consists of: 7 own inputs X1,X2, X3,X4, X10,
X11, X12; - finally, the total number of inputs is 70 (10 types of recipes multiplied with 7 types of
inputs).
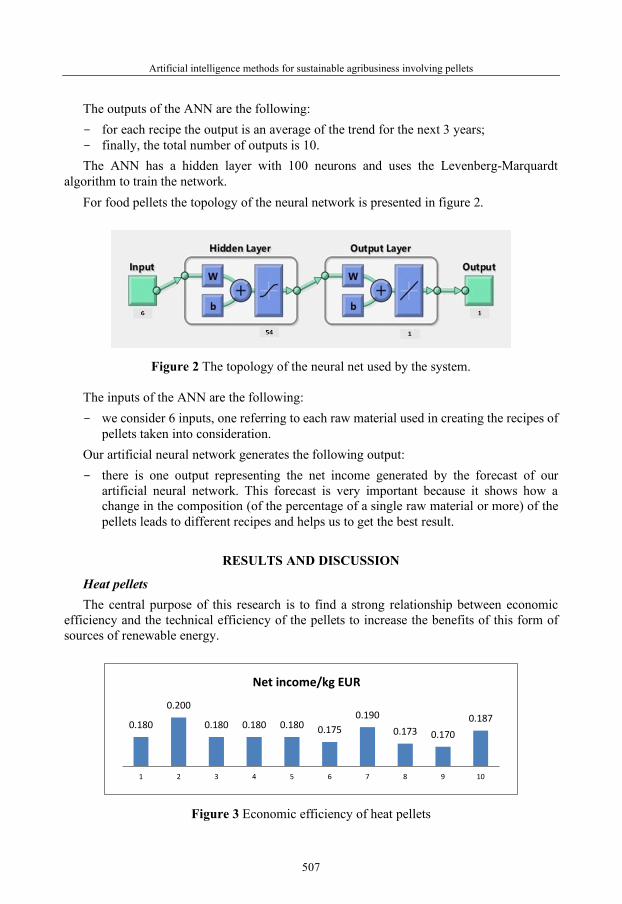
Artificial intelligence methods for sustainable agribusiness involving pellets
507
The outputs of the ANN are the following: - for each recipe the output is an average of the trend for the next 3 years; - finally, the total number of outputs is 10. The ANN has a hidden layer with 100 neurons and uses the Levenberg-Marquardt
algorithm to train the network. For food pellets the topology of the neural network is presented in figure 2.
Figure 2 The topology of the neural net used by the system. The inputs of the ANN are the following: - we consider 6 inputs, one referring to each raw material used in creating the recipes of
pellets taken into consideration. Our artificial neural network generates the following output: - there is one output representing the net income generated by the forecast of our
artificial neural network. This forecast is very important because it shows how a change in the composition (of the percentage of a single raw material or more) of the pellets leads to different recipes and helps us to get the best result.
RESULTS AND DISCUSSION
Heat pellets The central purpose of this research is to find a strong relationship between economic
efficiency and the technical efficiency of the pellets to increase the benefits of this form of sources of renewable energy.
Figure 3 Economic efficiency of heat pellets
0.180
0.200
0.180 0.180 0.180 0.1750.190
0.173 0.1700.187
1 2 3 4 5 6 7 8 9 10
Net income/kg EUR
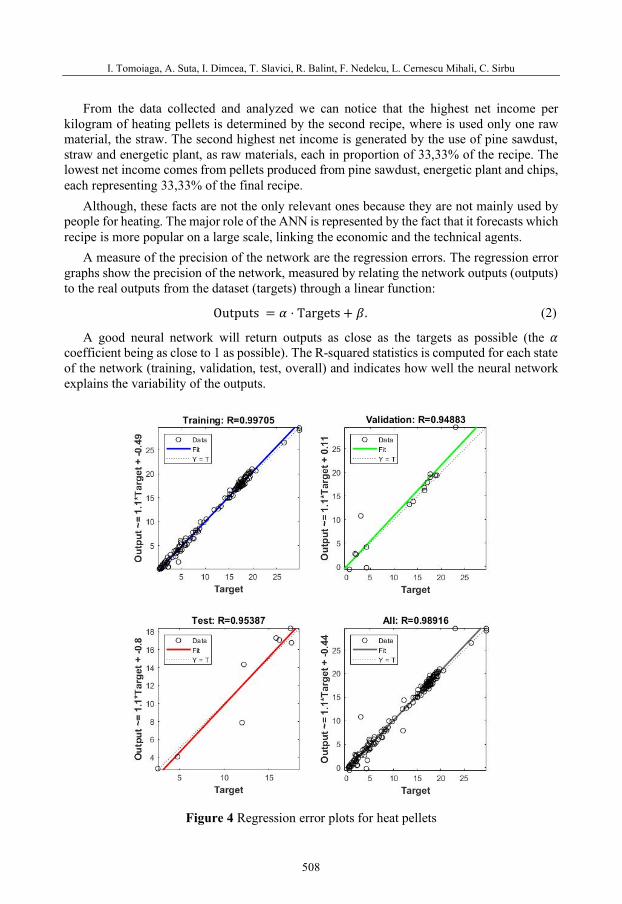
I. Tomoiaga, A. Suta, I. Dimcea, T. Slavici, R. Balint, F. Nedelcu, L. Cernescu Mihali, C. Sirbu
508
From the data collected and analyzed we can notice that the highest net income per kilogram of heating pellets is determined by the second recipe, where is used only one raw material, the straw. The second highest net income is generated by the use of pine sawdust, straw and energetic plant, as raw materials, each in proportion of 33,33% of the recipe. The lowest net income comes from pellets produced from pine sawdust, energetic plant and chips, each representing 33,33% of the final recipe.
Although, these facts are not the only relevant ones because they are not mainly used by people for heating. The major role of the ANN is represented by the fact that it forecasts which recipe is more popular on a large scale, linking the economic and the technical agents.
A measure of the precision of the network are the regression errors. The regression error graphs show the precision of the network, measured by relating the network outputs (outputs) to the real outputs from the dataset (targets) through a linear function:
Outputs = 𝛼𝛼 ⋅ Targets + 𝛽𝛽. (2)
A good neural network will return outputs as close as the targets as possible (the 𝛼𝛼 coefficient being as close to 1 as possible). The R-squared statistics is computed for each state of the network (training, validation, test, overall) and indicates how well the neural network explains the variability of the outputs.
Figure 4 Regression error plots for heat pellets

Artificial intelligence methods for sustainable agribusiness involving pellets
509
In the case of heat pellets, the overall R-squared statistics shows that the neural network, as we computed it, explains 98,916% of the variability of the results, thus having an overall precision of 98,916%.
Food pellets From the data collected and analyzed we can notice that the highest net income per
kilogram of feed pellets is determined by the second recipe, where is used only one raw material, the straw. The second highest net income is generated by the use of clover as raw material.
The major role of the artificial neural networks is represented by the fact that it forecasts which recipe is more popular on a large scale, correlating the economic and the technical factors.
In the case of food pellets, our neural network explained an overall 99,568% of the outputs’ variability (99,796% for the training phase, 97,921% for the validation phase and 99,853% for the testing phase), thus being 99,568% accurate. This points out that the indicator achieved by the network we propose is a high performance one.
Figure 5 Regression error plots for food pellets

I. Tomoiaga, A. Suta, I. Dimcea, T. Slavici, R. Balint, F. Nedelcu, L. Cernescu Mihali, C. Sirbu
510
Furthermore, the results obtained show the relationship between the results of the statistical data and the accuracy of the forecast that we use for the general trend of buying heat pellets and briquettes.
CONCLUSIONS
All things considered, our study provides useful information for the economic agents investing in agribusiness, in Eastern Europe or similar geo-climatic regions. We were able to identify a database containing information about previous experience in similar conditions and an optimized neural network that could accurately predict the outcome of various energetic crops.
The most important thesis of the paper is the opportunity of using ANN for the possibility of predicting economic and financial results, maximizing the profit of businesses in the field of pellet manufacturing. A perspective related to the future research work is to develop neural networks in agribusiness.
Thus, this paper expands the actual knowledge with information corresponding to a previously not investigated context: the outcome of several types of energetic crops in a specific geo-climatic area.
REFERENCES
Aarseth, K.A., Prestløkken E., (2003). Mechanical Properties of Feed Pellets: Weibull Analysis. In: Biosystems Engineering, Elsevier, Volume 84, Issue 3, 349-361
Anton, S. G., Afloarei Nucu, A. E., (2020). The effect of financial development on renewable energy consumption. A panel data approach. In: Renewable Energy, Elsevier, Vol. 147, Part 1, 330-338.
Braungardt, S., Bürgera, V., Ziegera, J., Bosselaarb, L., (2019). How to include cooling in the EU Renewable Energy Directive? Strategies and policy implications. In: Energy Policy, Elsevier Volume 129, 260-267.
DiGiacomo, G., Taglieri, L., (2009). Renewable energy benefits with conversion of woody residues to pellets. In: Energy, Elsevier, Vol. 34, 724–731.
Ines, C., Guilherme, P. L., Esthera, M.G., Swantje, G., Stephen H, Lars, H. (2020). Regulatory challenges and opportunities for collective renewable energy prosumers in the EU. In: Energy Policy, Elsevier, Volume 138, 111-212.
Jurasz, J., Canales, A., Guezgouz, K.M., Beluco, (2020). A review on the complementarity of renewable energy sources: Concept, metrics, application and future research directions.In: Solar Energy, Elsevier, Volume 195, 1 703-724.
Kalogirou, S. A., (2001). Artificial neural networks in renewable energy systems applications: a review. In: Renewable and Sustainable Energy Reviews, Elsevier, Volume 5, Issue 4, 373-401.
King, R. P., Boehlje, M., Cook, M. L., Sonka, S. T., (2010). Agribusiness Economics and Management. In: American Journal of Agricultural Economics, Volume 92, Issue 2, 554–570.
Maris, S., Cernescu, L. M., Maris, S. A., Darvasi, D., & Slavici, T. (2018). Determining efficient mixtures of biomass for pellet production. In Proceedings 46th International Symposium: Actual tasks on agricultural engineering, Opatija, Croatia, 27th February-1st March 2018 (pp. 359-368). University of Zagreb, Faculty of Agriculture.

Artificial intelligence methods for sustainable agribusiness involving pellets
511
Maris, S., Slavici, T., Nenu, P., & Baciu, L. (2017). Artificial Intelligence as a Decision-making Tool in Planning the Research. BRAIN. Broad Research in Artificial Intelligence and Neuroscience, 8(3), 69-76.
Martín-Gamboa, M., Marques, P., Freire, F., Arroja, L., Diasa, A. C., (2020). Life cycle assessment of biomass pellets: A review of methodological choices and results. In: Renewable and Sustainable Energy Reviews, Elsevier, Volume 133, 110-278.
Obafemi, O., Stephen, A., Ajayi, O., Nkosinathi, M., (2019). A survey of Artificial Neural Network-based Prediction Models for Thermal Properties of Biomass. In: Procedia Manufacturing, Elsevier, Volume 33, 184-191.
Omri, A., Nguyen, D. K., (2014). On the determinants of renewable energy consumption: International evidence. In: Energy, Elsevier, Volume 72, 554-560.
Sadorsky, P., (2009). Renewable energy consumption and income in emerging economies. In: Energy Policy, Elsevier, Volume 37, Issue 10, 4021-4028.
Salim, R. A., Rafiq, S., (2012). Why do some emerging economies proactively accelerate the adoption of renewable energy?. In: Energy Economics, Elsevier, Vol. 34, 1051–1057.
Smyth, R., (2013). Are fluctuations in energy variables permanent or transitory? A survey of theliterature on the integration properties of energy consumption and production. In: Applied Energy, Elsevier, 104, 371–378.
Xia, X., Zhang, K., Xiao, H., Xiao, S., Song, Z., Yang, Z., (2019). Effects of additives and hydrothermal pretreatment on the pelleting process of rice straw: Energy consumption and pellets quality. In: Industrial Crops and Products, Elsevier, Volume 133, 178-184.
Zenobi, M. G., Lardner, H. A., Jefferson, P. G., McKinnon, J. J., (2014). Blended by-product feed pellets for backgrounding cattle. In: Canadian Journal of Animal Science, Volume 94, 533–543.


48th Symposium "Actual Tasks on Agricultural Engineering", Zagreb, Croatia, 2021
513
INNOVATIVE RESULTS CONCERNING OPTIMIZED RECIPES FOR HEAT PELLETS
Alexandra SUTA1, Ileana TOMOIAGA1, Iasmina DIMCEA1, Ștefan-Alfred MARIS1, Roxana BALINT1, Evelyne POP1, Titus SLAVICI1,2*
*E-mail of corresponding author: [email protected] 1Politehnica University of Timisoara, Romania 2Ioan Slavici University of Timisoara, Romania
ABSTRACT
As heat pellets become an increasingly popular solution for small and medium consumers, there is an urge to produce better mixtures in terms of energetic efficiency, cost and not in the least sustainability. The aim is to use mixtures of the available raw material to produce heating pellets with higher calorific value, while the emissions and are contained in preset limits.
The aim of our paper is to propose new, optimized recipes for heating pellets, based on the research activities performed in collaboration with a small pellet factory in Cenei Village. The raw material is collected from Eastern European countries (Romania, Hungary, Serbia) and the pellets are also intended to be capitalized in the same geographical area. The recipes produced experimentally at Cenei factory were analyzed in the Politehnica University and Nyiregyhaza University laboratories and the data was further processed and refined using advanced statistical methods. The results consist of improved recipes for the mixtures used in the pellet production using scientific methods of research such as factorial experiments.
The innovative character of this work is represented by a factorial experiment which led to a reduced number of tests necessary for establishing optimal values for both the calorific value and the percentage of ash. Thus, the research costs were significantly reduced.
Keywords: heat pellets, calorific value, artificial intelligence, sustainable development
INTRODUCTION
Nowadays, on a global scale, there is a general trend to use renewable energy. Climate changes, pollution and other relevant factors require a higher interest in the sustainable development of the environment.
48. ACTUAL TASKS ON AGRICULTURAL ENGINEERING
Original scientific paper

A. Suta, I. Tomoiaga, I. Dimcea, Ș.-A. Maris, R. Balint, E. Pop, T. Slavici
514
In many regions of the European Union, a relevant share of the total amount of the energy supply can be covered by pellets (DiGiacomo and Taglieri, 2009). Agriculture plays an important role in the production of heating pellets (Park et al, 2020) because of the huge potential of residual biomass as energy source (Royo et al, 2020).
A perspective of the International Energy Agency shows that until 2030 about 60% of the power capacity will come from sustainable energy sources (Peñalvo-López et al, 2019). Moreover, bioenergy is seen by the experts as the largest contributor to global renewables (Pradhan et al, 2018). This expresses a new trend towards new sources of energy embraced worldwide.
The problems that our world is facing require renewable solutions and the main challenge is to provide safe, renewable and economical fuels oriented to protect the environment (Hodges et al 2019). Raw biomass materials represent a significant source of renewable energy in the context of reducing the dependence on traditional fuel fossils (Mostafa et al, 2019).
Heating pellets are an important tool to promote renewable energy, especially towards emerging countries. Also, the raw materials used for the production of pellets play an important role (Nilsson et al, 2011).
The pellets play an important role in reducing the energy provided by fossil fuels (Smyth, 2013) and they are an important biomass in producing renewable energy (Martin-Gamboa et al, 2020). The general aim is to make a transition from the traditional use of energy to the renewable sources of energy (Maris et al, 2018).
This paper aims to analyze and establish optimized recipes for heating pellets by combining experimental research, scientific planning of experiments through factorial experiments and advanced statistical methods.
Among the objectives of the experimental research at Cenei are: - - obtaining pellets with increased calorific value while the ash content is as low as
possible (described in the current paper) - - obtaining pellets whose combustion have a minimal influence on the boilers
(minimizing the amount of sediments and corrosion) Another novelty of the work is the application of the scientific research through factorial
experiments and the usage of raw material from Hungary, Serbia and Romania.
MATERIALS AND METHODS
The experimental research took place at a factory for pellets and briquettes located in Cenei. The results obtained in this factory are comparable with similar research performed in factories from Serbia and Eastern Hungary.
For the experimental part, we analyzed 10 different recipes for pellets, each of them containing a different percentage of different raw materials. We did this experiment in order to find out which of them is the most suitable for renewable energy. The 10 recipes are made from 4 raw materials: pine sawdust, straw, energetic plant and wood chips. For the first 4 recipes, the pellets are 100% made from one raw material. The next two recipes contain two

Innovative results concerning optimized recipes for heat pellets
515
raw materials, 50% of each. The last 4 recipes of pellets contain three raw materials, each representing 33,33% of the recipe.
Figure 1 Details from the Cenei factory
While the inputs are the percentages of each biomass component to the recipe, the outputs are the calorific value of the mixture, the ash content of the mixture and a customer rating for the obtained pellets (based on 5 independent evaluations of potential buyers).
Table 1 Empiric research: recipes and results
Recipe Pine
sawdust %
Straw %
Energetic plant
%
Wood Chips
%
Q (MJ/kg)
Ash content (%,wt.c.)
Customer rating
X1 X2 X3 X4 Y1 Y2 Y3
1 100 0 0 0 19.43 0.60 2
2 0 100 0 0 17.40 5.70 3
3 0 0 100 0 18.40 2.00 1
4 0 0 0 100 15.16 1.50 2
5 50 50 0 0 18.42 3.15 2
6 0 0 50 50 16.78 1.75 1
7 33.33 33.33 33.33 0 18.41 2.77 2
8 0 33.33 33.33 33.33 16.98 3.07 2
9 33.33 0 33.33 33.33 17.66 1.37 1
10 33.33 33.33 0 33.33 17.33 2.60 2
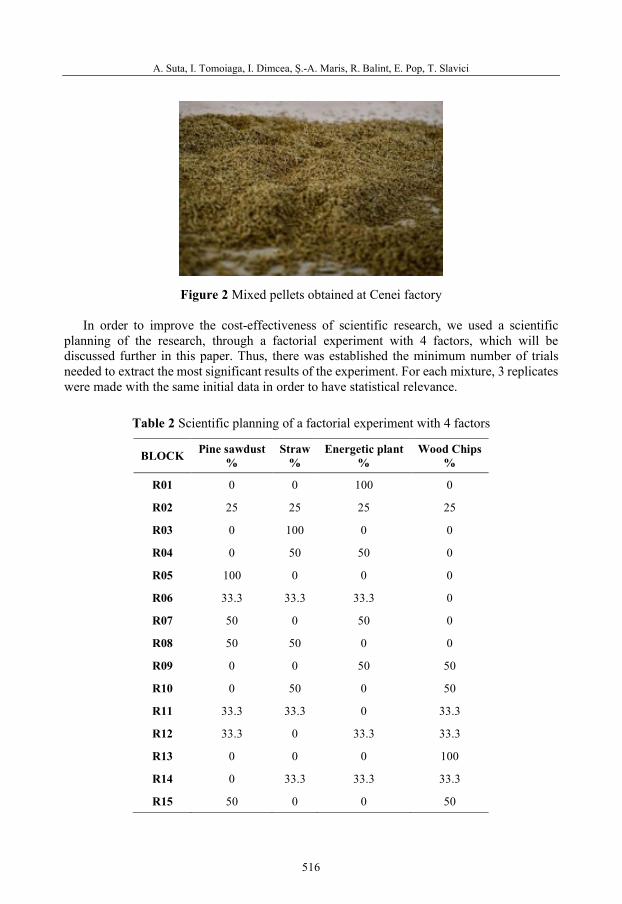
A. Suta, I. Tomoiaga, I. Dimcea, Ș.-A. Maris, R. Balint, E. Pop, T. Slavici
516
Figure 2 Mixed pellets obtained at Cenei factory
In order to improve the cost-effectiveness of scientific research, we used a scientific planning of the research, through a factorial experiment with 4 factors, which will be discussed further in this paper. Thus, there was established the minimum number of trials needed to extract the most significant results of the experiment. For each mixture, 3 replicates were made with the same initial data in order to have statistical relevance.
Table 2 Scientific planning of a factorial experiment with 4 factors
BLOCK Pine sawdust %
Straw %
Energetic plant %
Wood Chips %
R01 0 0 100 0
R02 25 25 25 25
R03 0 100 0 0
R04 0 50 50 0
R05 100 0 0 0
R06 33.3 33.3 33.3 0
R07 50 0 50 0
R08 50 50 0 0
R09 0 0 50 50
R10 0 50 0 50
R11 33.3 33.3 0 33.3
R12 33.3 0 33.3 33.3
R13 0 0 0 100
R14 0 33.3 33.3 33.3
R15 50 0 0 50

Innovative results concerning optimized recipes for heat pellets
517
Figure 3 Details from the thermo-technics laboratory at the Politehnica University.
RESULTS AND DISCUSSION
In order to analyze the data, measurements were made at the thermo-technics laboratory at the Politehnica University of Timisoara.
As opposed to the empirical research, the scientific research was performed following the principles of scientific planning of and factorial experiments.
Table 3 Results for the factorial experiment
Recipe Pine
sawdust %
Straw %
Willow %
Wood Chips
%
Q (MJ/kg)
Ash content
(%,wt. c.)
Customer rating
R01 0 0 100 0 18.40 2.00 1
R02 25 25 25 25 17.60 2.45 2
R03 0 100 0 0 17.40 5.70 3
R04 0 50 50 0 17.90 3.85 2
R05 100 0 0 0 19.43 0.60 1
R06 33.3 33.3 33 0 18.39 2.76 2
R07 50 0 50 0 18.92 1.30 1
R08 50 50 0 0 18.42 3.15 3
R09 0 0 50 50 16.78 1.75 2
R10 0 50 0 50 16.28 3.60 3
R11 33.3 33.3 0 33.3 17.31 2.60 2
R12 33.3 0 33.3 33.3 17.65 1.37 1
R13 0 0 0 100 15.16 1.50 2
R14 0 33.3 33.3 33.3 16.97 3.06 3
R15 50 0 0 50 17.30 1.05 2

A. Suta, I. Tomoiaga, I. Dimcea, Ș.-A. Maris, R. Balint, E. Pop, T. Slavici
518
Based on the data obtained and detailed in Table 2, we computed linear regressions for the calorific value (Q) and ash content (ash).
The condition is that the quantities of raw materials are expressed as percentages (i.e. the sum of the components should amount 100).
We obtained the following linear multi-regression equation for the calorific value: Q = 11,3527 + 0,0808024*pine_sawdust + 0,0604631*straw +
+ 0,0704774*energetic_plant + 0,0380316*wood_chips
Where the dependent variables are expressed as percentages (out of 100) and the independendent variable is expressed in MJ/kg. The corresponding P-value in the ANOVA table is less than 0,05, hence there is a statistically significant relationship between the variables at the 95,0% confidence level.
The R-Squared statistic indicates that the model as fitted explains 99,9971% of the variability in Q. The adjusted R-squared statistic is 99,9959%. The standard error of the estimate shows the standard deviation of the residuals to be 0,00686475. The mean absolute error (MAE) of 0,00439691 is the average value of the residuals.
We obtained the following linear multi-regression equation for the ash content: Ash = 0,606284 - 0,0000523008*pine_sawdust + 0,0509305*straw +
+ 0,0139349*energetic_plant + 0,00893968*wood_chips
Where the dependent variables are expressed as percentages (out of 100) and the independendent variable is expressed in %,wt. cont. The corresponding P-value in the ANOVA table is less than 0,05, hence there is a statistically significant relationship between the variables at the 95,0% confidence level. The R-Squared statistic indicates that the model as fitted explains 99,9999% of the variability in ash.
The adjusted R-squared statistic, which is more suitable for comparing models with different numbers of independent variables, is 99,9998%. The standard error of the estimate shows the standard deviation of the residuals to be 0,00189105. This value can be used to construct prediction limits for new observations by selecting the Reports option from the text menu. The mean absolute error (MAE) of 0,00094068 is the average value of the residuals.
CONCLUSIONS
Our study provides coherent information regarding the trend in the pellets market and also in the renewable energy sector. This information provided is specific for Eastern Europe and other countries with a similar climate. Moreover, our study offers a database containing information about previous experience in similar conditions and the optimal structure of the recipe for obtaining the maximum caloric power. Certain products such as straw that affect heating plants have been eliminated due to massive deposits and corrosion of boiler components.
As future work, we plan to continue and expand the research, in order to further optimize the recipes and also to optimize the structure of the technological manufacturing line.
Finally, this article increases the actual knowledge with information corresponding to a previously not investigated context: the outcome of several types of energetic crops in a specific geo-climatic area.

Innovative results concerning optimized recipes for heat pellets
519
REFERENCES
Azadeh, A., Babazadeh, R., Asadzadeh, S.M., (2013). Optimum estimation and forecasting of renewable energy consumption by artificial neural networks. In: Renewable and Sustainable Energy Reviews, Elsevier, Volume 27, 605-612.
Darvasi, D., Dorneanu, L., Badescu, A., Untaru, M., Slavici, T., (2011). Sisteme expert si retele neuronale in economie si tehnica, Timisoara.
DiGiacomo, G., Taglieri, L., (2009) Renewable energy benefits with conversion of woody residues to pellets. In: Energy, Elsevier, Vol. 34, 724–731.
García, R., Gil, M.V., Rubiera, F., Pevida, C. (2019). Pelletization of wood and alternative residual biomass blends for producing industrial quality pellets. In: Fuel, Elsevier, Volume 251, 739-753.
Hodges, D. G., Chapagain, B., Watcharaanantapong, P., Poudyal, N. C., Kline, K. L., Dale, V. H., (2019). Opportunities and attitudes of private forest landowners in supplying woody biomass for renewable energy. In: Renewable and Sustainable Energy Reviews, Elsevier, Volume 113, 109-205.
Kalogirou, S. A, (2000). Applications of artificial neural-networks for energy systems. In: Applied Energy, Elsevier, Volume 67, Issues 1–2, 17-35.
Karkania, V.,Fanara, E., Zabaniotou, A. (2012). Review of sustainable biomass pellets production – A study for agricultural residues pellets’ market in Greece. In: Renewable and Sustainable Energy Reviews, Elsevier, Volume 16, Issue 3, 1426-1436.
Maris, S., Cernescu, L. M., Maris, S. A., Darvasi, D., & Slavici, T. (2018). Determining efficient mixtures of biomass for pellet production. In Proceedings 46th International Symposium: Actual tasks on agricultural engineering, Opatija, Croatia, 27th February-1st March, 2018 (pp. 359-368). University of Zagreb, Faculty of Agriculture
Martín-Gamboa, M., Marques, P., Freire, F., Arroja, L., Diasa, A.C., (2020). Life cycle assessment of biomass pellets: A review of methodological choices and results. In: Renewable and Sustainable Energy Reviews Volume 133, 110-278.
Mostafa, M. E., Hu, S., Wang, Y., Su, S., Hu, X., Elsayed, S. A., Xiang, J., (2019). The significance of pelletization operating conditions: An analysis of physical and mechanical characteristics as well as energy consumption of biomass pellets. In: Renewable and Sustainable Energy Reviews, Elsevier, Volume 105, 332-348.
Nilsson, D. Bernesson, S., Hansson P.A., (2011). Pellet production from agricultural raw materials – A systems study. In: Biomass and Bioenergy, Elsevier, Volume 35, Issue 1, 679-689.
Park, S., Kim, S. J., Oh, K. C., Cho, L., Kim, M. J., Jeong, I. S., Lee, C. G., Kim, D. H., (2020). Investigation of agro-byproduct pellet properties and improvement in pellet quality through mixing. In: Energy, Elsevier, Vol. 190, 116-380.
Peñalvo-López, E., Pérez-Navarro, A. , Hurtado, E., Cárcel-Carrasco, F. J., (2019). Comprehensive Methodology for Sustainable Power Supply in Emerging Countries. In: Sustainability,MDPI, Volume 11, 53-98.
Pradhan, P., Mahajani, S.M., Arora, A., (2018). Production and utilization of fuel pellets from biomass: A review. In: Fuel Processing Technology, Elsevier, Volume 181, 215-232.
Royo, J., Canalís, P., Quintana, D., (2020). Chemical study of fly ash deposition in combustion of pelletized residual agricultural biomass. In: Fuel, Elsevier, Volume 268, 117-228.
Smyth, R., (2013). Are fluctuations in energy variables permanent or transitory? A survey of the literature on the integration properties of energy consumption and production. In: Applied Energy, Elsevier, Volume 104, 371–378.

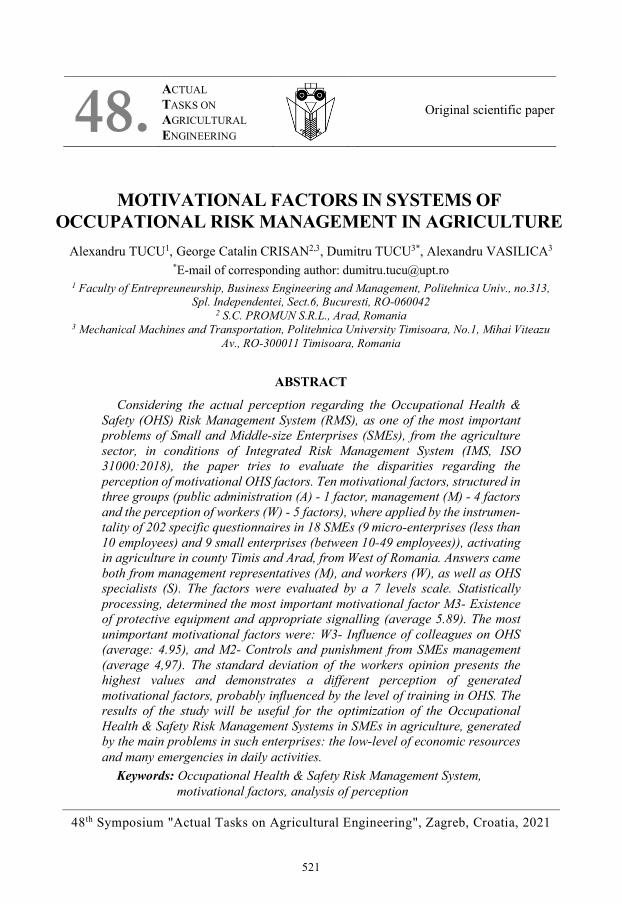
48th Symposium "Actual Tasks on Agricultural Engineering", Zagreb, Croatia, 2021
521
MOTIVATIONAL FACTORS IN SYSTEMS OF OCCUPATIONAL RISK MANAGEMENT IN AGRICULTURE
Alexandru TUCU1, George Catalin CRISAN2,3, Dumitru TUCU3*, Alexandru VASILICA3
*E-mail of corresponding author: [email protected] 1 Faculty of Entrepreuneurship, Business Engineering and Management, Politehnica Univ., no.313,
Spl. Independentei, Sect.6, Bucuresti, RO-060042 2 S.C. PROMUN S.R.L., Arad, Romania
3 Mechanical Machines and Transportation, Politehnica University Timisoara, No.1, Mihai Viteazu Av., RO-300011 Timisoara, Romania
ABSTRACT
Considering the actual perception regarding the Occupational Health & Safety (OHS) Risk Management System (RMS), as one of the most important problems of Small and Middle-size Enterprises (SMEs), from the agriculture sector, in conditions of Integrated Risk Management System (IMS, ISO 31000:2018), the paper tries to evaluate the disparities regarding the perception of motivational OHS factors. Ten motivational factors, structured in three groups (public administration (A) - 1 factor, management (M) - 4 factors and the perception of workers (W) - 5 factors), where applied by the instrumen-tality of 202 specific questionnaires in 18 SMEs (9 micro-enterprises (less than 10 employees) and 9 small enterprises (between 10-49 employees)), activating in agriculture in county Timis and Arad, from West of Romania. Answers came both from management representatives (M), and workers (W), as well as OHS specialists (S). The factors were evaluated by a 7 levels scale. Statistically processing, determined the most important motivational factor M3- Existence of protective equipment and appropriate signalling (average 5.89). The most unimportant motivational factors were: W3- Influence of colleagues on OHS (average: 4.95), and M2- Controls and punishment from SMEs management (average 4,97). The standard deviation of the workers opinion presents the highest values and demonstrates a different perception of generated motivational factors, probably influenced by the level of training in OHS. The results of the study will be useful for the optimization of the Occupational Health & Safety Risk Management Systems in SMEs in agriculture, generated by the main problems in such enterprises: the low-level of economic resources and many emergencies in daily activities.
Keywords: Occupational Health & Safety Risk Management System, motivational factors, analysis of perception
48. ACTUAL TASKS ON AGRICULTURAL ENGINEERING
Original scientific paper

A. Tucu, G. C. Crisan, D. Tucu, A. Vasilica
522
Figure 1 Methodological steps
Step 1
•Establishing of main questions
Step 2
•Making of questionnaires
Step 3
• Training and distribution of the questionnaires in SMEs in Agriculture: M, W, S
Step 4
•Collecting of answers
Step 5
•Analyse of results
Step 6
•Proposing of measures. Improvement
INTRODUCTION
Optimization of the Occupational Health & Safety Risk Management Systems (OHSRMS), in SMEs in agriculture supposes, firstly the compliance with law and standard regulation.
The perception regarding risk factors, responsibilities, mission, objectives, and performance of OHSRMS, etc. is different, according with the field of activities (Gusetoiu and Tucu, 2012; Gusetoiu and Tucu, 2013; Tucu et al., 2019), and the structure and functions of OHSRMS (Tremblay and Badri, 2018; Darabont et al., 2018; Crisan et al., 2017). Such perception could be the main link between the structure of OHSRMS and achieving of best results, according to ISO 45001-Occupational Health & Safety Risk Management Systems, by monitoring, measuring, and analysing (Brocal et al., 2018; ISO, 2018). Also, in the last decade, has been increased the attention dedicated to evaluation and monitoring of early deviations through appropriate of risk indicators, as a way to assess and control risk (Paltrinieri and Reniers, 2017), involving of the risk perception. Few studies examined the mediating effect of other specific motivation factors, as implicit factors, that inspire individual performance or the moving role of emotions that move workers to goal achievement, while motives shape the desires and actions (Deng et al., 2019). Another important factor in influence motivation that shapes and maintains a high level of occupational safety in production processes could be communication, by its cognitive and emotional aspects (Sadlowska-Wrzesinska, 2020).
The paper aims to evaluate the disparities regarding the perception of motivational factors regarding OHS, in conditions specific SME’s in agriculture: the low-level of economic resources and many emergencies in daily activities.
MATERIAL AND METHODS
The methodological steps are presented in figure 1 (source: authors).

Motivational factors in systems of occupational risk management in agriculture
523
For questionnaire, 10 factors were selected, and the evaluator must evaluate each factor on 7 levels scale in OHS motivation, according to correspondences: 1 - indifferent; 2 - almost unimportant; 3 - a little unimportant; 4 - important; 5 - quite important; 6 - very important; 7 - of maximal importance. The proposed factors for ranking and their coding are presented in table 1.
202 questionnaires were distributed in 18 accessible SMEs with activity in agriculture in county Timis and Arad, from West of Romania (9 micro-enterprises (less than 10 employees) and 9 small enterprises (between 10-49 employees)), at 156 workers (“W”), 28 representatives from management (“M”), and 18 OHS specialists (“S”). The questionnaire’s results were processed statistically using Microsoft Excel 2016 and STATGRAPHICS Centurion. Were calculated, on each category, the total amount (“Sum”), average and standard deviation P (“St.Dev.”). The results were analysed on each category of the respondent (M, W, S), and global, for all 202.
Table 1 The proposed factors for ranking and their coding
Code Factor
A1 Controls from I.T.M. (Territorial Work Inspectorate)
M1 Financial incentives granted by the company
M2 Controls and sanctions from the company's management
M3 Existence of protective equipment and appropriate signalling
M4 Periodic assessment of OHS knowledge
W1 Fear of accidents at work
W2 Comfort of work activities
W3 The influence of colleagues related to work safety
W4 The usefulness of trainings and other examples of good practice
W5 Importance of OHS in increasing labour productivity
RESULTS AND DISCUSSION
Table 2 presents simultaneously the synthesis of the results from statistical analysis regarding global values for all 202 questionnaires (noted T), and for each category of respondents (respective: M, W, S).
In figure 2 is presented the histogram of global quotation average on each approach factor, the evolution of standard deviation P and, on each, the corresponding error bar.
Figure 3, 4 and 5 presents the relations between the weight of participants on criteria and the value of grades average („series 1”), and the evolution of standard deviation P („series 2”), respectively for specialists (S), workers (W) and management (M). The trend of relationship was also represented using the regression for a 4-grade polynomial function („poly”).

A. Tucu, G. C. Crisan, D. Tucu, A. Vasilica
524
Table 2 Synthesis of the results from statistical analysis
Cat
egor
y
Stat
istic
A1 M1 M2 M3 M4 W1 W2 W3 W4 W5 Sum
Ave
rage
M Sum M 108 90 91 116 107 103 117 93 111 105 1041 104.1
Average M 6 5 5.05 6.44 5.94 5.72 6.5 5.17 6.17 5.83 54.67 5.78 St.Dev. M 1.45 2.24 2.25 0.5 1.27 1.66 0.60 1.61 1.21 1.5 8.12 1.43
W Sum W 761 898 794 901 773 802 897 759 813 862 8260 826
Average W 4.88 5.76 5.09 5.77 4.95 5.14 5.75 4.86 5.21 5.52 52.95 5.29 St.Dev. W 1.99 1.45 1.42 1.38 1.87 1.98 1.33 1.86 1.58 1.7 11.67 1.66
S Sum S 109 98 87 111 101 109 119 92 110 102 1038 103.8
Average S 6.05 5.44 4.83 6.17 5.61 6.05 6.61 5.11 6.11 5.67 57.67 5.77 St.Dev. S 1.22 1.98 1.86 0.9 1.11 1.87 0.49 1.1 0.81 1.1 4.94 1.24
Total Sum T 1011 1113 998 1184 1031 1046 1186 994 1091 1120 10774 1077,4
Average T 5.03 5.54 4.96 5.89 5.13 5.20 5.90 4.94 5.43 5.57 5.36 0.34 St.Dev. T 1.93 1.69 1.62 1.29 1.78 2.01 1.25 1.76 1.53 1.61 1.65 0.23
The analysis of presented results demonstrates high dispersions of opinions in every group,
the greatest values in case of workers (average of St.Dev.P,W=1,66), the lowest value in case of specialists (average of St.Dev., P,S=1,24), and average of St.Dev., P,M=1,43 for management. The analysis of relationship between the weight of participants and the value of grades average demonstrated there is not a correlation by regression (R2 had values between
Figure 2 Global quotation average on each approach factor
Figure 3 Influence of specialists opinion
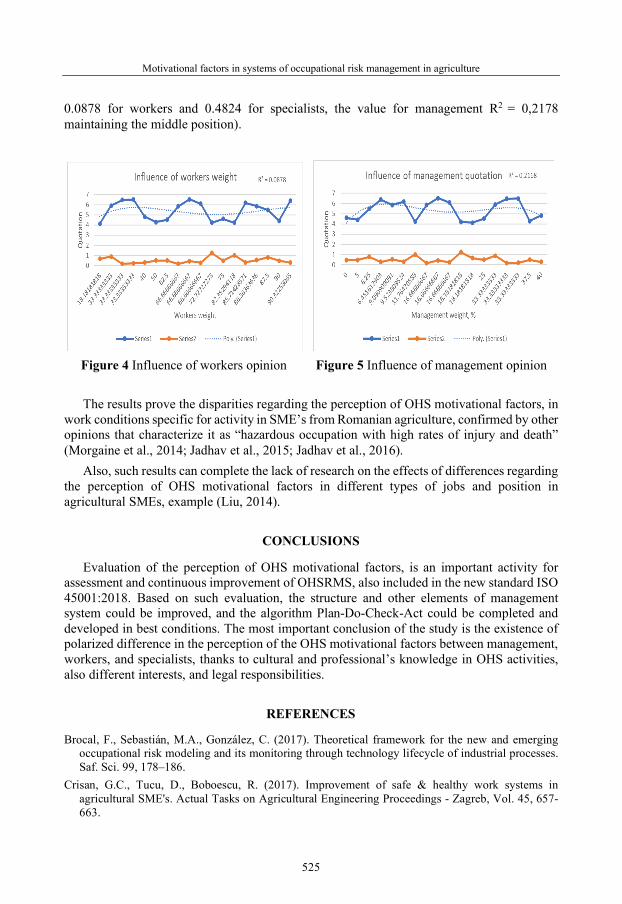
Motivational factors in systems of occupational risk management in agriculture
525
0.0878 for workers and 0.4824 for specialists, the value for management R2 = 0,2178 maintaining the middle position).
The results prove the disparities regarding the perception of OHS motivational factors, in
work conditions specific for activity in SME’s from Romanian agriculture, confirmed by other opinions that characterize it as “hazardous occupation with high rates of injury and death” (Morgaine et al., 2014; Jadhav et al., 2015; Jadhav et al., 2016).
Also, such results can complete the lack of research on the effects of differences regarding the perception of OHS motivational factors in different types of jobs and position in agricultural SMEs, example (Liu, 2014).
CONCLUSIONS
Evaluation of the perception of OHS motivational factors, is an important activity for assessment and continuous improvement of OHSRMS, also included in the new standard ISO 45001:2018. Based on such evaluation, the structure and other elements of management system could be improved, and the algorithm Plan-Do-Check-Act could be completed and developed in best conditions. The most important conclusion of the study is the existence of polarized difference in the perception of the OHS motivational factors between management, workers, and specialists, thanks to cultural and professional’s knowledge in OHS activities, also different interests, and legal responsibilities.
REFERENCES
Brocal, F., Sebastián, M.A., González, C. (2017). Theoretical framework for the new and emerging occupational risk modeling and its monitoring through technology lifecycle of industrial processes. Saf. Sci. 99, 178–186.
Crisan, G.C., Tucu, D., Boboescu, R. (2017). Improvement of safe & healthy work systems in agricultural SME's. Actual Tasks on Agricultural Engineering Proceedings - Zagreb, Vol. 45, 657-663.
Figure 4 Influence of workers opinion Figure 5 Influence of management opinion

A. Tucu, G. C. Crisan, D. Tucu, A. Vasilica
526
Darabont, D.C., Bejinariu, C., Ionita I., Bernevig-Sava M.A., Baciu C., Baciu E.R. (2018). Considerations on improving occupational health and safety performance in companies using ISO 45001 Standard. Environmental Engineering and Management Journal, Vol.17, No. 11, 2711-2718.
Deng, J., Guo, Y., Ma, T.,Yang, T., Tian, X. (2019). How job stress influences job performance among Chinese healthcare workers: a cross-sectional study. In: Environmental Health and Preventive Medicine, 24:2, https://doi.org/10.1186/s12199-018-0758-4, (accessed September 2020)
Gusetoiu, I.R., Tucu, D. (2012). Influence of occupational stress in jobs in the field of nanomaterials. In: Tanger Ltd. Conference: 4th International Conference on NANOCON, Brno, Czech Republic, 531-536.
Gusetoiu, I.R., Tucu, D. (2013). Stress risk in management systems in metallurgical problems. In: Tanger Ltd. Conference: 22nd International Conference on Metallurgy and Materials (METAL), Brno, Czech Republic, 1904-1908.
Jadhav, R., Achutan, C., Haynatzki, G., Rajaram, S., Rautiainen, R. (2015). Risk factors for agricultural injury: a systematic review and meta-analysis. In: J. Agromed. 20, 434–449.
Jadhav, R., Achutan, C., Haynatzki, G., Rajaram, S., Rautiainen, R. (2016). Review and meta-analysis of emerging risk factors for agricultural injury. J. Agromed. 21, 284–297.
Liu B, Yang K, Yu W. (2014). Work-related stressors and health-related outcomes in public service: examining the role of PSM. In: Am Rev Public Adm., Vol.: 3:1, 24.
Morgaine, K.C., Langley J.D., McGee, R.O., Gray, A.R. (2014). Impact evaluation of a farm-safety awareness workshop in New Zealand. Scandinavian Journal of Work Environment & Health, Vol.40, Iss. 6, 649-653.
Sadlowska-Wrzesinska, J. (2020). Cognitive and Emotional-Motivational Aspects of Communication to Improve Work Safety in Production Processes: Case Study. In: Karwowski, W; Trzcielinski, S; Mrugalska, B, Advances in Intelligent Systems and Computing, Vol. 971, 340-349.
Tremblay, A., Badri, A. (2018). Assessment of occupational health and safety performance evaluation tools: state of the art and challenges for small and medium-sized enterprises. Safety Science, No.101, 260–267.
Tucu, D., Crisan, G.C., Tucu, A. (2019). The use of self-assessment in occupational risk management system in SMEs from agriculture. Actual Tasks On Agricultural Engineering. Proceedings - Zagreb, vol.47, 479-485.
* * *, ISO. (2018). ISO 45001:2018, Occupational health and safety management systems - Requirements with guidance for use. https://www.iso.org/iso-45001-occupational-health-and-safety.html, (accessed September 2020)

48th Symposium "Actual Tasks on Agricultural Engineering", Zagreb, Croatia, 2021
527
QUALITY EVALUATION OF OCCUPATIONAL HEALTH & SAFETY (OHS) RISK MANAGEMENT SYSTEMS
FROM AGRICULTURE Alexandru TUCU1, Anca-Alexandra PURCAREA1, George Catalin CRISAN2,3,
Alexandru VASILICA3, Dumitru TUCU3* *E-mail of corresponding author: [email protected]
1 Faculty of Entrepreuneurship, Business Engineering and Management, Politehnica Universiti Bucuresti, no.313, Spl. Independentei, Sect.6, Bucuresti, RO-060042
2 S.C. PROMUN S.R.L., Arad, Romania 3 Mechanical Machines and Transportation, Politehnica University Timisoara, No.1,
Mihai Viteazu Av., RO-300011 Timisoara, Romania
ABSTRACT
The paper proposes a model applicable for analysis and ranking of the quality of Occupational Health & Safety (OHS) Risk Management Systems (RMS) for Small and Middle-size Enterprises (SMEs) in agriculture. Such model must be simple and efficient, correlated with risk factors and dynamic evolution, using measurable, cost-effective indicators. The proposed original model consists of key performance factors/indicators (KPF/I), involved in implementation and sustainability, by considering the elements of OHSRMS. The KPF/Is were selected according to effect of hazard on workers, equipment, environment, impact on competitiveness and economic performance, for SMEs in the field of agricultural activity, and for local rural communities. The proposed model appreciates the pro-active attitude of SMEs and consists in the use of 38 pondered KPI. The KPI are divided in 5 sections: OHS policy (7 indicators with maximum cumulated group value 10); OHS plan (7 indicators/ maximum group value 10); implementation and operation (11 indicators/ maximum group value 11); OHS checking (10 indicators/ maximum group value 11); control of management (3 indicators/ maximum group value 4). For the homogenization of groups, the score achieved from each group will be divided by the corresponding maximum possible score of the group “I”, resulting the group index of performance. The SMEs general performance index will be calculated as an average of each 5 groups indexes of performance. The index will be used in rating the levels of capability maturity model (CMM), or other levels could be used, and for qualitative analysis of OH&SRMS for identification of the weaknesses or other feasible measures and actions. It is
48. ACTUAL TASKS ON AGRICULTURAL ENGINEERING
Original scientific paper

A. Tucu, A.-A. Purcarea, G. C. Crisan, A. Vasilica, D. Tucu
528
possible to transpose the model into Excel and use it for qualification and rapid diagnosis of OHSRMS implemented in any SME in agriculture.
Keywords: Occupational Health & Safety Risk Management Systems, SME in agriculture, Key Performance Indicators
INTRODUCTION
In the last years many OHS management systems were developed according to adoption and dissemination at international level of different guides and normative documents.
Most relevant examples (International Labour Organization guidelines good practices in labour inspection in the rural sector (ILO, 2012), Guidelines on occupational safety and health management systems (ILO-OSH:2001), (ILO, 2009), BS OHSAS 18001 (updated in 2007, and converted in ISO OHSAS 18001:2007), (BSI, 2007), ISO 45001:2018 (ISO, 2018), etc.), could generate recommended requirements for designing, implementation and improvement (not mandatory by law), of OHS management systems (Podgorki, 2015). Such interests came from considering the workers as the most valuable resource of the company, so each employer must pay a special attention to OHS issues (Darabont et al., 2018). A few dimensions are essential for such objective:
- Evaluation of workers perception in different fields and activities, especially new technology, heavy industry and agriculture (Gusetoiu and Tucu, 2012; Gusetoiu and Tucu, 2013; Tucu et al., 2019);
- Improvement of OHS management systems evaluation by using new tools specific to SMEs (Tremblay and Badri, 2018a), also in agriculture (Crisan et al., 2017).
A lack of information about evaluation of improvement performance and associated factors are confirmed in literature (Tremblay and Badri, 2018a, b), and there are several reasons why OHS performance is weaker in SMEs than in large companies, especially in agriculture.
The aim of the paper is to design a new tool for the evaluation of OHS management systems performance based on KPI, adapted to SMEs from agriculture.
METHODS
Based on principal structure of elements, as defined in ILO-OSH: 2001 (ILO, 2009), and ISO 45001:2018 (ISO, 2018), the main base relationships between elements, objectives and advantages were identified.
The start of present methodology implies three approaches: result-based approach, compliance-based approach, and process-based approach, according to Cambon et al., 2005.
A structural OHSRMS model according to the legislation of Romania (translated from EU), was elaborated and three specific fields were separated: legislative (mandatory), legal consequences (accreditation regulations, not mandatory) and strategical (specific to organization).

Quality evaluation of occupational health & safety (OHS) risk management systems from agriculture
529
For OHSRMS evaluation and improvement both processual and systemic approach must be considered, without omissions and `direct import` of models from other organizations (possibility to develop OHSRMS which does not comply with the reality from the destination organization, thus unworkable). Also, the ISO standards must be considered structured on processual approach. Another important step was establishing key success factors hierarchy and elements for increasing the integration of OHSRMS with other specific management systems (quality, environment, financial risk, information’s security, etc.), in cycle’s steps: design, implementation, accreditation and improvement, giving priority to proactive attitude.
Starting from the need for a comprehensive and appropriate approach, in terms of information provided to the evaluation of the quality of OHSRMS, on the basis of reactive and key indicators, the proposed method allows the development of specific performance criteria for OHSRMS, both on their evaluation and comparisons between such management systems, whether they are certified or not.
The methodological steps for design of the evaluation method are presented in figure 1.
Figure 1 Methodological steps for design of the evaluation method
The proposed KPIs (as independent variables), were selected from literature (Podgórski,
2015; Kaassis and Badri, 2018; Goncalves et al., 2012, Mohammadfam et al., 2016). Also, the effect of hazard on workers, equipment, environment, impact on competitiveness and economic performance, were considered both for SMEs in the field of agricultural activity and local rural communities.
Step 1•Analysis of actual stage (literature & experts review)
Step 2•Selection of KPI and packages proposed
Step 3•Discussions in SMEs in Agriculture
Step 4•Consulting OHS specialist
Step 5•Establishing of KPI index of influence
Step 6 •Validation of method
Step 7•Improvement
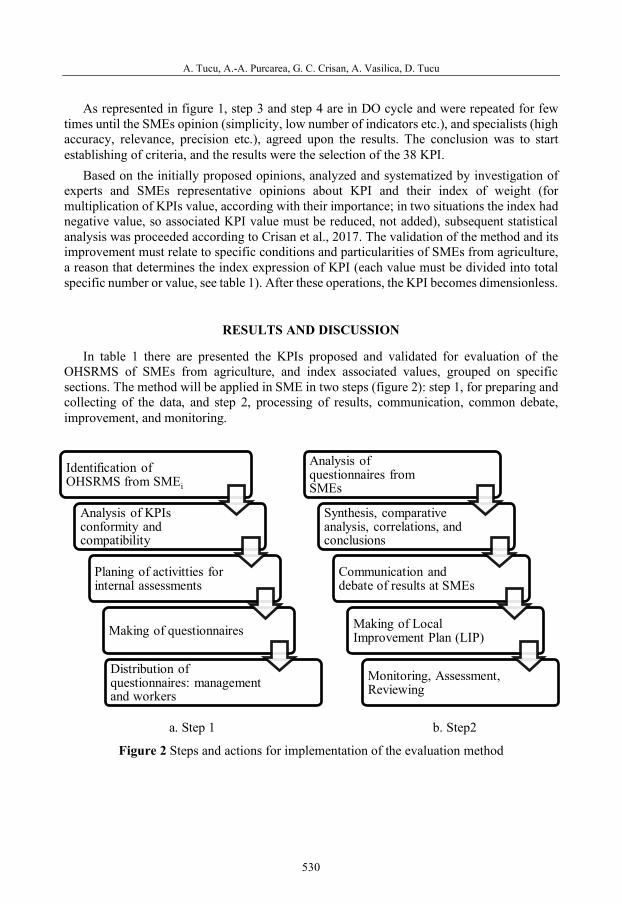
A. Tucu, A.-A. Purcarea, G. C. Crisan, A. Vasilica, D. Tucu
530
As represented in figure 1, step 3 and step 4 are in DO cycle and were repeated for few times until the SMEs opinion (simplicity, low number of indicators etc.), and specialists (high accuracy, relevance, precision etc.), agreed upon the results. The conclusion was to start establishing of criteria, and the results were the selection of the 38 KPI.
Based on the initially proposed opinions, analyzed and systematized by investigation of experts and SMEs representative opinions about KPI and their index of weight (for multiplication of KPIs value, according with their importance; in two situations the index had negative value, so associated KPI value must be reduced, not added), subsequent statistical analysis was proceeded according to Crisan et al., 2017. The validation of the method and its improvement must relate to specific conditions and particularities of SMEs from agriculture, a reason that determines the index expression of KPI (each value must be divided into total specific number or value, see table 1). After these operations, the KPI becomes dimensionless.
RESULTS AND DISCUSSION
In table 1 there are presented the KPIs proposed and validated for evaluation of the OHSRMS of SMEs from agriculture, and index associated values, grouped on specific sections. The method will be applied in SME in two steps (figure 2): step 1, for preparing and collecting of the data, and step 2, processing of results, communication, common debate, improvement, and monitoring.
a. Step 1 b. Step2
Figure 2 Steps and actions for implementation of the evaluation method
Identification of OHSRMS from SMEi
Analysis of KPIs conformity andcompatibility
Planing of activitties for internal assessments
Making of questionnaires
Distribution of questionnaires: management and workers
Analysis of questionnaires from SMEs
Synthesis, comparative analysis, correlations, and conclusions
Communication and debate of results at SMEs
Making of Local Improvement Plan (LIP)
Monitoring, Assessment, Reviewing

Quality evaluation of occupational health & safety (OHS) risk management systems from agriculture
531
Table 1 Groups and associated KPI
Group KPI Code Index
1. O
HS
Polic
ies
Number of OHS meetings with top management/Number of OHS meetings K 1.1 1 Percentage of workers informed about OHS policies/100 K 1.2 2 Number of yearly updated OHS policies/ Number of OHS policies K 1.3 1 Percentage of applied rules and standards in OHS/100 K 1.4 2 Number of risks reported by workers/Number of total risks reported K 1.5 2 Number of workers who understand policies/Total number of workers K 1.6 1 Number of risk assessment per year /number of workers K 1.7 1
2. O
HS
Plan
ning
Number of assessment reports with worker’s involving/Number of reports K 2.1 2 Number of incentives allocated to workers for risk reporting/Total reported K 2.2 2 Number of departments to which there are OHS reports and records/Total K 2.3 1 Number of actualized risk assessments per year/No. total risk assessments K 2.4 1 No. of OHS programs with well-defined period/Total number of programs K 2.5 1 Number of OHS events for workers/Total number of OHS events K 2.6 1 Financial resources yearly allocated for OHS/Total allocated resources K 2.7 2
3. Im
plem
enta
tion
And
Ope
ratio
n
Number of OHS training hours per year/Total training hours per year K 3.1 2 Number of jobs with risk assessment and measures/ Number of jobs K 3.2 1 Number of OHS edited bulletins, newsletters etc./ Total number K 3.3 1 Number of incidents due to a lack of procedure/ Total number of incidents K 3.4 -1 No. of rewards for workers for participating in OHS/Number of rewards K 3.5 1 Number of tasks that have OHS procedures/ Total number of tasks K 3.6 1 Number of trainings for emergency response procedures/No. of trainings K 3.7 1 Number of emergency response drills performed/Number total of drills K 3.8 1 Number of jobs with emergency response procedures/ Number of jobs K 3.9 1 Number of verified OHS procedures for purchase or use/Total number K 3.10 1 Number of units with OHS reporting system/Total number of units K 3.11 1
4. O
HS
Che
ckin
g
Number of units that evaluated OHS performance/Number of units K 4.1 1 Number of penalties for OHS violations/Number of OHS violations K 4.2 1 Number of units with OHS reporting systems/Number of units K 4.2 1 No. of meetings with workers on OHS audit/ No. of meetings with workers K 4.4 2 Number of reviewed audits/Number of audits K 4.5 1 No. of accidents investigated together with workers/No. of accidents K 4.6 1 Number of OHS audits with determined period/Number of OHS audits K 4.7 1 Number of trainings for accidents investigation/Number of trainings K 4.8 1 Number of accidents investigation reports sent to units/No. of accidents K 4.9 1 No. of meetings dedicated to corrective measures/ Number of meetings K 4.10 1 Number of restructured/rescheduled OHS meetings/Number of meetings K 5.1 -1 Number of SSO performance reports sent from the units/Number of units K 5.2 2 Number of OHS continuous improvement proposals/Number of proposals K 5.3 2

A. Tucu, A.-A. Purcarea, G. C. Crisan, A. Vasilica, D. Tucu
532
The SMEs general index, (I), will be calculated as an average of each 5 groups index performance, (Ipg), (Ipg is calculated by dividing the sum of measured indexes, (Ii) at sum of maximum possible value of each indexes, (IMi)):
𝐼𝐼 =∑ 𝐼𝐼𝐼𝐼𝐼𝐼𝐼𝐼
5=∑ ∑ 𝐼𝐼𝐼𝐼∑ 𝐼𝐼𝑀𝑀𝑀𝑀5
The index I will be used in rating the levels of capability maturity model (CMM), or other levels could be used, and for qualitative analysis of OH&SRMS for identification of the weaknesses or other feasible measures and actions
The added value of present method consists in the capacity to use a low number of resources, to be adapted to SME’s specifically, and to be, relatively, independent of SMEs dimensions.
All the other mentioned methods presented in previous papers (Podgórski, 2015; Kaassis and Badri, 2018; Goncalves et al., 2012, Mohammadfam et al., 2016), used in safety performance measurement, introduce a strong influence of enterprise’s dimensions. The proposing of the presented method, to use the relative KPI (relative to main base), and to correlate KPIs to positive and negative indexes, makes the data normalization and allows an independent assessment of OHSRMS, regardless of the dimensions of SME.
CONCLUSIONS
The OHSRMS performance measurement is an essential activity for occupational risk management systems, since it provides information about the performance of those systems, with the aim of supporting decision-making on safety issues. Most enterprises and state responsible apply traditional approaches to measure the OHS performance, based on the statistical analysis of a few indicators, such as number of injuries, accident rates, accident costs and damages, associated to poor performance (so-called reactive monitoring). One the other hand, companies (especially in agriculture) choose easy-to-have indicators that facilitate benchmarking with other organizations or that provide results in the short-term, that do not support decision-making related to the company strategies and to critical processes, in condition of digitalization demands. In such conditions the proposed method offer a fast, simple, efficient, and effective method, focused on particular aspects of SMEs from agriculture, in a pro-active manner, according with new ISO 45001 standard, and ensuring the continuous improvement and total quality management of OHSRMS. The proposed methods are insensitive at SME dimensions and accreditation of OHSRMS. Also, such method could be transposed into Office Excel or other big data algorithm (if necessary, according with SME dimensions), and used for qualification and rapid diagnosis of OHSRMS implemented in any SME in agriculture. Opposite to previous advantages, the proposed method has few disadvantages: low resolution in the case of big enterprises (more than 250 workers) and necessity of KPIs correction according to national law for work, if it is different than EU regulation.
Quality evaluation of occupational health & safety (OHS) risk management systems from agriculture
533
REFERENCES
Cambon, J., Guarnieri, F., Groeneweg, J. (2005). Towards a new tool for measuring safety management systems performance. In: Rigaud, E., Hollnagel, E. (Eds.), Proceedings of the Second Resilience Engineering Symposium, 8–10 November 2006. Antibes-Juan-les-Pins, France, Mines Paris, Les presses, Paris, 53–62.
Crisan, G.C., Tucu, D., Boboescu, R. (2017). Improvement of safe & healthy work systems in agricultural SME's. In: Actual Tasks on Agricultural Engineering-Zagreb, Vol. 45, 657-663.
Darabont, D.C., Bejinariu, C., Ionita I., Bernevig-Sava M.A., Baciu C., Baciu E.R. (2018). Considerations on improving occupational health and safety performance in companies using ISO 45001 Standard. Environmental Engineering and Management Journal, Vol.17, No. 11, 2711-2718.
Goncalves, A.P.; Kanegae, G.; Leite, G. (2020) Safety Culture Maturity and Risk Management Maturity in Industrial Organizations. Available online: http://www.abepro.org.br/ biblioteca/icieom2012_submission_131.pdf, (accessed on 15 September 2020)
Gusetoiu, I.R., Tucu, D. (2012). Influence of occupational stress in jobs in the field of nanomaterials. In: Tanger Ltd. Conference: 4th International Conference on NANOCON, Brno, Czech Republic, 531-536.
Gusetoiu, I.R., Tucu, D. (2013). Stress risk in management systems in metallurgical problems. In: Tanger Ltd. Conference: 22nd International Conference on Metallurgy and Materials (METAL), Brno, Czech Republic, 1904-1908.
Kaassis, B., Badri, A. (2018). Development of a Preliminary Model for Evaluating Occupational Health and Safety Risk Management Maturity in Small and Medium-Sized Enterprises. In: Safety, Vol. 4, Iss.1, Art.5, 1-20.
Mohammadfam, I., Kamalinia, M., Momeni, M., Golmohammadi, R., Hamidi, Y., Soltanian, A. (2016). Evaluation of the quality of occupational health and safety management systems based on key performance indicators in certified organizations. In: Saf Health Work. 2017, 8(2), 156–161.
Podgórski, D. (2015). Measuring operational performance of OSH management system – A demonstration of AHP-based selection of leading key performance indicators. In: Safety Science, 73, 146–166.
Tremblay, A., Badri, A. (2018a). A novel tool for evaluating occupational health and safety performance in small and medium-sized enterprises: The case of the Quebec forestry/pulp and paper industry. Safety Science, No. 101, 282–294.
Tremblay, A., Badri, A., (2018b). Assessment of occupational health and safety performance evaluation tools: state of the art and challenges for small and medium-sized enterprises. Safety Science, No.101, 260–267.
Tucu, D., Crisan, G.C., Tucu, A. (2019). The use of self-assessment in occupational risk management system in SMEs from agriculture. In: Actual Tasks on Agricultural Engineering. Proceedings - Zagreb, vol.47, 479-485.
* * *, BSI. (2007). Occupational Health and Safety Management Systems – Specification (BS OHSAS 18001:2007). Occupational Health and Safety Assessment Series, BSI, London, UK.
* * *, ILO. (2009). Guidelines on occupational safety and health management systems, ILO-OSH 2001. 2nd ed. International Labour Office, Geneva, Available at: http://www.ilo.org/safework /info/standards-and-instruments/WCMS_107727/lang--en/index.htm
* * *, ILO. (2012). Good practices in labour inspection: the rural sector with special attention to agriculture International Labour Office. Labour Administration and Inspection Programme, ILO (ed), Geneve, 9-11, https://labordoc.ilo.org/discovery/fulldisplay?docid=alma994699803402676&context=L

A. Tucu, A.-A. Purcarea, G. C. Crisan, A. Vasilica, D. Tucu
534
&vid=41ILO_INST:41ILO_V2&lang=en&search_scope=ALL_ILO&adaptor=Local%20Search%20Engine&tab=ALL_ILO&query=any,contains,International%20Labour%20Organization%20guidelines&pfilter=rtype,exact,books&offset=0, (accessed September 2020)
* * *, ISO. (2018). ISO 45001:2018, Occupational health and safety management systems - Requirements with guidance for use. https://www.iso.org/iso-45001-occupational-health-and-safety.html, (accessed September 2020)

Related Documents