4 th Grade CST ELA and 4sight Data Meeting 2013-14

4 th Grade CST ELA and 4sight Data Meeting
Jan 02, 2016
4 th Grade CST ELA and 4sight Data Meeting. 2013-14. PCS Proficient and Advance 2008-12. 4 th Grade Across the Years. Previous Year. Goals for 2014 Math. CST 2013 71% CST Target for 2014- ? Strands Dec/ Frac / Neg Num - (79) Operations and Factoring – 82 AF- 80 MG- 76 SDAP- 80. - PowerPoint PPT Presentation
Welcome message from author
This document is posted to help you gain knowledge. Please leave a comment to let me know what you think about it! Share it to your friends and learn new things together.
Transcript

4th Grade CST ELA and 4sight Data Meeting
2013-14

PCS Proficient and Advance2008-12
ELA MATH0
10
20
30
40
50
60
70
25
43
36
48
41
57
45
61
45
60
43
65
200820092010201120122013
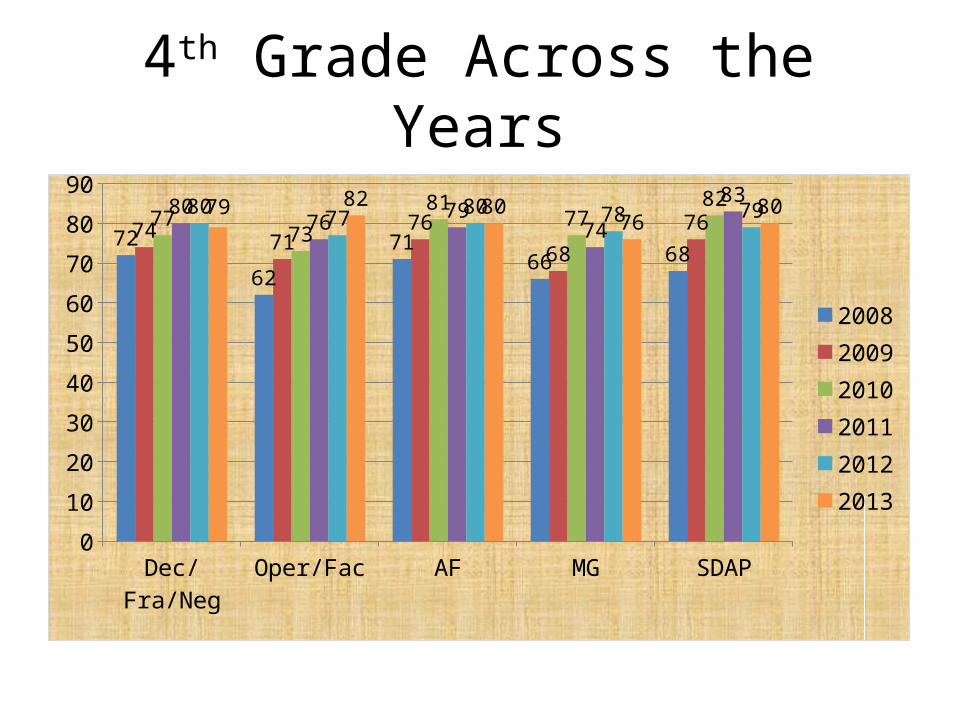
4th Grade Across the Years
Dec/Fra/Neg Oper/Fac AF MG SDAP0
10
20
30
40
50
60
70
80
90
72
62
7166 68
7471
76
68
767773
8177
828076
7974
8380
7780 78 7979 82 80
7680
200820092010201120122013
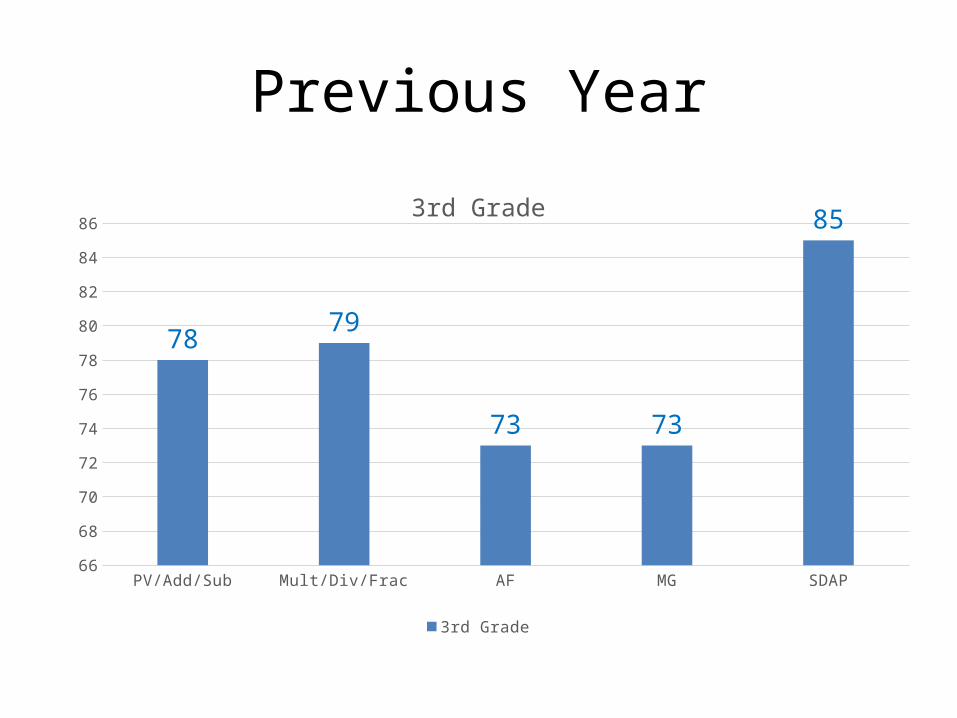
Previous Year
PV/Add/Sub Mult/Div/Frac AF MG SDAP66
68
70
72
74
76
78
80
82
84
86
7879
73 73
853rd Grade
3rd Grade
Goals for 2014 Math
• CST 2013 71%• CST Target for 2014- ?• Strands– Dec/Frac/Neg Num- (79)– Operations and Factoring – 82– AF- 80– MG- 76– SDAP- 80

Target Concerns• What skills were strong/ weak?• What in our instructional process (instruction and
structures) led to these results (positive and negative)?
• What areas, other than instruction but within our control (such as attendance rate, tardy rate, suspension rate), contributed to these results (positive and negative)?
• What instruction decisions (structural and instructional) can we make to increase the likelihood of our school meeting or exceeding?

4th Grade Last 5 years(ELA)
narrativesum
mary
WA RC LA WC WS WA0
10
20
30
40
50
60
70
80
90
100
57
48
58
50
39
55
62
53
67
5854
61
68
59
69
59
52
66
51
5761
53
58
72
61 6163
55
91
69
52
63 62
54
66
200820092010201120122013

Sub-strands for PCS class of 2013
WA RC LA WC WS0
10
20
30
40
50
60
70
80
68
59
69
59
52
71
61
70
62
55
72
61 62 63
54
6258
63
72
64
Chart Title
2nd Grade 3rd Grade 4th Grade 5th Grade
15/15/15/16 6 /8 / 9 /12 14/13/18/17 08/09/15/1622/20/18/14

Substrands PCS Class of 2014
WA RC LA WC WS0
10
20
30
40
50
60
70
80
67
59
6966
52
72
58 56 5761
69
52
63 62
54
2nd Grade 3rd Grade 4th Grade Series4

2013-14 4th Grade Class
WA RC LA WC WS0
10
20
30
40
50
60
70
80
67
57 5963
58
6863
71
5561
Chart Title
2nd Grade 3rd Grade

2013-14 4th Grade Class
52
38
63
4637

Related Documents