NASA CONTRACTOR REPORT I. p li '4 SPIN TEST OF TURBINE ROTOR 'f li' 1 f I by Michael H. Vaura, James E. Hammer, ! 1 , and Lawrence E. Bell 1 ; Prepared by I. 8 NAVAL POSTGRADUATE SCHOOL E f Monterey, Calif. 93940 i for . . . , 'i NATIONAL AERONAUTICS AND SPACE ADMINISTRATION 0 WASHINGTON, D. C. FEBRUARY 1972

Welcome message from author
This document is posted to help you gain knowledge. Please leave a comment to let me know what you think about it! Share it to your friends and learn new things together.
Transcript
N A S A C O N T R A C T O R
R E P O R T
I. p li '4 SPIN TEST OF TURBINE ROTOR ' f li'
1 f I by Michael H. Vaura, James E. Hammer, ! 1 , and Lawrence E. Bell
1;
Prepared by I.
8 NAVAL POSTGRADUATE SCHOOL E f Monterey, Calif. 93940 i f o r
. . . ,
'i
N A T I O N A L A E R O N A U T I C S A N D SPACE A D M I N I S T R A T I O N 0 W A S H I N G T O N , D. C. FEBRUARY 1972
TECH LIBRARY KAFB, NM
1. Report No. 2. Government Accession No.
.NASA CR-1967 4. Title and Subtitle
SPIN TEST OF TURBINE ROTOR
3. Recipient's Catalog No.
5. Report Date Februarv 1972
6. Perforkng Organization Code
7. Author(s1
Michael H. Vavra, James E. Hammer, and Lawrence E. Bell
9. Performing Organization Name and Address
Naval Postgraduate School Monterey, California 93940
12. Sponsoring Agency Name and Address
National Aeronautics and Space Administration Washington, D. C. 20546
8. Performing organization Report No.
NPS-57VA71061B 10. Work Unit No.
11. Contract or Grant No. NASA Defense Purchase Request C-10836
13. Type of Report and Period Covered
Contractor Report 14. Sponsoring Agency Code
15. Supplementary Notes
Project Manager, Charles F. Zalabak, Chemical Rocket Division, NASA Lewis Research Center, Cleveland, Ohio
16. Abstract
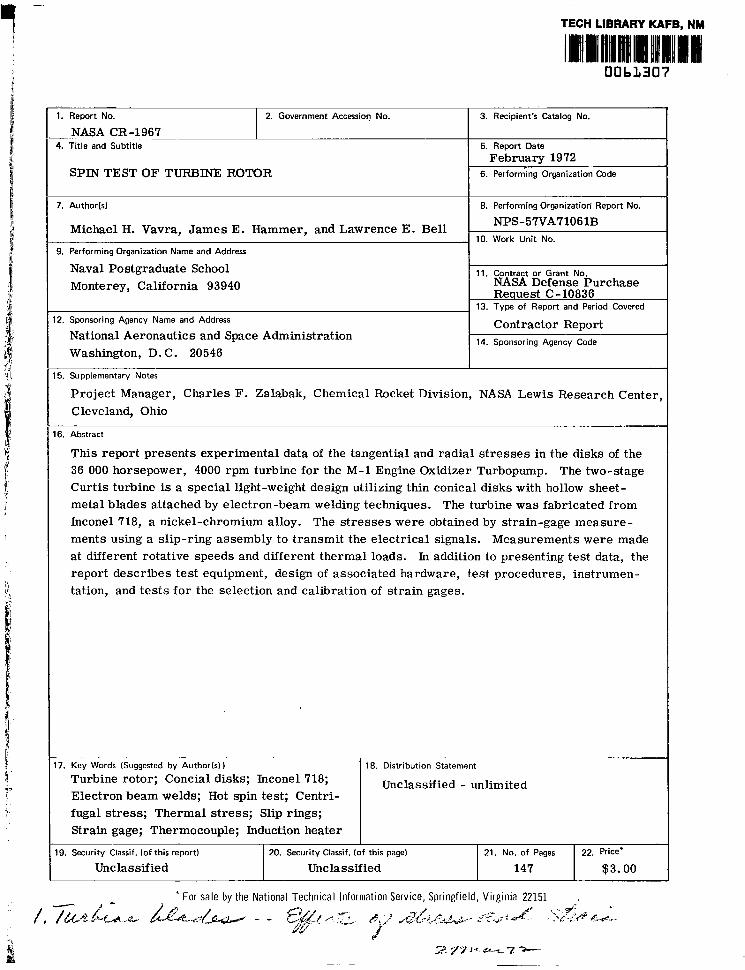
This report presents experimental data of the tangential and radial stresses in the disks of the 36 000 horsepower, 4000 rpm turbine for the M-1 Engine Oxidizer Turbopump. The two-stage Curtis turbine is a special light-weight design utilizing thin conical disks with hollow sheet- metal blades attached by electron-beam welding techniques. The turbine was fabricated from Inconel 718, a nickel-chromium alloy. The stresses were obtained by strain-gage measure- ments using a slip-ring assembly to transmit the electrical signals. Measurements were made at different rotative speeds and different thermal loads. In addition to presenting test data, the report describes test equipment, design of associated hardware, test procedures, instrumen- tation, and tests for the selection and calibration of strain gages.
17. Key Words (Suggested by Author(s)) I 18. Distribution Statement
Turbine rotor; Concial disks; Inconel 718; Electron beam welds; Hot spin test; Centri-
Unclassified - unlimited
fugal stress; Thermal stress; Slip rings; Strain gage; Thermocouple; Induction heater
19. Security Classif. (of this report) 22. Price' 21. NO. of Pages 20. Security Classif. (of this page)
Unclassified $3.00 147 Unclassified


TABLE OF CONTENTS
I . SUMMARY . . . . . . . . . . . . . . . . . . . . . . 1
I1 . INTRODUCTION . . . . . . . . . . . . . . . . . . . 2
I11 . HARDWARE DESCRIPTION . . . . . . . . . . . . . . . 4
A . TESTROTOR . . . . . . . . . . . . . . . . . . . 4
B . EXISTING SPIN TEST FACILITY . . . . . . . . . . . 4
C . SPECIAL EQUIPMENT A N D MODIFICATIONS . . . . . 7
1 . Drive Turbine . . . . . . . . . . . . . . . . 7
2 . Rotor Suspension System . . . . . . . . . . . 8
3 . Measuring and Balancing Rig . . . . . . . . . 9
4 . Rotor Handling Rig . . . . . . . . . . . . . . 10
5 . Heating and Cooling Coils . . . . . . . . . . 10
6 . Calibration Beam . . . . . . . . . . . . . . . 11
IV . PRELIMINARY AND FABRICATION-EVALUATION SPIN TESTS . 12
A . INSTRUMENTATION . . . . . . . . . . . . . . . . 12
B . PRELIMINARY SPIN TESTS . . . . . . . . . . . . . 13
1 . Preparations and Test Procedures . . . . . . . . 13
2 . Test Results . . . . . . . . . . . . . . . . . 16
3 . Spin Test for Fabrication Evaluation . . . . . . 16
a . Test Preparation and Procedure . . . . . . . 16
b . Results . . . . . . . . . . . . . . . . . 17
C . DISCUSSION OF HUB-BOLT BEHAVIOR . . . . . . . . 18
V . HIGH-TEMFTRATURE INSTRUMENTATION . . . . . . . . 20
A . STRAIN-GAGE SEUCTION . . . . . . . . . . . . . 20
1 . Gage Availability . . . . . . . . . . . . . . 20
2 . Tests for Gage Selection . . . . . . . . . . . 21
B . DETAILED EVALUATION OF SELECTED STRAIN GAGE . . 23
1 . Signal Conditioning . . . . . . . . . . . . . 24
2 . Gage Performance Evaluation at Ambient Temperature . . . . . . . . . . . . . . . . . 25
Temperature . . . . . . . . . . . . . . . . . 26 3 . Gage Performance Evaluation at Elevated
iii

a . Evaluation of Apparent Strains . . . . . . . 27
b . Evaluation of Gage Stability . . . . . . . . 28
Temperature . . . . . . . . . . . . . . 28
4 . Summary . . . . . . . . . . . . . . . . . . 29
c . Variation of Gage Factor with
C . DATA LOGGING SYSTEM . . . . . . . . . . . . . 30
D . INSTRUMENTATION OF TEST ROTOR . . . . . . . . 31
V I . ROOM-TEMPERATURE SPIN TESTS . . . . . . . . . . . 33
A . EQUIPMENT CHANGES . . . . . . . . . . . . . . 33
B . TEST PROCEDURE . . . . . . . . . . . . . . . . 34
C . RESULTS AND DISCUSSION . . . . . . . . . . . . 35
VI1 . ELEVATED-TEMPERATURE STATIC TESTS . . . . . . . . . 41
A . PREPARATION FOR TEST AND PRELIMINARY RUNS . . . 41
B . TEST PROCEDURES . . . . . . . . . . . . . . . 43
C . RESULTS AND DISCUSSION . . . . . . . . . . . . 44
VI11 . ELEVATED-TEMPERATURE SPIN TESTS . . . . . . . . . . 50
A . TEST PROCEDURES . . . . . . . . . . . . . . . . 50
B . RESULTS AND DISCUSSION . . . . . . . . . . . . 5 1
IX . CONCLUSIONS . . . . . . . . . . . . . . . . . . . 52
X . REFERENCES . . . . . . . . . . . . . . . . . . . . 99
APPENDIX A DESIGN OF SPECIAL EQUIPMENT . . . . . . . . 100
A . 1 Rotor Suspension System . . . . . . . . . 100
A . 2 Measuring and Balancing Rig . . . . . . . 102
A . 3 Rotor Handling Rig . . . . . . . . . . . . 105
APPENDIX B STRESS CALCULATIONS . . . . . . . . . . . . 109
B . 1 Centrifugal Stress Due to Balance Weights . . 109
B . 2 Stress Distributions in a Straight Replacement Model of the Second-Stage Rotor . . . . . . . . . . . . . . . . . 111
APPENDIX C
APPENDIX D
HUB BOLT TEST PROGRAM . 124
132 DRAWINGS . . . . . . . . . . . . . . . . .
iv

LIST OF FIGURES
Figure Page
1 Test Rotor Mounted in Measuring and
2 Oxidizer Turbopump Assembly . . . . . . . . . 55
3 M-1 Engine Mockup . . . . . . . . . . . . . 56
4 Inner Face of Second-Stage Turbine . . . . . . 57
5 Strain Gage and Thermocouple Locations --
Balancing Rig . . . . . . . . . . . . . . . . 54
High-Temperature Instrumentation . . . . . . . 58
6 Cross Section of Test Rotor in Spin Pit . . ., . . 59
7 Overall View of Hot Spin Test Facility . . . . . 60
8 Hot Spin Test Unit Control Console . . . . . . 6 1
9 Test Rotor Supported in Handling Rig . . . . . . 62
10 Cross Section of Heating Coils and
11 Upper Heating Coil and Insulation Surrounding
12 Upper Hub Cooling Plate . . . . . . . . . . . 65
Hub Cooling Plates . . . . . . . . . . . 63
Test Rotor . . . . . . . . . . . . . . . . . 64
13 Cantilever Beam Test Jig and Uniform-Stress Beam . . . . . . . . . . . . 66
1 4 Microdot SG-180 Gage Configuration . . . . . 67
15 Standard Three-Wire Circuit Illustrating Lead-Wire Resistance and Input Conditioning . . 68
16 Mean Apparent Strain With Temperature Curve Based on Tests of Eight Gages Mounted on Calibration Beam . . . . . . . . . . . . . . 69
17 Typical Gage Installation (Microdot SG-180) on Rotor Disk . . . . . . . . . . . . . . . . 70
18 'Thermocouple Circuit Showing Reference Junction Arrangement . . . . . . . . . . . . 71
19 Strain Data Scatter Bands for Typical
20 Averaged and Zeroed Strain Data for
Face-1 Gages . . . . . . . . . . . . . . . 72
Typical Face-1 Gages . . . . . . . . . . . . 73
V
2 1
22
23
24
25
26
27
28
29
30
31
32
33
34
35
36
37
38
Centrifugal Strains on First-Stage Disk at 4 ,000 RPM . . . . . . . . . . . . . . . . . . Centrifugal Strains on Second-Stage Disk a t .4,00ORPM. . . . . . . . . . . . . . . . Dimensionless Centrifugal Stresses on First- Stage Disk . . . . . . . . . . . . . . . . . . Dimensionless Centrifugal Stresses on Second- Stage Disk . . . . . . . . . . . . . . . . . . Centrifugal Stresses on First-Stage Disk a t 6,100 RPM . . . . . . . . . . . . . . .. . . . Centrifugal Stresses on Second-Stage Disk a t 6,100 RPM . . . . . . . . . . . . . . . . . . Temperature Distributions on Outer Face of Second- Stage Disk a t Various T imes During a Standard Run
Temperature Gradients after 2.0 Hours a t 6 KW . . Dimensionless Temperature Distributions for 2.0 Hours a t 6 KW . . . . . . . . . . . . . . . . Dimensionless Temperature Distributions for 2.0 Hours at 6 KW Plus 1.0 Hour a t 0 KW . . . . . . Variation of Young's Modulus and Poisson's Ratio With Temperature . . . . . . . . . . . . . . . Thermal Strains on First-Stage Disk After 2.0 Hours at 6 Kw . . . . . . . . . . . . . . . . Thermal Strains on Second-Stage Disk After 2.0 Hours a t 6 KW . . . . . . . . . . . . . . . . Thermal Strains on First-Stage Disk After 2.0 Hours at 6 KW Plus 1.0 Hour a t 0 KW . . . . . . Thermal Strains on Second-Stage Disk After 2.0 Hours at 6 KW Plus 1.0 Hour at 0 KW . . . . . . Dimensionless Thermal Stresses on First-Stage Disk After 2.0 Hours at 6 KW . . . . . . . . . . Dimensionless Thermal Stresses on Second-Stage Disk After 2.0 Hours a t 6 KW . . . . . . . . . . Dimensionless Thermal Stresses on First-Stage Disk After 2.0 Hours at 6 KW Plus 1 .0 Hour at 0 KW
74
75
76
77
78
79
80
81
82
83
84
85
86
87
88
89
90
91
vi
39
40
A 1
A2
A3
B 1
B2
B3
B4
c1
c2
Dimensionless Thermal Stresses on Second-Stage Disk After 2.0 Hours at 6 KW Plus 1.0 Hour a t 0 KW . . . . . 92
Stresses on Second-Stage Disk Due to Combined Thermal and Centrifugal Lmnds of 2.0 Hours a t 6 KW and 3,000 RPM . . . . . . . . . . . . . . . . . . 93
Principle of Rotor Balancing System . . . . . . . . . . 107
Mass Moment of Inertia of B o d y of Revolution . . . . . 107
Evaluation of Bearing Flexures . . . . . . . . . . . . 108
Model of Blade Segment with Balance Weight Attached . . 119
Constant Cross Section Model of Second-Stage Disk . . 120
Equilibrium Conditions a t Radius r2 . . . . . . . . . . 1 2 1
Centrifugal and Thermal Stress Distributions in Replacement Model of Second-Stage Rotor . . . . . . . 122
Comparison of Hub Bolts Before and After Tensile Test . . . . . . . . . . . . . . . . . . . . 127
Load-Elongation Curves from Tensile Tests of Hub Bolts . . . . . . . . . . . . . . . . . . . . . 128
c 3 Load-Strain Curve from Tensile Test of Hub Bolt Material Specimen . . . . . . . . . . . . . . . . . 129
c 4 Load-Strain Curve from Tensile Test of Age-Hardened Hub Bolt Material Specimen . . . . . . . . . . . . . 130
v i i

LIST OF TABLES
1
2
3
4
5
B 1
C i
Strain Data from Preliminary Spin Tests . . . . . . . . Test-Rotor Dimensional Changes After 6 ,000 RPM Spin Test for Fabrication Evaluation . . . . . . . . . Summary of Tensile Test Results for Annealed and Heat-Treated Inconel 718 Hub Bolts and Tensile Specimens . . . . . . . . . . . . . . . . . Corrected Strain Data from Room-Temperature Spin Tests and Elevated-Temperature Tests . . . . . . . . Characteristics of Disk Temperature Profiles for Several Heater Power Inputs . . . . . . . . . . . . Effect of Balance Weight on Centrifugal Blade-Disk Attachment Stress of Second Stage Disk . . . . . . . Summary of Tensile Tests on Hub Bolts . . . . . . . .
94
95
96
97
98
123
13 1
viii

I. SUMMARY
This report presents experimental-data of the tangential and radial
stresses in the turbine disks of the oxidizer turbopump designed for the
M-1 engine. This two-stage Curtis turbine is a special light-weight
design. It has thin conical disks to which the blades and shrouds are ,
attached by electron-beam welding. The geometry of the rotor assembly
made theoretical stress analysis uncertain. Therefore, it was consider-
ed necessary to experimentally determine the disk stress distributions
under thermal and rotational loads. The measured distributions could
then be used to evaluate and improve computer design programs.
The stresses were obtained by strain-gage measurements using a
slip-ring assembly to transmit the electrical signals from the rotating
assembly. Measurements were made at different rotative speeds and
different thermal loads. Room temperature tests were made to a speed
of 6 , 000 rpm or 15 0 per cent of the normal operating speed. Most hot
tests were carried out at low rotational speeds and maximum hub to rim
thermal gradients obtainable without exceeding 625OF at the disk rim.
Hot tests at the desired rim temperature of 1, OOOuF could not be com-
pleted due to the non-availability of suitable strain gages. Hot tes ts
a t 625OF and 3,000 rpm verified that the principle of superposition for
the centrifugal and thermal stresses was valid for the subject rotor.
Detailed inspections and measurements of critical dimensions be-
fare and after the test series showed that the turbine rotor maintained
its mechanical integrity at all operating conditions. However, a prob-
l e m was experienced during the tests which involved elongation of the
bolts used to secure the turbine disks to the rotor hub. The problem
was traced to a misunderstanding between test personnel and the bolt
manufacturer, which resulted in the installation of bolts i n the low-
strength annealed condition and did not indicate a design deficiency.
The report also describes the test facil i ty, design of associated
hardware, test procedures , instrumentation, and tests for selection
and calibration of strain gages.
1
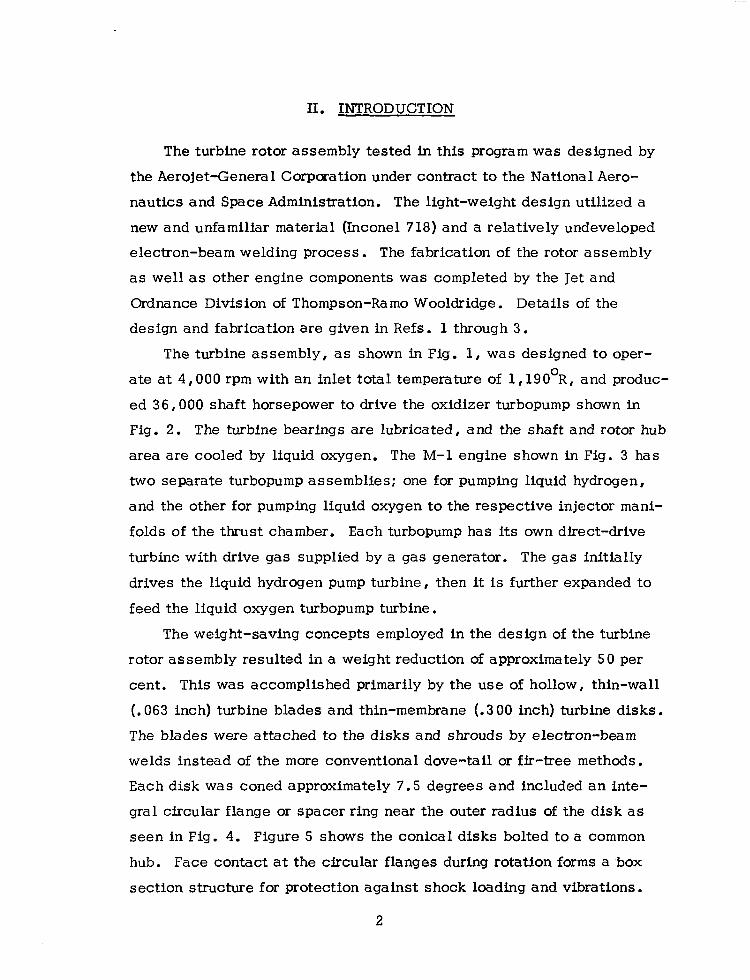
11. INTRODUCTION
The turbine rotor assembly tested in this program was designed by
the Aerojet-Genera1 Corporation under contract to the National Aero-
nautics and Space Administration. The light-weight design utilized a
new and unfamiliar material (Inconel 718) and a relatively undeveloped
electron-beam welding process. The fabrication of the rotor assembly
a s wel l as other engine components was completed by the Jet and
Ordnance Division of Thompson-Ram0 Wooldridge. Details of the
design and fabrication are given in Refs. 1 through 3.
The turbine assembly, as shown in Fig. 1, was designed to oper-
ate a t 4 , 000 rpm with an inlet total temperature of 1 , 190°R, and produc-
ed 36 , 000 shaft horsepower to drive the oxidizer turbopump shown in
Fig. 2. The turbine bearings are lubricated, and the shaft and rotor hub
area are cooled by liquid oxygen. The M-1 engine shown in Fig. 3 has
two separate turbopump assemblies; one for pumping liquid hydrogen,
and the other for pumping liquid oxygen to the respective injector mani-
folds of the thrust chamber. Each turbopump has its own direct-drive
turbine with drive gas supplied by a gas generator. The gas initially
drives the liquid hydrogen pump turbine , then it is further expanded to
feed the liquid oxygen turbopump turbine.
The weight-saving concepts employed in the design of the turbine
rotor assembly resulted in a weight reduction of approximately 50 per
cent. This was accomplished primarily by the use of hollow , thin-wall
(. 063 inch) turbine blades and thin-membrane (.300 inch) turbine disks.
The blades were attached to the disks and shrouds by electron-beam
welds instead of the more conventional dove-tail or fir-tree methods.
Each disk was coned approximately 7.5 degrees and included an inte-
gral circular flange or spacer ring near the outer radius of the d i sk as
seen in Fig. 4. Figure 5 shows the conical disks bolted to a common
hub. Face contact a t the circular flanges during rotation forms a box
section structure for protection against shock loading and vibrations.
2

The geometry of the turbine rotor with its unique bolted-membrane
disks did not readily lend itself to theoretical stress analysis. Hence , a program was established to perform spin tests of the turbine rotor, to
obtain measurements for the evaluation of the design stress program,
and to confirm the fabrication integrity. A s originally established, the
test program required two specific tests to obtain two sets of strain
data for design evaluation; one set of data to be obtained a t the mechan-
ical design speed of 4 ,000 rpm with the disks at ambient temperature,
the second test to be made at 4 , 000 rpm with a disk temperature profile
where the maximum hub temperature is 3 00 F and the rim temperature is
approximately l,OOO°F. Also required was a spin test f o r fabrication
evaluation to be made a t ambient temperatures and a t a maximum rotation-
al speed not to exceed 170 ks i stress.
0
The specific goals of the original test program could not be me t be-
cause of the nonavailability of a suitable strain gage for static strain
measurements in thermal gradients and/or temperatures of 1 , 000 F. For
the reason stated above and due to changes in the M-1 rocket engine
program, the spin-test program philosophy was changed from verifica-
tion of a specific design at its operating conditions to one of fundamental
understanding of the stress distributions in a rotor of this configuration.
The tests were made using strain gages that limited maximum rotor tem-
peratures to 650 F. The large number of gages involved coupled with the
problems and limitations of the slip-ring assembly required many test
runs and several hundred hours of test t i m e to establish and verify the
stress distributions. The dimensionless stress parameters presented in
this report are applicable to any geometrically similar rotor for a wide
range of operating conditions.
0
0
3

III. HARDWARE DESCRIPTION
A. TEST ROTOR
The test rotor assembly as furnished consisted of the two turbine
wheels and a rotor hub. Figure 1 shows the assembled rotor mounted
in the measuring and balancing stand. The test rotor assembly was
actually built for u s e in the M-1 engine and is an operational part i n
every detail. Figure 4 provides a n inner view of the disassembled
second-stage turbinewheel showing the parallel face lugs at the disk
bore, which match with radial slots in the hub to transmit torque and
t o maintain concentricity a s t h e rotor expands. The same arrangement
is used to a t tach the first-stage turbine. The actual rotor shaft was
replaced with a special arbor shaft and adapter described later under
modifications. The mean diameter of each stage is 33 inches.
The box-section structure of the rotor assembly is shown in Fig. 5
with the two conical disks clamped to a common rotor hub. The nine
hub attaching bolts were not furnished with the other components, but
were manufactured locally in accordance with specifications of Draw-
ing 2011 of Appendix D. The bolts were made from 3/4-inch Inconel
718 bar stock. A certified report of the bolt material heat showed that
the material possessed a 0.2 per cent yield strength of 165 ksi. A
total of 13 bolts was fabricated in a'ccordance with machining proce-
dures described in Ref. 4. When installed in the rotor assembly, the
bolts were torqued to 80 inch-pounds with cotter pins to prevent the
nuts from loosening during testing. Figure 6 shows a cross section
view of the rotor assembly installed in the spin test facility. Total
weight of the rotor assembly was approximately 340 pounds.
B. EXISTING SPIN TEST FACILITY
The basic hot spin test facility (Figs. 6 , 7 , and 8) utilized in this
program was designed and built for the Astro-Aeronautical Propulsion
Laboratories of the Naval Postgraduate School by the Baldwin-Lima-
Hamilton Corporation and was completed in November 1965. The unit
was designed for testing various types of turbine and compressor
4

rotors a t both ambient and elevated temperatures. Test rotors up to 5 0
inches in diameter and of maximum axial length of 24 inches can be
accommodated. Both strain and temperature data can be taken from the
rotating test model through slip-ring assemblies. Prior to this prcqram,
the facility was used for one other test program, which examined only
centrifugal stresses (Ref. 5).
The test rotor is suspended from the lower end of the drive-turbine
spindle shaft which extends through the spin-pit cover plate (Fig. 6).
The maximum rotor weight and rotational speeds are determined by
choice of drive-turbine size and rating. Two drive turbines were avail-
able; a four-inch (rotor diameter) Pelton turbine rated for speeds up to
30,000 rpm with a 250 pound maximum rotor weight, and a four-inch
Barbour-Stockwell turbine rated to 60,000 rpm and 200 pounds. Each
of the drive turbines contains provisions for applying a reversing air sup-
ply for braking. Both drive and brake air supplies are controlled from the
control console, with rotor acceleration rates determined by rotor mass
and spindle-shaft size.
A lube-oil system mounted adjacent to the spin pit circulates oil
through the vibration-damper housing for lubricating and cooling the
vibration dampers. This unit has both a delivery and suction scavenge
pump to control oil level in the damper housing. The lower vibration
damper contains a Garlock shaft seal to prevent oil leakage past the
spindle shaft into the spin pit.
A catcher assembly (Fig. 6) is provided at the bottom of the pit to
minimize damage in case of rupture in the test rotor or shaft separation.
The lower end of the test-rotor arbor shaft is extended and coned to match the tapered inner race of a ball bearing mounted horizontally on
top of the catcher base. The catcher assembly was positioned to pro-
vide 1/8 inch clearance between the rotor arbor taper and the bearing
and would, therefore, l i m i t lower arbor shaft eccentricities to 1/8 inch.
A second ball bearing unit a t the spindle housing limits travel of the
upper shaft. In case of spindle-shaft failure, the rotating assembly
5

could drop slightly Into the catcher assembly and run out between the
bearing assemblies. A Bentley-Nevada Proximitor pickup is mounted
on the catcher stand to detect shaft eccentricities. The Proximitor out-
put can be displayed on an oscilloscope and monitored as a safety pre-
caution.
A Kinney 30 CFM vacuum service unit is used to evacuate the pit,
thus minimizing air-friction effects on the rotating assembly. This unit
is capable of maintaining tank pressures in the 50-micron range when
properly serviced and maintained.
Air for the drive turbine is supplied at approximately 140 ps i from
a compressor located in the Jet Engine Laboratory. Sufficient air is available a t the spin test facility to permit use of a wide variety of
rotor combinations. Drive and brake air supplies to the turbine are
regulated through diaphragm-actuated valves located adjacent to the
spin pit. Separate regulator valves were installed for adjusting turbine
balance air and regulating cooling air flow to the slip-ring contacts.
A 30 kVA Ecco High Frequency motor-generator (M-G) set is utiliz-
ed for induction heating of the test rotors. The system operates at
10,000 Hz and has a multiple capacitor bank to maintain a power fac-
tor close to unity. A cooling water supply is used to cool the M-G unit
and is available for the rotor heater element and hub radiation cooling
plates. A radiamatic pyrometer is normally mounted near the test rotor
to sense the rotor temperature and provide a signal f o r automatic con-
trol of the heater to preselected temperatures. However, this feature
was not used for the present tests since the lower control range far
automatic control was above the maximum test tamperatures.
A l l systems are operated from the two control consoles of Figs. 7
and 8 located adjacent to the spin pit. Rotational speed of the turbine
is measured by means of a magnetic pickup mounted on top of the drive
turbine at the slip-ring adapter. Output signal from the pickup is fed
to a digital counter for direct readout in rpm. Speed is automatically
maintained at preselected values by means of a counter limiter which
6
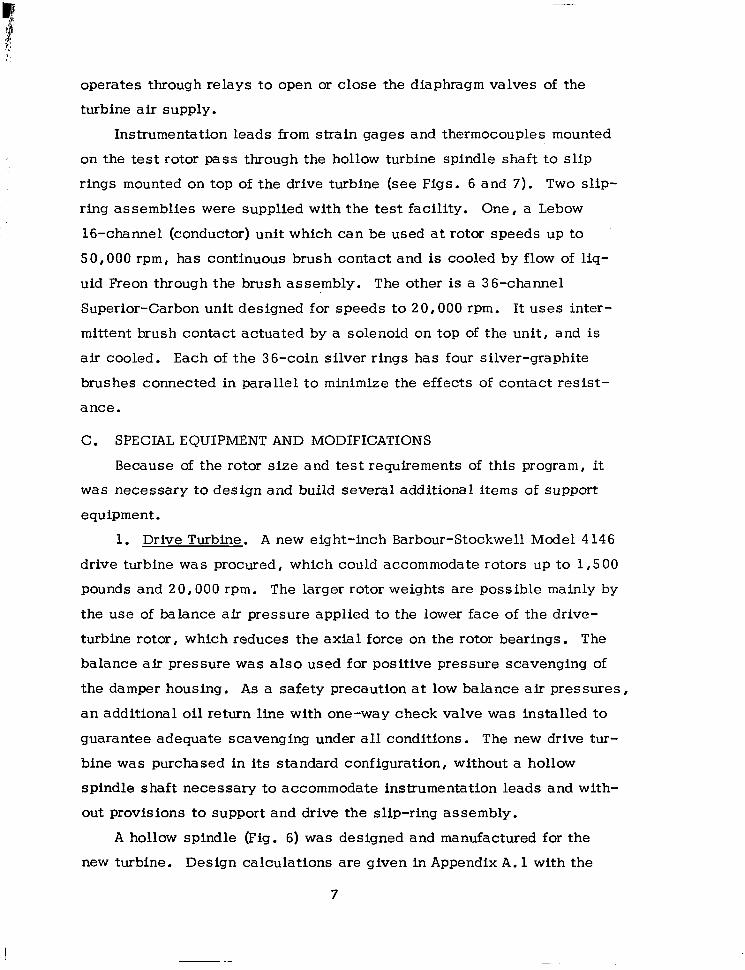
operates through relays to open or close the diaphragm valves of the
turbine air supply.
Instrumentation leads f rom strain gages and thermocouples mounted
on the test rotor pass through the hollow turbine spindle shaft to s l ip
rings mounted on top of the drive turbine (see Figs. 6 and 7). Two slip-
ring assemblies were supplied with the test facility. One, a Lebow
16-channel (conductor) unit which can be used at rotor speeds up to
50,000 rpm, has continuous brush contact and is cooled by flow of liq-
uid k e o n through the brush assembly. The other is a 36-channel
Superior-Carbon unit designed for speeds to 20 ,000 rpm. It uses inter-
mittent brush contact actuated by a solenoid on top of the unit, and is
air cooled. Each of the 36-coin silver rings has four silver-graphite
brushes connected in parallel to minimize the effects of contact resist-
ance.
C. SPECIAL EQUIPMENT AND MODIFICATIONS
Because of the rotor size and test requirements of this program, it
was necessary to design and build several additional items of support
equipment.
1. Drive Turbine. A new eight-inch Barbour-Stockwell Model 4146
drive turbine was procured, which could accommodate rotors up to 1,s 00
pounds and 20 ,000 rpm. The larger rotor weights are possible mainly by
the use of balance air pressure applied to the lower face of the drive-
turbine rotor, which reduces the axial force on the rotor bearings. The
balance air pressure was also used for positive pressure scavenging of
the damper housing. As a safety precaution at low balance air pressures,
an additional oil return line with one-way check valve was installed to
guarantee adequate scavenging under all conditions. The new drive tur-
bine was purchased in its standard configuration, without a hollow
spindle shaft necessary to accommodate instrumentation leads and with-
out provisions to support and drive the slip-ring assembly.
A hollow spindle (Fig. 6) was designed and manufactured for the
new turbine. Design calculations are given in Appendix A. 1 with the
7
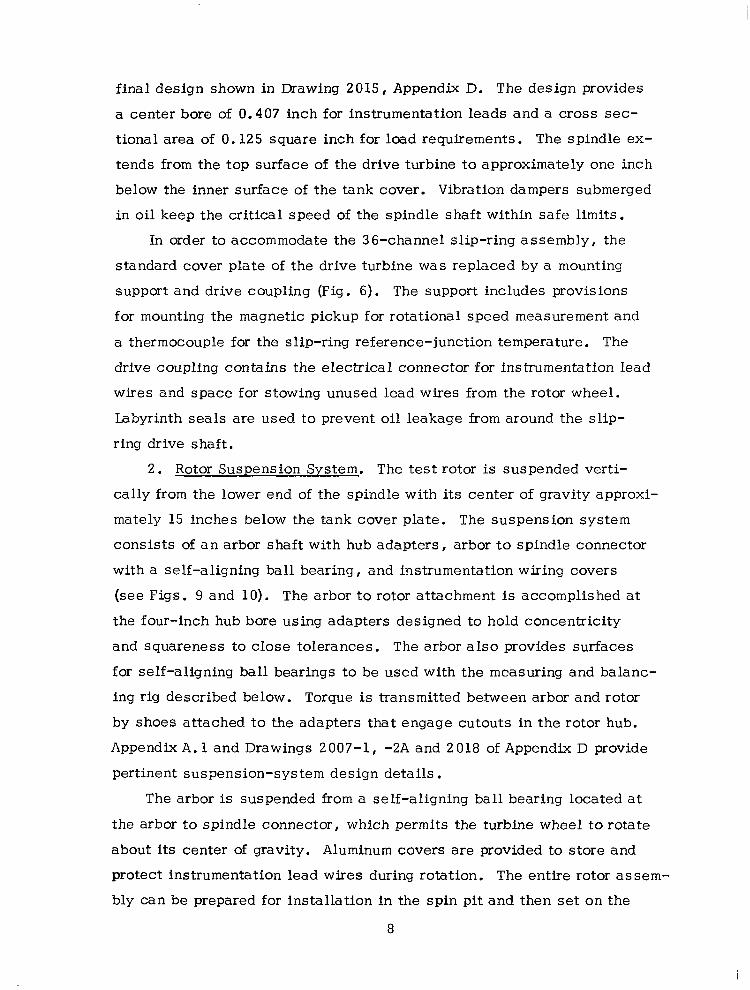
final design shown in Drawing 2015, Appendix D. The design provides
a center bore of 0.407 inch for instrumentation leads and a cross sec-
tional area of 0.125 square inch for load requirements. The spindle ex-
tends from the top surface of the drive turbine to approximately one inch
below the inner surface of the tank cover. Vibration dampers submerged
in oil keep the critical speed of the spindle shaft within safe limits.
In order to accommodate the 36-channel slip-ring assembly, the
standard cover plate of the drive turbine was replaced by a mounting
support and drive coupling (Fig. 6). The support includes provisions
for mounting the magnetic pickup for rotational speed measurement and
a thermocouple for the slip-ring reference-junction temperature. The
drive coupling contains the electrical connector for instrumentation lead
wires and space for stowing unused lead wires from the rotor wheel.
Labyrinth seals are used to prevent oil leakage from around the slip-
ring drive shaft.
2 . Rotor Suspension System. The test rotor is suspended verti-
cally from the lower end of the spindle with its center of gravity approxi-
mately 15 inches below the tank cover plate. The suspension system
consis ts of a n arbor shaft with hub adapters, arbor to spindle connector
with a self-aligning ball bearing, and instrumentation wiring covers
(see Figs. 9 and 10). The arbor to rotor attachment is accomplished a t
the four-inch hub bore using adapters designed to hold concentricity
and squareness to close tolerances. The arbor also provides surfaces
for self-aligning ball bearings to be used with the measuring and balanc-
ing rig described below. Torque is transmitted between arbor and rotor
by shoes attached to the adapters that engage cutouts in the rotor hub.
Appendix A. 1 and Drawings 2007-1, -2A and 2018 of Appendix D provide
pertinent suspension-system design details.
The arbor is suspended from a self-aligning ball bearing located a t
the arbor to spindle connector, which permits the turbine wheel to rotate
about its center of gravity. Aluminum covers are provided to store and
protect instrumentation lead wires during rotation. The entire rotor assem-
bly can be prepared for installation in the spin pit and then set on the
8

spin-pit flange using the rotor handling rig described below. The spin-
pit cover plate rests on safety supports while final mechanical and
electrical connections are made. Figure 9 shows the rotor mounted
above the spin pit ready for final hookup.
3 . Measurinq and Balancinq Riq . The test specifications required
that the turbine assembly be balanced prior to testing and that specified
dimensions of the turbine disks be measured prior to and after the fabri-
cation evaluation test. A single rig was designed and manufactured to
serve both requirements. Figure 1 is a photograph of the measuring and
balancing rig with the test rotor installed.
The rig was built using support flexures with adapters for self-
aligning ball bearings mounted approximately eight inches apart on each
end of the rotor arbor shaft. The rotor was mounted horizontally in the
stand, as shown in Fig. 1, and supported on the ball bearings at the
upper end of the vertical support flexures. The rotor was driven by a
jet of air directed onto the turbine blading. Provisions are made for cen-
tering and clamping both bearings for rotor assembly measurements or
securing one bearing at a t i m e for dynamic balancing. Design details
are given in Appendix A. 2 and Drawing 2 022, Appendix D.
Measuring stations were provided at various locations on the
outer faces of each disk, along the blades and shroud, and a t the cir-
cular flanges (Drawing 2022 , Appendix D). Measurements were made
using a special spring-loaded probe, inserted through a bushing pro-
vided in the support frame. An inside micrometer was used to measure
the distance between the probe head and the bushing to establish the
rotor measurements relative to the fixed support frame.
Provisions were made to clamp either of the two rotor bearings
for dynamic balancing. The horizontal shaft deflections produced by
unbalanced forces on the rotor were detected by a proximeter pickup
with the output displayed on an oscilloscope. A flux cutter and mag-
netic pickup were used to detect angular position, which was also
indicated on the oscilloscope. A jet of compressed air directed onto
9

the turbine blades was used to accelerate the turbine to slightly above
its critical speed. Pictures were taken of the oscilloscope grid as the
rotor decelerated through the critical speed and were analyzed to deter-
mine the magnitude and relative angular position of the imbalance.
An alternate method was developed during the balancing proc-
ess which eliminated the need for the oscil loscope and camera. A
common lead pencil was mounted on the measuring stand and adjusted
to produce a trace on a paper disk attached to the end of the arbor shaft
(Fig. 1). The rotor was accelerated to slightly above the critical speed
and the drive air turned off. The pencil was then adjusted to produce a
trace on the paper disk as the rotor decelerated through the critical
speed. The horizontal oscillations of the arbor caused by rotor imbal-
ance produced a trace which was offset from its center and could be
used to locate the angular position of the unbalance.
4 . Rotor Handlins R i q . It was necessary to design and build a
rotor handling rig (Fig. 9) t o permit ease of handling and to eliminate
the possibility of damage to the rotor. The rig consisted of a triangular
aluminum frame with hardwood blocks that clamp and hold the rotor a t
the drum spacer between the blades. Design details are given in Appen-
dix A. 3 and Drawing 2 02 1-2 , Appendix D. The rotor assembly could be
supported by the rig with its axis either horizontal or vertical and could
be lifted by hoist. Adjustable legs were provided at each corner of the
rig so that it could be set on the spin-pit flange and leveled to facili-
tate connecting of the rotor arbor to the spindle shaft .
5. Heatins and Coolinq Coils. The purpose of the heating and
cooling coils was to produce thermal gradients in the rotor disks corres-
ponding to those which would exist in the wheel during engine operation.
Induction heating coils were constructed using 3/8-inch copper tubing
t o provide for a cooling water flow against resistive heating in the coils
during operation. Location of the coils relative to the rotor is shown in
Fig. 10. Design calculations proved to be of limited value, and the
final design evolved from a cut and try procedure. Two flat coils of
10

five turns each, wound in "pancake" fashion, were attached to sheets
of Johns-Manville Marinite insulation. The coils were wound in oppo-
site directions and connected in parallel. The coils had a width of
g - 2 1/4 inches and an outside diameter of approximately 28 inches to
place the maximum induction field at the rotor disk rim. The insula-
t ion sheets, Figs. 10 and 11, provided support for the heating coils
and enclosed the rotor to prevent radiation heating from the rotor to
the spin pit cover plate and had provisions for adjusting the clear-
ance between the coils and rotor.
Cooling coils were used for hub cooling to produce thermal
gradients in the rotor disk. Copper plates, 1/8 inch th ick , were f i t -
ted around both outer faces of the rotor hub to cool the inner parts of
the rotor disks and around the arbor shaft to cool instrumentation lead
wires, as shown in Fig. 10. Cooling water was circulated through
copper tubing brazed along the back side of the cooling plates away
from the rotor, and thermocouples were installed in the water inlet and
discharge lines. The upper cooling coils and plate were split to permit
removal of one-half of the assembly providing access t o the hub termi-
nal connector for wiring changes (Figs. 11 and 12).
6. Calibration Beam. A calibration beam device (Fig. 13) was
constructed to evaluate strain-gage performance at room and elevated
temperatures. The beams and holding jig were made from Inconel 718
with the load screw and mounting bolts of stainless steel . Two beams,
a straight cantilever beam and a uniform-stress beam, were made 0.3
inch thick (same thickness as the rotor disks), and the entire assembly
could be placed in a furnace. The uniform-stress beam was used
exclusively since it provided a large constant-strain surface for simul-
taneous comparison of several gages. The device was calibrated using
conventional strain gages and a Tuckerman optical gage.
11

IV. PRELIMINARY AND FABRICATION-EVALUATION SPIN TESTS
Several delays were encountered in the selection of a suitable strain
gage for static measurements a t elevated temperatures. While several
strain-gage configurations were available f o r high-temperature testing
and dynamic strain measurements, many demonstrated excessive tempera-
ture effects and proved unsuitable for actual steady-state strain measure-
ments on a rotating disk. Others required difficult mounting procedures
and high temperature cures, which were nearly impossible to perform with
the large size rotor. Further delays involved the existing strain-gage in-
strumentation and recording system of the spin test console which proved
unsatisfactory, and a new data acquisition system ordered as a replace-
ment was damaged in shipment. Due to these delays, it was decided to
proceed with the ambient-temperature spin tests using available low-
temperature gages and manual data scanning and recording procedures.
The search for a suitable gage was continued during the preliminary spin
tests . A. INSTRUMENTATION
The gages used in the preliminary test series were 350-ohm foil gages
manufactured by the Budd Company with a gage factor (GF) of 2.07. The
sensing element was 1/4 x 1/4-inch on a 1/2 x 3/4-inch phenolic backing.
Gages were bonded to the wheel using Eastman 910 cement and standard
bonding procedures. Installations were checked for minimum 50 megohms
resis tance to ground.
A total of 36 gages was installed on the two rotor disks with gages
placed a t four different radii on each of the four wheel faces as shown on
Drawing 2 007-2, Appendix D. Gages were mounted in pairs with one
aligned radially and the other tangentially, as seen in Fig. 1. The gage
lead wires were attached to solder terminals bonded to the rotor with
Eastman 910 cement. Stress-relief terminal loops were used between
the strain-gage and lead-wire terminals. The lead wires were held in
place along the rotor disk contour by Nichrome ribbon straps spot welded
12

b
to the disk with a capacitance discharge welder. General Electric Silicon +!
l$ Rubber adhesive/sealant (RTV) was used in repairing lead-wire insulation '1
:i damage and for additional securing of lead wires.
Seventy-two varnish-insulated copper lead wires from the installed ';i
i i gages were routed inward to the rotor hub connector pins, upward along 1 the rotor shaft to the spindle flange, then through the hollow spindle shaft i 1 I' to the sl ip r ings, as indicated by the arrangement on the left of the shaft ,d
in Fig. 6. Terminal connector pins at the rotor hub, arbor to spindle mat-
ing flange, and slip-ring attachment were provided to permit disconnect-
ing or disassembly of the rotor without having to cut and splice the wires.
Since only 3 6 lead wires could be connected to the slip rings at one time , the remaining wires were stored in the slip-ring connector housing. Wir-
ing change-overs between runs were made at the slip-ring connector.
The electrical circuit consisted of a basic two lead-wire system, with
the gage and leads forming one leg of a Wheatstone bridge. Eighteen
gages at a time were connected to a B-L-H 20-channel manual switching
and balancing unit using a common bridge completion network and excita-
tion power supply. Bridge excitation was maintained at six volts DC and
power was applied to individual gages a s s e l ec t ed when the slip rings
were closed. Individual ten-turn potentiometers were used to balance each
gage to the bridge network for a zero bridge output. Bridge output was am-
plified and fed through a voltage to frequency converter and to a digital
counter for manual recording. A calibration resistor shunted across the
gage leads simulated a calculated strain value and w a s used to adjust the
signal amplifier gain to give a direct readout in microinches/inch strain.
B. PRELIMINARY SPIN TESTS
1. Preparations and Test Procedures. The instrumented assembly was
placed in the Measuring and Balancing Rig where it was balanced, and spec-
ified dimensional data were recorded for future compxisons. The rotor
critical speed was determined to be approximately 124 rpm. Balancing was
accomplished by adding lead weights a s needed along the inside of the shroud.
A typical installation of such weights is noticeable in Fig. 1. The maximum
13

weight added at any location was of the order of eight grams per blade
segment. The weights were strapped in place using Nichrome ribbon
spot welded to the shroud.
The test rotor was then installed in the spin pit and prepared
for spin testing. Due to the frequent opening, tank pressures of 1/10
inch mercury absolute or better were considered acceptable for testing.
The drive-turbine balance air was maintained at 3 0 psi gage pressure
which offset approximately 90 per cent of the rotor assembly weight.
Prior to the start of each test run, the slip rings were closed
and each gage channel was selected and adjusted for zero bridge out-
put. The calibration resistor was then shunted across a single gage
and the signal amplifier gain was adjusted to the calculated strain value.
The power supply for the proximeter pickup was turned on and the oscil-
loscope trace adjusted for static conditions.
The drive-turbine air was adjusted to maintain an acceleration
rate of approximately 300 rpm per minute. The maximum rotor oscilla-
t ions seen by the proximeter pickup occurred between 100 and 150 rpm,
which corresponded to the previously observed critical speed of the
assembly. The oscillations decreased rapidly and were not detectable
above 1,000 rpm. The automatic speed control maintained rotor speed
to within - 10 rpm of the selected speed. +
With rotor speed stabilized at the desired rpm, power was
applied to the slip-ring solenoid bringing the brushes in contact with
the rings. The manual selector switch on the switching and balancing
unit was set to the first channel, which applied excitation power to that
gage. Approximately eight to ten seconds were allowed for the strain
reading to stabilize before the strain reading was recorded. The next
channel was then selected and the same procedure repeated until all
18 channels were recorded. This procedure was repeated for rotor
speeds of 1,000; 2,000; 2,800; 3,400; and 4,000 rpm. Braking air was
applied to the air turbine to reduce the speed. Strain data were again
recorded a t the same speeds on the decreasing speed cycle. The rotor
14

was stopped by applying braking air to the drive turbine. A post-run
inspection of overall conditions was made following each run, and de-
sired gage wiring changeovers were made for the next run.
A s an indicator of data accuracy, the strain data from each 2 gage was plotted against (rpm) . The data generally gave a straight-
line relationship, but frequently the line would not pass through zero.
Sometimes the data from the same gage on different runs gave a straight
line with equal slope, but shifted by as much as 200 microstrain from
previous data. It is believed that this shift was due to a change in con-
tact resistance, either in the terminal connections or sl ip r ings, caused
by movement of the lead wires after zeroing the bridge output at static
conditions. Since it is known that the strain is zero at zero rpm and
that it must vary directly with (rpm)2, it is felt that by adjusting the
plots to pass through zero one obtains the representative values of
strains actually experienced by the gage.
Problems were encountered during this series of room-tempera-
ture spin tests, necessitating a total of 16 runs to establish the strains
in the rotor disks. The problems mainly involved the lead wires, termi-
nal connector pins, and slip rings. The radial loading on the connector
pins due to centrifugal forces acting on the lead wires caused the pins
to become loose, which resulted i n data scatter or caused the gage t o
become inoperable. Most of the connector pins were eventually solder-
ed in place. Breakdown of lead-wire insulation, usually a t tie-down
straps or at sharp corners, caused some of the gages to ground out. Re-
pairs were made with RTV cement. Broken lead wires in the slip-ring
assembly usually occurred between the brush-block units and caused ex-
cessive signal noise and data scatter. Although not specifically detected
on these runs, later tests showed some evidence of brush contact heat-
ing a t higher speeds.
Only minor problems were encountered in the mechanical sys-
tems. The vacuum pump had to be disassembled to remove deposits
15

built up as a result of excessive moisture trapped in the oil. Also, on
the first run to 4,000 rpm, the large-diameter snap ring used to secure
the arbor cover (RS 600, Drawing 2 007-2A, Appendix D) became loose
due to centrifugal forces. A l l snap rings used on the rotating system
were then either replaced by machine screws secured by safety wires,
or were fitted with safety covers to prevent their loosening under losd.
2. Test Results. The strain data obtained during these tests
were previously submitted t o NASA and are listed in Table 1. A discus-
sion of these data is not given here since its accuracy was not verified
and the tests were, in effect, repeated in later runs using improved gag-
ing and instrumentation, a s reported in Section V I below.
3 . Spin Test for Fabrication Evaluation
a. Test Preparation and Procedure. A s stated earlier, one
objective of the tes t program was the evaluation of the rotor a t condi-
tions near the elastic l i m i t of the rotor material in order to determine
rotor fabrication integrity. Data from the preliminary tests were review-
ed jointly by representatives from NPS and NASA. The data from runs
made t o 4 ,000 rpm were projected to rotational speeds up to 6,000 rpm.
It was jointly agreed that available data indicated a fabrication-evalua-
tion run could be made up to 6 ,000 rpm without exceeding the 170 k s i
s t ress limits stipulated in the contract.
Attempts to provide high-speed photographic coverage for this
test were unsuccessful. Due to the very limited area of the viewing
window in the pit cover, mounting of both lights and camera inside the
pit would have been required, along with an external control system.
For these reasons and the probable effect of radiation heating from high
intensity lights, it was decided to conduct the test without photographic
coverage.
The 18 most reliable gages were connected through the s l ip
rings to the readout. After insuring that all systems were functioning
properly, the speed was brought up slowly to 4 ,000 rpm. Strains were
1 6
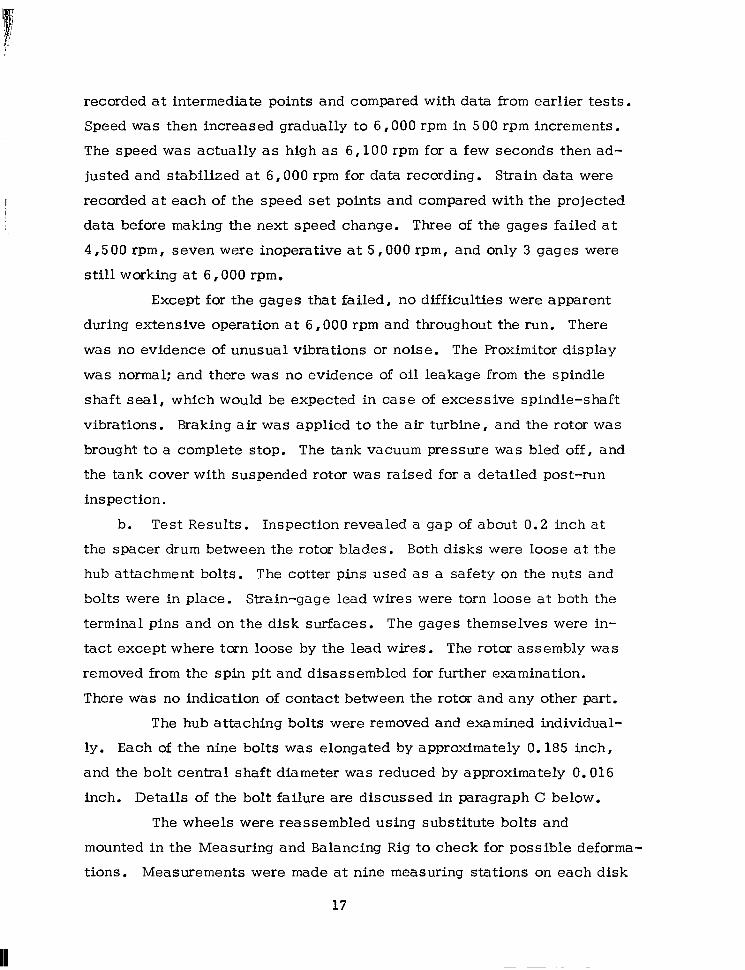
recorded a t intermediate points and compared with data from earlier tests.
Speed was then increased gradually to 6 ,000 rpm in 5 00 rpm increments.
The speed was actually as high as 6 ,100 rpm for a few seconds then ad-
justed and stabilized at 6 ,000 rpm for data recording. Strain data were
recorded at each of the speed set points and compared with the projected
data before making the next speed change. Three of the gages failed a t
4,s 00 rpm, seven were inoperative at 5 ,000 rpm, and only 3 gages were
still working at 6,000 rpm.
Except for the gages that failed, no difficulties were apparent
during extensive operation at 6,000 rpm and throughout the run. There
was no evidence of unusual vibrations or noise. The Proximitor display
was normal: and there was no evidence of oil leakage from the spindle
shaft seal, which would be expected in case of excessive spindle-shaft
vibrations. Braking air was applied to the air turbine, and the rotor was
brought to a complete stop. The tank vacuum pressure was bled off, and
the tank cover with suspended rotor was raised for a detailed post-run
inspection.
b. Test Results. Inspection revealed a gap of about 0.2 inch at
the spacer drum between the rotor blades. Both disks were loose at the
hub attachment bolts. The cotter pins used as a safety on the nuts and
bolts were in place. Strain-gage lead wires were tom loose a t both the
terminal pins and on the disk surfaces. The gages themselves were in-
tact except where tarn loose by the lead wires. The rotor assembly was
removed from the spin pit and disassembled for further examination.
There was no indication of contact between the rotor and any other part.
The hub attaching bolts were removed and examined individual-
ly. Each of the nine bolts was elongated by approximately 0.185 inch,
and the bolt central shaft diameter was reduced by approximately 0.016
inch. Details of the bolt failure are discussed in paragraph C below.
The wheels were reassembled using substitute bolts and
mounted in the Measuring and Balancing R i g to check for possible deforma-
tions. Measurements were made at nine measuring stations on each disk
17

and repeated for four peripheral stations around the wheel. A comparison
of these data with the measurements made prior to the spin tests is given
in Table 2 . The differences of Table 2 are considered to be within reason-
able measuring tolerances and do not indicate actual deformations in the
wheel.
The electron-beam weld joints which secure the rotor blades to
the disk rim were not affected by the 6,000 rpm spin test. This fact is
especially significant since the electron-beam welding technique repre-
sents advanced technology developed specifically for the test rotor as dis-
cussed in Ref . 3. Centrifugal stresses at the second-stage blade-disk
attachment are estimated in Appendix B. 1 .to be 40.9 k s i a t 6,100 rprn.
This stress is shown to be about 3.5 per cent higher than that which
would normally exist a t the joint without the added centrifugal stresses
caused by the balance weights attached to the shrouds. Thus the blade-
disk attachment withstood, without failure, a slightly higher centrifugal
load than that which would normally occur a t 6,000 rpm.
C. DISCUSSION OF HUB-BOLT BEHAVIOR
To explain the severe and unexpected 0.185 inch elongation of hub
bolts a t 6,000 rpm, a bolt tensile test program was initiated to establish
the loads which caused bolt elongation and to evaluate the tensile strength
of the Inconel 718 bolt material. Details of this test program are given in
Appendix C. Significant results were as follows:
It was established that the maximum hub-bolt load during spin tests
to 6,100 rpm was approximately 6,600 pounds. This load corresponds to
a n engineering stress of only 86.0 ksi, the maximum condition a t which
the 0.185 inch plastic deformation occurred. However, as s ta ted in
Section 1II.A above, tensile tests conducted by the bolt material supplier
established a 0.2 per cent yield strength of 165.0 ksi. This apparent dis-
crepancy indicated that the actual bolts were constructed of a material
having a 0.2 per cent yield strength much less than that of the high-
strength Inconel 718 as certified by the supplier.
18

However, this indication was not evident initially, and a new set
of bolts of identical material but modified design was ordered to allow
continuation of rotor testing. The primary modification for these new
bolts was a nominal diameter increase from 0.313 inch to 0.323 inch.
Moreover, the threads were ground instead of turned. Drawing 2 01 l-A,
Appendix D gives detai ls of the modified bolt geometry. These bolts also
stretched during rotor tests under combined thermal and centrifugal loads
as will be discussed in Section VI1.A below. Furthermore, a tensi le test
specimen (Drawing 2 01 l-A, Appendix D) ordered from the same stock as
the modified bolts exhibited a 0.2 per cent yield strength of only 68.6 k s i
when tested, again indicating that the bolt tensile strength was much l e s s
than that commonly reported for Inconel 718.
Eventually, near the end of the program, this problem was cleared up.
The bar stock, from which both sets of bolts were machined, was supplied
in an annealed condition since machining is much easier when Inconel 718
is in this relatively ductile state. However, after machining the bolts re-
quired a n age-hardening heat treatment in order to precipitate out the
intermetallic and carbon strengthening phases (Ref. 7 ) . The tensile speci-
men made from the bolt material had been given the proper heat treatment
as indicated by tensile properties shown in the certified report, but for
some reason the bolts were not treated. Test personnel erroneously assum-
ed that the bolts had been given the same heat treatment as the certified
tensile test specimen since all were made from the same piece of material.
Therefore, a l l hub bolts tested in the rotor and in the tensile test program
of Appendix C were actually in an annealed, low-strength condition. This
accounts for the plastic elongation which occurred a t relatively low bolt
loads during spin tests and for the poor tensile properties obtained in ten-
sile tests.
To verify the above explanation, a remaining tensile specimen was
given an age-hardening heat treatment and tested a t NPS. A 0.2 per cent
yield strength of 142.8 ksi was obtained, verifying that heat treatment
would have strengthened the hub bolts sufficiently to prevent elongation
19
I

during rotor tests. Tensile properties of all specimens tested are summar-
ized in Table 3 .
V. HIGH-TEMPERATURE INSTRUMENTATION
One important objective of the program was to establish whether the
disks could support the thermal stresses which are caused by radial t e m -
perature gradients. For these tests the ambient-temperature gages
described above had to be replaced by high-temperature gages. This sec-
tion describes the effort involved in selection, evaluation, and mounting
of the high-temperature instrumentation system. The instrumentation
described below was used for a second set of ambient-temperature spin
tes t s to provide a check of the preliminary spin tests a s well as for high-
temperature runs.
A. STRAIN-GAGE SELECTION
1. Gaqe availability. Finding an acceptable gage for strain measure-
ment a t elevated temperatures was more difficult than originally anticipated,
although a number of suppliers fabricate gages for high-temperature work.
Test personnel visited and discussed the specific gage requirements of this
program with various strain-gage manufacturers, other agencies doing high-
temperature testing, and recognized specialists in the field. General im-
pressions gained from these contacts were as follows:
a . Only a few activit ies are performing static (steady-state)
strain measurements on rotating components a t elevated temperatures.
b. Few, if any, are measuring static strains in steep thermal
gradients. The upper temperature l i m i t for most gages used for static strain
measurements is generally around 650 F. 0
c. High-temperature gages are usually attached to the surface by
spot welding, flame spray (Rokide), or ceramic cements. Welding and flame-
spray processes require expensive equipment but are easier to apply than
2 0

cements on large components. Cements require high temperature cures
while applying pressure on the gage.
d. Dual-element gages, using a thermocouple or similar device
to adjust gage performance, require complex bridge circuitry and are ex-
pensive. Even then the gage may be compensated only at one fixed-tem-
perature point, which must be known in advance.
e. The best approach to temperature compensation is probably
the half-bridge configuration where the active (measuring) gage and dummy
(zero-strain) gage are subjected to the same temperature. While satis-
factory for simple tests, this approach is usually not practical on a spin-
ning disk or in thermal stress fields where it is impossible to subject the
dummy gage to identical temperatures without placing it on the stressed
disk.
f . High-temperature gages are available in a broad price range
of fifty to ninety dollars for most dual-element gages. Some single-ele-
ment gages with self-temperature compensation (heat treatment to adjust
the thermal coefficients of expansion and resistivity to specified values)
are available at a cost of about seven dollars.
g. Some gages have a limited useful life at temperature (as low
as f ive hours) due to permanent metallurgical changes in the sensing ele-
ments.
2 . Tests for Gase Selection. Based on the above review, a test
plan was initiated to select and test a number of gage types that appeared
t o offer the best possibilities. From this test, one gage type would be
selected for a detailed evaluation prior to use on the test rotor. The fol-
lowing four types of gages were tested:
B-L-H HT 1235-4B. This is a 1/4-inch, single-element, free-
filament, platinum wire grid with a chromel-alumel thermocouple junction.
The gages are nonself-temperature compensated and are advertised for
static strain measurement to 1 ,200 F. 0
2 1
B-L-H FNH-5 0-12E. This is a universally temperature-compen-
sated, foil gage applied with ceramic cement. The 1/2-inch sensing
element is made of Nichrome foil and includes a platinum-wire compensat-
ing element for temperature to 85OUF. The cement precoat and overcoat
require temperature cure cycles.
Microdot SG-420. This is a half-bridge, weldable gage, which
has a one-mil, platinum-alloy strain filament and a strain-free, tempera-
ture-compensating filament combined in a single strain tube. By using
the proper external temperature-compensating resistor in the bridge com-
pletion network, apparent strain errors with temperature should not
exceed 15 0 microinches/inch. Highly compacted magnesium-oxide
powder is used in the strain tube for electrical insulation and to transmit
strains to the filament. The Inconel strain tube is line welded to a n
Inconel flange for mounting. The overall length is 1.094 inches, and the
gage is advertised for static strain measurement to 950 F. 0
Microdot SG-180. This gage is similar to the SG-420 above,
except that it has a single Nichrome filament usable to 65OoF for static
measurements. Strain tube and mounting flange are s ta inless steel with
overall length of 1.16 inches.
Two gages of each type were mounted on the uniform-stress
calibration beam of Fig. 12 for initial evaluation. Installation and wir-
ing were in accordance with manufacturers' instructions. The gages were
first tested a t room temperature to verify the gage factor and to check
gage stability. A l l gages were found to operate satisfactorily. The cali-
bration-beam assembly with gages was then placed in a furnace and the
temperature was increased slowly to 650 F. The temperature and gage
strain readings due to temperature effects were recorded for several dif-
ferent temperatures during the heat-rise cycle. The tests were repeated
several times to evaluate gage repeatability and stability a t steady-state
temperatures.
0
Based on the results of these tests the Microdot SG-180 gage
was chosen, mainly for its repeatable apparent strain with temperature,
22
e a s e of application, simple bridge circuit, and lowest unit cost. A possi-
ble disadvantage of the Microdot SG-180 gage was the long overall length
of about 1.16 inches. The HT 1235 gage showed excessive apparent
strains a t 6OO0F, and the FNH 50-12E gage was rejected because of its
difficult application process and the requirement of a high temperature cure.
The SG-420 gage requires the addition of a temperature-compensating re-
sistor adjusted for each gage installation. This system would have result-
ed in severe complexities in wiring and difficulties for data acquisition,
making the gage unsuitable for the present purpose in spite of improved
temperature capability. Also, the cost factor of ten over the SG-180 gage
was considered unreasonable for the present purpose in spite of improved
temperature capability.
B. DETAILED EVALUATION OF SELECTED STRAIN GAGE
Ambient and elevated temperature tests were conducted on the Microdot
SG-180 gages to establish gage performance parameters for correction of
rotor test data. Eight gages were randomly selected for evaluation out of
a total of 51 gages procured from the same manufacturer's lot number.
A l l gages were self-temperature compensated to nine parts per million
per F over the range of 75 to 65OoF. This established the maximum rotor
temperature to be used for the high temperature tests. The SG-180 is a
nominal 120-ohm gage with a gage factor of 1.80. Figure 14 shows gage
configuration and construction details.
0
The gages were spot welded to the uniform-stress calibration beam with
32 welds per inch. Four of the gages were mounted for tension loading and
the other four in compression. Nichrome-alloy lead wires were silver
brazed to the gage leads to form a three-lead-wire system. This was done
to prevent signal shifts due to resistance changes in the leads caused by
temperature variations. Iron-constantan thermocouple measuring junctions
were spot welded to the beam alongside and a t the equivalent center of each
gage. The entire electrical hookup duplicated that which was to be used in
23
I

the turbine rotor tests. Figure 15 is a schematic wiring diagram of
the three-wire arrangement and the data-system input conditioning.
1. Siqnal Conditioning. The strain-gage manufacturer recom-
mends a correction for signal desensitization due to effects of long-
lead-wire resistance on bridge sensitivity. The measured resistance
of a single conductor from gage to data system was 1.42 ohms, and
the measured gage resis tances of the eight selected gages varied
from 119.12 to 120.71 ohms. The bridge completion resistors on the
signal-input conditioning cards were precision-quality resistors of
120 ohm. The ' 'natural" gage factor of 1.8, as specified by the manu-
facturer, was modified by a simplified resistance ratio to obtain a
"desensitized" gage factor GFd, or
where: GF = specified "natural" gage factor - 1.80 n R = R = R = R = bridge-completion resistor, ohms 1 2 3 R = measured gage resistance, ohms
r = measured lead resistance -- g
single conductor-gage readout, ohms
Hence, for R = 119.12 and r = 1 .42 , g
12 0 GFd 119.12 + 1.42
- - x 1.80 = 1.7919
The desensitized gage factor was then used in calculating a
calibration set point for adjusting the data system to automatically cor-
rect for the lead-wire effect. A fixed calibration resistor mounted on
the signal-input conditioning card could be internally shunted across
two leads from the strain gage to simulate a strain a t the gage. A re-
sultant strain was calculated and then used as a calibration set point
for adjusting the data system to read out directly in micro engineering
units.
24

That is: " 1 R 'C GFd R + 2r + Rc
- X
g where,
€C = Calculated strain, microinches/inch
GFd = Desensitized gage factor
R = R = R = R = Completion resistor, ohms
R = Gage resistance, ohms
r = Lead resis tance -- single conductor, ohms
Rc = Calibration resistor, ohms
1 2 3
g
For the above example, and R = 50,000 ohms C
- 1 1 2 0 €C
- 1.7919 119.12 + (2 x 1.42) + 50,000
= 0.001336 1336 inch microinches
The above calculations were carried out for the measured resistances
of each gage mounted on the beam, and the calibration set point was
recorded for each gage circuit for future use .
2 . Ggse Performance Evaluation a t Ambient Temperature. Tests
were made with the gages a t room temperature to verify gage perform-
ance, evaluate gage mounting procedures , and to study the effect of
long lead wires. Each gage channel was balanced to zero, and the
gage excitation or span was set for the calibration set point calculat-
ed above. The excitation voltage was approximately 2 . 2 volts which
helped to minimize errors due to gage self-heating. The beam was
loaded with the load screw to produce a measured deflection of 0.614
inch which corresponds to a strain of 2 , 000 microinches/inch. The
load was removed and the gages checked for zero shift. The zero set-
ting was readjusted, and the procedure was repeated several times to
determine the effect of load cycling. The beam was then deflected by
approximately 0.1-inch increments and the strains recorded to verify
the linearity of the gage reading with deflection. To evaluate gage
stability, the beam was loaded for 2,000 microinches/inch and held
for one hour. Strain readings were recorded a t the beginning and end
of the period.
25

The resul ts of the tests at room temperature were satisfac-
tory. They showed that the gages were reliable and that the correct
mounting procedures had been adopted. The zero shift after the first
losd cycle varied from ten to 17 microinches/inch. This shift was
reduced to less than five microinches/inch on subsequent cycles.
The strain readings with increasing loads were linear within approxi-
mately six to eight microinches/inch. Gage creep, the change of
gage strain reading with t i m e a t constant load, was negligible. The
following data were recorded for the different gages at a beam deflec-
tion corresponding to an actual s t ra in of 2,000 microinches/inch:
Gage#l: +1,947 microinches/inch Gage#5: -2,001 microinches/inch
Gage#2: +2 I 000 microinches/inch Gage#6: -2,013 microinches/inch
Gage#3: +2 I 055 microinches/inch Gage#7: -2,008 microinches/inch
Gage#4: +2,007 microinches/inch Gage#8: -2,010 microinches/inch
The largest differences between actual and recorded strains occurred
for gages #1 and #3. However, these gages had been removed from
the load beam after initial installation and then reapplied. It is very
likely that this procedure impaired the reliability of these gages. The
results obtained with the other gages shows that the above-listed cor-
rection for the lead-wire effect establishes correct readings with an
error of less than 0.7 per cent.
Errors could have been introduced also because the sensing
element of the Microdot SG-180 gages is about 0.014 inch above the
be3m surface, or if the structure of the gage reinforces the beam sur-
face. Thus, for a beam in bending, the sensing element experiences
higher strains than those existing in the outer fiber of the beam. Con-
versely., any reinforcing by the gage would tend to reduce the strains.
Test data indicate, however, that these influences are either insig-
nificant for the 0.3 inch thick beam, or that they cancel each other.
3. Gase Performance Evaluation a t Elevated Temperature. - ~
Elevated-temperature tests were made to 600 F to establish the apparent 0
2 6
I"
strain of the gages at different temperatures, to evaluate gage stability
and gage-factor variation with temperature, and t o determine the effect
of temperature cycling on gage performance. The term "apparent strain"
as used in this report includes those induced strains resulting from a dif-
ferential thermal coefficient of expansion between elements of the strain
gage and the test structure. It also includes the indicated strains result-
ing from changes in electrical resis tance of the gage and lead wires due
to variation of the thermal coefficient of resistivity with temperature. The
apparent strain would be zero if the entire gage and test specimen had
identical thermal coefficients of expansion, and if the gage and attached
lead wires had a constant thermal coefficient of resistivity.
a. Evaluation of Apparent Strain. These tests were made by
placing the calibration beam in an electric furnace and gradually increas-
ing the temperature to 6OO0F, followed by cooling in the furnace to room
temperature. The complete cycle of heat-up and cool-down to room-tem-
perature conditions required approximately seven hours. Strain and tem-
perature data were recorded a t frequent intervals throughout the cycle.
The temperature was measured a t each gage location. Slight variations
in temperature could be noted between the different gages. On the heat-
up cycle, the mounted end of the tapered beam was 6-8 F cooler than the
free end, indicating that the beam had not reached full temperatue equi-
librium. Possible effects of this slight variation in temperature were
ignored, and the apparent strains of the individual gages were plotted
against the measured temperatures at the same location. The tes t was
repeated several t i m e s to evaluate the effect of temperature cycling on
gage performance-
0
After the first temperature cycle to 6OO0F there were zero
shifts of a s much as 100 microinches/inch. This shif t decreased to less
than 3 0 microinches/inch after subsequent cycles. This experience
shows the definite requirement for temperature cycling to stabilize and
to insure accurate strain measurement. After the gages had been tempera-
ture cycled and stabilized, the apparent strains were repeatable to within
2 7

two to three per cent. The following average apparent strains were obtain-
ed for the different gages a t 600°F:
Gage #1: + 802 microinches/inch Gage #5: + 759 microinches/inch
Gage #2: + 766 microinches/inch Gage #6: + 784 microinches/inch
Gage #3: + 834 microinches/inch Gage #7: + 778 microinches/inch
Gage #4: + 757 microinches/inch Gage #8: + 766 microinches/inch
Based on these data, the single curve of the apparent strain vs. tempera-
ture of Fig. 16 was established for the correction of the test data obtained
with the turbine rotor.
b. Evaluation of Gage Stability. Attempts to evaluate gage
creep a t a constant temperature were unsuccessful due to difficulties with
the furnace controller, which made it impossible to maintain an exact ly
constant temperature. A s shown by Fig. 16, slight temperature variations
can produce large changes in the apparent strains; hence, gage creep due
to temperature effects could not be identified independently of these tem-
perature and apparent strain variations. Therefore, the zero readings of
the gages at ambient temperature were recorded before and at the end of
a temperature cycle with a one-hour hold at near 600 F. The changes in
zero readings represent the combined effects of gage zero shift and creep.
The combined creep and zero shift for one temperature cycle and a one-
hour hold at 6OO0F was generally less than 14 microinches/inch. The
gages showed good stability over the entire temperature range.
0
During a particular temperature cycle, one of the gages show-
ed an apparent sea in of about twice the normal value found during previous
runs, and the zero setting after cool-down was several hundred counts
higher than that recorded earlier. Investigations revealed that the gage
was partially grounded through a break in the lead-wire insulation. The
insulation was repaired and subsequent tests were normal. This experi-
ence showed that it is extremely important to maintain adequate gage-to-
ground resistance.
c. Variation of Gage Factor with Temperature. Two tests were
made to evaluate the effect of temperature on gage factor. For the first
28

test, the beam was deflected to produce 2 ,000 microinches/inch strain;
then it was placed in the furnace and temperature cycled a s during the
tests for the apparent strains. Strain data from this run were corrected for
temperature by using the apparent strain values established earlier. The
resulting data varied only slightly from the 2,000 microinches/inch preload
setting, with five gages approximately two per cent lower, two gages less
than one per cent higher, and one gage showing no change.
For the second test the procedure was changed to allow for
loading of the beam while at temperature, thereby eliminating the need for
the apparent strain correction. A spacer block was obtained which could
be inserted between the calibration beam and the load-screw bracket of
the holding jig, producing a repeatable strain reading of 1,775 microinches/
inch a t room temperature. The beam, without the spacer block, was placed
in the oven: and the temperature was increased to a particular value. The
strain readings were recorded after the temperature was stabilized. The
spacer block was then inserted, and a second set of strain data was record-
ed. The difference in the two readings was due only to the strain induced
by the beam deflection produced by the spacer block and was independent
of apparent strains. Such tests were carried out at 150, 200, 300, 35 0,
4 5 0 , and 60OOF. The data showed that no change in gage factor occurred
for temperatures up to about 35OoF, and that at 6OO0F the gage factor was
decreased by about four per cent.
4. Summary. The various tests for gage performance evaluation indi-
cate that reasonably accurate test results can be obtained with gages from
the same manufacturing lot number with the following procedure:
a . Mount gages according to manufacturer's instruction.
b. Use standard three-wire hookup for single active gage.
Lead wires connected to gage must be of same material as gage element.
This is necessary for all connections in the thermal environment to avoid
thermocouple effects.
c. Calculate desensitized gage factor for each gage to take ac-
count of res is tance of lead wires.
29

d. Calculate strain for each gage calibration set point to ob-
tain readout in microinches/inch.
e. Temperature cycle gages after installation to stabil ize for
maximum temperature expected.
f . Establish apparent strain curve for each installed gage by
testing representative gages from the same lot.
g. Correct data for gage-factor decay with temperature.
C. DATA LOGGING SYSTEM
A new B & F Model SY 133 solid-state data acquisition system was
obtained during this period of the program which was used for the strain-
gage evaluations and all subsequent rotor tests. The system is capable
of acquiring, displaying, and recording data from pressure-scanning
valves, force transducers, strain-gage bridges, thermocouples, and fre-
quency sources. Adjustments can be made for calibration and direct
readout in engineering units. Data is automatically recorded by a Model
33 Teletype Unit which has print-out and/or punch-tape capability.
Ten thermocouple channels were available with direct readout in
millivolts to three decimal places. The system was calibrated by inputs
from a Leeds and Northrop Calibration Standard. This readout was further
checked during the tests by comparing the signal from the system output
monitor with those read on a precision potentiometer.
Ten channels were used for strain data, each having a completely
isolated, full-floating power supply and separate signal-input condition-
ing. The input conditioning cards contained provisions for bridge-comple-
tion, calibration, and balance-limit resistors (Fig. 15). A balance poten-
tiometer was provided to initially balance the bridge output to zero. The
value of the limit resistor (R in Fig. 15) was chosen to provide sufEi-
cient balance adjustment range, yet minimize the shunting effect of the
balance network on the bridge. Span adjustments were made by adjusting
the bridge excitation, which was maintained by the constant voltage mode
of the power supplies. A calibration resistor mounted on the strain-gage
conditioning card could be shunted across the active gage leg of the
Limit
30

bridge by a toggle switch mounted on the front control panel, which oper-
a t e s through a switching relay. The resultant change in resistance pro-
duced by the high-resistance shunt simulated a strain in the active leg of
the bridge. Using th is procedure prior to a run, each bridge output channel
was balanced to zero; then, with the calibrate switch on , it was possible
to adjust the span control for calculated bridge output, so that each chan-
nel was read out directly in microinches/inch strain.
The data system was loca,ted in the main control room of the Turbo-
Propulsion Laboratory requiring about 60 feet of instrumentation leads be-
tween the slip rings of the turbine rotor and the signal-input conditioning
cards. A shielded 38-conductor cable with matched 20-gage lead wires
was used for these connections. A switching arrangement was provided a t
the data system so that the cable could be used for any combination of
strain-gage and/or thermocouple inputs.
D. INSTRUMENTATION OF TEST ROTOR
The turbine rotor was disassembled and cleaned prior to installing
high-temperature strain gages and thermocouples. A11 gages, wiring, and
residue from the preliminary tests were removed. The new gage lead
wires were attached to the gage by silver brazing prior to installation on
the test rotor. Heat sinks were used to reduce heating of the gage sens-
ing element during lead attachment. Forty-two high-temperature gages
were mounted on the rotor disks by following the same procedure a s u s e d
with the test gages on the calibration beam. The gages were mounted in
pairs, with one aligned radially and the other tangentially, having their
equivalent centers at the same radius. Figure 17 shows a typical gage
alignment and thermocouple installation. For purposes of wiring change-
overs and data recording, the gages were identified corresponding to
rotor-disk face, gage radius, and alignment. For instance, the designa-
tions 1-6.350R and 1-6.350T refer to the radial and tangential gages a t
the 6.350 inch radius on Face 1. The rotor faces were identified as:
3 1

Face 1 = Outer surface of s tage 1 Face 2 = Inner surface of stage 1 Face 3 = Inner surface of s tage 2 Face 4 = Outer surface of s tage 2
Radial positions of the pairs of strain gages and thermocouples
rotor are shown in Fig. 5.
on the
The gage bridge circuitry is shown in Fig. 15. The gage and lead-
wire resistances were measured, and a calibration set point was calcu-
lated for each installed gage using a 50-Kohm shunt resistor as described
earlier. The calculated values varied from 1,3 09 to 1,386 microinches/
inch, depending on gage resistance and length of Nichrome lead wire be-
tween the gage and the hub terminal connector. The lead wires through
the slip rings and the matched conductors to the data system were assumed
to have equal resistances.
The iron-constantan thermocouple junctions were made by spot weld-
ing the thermocouple wires directly to the rotor disk (Fig. 17). A thermo-
couple was placed a t each strain-gage location to provide temperatures
for apparent strain comections. Figure 5 also shows the locations of
additional thermocouples to establish the disk temperature profiles. The
thermocouple lead wires were also connected to the hub terminal connect-
ors of Figs. 6 and 12. Since copper lead wires were used from the hub
terminal connector to the sl ip r ing, the connections a t this location con-
stituted the reference junctions for al l thermocouples on the rotor. A
separate thermocouple was placed at the hub terminal connector with its
iron and constantan wires extending through the hollow spindle. These
wires were connected to the lowest slip-ring connector forming the refer-
ence junction of this thermocouple. The temperature a t this junction was
determined by another thermocouple located as closely as possible to this
slip-ring connector. It measured the slip-ring temperature with respect
to a 32 F electronic reference junction manufactured by Pace Engineering
Company. The general wiring system for the temperature measurements is
shown in Fig. 18. The temperature a t a location on the rotor is obtained
by adding the measured temperature differences AT 12 AT2, and ATg of
Fig. 18. The validity of this procedure was verified by taking direct
3 2
0
thermocouple readings from the stationary rotor with respect to the 32OF
reference junction. This approach used the minimum number of thermo-
couple lead wires , which was of importance because of limited slip-ring
capacity, and allowed the maximum choice in combination of strain and/
or temperature measurements for any run.
VI. ROOM-TEMPERATURE SPIN TESTS
The room-temperature tests of Section IV. B were repeated using the
high-temperature instrumentation and data acquisition system described
above, to verify and possibly improve the accuracy of the earlier-
acquired test data. Changes were made before the test to correct several
problems and deficiencies that were encountered during the previous runs.
A. EQUIPMENT CHANGES
New attaching bolts were obtained for these tests, as mentioned in
Section IVC. They were manufactured from the same material as the orig-
inal ones but with the nominal central shaft diameter increased from 0.3 13
inch to 0.323 inch. Two special test specimens, also made from the same
material, were subjected to tensile tests; and the results are discussed
in Appendix C.
The lead weights previously added a t the blade shrouds for wheel bal-
ancing were removed, and similar weights of s ta inless steel were prepared
for the high-temperature runs. The heaviest of the weights was 40 grams
and would have spanned about four blade segments on the shroud. Because
of the difficulty in attaching and contouring the weight precisely to the
shroud ring and the possibility that the centrifugal forces on the weight
could be concentrated at as few as two points on the shroud, it was de-
cided to carry out the tests without these balancing weights. Table B l of
Appendix B indicates that a stainless-steel balance weight would increase
blade-disk attachment stress by nearly ten per cent. This decision was
also influenced by test experience and confidence gained during the previ-
ous runs, which indicated that balance weights would not be necessary.
33

B. TEST PROCEDURE:
Test procedures were basically the same as those used for the pre-
liminary tests. Ten gages a t a time were connected through the slip rings
to the data system. Each gage channel was balanced for zero bridge out-
put, and the calibration step was adjusted for the exact value calculated
for the individual gage being measured. After the rotor was brought up to
a predetermined speed, the slip rings were closed to apply excitation
power simultaneously to all connected gages. After about 30 seconds
for the stabilization of the gages, the scan cycle was init iated on the
data acquisition system. Scan rate was two seconds per channel; and
since each channel was recorded twice, a complete cycle required only
about 4 0 seconds. The slip rings were then opened, and the speed was
increased for the next data point. This procedure was carried out a t speeds
of 1,000, 1,500, 2,000, 2,400, 2,800, 3,0CO, 3,200, 3,400, 3,600,
3,800, and 4,000 rpm. From 4,000 rpm the speed was reduced by applying
braking air to the drive turbine. During the slowdown, data were usually
recorded a t three or four of the above-listed speeds to check the repeat-
ability of the test data. After the rotor was stopped, the zero and calibm-
tion data were again recorded and compared with those a t the start of the
test. Plots of strain vs. (rpm) were then established for each gage to
evaluate the gage performance over a number of runs.
2
Changeover for the next run required disconnecting various air, lube-
oil, and instrumentation leads, bleeding off tank vacuum pressure, and
raising the tank cover with the suspended rotor. Lead wires from the s l ip
rings were unsoldered a t the hub terminal block and resoldered to other
strain-gage or thermocouple connectors. This lead wire changeover was
very time-consuming but resulted in better test data and fewer runs.
Usually only one run per day could be completed. A physical inspection
was made of the rotor, attaching bolts, and instrumentation leads a t
each wiring changeover.
34

Some of the gages became inoperative during the tests, and unfor-
tunately m o s t of these were located on Face 2. It is believed that their
gage lead wires were pinched at the point where they passed between
the rotor disk and the hub assembly (Fig. 6) and were grounding out. To
correct this condition would have required complete disassembly of the
rotor at the hub and extensive rewiring at the hub connector. A single
gage had been mounted axially on the spacer drum of the second-stage
rotor to find out at what operating conditions the rotor disks came into
positive contact a t the spacer. This was one of the gages which became
defective
C. RESULTS AND DISCUSSION
In Ref. 5 it is shown that the stresses induced at a point in a rotat-
ing disk by centrifugal forces and bending moments are proportional to the
square of the angular velocity. Since for assumed elastic behavior the
stress-strain relationship is linear, plots of measured strain vs. (rpm)
should result in straight-line relationships. This consideration was used
in the data reduction.
The strain data for each individual gage and spin test run were plot-
ted vs. (rpm) and approximated by a straight line giving minimum devia-
tion. A t least two sets of data were available for each gage, and as
many as four were available for m o s t gages. Since data scatter was great-
e s t a t low speeds # the only data obtained above 2 # 000 rpm were used
in establishing the plots. The data scatter about the straight lines obtain-
ed was very small and generally less than three per cent of the average
value.
2
An average straight line was drawn for each gage to represent a best
average of the combined data from all runs. The heavy lines in Fig. 19
show the average strain values for four typical gages on Face 1, together
with bands within which the actual test data scattered about the average
line. A t 4 ,000 rpm the maximum deviation from the average line was
about 4.5 per cent. This is an indication of the repeatability of the
strain readings taken during different runs. The slight variations from
run to run can be attributed to wear in the slip-ring contacts over a peri-
od of t i m e , which affected the contact resistance.
35
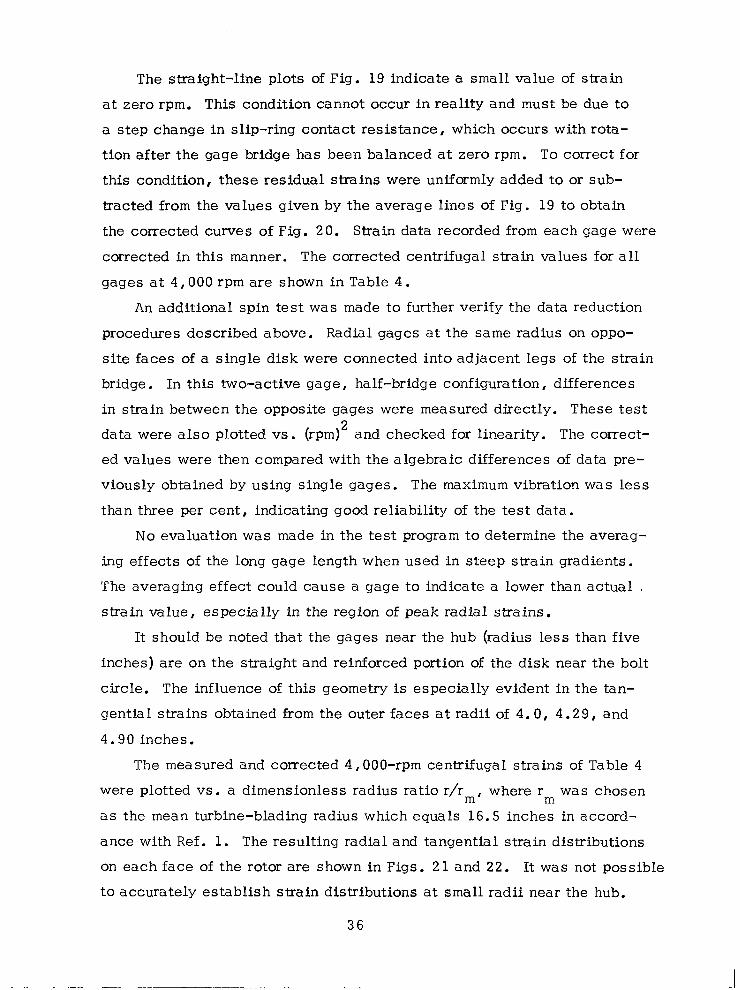
The straight-line plots of Fig. 19 indicate a small value of strain
at zero rpm. This condition cannot occur in reality and must be due to
a step change in slip-ring contact resistance, which occurs with rota-
tion after the gage bridge has been balanced a t zero rpm. To correct for
this condition, these residual strains were uniformly added to or sub-
tracted from the values given by the average lines of Fig. 19 to obtain
the corrected curves of Fig. 20. Strain data recorded from each gage were
corrected in this manner. The corrected centrifugal strain values for al l
gages at 4,000 rpm are shown in Table 4.
An additional spin test was made to further verify the data reduction
procedures described above. Radial gages a t the same radius on oppo-
site faces of a single disk were connected into adjacent legs of the strain
bridge. In this two-active gage, half-bridge configuration, differences
in strain between the opposite gages were measured directly. These test
data were also plotted vs. (rpm) and checked for linearity. The correct-
ed values were then compared with the algebraic differences of data pre-
viously obtained by using single gages. The maximum vibration was less
than three per cent, indicating good reliability of the test data.
2
N o evaluation was made in the test program to determine the averag-
ing effects of the long gage length when used in steep strain gradients.
The averaging effect could cause a gage to indicate a lower than actual . strain value, especially in the region of peak radial strains.
It should be noted that the gages near the hub (radius less than five
inches) are on the straight and reinforced portion of the disk near the bolt
circle. The influence of this geometry is especially evident in the tan-
gential strains obtained from the outer faces a t radii of 4.0, 4.29 , and
4.90 inches.
The measured and corrected 4,000-rpm centrifugal strains of Table 4
were plotted vs. a dimensionless radius ratio r/r where r was chosen
as the mean turbine-blading radius which equals 16.5 inches in accord-
ance with Ref. 1. The resulting radial and tangential strain distributions
on each face of the rotor are shown in Figs. 2 1 and 22. It was not possible
to accurately establish strain distributions a t small radii near the hub.
m' m
36

The available data indicate that strain changes rapidly with radius in the
hub region, particularly by changes in the thickness of the disks and the
presence of the bolt holes. The strain distributions shown by broken
lines in Figs. 2 1 and 22 are included only to indicate how the strains
might behave in the hub region. The limited data available and the vari-
able geometry prevented accurate estimation of strain distributions in
this region. The shape of the broken curves was based on the following
considerations:
a. The centrifugal strain data of Table 4 was assumed to be
valid, even that which indicated unusual strain distributions, since it
had been verified by several runs as explained above.
b. It was assumed that the strain distributions on both outer
faces must be of similar s h a p e , a s must those on the inner faces, s ince
the two disks are geometrically similar. With this assumption the strain
distribution on a particular face was drawn considering both the data
taken on that face and the data taken on the geometrically similar face.
For example, Fig. 2 1 shows a large dip in Face 1 of E at r/r = 0.265
although there is no data a t this radius. However, a tangential gage a t
r/rm = 0.26 on Face 4 indicates that such a dip occurs (Fig. 22); and
since the two faces are similar, it is assumed to also occur on Face 1.
c. When the data. indicated a sharp change in strain, it was
attempted to locate these changes relative to points of changing geom-
etry, such as at the tangent points and a t the outer radius of the parallel
face lugs.
t m
The radial strain at the disk inner radius (r/r = 0.2) was not measured
but was determined from the compatibility equations (given below) and
the condition of zero radial stress at this radius.
m
Once the seain curves were established, stresses were determined
with the compatibility relations for two-dimensional stress conditions
i n a n elastic body
37
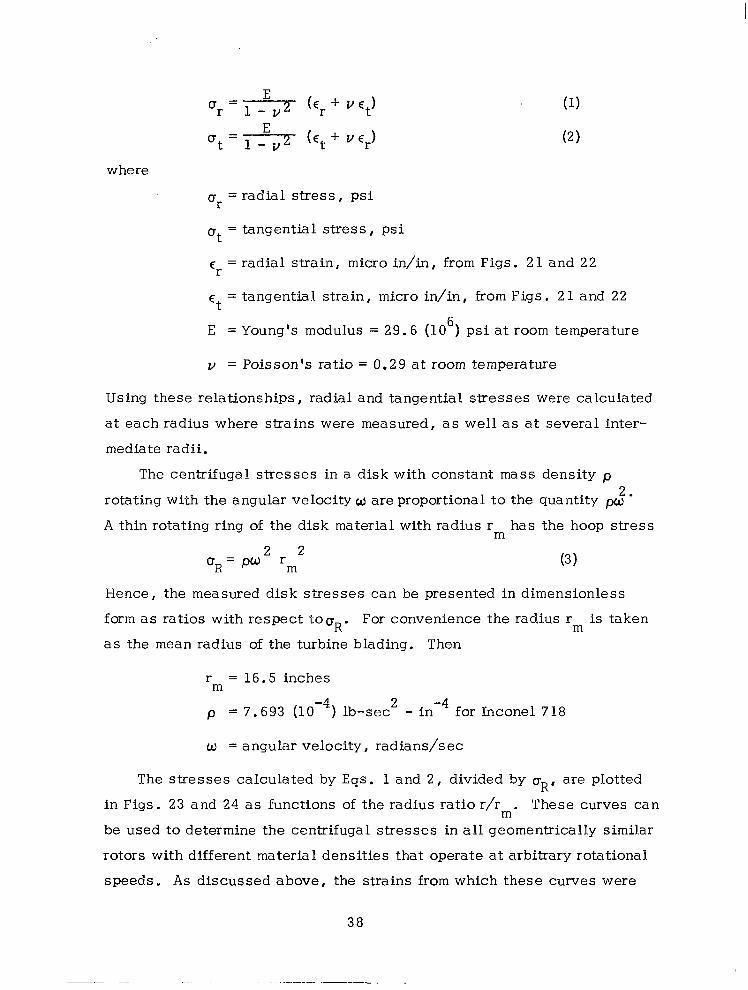
where
'r
at
5-
Et
= radial stress, ps i
= tangential stress, psi
= radial strain, micro in/in, from Figs. 2 1 and 2 2
= tangential strain, micro in/in, from Figs. 2 1 and 22
E = Young's modulus = 29.6 (10 1 ps i a t room temperature 6
I/ = Poisson's ratio = 0.29 a t room temperature
Using these relationships, radial and tangential stresses were calculated
a t each radius where strains were measured, a s w e l l as a t several inter-
mediate radii.
The centrifugal stresses in a disk with constant mass density p
rotating with the angular velocity w are proportional to the quantity
A thin rotating ring of the disk material with radius r has the hoop stress
2 .
m 2 2 uR= pw r (3 1 m
Hence, the measured disk stresses can be presented in dimensionless
form as ratios with respect too For convenience the radius r is taken
as the mean radius of the turbine blading. Then R' m
r = 16.5 inches
p = 7.693 (10 ) lb-sec - in for Inconel 718 -4 2 -4 m
w = angular velocity, radians/sec
The stresses calculated by Eqs. 1 and 2 , divided by aR, are plotted
in Figs., 23 and 24 as functions of the radius ratio r/rm. These curves can
be used to determine the centrifugal stresses in all geomentrically similar
rotors with different material densities that operate at arbitrary rotational
speeds. A s discussed above, the strains from which these curves were
38

calculated were duplicated to within 4.5 per cent on different runs, veri-
fying the repeatability of the stress distributions. The stress distributions
in the hub region are shown by broken lines to indicate that they were cal-
culated from the estimated curves of Figs. 2 1 and 22. Figures 23 and 24
show the tangential stress at the inner bore of the disks where a tangen-
tial strain gage was mounted on each disk. With the assumption that the
radial stress is zero a t this radius, the tangential stress is ut = et E
(Hooke's law). The figures also indicate that the outer faces of both disks
have similar stress distributions, as do the inner faces. This condition
must be due to the geometric similarity of the disks. The maximum stress
in the conical portion of the disks occurs at a radius ratio of about 0.33
on Face 4 . A t 4,000 rpm this stress is about 48.0 ksi in tension.
To obtain a qualitative comparison of the experimental stress distribu-
tions of Figs. 23 and 24 with those of a more conventional non-conical
disk, a theoretical calculation is given in Appendix B.2 for a straight-disk
replacement model of the second stage. A s shown in Fig. B 2 , the conical
disk is replaced by a straight disk of constant thickness which is attached
to another ring of constant thickness that substitutes for the r im. The cen-
trifugal forces of the blades and the shroud are distributed equally over
the outer periphery of the rim, producing a uniform radial stress u In
the following discussion, the disk of the replacement model will be refer-
red to as the straight disk.
1-3
The centrifugal stresses in the straight disk are shown by the solid
lines of Fig. B4. These theoretical curves point out that if the radial
stress is assumed to be zero at the inner radius of the disk, the tangen-
tial stress has a maximum at this station. A sharp drop of this stress is
followed by a gradual decrease a t larger radii, whereas the radial stress
has a maximum at a n intermediate radius and then decreases slightly
toward the outer periphery. The entire disk is in tension.
The general nature of the experimental stresses in the conical disks
of Figs. 23 and 24 and their deviations f rom the theoretical stresses in
the straight disk can be summarized as follows:
39

Outer Faces 1 and 4 . The experimental radial stresses have much
more pronounced and higher maxima than the theoretical stresses in the
straight disk, occuring at radius ratios between 0.325 and 0.425 instead
of about 0.55. They are about twice as high as the maximum radial
stress in the straight disk. However, a t the outer radius of the disk
where the theoretical stress ratio a /u is about 0.5, the experimental
stresses are zero on Face 1 and negative on Face 4. Contrary to the
theoretical stress distributions, the experimentally determined tangen-
tial s t resses decrease from a maximum a t r/r of about 0.5 toward the
hub and toward the outer periphery. Except for the disk portions near
the hub, the experimental tangential stresses have the same order of
magnitude as the theoretical ones. A t the inner bore the ratios a /a
for the first and second stages of the rotor are about 1.6.
r R
m
t R
Inner Faces 2 and 3. The stress distributions on the inner faces of
the test rotor differ considerably from those on the outer faces and have
little resemblance to the theoretical ones. The radial stresses are zero
or negative in the mid-portions of the disks and increase sharply toward
the rims. The tangential stresses exhibit a minimum near r/r equal to
about 0.5, reach values similar to those on the outer Faces 1 and 4 a t
larger radius ratios, and increase gradually to their maxima a t the inner
bore.
m
The differences in stress distribution relative to those in the straight
disk are due to the special geometry of the test rotor. Bending moments
are produced in the conical disks by cenwifugal forces which pull the
disks toward each other. These moments are redistributed in complex
manner if the disks contact a t the spacer drum. Both the sharp increase
of the inner-face stresses and the change of the outer-face radial stress
into compression a t large radii result from these bending moments. In
addition to this effect, the hub geometry influences the stress distribu-
tions. It is probably responsible for the condition that the tangential
stresses at the outer faces tend to decrease near the hub and then to
4 0

increase sharply a t the inner bore of the disk.
The centrifugal stresses for a rotor speed of 6,100 rpm were calcu-
lated from Figs. 23 and 24 to establ ish the stresses which occurred during
the fabrication-evaluation tests discussed in Section N. B.3. A s indi-
cated in Section N.B.3, it was not possible to measure strains at 6 , 0 0 0
rpm due to strain-gage and lead-wire failures. The reference stress o at the maximum speed of 6,100 rpm is 85.464 k s i by Eq. 3. Actual s t r e s ses
are found by multiplying the dimensionless ratios of Figs. 23 and 24 a t
chosen radii by cr The results are shown in Figs. 25 and 26, which repre-
sent the maximum centrifugal stress levels at which the wheel was operated
a t room temperature.
R
R'
VII. ELEVATED-TEMPERATURE STATIC TESTS
A. PREPARATION FOR TEST AND PRELIMINARY RUNS
The objective of the elevated-temperature tests was to subject the
rotor to radial temperature gradients in order to induce thermal stresses
which could be determined from measured thermal strains. The induction
heater assembly and hub cooling plates (Section 111. C. 5) were installed
and adjusted around the rotor as shown in Figs. 10 and 11. These assem-
blies were readjusted after the preliminary runs to reduce the axial t em-
perature gradients across the rotor.
Preliminary runs were made at several induction-heater power inputs
to evaluate the influence of the induction field on thermocouple readings.
Readings were taken both with the electric power turned on and switched
off. It was found that heater power inputs of more than five kW caused
some of the thermocouples to indicate values as much as 50 per cent lower
than those corresponding to the actual temperature. Strain-gage readings
were only slightly affected by the heater induction field. These tests
established the requirement that the heater power must be turned off dur-
ing data taking in order to obtain valid thermocouple data.
41
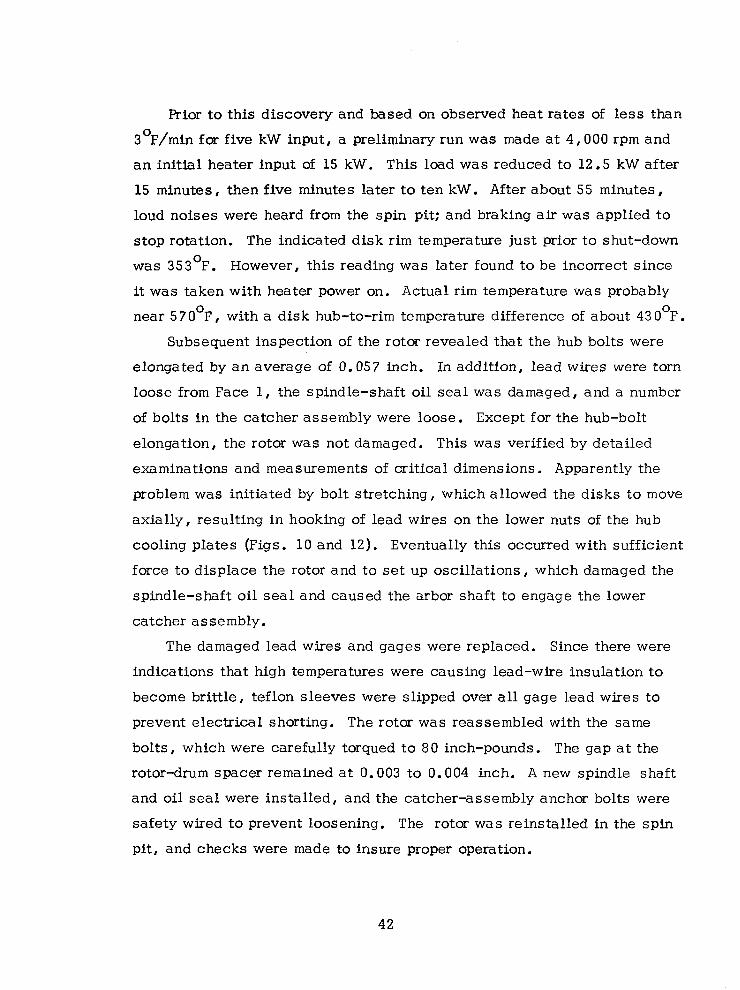
Prior to this discovery and based on observed heat rates of less than
3OF/min for five kW input, a preliminary run was made at 4,000 rpm and
an init ial heater input of 15 kW. This load was reduced to 12.5 kW after
15 minutes, then five minutes later to ten kW. After about 55 minutes,
loud noises were heard from the spin pit; and braking air was applied to
stop rotation. The indicated disk rim temperature just prior to shut-down
was 353OF. However, this reading was later found to be incorrect since
it was taken with heater power on. Actual rim temperature was probably
near 57OoF, with a disk hub-to-rim temperature difference of about 43 0 F. 0
Subsequent inspection of the rotor revealed that the hub bolts were
elongated by a n average of 0.057 inch. In addition, lead wires were torn
loose from Face 1, the spindle-shaft oil seal was damaged, and a number
of bolts in the catcher assembly were loose. Except for the hub-bolt
elongation, the rotor was not damaged. This was verified by detailed
examinations and measurements of critical dimensions. Apparently the
problem was initiated by bolt stretching , which allowed the disks to move
axially, resulting in hooking of lead wires on the lower nuts of the hub
cooling plates (Figs. 10 and 12). Eventually this occurred with sufficient
force to displace the rotor and to set up oscillations, which damaged the
spindle-shaft oil seal and caused the arbor shaft to engage the lower
catcher assembly.
The damaged lead wires and gages were replaced. Since there were
indications that high temperatures were causing lead-wire insulation to
become brittle, teflon sleeves were slipped over all gage lead wires to
prevent electrical shorting. The rotor was reassembled with the same
bolts, which were carefully torqued to 80 inch-pounds. The gap a t the
rotor-drum spacer remained a t 0.003 to 0.004 inch. A new spindle shaft
and oil seal were installed, and the catcher-assembly anchor bolts were
safety wired to prevent loosening. The rotor was reinstalled in the spin
pit, and checks were made to insure proper operation.
42
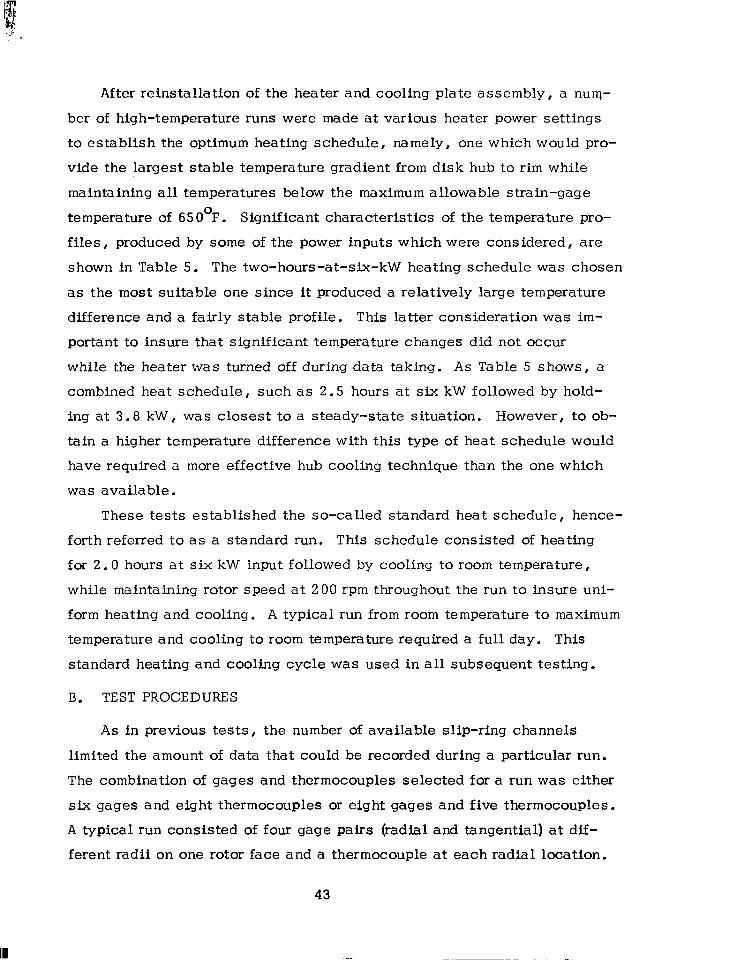
After reinstallation of the heater and cooling plate assembly, a nun)-
ber of high-temperature runs were made at various heater power sett ings
to establish the optimum heating schedule, namely, one which would pro-
vide the largest stable temperature gradient from disk hub to rim while
maintaining all temperatures below the maximum allowable strain-gage
temperature of SSOOF. Significant characteristics of the temperature pro-
files, produced by some of the power inputs which were considered, are
shown in Table 5. The two-hours-at-six-kW heating schedule was chosen
as the most suitable one since it produced a relatively large temperature
difference and a fairly stable profile. This latter consideration was im-
portant to insure that significant temperature changes did not occur
while the heater was turned off during data taking. A s Table 5 shows, a
combined heat schedule, such as 2.5 hours at six kW followed by hold-
ing at 3.8 kW, was closest to a steady-state situation. However, to ob-
tain a higher tempemture difference with this type of heat schedule would
have required a more effective hub cooling technique than the one which
was available.
These tests established the so-called standard heat schedule, hence-
forth referred to a s a standard run. This schedule consisted of heating
for 2.0 hours a t s i x kW input followed by cooling to room temperature,
while maintaining rotor speed a t 200 rpm throughout the run to insure uni-
form heating and cooling. A typical run from room temperature to maximum
temperature and cooling to room temperature required a full day. This
standard heating and cooling cycle was used in all subsequent testing.
B. TEST PROCEDUES
A s in previous tests, the number of available slip-ring channels
limited the amount of data that could be recorded during a particular run.
The combination of gages and thermocouples selected for a run was either
six gages and eight thermocouples or eight gages and five thermocouples.
A typical run consisted of four gage pairs (radial and tangential) a t dif-
ferent radii on one rotor face and a thermocouple at each radial location.
43

The thermocouple at r = 13.0 inches on Face 1 was monitored on every
run and served as a reference point in comparing data from different runs.
Maximum hub-cooling water flow was used on. all runs, and the rotor
was cooled to minimum temperature prior to start of a run. The strain
bridge was balanced for zero output, and the calibration adjustments were
made after the rotor speed was stabilized at 200 rpm and just prior to turn-
ing the heater on. The thermocouple channels were calibrated using a
L-N calibration standard, and readings were periodically cross-checked
using a precision potentiometer.
Heater power input was set and maintained a t six k W with the power
factor at unity. Temperature and strain data were recorded at 15-minute
intervals during rotor heat-up. Slip rings were closed one minute before
data recording to permit strain readings to stabilize. The heater load
coil was disconnected during all data recording, which required about one
minute for scanning all inputs twice. The heater was turned off after two
hours, and the rotor was permitted to cool down. Data were recorded at
30-minute intervals up to three hours after the power was shut off. Ap-
proximately 12 hours were required for complete cool down to room temper-
a ture . The test data were corrected for reference-junction temperatures and
apparent strains. Rotor-disk temperatures were obtained by adding the
terminal connector and slip-ring reference-junction millivolt readings to
the measuring-junction reading and using standard conversion tables to
convert to F. The measured strain values were corrected for apparent
strain using the corrected temperature for the gage location and the ap-
parent strain vs. temperature curve of Fig. 16.
0
C. RESULTS AND DISCUSSION
In Fig. 27 is shown the temperature profile on Face 4 recorded a t
several times during a standard run. Similar profiles were obtained for
Faces 1, 2 , and 3 during other standard runs. The temperature profiles
44

on the four faces could not be compared directly since slip-ring limita-
t ions necessitated a separate run to obtain each profile, and slight
variations in heat input caused by inaccuracies of the heater control
were inevitable from run to run. However, an accurate comparison was
obtained by monitoring the thermocouple a t the 13-inch radius on Face 1
during the runs for Faces 2 , 3 , and 4 , and then referencing this reading
and all other thermocouple readings recorded during the runs to the Face
1 test data. Figure 28 shows the results and establishes the axial tem-
perature variation between rotor surfaces a t the 2 .0 hour point of a
standard run. The first-stage disk was generally cooler than the second-
stage disk, probably because of its larger diameter. Temperature profiles
obtained at other t i m e intervals showed relationships similar to those of
Fig. 27.
A s shown below, the thermal stresses induced by a given tempera-
ture profile were nondimensionalized to be independent of the overall
temperature difference. Therefore, temperature profiles were also non-
dimensionalized to indicate the manner in which temperature is distribu-
ted across the disk, independent of the overall temperature difference.
For a given temperature profile, there is
Dimensionless temperature ratio = AT/AT max (4)
where AT = Temperature difference between radius of
interest r and radius = 4.0 in.
ATmax = Temperature difference between radius =
12.3 in. and radius = 4.0 in.
Thus, the dimensionless temperature is that fraction of the total tempera-
ture difference which occurs from the inner radius, r = 4.0 inches, to the
radius of interest. Values of AT are tabulated as follows: max
45
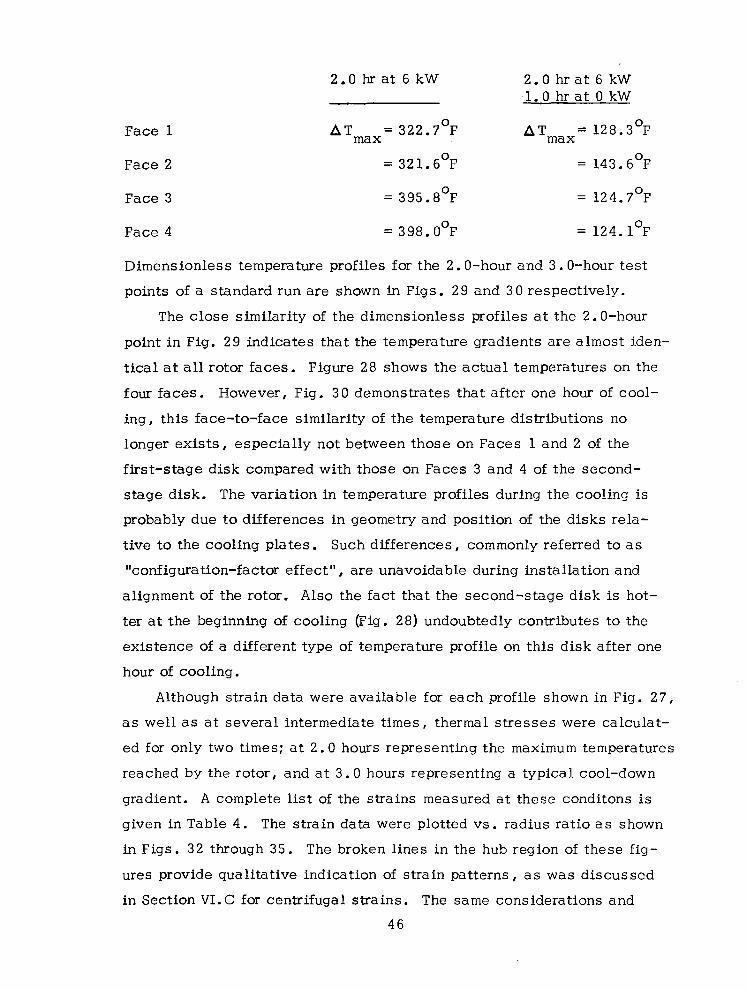
2.0 hr at 6 kW 2.0 hr a t 6 kW -1.0 hr a t 0 kW
Face 1 A T = 322.7 F 0 max ATmax= 128.3OF
Face 2 = 321.6OF = 143.6OF
Face 3 = 395.8OF = 124.7OF
Face 4 = 398. O°F = 124. l0F
Dimensionless temperature profiles for the 2.0-hour and 3.0-hour test
points of a standard run are shown in Figs. 29 and 30 respectively.
The close similarity of the dimensionless profiles a t the 2.0-hour
point in Fig. 29 indicates that the temperature gradients are almost iden-
tical a t al l rotor faces. Figure 28 shows the actual temperatures on the
four faces. However, Fig. 3 0 demonstrates that after one hour of cool-
ing, this face-to-face similarity of the temperature distributions no
longer exists, especially not between those on Faces 1 and 2 of the
first-stage disk compared with those on Faces 3 and 4 of the second-
s tage disk. The variation in temperature profiles during the cooling is
probably due to differences in geometry and position of the disks rela-
tive to the cooling plates. Such differences, commonly referred to a s
"configuration-factor effect", are unavoidable during installation and
alignment of the rotor. Also the fact that the second-stage disk is hot-
ter a t the beginning of cooling (Fig. 28) undoubtedly contributes to the
existence of a different type of temperature profile on this disk after one
hour of cooling.
Although strain data were available for each profile shown in Fig. 27 ,
as well as a t several intermediate times, thermal stresses were calculat-
ed for only two times; a t 2.0 hours representing the maximum temperatures
reached by the rotor, and a t 3 .0 hours representing a typical cool-down
gradient. A complete list of the strains measured at these conditons is
given in Table 4 . The strain data were plotted vs. radius ratio as shown
in Figs. 32 through 35. The broken lines in the hub region of these fig-
ures provide qualitative indication of s t ra in pat terns , as was discussed
in Section V1.C for centrifugal strains. The same considerations and
46
assumptions as described in Section VI were applied to obtain Figs. 32
through 35. The Face 2 data (Fig. 32) were taken early in the test pro-
gram and were not verified due to failure of Face 2 instrumentation as
described in Section VI . This failure also prevented obtaining Face 2
data a t the 3.0-hour test condition. The Face-3 tangential strain gage
at radius 11.02 inches was not operational during elevated-temperature
tests. The strain curve was estimated by the broken line shown, based
on the shape of the Face-2 tangential strain curve in this region.
Thermal stresses corresponding to the 2.0-hour and 3.0-hour t e s t
conditions were calculated by substituting the strains of Figs. 32 through
35 into Eqs. 1 and 2 . Values of Young's modulus and Poisson's ratio
were obtained from Fig. 3 1 a t the appropriate temperatures. No account
was taken of the centrifugal stresses a t 200 rpm since they are neglig-
ible compared with the thermal stresses, and the gage bridges were bal-
anced for zero output with the rotor stabilized at 200 rpm. The value of
u a t the inner bore was again obtained by assuming that the radial
stress vanishes at the inner bore. t
Since thermal stresses depend on the shape of the temperature profile,
as well as on the value of the temperature difference AT/AT between
I hub and rim, and the material properties, they cannot be nondimensional- max
ized for completely general test conditions as can centrifugal stresses.
However, for a temperature profile with equal temperature ratios A T/A T
they can be expressed as fractions of the thermal stress (5 that would
exist in a bar of the rotor material that is completely restrained while its
temperature is increased by AT . This maximum possible thermal stress
is
max
T
max
0 = E cy ATmax T
where
E = Young's modulus of rotor material
cy = Coefficient of thermal expansion of rotor material
AT = Temperature difference between radii 4.0 and 12.3 inches. m a x
47

Values of E are taken from Fig. 31 for the temperatures a t the mean radi-
u s of 8.15 inches; and for the temperatures of the tests, an average
value cy = 7.7 in/in/OF can be used.
The radial and tangential stresses calculated by Eqs. 1 and 2 ,
divided by 0 of E q . 5 , are plotted in Figs. 36 through 39 vs. the radius
ratio r/r for the different dimensionless temperature distributions of
Figs. 29 and 30. These curves can be used to calculate thermal stress
distributions in geometrically similar rotors irrespective of the rotor
material or the overall maximum temperature difference, provided that
the dimensionless temperature profile corresponds to that shown in the
appropriate figures. The statement that thermal stresses are independent
of overall temperature difference AT is correct only if temperature in-
dependence of material properties is assumed. Although this assumption
was not made for the thermal stress calculations, the errors that would
occur with this simplification in the present temperature range would be
within the measuring accuracy of the test data.
T
m
max
The tangential and radial strains used to calculate the s t ress of
Figs. 36 through 39 were not averages of several runs but represent
data from individual test runs. In order to estimate the repeatability of
this data, thermal stresses were calculated from a limited amount of data
available from other runs. These independent data were available a t one
radius on Face 1, three radii on Face 3, and one radius on Face 4 . The
stresses calculated from these data were found to be within 7 per cent
of the points of Figs. 36 through 39.
Figure 36 shows that the highest thermal stress is a tensi le s t ress
on Face 1 in radial direction, at a radius ratio of about 0.34. For the
test conditions, the value of this stress was about 5 0 ksi . It is of inter-
est to note from Figs. 23 to 2 6 that the highest centrifugal stresses in
the conical portions of the disks occur a t about the same radius. These
are also tensile stresses acting in radial direction. The figures indicate
that the temperature distributions for two hours a t six k W with one hour
48

cooling a t zero kW produce stress distributions similar to those without,
cooling, but give somewhat smaller values. From the similarity of the
stress distributions on Faces 2 and 3 of Figs. 36 and 37 it can be antici-
pated that the thermal stress distributions on Face 2 a t the 3.0-hour test
point must be similar to those on Face 3 of Fig. 39.
T o investigate the effect of the conical arrangement of the disks on
the thermal stress distribution, the thermal stresses in the straight re-
placement disk of Fig. B2 were calculated for a linear temperature pro-
file, which closely approximates the temperature distribution at the
2.0-hour-at-six-kW heating schedule. These theoretical calculations
are presented in Appendix B2, and the results are shown by the dashed
curves in Fig. B4. The following conclusion can be drawn from a com-
parison of these curves with the experimental stress distributions of
Figs. 36 and 3 7 .
Outer Faces 1 and 4. Although similar in character, the measur-
ed radial stresses differ materially from the theoretical ones of the
straight replacement disk. A t a radius ratio of about 0.35, they are three
t i m e s higher than those calculated: and whereas the straight disk has ten-
sile s t resses at r/r = 0.75, the measured stresses are compressive
s t resses of about the same magnitude as the maximum tensile stresses in
the straight disk. A t the inner bore, the ratio /o is about 0.925 and
0.71 for the first and second stage respectively compared to 0.68 for the
straight disk. Outside of the hub region, the experimental tangential
stress curves are similar in shape to that of the straight disk. A t the
outer-disk radii where the theoretical value of u /a is about - 0.12, the
experimental ratios are about - 0.3 on Face 1 and - 0.4 on Face 4 , indi-
cating that considerably higher compressive stresses will occur at these
locations than those predicted with the simplified model of the straight
disk.
m
t T
t T
Inner Faces 2 and 3 . Although only limited data were available
from Faces 2 and 3 , it is evident that inner-face stress distributions are
4 9

quite different from those in the straight disk. This is particularly true
of radial stresses, which become slightly compressive at r/rm near 0.4
and increase into tension at large radius ratio. Tangential stresses are
more like those of the replacement disk since they decrease continuously
into compression with increasing radius ratio. However, the slope of
the experimental tangential stress curves changes rapidly over the disk,
whereas that for the replacement disk is nearly constant.
It appears that the thermal loads applied, although much less
than those which would exist in actual operation of the test rotor, were
sufficient to cause bending moments in the disks similar to those dis-
cussed in earlier sections. These moments cause the outer-face radial
stresses to become compressive, and inner-face stresses to increase
in direction of tension at large radii. The disk geometry in the hub region
probably causes the decrease in outer-face tangential stresses at small
radii.
VIII. ELEVATED-TEMPERATURE SPIN TESTS
A. TEST PROCEDURES
Combined-loading tests, relatively few in number, were run near
the end of the program. The rotor was loaded by spinning at 3 ,000 rpm.
Simultaneously the temperature gradients of a standard elevated-tempera-
ture run were applied. A major objective of these tests was to compare
the experimentally measured stresses to those obtained by adding the re-
sults of separate centrifugal (Section VI) and thermal (Section VII) s t ress
tests, to verify that test results approximately correlate with the princi-
ple of superposition.
Rotor speed was limited to 3 ,000 rpm for the following reason. The
strains from separate room-temperature spin tests and elevated-tempera-
ture static tests, when combined, indicated that for speeds greater than
3,000 rpm, rotor strain would exceed that at which bolt elongation occur-
red during the 6,100-rpm fabrication-evaluation run. Three thousand rpm
was thus chosen as the maximum safe speed to prevent bolt elongation,
5 0
when applied in combination with the temperature gradients of the stand-
ard elevated-temperature run.
The procedures were basically the same as used for the elevated-
temperature static tests described above, except that the rotor speed was
stabilized at 3,000 rpm prior to application of heater power. Gage bridge
circuits were balanced to zero, and calibration adjustments were made
with the rotor at zero rpm. The rotor speed was then brought up and sta-
bilized at 3,000 rpm. A set of strain data was recorded at ambient t em-
perature and compared with previous 3,000 rpm data. After verifying the
centrifugal strain values, the heater unit was started: and power was
adjusted to maintain a constant six kW input to the load coil. Heating
was continued for two hours; then power was turned off, and the rotor was
cooled to ambient temperature. Rotor speed was reduced to 2 00 rpm after
one hour of cool down (three hours total) and maintained until room temper-
ature was reached. Both strain and temperature data were recorded, with
heater power off, a t 15-minute intervals during the run. Test data were
corrected for thermocouple reference junction and apparent strains a s
described earlier. Slip-ring contact deterioration became so severe near
completion of these tests that only data from Faces 3 and 4 , taken early
in the series, were considered reliable.
Following combined-loading tests the rotor was removed from the
spin pit. Visual inspection indicated that no permanent geometry changes
occurred during these tests.
B. RESULTS AND DISCUSSION
The corrected values of strain were converted to stress using Eqs. 1
and 2 in Fig. 3 1. These results are shown by the points plotted in Fig. 40.
These points represent the experimentally determined stresses due to com-
bined loads at radii where radial and tangential strains were measured.
An important assumption often made in the analysis of members under
combined loading is that material properties do not vary with temperature.
51

With this assumption the equilibrium, stress-strain, and strain-displace-
ment relations are linear; and the superposition principle can be applied.
In other words, thermal stress and rotational stress can be calculated
separately and added to obtain the total s t resses . For this program the
assumption of constant material properties was not made. Instead, pro-
perties were considered to vary with temperature according to Fig. 3 1.
However, for the temperature range considered, the effect of this varia-
tion on stress is very small: and the superposition principle should give
results similar to those obtained by direct measurement of stresses due
to combined loading. T o verFfy this statement, the stress distributions
for the combined 3 ,000 rpm and high-temperature test runs were calcu-
lated by adding the separate results of spin tests at 3,000 rpm to those of
high-temperature tests after 2 .0 hours a t six kW, reported above in Figs.
24 and 37 respectively. The resulting stresses a re shown by the broken
lines of Fig. 40.
As expected, the results of superposition agree closely with the
stresses measured directly during the combined-loading tests. This fact
is significant for two reasons. First, it implies that the results of the
separate spin and high-temperature tests can be combined to enable esti-
mation of stress distribution for a variety of centruugal and thermal load
combinations. Secondly, the agreement furnishes a final verification a s
to the reliability and repeatability of the test data. The fact that three
separate tests are involved in obtaining the data of Fig. 40 , with the
excellent correlation shown, emphasizes this latter point.
CONCLUSIONS
The centrifugal and thermal stress distributions in the M-1 engine
oxidizer turbine test rotor were experimentally determined for several
test conditions. Calculations made using data from duplicate runs indi-
cated that the stress distributions were repeatable to within f 4.5 per cent
for ambient-temperature centrifugal stresses, and to within 7.0 per cent
for thermal stresses.
52

The dimensionless stress distribution curves can be used to estimate
stresses in any geometrically similar rotor, independent of rotor material,
over a wide range of rotor speeds and thermal gradients. Within the tem-
perature range considered, the superposition principle can be applied to
estimate stresses due to various combined centrifugal and thermal loads.
The measured stress distributions differ significantly from those of a
more conventional straight disk under similar loads. The conical shape of
the disks, the contact which is established between disks under both cen-
trifugal and thermal loads, and the bolted hub-disk attachment geometry
are the primary features which cause these differences.
The mechanical integrity of the entire rotor assembly, tested under
centrifugal and thermal loads for several hundred hours, was satisfactory
at a l l test conditions. The only weakness discovered was hub-bolt
elongation at certain high-load conditions. This weakness was traced to
a n improperly heat-treated bolt material and was not caused by faulty
design.
Due to instrumentation and hub cooling coil limitations, it was not
possible to test the rotor under the maximum thermal gradients expected
in service. Hence, the mechanical integrity of the rotor a t this condi-
tion remains uncertain. This situation is not likely to change until s i m -
ple and reliable strain gages are developed for use at higher temperatures.
However, it is believed that information obtained during this program a t
less severe thermal conditions will prove useful in refinement of analyti-
cal methods to accurately predict thermal stresses in the rotor caused by
larger thermal gradients.
53
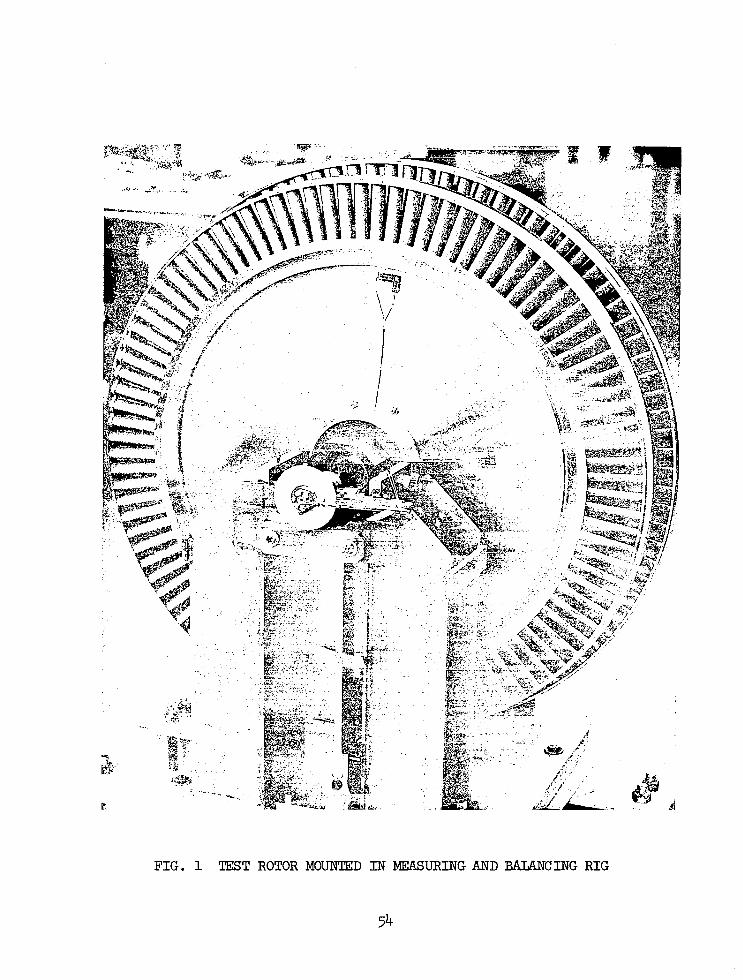
F I G . 1 TEST ROTOR MOUNTED I N MEASURING AND BALANCING R I G
54

THRUS 7 Rdl ANCfP - 1EAk;JGE YEN7S \
ZND STAGE SZl7UR
2ND STAGE RUTU!
?%!ERMA1 CUMPEBJATUR
MORAUL/C 5@/V€ ACCt-5J FLAME
a

FIG. 3 M-1 ENGINE MOCKUP

F I G . 4 INNER FACE OF SECONDSTAGE TURBINE
57

I Tangential Gage
- Radial Gage
Radius measured from shaft centerline.
1/2" I" 2" I
FIG. 5 STRAIN GAGE AND THERNOCOUPLE LOCATIONS - HIGH- TEMPERATURE INSTFWENTATION
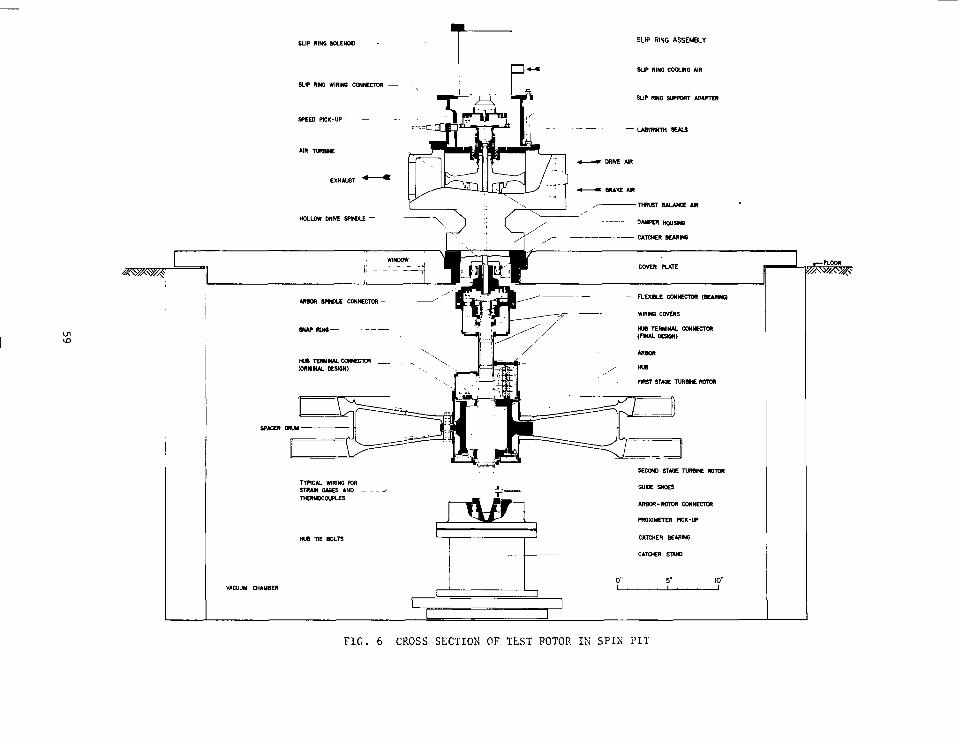
T-l SLIP RING ASSEWBLY
I P- SUP Rl f f i C W L l l G AIR
S P Y I R
VACUUM CHAMBER
ml- H
-" . I SECOHD STYX
,
m m
FIG. 6 CROSS SECTION OF TEST ROTOR IZi S P I J PIT
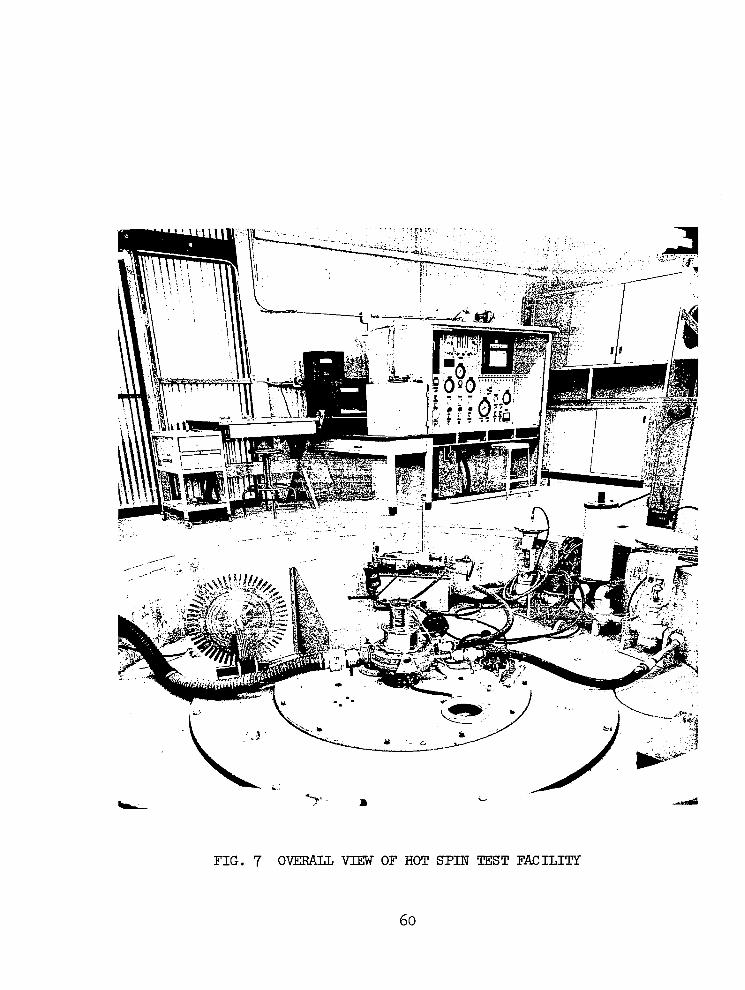
FIG. 7 OVERALL VIEW OF HOT SPIN TEST FACILITY
60

I FIG. 8 HOT SPIN TEST UNIT CONTROL CONSOLE

FIG. 9 TEST ROTOR SUPPORTED IN HANDLING R I G
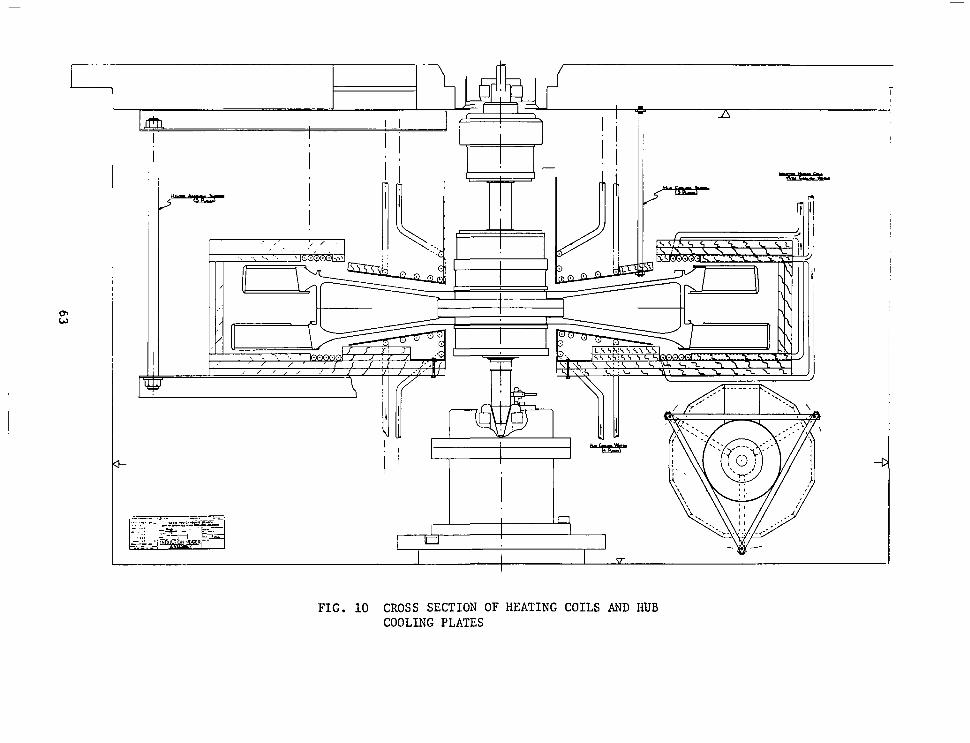
I I I \ /
L
FIG. 10 CROSS SECTION OF HEATING COILS AND HUB COOLING PLATES

F I G . 11 UPPER €EATING COIL AND INSULATION SURROUNDING T E S T ROTOR

FIG. 12 UPPER €IUB COOLING PLATE. (One-half of the cooling plate and the instrumentation cover are removed to show the hub terminal connector, )

Stainley Bolts 1/4-28
FIG. 13 CANTILEVER BEAM TEST J I G AND UNIFORM STNSS-BEAM
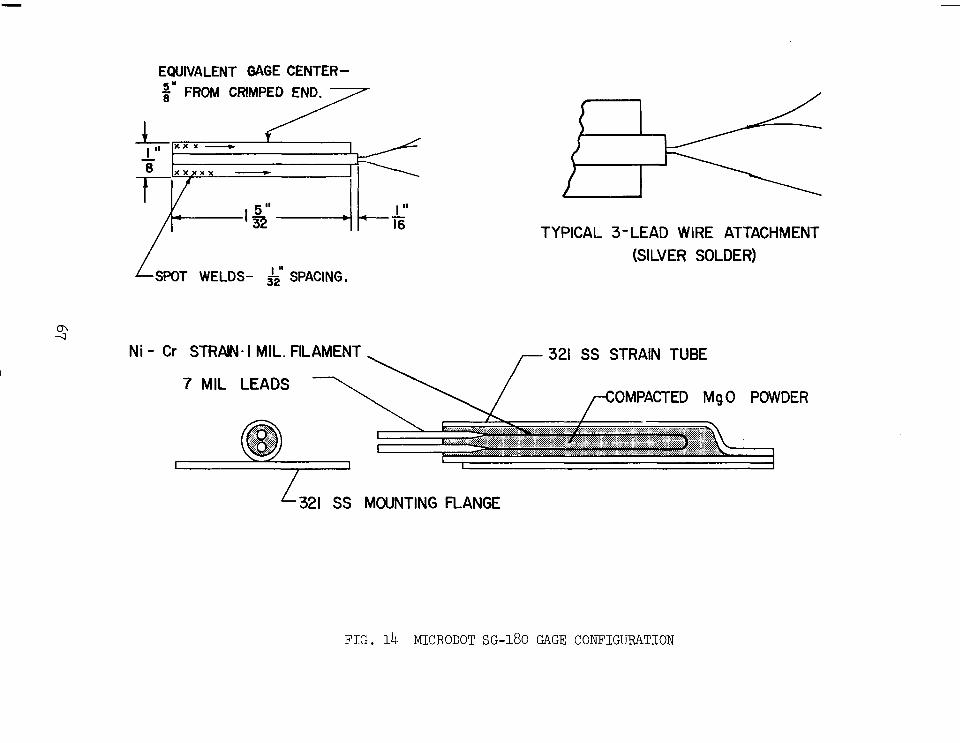
EQUIVALENT OAGE CENTER- 5" 8 FROM CRMPED END.
TYPICAL 3-LEAD WIRE ATTACHMENT (SILVER SOLDER)
LSPoT WELDS- SPACING.
Ni - Cr STRAN- 1 MIL. FILAMENT , 321 SS STRAIN TUBE
POMPACTED MgO POWDER
" I I I
L321 SS MOUNTING FLANGE
FIG. 1 4 MICRODOT SG-180 GAGE CONFIGUFtATION

Balanced Bridge = - = 1
Circuit Desensitization : GF = h G F n
Rl R R2 R 3
Rg+r
I B I I I
I
I I , I i I I \ \
< - V * r I
I C'J LWlJ K+" Hub Slip Instrumentation Lead CaMe
Te rrninal Rings Connector I B I
- E o T to D.V.M.
I I
Relay Rc -A
FIG. 15 STANDARD THREE-WIFE CIRCUIT ILLUSTRATING LEAD-WIRE RESISTANCE AND I W T CONDITIONING

800 d /
//
,700 -
6" -
I
Within These Limits)
I . 200 300 400
Temperature OF
I
FIG. 16 MEAN APPARENT STRAIN WITH TEMPERATURE CURVE EASED ON TESTS OF EIGHT GAGES MOUNTED ON CALIBRATION BEAM

EQUIVALENT GAGE CENTER
\ \ THERN IRON CONSTANTAN I THERMOCOUPLE I
NICHROME RIBBON
(SPOT WELDED)
MEASURED RADIALLY FROM ROTOR CENTER
\ NICHROME RIBBON T I E - D M STRAPS (SPOT WELDED)
GAGE RADIUS MEASURED RADIALLY FROM ROTOR CENTER
FIG. 17 T Y P I C A L GAGE INSTALLATION (MICRODOT SG-180) ON ROTOR DISK
70
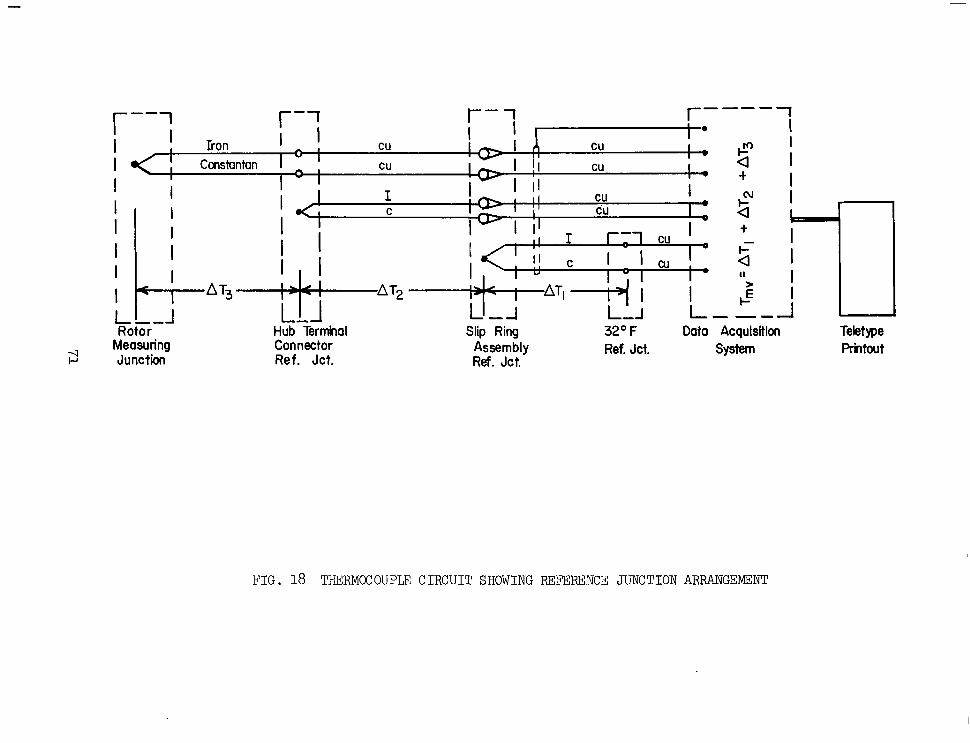
""
1 I r - 7 I I r""- 1 I I
I I I 1 I I 1 I I
I I * t I
I
Rotor Measuring Connector Junction Ref. Jct.
"- Hub Terminal
I I I
> @ "
I I= I I I I 1
Slip Ring 32OF Data Acquisition Teletype Assembly Ref. Jct. System Rintout Ref. Jct.
F I G . 18 THERMEOUPLE CIRCUIT SHOWING REFERENCE JlTNCTION ARRANGEMENT

T 1
\ 5.02 in RADIUS
FIG. 19 STRAIN DATA SCATTER BANDS FOR TYPICAL FACE- 1 GAGES - (Heavy l i n e s denote average of a l l runs )

I
m-
800-
600”
400 -
200 -
FIG. 20 AVERAGED AND ZEROED STRAIN DATA FOR TYPICAL FACE 1-GAGES
73

\ \ \ \
-Determined From Maoaurad Tongmtial Strain And Condition ur = O At I n m R d u r
" . .. - "
"" . .
I
i
I I I
. . ..
7
.. .~ ".
FIG. 21 CENTRIFUGAL STRAINS ON FIRST- STAGE DISK AT 4,000 RPM (Broken lines in hub region represent approximate strain distributions estimated from a limited number of data points. )
74

\
\ - \ ""
I \ \ \
\ \
\ \ -
\ I
I / /
I "1 ,P- /!
i"
j ' I j
I I
I l i t
- Faco 4
Y -
"
1
"\ 1
FIG. 22 CENTRIFUGAL STRAINS ON SECOND-STAGE DISK AT 4,Ooo Rm (Broken lines in hub region represent approximate strain distributions estimated from a limited number of data points. )
75
I

16
I .4
1.2
10
b" 0.8
E \ m
u)
0.6 0 s c 5 0
0.4
0.2
0
- 0.2
Qr = Rodiol Stnss ct = Tongatiol Stnss
r m Mcon Blading Radius = 16.5 in. -
+ Meosurrd Rodiol Stmin Only
/" m-R-Facr I - - . - -
FIG. 23 DIMENSIOKLESS CENTRIFUGAL STFESSES ON FIRST-STAGE D I S K (Stress distributions based on estimated strains are shown by broken lines. )

1.6
1.4
1.2
LC
E oe
8 ti
0.E t
0.4
0. :
O,
-0.;
-r I
I
FIG. 24 DIMENSIONLFSS CENTRIFUGAL STRESSES ON SECONDSTAGE DISK (Stress distributions based on estimated strains are shown by broken lines. )
77

I" \
-\ 10 I
40 - 5.0 6.0 90 10.0 11.0 121) Radiur-in.,
!
FIG. 25 CE2TCRIFUGAL STRESSES ON FIRST-S!CAGE D I S K AT 6,100 RPM (Stress distributions based on estimated strains are shown by broken lines. )

FIG. 26 CENTRIFUGAL STRESSES ON SECOND-STAGE D I S K AT 6 Y 100 RPM (Stress dis t r ibut ions based on est imated s t ra ins are shown by broken l i nes . )
I

1 i i i 1 i 1
03 0
4.0 51) 6.0 7.0 ao 9D 10.0 11.0 12.0 Rodfur - in.
F I G . 27 TEMPERClTURE DISTRIBUTIONS ON OUTER FACE OF SECOND STAGE D I S K A T VARIOUS TIMES DURING A STANDARD RUN

I
Radius - in
FIG. 28 TEMpERllTlTRE GRIU)IZXC'S AFTER 2.0 HOURS AT 6 KW
81

r / rm
FIG. 29 DIMENSIONIESS TEMPERATURE DISTRIBUTIONS FOR 2.0 HOURS AT 6 IW
82

1.0
0.9
0.8
0.7
Q6
P 0.5
k Q \ + 0.4 a
0.3
0.2
0. I
0 I 02 0.3 04 0.5 0.6 0.7 0.8
r/r,
FIG. 30 DIMENSIONLESS TEMPERATURF: DISTRIBUTIONS FOR 2.0 HOURS AT 6 KW FLUS 1.0 HOUR AT 0 KW
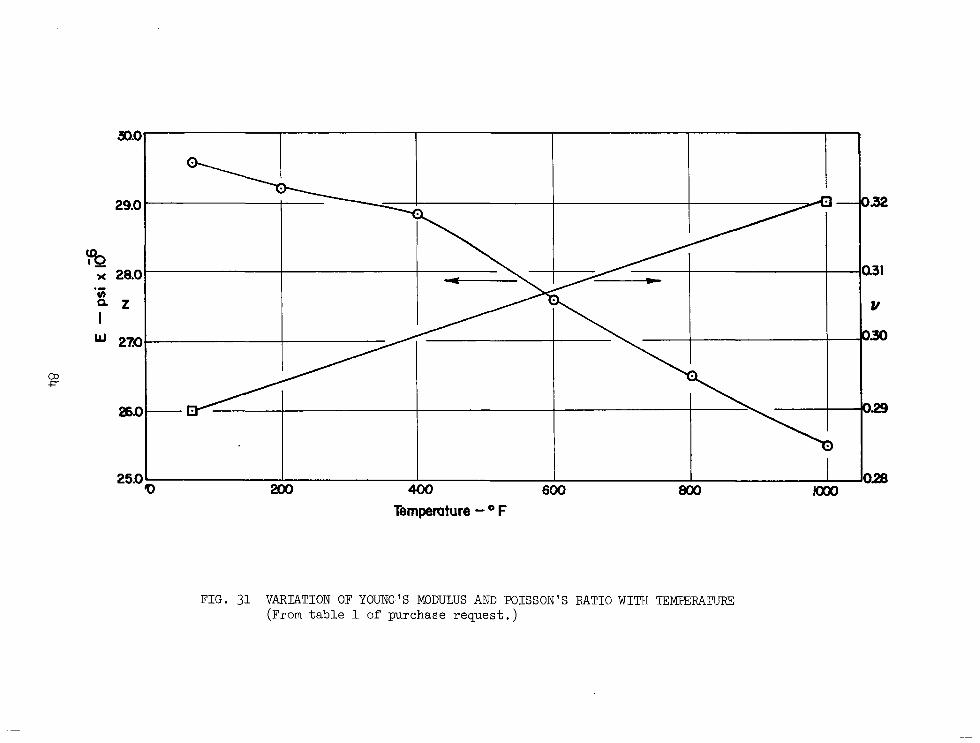
Tempemture - O F
FIG. 31 VARIATION OF YOUNG'S MODULUS A?JD POISSON'S RATIO WITH TEMPERATLIRF: (From table 1 of purchase request.)

FIG. 32 THERMAL STRAINS ON FIRSTSTAGE DISK AFTER 2 .o HOURS AT 6 KFT (Broken lines in hub region represent approxi- mate strain distributions estimated from a limited number of data points. )

\ ! ! *r = Radlol Sfrain I
FIG. 33 THEW STRAINS ON SECOND-STAGE D I S K A m 2 .O HOURS AT 6 KW (Broken lines in hub region represent approxi- mate strain distributions estimated from a linited number of data points. )

FIG. 34 THERMAL STRAINS ON FIRST STAGE DISK AFTER 2 .O HOURS AT 6 KW PLUS 1.0 HOUR AT 0 IW (Broken lines in hub region represent approximate strain distributions estimated from a limited number of data points. )

' r = Radial Strain 't =Tan@ontial Strain m= Mean Blading Radius = 16.5m.
\ \
-\ \ . r ' r - Face 4 ---
I I I
Points
FIG. 35 THERMAL STRAINS ON SECOND-STAGE DISK AFTEX 2 .O HOURS AT 6 IW PLUS 1 .O HOUR AT 0 IW (Broken lines in hub region represent approximate strain distributions estimated from a limited number of data points. )
88
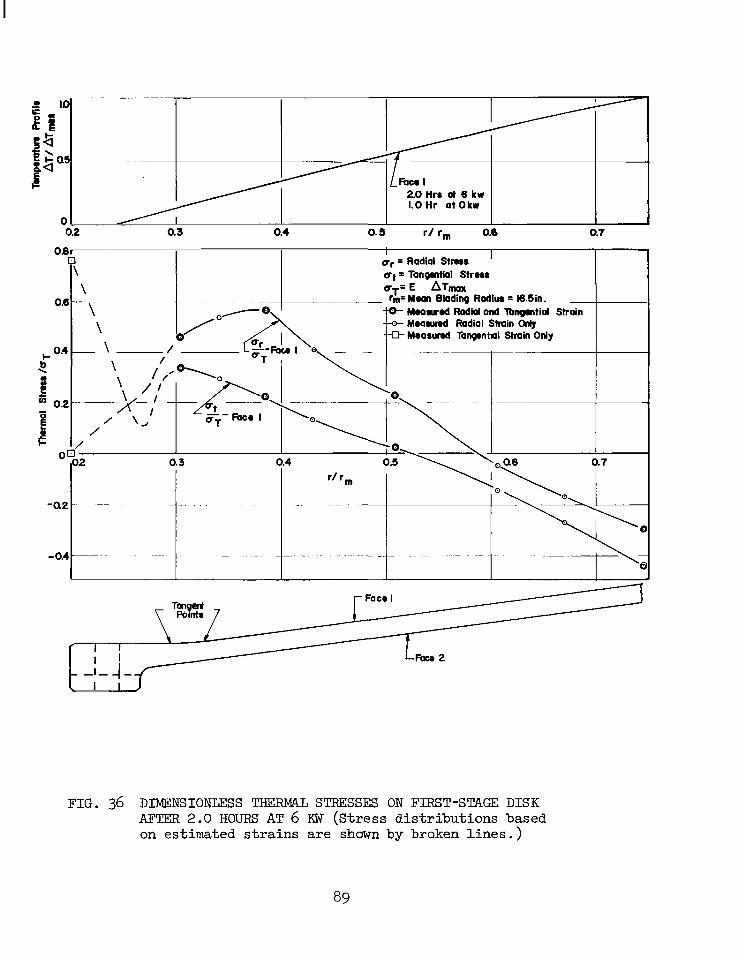
2.0 Hr8 at 6 kw 1.0 Hr at Okw
r/ rm 0.6 0.7
OP
01
~ 0.4
\ b
t ti 0.2 -
0
- 0 2
- 0.1
2 0.3 I I
FIG. 36 DIMENSIONLESS THERMAL STRESSES ON FIRST-STAGE DISK AFTER 2.0 HOURS AT 6 KW (Stress distributions based on estimated strains are Shawn by broken lines.)

Io
0.8
Q6
- 0.2
- 0,4
~ " ~ - r = M i l Strow
=Rmgwnioi S t m u
'm Moan Bbding R o d i = I 6 3 in.
F I G . 37 DIMENSIONLESS " A L STRESSES ON SECONDSTAGE D I S K AFTER 2.0 HOURS AT 6 KW (Stress distributions based on estimated strains are shown by broken lines.)

i- 1
F I G . 38 DLMENS1OM;ESS " A L SmSSES ON FIRST-STAGE DISK AFTER 2.0 HOURS AT 6 KW FLUS 1.0 HOUR AT 0 Kif (Stress distributions based on estimated strains are shown by broken lines.)

1.3 0.4 0.5 r / rm 0.6 0.7
FIG. 39 DIMENSIONLESS THERMAL STRFSSES ON SECONDSTAGE DISK AFTER 2.0 HOURS AT 6 KW PLUS 1.9 HOUR AT 0 KW (Stress distributions based on estimated strains are shown by broken lines.)

0Qu I I -Q- Ur - Facr 4 +ut - F a a 4 Exprinmtally
[ktrrminrd
mi7 "r - k.4-
.- : 40.0 I
3i t 3
4- Suporposition ut- Fa#
M O \
ut "For 3- Supr~pdtion f - V \
0 / 660
I \
3.3 4.0 5.0 7.0 / a0 9.0 0.0 \, 11.0 12.0 / Rodiur - in. I
I I \\o \
"0 Qr - Facr 3- Suporporkion
I I
FIG. 40 STRESSES ON SECOND-STAGE DISK DUE TO COMBINED THERMAL AND CENTRIFUGAL LOADS OF 2 .O HOURS AT 6 KW AND 3,000 Rl" (Data points denote stresses determined from experimental strains measured during combined-load tests. Broken lines denote stress distributions determined by super- position of separate high-temperature and spin test results. )
93

“” -”
GAG E NO.
CAGE LOCATION STRAIS P.T 4000 F??M Elicroinches/inch ~” “
I-1st O=Outer Radia l
””
1
5 1 0 T 6.350 59 5 54@ 567 4 1 0 R 12.473 -295 -180 -235 3 1 0 T 12.473 no data a v a i l a b l e 2 1 Hub T
1 1 7 80 155 3.922 I? 0 1 9 539 405 6 15 3.922 T 0 1 8
111 2 9 20 1145 8.387 R 0 1 7 979 870 1055 8.387 T 0 1 6
1657 1405 15 10 0.350 R 0 1
10 1 l? i m T 13.000 825 80@ 806 11 1 I
-. 480 355 605 4.875 R I 1 18 1509 1440 154@ 4.875 T I 1 17 -472 -470 -475 5.696 R I 1 16 1244 1100 1485 5.696 T I 1 15
322 2 80 365 9 . loo R I 1 14 63 7 565 725 9.100 T I 1 1 3
1195 995 1355 11.905 R I 1 1 2 831 810 880 11.905 T
20 2 0 11.547 -540 -505 -519 2 1 2 0 T 11.547 975 875 9 16 22 2 0 9.079 690 470 614 1 9.079 23 2 0 T 965 945 953 24 2 0 5.743 1520 1215 1304 25 2 0 T , 5.743 770 485 667 26 2 0 E 4.290
-325 -285 -425 5.709 . E I 2 34 985 935 1025 5.709 T I 2 33 411 260 820 8.787 R I 2 32 717 670 770 8.787 T I 2 31
1036 955 1070 11.131 R I 2 30 805 760 835 11.131 T I 2 29 792 760 845 13.000 T R i m 2 2 8 547 480 6 10 4.290 T 0 2 27 182 145 270
36 2 I I R 4.903 no data a v a i l a b l e
NOTE - Gage numbers correspond to Drawing 2007-28, Appendix D
19 1642 1395 1 7 5 5 T ’ 3.300 Hub 2 ”
35 1290 128@ 1330 4.903 I I T 2
I
Table 1 STRAIN DATA FROM PRELIMINARY S P I N TESTS
94

FIEASCRING
STATIONS
1 A & 1 B
2A & 2B
3P. & 3E
4A & 4 B
5A & 5E
6A & 6B
7A & 7B 8 A ti 8 B
.3A & 12B
, c t u a l lpacing letween : i m s a t lpacer Drum
”
F ” ”-
DIMENSIONAL CHANGE I N INCHES ” “
PERIPHERAL F o ~ Z E ~ ~ N ~ E E E L ”_
I
- .001
- . O O l
. O O l
- .002
- .004
”-
.008
.004
.003
.008
.0015
””
I1
- .004
- .002 - .002
-. 004
- .005
.0@6
.003
- .OOl .001
.On3
”- - ”_ - I11 IV AVERAGE
- .OO5 - .003 - .0@325
-.0@1 - .002 - . 0015
.co1 .001 .On025
- . CO6 - ,005 - .On425
-.005 - .904 - .(I045
.005 .0@6 .OC625
.002 .On4 .00325
.001 .oar) .on075
. OOG .006 .00375 ..-I_____ -
.no2 .PO1 .002
NOTES - Measur ing s t a t ions co r re spond t o Urawinp 2 0 2 2 , Pppendix C .
- D i m e n s i o n s l i s t e d o p o s i t e t h e r e s p e c t i v e m e a s u r i n e s t a t i o n s i n d i c a t e a c h a n g e i n t h e d i s t a n c e b e t v e e n t h e o u t e r s u r f a c e s of t h e two r o t o r s . A n e g a t i v e s i g n i n d i c a t e s t h e d i s t a n c e h a s d e c r e a s e d .
Tab le 2 TEST ROTOR DIMEKSIONAL CIIANGES AFTER 6OO@ RPN SPIN TEST FOR FABRICATION EVALUATIOK
95
I
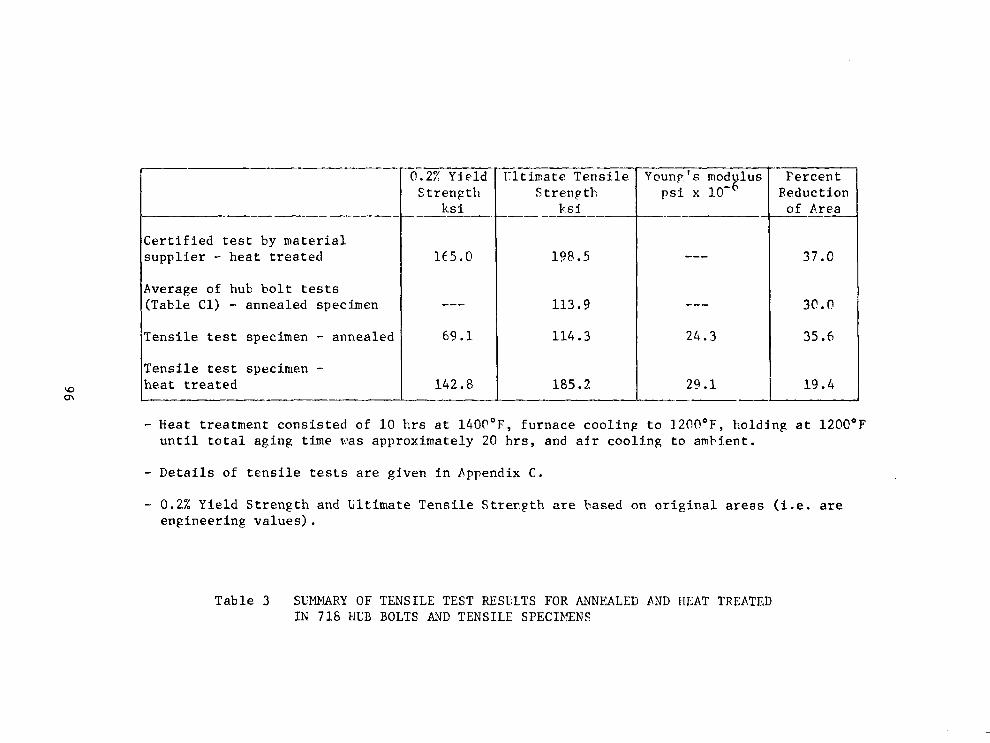
C e r t i f i e d test by m a t e r i a l s u p p l i e r - h e a t t r e a t e d
Average of hub b o l t tests (Tab le Cl) - annea led spec imen
T e n s i l e test specimen - a n n e a l e d
T e n s i l e tes t specimen - h e a t t r e a t e d
"_ 0.2% Yield
S t r e n g t h ks i "-
165.0
"_ 69 .1
142.8
198 .5
113.9
114 .3
185.2
"-
"-
2 4 . 3
29.1
Reduc t ion of F.rea "-
3 7 . 0
3c .c
35 .h
19 .4
- Heat t r e a t m e n t c o n s i s t e d of 10 h r s a t 1400"F, f u r n a c e c o o l i n g t o 12CIO°F, h o l d i n g a t 1200OF u n t i l t o t a l a g i n g time vas a p p r o x i m a t e l y 20 h r s , a n d a i r c o o l i n g t o a m b j e n t .
- Details of t e n s i l e tests a r e g i v e n i n A p p e n d i x C .
- 0.22 Y i e l d S t r e n g t h a n d l i l t i r n a t e T e n s i l e S t r e n e t h are b a s e d o n o r i g i n a l areas ( i . e . are e n g i n e e r i n g v a l u e s ) .
T a b l e 3 SUMMARY OF TENSILE TEST RESULTS FOR ANNEALED AND HEAT TREATED I N 718 HCB BOLTS AND TENSILE SPECI8TNS

-
GAGE LO
Face
1
-
-
2
3
4
.T I O N P.adius
i n 3.300 4 .OOO 5.020 5.625 6.350 7.100 8.387 9.037 10 .ooo 11.020 12.300 5.020 6.350 7.100 8.387 10.000 11.925 5.020 6.013 7.750 9.037 11.020 3.300 4.290 4.903 6.013 7.750 9.037 10.000 11.020
F t CENTRIFUGAL TESTS
S t r a i n a t ,4000 rpm Radia l ' Tangen t i a l m i c r o i n f i n , m i c r o i n f i n -539** I 1860 -117 700 1165 1095 1100 850 7 15 450 80
-210 15
-295 no gage - 70 310 820
no da ta -300 -130 265 1015 -474** 525 725 12 10 920 450 145 -410
NOTES + = Tension - = Compression
49 6 695
550 i no gage I
"
no gage
no gage no gage no gage
730 1330 795 620 510
no gape 630 11.95 790 575 650 810 1635 - 30 590 580 730 826
- 875
71 5
no gage
'I F 'I
ELEVATED TEMPERATURE TESTS (200 rpm) 1 Strain a f t e r 2 h r s a t 6 x
i t r a i n a= P a d i a l m i c r o i n f i n - -672** - 94 1010 1433 1387 1270 865 680 353 80
- 90 78*
-140* no page 260* 892* 11@0*
no data -271 176 844 1412 -627**
64 2 1110 1423 934 462 115 -350
h r s a t 6KW Tangen t i a l
2316 530 7 14
297
84
" m i c r o i n f i n
no gage
no gape
no page no Rage no gape -982 1083* 303* 133*
- 95* no Rage -790* 1157 651
- 54 -284
no d a t a 2 163 12c 767 494 170
- 36 no gape -784
+ 1 h~ Radia l m i c r o i n l i n
-21€.** no da ta 353 444 49@ 364 220
no da ta - 5 - 88 -164
no d a t a no da t a no d a t a no data no data no da ta no da ta 425 44 313 370 -2@3** 115 355 436 310 87
- 34 -236
"-
-
e , -
"
at 0KW rTangen t i a l m i c r o i n f i n
747 no d a t a
199 no page
5 6 no gage
- 43 no gage no gage no gage -351
no da t a PO d a t a no da ta no da t a no d a t a no da ta
380 328 -185 -212
+700 68 241 95
- P 7 -154
no gage -350
:e ** = Calculated from Condition ur = 0 a t d i s k hub bore
Tabel 4 CORRECTED S T M I N DATA FROM ROOM TEMPERATURE SPIN TESTS AND ELEVATED TEPPERATURE TESTS

"" -
Tempera ture a t r a d i u s = 1 3 . 0 in.-OE'
Tempera ture a t r a d i u s = 4 . 0 in.-'F
I A T Rate of t empera tu re change d u r i n g d a t a r e c o r d i n g OF/min
1- I T i m e From Room Temperature and Heater I n p u t
2 h r s a t 6 bw
566
210
356
4 "
2 . 5 h r s a t 6 kw
"
604
256
348
- 2 . 5 hrs a t h ktg + 1 h r a t 3.Pkw
600
355
245
3
1 h r a t 10 kw
576
146
4 3 0
14
"
3 hr a t 5 kv
5 7 1
254
317
4
NOTE - 2 h r s a t 6 kw chosen as o p t i m u m . O t h e r c o m b i n a t i o n s e x h i b i t e i t h e r i n a d e q u a t e AT or e x c e s s i v e t e m p e r a t u r e c h a n g e d u r i n p d a t a r e c o r d i n g .
T a b l e 5 CHARACTERISTICS OF DISK TEMPERATURE PROFILES FOR SEVEF.AL HEATER POWER INPUTS

REFERENCES
1. Beer, R. , AERODYNAMIC DESIGN AND ESTIMAm PERFORMANCE OF A
TWO-STAGE CURTIS TURBINE FOR THE LIQUID OXYGEN TURBOPUMP OF THE M-1 ENGINE, NASA Report No. CR 54764, 19 November 1965.
2. Roesch, E., MECHANICAL DESIGN OF A CURTIS TURBINE FOR THE OXIDIZJCR
TURBINE OF THE M-1 ENGINE, NASA Report No. CR 54815, 15 June 1966. 3. Beer, R. , FABRICATION OF LIGHTWEIGHT TURBINE COMPONENTS USING
ELECTRON-BEAM WELDING FOR THE A'ITACHMENT OF SHEET METAL BLADES
TO DISCS AND SHROUDS, NASA Report No. CR 54814, 15 October 1966. 4. Zlatin, N. , Field, M., Koster, W., FINAL REPORT ON MACHINABILITY
OF MITERIAIS, Contract AF 33(615) - 5262.
5. Harshberger , R. , Troutmn, D. , CENTRIFUGAL STRESSES I N CONICAL
ROTORS AND ROTORS OF ARBITRARY CROSS SECTION, Masters Thesis,
Naval Postgraduate School, May 1966. 6. Vavra, M. , AGARD-VKI LECTURE SERIES ON FLOW I N TURBINES , - FULDIAL
TURBINES, Lecture Series 6, Part k , March 1968. 7. Dovey, D. , Gadd, E., Mitchell, E., HEAT "ATMENT OF METALS,
London: Addison-Wesley Publishing Company, Inc., 1963.
99
APPENDIX A
DESIGN OF SPECIAL EQUIPMENT
1. Rotor Suspension System
The 8 inch Barbour-Stockwell turbine, can have a maximum spindle
diameter of 0.625 inch. With a 518 -32- Class 2 thread the minimum outer spindle diameter can be 0.57 inch. Thus, with a spindle central bore of
0.407 inch, the minimum cross sec t iona l sp indle a rea i s 0.125 inch'. The
weight of t he t u rb ine ro to r i s about 380 pounds giving a m a x i m u m t e n s i l e
s t r e s s of 3040 p s i . With a spindle material having a y i e l d s t r e s s of
about 90.0 k s i , or a permiss ib le shear s t ress of about 45.0 k s i , t h e
m a x i m u m torque, q, that can be t ransmit ted by the sp indle is
4 M ( '571f;i407 ) (45,000) = 1210 in- lb t i 6
For a y i e l d s t r e s s of 90.0 ks i , t he maximum bending moment, M t h a t
can be exerted on the sp indle is e q u a l t o q, since B'
4 '574- .407 ) (90,000) = 1210 in- lb
Drawing 2OO7-2A of Appendix D shows t h a t t h e C . G . of the turbine i s located
about 15 inches below the point where the sp indle is a t t ached t o t he a rbo r
support. If the arbor were connected r i g i d l y t o t h e s u p p o r t an eccentric-
i ty , e, of the tu rb ine ro tor would produce a moment M of
M = m u) e (15) 2
where 380 32.2
m = mass of tu rb ine ro tor = - = 11.8 slug
u) = - 30 " (7000) = 730 rad / sec a t 7000 rpm, the maximum ant ic ipated
spin speed
e = eccen t r i c i ty ( i nch )
o r
M = (11.8)(53.3) 10 (15) e = 9.44(10 ) e . 4 7
fo r M = MB = 1210 in - lb the permiss ib le eccent r ic i ty would be l imi ted to
1 - 2 1 x lo3 1.28 inch e = 9.44 x 10⁷- 105
100

Since it would not be possible to maintain such a small eccentriciky,
it was decided t o suspend the arbor by a se l f -a l ign ing ba l l bear ing ,
Fafnir Ty-pe 304 S, which has a carrying capacity of about 1500 pounds.
The torque is transmitted by pin 2016-8 (Drawing 2OO7-2A) of 0.2 inch
diameter. For a torque of 1210 pounds, t h e s h e a r s t r e s s i n t h e p i n i s
40.0 k s i .
Arbor 2018-1 was used a l so to ba lance the ro tor assembly. For
th i s reason it was equipped with surfaces t o accommodate two self-al igning
bal l bear ings, Fafnir Type 208S, with a bore of 1.57 inch, which are 8 inches apart. With i ts axis horizontal for balancing, the deflection, f ,
of the arbor is about
380 R3 (380>(83> f = - - " 45 inch IE = TT (1.57,4(30)(106)(48) lo3 64
The other elements of the arbor attachment were calculated such
that permissible s t resses are not exceeded fo r e i t he r a torque of 1210
in-lb, or an axial load of 380 pounds.
A s shown i n paragraph A. 2 the turbine rotor assembly has a polar
mass moment of i ne r t i a o f 141.2 in-lb-sec . I n o r d e r t o avoid damage
t o t h e hollow spindle, that is, to i n su re t ha t t he moment of 1210 in-lb
which it can safely handle, is not exceeded, the accelerations o r
2
decelerations of the
the maximum possible
dr ive assembly must be l imited. From
in- Ib ,
rad/sec , = 8.57
t ime rate of speed N i s
For safety reasons the unit was therefore not accelerated or decelerated
by more than about 1000 rpm per minute
101
II I
2. Measuring and Balancing Rig
a. Determination of Flexibil i ty of Flexures. It was assumed t h a t
the natural frequency of the system with one bearing clamped and the
.other freely supported by the f lexure would occur a t a speed of 100 rpm.
The natural flrequency of the system of Fig. Al was determined from the condition that the t ime rate of change of the angular momentums of
the system must be equal to the moments tha t a re exer ted on it. For def lect ions in the y-direct ion of Fig. Al, and with the C . G .
of the rotor located halfway between the two supports, there are
and
where
e = a
B =
B =
e = P M = z
% =
mass moment of iner t ia of ro to r fo r a l ine perpendicular
t o shaf t
angle of deflection
- dB d t
polar mass moment of iner t ia
moment about z-axis
moment about y- axis
For a rotor without unbalance the moment M i s zero, and i s produced
by the spring force F. Let Y
F = C Y
where c i s the spring constant -of one flexure. Then
M = - F - = - C - y L L z 2 2
Further
Then
- ( ( e , f ) = - c p y = - d L a *. 8
d t L Y
102

or *. CL 2
a y + i J J - y = O
The angular velocity wc a t resonnance i s then obtained from
y = A COS (.),t) giving
For 100 rpmthe value of wc must be - ( loo) , or about 10 radians per
second.
l-r
30
For bodies of revolution of the type shown i n Fig. A2, whose
meridional cross sectional area i s symmetrical with respect t o an axis
para l le l wi th the axis of symmetry, there are
6 = 2rrpR(R2A + 31,) P
2 0 = npR(R A + 31m + 21a) a where
0 = polar mass moment of i ne r t i a
ea = mass moment of inertia with respect to axis a-a perpendicular P
to ax is o f symmetry
A = cross sectional area in meridional plane
Im = moment o f iner t ia of A with respect to axis m-m of Fig. A2
1, = moment of i ne r t i a of A with respect to ax is a-a of Fig. A2 =
I n + A g
In = moment of i ne r t i a of A with respect t o axis n-n of Fig. A2
p = mass density of material
The turbine disks and the hub were replaced by 18 bodies of revolutions of the type for which the above-listed equations hold. For Inconel 718 with a specific weight of 0.297 lb/in3, or P = 0.297/(32.17 x 1 2 ) = 7.69(10- )
lb/sec / in , the summation of the values for the individual cross- sectional 2 4
areas gave:
4
Qp = 141.2 (in-lb) see
8, = 73.2 (in-lb) sec2
2
103
m e same replacement of the actual disk shape was used also to determine
the weight w of the bladed turbine disks and the hub, and was found t o
be
w = 317 l b .
For L = 8 in , 8, = 73.2 ( in-lb) sec2, the spring constant c of the f lexure
for wC = 10 rad/sec is
2 2 8, c = ,2
= 228 lb / in . L
b. Determination of Dimensions of Flexure. Design considerations
establ ished the length "A" and axial width '1,'' of the f lexure (par ts 2026-1 t o 3 of Drawing 2022 Appendix D ) as
L = 14 inches
b = 2 inches
It was then necessary to determine i ts thickness "t" to g ive the
necessary spring constant. A check was made a l s o t o i n s u r e t h a t t h e
flexure i s safe against buckling. O f i n t e r e s t i s fur ther the def lec t ion
Ax of the f lexure i f an assumed force of 100 pounds i s acting on it i n t h e
d i rec t ion o f the
with E = 10( lob)
The c r i t i c a l
ro tor ax is . The flexures are made of Aluminum 606~~651 p s i .
buckling force FB i s
Since O G ~ f lexure has to support about 170 pounds, the sa fe ty fac tor u
against buckling i s
u = Fg/170
Permissible forces acting on a column also depend on the s lenderness ra t io
o r the compressive s t r e s s , oc = FdA, must not exceed t h e e l a s t i c limit
of the material , i f the slenderness ratios are small . Fig. A3 shows the
calcxlated data. For a spring constant c = 228 lb/ in the f lexure thickness
t must be about 0.5 inch. A f lexure of this thickness i s safe against

buckling. Since an attainable speed of 100 rpm with the existing source
o f a i r was an assumption, and because of the simpliQing assumptions made
for the ca lcu la t ions (st iff shaft, ignoring of gyroscopic effect and
bear ing res t ra in ts ) it was decided t o manufacture two addi t ional pairs of
f lexures with t = 0.28 inch, and t = 0.38 inch, giving values of c of 42
and 100 lb/ in respect ively. Other quantities remaining equal, the three
sets of f lexures would produce resonance conditions a t wc = lo%, 66%, and 4'36, f o r t = 0.5, 0.38, and 0.28 inch, respectively. Due t o i t s large
s lenderness ra t io the th innes t f lexure w i l l not buckle.
3. Rotor Handling R i g
The handling r i g must be cayable of supporting the rotor assenibly whether i t s axis i s horizontal or ver t i ca l . I ts design must be such
t h a t it can be l i f ted by a crane, and tha t the ro tor can be located
above the f lange of the spin pi t for assembly purposes, and t o a s s u r e t h a t
no damage w i l l occur. Drawing 2021-1 shows the design of the r ig. The aluminum extrusions
have dimensions of 1-3/4 x 3 x 1/8 inch wall thickness. The maximum and
m i n i m u m moments of iner t ia a re 1.3379 and 0.5564 i n , with corresponding
sect ion moduli of 0.8919 and 0.6359 i n 3 , respectively.
4
For the ro tor axis in ver t ical posi t ion, each of the three extrusions
of 52 inch length must support 380/3 = 127 pounds, giving a bending moment
of (127)( 52)/4 = 1650 in-lb. The m a x i m u m bending s t r e s s is 1650/0.6359 =
2600 p s i , and the deflections f of the members are
The bending moment exerted on the 5/8 inch diameter pins, (2021-4) , that hold the wooden blocks is about (127) (3) = 381 in-lb, giving a bend-
ing s t r e s s of 381/0.024 = 16,000 psi i f one o f t h e two p i n s c a r r i e s a l l t h e
load. With the rotor axis horizontal , one of the three extruded members
car r ies the whole rotor weight. The bending s t ress in the midsect ion of
t h a t member i s then
I
oB = 2600 X 3 X o.8919 0.6359 = 5600 p s i
and i t s def lect ion f becomes
f = 0.067 X 3 X 0*5564 = 0.083 inch 1.3379 The mater ia l of the extrusions has a yield strength of about 35,000 p s i ,
hence, even with a s t ress concentrat ion factor of two because of the
holes for s teel p ins , t he s a fe ty f ac to r o f t he r i g is more than 2.5.
If t h e r i g i s suspended by a s l ing a t tached to rod 20: -13, t h a t i s
inser ted in spindle 2021-10 having a diameter of 0.75 inch, the diameter
d of the rod is obtained from
and
where
F = load
k = st ress concentrat ion factor
0 = t ens i l e s t r e s s i n sp ind le
7 = shear stress i n rod
for equal ut i l izat ion of the rod and spindle materials. For equal materials
with 7 = a/2 and k = 2
d = 0.343
Then, with F = 400 lb .
7 z - z *O0 2,200 p s i n/ 4d2
ko M 2T2 = 8,800 p s i
106
FIG. Al PRINCTPLF: OF ROTOR BALANCING SYSTEM
V A x i s of Rotation (Symmetry) I I
e I
Sectional
to m-m a " 2 :
I - - - -a
- .. . ~ ~.
FIG. A2 MASS MOMENT OF INEEITIA OF BODY OF REVOLUTION
107

16
15
U I4
I3
12
I I
io
9
8
7
6
5
4
3
2
I
0
x C
Ib/ in
240
2 20
200
BO
160
1 4 0
120
100
80
60
40
20
I I
I U = Safety Factor Against Buckling, ~~
1 = I4 in, b = 2111. See Drawing 2022
c = Spring Constant of One Flexure - Ib/in 1 -3000 h = I / m A = Slenderness Ratio /
=c - c c = Cr i th1 Compressive Stress - psi (psi 1 AX =Axial Deflection at Both Fledures (in),
- 2600
/ I
for Force of 1 0 0 Ib.
-1400
- loo0
0.03
0.2 0.28 0-3 0.30 0.4 t = Thickness of Flexure -In.
0.5
FIG. A 3 EVALUATION OF BEARING FLEXITRES

APPENDIX B
STRESS CAICULATIONS
1. Centrifugal Stress Due to Balance Weights
Figure B1 is a simplified model of s stage 2 single blade segment with balance weight. Figure 1 shows an actual balance weight mounted on the test rotor. The model was assumed in order to estimate the effect of balance weight on o ~ ~ ~ , the total centrifugal stress at the disk rim, as indicated below.
o = centrifugal stress due to shroud - psi ob = centrifugal stress due to blade - psi Obw
S
= centrifugal stress due to balance weight - psi
F = centrifugal force due to shroud - lb S
= blade cross sectional area - in 2
Similarly,
. Ob = Fb/%
Obw = 'bW'%
In general,
m = mass - slugs w = angular velocity - radians/second R = radius - I%
Eq. B(5) into Eqs . B(2), B(3) and B(4) gives (with Fig. Bl)
In UI 2 2
S m w Ro
- Os - (Ro + t/2) S
% where m = mass of shroud segment
S
= p (t) (s) (1) with p = mass density = 15.95 lbf - see2 - ft -4 for Inconel 718, and t, s , and R in units of ft.
109
2 2 "bw %w Ro =- (Ro - h/2)
Obw I+, % mbw or , with Eq. B(6), abw =- a
S
where % = mass of blade = p H with H and % in units of ft and ft respectively 2
o r P H W Rm 2
Ob - 144 -
For the second stage disk, the following dimensions (shown in proper units) were obtained from Ref. 3.
% = 0.241 in = 1.67 (10-3)ft 2 2 n
t = 1.67 (10-~)ft R = 1.60 ft
0
R = 1.375 ft H = 0.45 ft m
R = 0.15 ft The balance weight mass per blade was found by weighing to be 7.71 grams, o r 0.528 x slug. For the 94 blades of the second stage, s was obtained as:
s = R ( ) ( ) = 0.167 ft 360 0 % 6
For N = 6100 rpm,
w = - ITN = 638.47 radians/sec. 30
Substitution into B(7), B(g), B(11), and B(1) yielded the stresses shown in Column A of Table B1.
Stainless steel balance weights, of maximum total mass 39.78 grams, were considered for the high temperature spin tests. Hence a second calculation was made to establish the effect of a stainless weight not
110
in uniform contact with the shroud. Nonuniform contact could occur with stainless steel weights due to slight curvature differences between the weight and the shroud and due to the inability of relatively stiff stainless steel to deform and match the shroud curvature at speed,
For the calculation it was assumed that the balance weight was concentrated at two points on the shroud giving 19.89 grams , o r 1.36
slug, per blade. The results for the maximum speed of 4000 rpm are shown in Column B of Table B1.
2. Stress Distribution in a Straight Replacement Model of the Second Stage Rotor
The procedure for theoretical calculation of the centrifugal and thermal stress distributions in a conventional straight disk is given in this paragraph. The disk chosen is a model of the second stage rotor disk, as shown in Fig. B2. The results of this calculation, when compared to the experimental results obtained for the test rotor, permit qualitative assessment of the influence of the conical shape of the rotor.
a. Centrifugal Stress Distribution. Assuming that the centrifugal force of the shroud is equally supported by the 94 blades of the second stage, there are from Fig. B2.
r4 + r r = mean radius = 5 S 2
t = thickness S = r5 - ‘4
S = - g F
217 rs R = length
b = width
m = mass = p(ts)(bs)(Rs) where p = mass density for Inconel 718
Then Fs, the centrifugal force produced by one shroud segment is F = m UJ r with UJ = angular velocity, radians/sec.
S
S
2 S S S
For the rotor blade of cross-sectional area %,
111

r3 " '4 mean radius r - b 2 '
height hb = '4 - r39
mass % = P A , % '
the centrifugal force, FB, is 2
F b = % w r b
Then
F + Fb = PO" [(ts)(bs)(As)(rs) +%% 2 S
The radial stress at the outer radius of the rim r due to these forces is 3
or
For the geometry of Fig. B2 using Eq. B(12)
(Ot )R r 2 c2
2 2 = - B(,) + P O" r3 3
with A = T ' 3+v B = 7 1+3 v
112
. __ . _. . . .. . . .-...

v = Poisson’s Ratio = 0.29 for Inconel 718 C & C2 are constants to be determined from the boundary conditions. 1
Eq. B(14) and B ( 1 5 ) may be written as
(QR r 2
P UJ ’2 3 2 = [ - B ( y ) + C1 +
Also E q . B ( 1 3 ) may be written as
0
r3 - (0.1002) (-) *3 2 2 - P W r 2 r2
The boundary conditions for the rim are
0 = o a t r = r r r3 3
0 = (ur2lR at r = r r 2
Substituting into E q . B(16) with E q . ~ ( 1 8 ) 0.1002 = -A + C 1 - c2
Eq. B(1,9) and B(2O) contain 3 unknown quantities, hence they are not sufficient for evaluation of the constants C1 and C2.
Applying E q s . C (70) and C (71) of Ref. 6 to the disk of Fig. B2
gives
113

where D and D are constants. 1 2 The boundary conditions for the disk are
0 = o a t r = r r 1
Substituting into Eq. B(21)
Equations B(l9) , B(20), B(23), and B(24) contain six unknowns and are not sufficient fo r evaluation of the unknown constants. However additional equations are obtained by writing equilibrium and deformation expressions at r = r (see Fig. B3) . 2’
C F = 0 = (a ) b - (ar2)R bR Y r D D 2
or
Also at r2
Hence E L
K ”
r - ( 0 1 - v (or )R 2 t2 2
114

and from Eq. ~ ( 2 6 )
where (a ) and (a ) can be expressed in terms of Cly C2, and Dl, t2 t2
D respectively using Eqs. B(17) and B(22). 2 Thus, by Eqs. B(25) and B(27), with Eqs . B ( l g ) , B(20), B(23), and
B(24), a system of six equations with six unknowns is obtained. These equations when solved simultaneously for the geometry of Fig. B2
give
C = 0.7225 1 c2 = 0.2113
Dl = 1.4648 D = 0.1479 2
Substitution into Eq. ~ ( 1 6 ) ~ B ( 1 7 ) , B ( 2 1 ) , and B(22) gives the following solutions for the centrifigal stress distributions in the uniform disk of Fig. B2.
These four equations can be multiplied by the ratio (r2/rm) , where r = mean blade radius = 16.5 inches, to allow direct comparison with the results of Section VI. Thus
2
m
= - 0.2875(-) r 2 -I- 0.5054 - 0.1478 U R r3
115
I

(ut I D = - 0.1322(7) r 2 + 0.8273 -t 0.0835 O R 2 (r/r2I2
2 2 where aR = p w r
Equations ~ ( 2 8 ) through B(31) are the solution tangential centrifugal stress distributions in
m
for the radial and the straight replace-
ment model of Fig. B2. They are shown by the solid lines of Fig. B4. b. Thermal Stress Distribution. Equations ~ ( 9 8 ) and C(99) of
Ref. 6 give the thermal stresses in a stationary ring of constant thickness whose material properties are independent of temperature, when subjected to a temperature distribution expressed by T = T +AT (r/ro)n. For the linear temperature profile of Fig. B2, chosen to approximate the 2.0 hours at 6 kw test point of the experimental
program, there is n = 1. Then,
m 0
where = T r3 - Tm
T = temperature at r = o = 46 F
5 & K2 = unknown constants to be determined.
0
m
116

The boundary conditions for the rim are
o = O a t r = r r 3
o = at r = r r 2
Substitution into Eq. B(32) gives
Applying Eqs . c (98) and C ( 99) of Ref. 6 to the disk
where (ATo)D = Tr - Tm. The boundary conditions are 2
= ( o )D a t r = r r r2 2
o = o a t r = r r 1
Substitution into Eq. ~(36)
r 1 J2 0 = - 1/3 (F) + J1 - B (39) 2 (r1/r2I2
Equations B(25) and B(27), the equilibrium equations at r = r
can also be applied t o the case of thermal loads t o complete the set of six equations with six unknowns.
2,
I
117

Simultaneous solution of Eq. B(34), B(35), B(38), B(39), B(25), and B(27) yields
5 = 0.3902
J = 0.5021 1
Substituting these gives
K2 = 0.0569
J2 = 0.0411
values into Eqs . B(32) , B( 33), B( 36), and B( 37)
where CJ = cy E(ATo)D and (ATo)R of Eqs. B(32) and B(40) is converted to (ATo)D by multiplication of the right hand sides by r /r Equations B(40) through B(43) are expressions for the thermal stresses which exist in the straight replacement model of Fig. B2 with the chosen linear temperature distribution. They are shown by the broken lines
of Fig. B4.
T 3 2'
118

BALANCE
S
F I G . B 1 MODEL O F BLADE SEGMENT WITH BALANCE WEIGHT ATTACHED
1 4.0 5.0 6 0 7.0 81) 90 D.0 11.0 12 I) 13.0
Radius - in.
' '_Wocemmt r2=12.4" - Rim
. . r3 13.8" c
- 4 r = 192" -. '
'I
r 49.4'' 5 Y
FIG. B2 CONSTANT CROSS SECTION MODEL OF SECOND STAGE DISK

I
"
c _ C U D
-T
F I G . B3 EQUILDRXTM C O N D I T I O N S AT W I U S r2
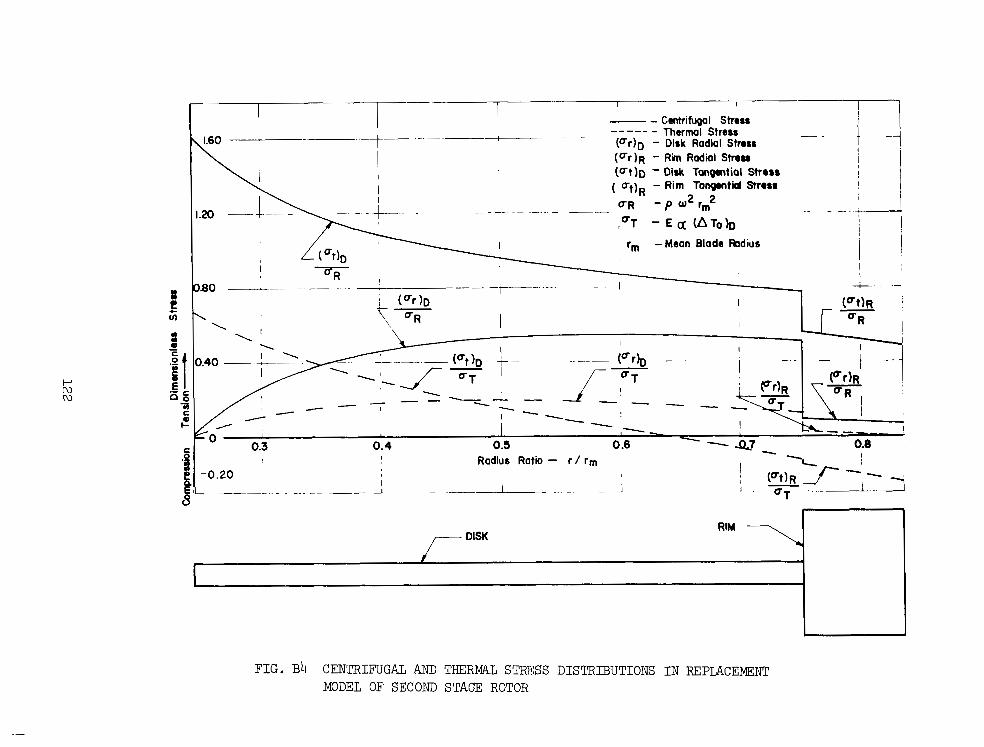
DISK RIM
I
F I G . B4 CENTRIFUGAL AND THERMAL STRESS D I S T R I B U T I O N S I N REPLACEMENT MODEL OF SECOND STAGE ROTOR
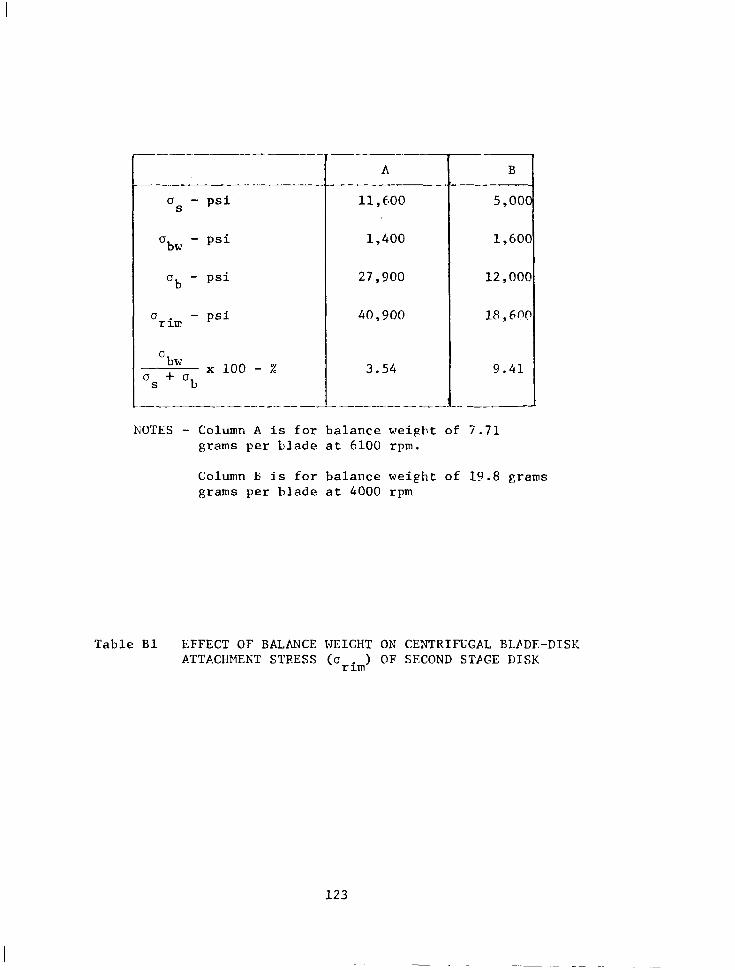
a b w
s b 0 + 0 x 100 - z
L""
A
11 y 600
1,400
27,900
40 , 900
3.54
- ""_ - "
- 1
B
5,000
1,600
12 y 000
18 , 6nO
9.41
"
KOTES - Column A i s for ba lance we igh t of 7 . 7 1 grams per b lade a t 6100 rpm.
Column E; i.s for b a l a n c e w e i g h t of 19.8 grams grams per b lade a t 4000 rpm
Tab le B 1 E F F E C T OF BALANCE WEIGHT ON CENTRIFUGAL BLADE-DISK ATTACHMEKT STRESS (arim) OF SECOND S T P G E DISK
123
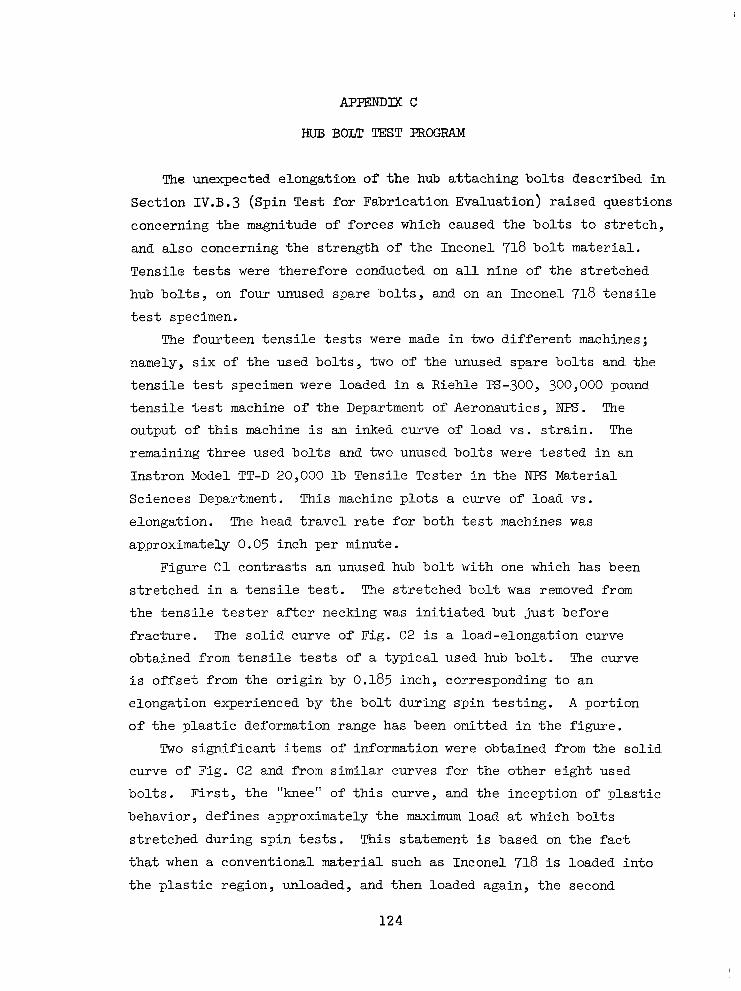
APPENDIX c
HUB BOLT TEST PROGRAM
The unexpected elongation of the hub attaching bolts described in
Section IV.B.3 (Spin Test for Fabrication Evaluation) raised questions concerning the magnitude of forces which caused the bolts to stretch, and also concerning the strength of the Inconel 718 bolt material. Tensile tests were therefore conducted on all nine of the stretched hub bolts, on four unused spare bolts, and on an Inconel 718 tensile test specimen.
The fourteen tensile tests were made in two different machines; namely, six of the used bolts, two of the unused spare bolts and the tensile test specimen were loaded in a Riehle E-300, 3OO,OOO pound tensile test machine of the Department of Aeronautics, Nps. The output of this machine is an inked curve of load vs. strain. The remaining three used bolts and two unused bolts were tested in an Instron Model TT-D 20,000 lb Tensile Tester in the Nps Material Sciences Department. This machine plots a curve of load vs. elongation. The head travel rate for both test machines was approximately 0.05 inch per minute.
Figure C1 contrasts an unused hub bolt with one which has been stretched in a tensile test. The stretched bolt was removed from the tensile tester after necking was initiated but just before fracture. The solid curve of Fig. C2 is a load-elongation curve obtained from tensile tests of a typical used hub bolt. The curve is offset from the origin by 0.185 inch, corresponding to an elongation experienced by the bolt during spin testing. A portion of the plastic deformation range has been omitted in the figure.
Two significant items of information were obtained from the solid curve of Fig. C2 and from similar curves for the other eight used bolts. First, the "knee" of this curve, and the inception of plastic
behavior, defines approximately the maximum load at which bolts stretched during spin tests. This statement is based on the fact that when a conventional material such as Inconel 718 is loaded into the plastic region, unloaded, and then loaded again, the second
124
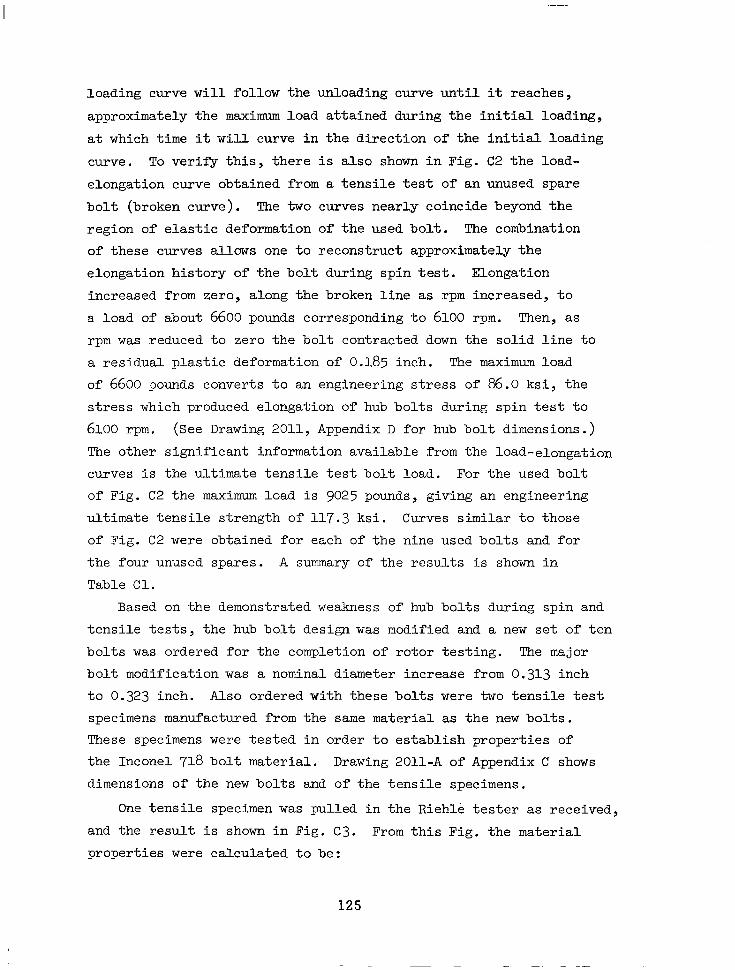
loading curve will follow the unloading curve until it reaches,
approximately the maximum load attained during the initial loading,
at which time it will curve in the direction of the initial loading
curve. To verify this, there is also shown in Fig. C2 the load- elongation curve obtained from a tensile test of an unused spare
bolt (broken curve). The two curves nearly coincide beyond the
region of elastic deformation of the used bolt. The combination of these curves allms one to reconstruct approximately the
elongation history of the bolt during spin test. Elongation
increased from zero, along the broken line as rpm increased, to
a load of about 6600 pounds corresponding to 6100 rpm. Then, as rpm was reduced to zero the bolt contracted down the solid line to
a residual plastic deformation of 0.185 inch. The maximum load of 6600 pounds converts to an engineering stress of 86.0 ksi, the
stress which produced elongation of hub bolts during spin test to
6100 rpm. (See Drawing 2011, Appendix D for hub bolt dimensions.) The other significant information available from the load-elongation
curves is the ultimate tensile test bolt load. For the used bolt
of Fig. C2 the maximum load is 9025 pounds, giving an engineering ultimate tensile strength of 117.3 ksi. Curves similar to those of Fig. C2 were obtained for each of the nine used bolts and f o r
the four unused spares. A summary of the results is shown in
Table C1.
Based on the demonstrated weakness of hub bolts during spin and
tensile tests, the hub bolt design was modified and a new set of ten bolts was ordered for the completion of rotor testing. The major bolt modification was a nominal diameter increase from 0.313 inch to 0.323 inch. Also ordered with these bolts were two tensile test specimens manufactured from the same material as the new bolts.
These specimens were tested in order to establish properties of the Inconel 718 bolt material. Drawing 2011-A of Appendix C shows
dimensions of the new bolts and of the tensile specimens.
One tensile specimen was pulled in the Riehle tester as received, and the result is shown in Fig. C3. From this Fig. the material
properties were calculated to be:
125

0.2% Yield Strength = 69.1 k s i (based on o r i g i n a l area)
Ultimate Tensile Strength -- 114.3 k s i (based on o r i g i n a l area)
Young's Modulus = 24.3 (10 ) p s i
Reduction i n Area = 35.6%
6
The ultimate t ens i l e s t r eng th and percent area reduct ion were noted
t o be near ly the same as tha t r epor t ed i n Table C1 f o r t h e o r i g i n a l
s e t of b o l t s .
Near the end of the program, i n o r d e r t o e s t a b l i s h t h e e f f e c t
of age hardening on the bo l t mater ia l , the second t e n s i l e specimen
was given a heat t reatment pr ior to t e n s i l e t e s t . The heat t reatment
consis ted of 10 hours a t 1400°F, furnace cool to 1200°F, holding a t
1200°F un t i l t o t a l ag ing t ime was approximately 20 hours, and air
cooling t o ambient. The load-strain curve from t h i s t e s t i s shown
as Fig. C 4 . Tensi le propert ies o f the hea t specimen were
0.2% Yield Strength = 142.8 k s i (based on o r ig ina l a r ea )
Ultimate Tensile Strength - 185.2 k s i (based on or ig ina l a rea)
Young's Modulus = 29.1 (10 ) p s i
Reduction i n Area = 19.4%
6
Therefore , the propert ies s ignif icant ly improved over those of previous
t e s t s and v e r i f y t h a t hub bol t mater ia l as received was i n t h e
annealed condition and required an aging heat treatment t o develop
i t s s t r eng th po ten t i a l . A summary of a l l t e n s i l e t e s t s and of t h e
c e r t i f i e d t e s t performed by the mater ia l suppl ie r i s given i n
Table 3.
12 6
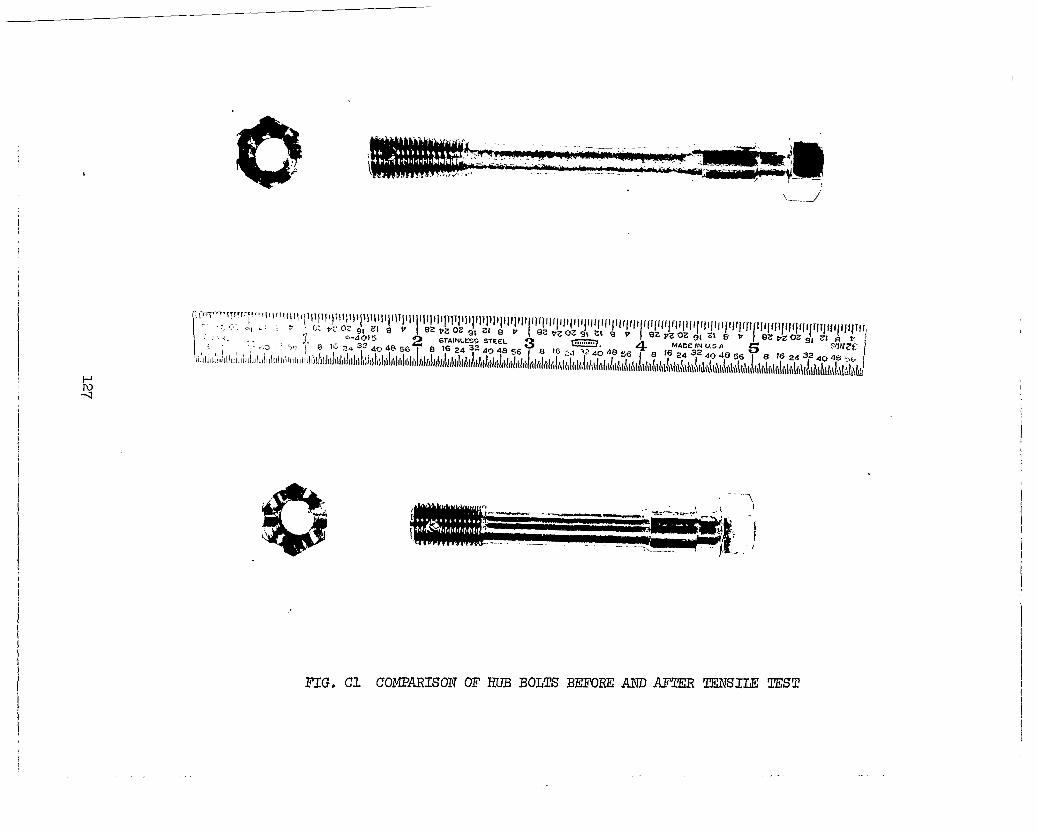
!
FIG, C1 COMPARISON OF HUB BOLTS BEFORE AND AFTER TEA?SIU TEST
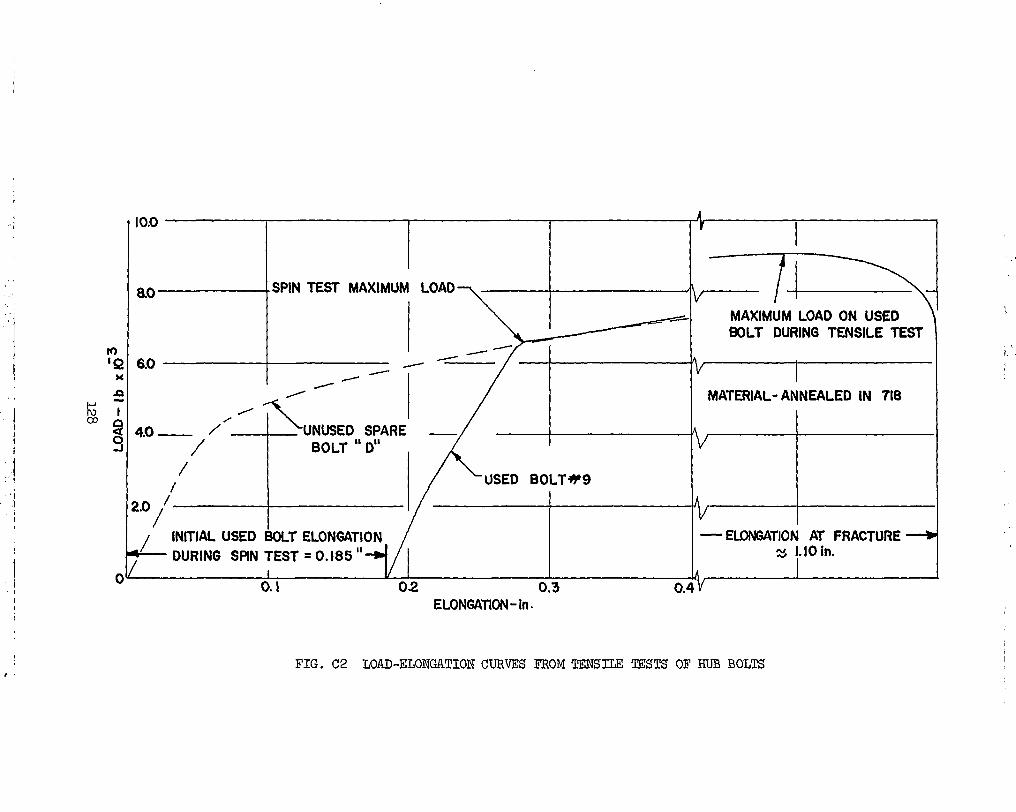
.. j
' ' I ' .I
10.0 d I - .SPIN TEST MAXIMUM LOAD I&>-
MAXIMUM LOAD ON USED 8oLT DURING TENSILE TEST
x
MATERIAL- ANNEALED IN 718
/ / USED B O L T e 9
INITiAL USED BOLT ELONGATION - ELOWATION AT FRACTURE * DURING SPIN TEST = 0. I85 ''* 3 1.10 in.
ELONGATION - In.
, FIG. C 2 LOAD-ELONGATION CURVES FROM TENSILF: TESTS OF HlTB BOLTS

I Fracture a t 9375 Ib.
I I I -
Original Nominal Diameter Of Specimen = 0.323 in.
Material -Annealed IN 718 I I
I - I
I I
-
/ / Load For 0.2 % Yield
/ Strength = 4020 I b
/
0.001 0.002 0.003 0.004 0.005 0.006 Strain - in./in.
FIG. C3 LOAD-STRAIN CURVE FROM T E N S I I E TEST OF HUE BOLT MATERIAL SPECIMEN

I
I i !
I
w P 0
14,000
12,000
10,000
e + 6.pocl
2po(
0 7”” 0.001 0.002 / 0.003 0.004 0.005 OU06 Q007 0.008 1
Heat Treatment : 14OOoF/ 10 hrs; Furnace Cool To 1200OF - Hold Until Total Tlmez2Ohr; Air Cool.
Strain - W i n . A.
FIG. C4 LOAD-STRAIN CURVE FROM TENSILF, TEST OF AGE HARDENED HUB BOLT MATERIAL SPECIMEN
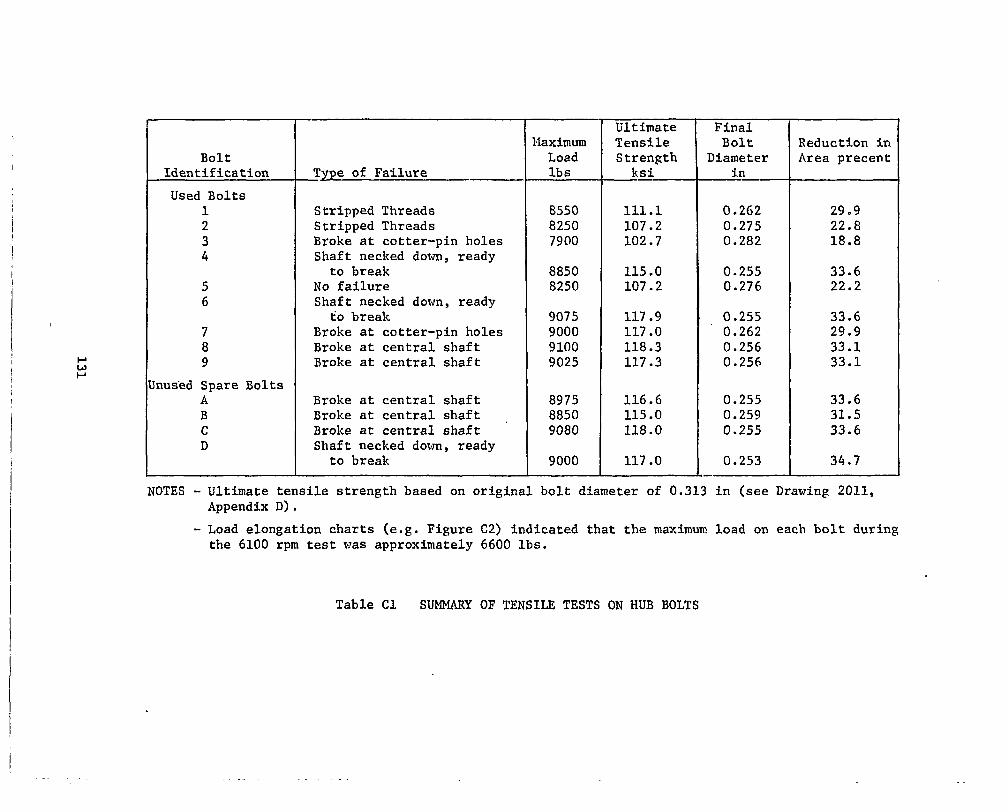
I
, L
I I !
I I
I
i : I
1 1
!
! I
w P
r
Bolt I d e n t i f i c a t i o n
Used B o l t s 1 2 3 4
5 6
7 8 9
Inus'ed Spare Bol t s A B C D
- Type of F a i l u r e
Stripped Threads Stripped Threads Broke a t c o t t e r - p i n h o l e s Shaft necked dotm, ready
to b reak No f a i l u r e Shaft necked down, ready
t o break Broke a t co t te r -p in ho les Broke a t c e n t r a l s h a f t Broke a t c e n t r a l s h a f t
Broke a t c e n t r a l s h a f t Broke a t c e n t r a l s h a f t Broke a t c e n t r a l s h a f t Shaft necked down, ready
t o b r e a k
Naximum Load l b s
8550 8250 7900
8850 8250
9075 9000 9100 9025
8975 8850 9080
9000
T e n s i l e S t r e n g t h
k s i
111.1 107.2 102.7
115 .O 107.2
117.9 117 .O 118.3 117.3
116.6 115 .@ 118.0
117 .O
B o l t Diameter
i n
0.2G2 0.275 0.282
0.255 0.276
0.255 0.262 0.256 0.256
0.255 0.259 0.255
0.253
Reduct ion in Area precent
29.9 22.8 18.8
33.6 22.2
33.6 29.9 33.1 33.1
33.6 31.5 33.6
34.7
NOTES - Ultimate t ens i l e s t r eng th based on o r ig ina l bo l t d i ame te r o f 0.313 i n ( s e e Drawing 2011, Appendix D) .
- Load e longat ion char t s (e .g . F igure C2) i n d i c a t e d t h a t t h e maximum load on each b o l t d u r i n g t h e 6100 rpm test was approximately 6600 l b s .
Table C 1 SUMMARY OF TENSILE TESTS ON HUB BOLTS

Number*
2007-1
2007-26
2011-A
2015
2018
2021
2022
PiPPENDIX D
DRAWINGS
*NPS F i l e Number
132
T i t l e
Assembly - Upper p a r t
Assembly - Lower p a r t
D i sk Bo l t s and Nu t s
D r i v e S p i n d l e with Rut and Lock Washer
Arbor
Rotor Handling Rig
Balancinp and Measuring Rip

I I /
10.
1., . . . . , , ,I
133

. , . _ - _ .
134

I
5 - 2 4 UNF CLASS38
UYLOS DIHEPWI~C IPUIPISD ''t: DCICPlPrlOU MAILRIAL I REE). I DIHEUCIOHI ARC IN Irumnt TOLERANLEI
N A V A L P O S T G R A D U A T E SCHOOL DEPT. OF hERONAUTICS, T U R B O - P R O P U L S I O M LABORArORy

-i

I r - - .15
I
i - t . 08
I I.0S"-
I

I
1
1
.. .. .I2

\
/ /
9'
139

Related Documents


