NOVEMBER/DECEMBER 2009 25 0278-6648/09/$26.00 © 2009 IEEE A re we headed toward a global energy crisis? Absolutely! I think the better question is what form will the crisis come in: skyrocketing natural gas and oil prices? Generation shortfalls and siting issues for transmis- sion and distribution systems? Emissions regulations forcing the shutdown of con- ventional fossil plants, or more likely, huge price spikes? Frequent transmission and distribution system failures leading to more blackouts? Unfortunately, all are likely scenarios in the near future, and many power engineers know all too well the inability of regulations and energy policies to control markets that are complex and based on technologies and concepts that began over 100 years ago. The intelligent grid that all power engineers dream about will take a long time to design and build, not to mention the cost. Additionally, the current popu- lar fossil fuels used for electric power generation are subject to varying and in- creasing market risks. This is not a discussion of distributed generation versus central generation— both have advantages and disadvantages— but we should consider that our future electric infrastructure may require both forms to ensure a reliable and sustain- able power grid. We have come to un- charted territory when it comes to our ability to meet growing demand and en- vironmental concerns. There are many alternatives that must all be used in co- ordination with existing electric infra- structure in order to meet future energy needs. The largest unknown of these future energy needs are the increase in electric and fuel availability to huge rural populations in India and China, which contain roughly one third of the global population. Why aren’t buildings de- signed and constructed to be electrically self sufficient through the use onsite power production? Is this complete mad- ness or is there some justification? High performance development as distributed generation While the global population contin- ues to grow and consume vast amounts of resources, designers of urban infra- structure and developments must con- sider sustainable strategies for materials and energy; one possible strategy is high-performance development as dis- tributed generation (HPDADG). In fun- damental form, by using specific design, construction and operational strategies to minimize energy usage and maxi- mize onsite electric energy production, high-performance developments can provide distributed generation and at the same time serve their intended de- velopmental purpose. High performance development can mean many things to many people but namely it is building methods that MATTHEW B. NISSEN High performance development as distributed generation Digital Object Identifier 10.1109/MPOT.2009.934893 ©DIGITAL STOCK, DIGITAL VISION, ARRAY IMAGE COURTESY OF US AIR FORCE

Welcome message from author
This document is posted to help you gain knowledge. Please leave a comment to let me know what you think about it! Share it to your friends and learn new things together.
Transcript

NOVEMBER/DECEMBER 2009 250278-6648/09/$26.00 © 2009 IEEE
Are we headed toward a global
energy crisis? Absolutely! I think
the better question is what form
will the crisis come in: skyrocketing
natural gas and oil prices? Generation
shortfalls and siting issues for transmis-
sion and distribution systems? Emissions
regulations forcing the shutdown of con-
ventional fossil plants, or more likely,
huge price spikes? Frequent transmission
and distribution system failures leading
to more blackouts? Unfortunately, all
are likely scenarios in the near future,
and many power engineers know all
too well the inability of regulations and
energy policies to control markets that
are complex and based on technologies
and concepts that began over 100 years
ago. The intelligent grid that all power
engineers dream about will take a long
time to design and build, not to mention
the cost. Additionally, the current popu-
lar fossil fuels used for electric power
generation are subject to varying and in-
creasing market risks.
This is not a discussion of distributed
generation versus central generation—
both have advantages and disadvantages—
but we should consider that our future
electric infrastructure may require both
forms to ensure a reliable and sustain-
able power grid. We have come to un-
charted territory when it comes to our
ability to meet growing demand and en-
vironmental concerns. There are many
alternatives that must all be used in co-
ordination with existing electric infra-
structure in order to meet future energy
needs. The largest unknown of these
future energy needs are the increase in
electric and fuel availability to huge rural
populations in India and China, which
contain roughly one third of the global
population. Why aren’t buildings de-
signed and constructed to be electrically
self sufficient through the use onsite
power production? Is this complete mad-
ness or is there some justification?
High performance development as distributed generation
While the global population contin-
ues to grow and consume vast amounts
of resources, designers of urban infra-
structure and developments must con-
sider sustainable strategies for materials
and energy; one possible strategy is
high-performance development as dis-
tributed generation (HPDADG). In fun-
damental form, by using specific design,
construction and operational strategies
to minimize energy usage and maxi-
mize onsite electric energy production,
high-performance developments can
provide distributed generation and at
the same time serve their intended de-
velopmental purpose.
High performance development can
mean many things to many people but
namely it is building methods that
MATTHEW B. NISSEN
High performancedevelopmentas distributedgeneration
Digital Object Identifier 10.1109/MPOT.2009.934893
©DIGITAL STOCK, DIGITAL VISION, ARRAY IMAGE COURTESY OF US AIR FORCE

26 IEEE POTENTIALS
incorporate the principles of sustainable
development, defined as “development
that meets the needs of the present with-
out compromising the ability of future
generations to meet their own needs.”
Facilities designed and constructed
under these principles (dubbed “green
buildings”) are long lasting, energy
efficient, and environmentally friendly.
There has been huge growth in this type
of construction both locally and globally.
The majority of commercial and institu-
tional projects in the United States use
the Leadership in Energy and Environ-
mental Design (LEED) rating system.
The New York Times recently published
the article, “How Green Is Your Tower?”
as a testament to this popular yet not-
quite mainstream design practice and
implementation. Homebuilders have
yet to come to a consensus on what a
green home is, and the U.S. Green
Building Council is working to create a
LEED-Homes rating system. The core
elements to reducing facility energy
needs are well known to sustain-
able designers:
effective solar orientation to reduce 1)
summer cooling loads and winter heat-
ing loads
maximum use of thermal insula-2)
tion in the building envelope to reduce
all air conditioning loads, including size
of equipment and energy needed to
maintain normal temperatures
use of efficient appliances (com-3)
pact fluorescents, Energy Star)
occupancy-based usage via auto-4)
matic controls or the ability to turn
lights and appliances off when not in
use (occupancy sensors, timers, digital
programmed thermostats, demand
response, or occupant discretion via
price incentives).
The stereotypes that surround sustain-
able developments are that they have
higher capital costs and are difficult to
design and build. These may be true in
many circumstances (documented pre-
miums of 10% increased capital costs);
however there are many documented
instances where designers have reduced
capital costs due to decreased equipment
and the prime goal: reduced life-cycle
energy costs by 30–60%. Add itionally,
office and business facilities have poten-
tial productivity gains of up to 15%,
according to Douglas Durst. Here it is
important to truly distinguish high-per-
formance development from the norm:
the focus is on reducing facility life-cycle
energy and material consumption. One
of the biggest difficulties is to encourage
developers and owners to choose, pro-
mote, and invest in sustainable strategies
because they pass on these life-cycle
costs to tenants and would not benefit
from the savings. Marketing and educa-
tion help, but we need to enlighten the
entire developed world about the limited
resources available and the looming
explosive growth in resource demand.
Additionally, where developers are also
owner-operators and have a vested
interest—they are more inclined to con-
sider sustainable strategies.
Renewable sources are often used as
distributed generation, but one of the
largest obstacles to wide acceptance has
been intermittent operation and the time-
gap between renewable electric power
production and peak electric demand.
Photovoltaic arrays typically reach maxi-
mum power production (during midday)
when demand is the greatest and gener-
ate continuously in sunlight, which is
ideal (until cloud cover or storms). Wind
turbines, though having greater produc-
tion potential, are less consistent and
tend to reach maximum or continuous
power production during times of low
demand (winter and nights).
Cogeneration plants, having the larg-
est stationary power potential with large-
scale building systems, typically produce
the most power during peak heating
seasons and periods of consistent hot
water demand; these are not in synch
with periods of peak electric demand
but are likely just before and after. Fig-
ures 3 and 4 show the approximate daily
renewable energy production of a single
family home with 5 kW of the three main
renewable energy technologies (RETs)
installed. The typical single family home
in the United States uses 34 kWh daily
according to Department of Energy
(DoE) statistics. During a day where all
RETs are producing (random outputs
used according to hypothetical climate
conditions) the RETs’ combined output
is shown as 43.9 kWh, having a net-ben-
efit of 9.9 kWh on this day. Of course this
Roof Area Needed in Square Feet (Shown in Bold Type)
PV Module
Efficiency (%)PV Capacity Rating (W)
4
100
30
15
10
8
250
75
38
25
20
500
150
75
50
40
1,000
300
150
100
80
2,000
600
300
200
160
4,000
1,200
600
400
320
10,000
3,000
1,500
1,000
800
8
12
16
For example, to generate 2,000 W from a 12%-efficient system, you need
200 square feet of roof area.
Fig. 1 Typical solar array chart.
Retscreen Power Equipment Type Typical Installed Cost ($/kw)
Reciprocating engine
Gas turbine
Gas turbine-combined cycle
Steam turbine
Geothermal system
Fuel cell
Wind turbine
Hydro turbine
Photovoltaic module
Note: Typical installed cost values in Canadian dollars as of January 1, 2005.
Approximate exchange rate at time was 1CAD = 0.81 USD and 1CAD = 0.62 EUR.
700–2,000
550–2,500
700–1,500
500–1,500
1,800–2,100
4,000–7,700
1,000–3,000
550–4,500
8,000–12,000
Fig. 2 Typical installed cost range.

NOVEMBER/DECEMBER 2009 27
is not indicative of every day of the year,
but one possibility of the potential appli-
cation of these concepts on a single
family home under good climate condi-
tions for these RETs to operate. The
graph in Fig. 4 also indicates that under
favorable conditions the cumulative
power produced onsite doesn’t have the
typical power spikes typically associated
with RETs, causing less stress on cen-
tral plants and transmission and distri-
bution infrastructure.
TechnologiesMaximizing onsite power production
is the focus of several journals and
magazines. The technologies are avail-
able and progressing every day by engi-
neers and scientists around the world.
The core technologies that can hypo-
thetically be implemented on all devel-
opments are:
building augmented wind-turbines1)
building integrated photovoltaics2)
cogeneration systems3)
building automation systems.4)
These renewable energy technolo-
gies would be combined and integrated
into facilities and managed by a build-
ing automation system and regulated
according to utility interconnection
requirements. Complying with utility
requirements can be difficult for some
systems, but modern power electronics
make this technically possible. The
question is one of scale and cost. Small
cogeneration and wind systems have
not progressed in the market suffi-
ciently for this to be easily accom-
plished at a low price.
Building augmented wind turbines
There are numerous wind propo-
nents around the world, including ven-
dors such as Vestas, GE, Enercon, and
Gamesa (the four largest manufactur-
ers), and of course the Dutch and German
governments. As stated by Sander Mer-
tens of the Delft University Wind Energy
Research Institute, “Vertical axis wind
turbines (VAWTs) are to be preferred
for operation in a complex wind envi-
ronment as is found on top of a roof.”
While the more common horizontal axis
wind turbines (HAWTs) are used exten-
sively in wind farms today, they are not
suited for urban or building integrated
applications. HAWTs have significant en-
vironmental considerations due to the
speed and size of their blades, and re-
quire clearances that are difficult to
obtain in urban settings. The major
advantages for VAWTs are small blade
sizes for large machines and the rela-
tively high power produced at slower
wind speeds when compared to HAWTs.
The large weight (many tons) of these
machines and structures must be taken
into account when designing the struc-
tural systems and foundation of the
building. Clearly, as stated by Steven
Peace of Eurowind, “Due to the stress-
es, I would have serious reservations
about installing a multi-megawatt ma-
chine on the top of a high rise building,
unless it were a new building and was
specifically designed to incorporate
such a machine.”
The wind turbines of the future will
likely follow the current trend of in-
creasing in energy output to multi-
megawatt machines, ensure optimal
performance in a range of environments,
and have an operational lifetime reach-
ing or exceeding 30 years. One recent
innovation is a 2.5 MW HAWT turbine
having four generators that are engaged
selectively depending on the wind-speed,
thus increasing the operational range of
wind-speeds and energy output for all
sites that experience varying wind-
speeds. While this will likely increase
the capital equipment costs, it has the
potential to increase the plant’s capac-
ity factor beyond the 40% ceiling that
plants currently are limited to in prac-
tice; this will increase the cumulative
energy generated and hence, improve
the feasibility.
Solar photovoltaicsSolar systems come in varying efficien-
cies as indicated in Fig. 1 and the main
parameters for operation are module ef-
ficiency, array area, and orientation (opti-
mal azimuth is for the array to face the
noon-time sun and be placed at the opti-
mal angle relative to latitude). Steven
Strong has written extensively about
building integrated photovoltaics (BiPV)
and has lectured in the recent past on this
topic at the CUNY Graduate Center in
New York City.
One of the most promising renew-
able energy technologies is photovolta-
ics (PVs). PVs are a truly elegant means
of producing electricity on site, directly
from the sun, without concern for
energy supply or environmental harm.
These solid-state devices simply make
electricity out of sunlight, silently with no
maintenance, no pollution, and no deple-
tion of materials. There is a growing con-
sensus that distributed photovoltaic
Chart: Single Family RET–Low Daily Production
System Ratings (kW) Average Minimum
BIPV
Wind
CHP
Total RET:
Total Usage:
DG Benefit
34.00 kWh
9.90 kWh
0.64
0.64
0.47
1.76
2.00
2.00
1.00
2.75
0.00
0.00
0.10
0.90
Maximum
43.90
2.00
2.00
1.00
Fig. 3 Sample daily energy production values for a hypothetical single family home.
Single Family RET—LOW Daily Production
Time of Day
RE
T O
utp
ut (k
W)
3.00
2.50
2.00
1.50
1.00
0.50
0.00
12:0
0 A
.M.
2:0
0 A
.M.
4:0
0 A
.M.
6:0
0 A
.M.
8:0
0 A
.M.
10:0
0 A
.M.
12:0
0 P
.M.
2:0
0 P
.M.
4:0
0 P
.M.
6:0
0 P
.M.
8:0
0 P
.M.
10:0
0 P
.M.
12:0
0 A
.M.
BIPV
WIND
CHPSUM
Fig. 4 Sample daily energy production curve for a hypothetical single family home.

28 IEEE POTENTIALS
systems that provide electricity at the
point of use will be the first to reach
widespread commercialization. Chief
among these distributed applications
are PV power systems for individual
buildings. Interest in the building inte-
gration of PVs, where the PV elements
actually become an integral part of the
building, often serving as the exterior
weather skin, is growing worldwide.
PV specialists and innovative design-
ers in Europe, Japan, and the United
States are now exploring creative ways
of incorporating solar electricity into
their work. A whole new vernacular of
solar electric architecture is beginning
to emerge.
A PV system is constructed by assem-
bling a number of individual collectors
called modules electrically and mechani-
cally into an array. BiPV systems consist
of integrating PV modules into the build-
ing envelope, such as the roof or the
façade. The PV modules can serve the
dual function of building skin—replacing
conventional building envelope materi-
als—and power generator. By avoiding
the cost of conventional materials, the in-
cremental cost of photovoltaics is re-
duced and its life-cycle cost is improved.
Envelope BiPV systems often have lower
overall costs than BiPV systems requiring
separate, dedicated, mounting systems.
Systems requiring a separate and dedi-
cated mounting system, while being
more costly, may have better energy per-
formance when placed at the optimal
orientation and angle for a specific site.
Common uses for separately mounted
BIPV systems are solar shades, awnings,
and adjustable inclined arrays for large
flat roofs.
There are many commercial PV module
technologies available on the market
today, but most fall into two categories:
thick crystal products and thin-film prod-
ucts. Thick crystal products include solar
cells made from crystalline silicon either
as single or poly-crystalline wafers and
deliver about 10–12 W/ft² of PV array
(under full sun). These products typi-
cally come in prefabricated, rigid/solid
array modules.
Thin-film products typically incorpo-
rate very thin layers of photovoltaicly
active material placed on a glass super-
strate or a metal substrate using vacuum-
deposition manufacturing techniques
similar to those employed in the coating
of architectural glass. Presently, com-
mercial thin-film materials deliver about
4–5 W/ft² of PV array area (under full
sun). Thin-film technologies hold out
the promise of lower costs due to much
lower requirements for active materials
and energy in their production when
compared to thick-crystal products.
These products are more flexible and
can be fabricated into a variety of shapes
and forms, including rolls of modules
and roof tiles.
The choice of proprietary photo-
voltaic-composite systems is wide. It
includes:
curtain wall systems for vertical •and inclined facades
rainscreen cladding systems •fixed and motorized solar shading •
louver systems
integrated roof cladding, sheeting, •and tilting systems
pitched and flat roof mounted •systems
roof light systems (semitransparent). •Researchers have been working to
improve cell efficiencies on two fronts.
In 2002, researchers at Lawrence Berke-
ley National Laboratory, working with
crystal-growing teams at Cornell Uni-
versity and Japan’s Ritsumeikan Univer-
sity, discovered that a single system of
alloys incorporating indium, gallium,
and nitrogen can convert virtually the
full spectrum of sunlight, from the near
infrared to the far ultraviolet, to electri-
cal current. This led to theoretical effi-
ciencies better than 70%. More recently,
researchers at the University of Idaho
have created a compound called a
“quantum dot” that is made of elements
that include copper, indium, and sele-
nium. The quantum dots would be em-
bedded between layers of a solar cell
and would absorb energy that is other-
wise wasted due to overheating; poten-
tially more than doubling the efficiency
(up to 50%).
Currently there are many obstacles
to the wide-spread use of solar photo-
voltaic systems, the most common being
cost, inverter losses, losses due to ori-
entation, and decay in module output
over time.
Combined heat and powerCombined heat and power (CHP)
technologies produce electricity or me-
chanical power and recover waste heat
for process use. Conventional central-
ized power systems average less than
33% delivered efficiency for electricity in
the United States; CHP systems can de-
liver energy with efficiencies exceeding
90%, while significantly reducing emis-
sions per delivered MWh. CHP systems
can provide cost savings for industrial
and commercial users and substantial
emissions reductions.
Primary technologies include diesel
engines, natural gas engines, steam tur-
bines, gas turbines, microturbines, and
fuel cells. Most CHP technologies are
commercially available for on-site genera-
tion and combined heat and power ap-
plications. Several barriers, including utility
interconnection requirements, environ-
mental regulations, and technology costs
have kept these technologies from gaining
wider acceptance. Many of the technolo-
gies are undergoing incremental improve-
ments to decrease costs and emissions
while increasing efficiency.
The engineer will have to carefully
size these systems and predict the ap-
proximate heating and hot water pro-
duction for an annual period. CHP
systems generally operate in any of three
modes: heating load following, power
load following, and full power capacity
output. Each mode has its own traits and
purpose, the most common is heating
load following. The determination and
control of these modes can be accom-
plished through thermostats, electric
meters, or intelligently with a building
automation system.
The CHP systems of the future will
strive for zero thermal losses, maximum
fuel combustion efficiencies, and may
even expand into the realm of cooling
systems. Trigeneration is a service of-
fered by some consultants. These sys-
tems use the steam output from a furnace
to drive absorption chillers during cool-
ing seasons and steam turbines to gener-
ate electricity. One of the largest
difficulties with implementing steam sys-
tems is the commercial market’s prefer-
ence for hydronic (water based) systems
for both heating and cooling and the
practical considerations of operating a
plant on-site.
Building automation systems
A building automation system (BAS)
is comprised of electronic equipment that
The CHP systems of the
future will strive for zero
thermal losses, maximum fuel
combustion efficiencies, and
may even expand into the realm
of cooling systems.
NOVEMBER/DECEMBER 2009 29
automatically performs specific facility
functions. The commonly accepted defi-
nition of a BAS includes the comprehen-
sive automatic control of one or more
major building system functions required
in a facility such as heating, ventilating,
and air conditioning (HVAC) systems. In
many cases, a BAS includes HVAC, light-
ing, security, fire safety, industrial pro-
cesses, and more.
A BAS offers managers maximum
control and flexibility for operating vari-
ous engineered systems within facilities.
Creating sustainable developments often
leads to sensor based thermostats and
lighting controls, various HVAC and
water efficiency/conservation systems
requiring constant monitoring and meter-
ing. Where utilities offer incentives for
demand response, the BAS allows the
operator to reduce energy consumption
during peak summer/winter loads by
changing the system parameters such as
raising/lowering the thermostat tempera-
tures, turning off sections of lights, HVAC,
or other processes to be operated during
off-peak times. Where occupancy sen-
sors made great strides in area lighting,
the BAS allows developments to operate
intelligently according to the local cli-
mate and occupancy.
Time for analysisThe preferred software and docu-
mentation for analysis of renewable
energy resources for this work was
RETSCREEN, however this analysis
makes use of estimated capacity factors
(based on wind speed and solar irradia-
tion). It becomes worthless to generalize
over varying climate regions, but the
U.S. Department of Energy provides
energy data based on national statistics —
these were used for energy and fuel con-
sumption and for average facility areas.
Pricing information for installed RETs is
the subject of several textbooks and a
core service provided by many consult-
ing engineers. Figure 2 provides basic
rule-of-thumb pricing of various types of
onsite generator technologies. While
these provide a good reference, the
actual unit prices used in this analysis
are clearly shown as U.S. dollars per
watt produced—these can be seen in the
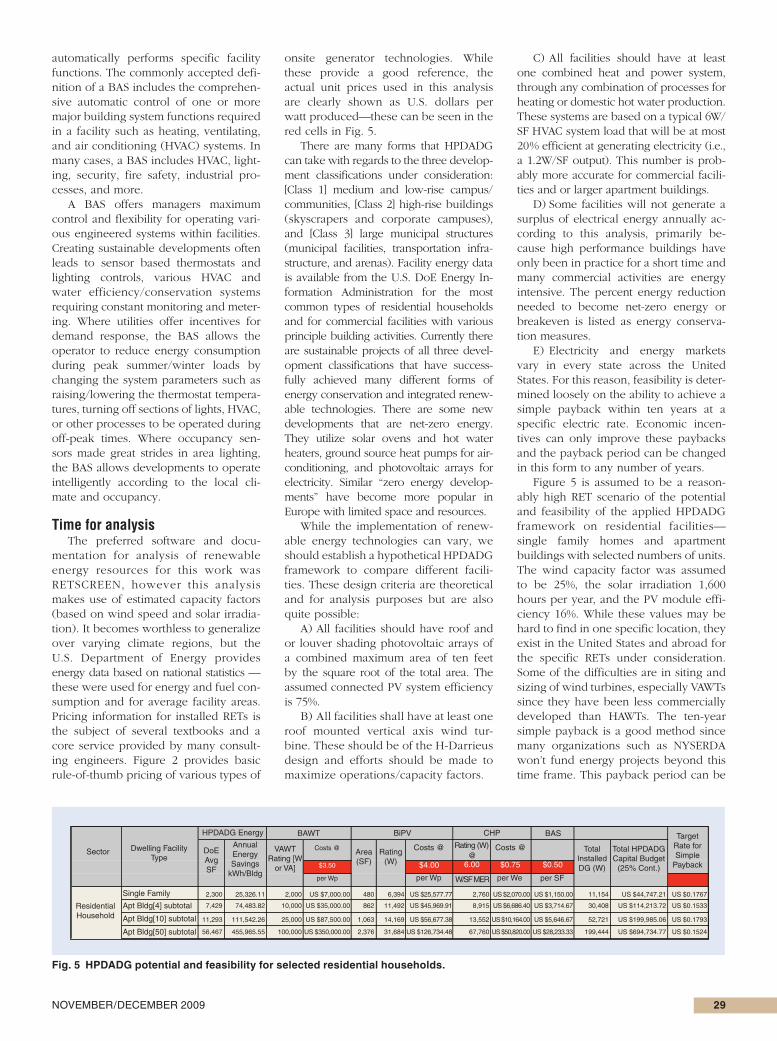
red cells in Fig. 5.
There are many forms that HPDADG
can take with regards to the three develop-
ment classifications under consideration:
[Class 1] medium and low-rise campus/
communities, [Class 2] high-rise buildings
(skyscrapers and corporate campuses),
and [Class 3] large municipal structures
(municipal facilities, transportation infra-
structure, and arenas). Facility energy data
is available from the U.S. DoE Energy In-
formation Administration for the most
common types of residential households
and for commercial facilities with various
principle building activities. Currently there
are sustainable projects of all three devel-
opment classifications that have success-
fully achieved many different forms of
energy conservation and integrated renew-
able technologies. There are some new
developments that are net-zero energy.
They utilize solar ovens and hot water
heaters, ground source heat pumps for air-
conditioning, and photovoltaic arrays for
electricity. Similar “zero energy develop-
ments” have become more popular in
Europe with limited space and resources.
While the implementation of renew-
able energy technologies can vary, we
should establish a hypothetical HPDADG
framework to compare different facili-
ties. These design criteria are theoretical
and for analysis purposes but are also
quite possible:
All facilities should have roof and A)
or louver shading photovoltaic arrays of
a combined maximum area of ten feet
by the square root of the total area. The
assumed connected PV system efficiency
is 75%.
All facilities shall have at least one B)
roof mounted vertical axis wind tur-
bine. These should be of the H-Darrieus
design and efforts should be made to
maximize operations/capacity factors.
All facilities should have at least C)
one combined heat and power system,
through any combination of processes for
heating or domestic hot water production.
These systems are based on a typical 6W/
SF HVAC system load that will be at most
20% efficient at generating electricity (i.e.,
a 1.2W/SF output). This number is prob-
ably more accurate for commercial facili-
ties and or larger apartment buildings.
Some facilities will not generate a D)
surplus of electrical energy annually ac-
cording to this analysis, primarily be-
cause high performance buildings have
only been in practice for a short time and
many commercial activities are energy
intensive. The percent energy reduction
needed to become net-zero energy or
breakeven is listed as energy conserva-
tion measures.
Electricity and energy markets E)
vary in every state across the United
States. For this reason, feasibility is deter-
mined loosely on the ability to achieve a
simple payback within ten years at a
specific electric rate. Economic incen-
tives can only improve these paybacks
and the payback period can be changed
in this form to any number of years.
Figure 5 is assumed to be a reason-
ably high RET scenario of the potential
and feasibility of the applied HPDADG
framework on residential facilities—
single family homes and apartment
buildings with selected numbers of units.
The wind capacity factor was assumed
to be 25%, the solar irradiation 1,600
hours per year, and the PV module effi-
ciency 16%. While these values may be
hard to find in one specific location, they
exist in the United States and abroad for
the specific RETs under consideration.
Some of the difficulties are in siting and
sizing of wind turbines, especially VAWTs
since they have been less commercially
developed than HAWTs. The ten-year
simple payback is a good method since
many organizations such as NYSERDA
won’t fund energy projects beyond this
time frame. This payback period can be
Sector Dwelling Facility
Type
HPDADG Energy BAWT
DoE
Avg
SF
Annual
Energy
Savings
kWh/Bldg
VAWT
Rating [W
or VA]
Costs @
$3.50
per Wp
Area
(SF)
Rating
(W)
BiPV
Costs @ Costs @
BASCHP
Rating (W)
6.00
W/SF MER per We per SF
Total
Installed
DG (W)
Total HPDADG
Capital Budget
(25% Cont.)
Target
Rate for
Simple
Payback@
$4.00 $0.75 $0.50
per Wp
Residential
Household
Single Family
Apt Bldg[50] subtotal
Apt Bldg[10] subtotal
Apt Bldg[4] subtotal
2,300
56,467
11,293
7,429
25,326.11
455,965.55
111,542.26
74,483.82
2,000
100,000
25,000
10,000
480
2,376
1,063
862
6,394
31,684
14,169
11,492
2,760
67,760
13,552
8,915
US $7,000.00
US $350,000.00
US $87,500.00
US $35,000.00
US $2,070.00
US $50,820.00
US $10,164.00
US $6,686.40
US $1,150.00
US $28,233.33
US $5,646.67
US $3,714.67
US $44,747.21
US $694,734.77
US $199,985.06
US $114,213.72
US $0.1767
US $0.1524
US $0.1793
US $0.1533
11,154
199,444
52,721
30,408
US $25,577.77
US $126,734.48
US $56,677.38
US $45,969.91
Fig. 5 HPDADG potential and feasibility for selected residential households.
30 IEEE POTENTIALS
changed to see if projects with a longer
or shorter financial timeline are feasible.
One thing is certain, electric rates are
only going to increase over time for the
foreseeable future.
So how does this compare with cur-
rent electric rates? Look for the latest
electric retail prices for your state on the
EIA Electric Power Monthly Web site
(http://www.eia.doe.gov/cneaf/electric-
ity/epm/table5_6_b.html) and find out.
As of December 2006, New York, Mas-
sachusetts, Connecticut, and Hawaii
have sufficient residential electric pricing
for HPDADG. Remember that most
urban centers have higher rates than the
state average.
Cases and considerationsWhile this study attempts to show the
feasibility of the HPDADG framework in
residential facilities, many residential
projects in the southwest United States
currently sell power back to the grid via
substantial solar PV installation and ultra-
efficient homes (zero air conditioning,
few appliances or amenities). One exam-
ple of this is the NREL/Habitat for
Humanity net-zero-energy demonstra-
tion home in Wheat Ridge, Colorado.
This 1,280 sq. ft., three-bedroom home
has a super-insulated envelope (up to
R-60), rooftop solar heating, and 4 kW of
PV modules. Without a cooling system
this home produced 24% more energy
than it consumed.
IEEE Spectrum reported how energy
mangers at the U.S. Department of
Defense now have a national program
for the Army’s net-zero-energy bases.
Along with other branches of the mili-
tary, the army is implementing the con-
cepts of HPDADG, “With some bases
supplying their own electricity and vast
empty stretches of military land being
used to produce power, the U.S. mili-
tary, at least at home, is at the forefront
of an energy revolution.”
As a further testament to the momen-
tum of this concept, in 2007 the Clinton
Global Initiative embarked on The
Energy Positive Initiative and raised
funds for projects that are “committed to
designing and implementing a combina-
tion of sustainable building systems that
are practical, affordable, and readily
available and that produce a significant
surplus of energy for a building’s every-
day operations.” The goal of this project
was to design and build a commercial
facility that produced 20% more energy
than it consumes, with and annual elec-
trical demand of 16 kwh/sm and onsite
generation of 20 kwh/sm. The resulting
design included 1.61 MW of rooftop
solar PV modules (Sanyo 17% efficiency),
several VAWTs integrated with the land-
scaping totaling |30 kW (QR5), and a
host of premium efficiency systems for
air-conditioning like ground source heat
pumps wells, enthalpy wheels, and river
water heat exchange.
Even with all this hype and activity,
HPDADG is far from mainstream. Having
large electric customers with onsite power
is a complex problem that utilities in the
United States have not addressed from a
financial perspective. Given the econo-
mies of scale and inherent technical infra-
structure issues, utilities are the best
positioned to be a part of the solution,
whether they encourage mass produced
interconnection devices or provide subsi-
dies for distributed generation to home-
owners and developers. A technical
consideration that is not addressed in this
article is the islanding (independent)
Fig. 6 HPDADG technical and economic feasibility summary.
HPDADG POTENTIALS–GENERAL COMPARISONS
Residential-Feasibility Commercial-Feasibility
Technical Economic Technical Economic
Class 1–
Medium and
Low Rise, Typ.
2,000–50,000
sq ft
Excellent–Low
usage and high
production
potentials
for all RETs.
Medium–expensive for smaller
systems, but high and rising rates are
improving payback–some regions are
currently cost effective with paybacks
<10 years. Limited ability of funding
options is a large obstacle for single
family homes.
Medium–relatively high usage
and medium production can
be accomplished typically with
20–30% ECMs, also depends
on building activity.
Good–combination of
incentives and access
to funding options. Low
bulk electric rates
increases the payback
period.
Class 2–High
Rise, Typ.
50,000–
500,000+ sq ft
Good–low usage
and high production
potentials for all
RETs, base loads
reduce benefit.
Medium–economy of scale,
combination of incentives and
access to funding options, relatively
low rates; historically small capital
budgets.
Poor–high usage and relatively
medium production can be
accomplished typically with 50-
67% ECMs.
Excellent–economy of
scale, combination of
incentives and access
to funding options, bulk
and market rates.
Municipal Facilities–Feasibility Transport Infrastructure–Feasibility
Technical Economic Technical Economic
Class 3–
Municipal
Facilities Starting
at 100,000SF;
Transportation
Infrastructure
Good–medium
usage and
high production
potentials for
all RETs.
Medium–economy of scale, combination
of regulations and access to funding
options; historically large capital
budgets. Extremely low government
electric rates increases the payback
period.
Excellent–low usage and
very high production
potentials for wind and
solar.
Good–economy of scale,
combination of incentives
and access to funding
options. Extremely low
government electric rates
increases the payback
period.
FacilityDescription and
Class
Facility
Description and
Class
NOVEMBER/DECEMBER 2009 31
operation for facilities with onsite genera-
tion. In order to reliably disconnect from
the utility, facilities will need some sort of
energy storage system, similar to a unin-
terruptible power supply. Currently these
technologies are expensive in general,
especially the small scale systems for
homes and small to medium sized build-
ings. One possibility for the future is com-
munity energy storage systems that take
advantage of economies of scale and
have shared ownership by the customers
and utility.
Figure 6 provides a summary of all
scenarios analyzed in the full white
paper that could not be listed due to
space limitations and propriety. Areas of
further interest that others are encour-
aged to explore and are directly related
to this work are:
integration of renewables with the •various types of structures in the built
environment
innovation in turbine and PV •module design, output, and efficiency
design and economics of electri- •cal T&D networks with HPDADG versus
conventional one-way utilities
potential applications of HPDADG •for net-zero energy regions, ultimately
leading to truly sustainable cities.
Conclusion The markets of renewable energy, dis-
tributed generation, manufactured sys-
tems, design and construction engineering,
and sustainable development are fast
approaching a crossroads, creating an
environment to make high-performance
development as distributed generation
economically and technically feasible.
Difficulties in siting of energy infrastruc-
ture in the United States and abroad fur-
ther encourage the use of distributed and
on-site generation. The economies of
scale that are typically required when
considering sustainable practices can be
compared to designing large campuses
of multiple building types. According
to Arthur C. Nelson of the Brookings
Institution, “by 2030 about half of all facil-
ities in the USA will have been built after
2000, this generation has a vital opportu-
nity to reshape future development.”
Developers and urban planners may
finally have a key ingredient to creat-
ing sustainable cities: high-performance
development as distributed generation.
The design and construction of high-
performance development as distrib-
uted generation requires that complex
structures and systems are integrated
with the development to enable it to
produce more electrical energy than it
consumes. Energy usage can be mini-
mized by using passive, low energy,
and efficient building systems. Onsite
power production can be maximized by
the balance of distributed renewable
and cogeneration energy resources cor-
responding to its geographic location.
Existing strategies in sustainable devel-
opment and green building guidelines
are effective energy conservation mea-
sures. Existing technologies consisting
of building integrated photovoltaic
arrays, roof mounted vertical axis wind
turbines, and combined heat and power
systems can be integrated with a build-
ing automation system to provide a sus-
tainable source of energy. Creating
developments that have a long term
net-benefit of electrical energy will be a
powerful tool in providing a plentiful
and consistent supply of electricity for
future generations.
Read more about it • S. Mertens, “The energy yield of
roof mounted wind turbines,” J. Wind Eng., vol. 27, no. 6, pp. 507–518, June
2003.
• D. Prasad and M. Snow, Design-ing with Solar Power: A Source Book for BIPV. Australia: Earthscan and the Im-
ages Publishing Group, 2005.
• P. Lippe, Ed., The Costs and Ben-efits of High Performance Buildings: Les-sons Learned, 3rd ed. New York: Earth
Day New York, 2005.
• 2005 Residential energy consump-
tion survey: Household energy con-
sumption and expenditures tables. U.S.
DoE Energy Information Administration
[Online]. Available: <http://www.eia.
doe.gov/emeu/recs/recs2005/c&e/de-
tailed_tables2005c&e.html>
• K. Yeang, Reinventing the Sky-scraper. London, U.K.: Wiley-Academy,
2002.
• A. C. Nelson. (2004). Toward
a new metropolis: The opportunity to
rebuild America. The Brookings Institu-
tion Metropolitan Policy Program [On-
line]. Available: www.Brookings.edu/
metro/pubs/20041213_rebuildamerica.
htm
• S. Strong. (2005, Dec. 13). Build-
ing integrated photovoltaics (BIPV).
Whole building design guide [Online].
Available: http://www.wbdg.org/de-
sign/BiPV.php
• ONSITE SYCOM Energy Corpo-
ration, “Review of combined heat and
power technologies,” California Energy
Comm., grant no. 98R020974 with the
US Dept. Energy, Office of EERE, Oct.
1999.
• L. Rowland. (2000, Aug. 7).
Building automation system communi-
cation. Energy and Power Management
[Online]. Available: http://www.energ-
yandpowermanagement.com/CDA/Ar-
ticles/Fundamental_Series/
• (2008, Aug. 1). Net-zero energy
home generating an energy surplus.
US DoE/EERE/NREL feature story [On-
line]. Available: http://www.nrel.gov/
features/20080801_habitat.html
• S. Upson. A less well-oiled war
machine. IEEE Spectr. [Online]. Available:
http://spectrum.ieee.org/oct08/6827
• Online public profile of CGI Mem-
ber Committments for Clinton Global Cli-
mate Initiative. (2007). The energy posi-
tive initiative [Online]. Available: http://
commitments.clintonglobalinitiative.org/
projects.htm? mode=view&rid=209687
• N. Keith and A. Padalka. (2005,
Mar.). Bigger Projects Have More Sus-tainable Feature Options. McGraw Hill
Construction [Online]. Available: http://
newyork.construction.com/features/
archive/0503_cover1.asp
About the authorMatthew B. Nissen, P.E. (matt.nissen@
ieee.org) received his B.S.E.E. from Poly-
technic University of Brooklyn in 2003
and has since been studying sustainable
development through various New York
City-based professional organizations.
While at Cosentini Associates Consulting
Engineers he worked on various sustain-
able commercial design projects in major
cities around the world. He is currently
with Sigma Energy Solutions, a Division
of Alstom, working on industrial/power
plants and infrastructure projects. He
served various roles as an officer in the
IEEE New York Section, is the founder of
the IEEE-NY Online Community <http://
www.ieeecommunities.org/ieee.ny>,
and is the vice chair of the PES Long
Island Chapter.
Developers and urban
planners may finally have
a key ingredient to creating
sustainable cities: high-
performance development as
distributed generation.
Related Documents