October 27, 2020 Dedicated to implementing Lean Operations Enhance the Company’s profitability progressively 3Q2020 Results Presentation

Welcome message from author
This document is posted to help you gain knowledge. Please leave a comment to let me know what you think about it! Share it to your friends and learn new things together.
Transcript
October 27, 2020Dedicated to implementing Lean Operations
Enhance the Company’s profitability progressively
3Q2020 ResultsPresentation
Agenda
1
Financial Highlights2
Operational Review3
Outlook4
Appendix5
Recovery & Stable Dividend Policy
Agenda
1
Financial Highlights2
Operational Review3
Outlook4
Appendix5
Recovery & Stable Dividend Policy
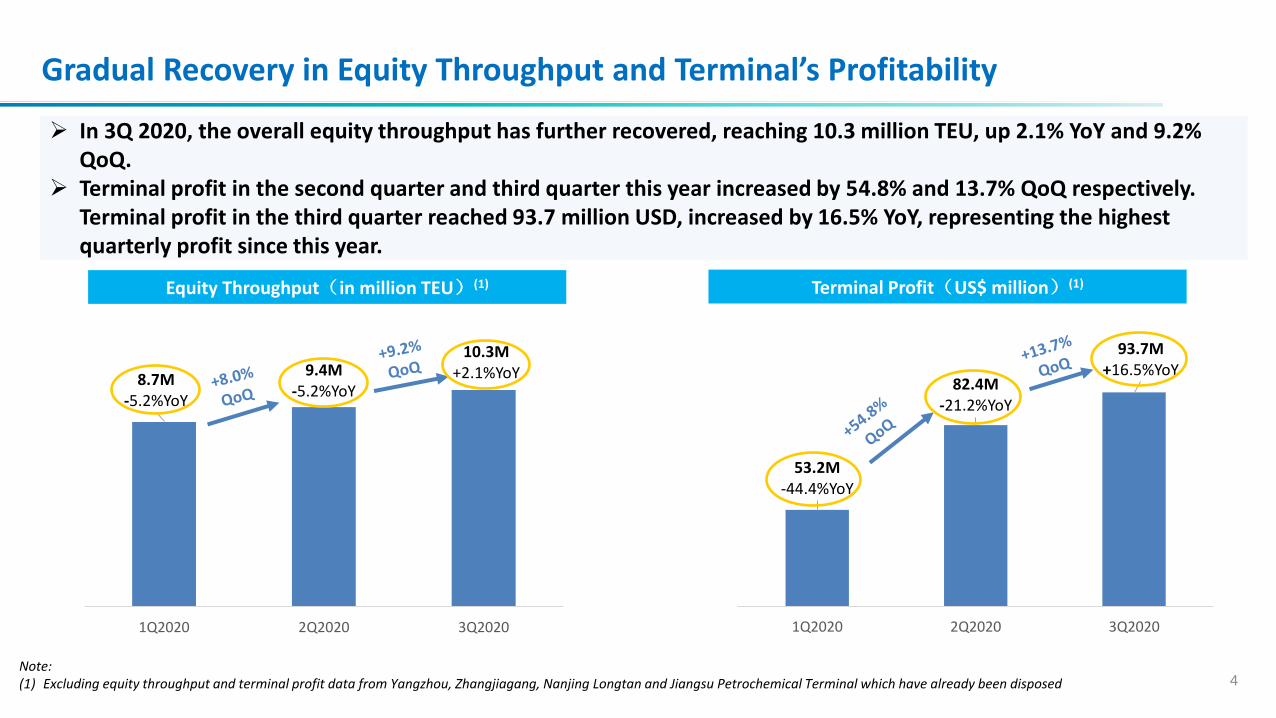
Gradual Recovery in Equity Throughput and Terminal’s Profitability
4Note:(1) Excluding equity throughput and terminal profit data from Yangzhou, Zhangjiagang, Nanjing Longtan and Jiangsu Petrochemical Terminal which have already been disposed
Terminal Profit(US$ million)(1)
53.2M-44.4%YoY
82.4M-21.2%YoY
93.7M+16.5%YoY
0
0.2
0.4
0.6
0.8
1
1.2
20.0
30.0
40.0
50.0
60.0
70.0
80.0
90.0
100.0
110.0
1Q2020 2Q2020 3Q2020
8.7M-5.2%YoY
9.4M-5.2%YoY
10.3M+2.1%YoY
0
0.005
0.01
0.015
0.02
-1
1
3
5
7
9
11
13
1Q2020 2Q2020 3Q2020
Equity Throughput(in million TEU)(1)
➢ In 3Q 2020, the overall equity throughput has further recovered, reaching 10.3 million TEU, up 2.1% YoY and 9.2% QoQ.
➢ Terminal profit in the second quarter and third quarter this year increased by 54.8% and 13.7% QoQ respectively. Terminal profit in the third quarter reached 93.7 million USD, increased by 16.5% YoY, representing the highest quarterly profit since this year.
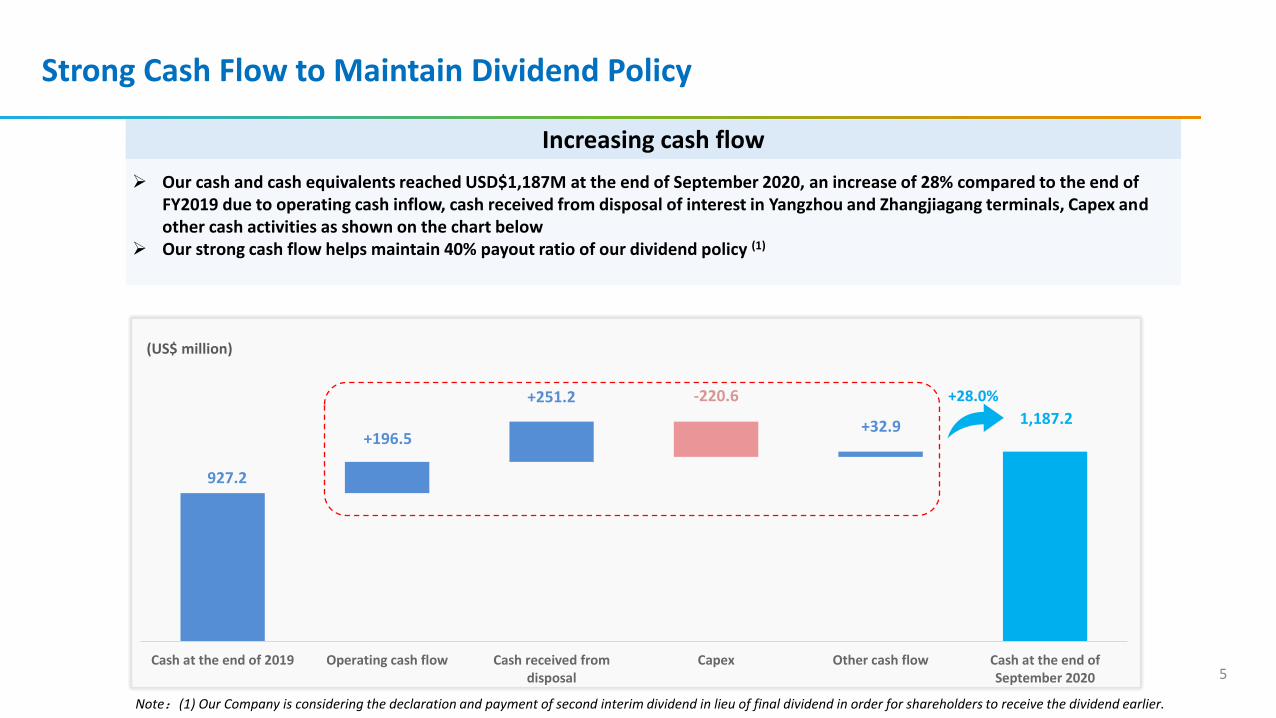
Strong Cash Flow to Maintain Dividend Policy
5
➢ Our cash and cash equivalents reached USD$1,187M at the end of September 2020, an increase of 28% compared to the end of FY2019 due to operating cash inflow, cash received from disposal of interest in Yangzhou and Zhangjiagang terminals, Capex and other cash activities as shown on the chart below
➢ Our strong cash flow helps maintain 40% payout ratio of our dividend policy (1)
Increasing cash flow
Cash at the end of 2019 Operating cash flow Cash received fromdisposal
Capex Other cash flow Cash at the end ofSeptember 2020
+196.5
927.2
+32.9
+28.0%
(US$ million)
+251.2
1,187.2
-220.6
Note:(1) Our Company is considering the declaration and payment of second interim dividend in lieu of final dividend in order for shareholders to receive the dividend earlier.
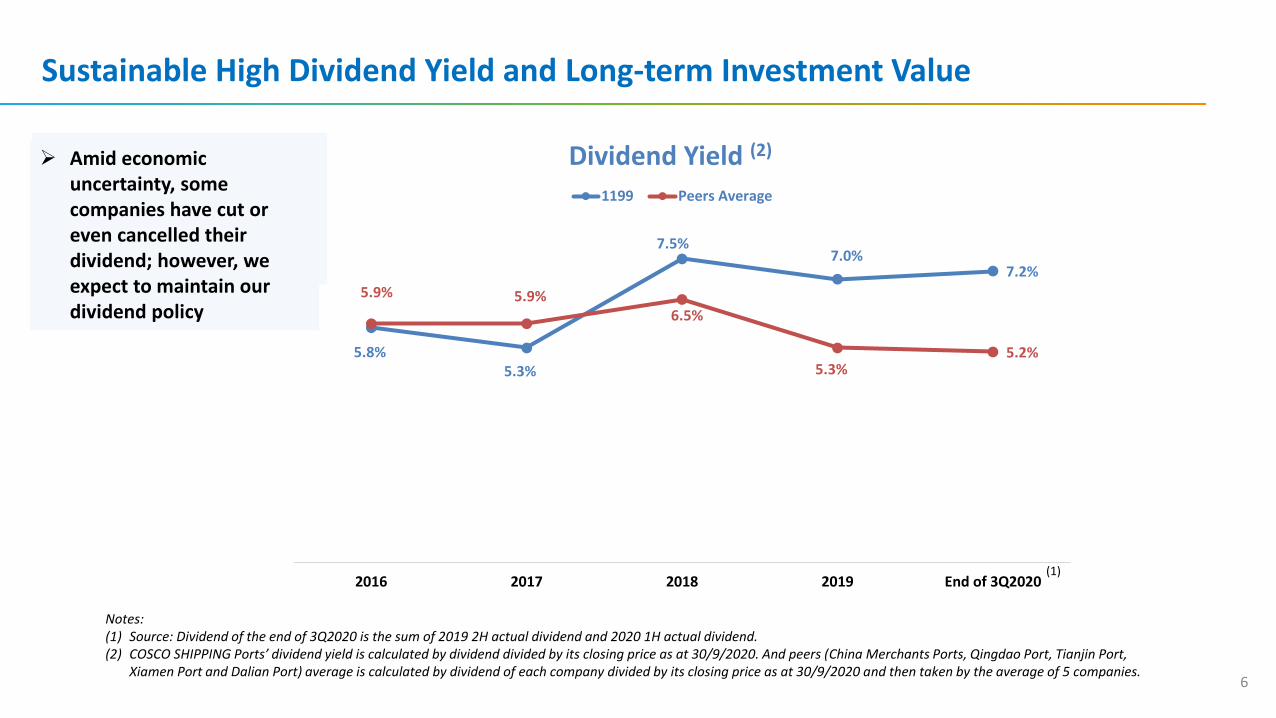
Sustainable High Dividend Yield and Long-term Investment Value
6
5.8%5.3%
7.5%7.0%
7.2%
5.9% 5.9%6.5%
5.3%5.2%
2016 2017 2018 2019 End of 3Q2020
Dividend Yield (2)
1199 Peers Average
Notes:(1) Source: Dividend of the end of 3Q2020 is the sum of 2019 2H actual dividend and 2020 1H actual dividend. (2) COSCO SHIPPING Ports’ dividend yield is calculated by dividend divided by its closing price as at 30/9/2020. And peers (China Merchants Ports, Qingdao Port, Tianjin Port,
Xiamen Port and Dalian Port) average is calculated by dividend of each company divided by its closing price as at 30/9/2020 and then taken by the average of 5 companies.
(1)
➢ Amid economic uncertainty, some companies have cut or even cancelled their dividend; however, we expect to maintain our dividend policy
Agenda
1
Financial Highlights2
Operational Review3
Outlook4
Appendix5
Recovery & Stable Dividend Policy
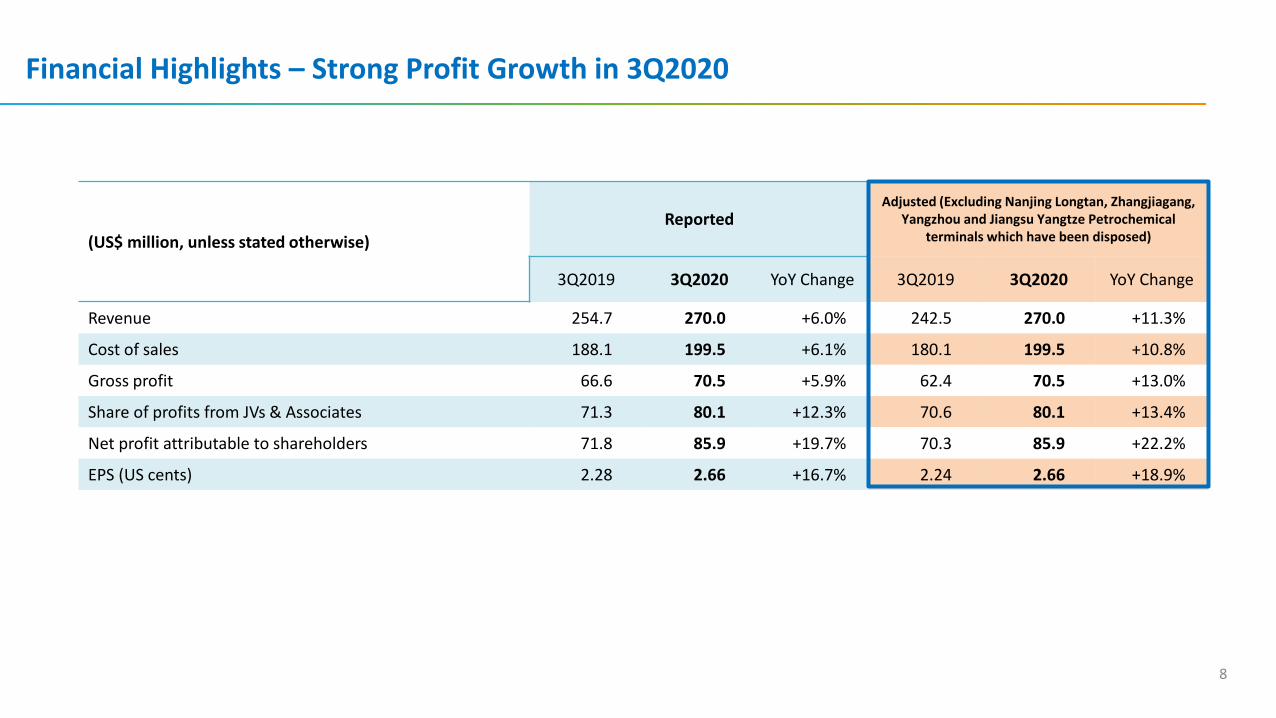
(US$ million, unless stated otherwise)
ReportedAdjusted (Excluding Nanjing Longtan, Zhangjiagang,
Yangzhou and Jiangsu Yangtze Petrochemical terminals which have been disposed)
3Q2019 3Q2020 YoY Change 3Q2019 3Q2020 YoY Change
Revenue 254.7 270.0 +6.0% 242.5 270.0 +11.3%
Cost of sales 188.1 199.5 +6.1% 180.1 199.5 +10.8%
Gross profit 66.6 70.5 +5.9% 62.4 70.5 +13.0%
Share of profits from JVs & Associates 71.3 80.1 +12.3% 70.6 80.1 +13.4%
Net profit attributable to shareholders 71.8 85.9 +19.7% 70.3 85.9 +22.2%
EPS (US cents) 2.28 2.66 +16.7% 2.24 2.66 +18.9%
Financial Highlights – Strong Profit Growth in 3Q2020
8
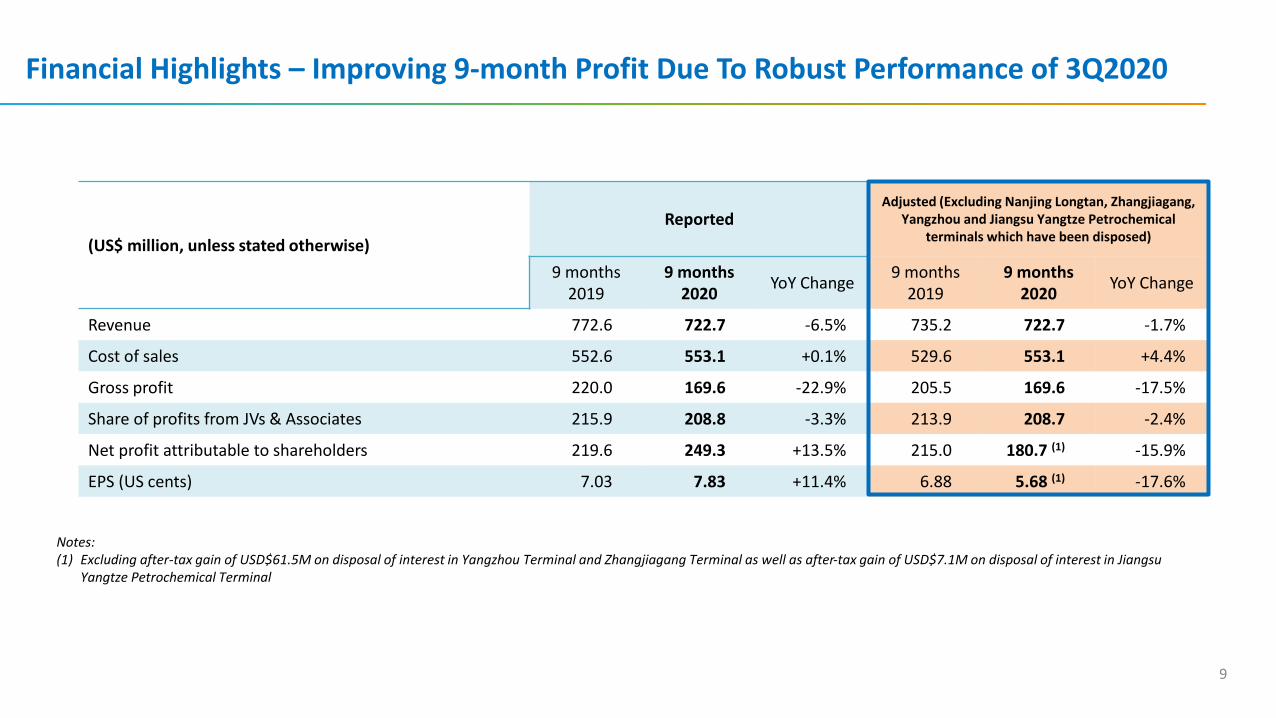
(US$ million, unless stated otherwise)
ReportedAdjusted (Excluding Nanjing Longtan, Zhangjiagang,
Yangzhou and Jiangsu Yangtze Petrochemical terminals which have been disposed)
9 months 2019
9 months 2020
YoY Change9 months
20199 months
2020 YoY Change
Revenue 772.6 722.7 -6.5% 735.2 722.7 -1.7%
Cost of sales 552.6 553.1 +0.1% 529.6 553.1 +4.4%
Gross profit 220.0 169.6 -22.9% 205.5 169.6 -17.5%
Share of profits from JVs & Associates 215.9 208.8 -3.3% 213.9 208.7 -2.4%
Net profit attributable to shareholders 219.6 249.3 +13.5% 215.0 180.7 (1) -15.9%
EPS (US cents) 7.03 7.83 +11.4% 6.88 5.68 (1) -17.6%
Financial Highlights – Improving 9-month Profit Due To Robust Performance of 3Q2020
9
Notes:(1) Excluding after-tax gain of USD$61.5M on disposal of interest in Yangzhou Terminal and Zhangjiagang Terminal as well as after-tax gain of USD$7.1M on disposal of interest in Jiangsu
Yangtze Petrochemical Terminal
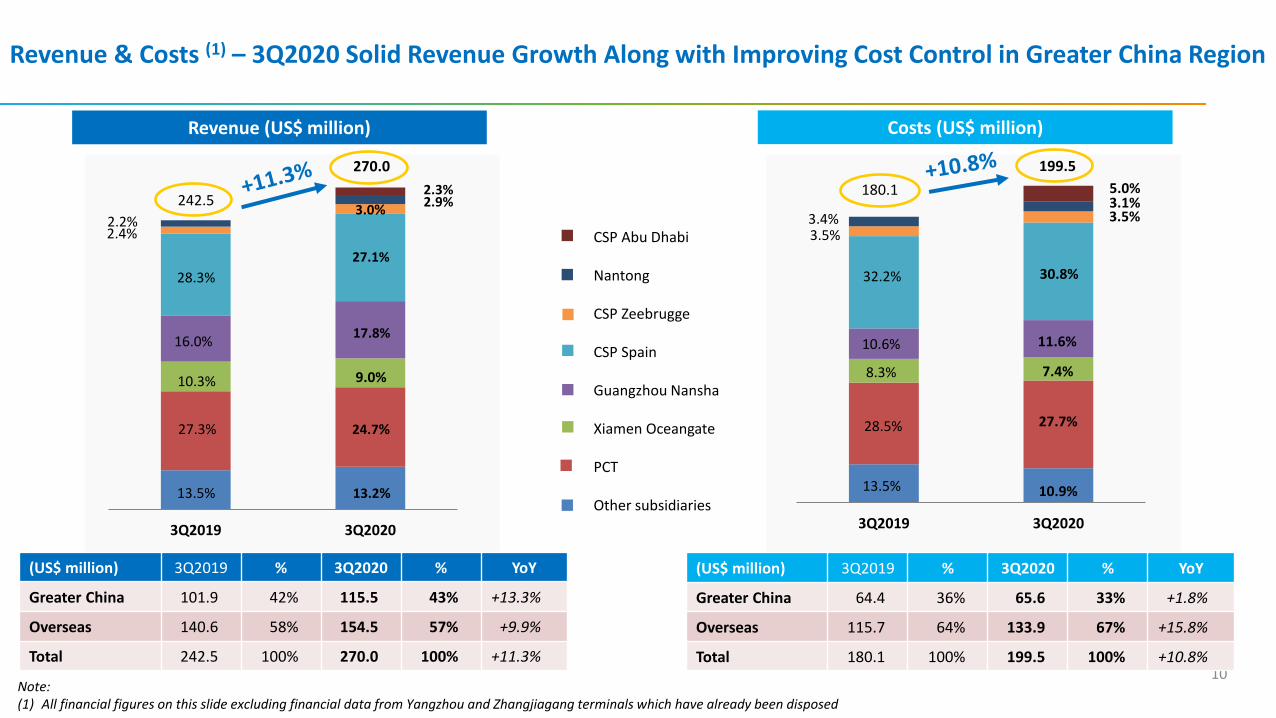
3Q2019 3Q2020
3.0%
3Q2019 3Q2020
Revenue & Costs (1) – 3Q2020 Solid Revenue Growth Along with Improving Cost Control in Greater China Region
Costs (US$ million)Revenue (US$ million)
10
(US$ million) 3Q2019 % 3Q2020 % YoY
Greater China 101.9 42% 115.5 43% +13.3%
Overseas 140.6 58% 154.5 57% +9.9%
Total 242.5 100% 270.0 100% +11.3%
(US$ million) 3Q2019 % 3Q2020 % YoY
Greater China 64.4 36% 65.6 33% +1.8%
Overseas 115.7 64% 133.9 67% +15.8%
Total 180.1 100% 199.5 100% +10.8%
Note:(1) All financial figures on this slide excluding financial data from Yangzhou and Zhangjiagang terminals which have already been disposed
242.5
270.0
27.3%
10.3%
16.0%
28.3%
2.4%2.2%
24.7%
13.2%
3.0%
27.1%
17.8%
9.0%
2.9%
13.5%
2.3% 180.1
199.5
3.5%
30.8%
27.7%
10.9%
28.5%
8.3%
13.5%
3.4%
10.6%
3.1%
7.4%
11.6%
5.0%
3.5%
32.2%
CSP Abu Dhabi
Nantong
CSP Zeebrugge
CSP Spain
Guangzhou Nansha
Xiamen Oceangate
PCT
Other subsidiaries
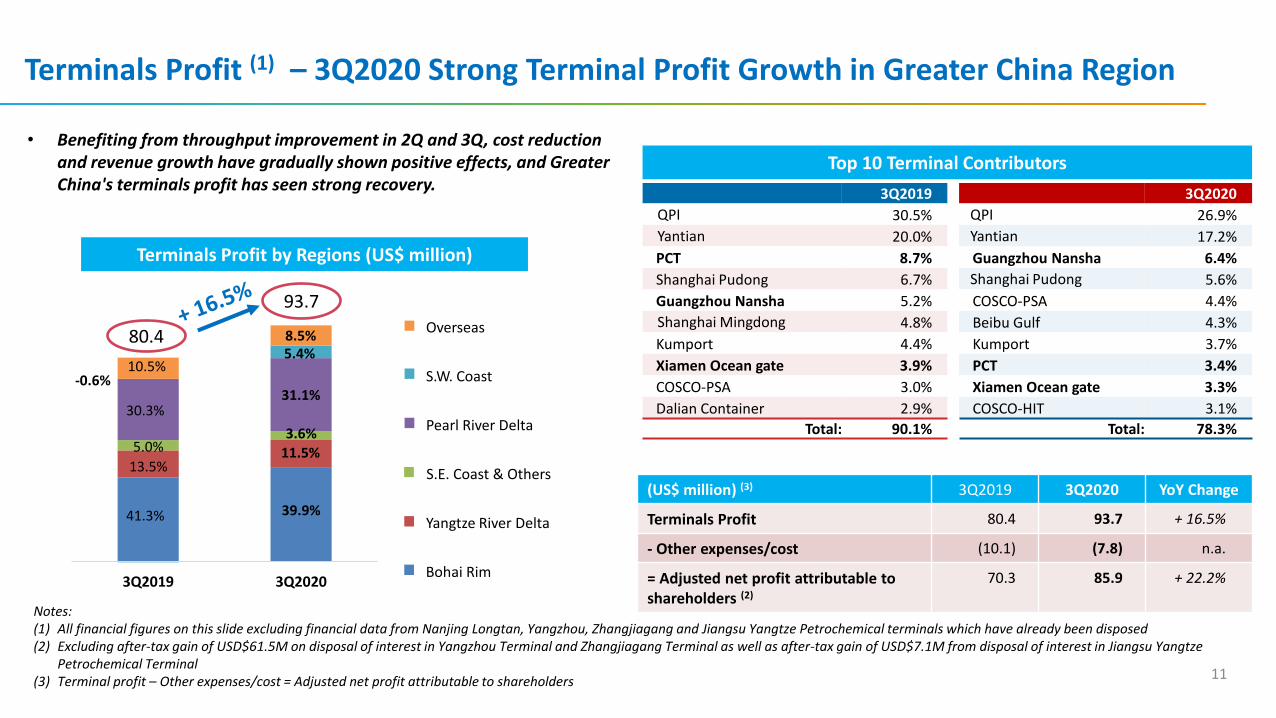
Terminals Profit (1) – 3Q2020 Strong Terminal Profit Growth in Greater China Region
Terminals Profit by Regions (US$ million)
11
3Q2019 3Q2020
-0.6%10.5%
5.4%
30.3%
3.6%5.0%
13.5%
31.1%
11.5%
8.5%
39.9%41.3%
3Q2019 3Q2020
QPI 30.5% QPI 26.9%
Yantian 20.0% Yantian 17.2%
PCT 8.7% Guangzhou Nansha 6.4%
Shanghai Pudong 6.7% Shanghai Pudong 5.6%
Guangzhou Nansha 5.2% COSCO-PSA 4.4%
Shanghai Mingdong 4.8% Beibu Gulf 4.3%
Kumport 4.4% Kumport 3.7%
Xiamen Ocean gate 3.9% PCT 3.4%
COSCO-PSA 3.0% Xiamen Ocean gate 3.3%
Dalian Container 2.9% COSCO-HIT 3.1%
Total: 90.1% Total: 78.3%
Top 10 Terminal Contributors
(US$ million) (3) 3Q2019 3Q2020 YoY Change
Terminals Profit 80.4 93.7 + 16.5%
- Other expenses/cost (10.1) (7.8) n.a.
= Adjusted net profit attributable to shareholders (2)
70.3 85.9 + 22.2%
Notes:(1) All financial figures on this slide excluding financial data from Nanjing Longtan, Yangzhou, Zhangjiagang and Jiangsu Yangtze Petrochemical terminals which have already been disposed(2) Excluding after-tax gain of USD$61.5M on disposal of interest in Yangzhou Terminal and Zhangjiagang Terminal as well as after-tax gain of USD$7.1M from disposal of interest in Jiangsu Yangtze
Petrochemical Terminal(3) Terminal profit – Other expenses/cost = Adjusted net profit attributable to shareholders
• Benefiting from throughput improvement in 2Q and 3Q, cost reduction and revenue growth have gradually shown positive effects, and Greater China's terminals profit has seen strong recovery.
80.4
93.7
Bohai Rim
Yangtze River Delta
S.E. Coast & Others
Pearl River Delta
S.W. Coast
Overseas
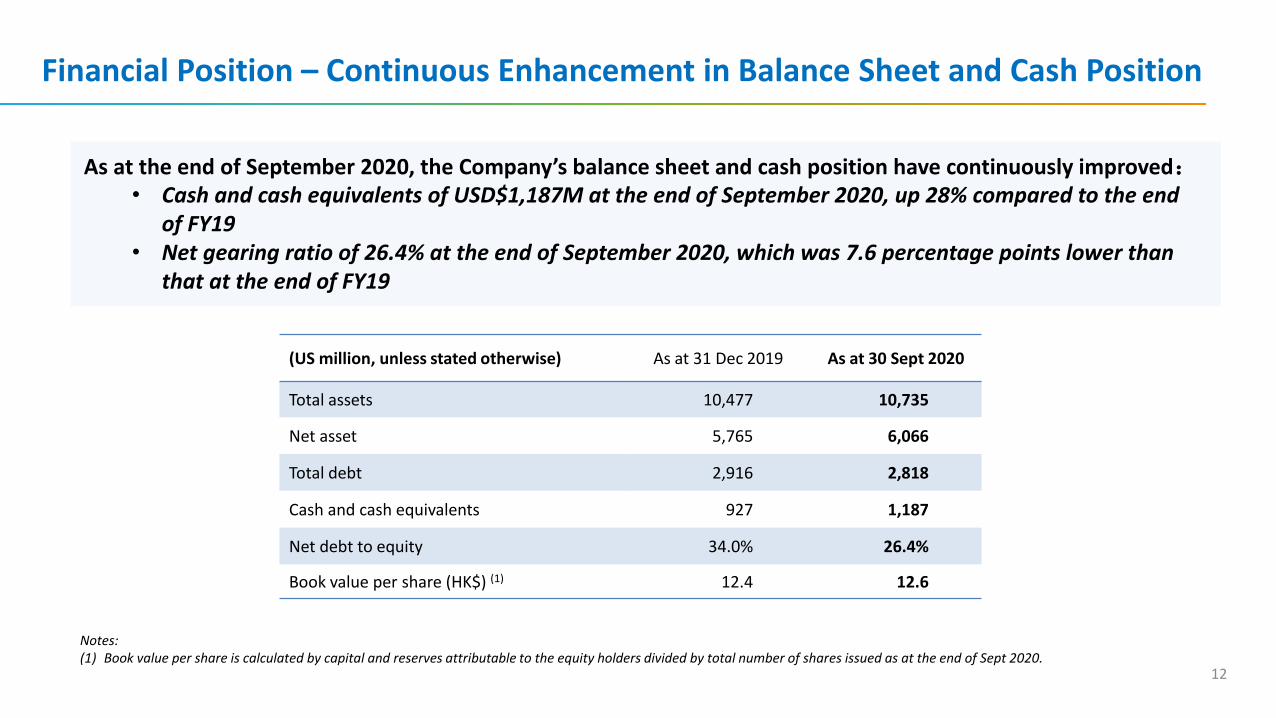
(US million, unless stated otherwise) As at 31 Dec 2019 As at 30 Sept 2020
Total assets 10,477 10,735
Net asset 5,765 6,066
Total debt 2,916 2,818
Cash and cash equivalents 927 1,187
Net debt to equity 34.0% 26.4%
Book value per share (HK$) (1) 12.4 12.6
Financial Position – Continuous Enhancement in Balance Sheet and Cash Position
12
As at the end of September 2020, the Company’s balance sheet and cash position have continuously improved:• Cash and cash equivalents of USD$1,187M at the end of September 2020, up 28% compared to the end
of FY19• Net gearing ratio of 26.4% at the end of September 2020, which was 7.6 percentage points lower than
that at the end of FY19
Notes:(1) Book value per share is calculated by capital and reserves attributable to the equity holders divided by total number of shares issued as at the end of Sept 2020.
Agenda
1
Financial Highlights2
Operational Review3
Outlook4
Appendix5
Recovery & Stable Dividend Policy
35.0% 35.2% 33.5%
11.8%11.9% 11.7%4.4%4.4%
4.4%20.4%
21.7%23.9%3.6%
4.3%
4.4%24.8%
22.5%
22.1%
1Q2020 2Q2020 3Q2020
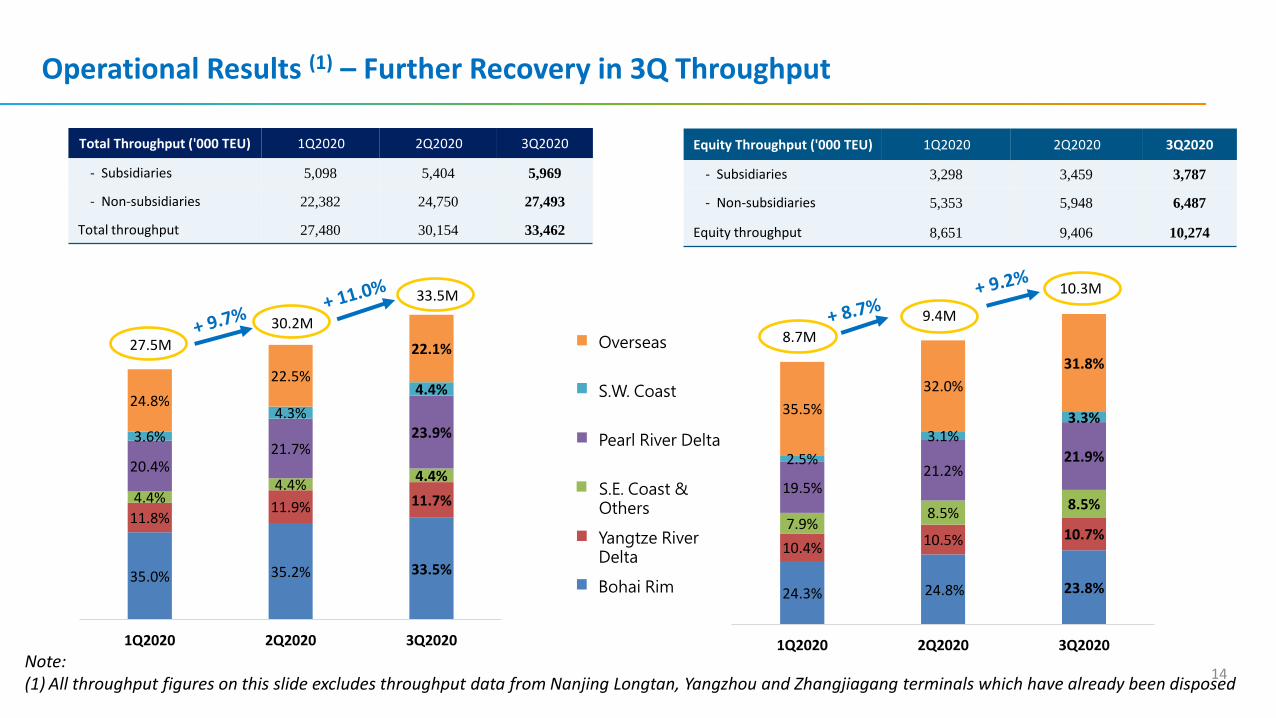
Operational Results (1) – Further Recovery in 3Q Throughput
24.3% 24.8% 23.8%
10.4% 10.5% 10.7%7.9%
8.5%8.5%
19.5%21.2%
21.9%2.5%
3.1%3.3%
35.5%
32.0%
31.8%
1Q2020 2Q2020 3Q2020
14
Total Throughput ('000 TEU) 1Q2020 2Q2020 3Q2020
- Subsidiaries 5,098 5,404 5,969
- Non-subsidiaries 22,382 24,750 27,493
Total throughput 27,480 30,154 33,462
Equity Throughput ('000 TEU) 1Q2020 2Q2020 3Q2020
- Subsidiaries 3,298 3,459 3,787
- Non-subsidiaries 5,353 5,948 6,487
Equity throughput 8,651 9,406 10,274
Note:(1) All throughput figures on this slide excludes throughput data from Nanjing Longtan, Yangzhou and Zhangjiagang terminals which have already been disposed
27.5M
30.2M
33.5M
8.7M
9.4M
10.3M
Bohai Rim
Yangtze River Delta
S.E. Coast & Others
Pearl River Delta
S.W. Coast
Overseas
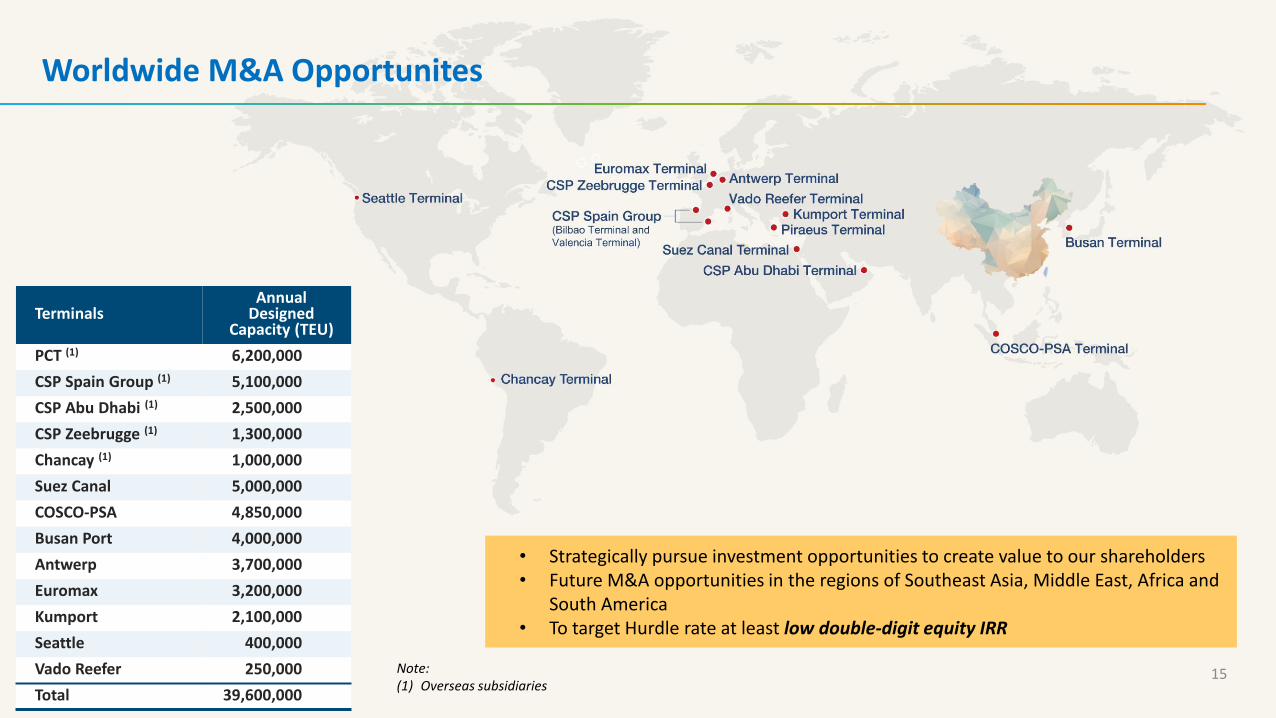
Worldwide M&A Opportunites
15
TerminalsAnnual
Designed Capacity (TEU)
PCT (1) 6,200,000
CSP Spain Group (1) 5,100,000
CSP Abu Dhabi (1) 2,500,000
CSP Zeebrugge (1) 1,300,000
Chancay (1) 1,000,000
Suez Canal 5,000,000
COSCO-PSA 4,850,000
Busan Port 4,000,000
Antwerp 3,700,000
Euromax 3,200,000
Kumport 2,100,000
Seattle 400,000
Vado Reefer 250,000
Total 39,600,000
• Strategically pursue investment opportunities to create value to our shareholders• Future M&A opportunities in the regions of Southeast Asia, Middle East, Africa and
South America• To target Hurdle rate at least low double-digit equity IRR
Note:(1) Overseas subsidiaries
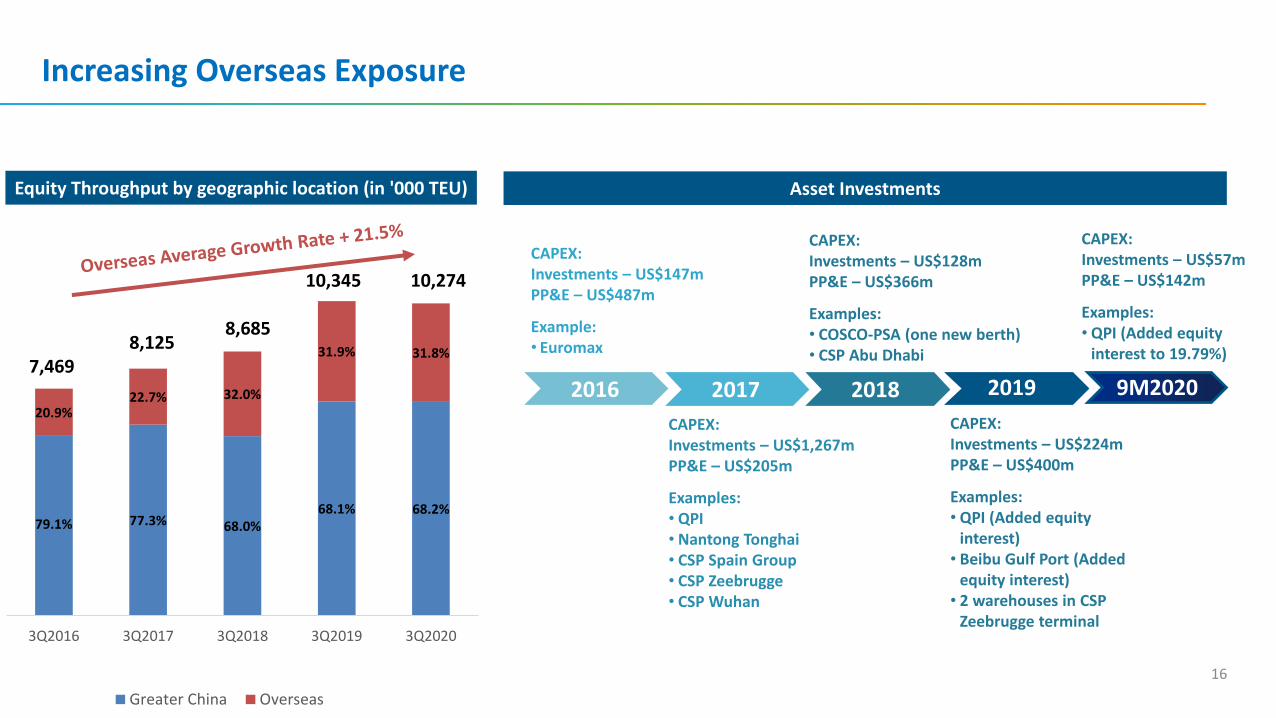
Increasing Overseas Exposure
Asset Investments
2016 2017 2018 2019
Equity Throughput by geographic location (in '000 TEU)
16
79.1% 77.3% 68.0%68.1% 68.2%
20.9%22.7% 32.0%
31.9% 31.8%
3Q2016 3Q2017 3Q2018 3Q2019 3Q2020
Greater China Overseas
10,27410,345
8,6858,125
7,4699M2020
CAPEX:Investments – US$1,267mPP&E – US$205m
Examples:• QPI• Nantong Tonghai• CSP Spain Group• CSP Zeebrugge• CSP Wuhan
CAPEX:Investments – US$147mPP&E – US$487m
Example:• Euromax
CAPEX:Investments – US$128mPP&E – US$366m
Examples:• COSCO-PSA (one new berth)• CSP Abu Dhabi
CAPEX:Investments – US$224mPP&E – US$400m
Examples:• QPI (Added equity
interest)• Beibu Gulf Port (Added
equity interest)• 2 warehouses in CSP
Zeebrugge terminal
CAPEX:Investments – US$57mPP&E – US$142m
Examples:• QPI (Added equity
interest to 19.79%)
Growth in Throughput (2)
(3Q2020 YoY Change)
25.1% 23.2%
4.7% 5.6%
24.1% 21.4%
3Q2019 3Q2020Note:
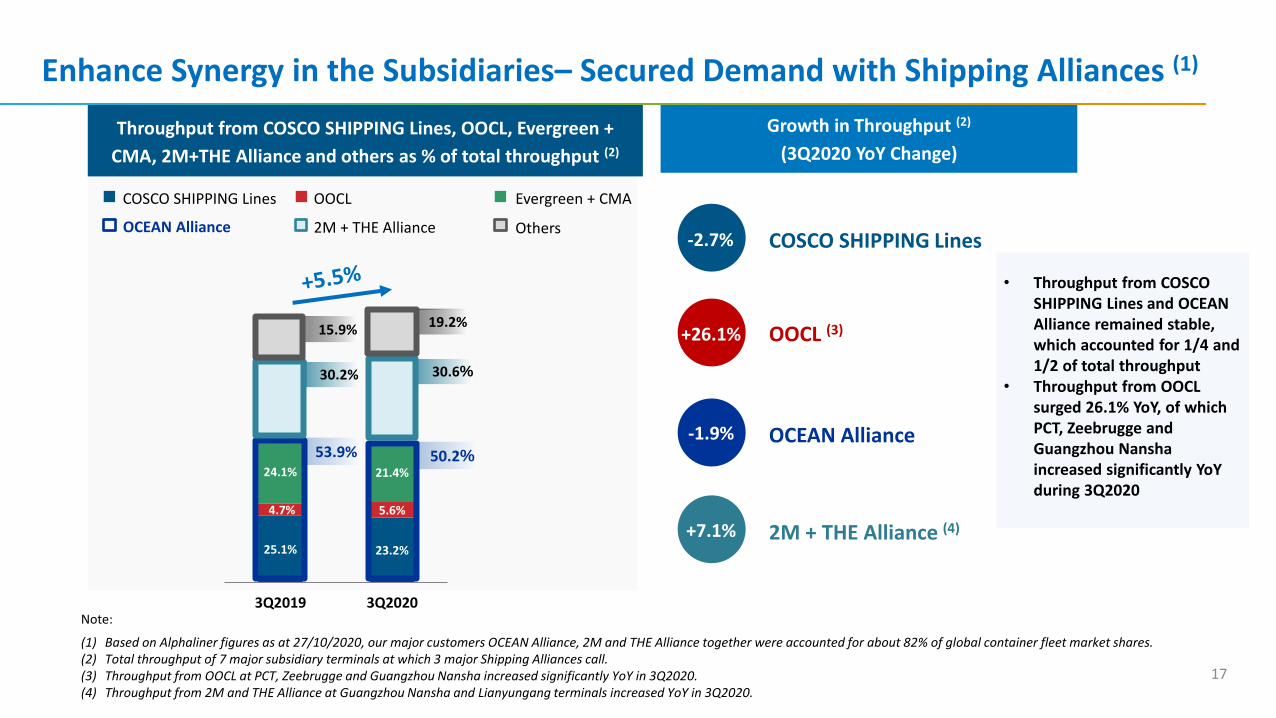
(1) Based on Alphaliner figures as at 27/10/2020, our major customers OCEAN Alliance, 2M and THE Alliance together were accounted for about 82% of global container fleet market shares.(2) Total throughput of 7 major subsidiary terminals at which 3 major Shipping Alliances call.(3) Throughput from OOCL at PCT, Zeebrugge and Guangzhou Nansha increased significantly YoY in 3Q2020.(4) Throughput from 2M and THE Alliance at Guangzhou Nansha and Lianyungang terminals increased YoY in 3Q2020.
Enhance Synergy in the Subsidiaries– Secured Demand with Shipping Alliances (1)
Throughput from COSCO SHIPPING Lines, OOCL, Evergreen +
CMA, 2M+THE Alliance and others as % of total throughput (2)
-2.7%
+26.1%
-1.9%
+7.1%
15.9%
53.9%
30.2%
50.2%
30.6%
19.2%
17
• Throughput from COSCO SHIPPING Lines and OCEAN Alliance remained stable, which accounted for 1/4 and 1/2 of total throughput
• Throughput from OOCL surged 26.1% YoY, of which PCT, Zeebrugge and Guangzhou Nanshaincreased significantly YoY during 3Q2020
OCEAN Alliance 2M + THE Alliance Others
COSCO SHIPPING Lines OOCL Evergreen + CMA
COSCO SHIPPING Lines
OOCL (3)
OCEAN Alliance
2M + THE Alliance (4)
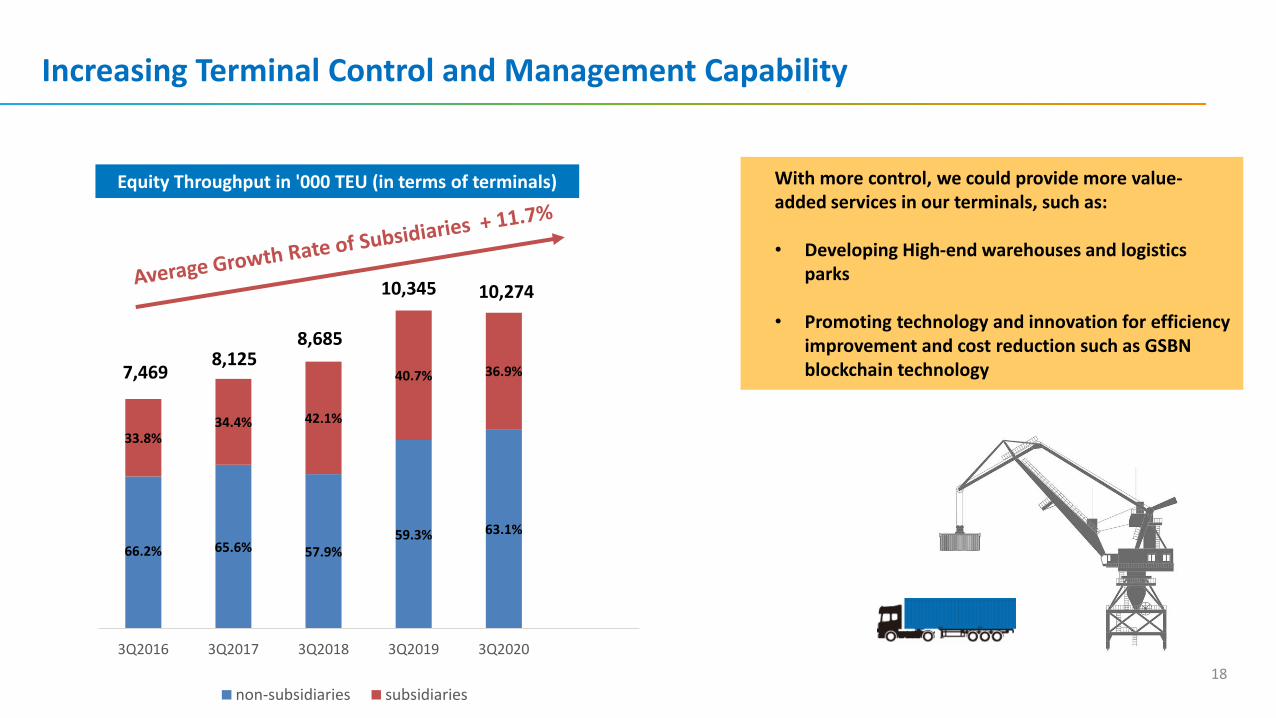
Increasing Terminal Control and Management Capability
Equity Throughput in '000 TEU (in terms of terminals)
18
7,4698,125
8,685
10,345
With more control, we could provide more value-added services in our terminals, such as:
• Developing High-end warehouses and logistics parks
• Promoting technology and innovation for efficiency improvement and cost reduction such as GSBN blockchain technology
66.2% 65.6% 57.9%59.3% 63.1%
33.8%34.4% 42.1%
40.7% 36.9%
3Q2016 3Q2017 3Q2018 3Q2019 3Q2020
non-subsidiaries subsidiaries
10,274
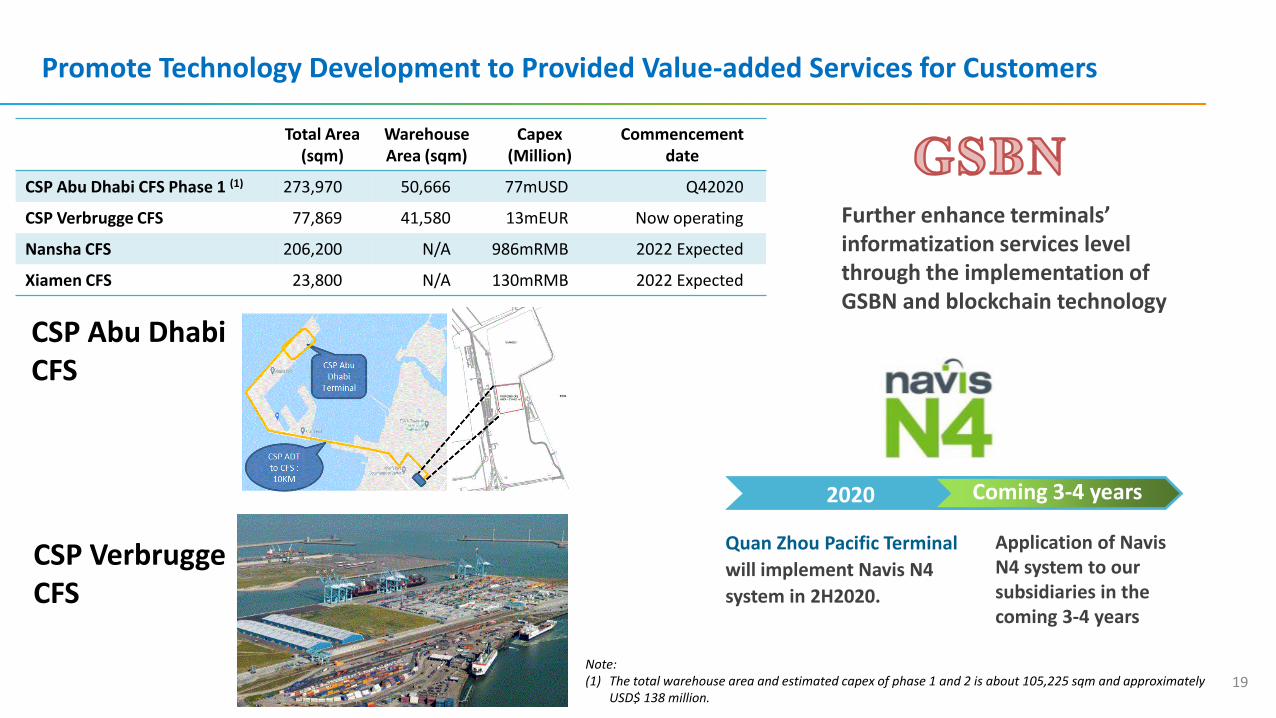
Promote Technology Development to Provided Value-added Services for Customers
19
CSP Abu Dhabi CFS
CSP Verbrugge CFS
Total Area(sqm)
Warehouse Area (sqm)
Capex(Million)
Commencement date
CSP Abu Dhabi CFS Phase 1 (1) 273,970 50,666 77mUSD Q42020
CSP Verbrugge CFS 77,869 41,580 13mEUR Now operating
Nansha CFS 206,200 N/A 986mRMB 2022 Expected
Xiamen CFS 23,800 N/A 130mRMB 2022 Expected
Quan Zhou Pacific Terminal
will implement Navis N4
system in 2H2020.
2020 2020Coming 3-4 years
Application of Navis N4 system to our subsidiaries in the coming 3-4 years
Further enhance terminals’ informatization services level through the implementation of GSBN and blockchain technology
Note: (1) The total warehouse area and estimated capex of phase 1 and 2 is about 105,225 sqm and approximately
USD$ 138 million.
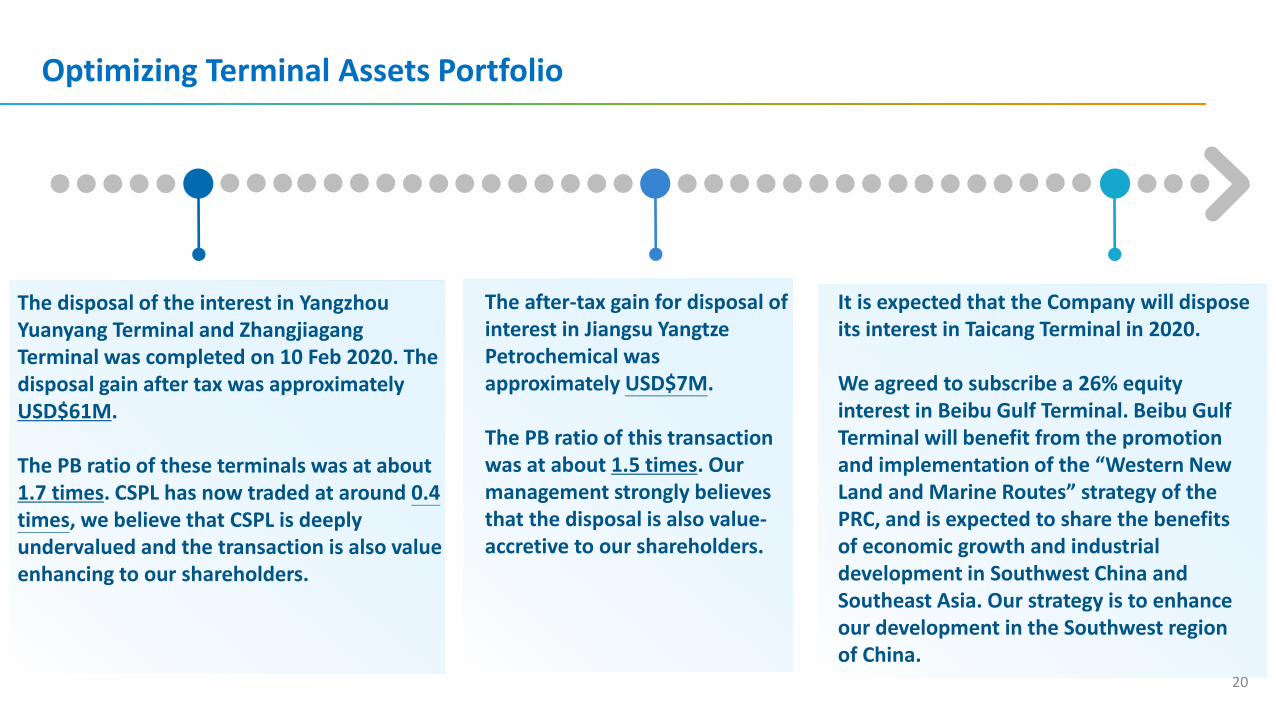
Optimizing Terminal Assets Portfolio
20
It is expected that the Company will dispose its interest in Taicang Terminal in 2020.
We agreed to subscribe a 26% equity interest in Beibu Gulf Terminal. Beibu Gulf Terminal will benefit from the promotion and implementation of the “Western New Land and Marine Routes” strategy of the PRC, and is expected to share the benefits of economic growth and industrial development in Southwest China and Southeast Asia. Our strategy is to enhance our development in the Southwest region of China.
The disposal of the interest in Yangzhou Yuanyang Terminal and Zhangjiagang Terminal was completed on 10 Feb 2020. The disposal gain after tax was approximately USD$61M.
The PB ratio of these terminals was at about 1.7 times. CSPL has now traded at around 0.4 times, we believe that CSPL is deeply undervalued and the transaction is also value enhancing to our shareholders.
The after-tax gain for disposal of interest in Jiangsu Yangtze Petrochemical was approximately USD$7M.
The PB ratio of this transaction was at about 1.5 times. Our management strongly believes that the disposal is also value-accretive to our shareholders.
Agenda
1
Financial Highlights2
Operational Review3
Outlook4
Appendix5
Recovery & Stable Dividend Policy
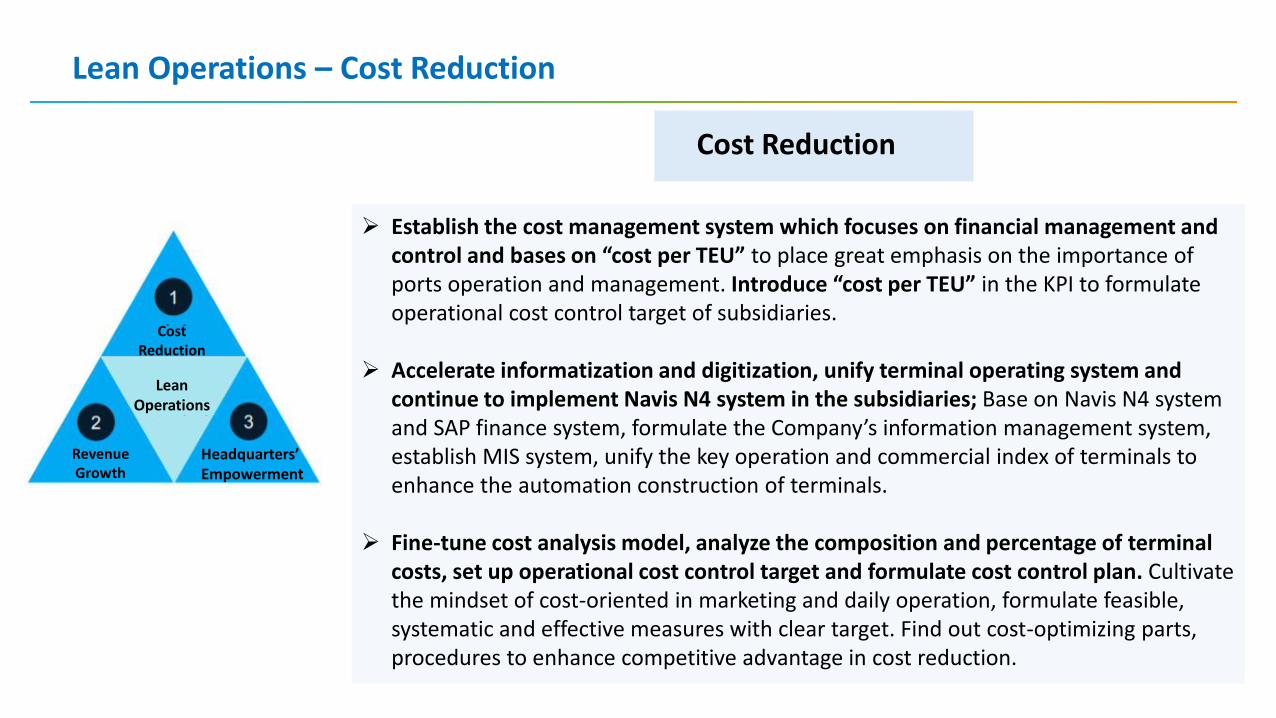
Lean Operations – Cost Reduction
22
Cost Reduction
➢ Establish the cost management system which focuses on financial management and control and bases on “cost per TEU” to place great emphasis on the importance of ports operation and management. Introduce “cost per TEU” in the KPI to formulate operational cost control target of subsidiaries.
➢ Accelerate informatization and digitization, unify terminal operating system and continue to implement Navis N4 system in the subsidiaries; Base on Navis N4 system and SAP finance system, formulate the Company’s information management system, establish MIS system, unify the key operation and commercial index of terminals to enhance the automation construction of terminals.
➢ Fine-tune cost analysis model, analyze the composition and percentage of terminal costs, set up operational cost control target and formulate cost control plan. Cultivate the mindset of cost-oriented in marketing and daily operation, formulate feasible, systematic and effective measures with clear target. Find out cost-optimizing parts, procedures to enhance competitive advantage in cost reduction.
Cost Reduction
Revenue Growth
LeanOperations
Headquarters’ Empowerment
Lean Operations – Revenue Growth and Headquarters’ Empowerment
23
➢ Build customer value analysis model to mainly analyze the profit contribution from different shipping companies and different boxes to understand the profit comes from which customer and business. Headquarters and terminals can precisely target each customer based on the customer value analysis results and formulate more effective marketing and negotiation strategies based on each terminals’ situation, in order to further tap customer value and improve terminals’ throughput and revenue.
➢ Enhance the Company’s overall sales and marketing, fine-tune marketing organization structure and maximize synergy. Continue to optimize and enhance the Company’s overall operational capability, including strengthening sales and marketing teams’ capability of market insight and customers value analysis as well as supporting our ports’ networking and relationship with shipping liners systematically.
➢ Innovate sales and marketing strategies and develop supply chain business. The Company is actively developing the ports extended supply chain platform to enhance supply chain warehousing service based on terminals and establish logistics network leveraging on supply chain platform. CFS business also increases the number of shipping lines and the increase in shipping lines will bring more CFS and supply chain services demand.
➢ The Headquarters is empowered to be a co-solver of problems impeding cost reduction and revenue growth by the terminal operators, as well as an enabler of good business decision making. Through the application approaches such as information visualization and lean operation center, it is realized that our company's role has transformed from “passive review” to “business partners” which improves our ports' performance in cost reduction and revenue growth.
➢ Actively execute action plan and strengthen the operation and management of terminals.
RevenueGrowth
Headquarters’ Empowerment
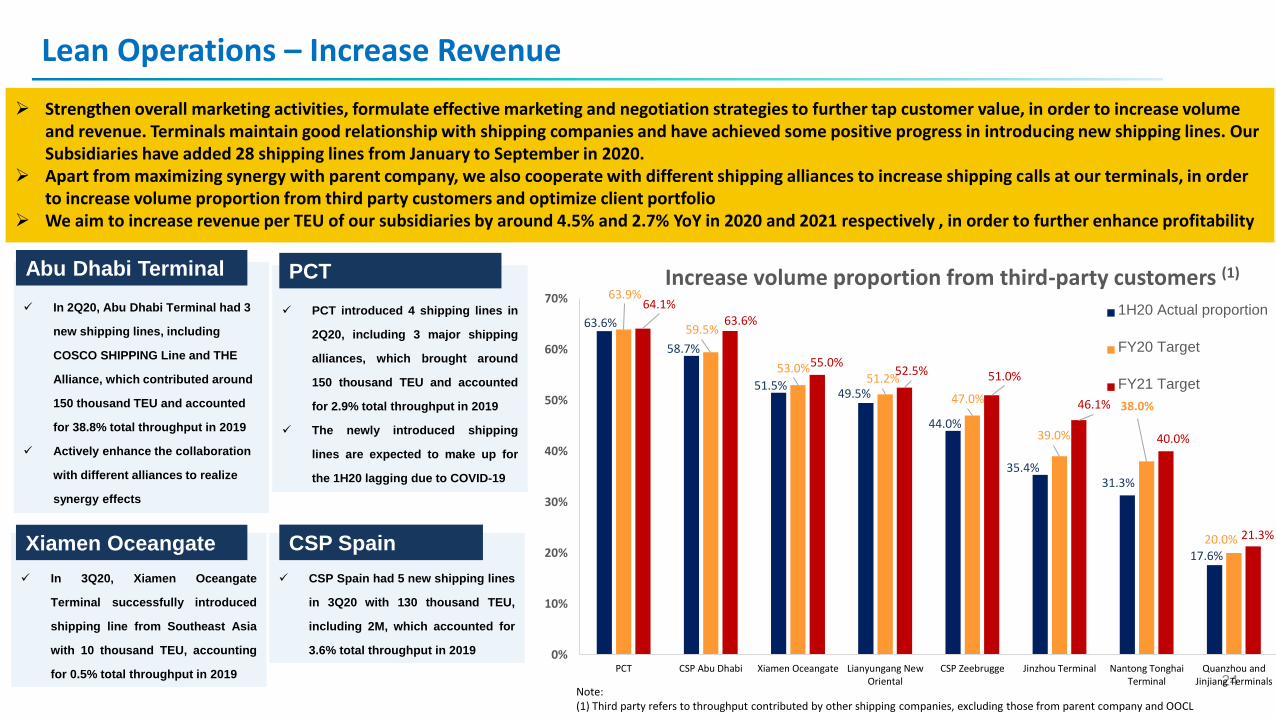
✓ In 2Q20, Abu Dhabi Terminal had 3
new shipping lines, including
COSCO SHIPPING Line and THE
Alliance, which contributed around
150 thousand TEU and accounted
for 38.8% total throughput in 2019
✓ Actively enhance the collaboration
with different alliances to realize
synergy effects
Lean Operations – Increase Revenue
24
Abu Dhabi Terminal
➢ Strengthen overall marketing activities, formulate effective marketing and negotiation strategies to further tap customer value, in order to increase volume and revenue. Terminals maintain good relationship with shipping companies and have achieved some positive progress in introducing new shipping lines. Our Subsidiaries have added 28 shipping lines from January to September in 2020.
➢ Apart from maximizing synergy with parent company, we also cooperate with different shipping alliances to increase shipping calls at our terminals, in order to increase volume proportion from third party customers and optimize client portfolio
➢ We aim to increase revenue per TEU of our subsidiaries by around 4.5% and 2.7% YoY in 2020 and 2021 respectively , in order to further enhance profitability
✓ In 3Q20, Xiamen Oceangate
Terminal successfully introduced
shipping line from Southeast Asia
with 10 thousand TEU, accounting
for 0.5% total throughput in 2019
Xiamen Oceangate
✓ PCT introduced 4 shipping lines in
2Q20, including 3 major shipping
alliances, which brought around
150 thousand TEU and accounted
for 2.9% total throughput in 2019
✓ The newly introduced shipping
lines are expected to make up for
the 1H20 lagging due to COVID-19
PCT
✓ CSP Spain had 5 new shipping lines
in 3Q20 with 130 thousand TEU,
including 2M, which accounted for
3.6% total throughput in 2019
CSP Spain
63.6%
58.7%
51.5%49.5%
44.0%
35.4%31.3%
17.6%
63.9%
59.5%
53.0%51.2%
47.0%
39.0%
38.0%
20.0%
64.1%63.6%
55.0%52.5% 51.0%
46.1%
40.0%
21.3%
0%
10%
20%
30%
40%
50%
60%
70%
PCT CSP Abu Dhabi Xiamen Oceangate Lianyungang NewOriental
CSP Zeebrugge Jinzhou Terminal Nantong TonghaiTerminal
Quanzhou andJinjiang Terminals
Increase volume proportion from third-party customers (1)
1H20 Actual proportion
FY20 Target
FY21 Target
Note: (1) Third party refers to throughput contributed by other shipping companies, excluding those from parent company and OOCL
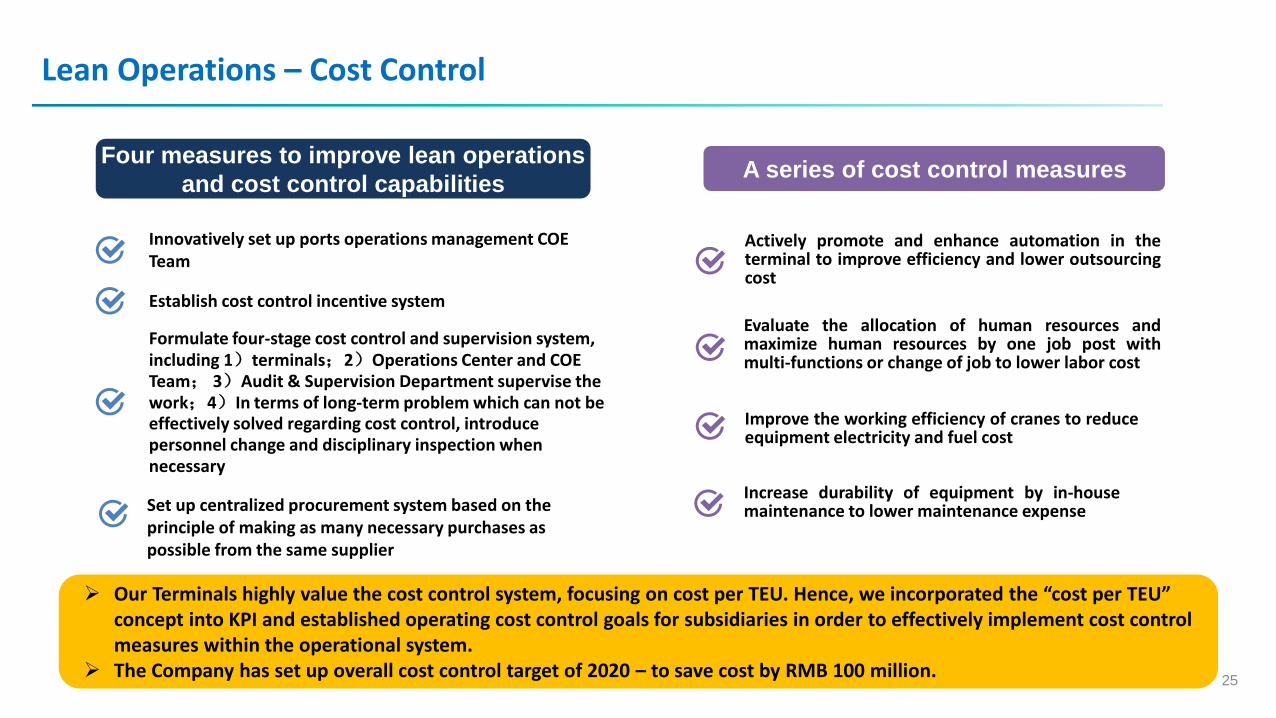
Lean Operations – Cost Control
25
A series of cost control measures
Actively promote and enhance automation in theterminal to improve efficiency and lower outsourcingcost
Evaluate the allocation of human resources andmaximize human resources by one job post withmulti-functions or change of job to lower labor cost
Improve the working efficiency of cranes to reduceequipment electricity and fuel cost
Four measures to improve lean operations
and cost control capabilities
Innovatively set up ports operations management COE Team
Establish cost control incentive system
Formulate four-stage cost control and supervision system, including 1)terminals;2)Operations Center and COE Team; 3)Audit & Supervision Department supervise the work;4)In terms of long-term problem which can not be effectively solved regarding cost control, introduce personnel change and disciplinary inspection when necessary
➢ Our Terminals highly value the cost control system, focusing on cost per TEU. Hence, we incorporated the “cost per TEU” concept into KPI and established operating cost control goals for subsidiaries in order to effectively implement cost controlmeasures within the operational system.
➢ The Company has set up overall cost control target of 2020 – to save cost by RMB 100 million.
Set up centralized procurement system based on the principle of making as many necessary purchases as possible from the same supplier
Increase durability of equipment by in-housemaintenance to lower maintenance expense
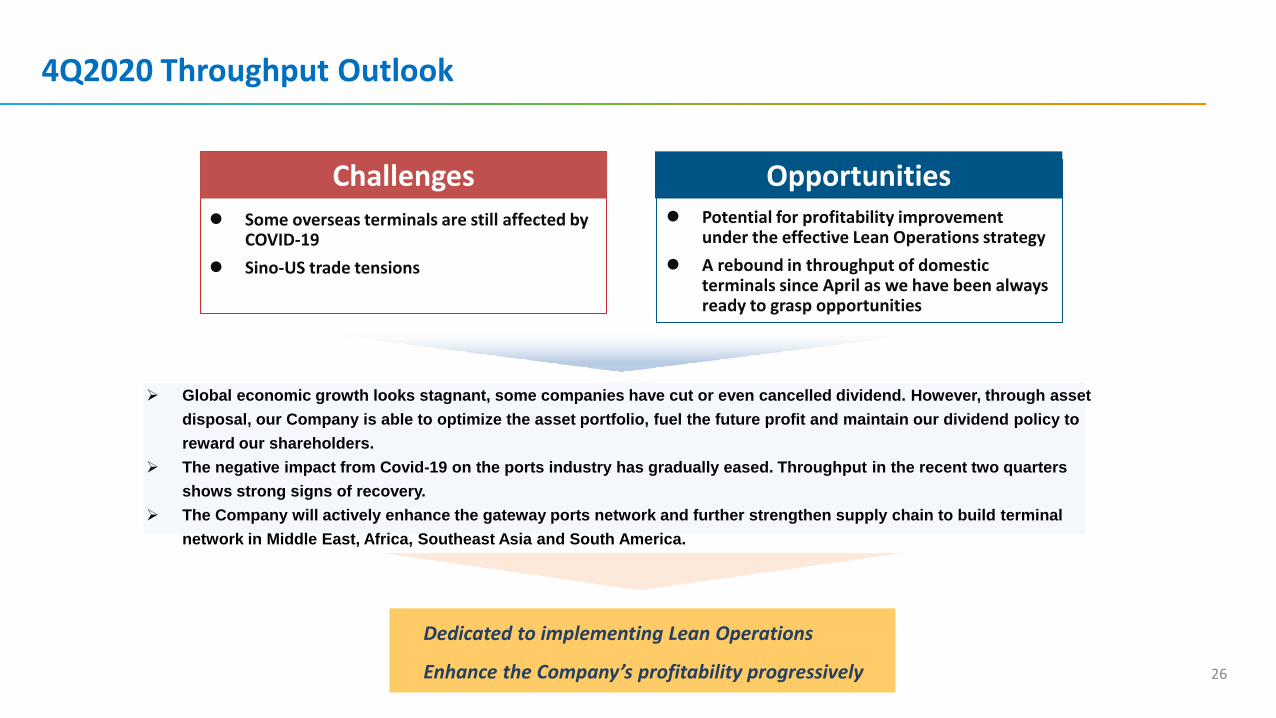
4Q2020 Throughput Outlook
26
Challenges Opportunities⚫ Some overseas terminals are still affected by
COVID-19
⚫ Sino-US trade tensions
⚫ Potential for profitability improvement under the effective Lean Operations strategy
⚫ A rebound in throughput of domestic terminals since April as we have been always ready to grasp opportunities
Dedicated to implementing Lean Operations
Enhance the Company’s profitability progressively
➢ Global economic growth looks stagnant, some companies have cut or even cancelled dividend. However, through asset
disposal, our Company is able to optimize the asset portfolio, fuel the future profit and maintain our dividend policy to
reward our shareholders.
➢ The negative impact from Covid-19 on the ports industry has gradually eased. Throughput in the recent two quarters
shows strong signs of recovery.
➢ The Company will actively enhance the gateway ports network and further strengthen supply chain to build terminal
network in Middle East, Africa, Southeast Asia and South America.
Q & A Session
Thank you!
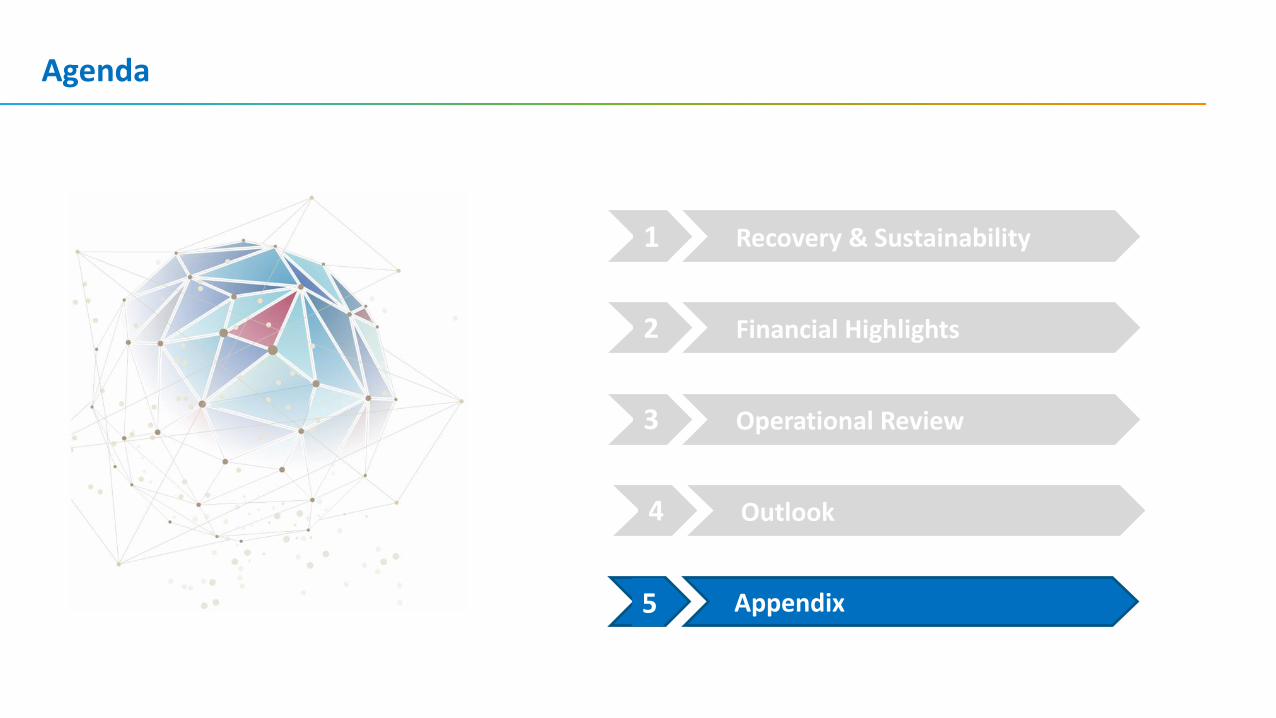
Agenda
Recovery & Sustainability1
Financial Highlights2
Operational Review3
Appendix5
Outlook4
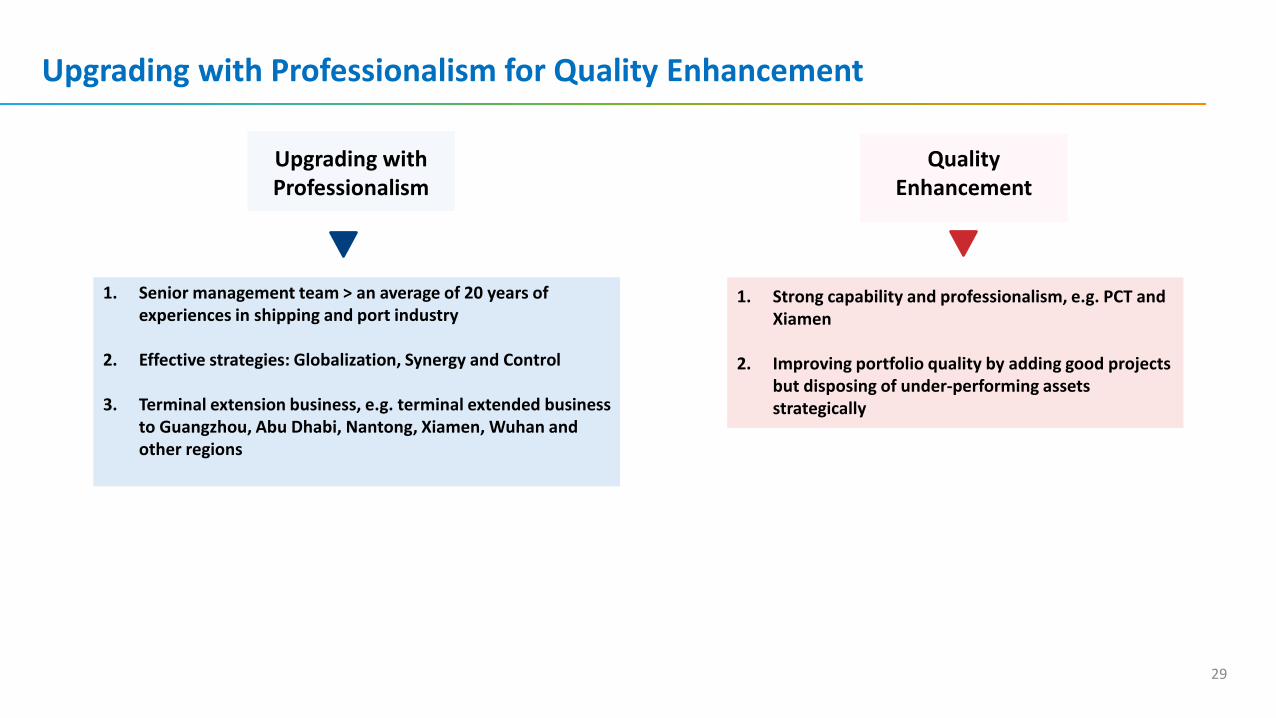
Upgrading with Professionalism for Quality Enhancement
29
Upgrading with Professionalism
1. Senior management team > an average of 20 years of experiences in shipping and port industry
2. Effective strategies: Globalization, Synergy and Control
3. Terminal extension business, e.g. terminal extended business to Guangzhou, Abu Dhabi, Nantong, Xiamen, Wuhan and other regions
Quality Enhancement
1. Strong capability and professionalism, e.g. PCT and Xiamen
2. Improving portfolio quality by adding good projects but disposing of under-performing assets strategically
Operations:◆ Global terminal network
◆ Linkage effects in costs,services and synergies
◆ Increasing subsidiaries
Financials:◆ Higher return from existing
portfolio
◆ Further improved assetquality after M&A anddivestment
◆ Strong free cash flow andhealthy balance sheet
30
2016Restructuring
2019Where we were
2021Vision
◆ As a pure port operator
◆ 3 core strategies
2016Base Year
Change2021
Target
Equity throughput 29.5 mn TEU +60% 47.2 mn TEU
Total assets US$6,786.5 mn +50% US$10,179.8 mn
Net profit US$180.9 mn(1) +100% US$361.8 mn
34.6%
54.4%
82.7%
60%50%
100%
Equitythroughput
Total assets Net profit
As of 2019 growth
2021 growth target
◆ No. of subsidiaries increasedto 16 (FY2016: 10)
◆ Industry leader in terms oftotal container throughput
On Track to Achieve Our 5-Year Target
Notes:
(1) Excluding one-off gain from disposal of Florens.(2) Excluding one-off dilution effect on equity interests in QPI of US$22.6M
FY2016 FY2017 FY2018 FY2019
6.5 (3)
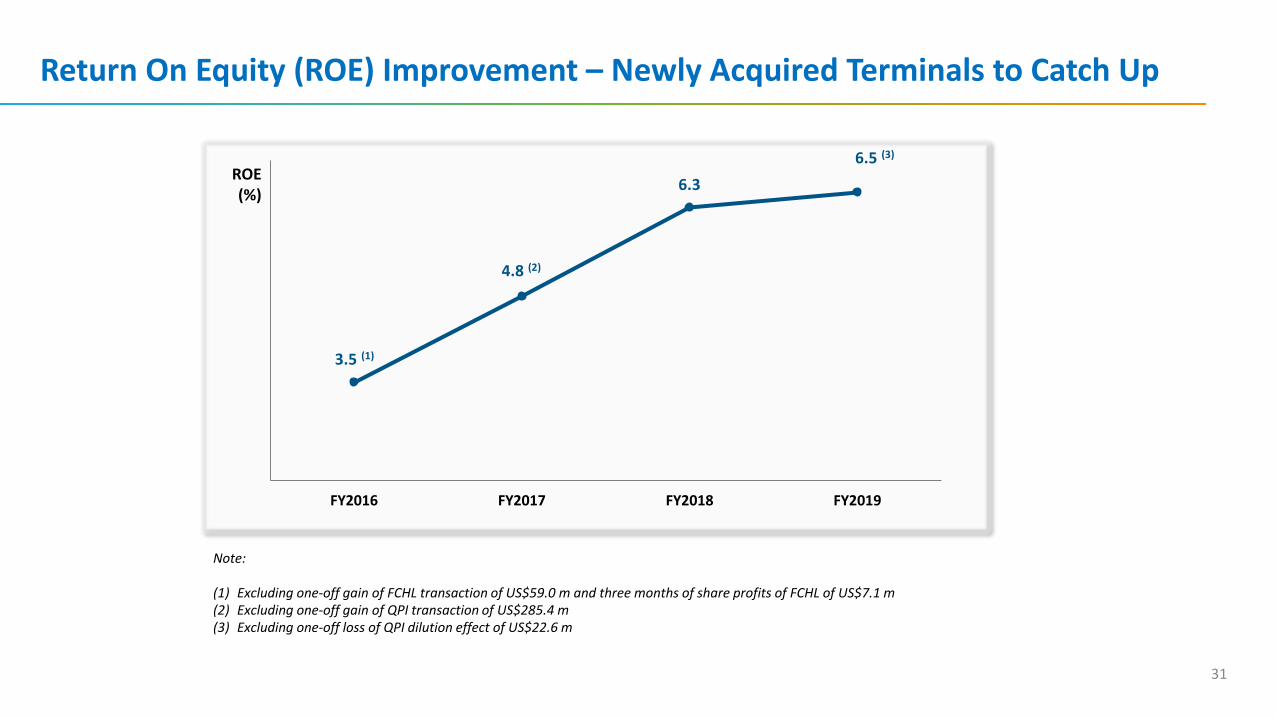
Return On Equity (ROE) Improvement – Newly Acquired Terminals to Catch Up
ROE(%)
3.5 (1)
4.8 (2)
6.3
Note:
(1) Excluding one-off gain of FCHL transaction of US$59.0 m and three months of share profits of FCHL of US$7.1 m(2) Excluding one-off gain of QPI transaction of US$285.4 m(3) Excluding one-off loss of QPI dilution effect of US$22.6 m
31
Notes:
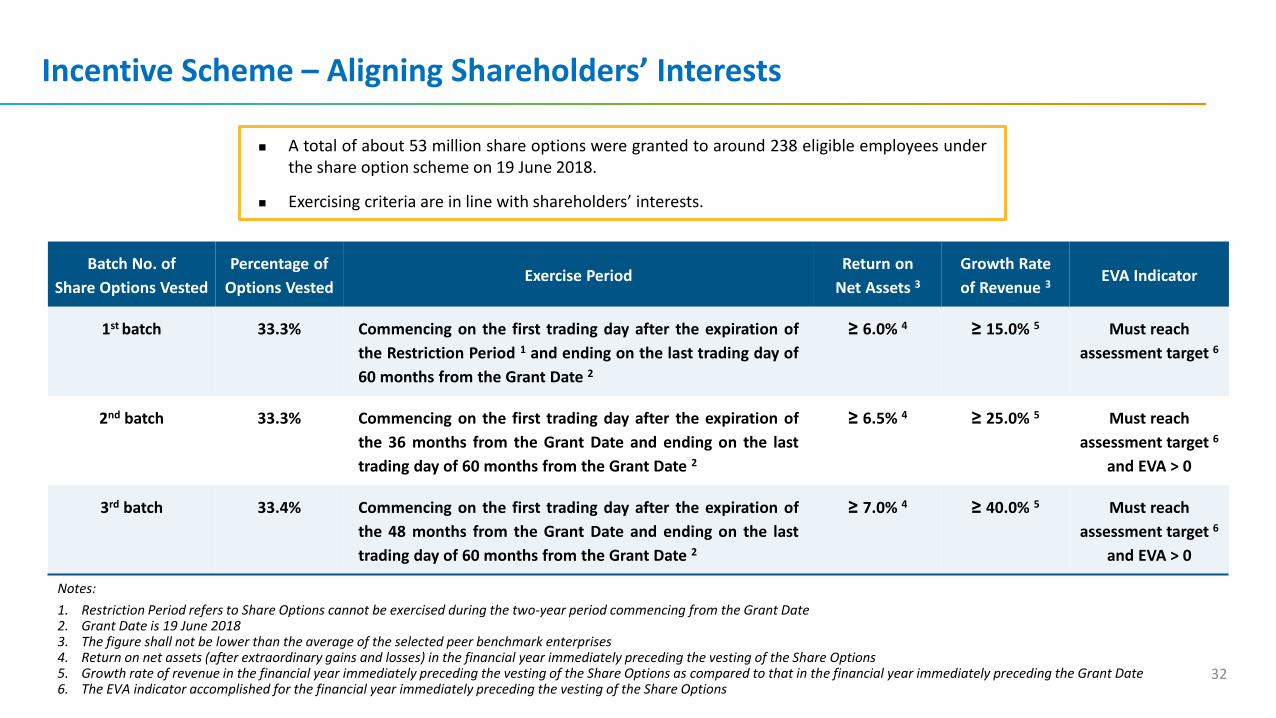
1. Restriction Period refers to Share Options cannot be exercised during the two-year period commencing from the Grant Date 2. Grant Date is 19 June 20183. The figure shall not be lower than the average of the selected peer benchmark enterprises4. Return on net assets (after extraordinary gains and losses) in the financial year immediately preceding the vesting of the Share Options5. Growth rate of revenue in the financial year immediately preceding the vesting of the Share Options as compared to that in the financial year immediately preceding the Grant Date6. The EVA indicator accomplished for the financial year immediately preceding the vesting of the Share Options
Incentive Scheme – Aligning Shareholders’ Interests
◼ A total of about 53 million share options were granted to around 238 eligible employees underthe share option scheme on 19 June 2018.
◼ Exercising criteria are in line with shareholders’ interests.
Batch No. of
Share Options Vested
Percentage of
Options VestedExercise Period
Return on
Net Assets 3Growth Rate
of Revenue 3EVA Indicator
1st batch 33.3% Commencing on the first trading day after the expiration of
the Restriction Period 1 and ending on the last trading day of
60 months from the Grant Date 2
≥ 6.0% 4 ≥ 15.0% 5 Must reach
assessment target 6
2nd batch 33.3% Commencing on the first trading day after the expiration of
the 36 months from the Grant Date and ending on the last
trading day of 60 months from the Grant Date 2
≥ 6.5% 4 ≥ 25.0% 5 Must reach
assessment target 6
and EVA > 0
3rd batch 33.4% Commencing on the first trading day after the expiration of
the 48 months from the Grant Date and ending on the last
trading day of 60 months from the Grant Date 2
≥ 7.0% 4 ≥ 40.0% 5 Must reach
assessment target 6
and EVA > 0
32
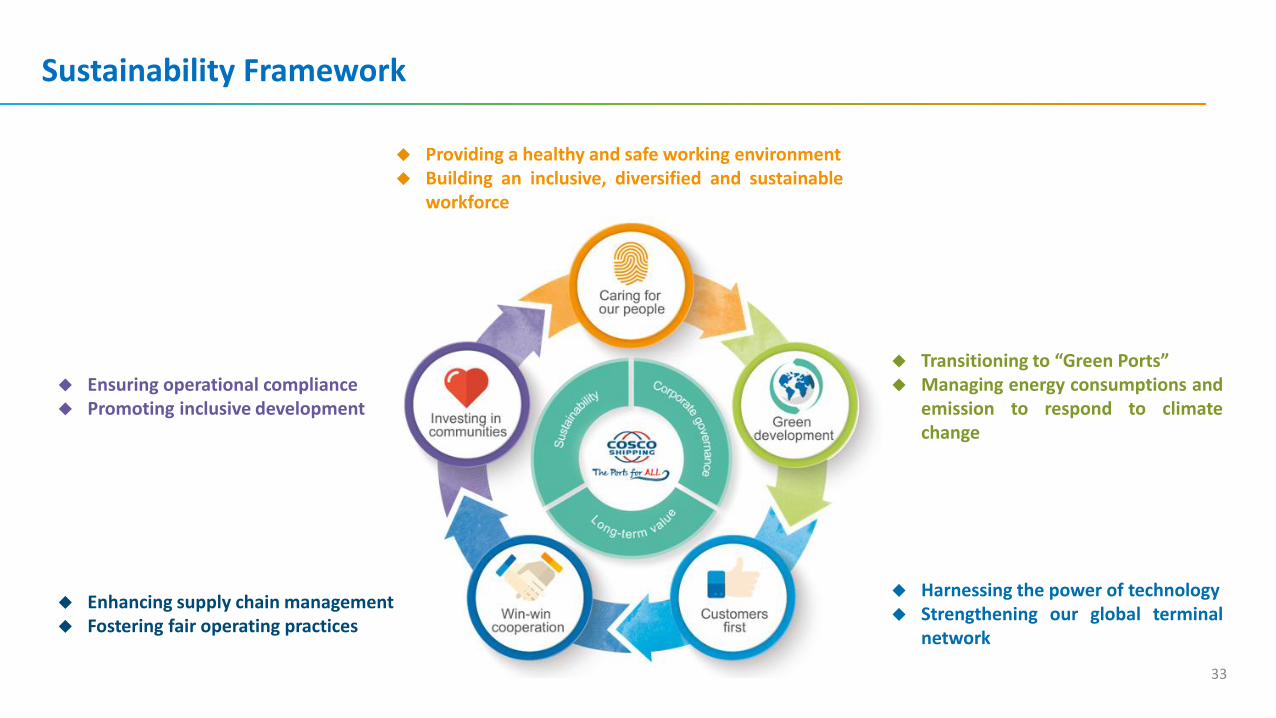
Sustainability Framework
33
◆ Enhancing supply chain management◆ Fostering fair operating practices
◆ Providing a healthy and safe working environment◆ Building an inclusive, diversified and sustainable
workforce
◆ Transitioning to “Green Ports”◆ Managing energy consumptions and
emission to respond to climatechange
◆ Harnessing the power of technology◆ Strengthening our global terminal
network
◆ Ensuring operational compliance◆ Promoting inclusive development
Aligning Global Principles
34
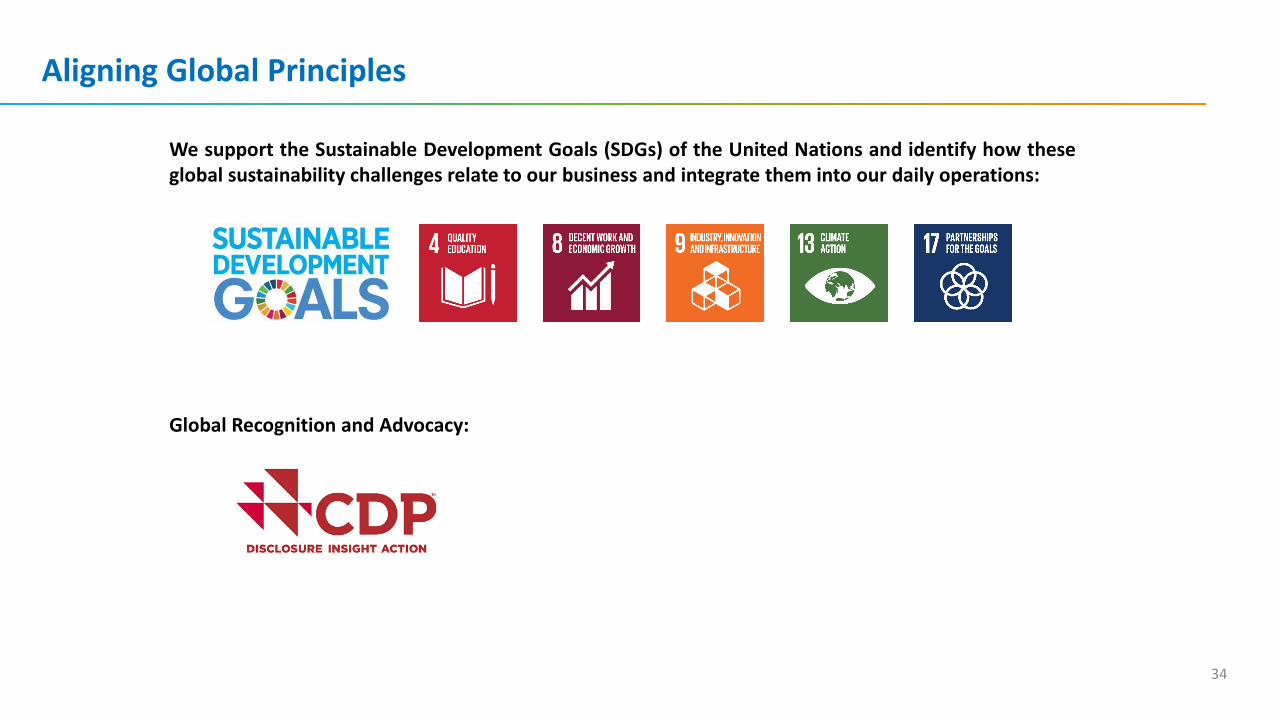
We support the Sustainable Development Goals (SDGs) of the United Nations and identify how theseglobal sustainability challenges relate to our business and integrate them into our daily operations:
Global Recognition and Advocacy:
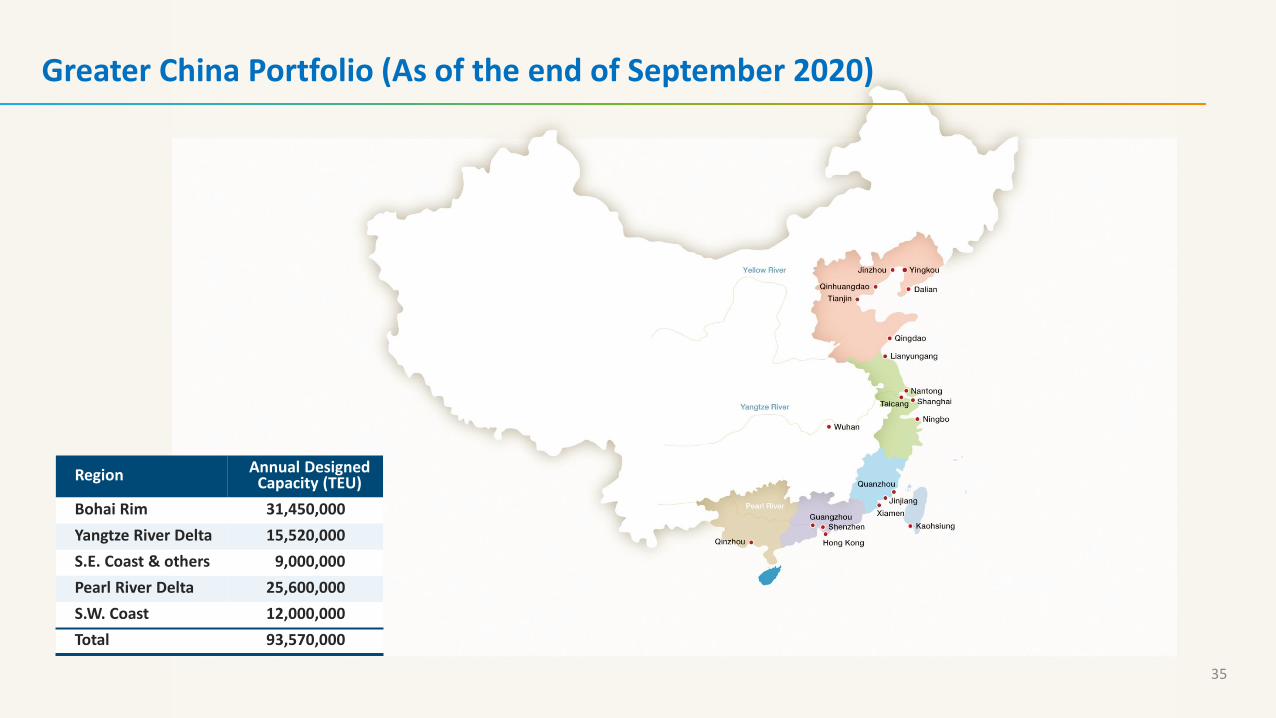
Greater China Portfolio (As of the end of September 2020)
35
Region Annual Designed Capacity (TEU)
Bohai Rim 31,450,000
Yangtze River Delta 15,520,000
S.E. Coast & others 9,000,000
Pearl River Delta 25,600,000
S.W. Coast 12,000,000
Total 93,570,000
This presentation contains certain forward-looking statements with respect to the financial condition, results of operations and business of
COSCO SHIPPING Ports Limited (“COSCO SHIPPING Ports”) and certain plans and prospects of the management of COSCO SHIPPING Ports.
Such forward-looking statements involve known and unknown risks, uncertainties and other factors which may cause the actual result or
performance of COSCO SHIPPING Ports to be materially different from any future results or performance expressed or implied by such forward
looking statements. Such forward- looking statements are based on numerous assumptions regarding COSCO SHIPPING Ports’ present and
future business strategies and the political and economic environment in which COSCO SHIPPING Ports will operate in the future.
The representations, analysis and advice made by COSCO SHIPPING Ports in this presentation shall not be construed as recommendations for
buying or selling shares of COSCO SHIPPING Ports. COSCO SHIPPING Ports shall not be responsible for any action or non-action made according
to the contents of this presentation.
Disclaimer
36
Thank you!
Related Documents