1 Earnings Release | Conference Call – 3Q14 November 14 th , 2014

Welcome message from author
This document is posted to help you gain knowledge. Please leave a comment to let me know what you think about it! Share it to your friends and learn new things together.
Transcript

1
Earnings Release | Conference Call – 3Q14
November 14th, 2014

2
Agenda
Ricardo Ribeiro
Vice President
Carlos Wollenweber
IR Officer
Operational Highlights
Financial Highlights

3
Highlights
Cash flow generation attained a record amount of R$ 113 million in 3Q14, reaching R$ 204 million in 9M14 and R$ 250 million in the accumulated for the last 12 months
Increase of 47% in services revenue (MCMV Level 1), totaling R$ 878 million in 9M14 which accounted for 65% of total revenue recognized during the period
In 3Q14, mortgage transfers in the development segment totaled R$ 167 million, representing a growth of 25% in comparison to the previous quarter
By the end of 3Q14, the company's leverage ratio (net debt over equity) decreased to 11.4%, one of the lowest among peers listed on the BM&F Bovespa
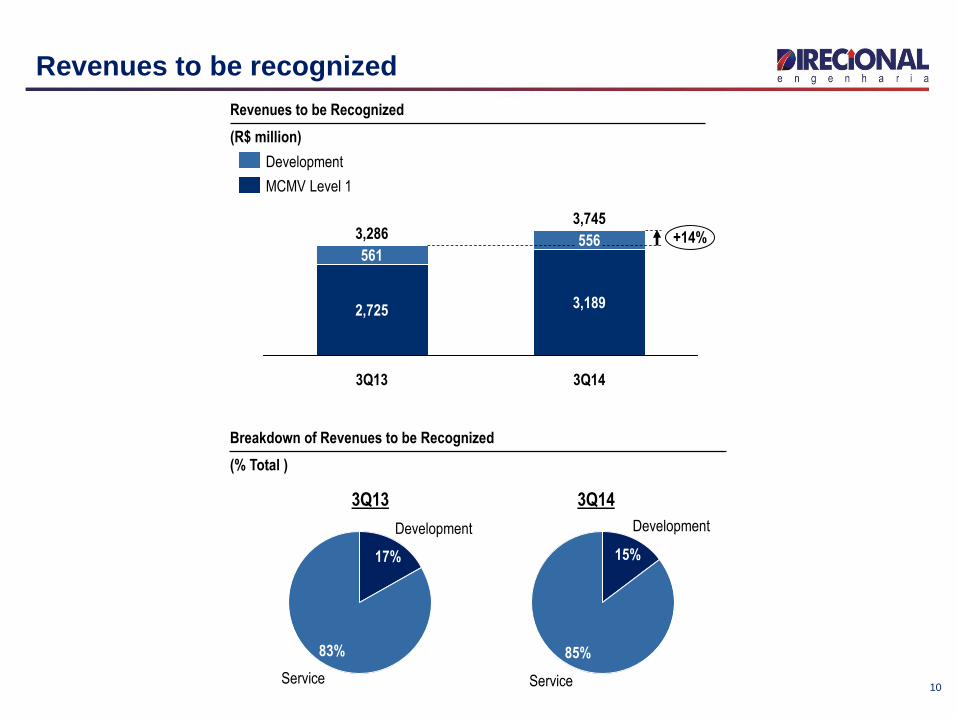
At the end of 3Q14, sales revenue to be recognized totaled R$ 3.7 billion, accounting for approximately 24 months of revenue
Payment of interim dividends amounting to R $ 36.3 million, equivalent to 25% of net income in 9M14, under the dividend policy approved by the Board of Directors on March 17, 2014

4
Launches
Launches
(PSV - R$ million)
72231
1,004
1,306
+32%
-21%
9M14
303
9M13
1,646
1,311
335
3Q14
304
232
2Q14 3Q13
780
504
276
MCMV Level 1
Development
PSV launched in 3Q14 totaled R$ 304 million, attaining R$ 1.3 billion in 9M14 The Company launched three projects under the MCMV Level 1 in 3Q14, totaling a PSV of R$ 232 million 77% of the launches were related to MCMV level 1 projects
7%
8%
5%
Upper-Middle
Medium
Low-Income
RET1 3%
MCMV Level 1 77%
Launches by Economic Segment – 9M14
(% PSV)

5
Contracted Net Sales
Contracted Net Sales
(PSV - R$ million)
63126
+134%
-24%
9M14
1,304
1,004
300
9M13
1,715
1,311
404
3Q14
296
232
2Q14 3Q13
642
504
138
MCMV Level 1
Development
Net sales reached R$ 296 in 3Q14, attaining R$ 1.3 billion in 9M14 Net Sales were equivalent to the volume of launches in 9M14 VSO reached 63% in 9M14
9%
6%
Commercial
1% Upper-Middle
Medium
Low-Income 4%
RET1 3%
MCMV Level 1 77%
Sales by Economic Segment - 9M14
(% PSV)

6
Inventory
Inventory Track Record
(R$ million)
Finished Units
23%
<2012
24%
2012 23%
2013
7% 2014
23% 46%
Midwest 14%
North 40%
Southeast
Inventory by Region
(% PSV)
Inventory by Launch Period
(% PSV)
813 +12.1%
6%
3Q14
630
183
2Q14
765
596
169
4Q13
725
571
154
Under Construction
Finished Units
By the end of 3Q14, total inventory summed up R$ 813 million 46% of the inventory is located in the Southeast region

7
Deliveries
Commercial 13%
MCMV Level 1
53%
Medium
21% Low-Income
13% Upper-Middle 1%
Deliveries by Region and Economic Segment
(Over the past 12 months: % PSV)
Northeast 5%
Midwest
11%
North
47%
Southeast
37%
3Q14
LTM
1,526
721
805
2Q14
LTM
1,806
1,046
760
1Q14
LTM
1,676
1,001
674
4Q13
LTM
1,237
839
398
3Q13
LTM
1,020
905
115
2Q13
LTM
1,029
713
316
Deliveries – Track Record
(Over the past 12 months: R$ million)
Development
MCMV Level 1
Deliveries
(VGV-R$ million) +40%
9M14
1,014
568
447
9M13
726
686
40
3Q14
224
155 69
2Q14
189
87 102
3Q13
502
479
23
MCMV Level 1
Development
In 9M14, the Company delivered PSV of R$ 1.0 billion, representing a growth of 40% in relation to 9M13
Deliveries in the last 12 months (LTM) totaled R$ 1.5 billion. MCMV Level 1 projects represented 53% of PSV delivered during the period
8
Carlos Wollenweber
IR Officer
Financial Highlights

9
Results
1. Adjustment excluding interest on financing for construction;
+5%
+2%
0%
9M14
1,337
878
459
9M13
1,335
598
737
3Q14
474
354
120
2Q14
454
274
179
3Q13
464
206
258
Gross Operating Revenue
(R$ million)
Revenues from Services
Revenues from Real Estate Sales
878
598
354274
206 +29%
+72%
+47%
9M14 9M13 3Q14 2Q14 3Q13
Gross Revenue from Services
(R$ million)
459
737
120179
258
-53%
-33%
-38%
9M14 9M13 3Q14 2Q14 3Q13
Gross Revenue from Real Estate Sales
(R$ million)
Adjusted¹ Gross Profit and Gross Margin
(R$ million)
26,4%26,4%26,4%26,6%27,0%
-1%
+1%
9M14
33
307
340
+9%
9M13
344
305
39
3Q14
123
112
11
2Q14
113
103 11
3Q13
122
111
11
Adjusted Gross Margin¹ Interest capitalized in costs Gross Profit
Growth in service segment and maintenance of gross margins
10
Revenues to be recognized
Service
85%
Development
15%
Service
83%
Development
17%
Breakdown of Revenues to be Recognized
(% Total )
3Q14 3Q13
+14%
3Q14
3,745
3,189
556
3Q13
3,286
2,725
561
MCMV Level 1
Development
Revenues to be Recognized
(R$ million)

11
Cancellations Resale
Cancellations and Cancellation Resale
(Units)
461 479 490613 632 617
79%77%81%
90%93%
64%
61%52%
71%73% 75%
3Q14
396
2Q14
500
1Q14
474
4Q13
399
3Q13
433
2Q13
430
Resale in the Period
% Resale (until 3Q14)
Resale (until 3Q14)
Cancellations
64% of the cancelled sales in the 3Q14 have already been resold in the same period. 74% of the cancelled sales in the 9M14 have already been resold in the same period. Total sales cancellations in 3Q14, net of resold units during the quarter, amounted to R$ 25 million
1,370
74%
9M14
1,862

12
1. Adjustment excluding interest expenses on construction financing
Results 3Q14
INCOME STATEMENT - (R$ Million) 3Q14 2Q14 D %
Net Operating revenue 462 425 9%
Adjusted Gross Profit¹ 123 113 9%
Adjusted Gross Margin¹ 27% 27% 0 p.p.
G&A² -28 -26 8%
%Net Revenue -6.0% -6.1% 0.0 p.p.
Selling expenses -14 -14 -3%
%Net Revenue -3.0% -3.4% -0.4 p.p.
Financial Result 3.5 1.9 81%
Other operating income and expenses -7.6 -2.2 240%
Equity pick-up 0.7 1.3 -41%
Tax -5.3 -5.8 -10%
Net income for the period before Minority Interest 62 58 7%
Net Margin before Minority Interest 13.3% 13.6% -0.2 p.p.
Non-controlling interest in SPEs and SCPs -9.3 -11.0 -16%
Net Income 52 47 12%
Net Margin 11.3% 11.0% 0.3 p.p.

13
Cash Flow Generation
Cash Flow Generation (Cash Burn) ¹
(R$ million)
Capital Structure
(R$ million)
394
Net Debt
24% 18% 11%
Net Debt/Equity
314 201
CRI
13%
Working Capital
1%
SFH 60%
FINAME and Leasing
5%
Debentures 21%
Loans and Financing
(% of Debt)
9M14
204
2013
76
2012
-183
2011
-176
2010
-283
3Q14
718
919
2Q14
643
956
3Q13
519
913 Cash
Debt
3Q14
LTM
250
2Q14
LTM
205
1Q14
LTM
189
4Q13
LTM
76
3Q13
LTM
26
2Q13
LTM
-88
1Q13
LTM
-138
4Q12
LTM
-183
3Q12
LTM
-206
Cash Flow Generation (Cash Burn)¹ - Track Record
(Over the past 12 months : R$ million)
1. Cash flow generation: net debt variation net of dividends and share buyback programs .

Dividends R$ Millions
Net Profit for the year (09/30/2014) 145.1
(x) % Distribution of Net Income 25%
(=) Proposed Dividend 36.3
14 14
Dividends
1 - Cash flow generation: net debt variation net of dividends and share buyback programs .
The Board of Directors approved on November 13th 2014, under the dividend policy, the payment of interim dividends of R$ 36.3 million.
Dividends Policy
The amount to be paid to shareholders will be 40% of Cash Flow Generation¹ of the period.
The amount to be distributed may not exceed 50% of net income for the period, neither be
lower than 25%.
This policy is contingent to the attainment of the leverage ratio: net debt to equity must be
lower than 30%.
Frequency of Payments: dividends will be paid 2 times per year. An anticipation will be paid
after the publication of the third quarter results.

15
Disclosure and Contacts
This presentation contains certain forward-looking statements concerning the business prospects, projections of
operating and financial results and growth potential of the Company, which are based on management’s current
expectations and estimates of the future performance of the Company. Although the Company believes such
forward-looking statements are based on reasonable assumptions, it can give no assurance that its expectations
will be achieved. Expectations and estimates that are based on the future prospects of the Company are highly
dependent upon market behavior, Brazil’s political and economic situation, existing and future regulations of the
industry and international markets and, therefore, are subject to changes outside the Company’s and
management’s control. The Company undertakes no obligation to update any information contained herein or to
revise any forward-looking statement as a result of new information, future events or other information.
www.direcional.com.b/ir
(55 31) 3214-6200
(55 31) 3214-6450
Carlos Wollenweber
CFO | IR Officer
Paulo Sousa
IR Coordinator
Luiz Felipe Almeida
IR Analist
Related Documents