NYSE: QEP 3Q 2015 OPERATIONS UPDATE OCTOBER 28, 2015

Welcome message from author
This document is posted to help you gain knowledge. Please leave a comment to let me know what you think about it! Share it to your friends and learn new things together.
Transcript

NYSE: QEP
3Q 2015 OPERATIONS UPDATE OCTOBER 28, 2015

2
FORWARD-LOOKING STATEMENTS & NON-GAAP FINANCIAL MEASURES
This presentation includes forward‐looking statements within the meaning of Section 27A of the Securities Act of 1933, as amended, and Section 21E of the Securities Exchange Act of 1934, as amended. Forward‐looking statements can be identified by words such as “anticipates”, “believes”, “forecasts”, “plans”, “estimates”, “expects”, “should”, “will”, or other similar expressions. Such statements are based on management’s current expectations, estimates and projections, which are subject to a wide range of uncertainties and business risks. These statements are not guarantees of future performance. These forward‐looking statements include statements regarding: forecasted oil production and compounded annual growth rate; forecasted amount and allocation of 2015 capital expenditures; reduction of well costs; potential for shallower and deeper zones and horizontal development in the Uinta Basin; potential locations for wells and development plans; and estimated reserves.
Actual results may differ materially from those included in the forward‐looking statements due to a number of factors, including, but not limited to: the availability and cost of capital; changes in local, regional, national and global demand for natural gas, oil and NGL; natural gas, NGL and oil prices; effect of existing and future laws and government regulations, including regulations on the flaring of natural gas, the use of hydraulic fracture stimulation and the implementation of the Dodd‐Frank Act; elimination of federal income tax deductions for oil and gas exploration and development; drilling results; shortages of oilfield equipment, services and personnel; operating risks such as unexpected drilling conditions; weather conditions; changes in maintenance and construction costs and possible inflationary pressures; permitting delays; estimates of contingency losses and outcome of pending litigation and other proceedings; actions taken by third‐party operators, processors and transporters; demand for oil and natural gas storage and transportation services; competition from the same and alternative sources of energy; natural disasters; large customer defaults; operating in ethane recovery or rejection mode; and the other risks discussed in the Company’s periodic filings with the Securities and Exchange Commission (SEC), including the Risk Factors sections of QEP’s Annual Report on Form 10‐K/A for the year ended December 31, 2014 (the “2014 Form 10‐K/A”) and Quarterly Report on Form 10‐Q for the quarter ended September 30, 2015. QEP undertakes no obligation to publicly correct or update the forward‐looking statements in this news release, in other documents, or on its website to reflect future events or circumstances. All such statements are expressly qualified by this cautionary statement.
The SEC requires oil and gas companies, in their filings with the SEC, to disclose proved reserves that a company has demonstrated by actual production or through reliable technology to be economically and legally producible at specific prices and existing economic and operating conditions. The SEC permits optional disclosure of probable and possible reserves calculated in accordance with SEC guidelines; however, QEP has made no such disclosures in its filings with the SEC. QEP also uses the term “EUR” or “estimated ultimate recovery,” and “estimated original oil in place”, and SEC guidelines strictly prohibit QEP from including such estimates in its SEC filings. EUR and estimated original oil in place, as well as estimates of probable reserves, are by their nature more speculative than estimates of proved reserves and, accordingly, are subject to substantially more risks of actually being realized. Actual quantities that may be ultimately recovered from QEP’s interests may differ substantially from the estimates contained in this presentation. Investors are urged to consider carefully the disclosures and risk factors in the 2014 Form 10‐K/A and other reports on file with the SEC
QEP refers to Adjusted EBITDA and other non‐GAAP financial measures that management believes are good tools to assess QEP’s operating results. For definitions of these terms and reconciliations to the most directly comparable GAAP measures, see the recent earnings press releases and SEC filings at the Company’s website at www.qepres.com under “Investor Relations.”

3
ASSET OVERVIEW
WY
CO UT
ND
OK
TX LA
Williston Basin Pinedale Anticline
Uinta Basin
Permian Basin
Haynesville
Liquids‐rich plays Dry‐gas play
Oil plays
59%
5%
36%
QEP Energy 3Q 2015 Production Revenues
Oil NGL Natural Gas
26%
15% 59%
QEP Resources 2014YE Proved Reserves
Oil NGL Natural Gas
AS OF AND FOR THE YEAR ENDED 12/31/14
Total production 323 Bcfe
% crude oil production 32%
Total reserves 3,932 Bcfe
Total net acreage 1,380,000

4
QEP RESOURCES CAPITAL ALLOCATION (1)
$0
$200
$400
$600
$800
$1,000
$1,200
$1,400
$1,600
$1,800
$2,000
2013 2014 2015E
$ m
illio
n
Corporate
Exploratory drilling
Williston Basin
Uinta Basin
Pinedale Anticline
Permian Basin
Midcontinent/SCOOP
Haynesville
(3)
6% 23%
6%
17%
57%
8%
18%
14%
(1) Excludes discontinued operations (2) Excludes the $942 million Permian property acquisition (3) As of October 28, 2015
(2)
50%
8%
16%
22%
48%

5
EXECUTING ON TRANSITION TO OIL
3.0 3.7
6.3
10.2
17.1
19.4
‐
5
10
15
20
25
2010 2011 2012 2013 2014 2015E
Oil
prod
uctio
n (M
MBb
l)
(1) 2015E represents midpoint of guidance as of October 28, 2015
6
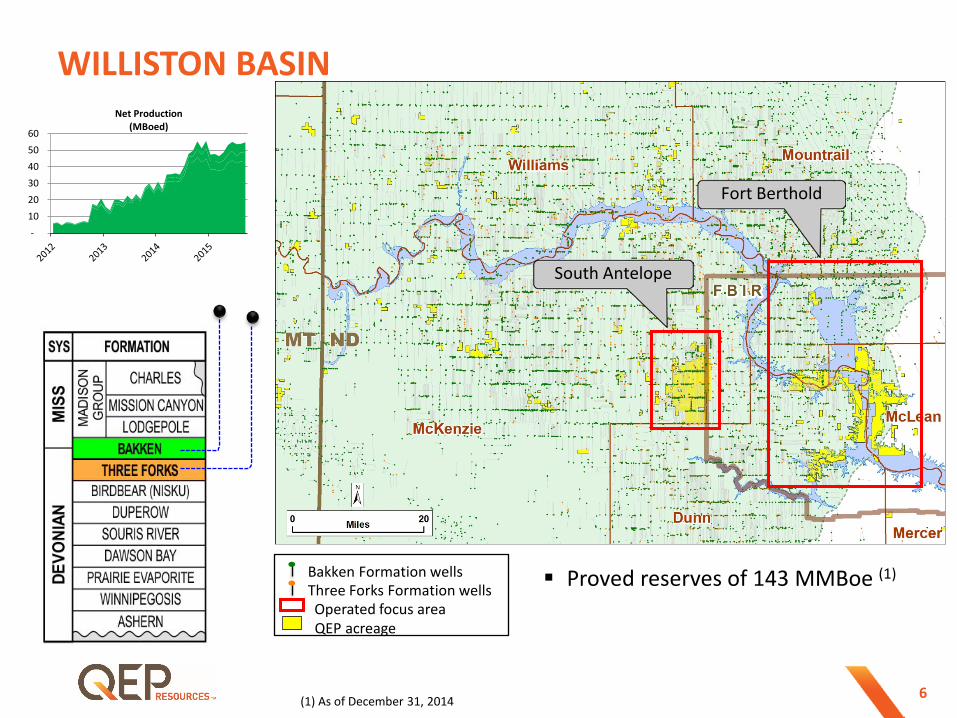
WILLISTON BASIN
Fort Berthold
South Antelope
Bakken Formation wells Three Forks Formation wells Operated focus area QEP acreage
Proved reserves of 143 MMBoe (1)
(1) As of December 31, 2014
‐ 10 20 30 40 50 60
Net Production (MBoed)

7
WILLISTON BASIN – SOUTH ANTELOPE
Bakken wells Three Forks wells
QEP Q3 Completions (24 wells)
QEP Drilling (1)
QEP Waiting on Completion (WOC, 19 wells) (1)
QEP acreage
(1) As of September 30, 2015
Net acres: 27,858 Remaining locations: >400 Gross well cost: $6.2 MM (drill &
complete) ‒ 10,000‐ft laterals (avg.) Additional gross costs: $1.1 MM per
well (facilities and artificial lift)
Q3 Completions 3‐well pad
(2 Bakken / 1 Three Forks)
Q3 Completions 6‐well pad
(3 Bakken / 2 Three Forks)
Q3 Completions 2‐well pad (1 Bakken /
1 Three Forks 2nd Bench)
Q3 Completions 6‐well pad
(1 Bakken / 4 Three Forks)
Q3 Completions 4‐well pad
(2 Bakken / 2 Three Forks) Q3 Completions
5‐well pad (3 Bakken / 1 Three Forks
/ 1 Three Forks 2nd Bench)
8
WILLISTON BASIN – HIGH-DENSITY INFILL PILOTS
High-density infill pilot wells showing strong results – At 180 days, wells significantly outperforming original completion design (30
stages, 3 MM lbs. of proppant) on original spacing (eight wells/unit, four Bakken, four Three Forks)
– Testing 400‐ and 600‐foot well spacing – Potential for over 400 locations on South Antelope for Middle Bakken and
Three Forks formations
Testing lower benches of the Three Forks – Producing four 2nd bench Three Forks wells with outstanding results
• First well produced 208 MBoe in 180 days – Two additional 2nd Bench Three Forks wells are currently on flowback
• Three additional 2nd Bench Three Forks wells are waiting on completion – Four additional 2nd Bench Three Forks wells are being drilled in 2015 – Third Bench
• First 3rd Bench Three Forks well is completed, waiting on flowback • One additional 3rd Bench Three Forks well planned in 2015

9
Parent Wells
Producing
Testing / WOC
Bakken Formation wells
Three Forks 1st Bench
Three Forks 2nd Bench
Three Forks 3rd Bench
QEP acreage
WILLISTON BASIN HIGH – DENSITY INFILL PILOTS

10
WILLISTON BASIN – HIGH-DENSITY RESULTS
0
20
40
60
80
100
0
20,000
40,000
60,000
80,000
100,000
120,000
140,000
160,000
180,000
200,000
‐ 30 60 90 120 150 180
Wel
l Cou
nt
Cum
ulat
ive
Oil
Equi
vale
nt -B
oe
Days
Original Completion ‐ 30‐35 Stgs; 3‐4 MMlbs (60 wells)
High Proppant Volume Completions: 48‐51 Stgs; 9.5‐10 MMlbs (32 wells)
High Density Infill Test: 48‐51 Stgs; 9.5‐10 MMlbs (5 wells)
Original well count
High-proppant volume well count
High-density infill well count
11
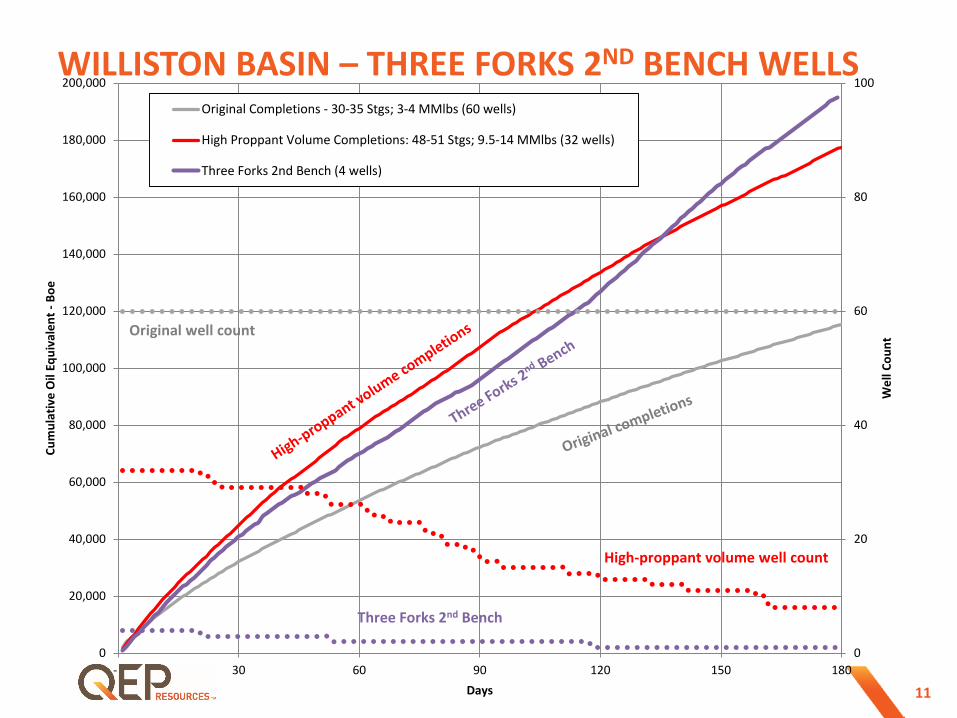
0
20
40
60
80
100
0
20,000
40,000
60,000
80,000
100,000
120,000
140,000
160,000
180,000
200,000
‐ 30 60 90 120 150 180
Wel
l Cou
nt
Cum
ulat
ive
Oil
Equi
vale
nt -
Boe
Days
Original Completions ‐ 30‐35 Stgs; 3‐4 MMlbs (60 wells)
High Proppant Volume Completions: 48‐51 Stgs; 9.5‐14 MMlbs (32 wells)
Three Forks 2nd Bench (4 wells)
Original well count
High-proppant volume well count
Three Forks 2nd Bench
WILLISTON BASIN – THREE FORKS 2ND BENCH WELLS

12
WILLISTON BASIN – FORT BERTHOLD
Bakken wells Three Forks wells
QEP acreage
Net acres: 67,289 Gross well cost: $6.7 MM
(drill & complete) ‒ 10,000‐ft laterals (avg.) Additional gross costs: $1.1MM per
well (facilities and artificial lift)

13
PERMIAN BASIN
Net acres: 26,073 Proved reserves: 63 MMBoe (1)
35 horizontal and 337 vertical operated producing wells(2)
7 horizontal wells completed in Q3 2015
‒ 7,323-ft. average lateral length
(1) As of December 31, 2014 (2) As of September 30, 2015
‐ 2 4 6 8
10 12 14 16
QEP Net Production (MBoed)
Existing vertical PDP well Q3 2015 horizontal completion QEP horizontal rig QEP acreage Leonard Shale Middle Spraberry Spraberry Shale Well in Progress
Andrews Martin
14
PERMIAN BASIN OPERATIONAL UPDATE Completion optimization program
– Zipper fracs reduce completion time – Continue to enhance completion design
Completed seven QEP operated wells in 3Q 2015 – Spraberry Shale: University 7‐1726 H1 SS (1,523 Boed 24‐hr peak rate) – Remaining six wells cleaning up – Completed first Leonard Shale horizontal well
Well costs continue to trend lower – Zipper fracs lowering completion costs – Spraberry current gross well cost: $6.2 MM (drill & complete) – Additional gross costs: $0.8 MM per well (facilities and artificial lift)
15
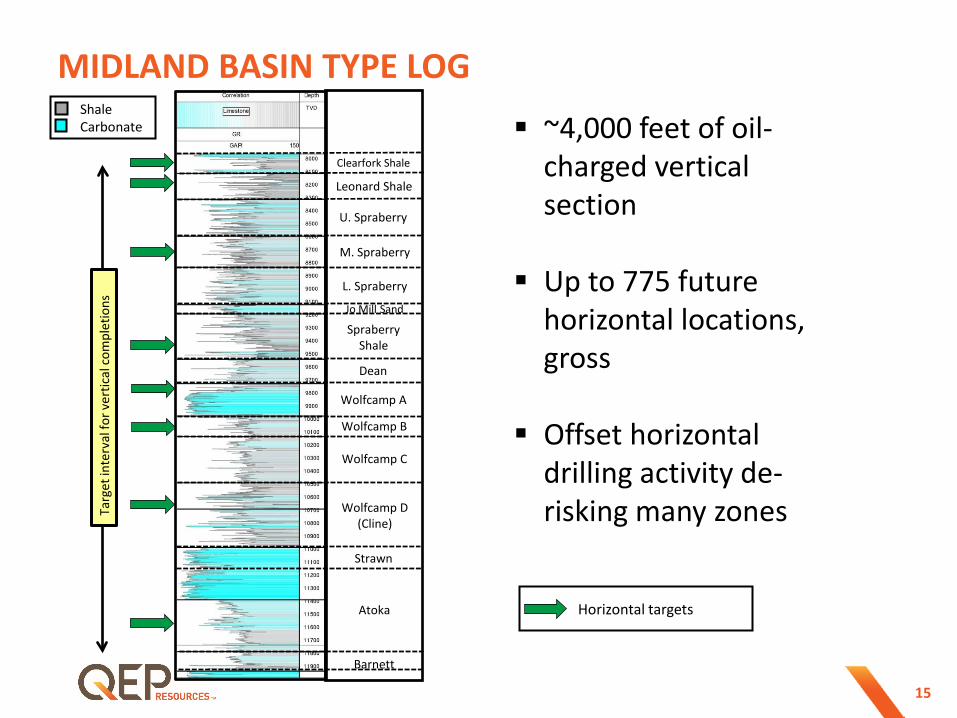
~4,000 feet of oil‐charged vertical section
Up to 775 future horizontal locations, gross
Offset horizontal
drilling activity de‐risking many zones
MIDLAND BASIN TYPE LOG
Horizontal targets
Shale Carbonate
Targ
et in
terv
al fo
r ver
tical
com
plet
ions
U. Spraberry
M. Spraberry
L. Spraberry
Spraberry Shale
Dean
Wolfcamp A
Wolfcamp B
Wolfcamp C
Wolfcamp D (Cline)
Strawn
Atoka
Barnett
Jo Mill Sand
Leonard Shale
Clearfork Shale

16
GREEN RIVER BASIN – PINEDALE ANTICLINE
Net acres: 12,673 Proved reserves: 1.45 Tcfe (1)
3Q 2015 completions: 28 wells Gross well cost: $3.2 MM Additional gross costs: $0.2 MM per well
(facilities and plunger lift)
QEP Producing Well Other operators (No QEP interest)
QEP Drilling (2)
QEP acreage
Pinedale Field
(1) As of December 31, 2014 (2) As of September 30, 2015
17
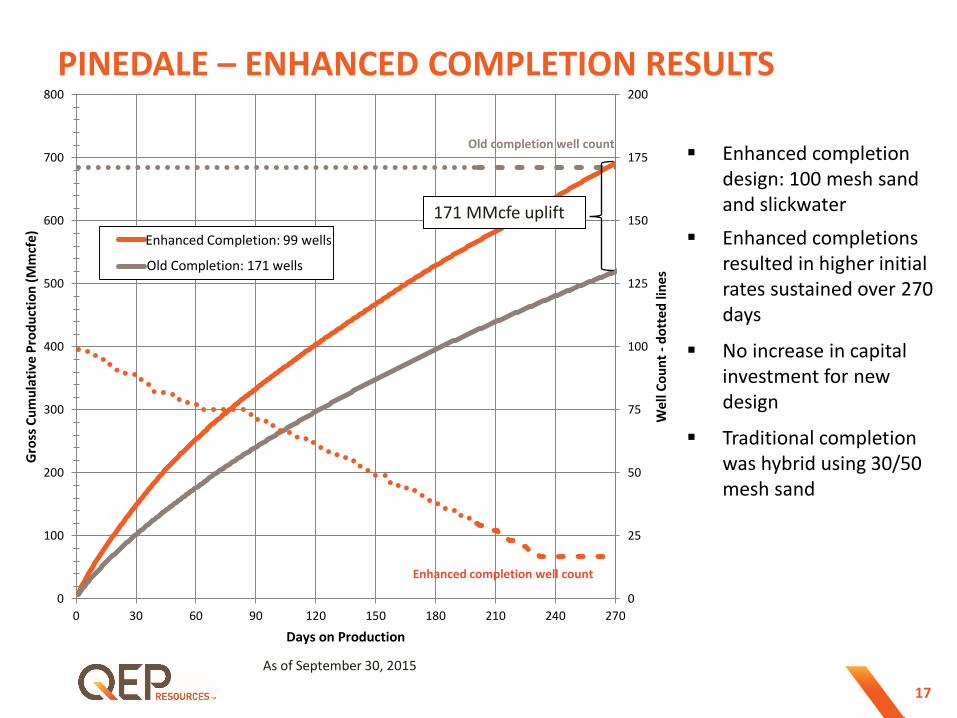
PINEDALE – ENHANCED COMPLETION RESULTS
Enhanced completion design: 100 mesh sand and slickwater
Enhanced completions resulted in higher initial rates sustained over 270 days
No increase in capital investment for new design
Traditional completion was hybrid using 30/50 mesh sand
0
25
50
75
100
125
150
175
200
0
100
200
300
400
500
600
700
800
0 30 60 90 120 150 180 210 240 270
Wel
l Cou
nt -
dott
ed li
nes
Gro
ss C
umul
ativ
e Pr
oduc
tion
(Mm
cfe)
Days on Production
New Completion: 99 wells
Old Completion: 171 wells
171 MMcfe uplift
Enhanced completion well count
As of September 30, 2015
Old completion well count
Enhanced Completion: 99 wells

18
(1) As of December 31, 2014 total Uinta Basin (2) As of September 30, 2015
UINTA BASIN – RED WASH LOWER MESAVERDE Net acres: Approximately 246,000 in the Uinta Basin ‒ Over 48,000 net acres in the Red Wash Unit (100% WI, 86.5% NRI)
‒ During Q3 2015 QEP closed on asset swap transaction acquiring 15,382 net acres, the South Red Wash, in exchange for ORRI in 640 acres
Proved reserves: 623 Bcfe(1)
Cumulative production of most recent vertical 8‐well pad >2.4 Bcfe in 150 days Additional potential in shallower and deeper zones
Most Recent Horizontal Well
Red Wash Unit
N
Miles 0 2
South Red Wash Unit
Producing Mesaverde wells
Mesaverde horizontal wells
1 Pad drilling, 8 wells(2)
QEP acreage
South Red Wash Unit Acquisition Most Recent 8‐Well Pad

19
UINTA BASIN HORIZONTAL TARGETS
Shale Sandstone
Braided Vertical testing shows potential for two horizontal targets in the western part of the Red Wash Unit Upper Neslen An estimated 60% of vertical Mesaverde production comes from the Neslen interval. The upper Neslen interval could potentially be developed horizontally Lower Neslen Current horizontal target Blackhawk When commingled with Mesaverde, the Blackhawk represents an estimated 30% of total production from vertical wells and could also be developed horizontally
Uinta Basin Type Log
2,35
0’ ‐
Gas
Sat
urat
ed S
ands
tone
s & S
iltst
ones
Braided
Upper Neslen
Lower Neslen
Blackhawk
Related Documents