Technical white paper Implementing HP 3PAR V400 and ProLiant BL460c Gen8 with Microsoft Exchange 2010 running on VMware vSphere 5 Table of contents Executive summary 3 Overview 3 Server and virtualization technologies 4 ProLiant BL460c Gen8 architecture 4 ProLiant management technologies 6 HP BladeSystem 7 VMware vSphere 5 8 Storage hardware and feature overview 9 HP 3PAR Storage system architecture 9 HP 3PAR Storage models for Exchange 9 HP 3PAR features 10 HP 3PAR software 12 Sizing the Exchange configuration 14 Exchange VM layout 14 Sizing the mailbox role in a virtualized environment 15 Tested configuration details 23 Network and storage 23 HP 3PAR software and version 24 Exchange VMs 25 Test results 26 Testing virtualized storage 27 Jetstress storage testing 27 LoadGen simulation testing 37 Test results summary 43 Bill of materials 44 Key findings from HP 3PAR Storage testing with VMware in Exchange environments 45 Implementing a proof-of-concept 46

3parV400ProliantGen8Vmware5
Dec 01, 2015
Welcome message from author
This document is posted to help you gain knowledge. Please leave a comment to let me know what you think about it! Share it to your friends and learn new things together.
Transcript
Technical white paper
Implementing HP 3PAR V400 and ProLiant BL460c Gen8 with Microsoft Exchange 2010 running on VMware vSphere 5
Table of contents
Executive summary 3
Overview 3
Server and virtualization technologies 4
ProLiant BL460c Gen8 architecture 4
ProLiant management technologies 6
HP BladeSystem 7
VMware vSphere 5 8
Storage hardware and feature overview 9
HP 3PAR Storage system architecture 9
HP 3PAR Storage models for Exchange 9
HP 3PAR features 10
HP 3PAR software 12
Sizing the Exchange configuration 14
Exchange VM layout 14
Sizing the mailbox role in a virtualized environment 15
Tested configuration details 23
Network and storage 23
HP 3PAR software and version 24
Exchange VMs 25
Test results 26
Testing virtualized storage 27
Jetstress storage testing 27
LoadGen simulation testing 37
Test results summary 43
Bill of materials 44
Key findings from HP 3PAR Storage testing with VMware in Exchange environments 45
Implementing a proof-of-concept 46

Summary 46
For more information 46

3
Executive summary
This Reference Architecture (RA) describes tests performed by HP to demonstrate the benefits and capabilities of the HP ProLiant BL460c Gen8 server blades (BL460c Gen8) and the HP 3PAR P10000 V400 storage (3PAR V400). The solution supports 15,000 mailbox users running Microsoft® Exchange Server 2010 (Exchange 2010) in a virtualized environment using VMware vSphere 5. The RA highlights scalability features of the ProLiant Gen8 servers running multiple Exchange virtual machines (VMs) in a vSphere cluster. The RA also details the advanced HP 3PAR Adaptive Optimization (AO) functionality of the HP 3PAR storage supporting Thin Provisioned (TP) virtual volumes using Nearline (NL) and Fibre Channel (FC) disk storage tiers.
As an IT manager, you face many server and storage design choices when deploying Exchange 2010. Solutions can be deployed using low cost Direct Attached Storage (DAS) or highly available Storage Area Networks (SAN). Exchange 2010 can be deployed either on physical servers or virtualized servers running on a variety of supported hypervisors. These choices no longer come with simple answers. Instead, it depends on which deployment model meets the IT processes and procedures used within your organization.
Exchange 2010 deployments using dedicated servers and fully provisioned storage may be the simplest to deploy initially, but they have higher up-front costs. These deployments typically require a majority of the computing and storage resources to be purchased and installed up front. Often these deployments must factor in headroom for future growth, which can go underutilized for an extended period. Traditional deployments have not been well suited for addressing changes in business requirements, often resulting in mismatched server and storage resources. Traditional deployment models also reduce flexibility, and increase operational costs, while making it more complex to adjust to changing business needs.
From a storage perspective, typical DAS solutions deploy fully provisioned database LUNs, sized for the needs of both the current and planned mailbox users. This approach however, requires a significant amount of initial storage capacity that will likely remain underutilized for an extended time. To improve storage capacity utilization, customers have looked to advanced SAN features like thin provisioning (TP) to allocate storage as needed. TP allows storage administrators to present full disk volumes to the Microsoft Windows® OS, but only allocate capacity on the backend storage as needed. With HP 3PAR thin suite, IT organizations can address capacity over-allocation by eliminating the need to dedicate storage capacity up-front, ensuring that existing storage capacity is highly utilized and maximizes energy efficiency.
The HP 3PAR storage solution detailed in this reference architecture also uses HP 3PAR Adaptive Optimization to create hybrid disk volumes. These hybrid disk volumes combine the high performance of Fibre Channel disks with the high capacity of Nearline disks to handle the storage needs of Exchange 2010. Adaptive Optimization reduces storage costs by meeting stringent performance requirements with fewer high performance disks. Expensive Fibre Channel drives can be used to support performance requirements while economical, widely striped Nearline drives are used to meet capacity requirements.
Target audience: This white paper is intended to assist IT decision makers, storage administrators, Exchange architects and VMware administrators involved in the planning and deployment of virtualized Exchange using HP 3PAR Storage and ProLiant Gen8 servers within a VMware vSphere 5 environment.
This white paper describes testing performed in July 2012.
Disclaimer: The Reference Architecture provided in this document is for reference only since customer configurations will vary due to specific needs. The memory, processor quantities and speed, and IO storage recommendations within this paper are the minimum configurations recommended.
Overview
The reference architecture described in this document provides server and storage sizing details to assist you in designing an Exchange 2010 hardware and software deployment. The solution uses virtualized Exchange servers running on BL460c Gen8 server blades. The BL460c Gen8 is highly scalable supporting up to 16 processor cores and 512GB of system memory and is quite capable of handling the workload demands of several enterprise Exchange mailbox server virtual machines. This RA has been sized with a total of ten Exchange VMs composed of five Exchange mailbox role VMs and five combination Hub Transport (HT) and Client Access Server (CAS) VMs to host 15,000 mailboxes. It supports large mailboxes with the Exchange design scalable to multi-gigabyte mailbox capacities.

4
For the initial deployment and testing, this reference architecture uses HP 3PAR V400 thinly provisioned storage for the Exchange databases and log LUNs. TP reduces initial storage costs by not requiring that all storage capacity be allocated up front. The HP 3PAR Inform Operating System (OS) monitors and manages storage growth allowing you to plan storage expansion, instead of having to purchase and install all the storage capacity during initial deployment.
To meet the initial performance and capacity demands when using thin provisioning, the HP 3PAR V400 was configured with tiered storage and uses HP 3PAR Adaptive Optimization (AO) software. AO provides policy driven service level optimization for different storage tiers. AO combines the performance of faster disk types such as FC and Solid State Disks (SSD) with the higher capacity of the slower NL disks. AO analyzes performance for sub-volume regions, and then selects the most active regions and moves them to faster storage tiers. Using AO the Windows OS sees a single volume but at the HP 3PAR storage controller level, a portion of FC disk blocks and a portion of NL disk blocks make up the virtual volume. The AO analysis process allows for a more cost effective distribution of data across storage tiers.
Server and virtualization technologies
IT organizations seeking to increase operational efficiency of their data center look to virtualization to help consolidate server workloads. Virtualization provides many benefits to your data center operations. Systems can be clustered together allowing additional High Availability (HA) and management options to be combined with existing HA options within Exchange 2010. With the release of Exchange 2010 SP1, Exchange now supports combining both Exchange Database Availability Groups (DAG) and hypervisor based HA features. Combining HA features allows for a rich set of tools to manage Exchange servers running as virtual machines. Hypervisor based HA tools such as VMware vSphere failover clustering and vMotion allow for added levels of protection from physical server failure. In planned service events, Exchange virtual machines can be moved between physical hosts using VMware vMotion while Exchange continues to operate online. For unplanned events, VMs will be failed over to other vSphere cluster members.
Although the combination of new Exchange 2010 SP1 support options greatly enhances availability models for Exchange in virtualized environments, Exchange administrators have been reluctant to virtualize Exchange mailbox roles due to the large CPU and memory resource demands. Supporting thousands of mailbox users requires significant processors resources and large physical memory requirements, which in the past warranted purchasing dedicated server hardware. However, with the increasing number of processor cores and increased megacycle performance in ProLiant Gen8 servers, this perception is changing. ProLiant Gen8 server system performance now allows multiple large Exchange VMs to be hosted on a single server. This reference architecture features the BL460c Gen8 with 2 processors and 16 total cores.
ProLiant BL460c Gen8 architecture
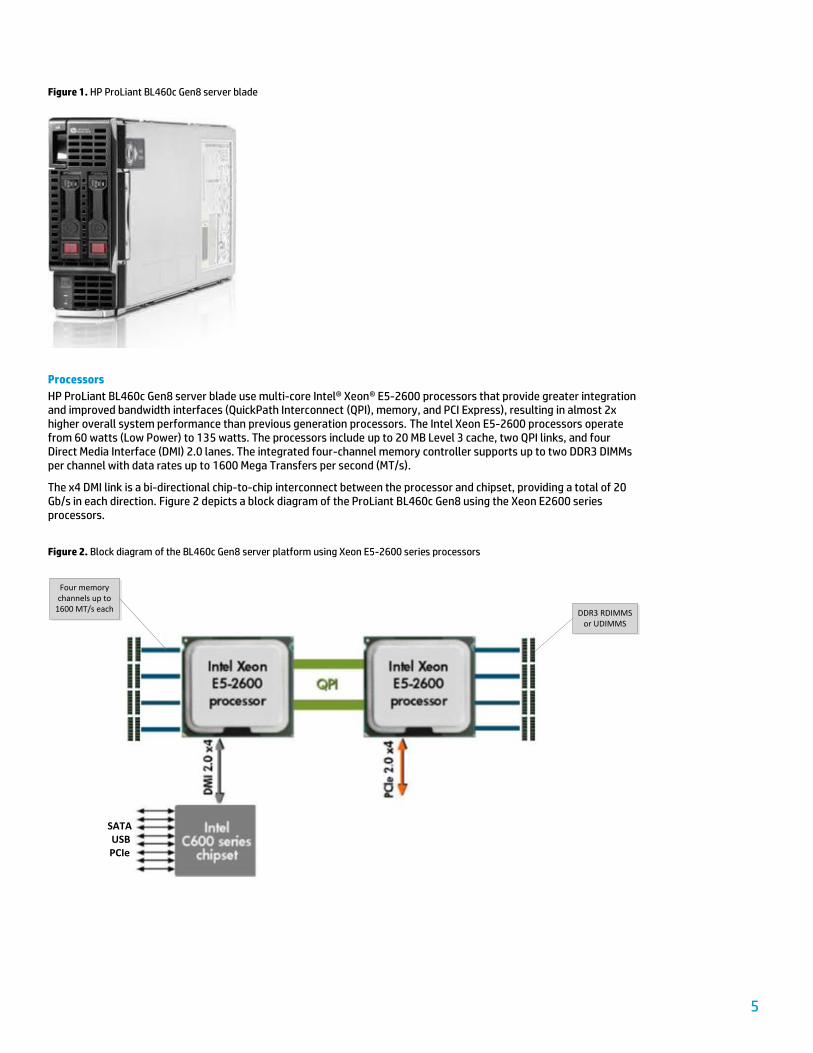
The ProLiant Gen8 family was designed to address the complex management challenges that IT administrators face in today’s virtual data center. The HP ProLiant Gen8 servers combine more than 150 design innovations and have more than 900 patents pending. These innovations dramatically accelerate application performance and allow administrators to maximize server availability by eliminating common problems that cause failures, downtime, and data loss. Performance has also been increased or optimized for all major subsystems in the ProLiant BL460c Gen8 server series. Figure 1 displays the BL460c Gen8 server.
5
Figure 1. HP ProLiant BL460c Gen8 server blade
Processors
HP ProLiant BL460c Gen8 server blade use multi-core Intel® Xeon® E5-2600 processors that provide greater integration and improved bandwidth interfaces (QuickPath Interconnect (QPI), memory, and PCI Express), resulting in almost 2x higher overall system performance than previous generation processors. The Intel Xeon E5-2600 processors operate from 60 watts (Low Power) to 135 watts. The processors include up to 20 MB Level 3 cache, two QPI links, and four Direct Media Interface (DMI) 2.0 lanes. The integrated four-channel memory controller supports up to two DDR3 DIMMs per channel with data rates up to 1600 Mega Transfers per second (MT/s).
The x4 DMI link is a bi-directional chip-to-chip interconnect between the processor and chipset, providing a total of 20 Gb/s in each direction. Figure 2 depicts a block diagram of the ProLiant BL460c Gen8 using the Xeon E2600 series processors.
Figure 2. Block diagram of the BL460c Gen8 server platform using Xeon E5-2600 series processors
Four memory channels up to
1600 MT/s each DDR3 RDIMMS or UDIMMS
SATA USB PCIe

6
SmartMemory
Server virtualization, cloud computing, and high-performance computing have significantly increased the need for more memory capacity. As a result, DRAM manufacturers have increased chip component densities to support higher memory capacities. The combination of higher memory demand, component complexity, and availability requirements have increased the importance of system memory. It significantly defines the system’s reliability performance, and overall server power consumption. Therefore, choosing the right memory is the key to ensure high reliability and performance, and to deliver a faster return on your IT investment.
HP SmartMemory is a unique technology introduced for the HP ProLiant Gen8 Server series. Unlike third-party memory, HP SmartMemory has passed the rigorous HP qualification and test process. More important, verification of HP SmartMemory unlocks certain performance and high efficiency features optimized for HP ProLiant Gen8 servers:
HP SmartMemory uses up to 20% less power than third-party memory while achieving the same performance. At low voltage (1.35 V), HP SmartMemory operates at DDR3-1333 MHz with one and two DIMMs per channel. In comparison, third-party memory requires 1.5 V to achieve the same performance.
HP SmartMemory performance is 25% higher with Unbuffered ECC (UDIMM) memory and capable of supporting 1333 MT/s with up to two DIMMs per channel at 1.35V. Third-party memory supports 1066 MT/s bandwidth at higher operating voltage (1.5V).
In addition, HP SmartMemory will provide enhanced support through HP Active Health System and HP Integrated Lights-Out (iLO). HP SmartMemory is ideal for HP ProLiant Gen8 customers looking to extract all the memory performance, dependability, and power savings that ProLiant Gen8 servers have been designed to deliver.
FlexibleNetwork adapters
HP FlexibleNetwork adapters include features that improve performance and energy efficiency and decrease latency. For select ProLiant Gen8 servers, HP offers FlexibleLOM (LAN-on-motherboard) modules to address rigid and aging infrastructures and provide choices based on your infrastructure needs.
As part of HP’s expanded Sea of Sensors 3D, FlexibleNetwork Adapters for ProLiant Gen8 servers have an embedded temperature sensor. The sensor reports thermal data to the iLO Management Engine for capture by the HP Active Health System log. This allows the server to manage fan speeds and internal temperatures better and maximize system power efficiency.
FlexibleLOM modules
The idea behind LAN-on-motherboard was to provide essential connectivity without the need to consume an expansion slot or mezzanine connector. The implication is that the choice has to be made in the design phase and the decision cannot be revisited until the design is changed. With the FlexibleLOM module approach in select ProLiant Gen8 servers, not only can you choose from several different technologies, speeds and features, but you can do so without sacrificing any of your expected expandability. This also means that if new connectivity technologies come out, you don’t have to wait for the next ProLiant generation to begin utilizing them, and even can upgrade existing deployed ProLiant Gen8 servers if desired. FlexibleLOM modules available for BL460c Gen8 servers include Ethernet 10Gb 2-port 560FLB FIO Adapter, FlexFabric 10Gb 2-port 554FLB FIO Adapter and the Flex-10 10Gb 2-port 530FLB FIO Adapter.
ProLiant management technologies Intelligent Provisioning
HP Intelligent Provisioning provides out-of-the box, single-server deployment and configuration. To develop Intelligent Provisioning, the best parts of SmartStart, ProLiant Support Packs, and HP Smart Update Manager have been combined and enclosed in an intuitive user interface, which is all embedded into a NAND flash chip on the motherboard.
All of the appropriate tools, drivers, and agents you need to set up, deploy, and maintain your system have been made available when you power up any ProLiant Gen8 server. You no longer need system and firmware CDs. You only need the OS and application discs. This makes deploying ProLiant Gen8 servers up to three times faster than deploying previous-generation servers. If some time passes before you deploy a ProLiant Gen8 server, you can use the built-in update manager to access HP.com or your local repository, and download the latest updates. You can use this same update function to maintain your system.
7
Agentless management
The HP iLO Management Engine enables base hardware monitoring and alerting capability without the complexity of OS-based agents. In addition, it is available the moment you connect a power cord and Ethernet cable to the server. HP Agentless Management Service is an optional add-on utility that provides OS configuration data and additional subsystem coverage.
Active Health System
The HP Active Health System is a diagnostic tool that continuously monitors and records every change in server hardware and system configuration. The Active Health System assists in diagnosing problems and rapidly resolving system failures.
Until now, a system issue without an obvious root cause required using multiple diagnostics tools to investigate the cause. These diagnostic tools may provide the necessary information, but you can only run them after an issue has developed. Another concern is that the tools often analyze subsystems individually instead of collectively. HP Active Health System removes these limitations.
HP Active Health System runs on iLO, so there is no impact on server performance. Active Health System logs every change in hardware and system configuration, variations in temperature and voltage, and every alert. HP support engineers can use this log to solve even the most elusive, intermittent issues in a lot less time. More important, you will spend less time resolving issues.
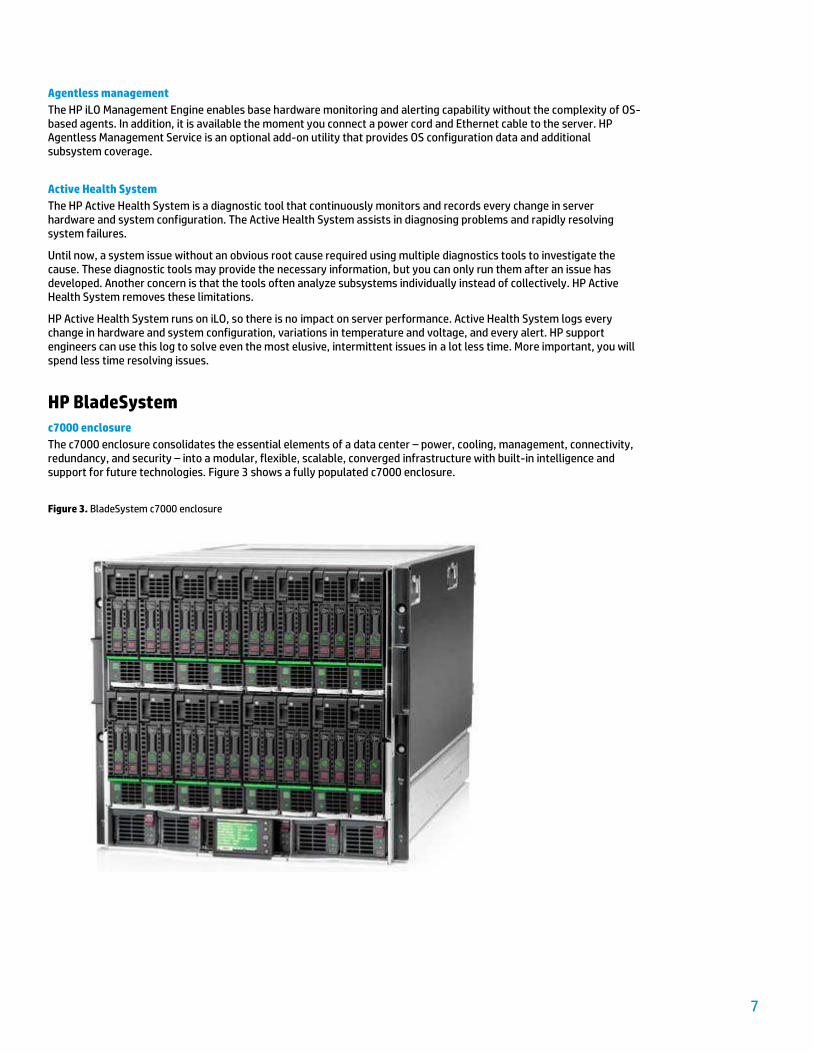
HP BladeSystem c7000 enclosure
The c7000 enclosure consolidates the essential elements of a data center – power, cooling, management, connectivity, redundancy, and security – into a modular, flexible, scalable, converged infrastructure with built-in intelligence and support for future technologies. Figure 3 shows a fully populated c7000 enclosure.
Figure 3. BladeSystem c7000 enclosure

8
Onboard Administrator
Onboard Administrator centralizes BladeSystem c-Class infrastructure management. Together with the enclosure’s HP Insight Display, the Onboard Administrator has been designed for both local and remote administration of HP BladeSystem c-Class components and provides the following capabilities:
Wizards for simple, fast setup and configuration
Highly available and secure access to the HP BladeSystem infrastructure
Security roles for server, network, and storage administrators
Automated power and cooling of the HP BladeSystem infrastructure
Agent-less device health and status
Thermal Logic power and cooling information and control
Virtual Connect technology
HP Virtual Connect technology provides wire-once, change-ready connectivity that is simple, flexible, and secure. This technology is a key element of HP Converged Infrastructure, providing a better way to connect your virtualized environment to the network core. Rather than tying profiles to specific server blades, a profile is created for each device bay in an HP BladeSystem enclosure; Virtual Connect then maps physical LAN or SAN connections to these profiles, allowing you to manage connectivity without involving LAN or SAN administrators. In addition, if a server blade were to fail, you could move its associated profile to a bay containing a spare blade, thus restoring availability without needing to wait for assistance.
VMware vSphere 5
VMware vSphere 5 integrates a number of infrastructure and application services designed to manage and maintain business critical applications. vSphere has been designed to:
Reduce capital and operational expenses by consolidation and automation through virtualization
Increase application availability with failover, load balancing and disaster recovery technologies
Provide IT operations with agility to manage hardware and application changes as business demands change
VMware vSphere 5, allows you to virtualize and aggregate hardware resources for a more efficient workload balancing without the need to overprovision server and storage resources. From a compute service vSphere 5, includes ESXi 5 for streamlined deployment and configuration, while providing reliability and security of a bare metal hypervisor. VMware vSphere 5 includes several new enhancements to ESXi 5 including:
Support for up to 32 virtual CPUs per VM
Support for up to 1TB of memory per VM
Image Builder used to create images suitable for different types of deployment
ESXi Firewall which is provided as added protection for the management interface
Enhanced SNMP expands support for SNMP v.2 with full monitoring for all hardware on the host
Secure Syslog adds several enhancements to system message logging
Central management of host image and configuration via Auto Deploy
Enhanced Unified CLI Framework
New generation of virtual hardware with virtual machine hardware version 8
Non-hardware accelerated 3D graphics for Windows Aero support
USB 3.0 device support
HP Customized ESXi 5 images
The new ProLiant Gen8 servers require the use of the HP customized ESXi 5 images for a successful installation. The drivers for the new network and storage controllers in the ProLiant Gen8 servers have been integrated in to the HP customized image and are not part of the generic ESXi image that is distributed by VMware. ESXi requires drivers for these controllers to be integrated as you will not be able to insert them during installation. The HP ESXi customized
9
images are available on the HP ProLiant servers website. For the image download page go to: http://h18004.www1.hp.com/products/servers/software/vmware/esxi-image.html
Storage hardware and feature overview
Server virtualization delivers increased operational efficiency and allows the flexibility to dynamically change IT operations depending on your business needs. As a result, storage must also be flexible and dynamic while at the same time being capable of supporting the performance and availability needs of a consolidated virtual server environment. HP 3PAR V400 Storage is built from the ground up to exceed the operational requirements of even the most demanding and dynamic IT environments. HP 3PAR V400 Storage delivers both the agility and efficiency demanded by virtual data centers and cloud computing environments as part of an HP Converged Infrastructure. It does this through an innovative system architecture that offers storage federation, secure multi-tenancy, built-in thin provisioning capabilities, and autonomic management and storage tiering features.
HP 3PAR Storage system architecture
HP 3PAR Storage architecture, combines best-in-class, open technologies with extensive innovations in hardware and software design. HP 3PAR Storage features a high-speed, full-mesh, passive system backplane that joins multiple controller nodes (the high-performance data movement engines of the architecture) to form a cache-coherent, mesh-active cluster. This low-latency interconnect allows for tight coordination among the controller nodes and a simplified software model.
Within this architecture, controller nodes have been paired via FC connections from each node in the pair to the dual-ported drive chassis (or drive cages) owned by that pair. In addition, each controller node may have one or more paths to hosts (either directly or over a SAN). The clustering of controller nodes enables the system to present to hosts a single, highly available, high-performance storage system.
High availability is also built into HP 3PAR architecture. Unlike other approaches, the system offers both hardware and software fault tolerance by running a separate instance of the HP 3PAR Inform OS on each controller node, thus ensuring the availability of user data.
The Thin Built-in ASICs (application-specific integrated circuit) feature a uniquely efficient, silicon-based zero-detection mechanism that gives HP 3PAR Storage the power to remove allocated but unused space without impacting performance. The ASIC also delivers mixed-workload support to alleviate performance concerns and cut traditional array costs. Transaction and throughput-intensive workloads run on the same storage resources without contention, thereby cutting array purchases.
HP 3PAR Storage models for Exchange
The HP 3PAR Storage system is available in six models. Each model in the family can accommodate different size and performance requirements for all Exchange systems. The F-Class system is offered in two models the F200 and F400. The F-Class is one of the world’s first cache-coherent, quad-controller architectures for scalable, efficient departmental and remote office consolidation. At the high end, the T-Class system offers the T400 and T800, and the P10000 offers the V400 and V800.
The HP 3PAR P10000 is the latest high-end storage, offering scale-up capacity to 1600TB. The V800 and T800 models accommodate up to eight controller nodes; the V400, T400, and F400 accommodate up to four controller nodes; and the F200 supports two controller nodes. Note that unless otherwise specified, the examples in this reference architecture have been based on the specifications of the P10000 V400 model. Table 1 compares the HP 3PAR storage system models.

10
Table 1. Comparison of HP 3PAR Storage system models
F-Class F200
F-Class F400
T-Class T400
T-Class T800
P10000 V400
P10000 V800
Description of use
F-Class is a cache coherent, mesh-active controller with quad controller architecture for scalable, efficient departmental and remote office consolidation.
T-Class is designed to deliver enterprise IT as a utility service simply, efficiently, and flexibly. Delivers massive consolidation and performance headroom for virtual and cloud data centers.
P10000 establishes the new benchmark for tier 1 storage performance in virtual and cloud data centers. Designed to deliver consolidation of thousands of virtual machines and ensure that applications never lose access to data.
Controller nodes
2 2 or 4 2 or 4 2, 4, 6 or 8 2 or 4 2, 4, 6 or 8
Built-in gigabit Ethernet ports
Yes Yes Yes Yes Yes Yes
Fibre channel host ports
0-12 0-24 0-64 0-128 0-96 0-192
iSCSI host ports
0-8 0-16 0-16 0-32 0-16 0-32
Drive chassis
2–12
3U drive chassis (16 drives each
2–24
3U drive chassis (16 drives each)
2–16
4U drive chassis (40 drives each)
2–32
4U drive chassis (40 drives each)
2–24
4U drive chassis (40 drives each)
2–24
4U drive chassis (40 drives each)
Drive types
(mixable)
Fibre Channel
Nearline
SSD
Fibre Channel
Nearline
SSD
Fibre Channel
Nearline
SSD
Fibre Channel
Nearline
SSD
Fibre Channel
Nearline
SSD
Fibre Channel
Nearline
SSD
HP 3PAR features
Common Provisioning Groups and RAID types
A Common Provisioning Group (CPG) is a virtual pool of logical disks that allows virtual volumes to share their resources and allocate space on demand. A CPG can contain fully provisioned virtual volumes and Thinly Provisioned Virtual volumes (TPVVs) that draw space from the CPG logical disk pool.
CPGs are fundamental to administration and reporting of HP 3PAR Storage. CPGs automatically provision logical disk capacity on demand. CPGs are the combination of a RAID type and a drive type and act as containers for virtual volumes. CPGs enable fine-grained, shared access to pooled logical capacity. Instead of pre-allocating logical disks to volumes, the CPG allows multiple volumes to share the buffer pool of logical disks. For example, when a TPVV is running low on user space, the system automatically assigns more capacity to the TPVV by mapping new regions from logical disks in the CPG associated with that TPVV. As a result, any large pockets of unused but allocated space are eliminated. Fully provisioned virtual volumes cannot create user space automatically and the system allocates a fixed amount of user space for the volume; they can however co-exist with a TPVV in the same CPG. By default, a CPG is configured to auto-grow new logical disks when the amount of available logical disk space falls below a configured threshold. The initial buffer pool of logical disks starts at a fraction of the exported virtual capacity of mapped volumes and automatically grows over time as required by application writes.
11
Chunklet-based RAID
HP 3PAR Storage incorporates several enhancements over conventional storage arrays. By making more effective use of all drive resources in the array, these enhancements allow higher performance with less hardware, which in turn, leads to cost reduction. HP 3PAR Storage supports the following RAID types:
RAID 10 (RAID 1)
RAID 50 (RAID 5)
RAID Multi-Parity (MP) or RAID 6
Chunklet based RAID allows thin provisioned and thick provisioned virtual volumes to co-exist on the same set of physical disks. This could be helpful to migrate existing Exchange fully provisioned volumes from legacy arrays to HP 3PAR without creating any additional CPGs for fully provisioned volumes. Chunklet based RAID is an enabler for wide striping, the benefits of which are detailed in the next section. While all storage vendors offer most of these RAID levels in one form or the other, the key difference here is that in HP 3PAR Storage, the RAID protection is not at the spindle level but at the chunklet level.
The HP 3PAR Inform OS divides physical drives into multiple equally sized slices called chunklets. The chunklets size is 1GB for HP 3PAR P10000 and 256MB for F-Class and T-Class. Each chunklet can be thought of as its own small disk. RAID groups are constructed from chunklets on separate drives throughout the array.
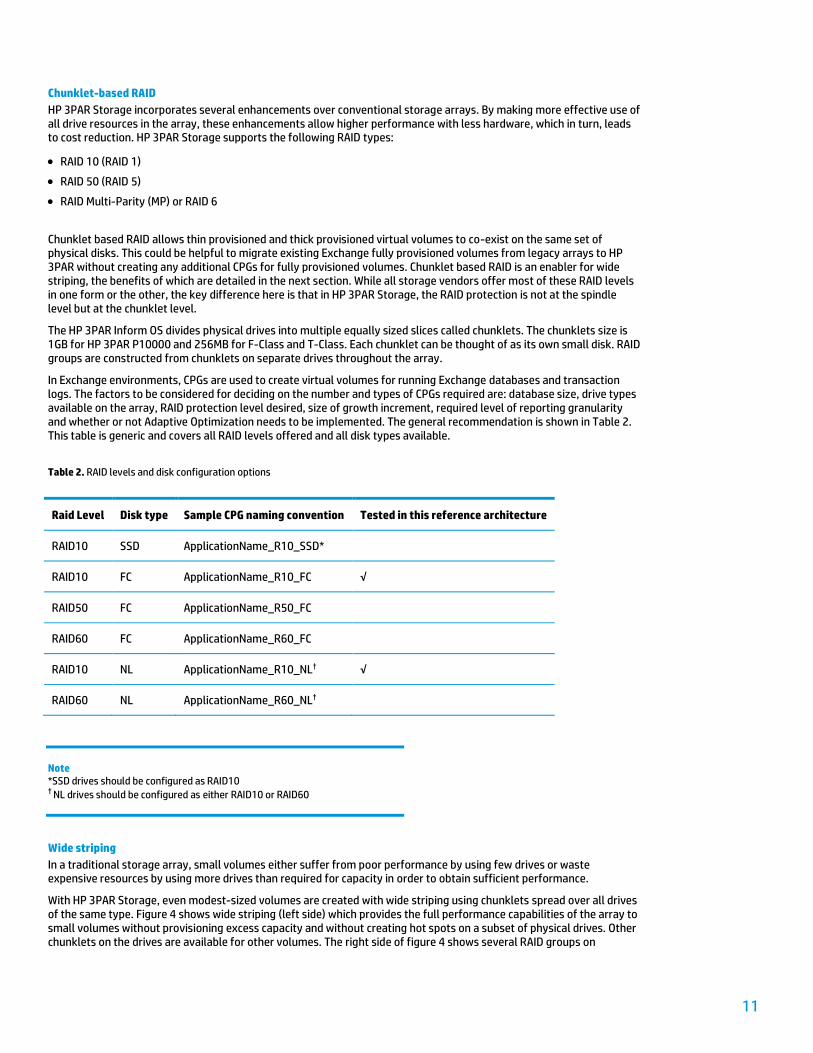
In Exchange environments, CPGs are used to create virtual volumes for running Exchange databases and transaction logs. The factors to be considered for deciding on the number and types of CPGs required are: database size, drive types available on the array, RAID protection level desired, size of growth increment, required level of reporting granularity and whether or not Adaptive Optimization needs to be implemented. The general recommendation is shown in Table 2. This table is generic and covers all RAID levels offered and all disk types available.
Table 2. RAID levels and disk configuration options
Raid Level Disk type Sample CPG naming convention Tested in this reference architecture
RAID10 SSD ApplicationName_R10_SSD*
RAID10 FC ApplicationName_R10_FC √
RAID50 FC ApplicationName_R50_FC
RAID60 FC ApplicationName_R60_FC
RAID10 NL ApplicationName_R10_NL† √
RAID60 NL ApplicationName_R60_NL†
Note *SSD drives should be configured as RAID10 † NL drives should be configured as either RAID10 or RAID60
Wide striping
In a traditional storage array, small volumes either suffer from poor performance by using few drives or waste expensive resources by using more drives than required for capacity in order to obtain sufficient performance.
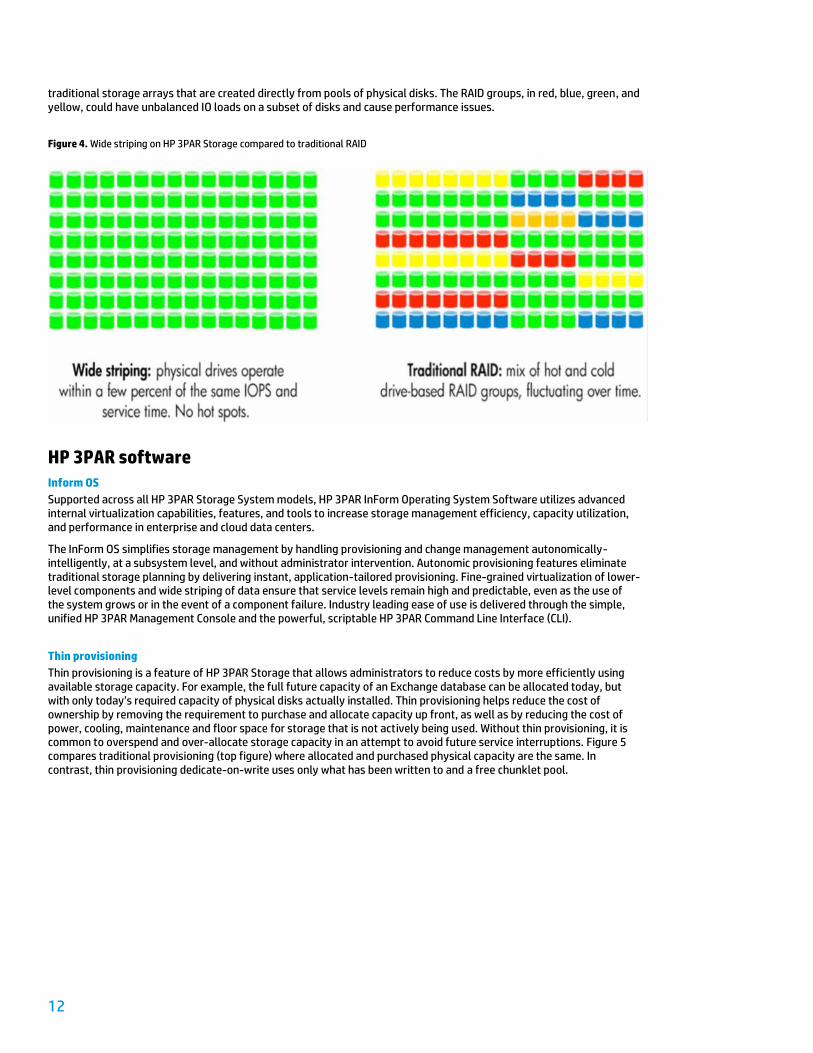
With HP 3PAR Storage, even modest-sized volumes are created with wide striping using chunklets spread over all drives of the same type. Figure 4 shows wide striping (left side) which provides the full performance capabilities of the array to small volumes without provisioning excess capacity and without creating hot spots on a subset of physical drives. Other chunklets on the drives are available for other volumes. The right side of figure 4 shows several RAID groups on
12
traditional storage arrays that are created directly from pools of physical disks. The RAID groups, in red, blue, green, and yellow, could have unbalanced IO loads on a subset of disks and cause performance issues.
Figure 4. Wide striping on HP 3PAR Storage compared to traditional RAID
HP 3PAR software Inform OS
Supported across all HP 3PAR Storage System models, HP 3PAR InForm Operating System Software utilizes advanced internal virtualization capabilities, features, and tools to increase storage management efficiency, capacity utilization, and performance in enterprise and cloud data centers.
The InForm OS simplifies storage management by handling provisioning and change management autonomically-intelligently, at a subsystem level, and without administrator intervention. Autonomic provisioning features eliminate traditional storage planning by delivering instant, application-tailored provisioning. Fine-grained virtualization of lower-level components and wide striping of data ensure that service levels remain high and predictable, even as the use of the system grows or in the event of a component failure. Industry leading ease of use is delivered through the simple, unified HP 3PAR Management Console and the powerful, scriptable HP 3PAR Command Line Interface (CLI).
Thin provisioning
Thin provisioning is a feature of HP 3PAR Storage that allows administrators to reduce costs by more efficiently using available storage capacity. For example, the full future capacity of an Exchange database can be allocated today, but with only today’s required capacity of physical disks actually installed. Thin provisioning helps reduce the cost of ownership by removing the requirement to purchase and allocate capacity up front, as well as by reducing the cost of power, cooling, maintenance and floor space for storage that is not actively being used. Without thin provisioning, it is common to overspend and over-allocate storage capacity in an attempt to avoid future service interruptions. Figure 5 compares traditional provisioning (top figure) where allocated and purchased physical capacity are the same. In contrast, thin provisioning dedicate-on-write uses only what has been written to and a free chunklet pool.

13
Figure 5. Thin Provisioning
Dynamic Optimization
HP 3PAR Dynamic Optimization (DO) software is an optional product that allows the underlying characteristics of a volume to be changed transparently and without disruption of service. Using this software ensures that drive type, RAID level and configuration, and high availability options can all be changed simply, easily, and non-disruptively. Unlike traditional arrays, where a poor initial choice can be difficult and/or costly to change, Dynamic Optimization allows changes to be made easily. DO provides the ability to migrate Exchange database virtual volume from one type of RAID level to another or to a different storage tier.
Adaptive Optimization
HP 3PAR Adaptive Optimization (AO) software is a fine-grained, policy-driven, autonomic storage software solution that delivers service level optimization for enterprises and cloud data centers at a low cost while increasing agility and minimizing risk. AO analyzes performance (access rates) for sub-volume regions, then selects the most active regions (those with the highest IO rates) and uses the proven sub-volume data movement engine built in to HP 3PAR Inform

14
software to autonomically move those regions to the fastest storage tier. It also moves less active regions to slower tiers to ensure space availability for newly active regions.
Traditional storage arrays require the storage administrator to choose between slow, inexpensive storage and fast, expensive storage for each volume — a process that depends on the storage administrator’s knowledge of the application’s storage access patterns. Moreover, volumes tend to have hot spots rather than evenly-distributed accesses, and these hot spots can move over time.
For Exchange AO is used to analyze database and log IO random accesses and move data regions based on IO profile. Highly accessed data regions can be moved to the faster storage tier. Note AO will not favor sequential IO accesses such as backup and background maintenance because they are already optimized.
In this reference architecture two storage tiers are used, NL and FC, the NL tier is the primary tier for the database and log virtual volumes, and the FC tier is used to move hot IO data regions to improve storage IO performance. Figure 6 depicts the AO movement of data regions between storage tiers.
Figure 6. Adaptive Optimization
Sizing the Exchange configuration
The reference architecture has been sized to support 15,000 mailboxes using a two-copy DAG with 40 active databases distributed across the five Exchange mailbox VMs. For unplanned events where an Exchange VM becomes unavailable, the solution can support all the mailboxes on the remaining four mailbox VMs. In this scenario, the remaining four mailbox VMs would each host 3,750 active mailbox users.
Exchange VM layout
The 10 Exchange VMs are distributed across a five node vSphere HA cluster (see figure 7). The vSphere cluster has been sized as N +1, allowing a single node (physical server) failure without impacting resources available to the Exchange VMs. One of the benefits of virtualizing Exchange servers is the ability to move Exchange VMs between clustered vSphere hosts. If an ESXi server unexpectedly crashes, the Exchange VMs can be automatically failed over to one of the other cluster members and restarted. For planned maintenance events, Exchange VMs can be moved online between ESXi hosts using the vMotion feature. VMware vMotion allows Exchange VMs to remain operational during migration between ESXi hosts with no perceived downtime.

15
Figure 7. Exchange VM logical layout
Sizing the mailbox role in a virtualized environment
Sizing an Exchange mailbox server in a virtualized environment is more difficult than on a physical server. Additional considerations must be taken into account, such as factoring in overhead of the hypervisor and the number of logical processors that can be allocated to a VM. Unlike sizing on physical servers where all processor cores are dedicated to one server, virtualized servers require some additional sizing steps to properly match the expected application workload. Virtualizing the Exchange mailbox role requires focusing on the individual processor core performance to scale up CPU resources available to a given VM while balancing the number of logical processors. In the Exchange configuration, the goal is to have up to four Exchange VMs per physical server, each with four virtual CPUs (vCPUs).
To assist in sizing Exchange 2010 mailbox servers, Microsoft has provided in-depth sizing details to account for the different user workload profiles. Processor sizing is based on the messages sent/received per user per day mailbox profile. The mailbox profiles provide processor-sizing details to account for peak times, where there may be significant spikes in mailbox activity. Sizing the virtual processors correctly ensures that the Exchange VM is capable of handling these peak periods when CPU resource demands may be at their highest. CPU sizing for Exchange 2010 is based on the number of processor cycles needed per mailbox profile, instead of the number of users supported by a given processor core.
Processor sizing
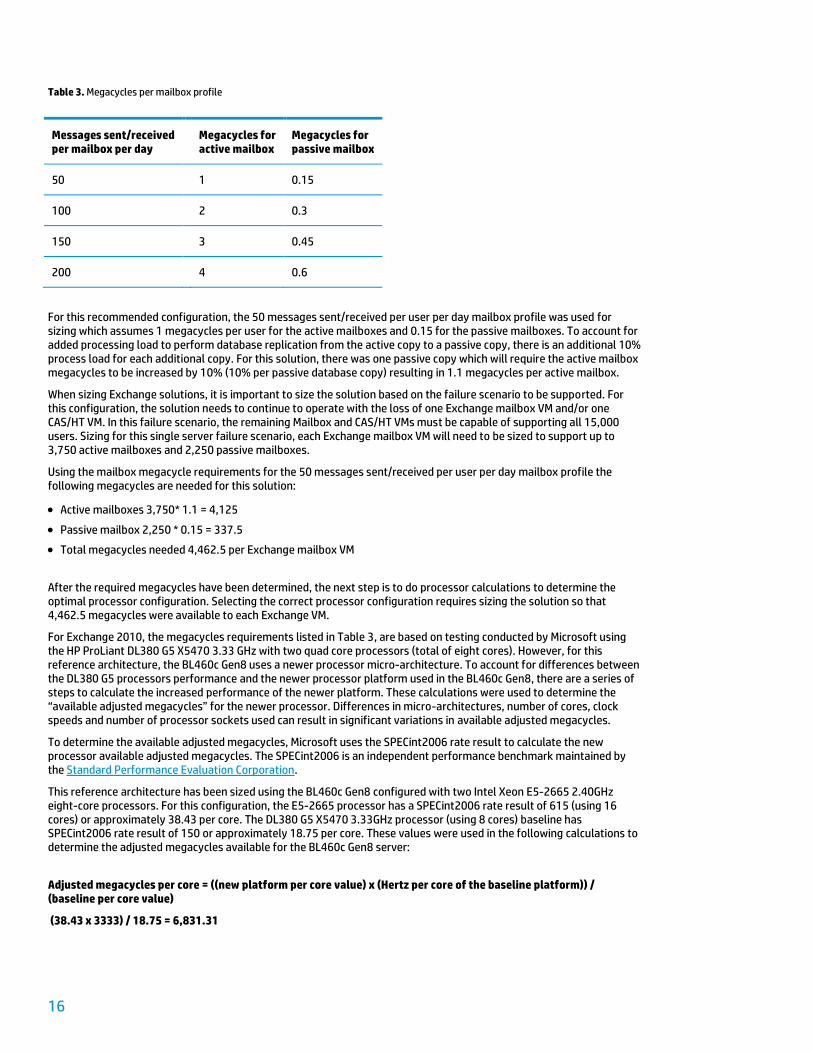
The processor cycles requirements, referred to in megacycles, are expressed using two values: megacycles for active mailbox and megacycles for passive mailbox. Considering that a mailbox server in Exchange 2010 can host both active and passive mailbox databases, sizing needs to account for both resource types. The megacycle values for the active mailbox databases accounts for users interacting directly with their mailboxes and using various client types including Microsoft Office Outlook and ActiveSync devices. Megacycles for passive mailbox databases are related to replication of mailbox data to the passive database copies hosted on this mailbox server. Table 3 provides a partial list of the Microsoft recommended megacycle values for the messages sent/received per user per day mailbox profile. For additional details on larger message profiles, refer to Microsoft TechNet article: http://technet.microsoft.com/en-us/library/ee712771.aspx.
16
Table 3. Megacycles per mailbox profile
Messages sent/received per mailbox per day
Megacycles for active mailbox
Megacycles for passive mailbox
50 1 0.15
100 2 0.3
150 3 0.45
200 4 0.6
For this recommended configuration, the 50 messages sent/received per user per day mailbox profile was used for sizing which assumes 1 megacycles per user for the active mailboxes and 0.15 for the passive mailboxes. To account for added processing load to perform database replication from the active copy to a passive copy, there is an additional 10% process load for each additional copy. For this solution, there was one passive copy which will require the active mailbox megacycles to be increased by 10% (10% per passive database copy) resulting in 1.1 megacycles per active mailbox.
When sizing Exchange solutions, it is important to size the solution based on the failure scenario to be supported. For this configuration, the solution needs to continue to operate with the loss of one Exchange mailbox VM and/or one CAS/HT VM. In this failure scenario, the remaining Mailbox and CAS/HT VMs must be capable of supporting all 15,000 users. Sizing for this single server failure scenario, each Exchange mailbox VM will need to be sized to support up to 3,750 active mailboxes and 2,250 passive mailboxes.
Using the mailbox megacycle requirements for the 50 messages sent/received per user per day mailbox profile the following megacycles are needed for this solution:
Active mailboxes 3,750* 1.1 = 4,125
Passive mailbox 2,250 * 0.15 = 337.5
Total megacycles needed 4,462.5 per Exchange mailbox VM
After the required megacycles have been determined, the next step is to do processor calculations to determine the optimal processor configuration. Selecting the correct processor configuration requires sizing the solution so that 4,462.5 megacycles were available to each Exchange VM.
For Exchange 2010, the megacycles requirements listed in Table 3, are based on testing conducted by Microsoft using the HP ProLiant DL380 G5 X5470 3.33 GHz with two quad core processors (total of eight cores). However, for this reference architecture, the BL460c Gen8 uses a newer processor micro-architecture. To account for differences between the DL380 G5 processors performance and the newer processor platform used in the BL460c Gen8, there are a series of steps to calculate the increased performance of the newer platform. These calculations were used to determine the “available adjusted megacycles” for the newer processor. Differences in micro-architectures, number of cores, clock speeds and number of processor sockets used can result in significant variations in available adjusted megacycles.
To determine the available adjusted megacycles, Microsoft uses the SPECint2006 rate result to calculate the new processor available adjusted megacycles. The SPECint2006 is an independent performance benchmark maintained by the Standard Performance Evaluation Corporation.
This reference architecture has been sized using the BL460c Gen8 configured with two Intel Xeon E5-2665 2.40GHz eight-core processors. For this configuration, the E5-2665 processor has a SPECint2006 rate result of 615 (using 16 cores) or approximately 38.43 per core. The DL380 G5 X5470 3.33GHz processor (using 8 cores) baseline has SPECint2006 rate result of 150 or approximately 18.75 per core. These values were used in the following calculations to determine the adjusted megacycles available for the BL460c Gen8 server:
Adjusted megacycles per core = ((new platform per core value) x (Hertz per core of the baseline platform)) / (baseline per core value)
(38.43 x 3333) / 18.75 = 6,831.31

17
The available adjusted megacycles were approximately 6,831 per physical core. However, to virtualize Exchange, CPU resources are needed by the hypervisor. While this can vary based upon processor architecture, Microsoft provides a conservative recommendation of 10% overhead factor to support the hypervisor host server. Accounting for the 10% reduction resources, there was approximately 6,148 megacycles available for each of the 16 virtual processor cores in the BL460c Gen8 using two E5-2665 eight-core processors.
In this reference architecture, each VM was configured with four virtual processors capable of providing 24,592 total megacycles to the VM. However, similar to sizing physical server solutions, sizing should not consume 100% of the available resources. Microsoft recommends Exchange mailbox servers in a DAG configuration be sized to consume no more than 80% of the available CPU resources. Sizing the VM to 80% CPU provides approximately 19,673 megacycles to each Exchange VM, which provides considerable CPU headroom for this configuration.
Exchange memory requirements
Exchange 2010 memory guidance is based on workload profiles similar to how processor megacycle requirements are determined. However, sizing memory for a virtualized environment is not significantly different than on a physical server, Table 4 provides a partial list the memory requirements for each of the workload profiles. For further details go to: http://technet.microsoft.com/en-us/library/ee832793.aspx
Table 4. Database cache per user
Messages sent/received per mailbox per day
Database cache per user (MB)
50 3
100 6
150 9
200 12
For this recommended configuration the 50 messages sent/received per user per day mailbox profile was used for sizing which requires 3MB memory per mailbox to be allocated to database cache. Sizing for the failure scenario with 3,750 users per Exchange Mailbox VM, the database cache requirement was 3,750 x 3MB or 11.25GB of memory. After the database cache size has been calculated, the next step was to determine the total memory requirements for the VM to support Exchange services and the given number of mailboxes.
Table 5 provides a partial list of the server memory requirements to support different database cache sizes for servers configured with only the mailbox role. Since this solution requires 11.25GB for database cache, the recommended server memory configuration would be 24GB for the mailbox VM to support the database cache requirements and memory.
Table 5. Database cache size
Server VM memory Database cache size (Mailbox role only)
16GB 10.4GB
24GB 17.6GB
32GB 24.4GB
48GB 39.2GB
18
Storage configuration
Sizing storage is a rather complex task due to having to account for many variables such as database whitespace, deleted items dumpster, and mailbox size to name a few. To simplify the storage sizing process, it is recommended to use both the HP Sizer for Microsoft Exchange Server 20101 and the Microsoft Exchange 2010 Mailbox Server Role Requirements Calculator2 to assist in storage sizing for both the initial deployment and target end state.
For this reference architecture, the storage model was designed to use thin provisioning. Designing with thin provisioning requires some additional sizing steps to account for differences between the initial deployment and the target end state. When deploying TP, storage sizing must account for both the initial capacity needs as well as the necessary disk performance to support the given workload. After the TP sizing defines the disk IO and capacity requirements, the target end state sizing is next.
Note The disk performance requirements are nearly identical for initial deployment and target end state.
The end state design determines how Exchange needs to lay out in terms of number of databases, their size and the LUN design. This end state design is then used to deploy the thin provisioned LUNs. By deploying the end state design, the Exchange configuration does not need to be reconfigured when additional storage is added to the HP 3PAR storage system.
Exchange storage sizing
Using the Microsoft Exchange 2010 Mailbox Server Role Requirements Calculator, the following inputs listed in table 6 were used to size the disk configuration for the initial deployment and the end state database and LUN design. This solution uses a 250MB mailbox capacity to size the initial disk configuration and then uses 2,048MB mailbox capacities for the Exchange database and LUN design. Sizing assumes five dedicated mailbox server roles, running as virtualized servers. The solution was defined with one DAG, 40 databases each with one passive copy. Table 7 details the sizing input settings.
1 hp.com/solutions/microsoft/exchange2010/sizer 2 http://gallery.technet.microsoft.com/v144-of-the-Exchange-2010-1912958d

19
Table 6. Mailbox sizing inputs
User mailbox configuration Initial deployment End state deployment
Total Number of Tier-1 User Mailboxes / Environment 15,000 15,000
Projected Mailbox Number Growth Percentage 0% 0%
Total Send/Receive Capability / Mailbox / Day 50 Messages 50 Messages
Average Message Size (KB) 75 75
Mailbox Size Limit (MB) 250 2,048
Personal Archive Mailbox Size Limit (MB) 0 0
Deleted Item Retention Window (Days) 14 14
Single Item Recovery Enabled Enabled
Calendar Version Storage Enabled Enabled
IOPS Multiplication Factor 1.00 1.00
Megacycles Multiplication Factor 1.00 1.00
Desktop Search Engines Enabled (for Online Mode Clients) No No
Predict IOPS Value? Yes Yes
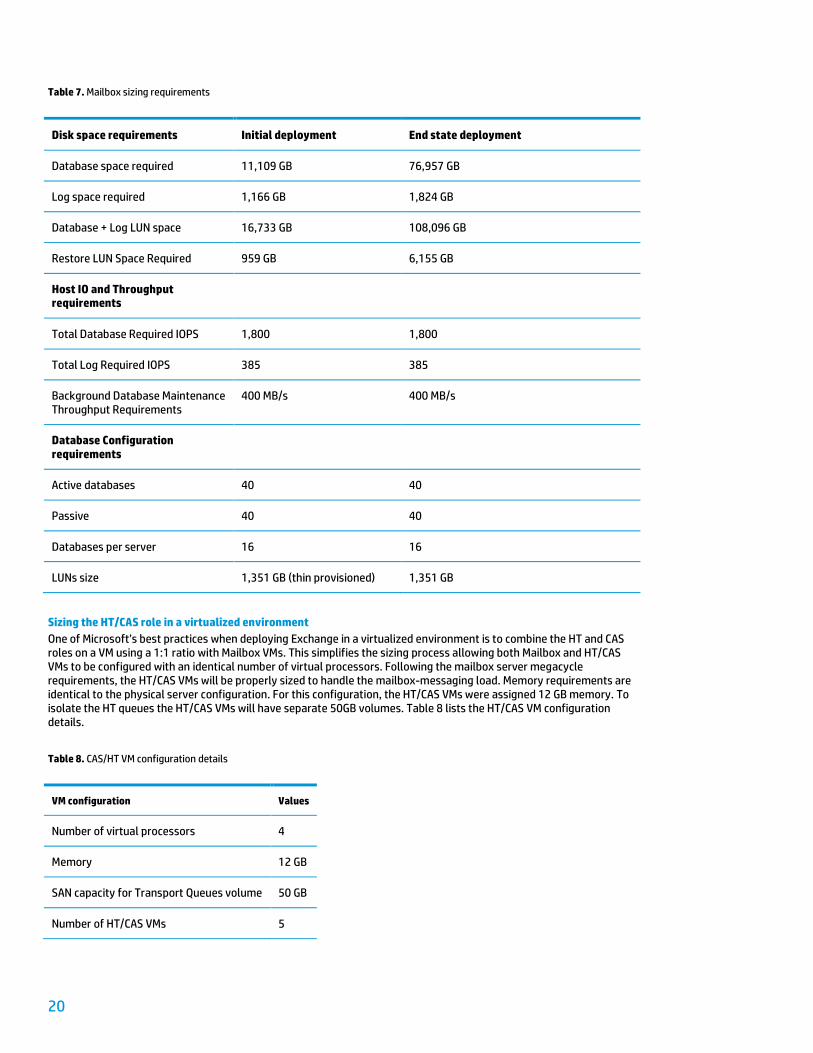
Table 7 details the sizing requirements for both the initial and end state deployments. For initial deployment the solution will use 16.733 TB of storage to host the 15,000 mailboxes and requires 2,185 transactional IOPS.
Note Database configuration requirements listed in table 8 for the initial deployment have been adjusted to reflect the end state deployment.
20
Table 7. Mailbox sizing requirements
Disk space requirements Initial deployment End state deployment
Database space required 11,109 GB 76,957 GB
Log space required 1,166 GB 1,824 GB
Database + Log LUN space 16,733 GB 108,096 GB
Restore LUN Space Required 959 GB 6,155 GB
Host IO and Throughput requirements
Total Database Required IOPS 1,800 1,800
Total Log Required IOPS 385 385
Background Database Maintenance Throughput Requirements
400 MB/s 400 MB/s
Database Configuration requirements
Active databases 40 40
Passive 40 40
Databases per server 16 16
LUNs size 1,351 GB (thin provisioned) 1,351 GB
Sizing the HT/CAS role in a virtualized environment
One of Microsoft’s best practices when deploying Exchange in a virtualized environment is to combine the HT and CAS roles on a VM using a 1:1 ratio with Mailbox VMs. This simplifies the sizing process allowing both Mailbox and HT/CAS VMs to be configured with an identical number of virtual processors. Following the mailbox server megacycle requirements, the HT/CAS VMs will be properly sized to handle the mailbox-messaging load. Memory requirements are identical to the physical server configuration. For this configuration, the HT/CAS VMs were assigned 12 GB memory. To isolate the HT queues the HT/CAS VMs will have separate 50GB volumes. Table 8 lists the HT/CAS VM configuration details.
Table 8. CAS/HT VM configuration details
VM configuration Values
Number of virtual processors 4
Memory 12 GB
SAN capacity for Transport Queues volume 50 GB
Number of HT/CAS VMs 5

21
HP 3PAR storage sizing
To address the performance and capacity requirements of the 15,000 mailboxes, the HP 3PAR V400 storage has been configured with both NL disks to provide large capacity and FC disk for performance. Initially the Exchange volumes were placed on the NL storage tier. The solution then uses Adaptive Optimization to analyze Exchange storage workload patterns and move sub volume data regions between the two storage tiers.
Note Data regions are logical fractions of the Logical Disks that make up the virtual volumes, each data region is 128 MB.
The goal was to maintain a majority of the Exchange data on the NL tier, however hot data regions with more significant transactional IO patterns will be moved to the faster FC tier to increase performance IOPS. Note that AO algorithms favor random IO patterns over sequential. Sequential IO such as background database maintenance and backups, which are more throughput focused, are not preferred so there is no need to put in complex exceptions to handle sequential IO.
AO configuration policies are managed through the HP 3PAR System Reporter tool. Polices for AO can be configured to manage the CPGs containing the Exchange database and log virtual volumes. For this configuration, two CPGs were used for the Exchange databases and logs, one for the NL storage, which was considered the primary tier housing the Exchange databases. The other was the FC tier, which was used to boost performance of hot data regions. This approach allows the thinly provisioned Exchange LUNs to reside on NL while giving them the added boost of the faster FC tier. Leaving the Exchange LUNs on NL storage has two benefits. The first benefit was that only a small portion of the FC tier was used in terms of capacity and performance, leaving the remainder to other applications on the array. The second benefit was that over time as mailbox capacities increase, more NL storage can be added to the V400, which will boost performance of the NL tier and subsequently reduce dependency on the FC tier.
For this configuration, the HP 3PAR V400 storage was sized with 48 2 TB NL disks to provide the capacity needed for the 250MB mailboxes and about 75% of the IO needed. The remaining 25% of the IO needed was dependent on AO using the FC tier. The FC tier consists of 64 600 GB 15K disks to supplement the IO but was also available for other application workloads. Figure 8 depicts the logical storage array configuration tested in this reference architecture. The HP 3PAR V400 storage system was configured with a single controller pair and four drive cages.

22
Figure 8. HP 3PAR V400 storage system configuration
Referring back to table 8, 80 virtual volumes have been created and exported to the ESXi hosts. Each volume was configured as a thinly provisioned volume. Figure 9 shows an example of one of the 80 database virtual volumes.
Figure 9. Example virtual volumes

23
Tested configuration details
Network and storage
The Exchange VMs were hosted by a vSphere cluster using five ProLiant BL460c Gen8 server blades configured in a vSphere HA cluster. The server blades were housed in a c7000 blade enclosure configured with two Virtual Connect Flex-10 10 Gb Ethernet (GbE) modules and two Virtual Connect 8 Gb 20-Port Fibre Channel Modules providing the necessary network and SAN connectivity. The BL460c Gen8 server blades each have two 10 GbE Flex-10 network adapters and each adapter was divided into four FlexNICs. The FlexNICs have been divided into separate networks to isolate the different types of networking traffic. Figure 10 depicts the different protocols and network speeds defined in Virtual Connect Manager.
Figure 10. FlexNIC network configuration
The ESXi servers use four separate networks to isolate the different protocols, table 9 lists the networks and speeds defined on each of the ESXi hosts.
Table 9. Network protocols and speeds
Network Type Speed
HA / Management traffic VMkernel port group 1Gb per VC module
vMotion VMkernel port group 4Gb per VC module
Client network Virtual Machine port group 1Gb per VC module
Replication network Virtual Machine port group 4Gb per VC module
For SAN connectivity, each of the ESXi servers was configured with a QLogic QMH2572 8 Gb FC HBA mezzanine card. The HBA was connected to the two Virtual Connect 8 Gb 20-Port Fibre Channel Modules in the c7000 blade enclosure. The two Virtual Connect 8 Gb 20-Port Fibre Channel Modules were externally connected to the HP 8/24 8Gb SAN (top of rack) switches which provide SAN connectivity to the HP 3PAR V400 storage system. Note that the Virtual Connect Fibre
24
Channel modules cannot be directly connected to the HP 3PAR V400 storage system and must be connected through SAN switches.
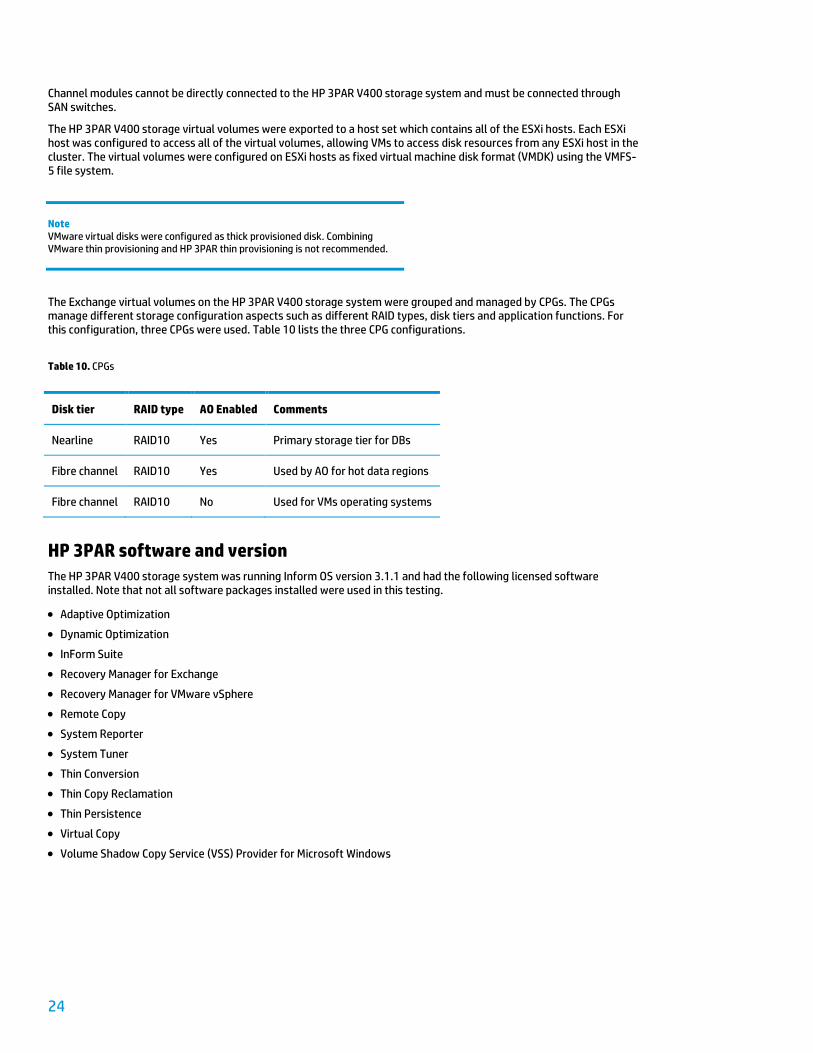
The HP 3PAR V400 storage virtual volumes were exported to a host set which contains all of the ESXi hosts. Each ESXi host was configured to access all of the virtual volumes, allowing VMs to access disk resources from any ESXi host in the cluster. The virtual volumes were configured on ESXi hosts as fixed virtual machine disk format (VMDK) using the VMFS-5 file system.
Note VMware virtual disks were configured as thick provisioned disk. Combining VMware thin provisioning and HP 3PAR thin provisioning is not recommended.
The Exchange virtual volumes on the HP 3PAR V400 storage system were grouped and managed by CPGs. The CPGs manage different storage configuration aspects such as different RAID types, disk tiers and application functions. For this configuration, three CPGs were used. Table 10 lists the three CPG configurations.
Table 10. CPGs
Disk tier RAID type AO Enabled Comments
Nearline RAID10 Yes Primary storage tier for DBs
Fibre channel RAID10 Yes Used by AO for hot data regions
Fibre channel RAID10 No Used for VMs operating systems
HP 3PAR software and version
The HP 3PAR V400 storage system was running Inform OS version 3.1.1 and had the following licensed software installed. Note that not all software packages installed were used in this testing.
Adaptive Optimization
Dynamic Optimization
InForm Suite
Recovery Manager for Exchange
Recovery Manager for VMware vSphere
Remote Copy
System Reporter
System Tuner
Thin Conversion
Thin Copy Reclamation
Thin Persistence
Virtual Copy
Volume Shadow Copy Service (VSS) Provider for Microsoft Windows

25
Exchange VMs
The Exchange VMs were installed with Windows Server 2008 R2 Enterprise SP1 and Exchange 2010 SP2. Each Exchange mailbox server was a member of a DAG and was configured with eight active databases and eight passive. The 16 database LUNs were presented to Windows and show as fully provisioned LUNs in Windows disk administrator and were configured as mount points.
Table 11. Exchange VM configurations
VM Role vCPU Memory LSI Logic SAS SCSI controller(s)
LUNs VMXNet3 Network adapters
Mailbox 4 vCPU 24 GB 4 16 2
HT/CAS 4 vCPU 12 GB 1 2 1
Note Due to large disk capacities (>20TB) the VMFS3.MaxHeapSizeMB needs to be increased on each ESXi server from 80 to 160.
Figure 11 provides a high-level diagram of the tested configuration, depicting the servers, storage, networking and SAN infrastructure.

26
Figure 11. High-level diagram of the tested configuration
Test results
The reference architecture testing was conducted in two phases, the first phase was to perform Exchange storage focused testing to validate sizing of the HP 3PAR V400 storage system. The Microsoft Exchange Jetstress 20103 tool (Jetstress) was used to test the storage performance by simulating Exchange databases IO patterns. Jetstress simulates the Exchange database and transaction log workloads while measuring disk performance to determine achievable read and write IOPS. Results were analyzed to verify that the storage subsystem has been adequately sized to support the number of users and their workload profile.
The second phase of testing used Microsoft Exchange Load Generator 20104 (LoadGen). LoadGen was used to simulate client load and to validate the server configuration or in this case the virtual machine environment. LoadGen tests the server performance by simulating load on a fully configured Exchange environment by generating client-messaging calendaring, search and task requests. Test results were then analyzed to verify that each ESXi virtual server configuration was adequately sized to support the number of users and their workload profile.
This reference architecture was designed to support 15,000 mailboxes using a 50 messages sent and received per day workload profile. Sizing calculations performed show that each mailbox VM required 360 database IOPS, 77 transaction log IOPS and 80 MB/s throughput for Background Database Maintenance (BDM). The entire Exchange environment including all five mailbox VMs requires approximately 2,185 transactional IOPS with 400MB/s throughput for BDM. Note that the Exchange databases and transaction logs were co-located on the same volume.
3 Version 14.01.0225.017 with Exchange SP2 ESE 4 Version 14.01.0218.011
27
One of the main goals of this configuration was to deploy thinly provisioned storage while providing the necessary performance IOPS for the Exchange workload. To accomplish this, the HP 3PAR V400 storage system has been configured with 48 2TB NL disks to support the capacity requirements of the thinly provisioned virtual volumes at initial deployment. Sizing was based on 15,000 mailboxes, each with an initial 250MB capacity. The 48 thinly provisioned Nearline disks do not provide all the IO performance required to support the workload. To bridge the performance gap, AO was used to tap into the faster FC disk tier for the added performance. The FC tier uses 64 15K disks that were not dedicated to Exchange, but AO will be able to use them for added disk performance.
While many solutions rely on FC for capacity and performance, this solution was designed to use the FC disks for extra performance during the initial TP deployment phase. As storage capacity requirements for the mailboxes increase over time, additional NL storage can be added. The additional NL storage will satisfy increased capacity requirements and addition IO performance to the wide striped virtual volumes. This added performance will lessen the IO performance demands from the FC tier.
Testing virtualized storage
Up until April 2012, Microsoft did not support submissions to the Exchange Solution Reviewed Program (ESRP) for storage testing in virtualized environments. This was due to concerns with inaccurate measurements from time based performance counters. However, with improvements in hypervisor technologies, time based counters are now more suitable for VM performance measurement. Microsoft now supports ESRP 3.0 submissions for the following hypervisors:
Microsoft Windows Hyper-V 2008 R2 (or newer)
Microsoft Windows Server 2008 R2 (or newer)
VMware ESX 4.1 (or newer)
For more information on storage validation in a virtual environment, go to: http://blogs.technet.com/b/exchange/archive/2012/04/02/storage-validation-in-a-virtual-world.aspx
Jetstress storage testing
For comparison purposes, two tests were conducted with Jetstress, in order to establish the storage performance before and after AO was used. The first tested the TP virtual volumes without AO enabled to establish a performance baseline for the 48 NL disks. This first test was run with a single server using the following settings:
Test type = performance
Duration = 2 hours
Number of databases = 8
Thread count = 7
Background database maintenance enabled
The test results indicate the storage solution was capable of producing 1,878 disk IOPS while maintaining disk read and write latencies below the 20ms threshold, which was below the minimum number of IOPS needed for the 15,000-mailbox reference architecture. Figure 12 and 13 detail the performance test summary information.

28
Figure 12. Jetstress performance baseline test
29
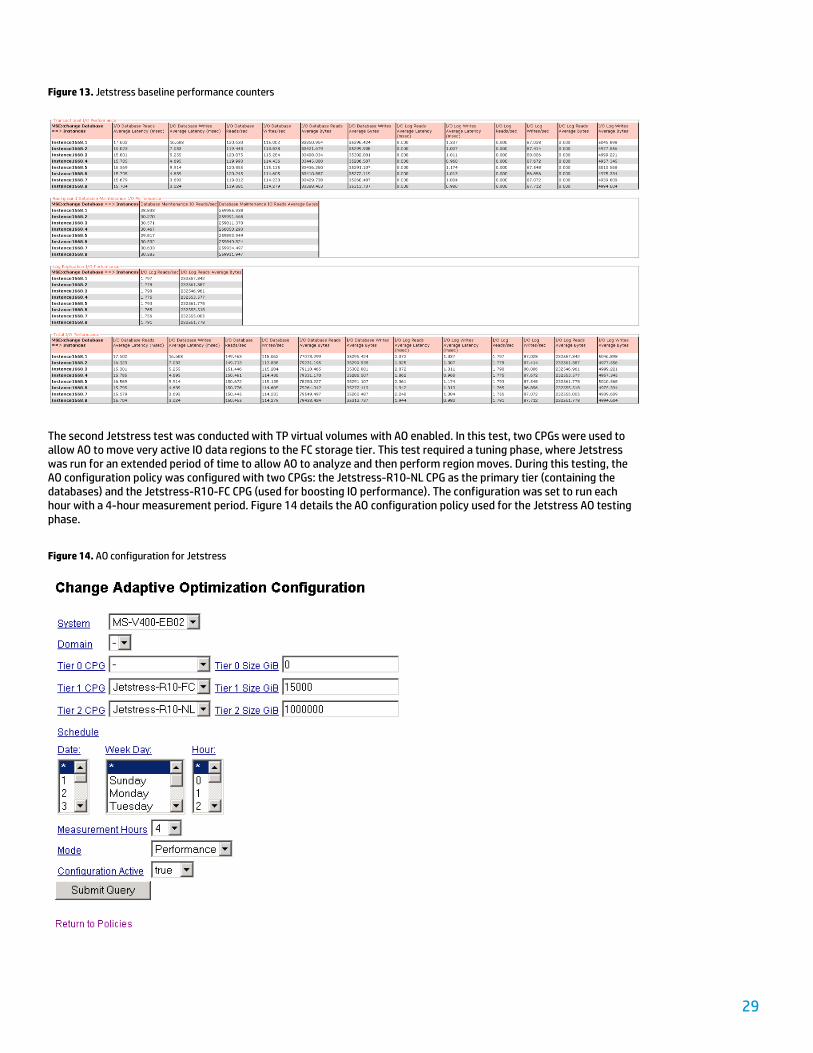
Figure 13. Jetstress baseline performance counters
The second Jetstress test was conducted with TP virtual volumes with AO enabled. In this test, two CPGs were used to allow AO to move very active IO data regions to the FC storage tier. This test required a tuning phase, where Jetstress was run for an extended period of time to allow AO to analyze and then perform region moves. During this testing, the AO configuration policy was configured with two CPGs: the Jetstress-R10-NL CPG as the primary tier (containing the databases) and the Jetstress-R10-FC CPG (used for boosting IO performance). The configuration was set to run each hour with a 4-hour measurement period. Figure 14 details the AO configuration policy used for the Jetstress AO testing phase.
Figure 14. AO configuration for Jetstress
30
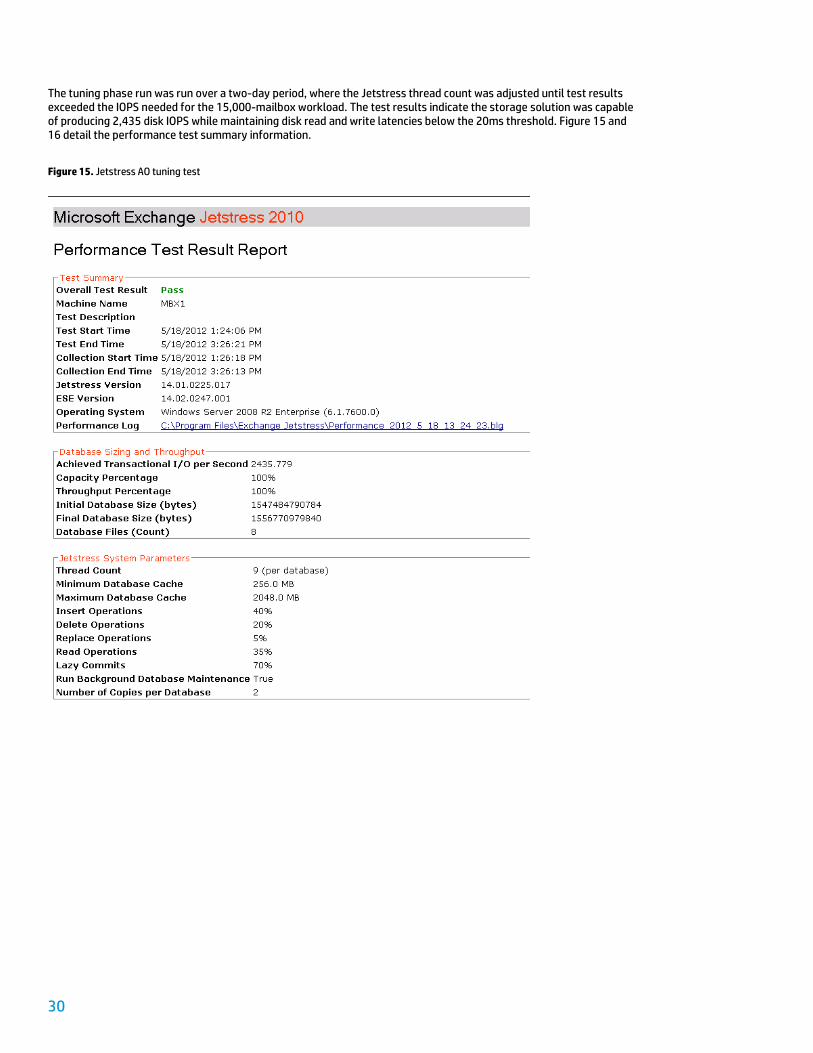
The tuning phase run was run over a two-day period, where the Jetstress thread count was adjusted until test results exceeded the IOPS needed for the 15,000-mailbox workload. The test results indicate the storage solution was capable of producing 2,435 disk IOPS while maintaining disk read and write latencies below the 20ms threshold. Figure 15 and 16 detail the performance test summary information.
Figure 15. Jetstress AO tuning test
31
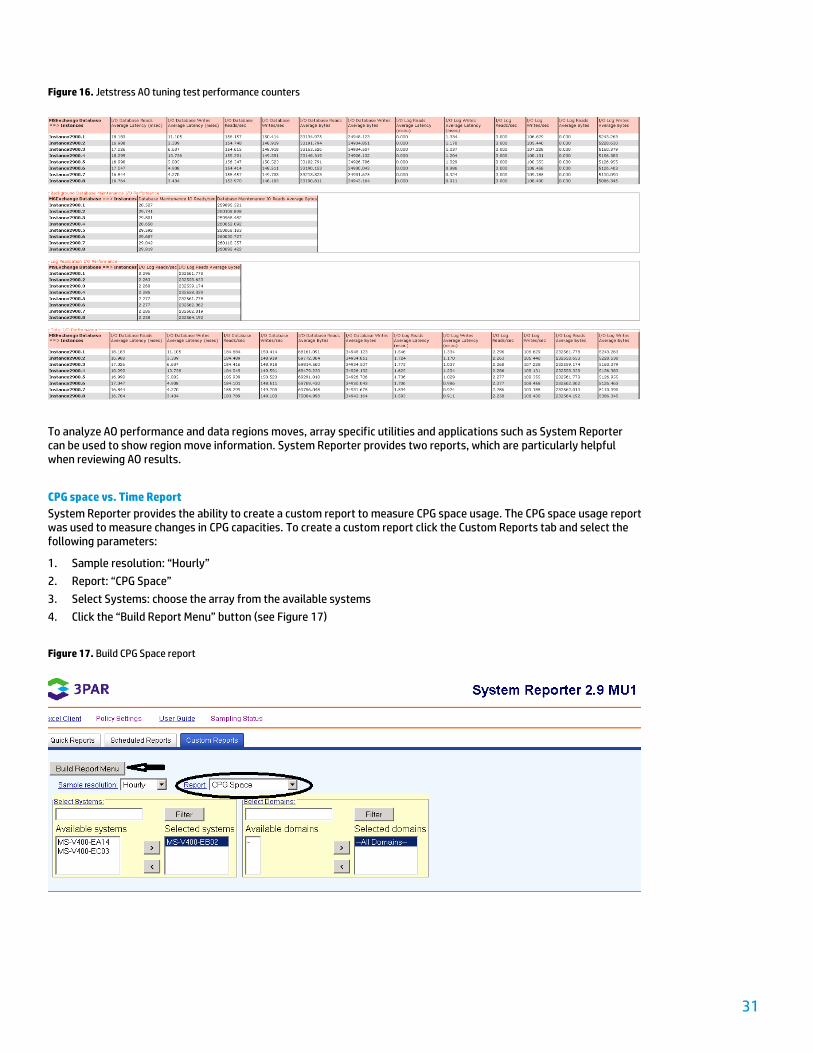
Figure 16. Jetstress AO tuning test performance counters
To analyze AO performance and data regions moves, array specific utilities and applications such as System Reporter can be used to show region move information. System Reporter provides two reports, which are particularly helpful when reviewing AO results.
CPG space vs. Time Report
System Reporter provides the ability to create a custom report to measure CPG space usage. The CPG space usage report was used to measure changes in CPG capacities. To create a custom report click the Custom Reports tab and select the following parameters:
1. Sample resolution: “Hourly”
2. Report: “CPG Space”
3. Select Systems: choose the array from the available systems
4. Click the “Build Report Menu” button (see Figure 17)
Figure 17. Build CPG Space report

32
A new Hourly CPG Space Usage screen will appear (see figure 18). From the new screen, configure the following sections:
1. Section 1, Report Selection, Compare option: CPG
2. Section 2, Time Selection: define Begin and End times
3. Section 3, Object Selection: select the Jetstress CPGs to be compared
4. Section 4, Format Selection: no changes were necessary
5. Use the “Generate Report” button to create the report.
Figure 18. Hourly CPG Space Usage

33
Figure 19 details the CPG Used Space graph, which shows the measurement of CPG Used Space during the Jetstress tuning phase. Initially the Jetstress databases were located entirely on the Jetstress-R10-NL CPG (denoted by the green line) and consumed approximately 1,400 GiB of logical disk space. During the tuning phase, the Jetstress-R10-FC CPG (denoted by the red line) grew to approximately 150 GiB as active IO regions were promoted to the FC tier. One important observation during the Jetstress testing was that CPG growth did not reach a steady state where both CPGs normalized after moving active data regions to the FC tier.
Note Space Units listed in the graphs are in Gibibytes, which calculates storage capacity using binary units instead of base 10. For more information go to: wikipedia.org/wiki/Gibibyte
Figure 19. CPG Used Space
Note Jetstress databases grow during testing phases, making it difficult to see a clearly defined AO steady state period. However, during LoadGen testing Exchange databases do not grow allowing a more clearly defined steady period to be measured on the CPG Used Space graph.

34
Adaptive Optimization – Region IO density report
The region IO density report shows the IO density distribution and capacity utilization between IO regions. This report is helpful in understanding how capacity is distributed between the CPGs and the active IO data regions. Figure 20 shows the first step in building a region IO density report from the System Reporter tool.
1. Select the Custom Reports tab
2. Sample resolution: “Hourly”
3. Report: “Adaptive Optimization”
4. Select Systems: choose the array from the available systems
5. Click the “Build Report Menu” button
Figure 20. Build Adaptive Optimization report

35
A new Hourly Adaptive Optimization screen will appear (see figure 21). From the new screen, configure the following sections:
1. Section 1, Report Selection, Report Type: “Region IO Density”
2. Section 2, Time Selection: define Begin and End times
3. Section 3, Object Selection: select the Jetstress CPGs to be compared
4. Section 4, Format Selection, Report Information: Charts and Table
5. Use the “Generate Report” button to create the report
Figure 21. Build Region IO Density report

36
Figure 22 shows the first histogram graph of IO rate density report space information for the tiered environment. Space is reported by CPG using stacked bar graphs. The green portion of the stacked bar data indicates the capacity on the Jetstress-R10-NL CPG tier, while the red portion of the stacked bar data indicates the capacity of data on the Jetstress-R10-FC CPG tier.
Looking at the histogram, nearly all capacity used by the Exchange CPGs was located in the 128 and 256 data regions (listed on x axis of the graph). The 128 data region consumes approximately 800 GiB and was nearly all on the NL storage tier. The 256 data region was divided between FC (~150GiB) and NL tier (~460 GiB). This information is helpful to initially understand how storage capacity is divided between the CPGs, but this graph must be combined with the other accompanying graph (shown next) to understand the overall impact for the Jetstress testing with AO.
Figure 22. Space distribution
The data regions are broken out from left to right with ever increasing IO rate densities. The IO rate density is the product of the IOPS value and 60 sec/min for a given data region. This provides a data region unit value of IO/(GiB * min). The first data region bucket contains the IO rate density from 0 up to 0.015625 IO/(GiB * min). The next and successive buckets are double the previous value.
Figure 23 is the second histogram of the AO region IO density report. This histogram graph shows the distribution of IO access across the data regions. Similar to space usage, nearly all the IO accesses were in the 128 and 256 data regions, however in this histogram, a majority of IO accesses were produced from the 256 data region. For this test, the NL CPG, generated 137,819 IO accesses (combine 128 and 256 data regions) while consuming a majority of the capacity. However, the FC CPG was producing 27,604 IO accesses while only consuming 150GiB of capacity.
Figure 23. IO access distribution

37
Note The Jetstress simulation generates IO across the entire database instead of creating a distribution across the IO data regions similar to how databases function in production environments. This behavior results in narrow distribution of IO accesses across the data region. LoadGen testing in the next section will demonstrate a wider distribution of IO regions more typical of production Exchange database access.
While certain characteristics of Jetstress make it more difficult to measure AO functionality, Jetstress does demonstrate the performance benefits AO for Exchange workloads. Jetstress results show that AO promoted only 150GiB of capacity to the FC tier while being able to boost the Jetstress transactional performance by 25% from approximately 1,878 IOPS in the baseline to 2,435 IOPS in the test with AO configured.
LoadGen simulation testing
In the LoadGen testing phase, several aspects of the reference architecture were evaluated. Testing measured storage performance as well as ESXi hypervisor and VM compute resources. LoadGen is rather complex to configure compared to Jetstress; however, LoadGen is designed to simulate workloads on a fully configured Exchange server environment. One of the key benefits of LoadGen is that it allows for a more complete set of test configurations to be measured and monitored beyond just the storage subsystem.
For this reference architecture, the entire Exchange 2010 environment was built out and configured. The solution used five mailbox VMs and five VMs with combined HT/CAS roles configured with the sizing specifications detailed in the Sizing the Exchange configuration section. Setup involved creating and initializing all 15,000 mailboxes with 250 MB mailbox capacities, creating and configuring the DAG with two copies of the 40 databases as well as preparing content indexing. The Exchange databases were also configured with circular logging and background database maintenance enabled.
Server configuration:
Windows Server 2008 R2 Enterprise SP1 (all servers)
Exchange Server 2010 SP2 (all Exchange server VMs)
2 Windows 2008 R2 Domain Controllers (supporting Active Directory and DNS functions)
5 ESXi 5 hosts configured in HA cluster (N+1 configuration)
5 Exchange mailbox VMs
5 HT/CAS VMs
5 LoadGen Client VMs
Network configuration:
Client traffic network (1 Gb)
Replication (4 Gb)
VMware HA network (1 Gb)
VMware vMotion network (4 Gb)
Storage configuration:
Total of 80 thinly provisioned virtual volumes were exported from the HP 3PAR V400 storage system to the ESXi cluster
Each mailbox server VM was presented with 16 LUNs, one LUN for each database and its associated transaction logs
Each mailbox server was configured with 8 active databases and 8 passive databases
Two CPGs were created for mailbox server data: EXCH-R10-NL and EXCH-R10-FC
The EXCH-R10-NL CPG was the primary CPG for the databases
38
AO configuration:
Tier 0 (SSD) not used
Tier 1 (FC)
Tier 2 (NL)
AO policy was scheduled to run once each day after the LoadGen 10 hour test completed
AO policy measurement period was 8 hours (measuring the last 8 hours of the LoadGen simulation)
AO policy Mode: performance
Note AO was configured to perform region moves after the LoadGen simulation completed, analyzing the last 8 hours of the LoadGen test.
LoadGen configuration:
8 hour simulation day
Total length of simulation 10 hours
Client type Outlook 2007 cached
Action profile Outlook_50
Mailbox profile 250 MB
Total five LoadGen clients used 3,000 users per client
LoadGen client started at 15-minute intervals to allow enough ramp time to logon all 15,000 users during each test session
CPG space vs. Time Report
Similar to the Jetstress testing, LoadGen simulation was run over a period of several days to allow AO to do the initial performance region moves to tune storage for the Exchange workload. LoadGen tests were run each day for 10 hours and AO was set to run at the completion of the simulation. Testing was monitored until AO reached steady state where CPG space moves normalized.
Figure 24 depicts the testing of LoadGen where normal workload has reached steady state. In this test scenario, the NL CPG capacity dropped from ~30,000 GiB to ~25,000 GiB while the FC CPG increased from 0 to ~5,000 GiB.
Once steady state was achieved, two additional tests were run to validate that the CFGs had normalized and were no longer increasing or decreasing significantly in size but maintaining active region moves.

39
Figure 24. LoadGen CPG used space graph
Adaptive Optimization – Region IO density report normal workload
Figure 25 shows the first histogram graph of IO rate density information for the tiered environment. The green portion of the stacked bar data indicates the EXCH-R10-NL CPG tier, while the red portion of the stacked bar data indicates the capacity of data on the EXCH-R10-FC CPG tier. As noted, all the Exchange databases were initially located on the NL tier, but during the tuning phase, the more active IO regions were promoted to the FC tier.
Looking at the histogram, there was a wide distribution of capacity across the IO rate density regions with approximately 25,000 GiB remaining on the NL storage with approximately 5,000 GiB being promoted to the FC tier.
Figure 25. Space distribution

40
Figure 26 is the second histogram of the AO region IO density report. This histogram shows the distribution of IO across the data regions. Similar to space usage, IO accesses were distributed over a wide range of data region buckets. However, the FC tier from which only 16% of the storage capacity was allocated to Exchange was providing nearly half of the IO accesses (~46%) servicing the LoadGen workload.
Figure 26. IO access distribution
Exchange performance validation
To verify that the storage subsystem is adequately servicing the Exchange workload, a series of Windows performance counters were evaluated. In this section, key Exchange performance counters are listed for each of the five mailbox VMs and five HT/CAS VMs. These counters were compared against established thresholds for Exchange 2010 to validate storage and server performance. The performance counters were started at the beginning of each test and run for the entire 10-hour test duration. Table 12 provides the Exchange performance and CPU counters for each of the five mailbox VMs. Note that the active databases Avg. Disk sec/Read values were below the 20ms threshold on each of the mailbox VMs.
Table 12. Exchange performance counters
Performance counter MB1 MB2 MB3 MB4 MB5 Target threshold
MSExchange Database:
I/O Database Reads (Attached) / Average Latency 10 7.7 7.9 9.2 9.3 <20 msec
I/O Database Reads (Attached) / sec 123.1 187.9 221 212.4 147.1
I/O Database Reads (Recovery) / Average Latency 16.4 28 22.8 26.7 20.5 <200 msec
I/O Database Reads (Recovery) / sec 75.7 55.6 79.1 74.8 70.1
I/O Database Writes (Attached) / Average Latency 2.5 2.2 2.3 2.3 2.5 <20 msec
I/O Database Writes (Attached) / sec 30.9 31.9 27.7 32.7 34

41
Performance counter MB1 MB2 MB3 MB4 MB5 Target threshold
I/O Database Writes (Recovery) / Average Latency 2.3 2.3 1.7 2.8 5 <200 msec
I/O Database Writes (Recovery) / sec 70.4 71.9 71.7 67.6 66.4
I/O Log Writes Average Latency 1.1 1 1.2 1.2 1 <10 msec
I/O Log Reads Average Latency 1.2 1.1 1 1 1.2 <200 msec
Database Page Faults Stalls/sec 0 0 0 0 0 <1
Log Record Stalls/sec 0 0 0 0 0 <10
MSExchangeIS (Information Store):
RPC Averaged Latency 3.4 3.3 3.2 3.5 3.4 <10 msec
RPC Operations / sec 825.1 811.9 798.7 817.5 865.4
RPC Packets / sec 377.8 372 336.6 375.2 396.8
RPC Requests 1.3 1.3 1.3 1.2 1.4 <70 at all times
MSExchangeIS Mailbox:
Messages Delivered / sec 4 3.9 3.9 4 4.1
Messages Sent / sec 1 0.98 0.97 1 0.69
Messages Queued for Submission 0.6 0.6 0.6 0.7 1 <50 at all times
MSExchange Replication:
CopyQueueLength 0.04 0.03 0.04 0.03 0.04 <1
ReplayQueueLength 2.9 3 3 2.7 3.7 <5
Processor
Processor Time 17.3 16.9 19.2 17.8 21.6 <80
Performance was measured and validated on the five Combined HT/CAS VMs. Table 13 list the key Exchange performance counters needed to monitor performance of the five HT/CAS VMs.

42
Table 13. Exchange HT/CAS counters
Performance counter HTCAS1 HTCAS2 HTCAS3 HTCAS4 HTCAS5 Target threshold
MSExchange RpcClientAccess
RPC Averaged Latency 9 10 9 9 9 <250 msec
RPC Requests 1.5 0.6 0.6 0.7 0.8 <40
Logical disks
Avg. Disk sec/Read 0 0.001 0.001 0.001 0 <20 msec
Avg. Disk sec/Write 0.001 0.001 0.001 0.001 0.001 <20 msec
MSExchangeTransport Queues
Active Mailbox Delivery Queue Length 0.4 0.3 0.3 0.3 0.4 <250
Retry Mailbox Delivery Queue Length 0 0 0 0 0 <100
Submission Queue Length 0 0 0 0 0 <100
Processor
Processor Time 8.8 15.4 6.9 6.5 6.8 <80
Exchange performance counters indicated that the Exchange VMs were well below the recommended warning thresholds indicating storage, processor and network resources were underutilized across the VMs and functioning normally.
Hypervisor performance
The vSphere configuration consists of a five-node high availability cluster. For testing purposes, the VMs were distributed in the following manner:
ESXi Node 1 was configured with four VMs (two mailbox VMs and two HT/CAS VMs)
ESXi Node 2 was configured with four VMs (two mailbox VMs and two HT/CAS VMs)
ESXi Node 3 was configured with two VMs (one mailbox and one HT/CAS VM)
ESXi Nodes 4 and 5 were not configured with VMs for this test scenario
During the LoadGen 15,000 user simulation test, performance was measured from the vCenter server to evaluate the ESXi hypervisor system resource usage. The ESXi virtual servers were evaluated to determine individual VM system resource demands as well as the entire system.

43
Figure 27 details CPU megacycle usage during the LoadGen testing for ESXi node 1. Results indicate that the CPU MHz usage during the LoadGen test steady state period averaged ~9,034 MHz which approximately 23.5% of the total available MHz for the system (2,400 MHz x 16 cores = 38,400 MHz) while supporting the two mailbox VMs and two HT CAS VMs.
The MHz usage was further broken down into the four individual VMs:
2,750 MHz Mailbox VM
2,771 MHz Mailbox VM
1,344 MHz HT/CAS VM
1,999 MHz HT/CAS VM
Figure 27. Node MHz usage
Results were similar for the ESXi node 2, which was also configured with two mailbox and two HT/CAS VMs with the second node usage approximately 8,787 MHz. The third node with only one mailbox and one HT/CAS VM only consumed ~4,528 MHz which was consistent with running half the number of VMs as the other two nodes.
Test results summary
This configuration has been tested using Jetstress and LoadGen to validate the ProLiant BL460c Gen8 server blades and the HP 3PAR V400 storage have been adequately sized for a Microsoft Exchange 2010 workload in a virtualized environment. The reference architecture test results demonstrated the effect of tuning the HP 3PAR V400 storage array using AO to support the Exchange 2010 workload using TP storage. Test results from both Jetstress and LoadGen highlight how a relatively small amount of FC storage capacity can boost transaction IO provided by the storage system to meet the requirements for the Exchange workload when deploying thin provisioning with NL disks. The solution provides a growth model that allows NL disks to be incrementally added as mailbox storage capacity requirements increase, which reduces the performance requirement from the FC disk tier.
With the BL460c Gen8 servers’ increased processor, memory and storage IO performance, each ESXi node was capable of supporting multiple large mailbox VMs. Sizing details demonstrated that the BL460c Gen8 server blades have enough headroom to support demanding Exchange workloads in a virtual environment. Under the 15,000 workload, the ESXi server running with four Exchange VMs consumed 25% less than the total available MHz for the physical server.

44
Bill of materials
Table 14 lists a bill of materials for the major server and storage hardware components needed for the five ESXi 5 vSphere servers, however this is not an exhaustive listing of all the necessary components needed to build a complete solution. For complete configuration details, please contact your HP Reseller or HP Sales Representative.
Table 14. Bill of materials
Quantity Description Part number
Server
5 HP BL460c Gen8 CTO Blade 641016-B21
5 HP BL460c Gen8 E5-2665 FIO Kit 667803-L21
5 HP BL460c Gen8 E5-2665 Kit 667803-B21
80 HP 8GB 1Rx4 PC3-12800R-11 Kit 647899-B21
10 HP 72GB 6G SAS 15K 2.5in SC ENT HDD 652597-B21
5 HP Flex-10 10Gb 2P 530FLB FIO Adptr 684211-B21
5 HP Fibre Channel 8Gb QMH2572 Adptr 651281-B21
1 HP BLc7000 Configure-to-order c-Class Enclosure AD361C
1 HP 6X 2400W Platinum Hot Plug Factory Integrated Power Supply Kit 517521-B22
1 HP BLc7000 3 PH FIO Power Module Option 413380-B21
1 HP Active Cool 200 Fan Bundle, FIO 517520-B21
1 HP BLc7000 Onboard Administrator with KVM Option 456204-B21
2 HP Virtual Connect Flex-10 10Gb Ethernet Module for c-Class BladeSystem 455880-B21
2 HP Virtual Connect 8Gb 20-port Fibre Channel Module for c-Class BladeSystem 572018-B21
SAN Switches
2 HP 8/24 Base 16-ports Enabled SAN Switch AM868A
16 HP 8Gb Shortwave B-series FC SFP+ 1 Pack AJ716A
8 HP 15m Multi-mode OM3 LC/LC FC Cable AJ837A

45
Quantity Description Part number
Storage
1 HP P10000 3PAR V400 NEMA Base QR584A
6 HP P10000 3PAR 4-Port FC Adapter QR591A
1 HP 3PAR Thin Suite 1TB LTU TE923B
16 HP 3PAR InForm V400/4x600GB 15K Mag LTU TE839A
12 HP 3PAR InForm V400/4x2TB 7.2K Mag LTU TE837A
16 HP 3PAR Opt Ste V400/4x600GB 15K Mag LTU TE849A
12 HP 3PAR Opt Ste V400/4x2TB 7.2K Mag LTU TE847A
1 HP 3PAR System Reporter V400 LTU TE921A
1 HP 3PAR System Reporter Media Kit TE087B
4 HP P10000 3PAR 40-Drive Chassis QR592A
16 HP P10000 3PAR 4x600GB 15K FC Magazine QR622A
12 HP P10000 3PAR 4x2TB 7.2K Magazine QR623A
Key findings from HP 3PAR Storage testing with VMware in Exchange environments
Below are the key findings from HP 3PAR Storage testing with VMware and how they relate to customer challenges in Exchange 2010 environments.
Thin provisioning increases storage system efficiency by optimizing capacity utilization in Exchange environments. It addresses capacity over-allocation by eliminating the need to dedicate storage capacity up-front. With HP 3PAR Thin Suite, users save money on up-front capital expenditures for their Exchange environments. It also ensures that existing storage capacity is highly utilized and maximizes energy efficiency.
By deploying Adaptive Optimization in Exchange environments, highly accessed data regions can be moved to faster storage tiers. Adaptive Optimization delivers sub-volume optimization that reduces storage costs by meeting stringent performance requirements with fewer high performance disks. Expensive Fibre Channel drives can be used to support performance requirements while economical, widely striped Nearline drives are used to meet capacity requirements.
The highly scalable BL460c Gen8 server is capable of handling the workload demands of virtualized Exchange servers. The BL460c Gen8 server provides both the CPU and memory resources needed to support multiple large virtualized Exchange servers on a single physical host server. Virtualization offers many benefits to IT organizations that are looking to increase flexibility when deploying Exchange and to decrease operational costs when adapting to changing business requirements.
46
Implementing a proof-of-concept
As a matter of best practice for all deployments, HP recommends implementing a proof-of-concept test environment that matches the planned production environment as closely as possible. In this way, appropriate configuration and solution deployment can be obtained. For help with a proof-of-concept, contact an HP Services representative or your HP partner (hp.com/large/contact/enterprise/index.html)
Summary
Based on lab tested data, this reference architecture describes the details to support sizing Exchange 2010 SP2 running in a virtualized environment using ProLiant BL460c Gen8 server blades and the HP 3PAR V400 storage system. The solution displays sizing and configuration guidance for a 15,000-mailbox environment running on VMware vSphere 5. The reference architecture highlights scalability features of the ProLiant Gen8 servers running multiple Exchange VMs in a vSphere HA cluster. The reference architecture also details how to deploy thinly provisioned storage for Exchange, using the HP 3PAR Adaptive Optimization functionality with tiered storage. The solution showcases how AO can be used to balance both capacity and performance needs for Exchange workloads across both high capacity NL and high performance FC disk storage.
To understand how the solution performs, the reference architecture was tested using both Microsoft Jetstress and LoadGen Exchange simulation tools to demonstrate server and storage performance. The Jetstress 2010 tool was used to test the HP 3PAR V400 storage system performance by simulating Exchange databases IO patterns. The results validated that the thinly provisioned storage configuration was adequately sized to support the number of users and their Exchange 2010 workload profile.
The LoadGen tool was used to validate the virtual machine environment. LoadGen tests the server performance by simulating load on a fully configured Exchange environment by generating client-messaging requests. Test results demonstrated that ProLiant BL460c Gen8 servers were adequately sized to support the virtualized Exchange configuration.
For more information
HP BladeSystem, hp.com/go/blades
HP ProLiant, hp.com/go/ProLiant
HP Servers, hp.com/go/servers
HP 3PAR P10000 Storage Systems, hp.com/go/P10000
HP 3PAR Storage Family, hp.com/go/3PAR
HP Storage, hp.com/go/storage
To help us improve our documents, please provide feedback at hp.com/solutions/feedback.
Get connected hp.com/go/getconnected
Current HP driver, support, and security alerts delivered directly to your desktop
© Copyright 2012 Hewlett-Packard Development Company, L.P. The information contained herein is subject to change without notice. The only warranties for HP products and services are set forth in the express warranty statements accompanying such products and services. Nothing herein should be construed as constituting an additional warranty. HP shall not be liable for technical or editorial errors or omissions contained herein.
Microsoft and Windows are U.S. registered trademarks of Microsoft Corporation. Intel and Xeon are trademarks of Intel Corporation in the U.S. and other countries.
4AA4-3845ENW, Created September 2012