GRI-96/0182 rr DOE Boonsville 3-D Seismic Data Set A Technology Transfer Product Generated as Part of the Secondary Gas Recovery Project Bob A. Hardage, James L. Simmons, Jr., David E. Lancaster, Robert Y. Elphick, Richard D. Edson, and David L. Carr Supported by Gas Research Institute, the U.S. Department of Energy. and the State of Texas Bureau of Economic Geology Noel Tyler, Director The University of Texas at Austin Austin. Texas 78713-8924 1996

Welcome message from author
This document is posted to help you gain knowledge. Please leave a comment to let me know what you think about it! Share it to your friends and learn new things together.
Transcript
GRI-96/0182 rr DOE
Boonsville 3-D Seismic Data Set
A Technology Transfer Product Generated as Part of the Secondary Gas Recovery Project
Bob A. Hardage, James L. Simmons, Jr., David E. Lancaster, Robert Y. Elphick, Richard D. Edson, and David L. Carr
Supported by Gas Research Institute, the U.S. Department of Energy. and the State of Texas
Bureau of Economic Geology Noel Tyler, Director The University of Texas at Austin Austin. Texas 78713-8924
1996

GRI-96/0182 Grl ® DOE
Boonsville 3-D Seismic Data Set
A Technology Transfer Product Generated as Part of the Secondary Gas Recovery Project
Bob A. Hardage.1 James L. Simmons. Jr.,1 David E. Lancaster.2 Robert Y. Elphick.3 Richard D. Edson,1 and David L. Carr4
1 Bureau of Economic Geology. The University of Texas at Austin 2S. A. Holditch & Associates. Inc., College Station. Texas 3Scientific Software-Intercomp, Inc.. Denver. Colorado 4Consulting Geologist, Austin. Texas
Supported by Gas Research Institute, the U.S. Department of Energy.
and the State of Texas
Bureau of Economic Geology Noel Tyler, Director
The University of Texas at Austin Austin. Texas 78713-8924
1996

Legal Notice This seismic and well log data set was prepared by the Bureau of Economic Geology as an
account of work sponsored by Gas Research Institute (GRI). Neither GRI, members of GRI, nor any person or organization acting on behalf of either
a. Makes any warranty or representation, express or implied, with respect to the accuracy, completeness, or usefulness of the information contained in this seismic and well log data set, or that the use of any information, apparatus, method, or process disclosed in this seismic and well log data set may not infringe privately owned rights, or
b. Assumes any liability with respect to the use of, or for any and all damages resulting from the use of, any information, apparatus, method, or process disclosed in this seismic and well log data set.
This technology transfer product contains the following:
• 5.5 mil of time-migrated 3-D seismic data, • digitized well log curves from 38 wells inside this 3-D seismic grid, • depths to the boundaries of many Bend Conglomerate genetic sequences interpreted
from these logs, • perforation depths, reservoir pressures, and production and petrophysical data for the
38 wells, and • vertical seismic profile (VSP) data and explosive-source checkshot data recorded in a
calibration well near the center of the seismic grid.
Use of the data:
We encourage use of this data set and welcome suggestions for the development of future digital products. This data set may be used for research and demonstration purposes provided that the authors, publisher, and supporting organizations are acknowledged. Components of this data set are considered a single product for use on one computer by one user. Any requests to use these data in any other way must be made in writing to the Director, Bureau of Economic Geology, The University of Texas at Austin.
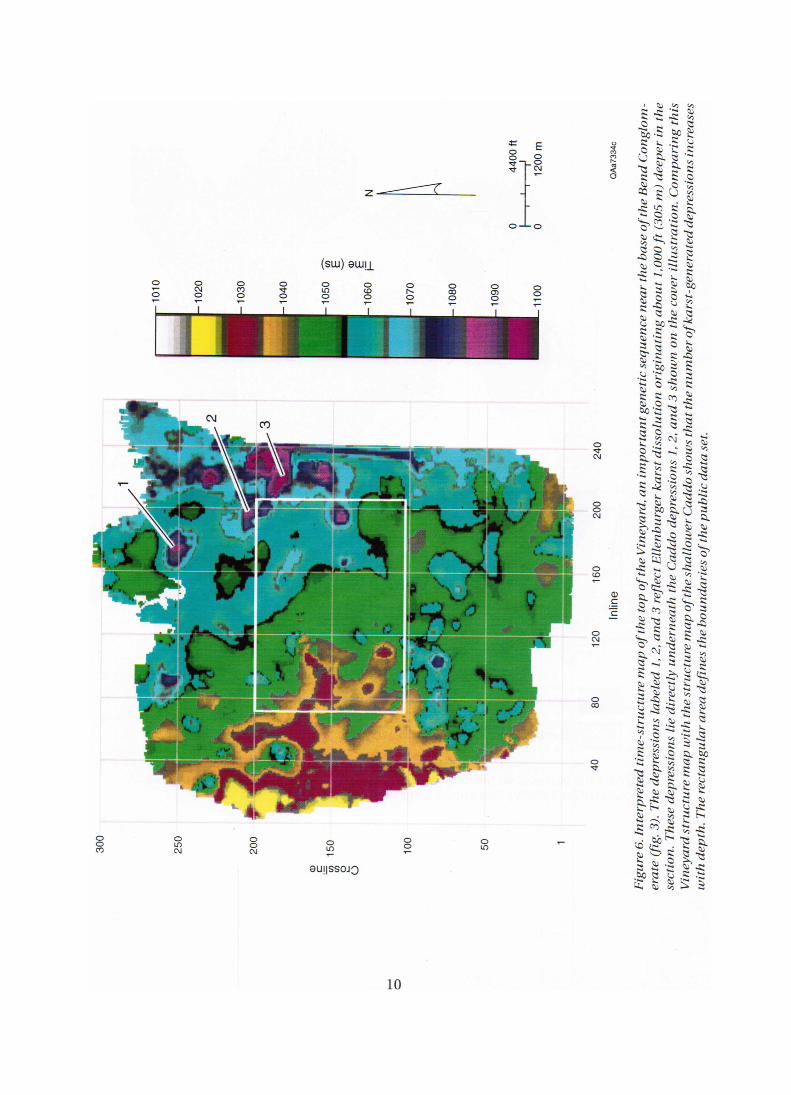
Cover: Interpreted time-structure map of the top of the Caddo, which is the shallowest genetic sequence in the productive Bend Conglomerate section (fig. 3). Features 1, 2, and 3 are circular depressions created by karst dissolution and collapse in the Ellenburger carbonates (Ordovician) some 2,000 to 2,500 ft (610 to 760 m) below this siliciclastic Caddo (Middle Pennsylvanian) sequence. The downward continu-ation of these karst-generated collapse features appears in figure 6 in the text, which is the time-structure map of the top of the Vineyard sequence approximately 1,000 ft (305 m) below the Caddo (fig. 3).
Contents Summary 1
Project study area 2
Overview of public data base area 2
Detailed map of public data base area 3
3-D seismic data 3
Well log data 3
Sequence stratigraphy information 3
Reservoir engineering data 4
VSP and checkshot data 4
Acknowledgments 34
References 34
Appendix 35
Figures
1. Middle Pennsylvanian paleogeographic map showing the Fort Worth Basin and other basins related to the Ouachita orogeny and the Boonsville project area 5
2. Generalized stratigraphic column for the Fort Worth Basin 6 3. Stratigraphic nomenclature used to define Bend Conglomerate genetic
sequences in Boonsville field 7 4. Number of net-pay intervals occurring between the Caddo and Vineyard
sequences across the Boonsville study area 8 5. Distribution of net hydrocarbon feet between the Caddo and Vineyard
sequences 9 6. Interpreted time-structure map of the top of the Vineyard sequence 10 7. Seismic reflection amplitude response on the Vineyard surface 11 8. Seismic profile ABC 12 9. Map of public data set area showing inline and crossline coordinates of
the 3-D seismic grid and locations of the wells within the grid 13
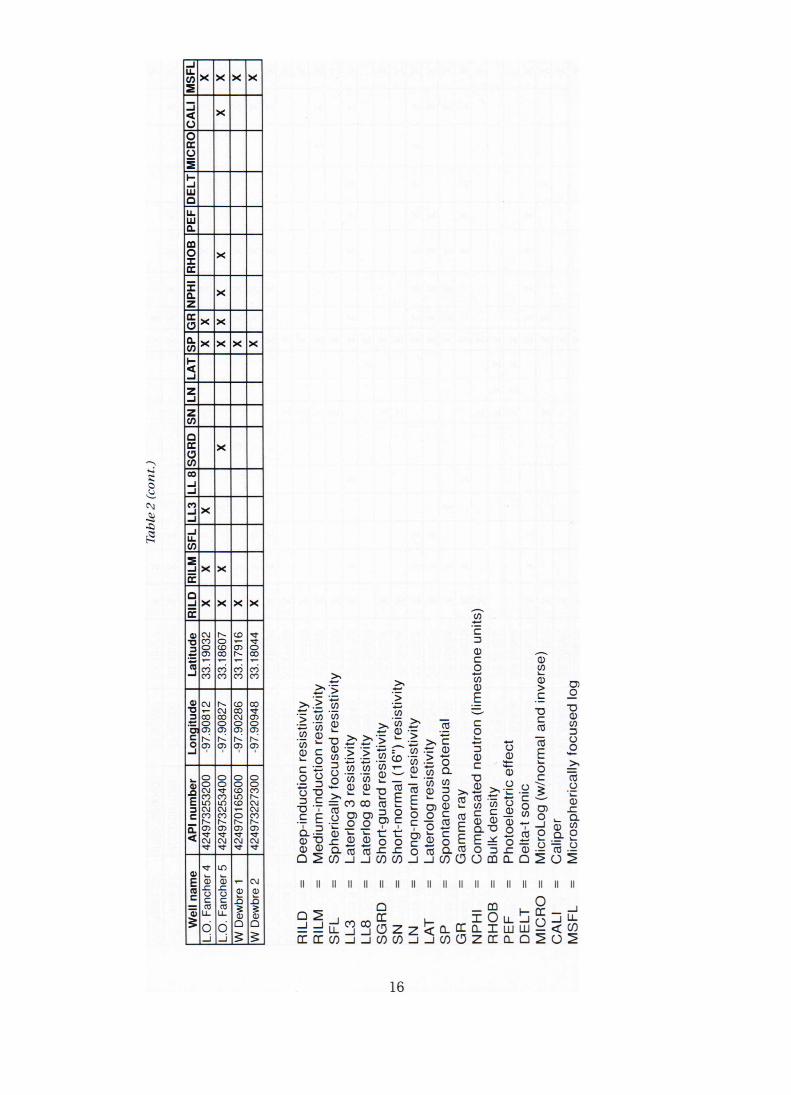
Tables
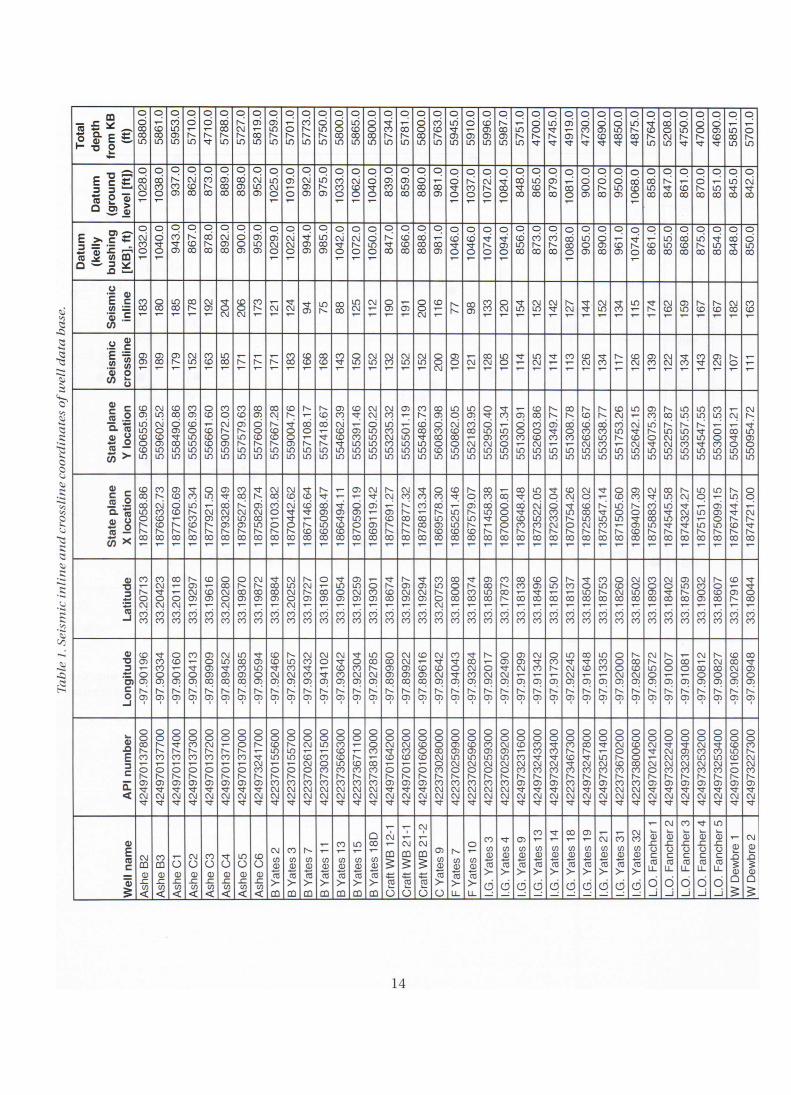
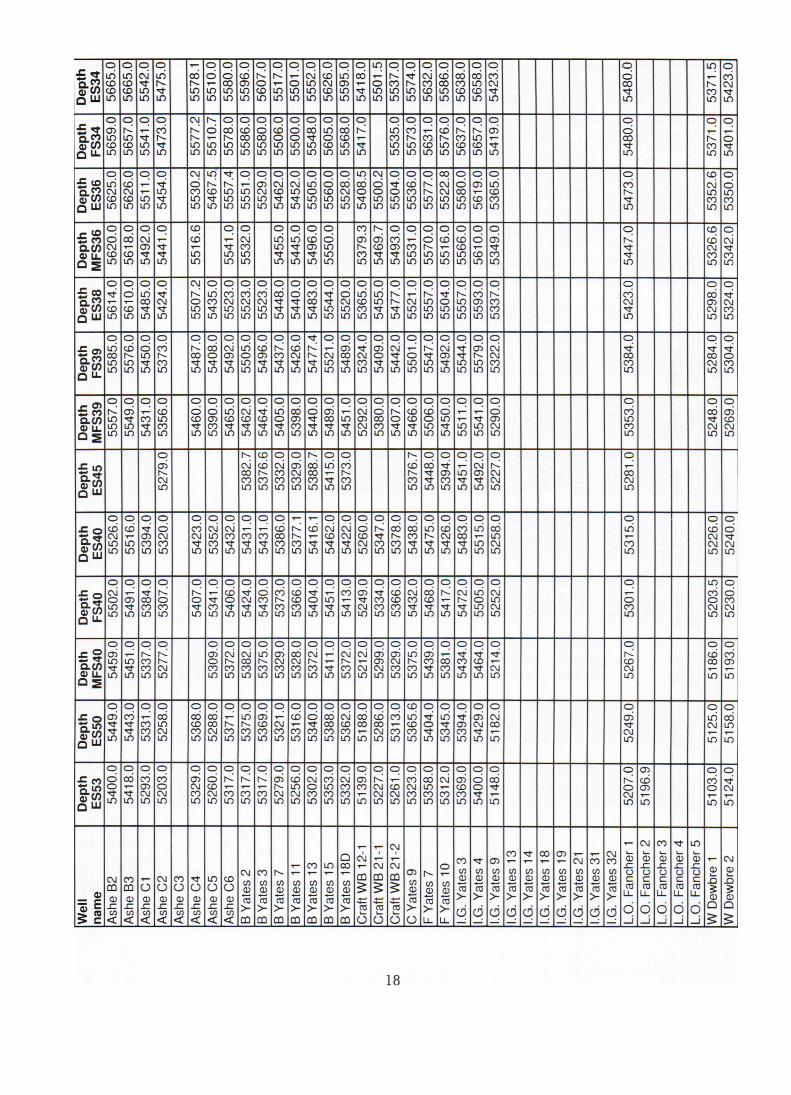
1. Seismic inline and crossline coordinates of well data base 14 2. Digital log data provided for wells 15 3. Boonsville public data set log depths of interpreted genetic sequence boundaries 17 4. Perforation, production, pressure, and petrophysical data 20 5. Velocity checkshot data 32
iii

Summary This 3-D seismic data set is made publicly available as a part of the technology transfer
activities of the Secondary Gas Recovery (SGR) program funded by the U.S. Department of Energy and the Gas Research Institute. The data are a significant part of the total data base amassed during a 2-year SGR study of the Bend Conglomerate reservoir system in Boonsville field, located in the Fort Worth Basin of North-Central Texas.
The objective of this publication is to provide the public with an affordable copy of digital 3-D seismic data, together with supporting geologic and reservoir engineering information, which can be used for educational and training purposes for a broad range of industry and academic interests. This data set should be particularly appealing because the 3-D seismic data have a high signal-to-noise ratio and a wide frequency range of approximately 10 to 115 Hz. When coupled with the geologic and engineering control provided with this publication, the 3-D data present a challenging opportunity to study a complex reservoir system of genetic sequences (sensu Galloway, 1989) that were deposited in a low- to moderate-accommodation basinal setting. The 3-D data also show how karstification of deep Ellenburger carbonates has generated collapse structures that have compartmentalized siliciclastic Bend Conglomerate reservoirs 2,000 to 2,500 ft (610 to 760 m) above the depths where the collapse structures originated, which is perhaps the most important geological phenomenon represented by these Boonsville data.
This public data set consists of the following components: • 5.5 mil of time-migrated 3-D seismic data, • digitized well log curves from 38 wells inside this 3-D seismic grid, • depths to the boundaries of many Bend Conglomerate genetic sequences interpreted
from these logs, • perforation depths, reservoir pressures, and production and petrophysical data for
the 38 wells, and • vertical seismic profile (VSP) data and explosive-source checkshot data recorded in
a calibration well near the center of the seismic grid.
The 3-D seismic data are provided on an Exabyte tape in SEGY format; the digital well log data are ASCII files on 3.5-inch floppy disks; well completion, production, pressure, and petrophysical data are provided as a digital spreadsheet file on the disks and also as a tabular listing (table 4); VSP data are digital SEGY files on the disks; and all other geologic and geophysical data are given in tables 3 and 5.
Anyone who benefits from the public availability of these data should be particularly appreciative of three companies—Arch Petroleum (and their production company, Threshold Production), Enserch, and OXY USA, Inc. Collectively, these three companies operated all of the property inside the SGR Boonsville study area, and they were industry partners with the Bureau of Economic Geology in the reservoir characterization study that amassed this data set. Arch, Enserch, and OXY paid approximately 90 percent of the cost of the 3-D seismic data acquisition and processing, yet they are graciously allowing the public to have access to, and to benefit from, these data.
Keywords: 3-D seismic technology, karst phenomena, reservoir characterization, sequence stratigraphy
1
Project Study Area
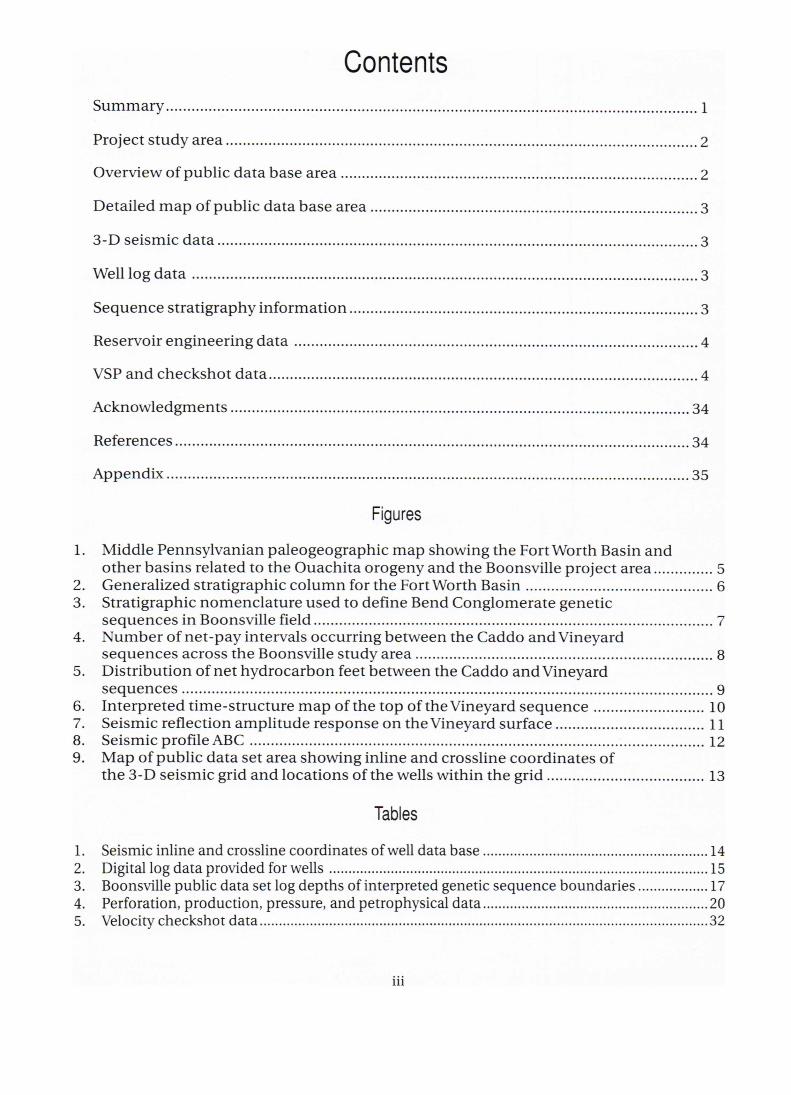
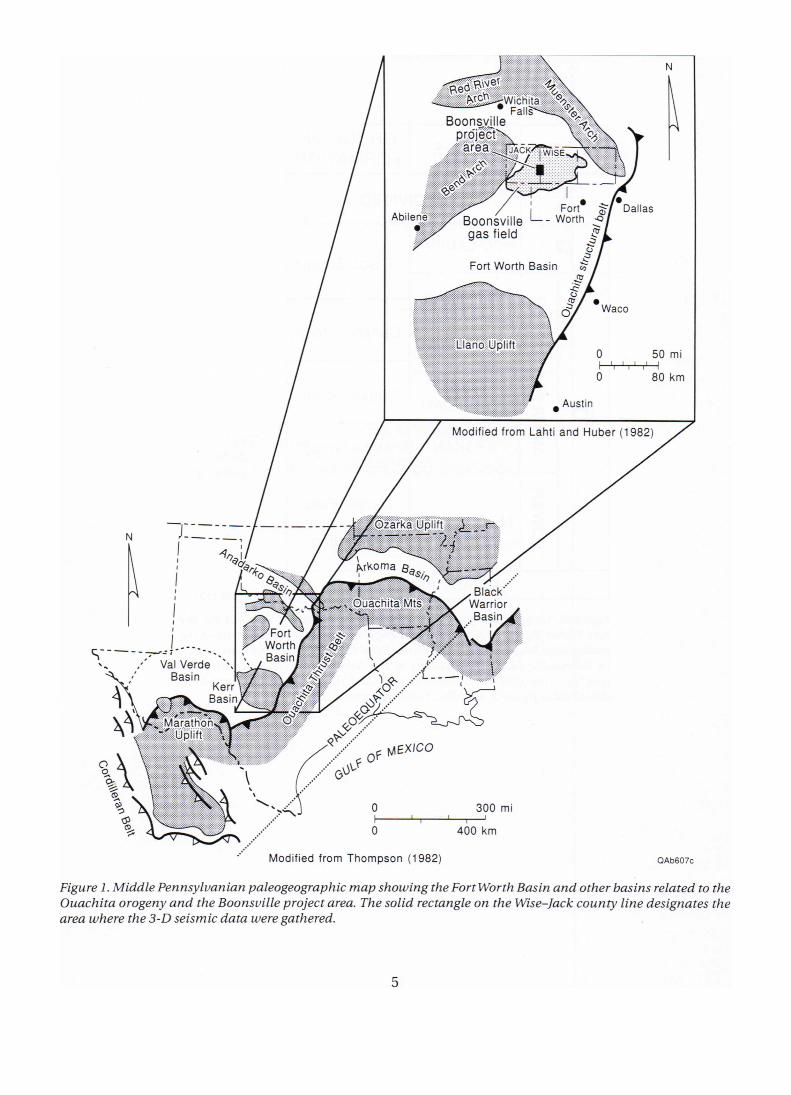
The SGR Boonsville study area is located in Jack and Wise Counties in the Fort Worth Basin in North-Central Texas (fig. 1). The accomplish-ments achieved in the 2-year study of this project area are described in a two-volume report by Hardage and others (1995), which is publicly available through the Gas Research Institute (phone 312-399-4601).
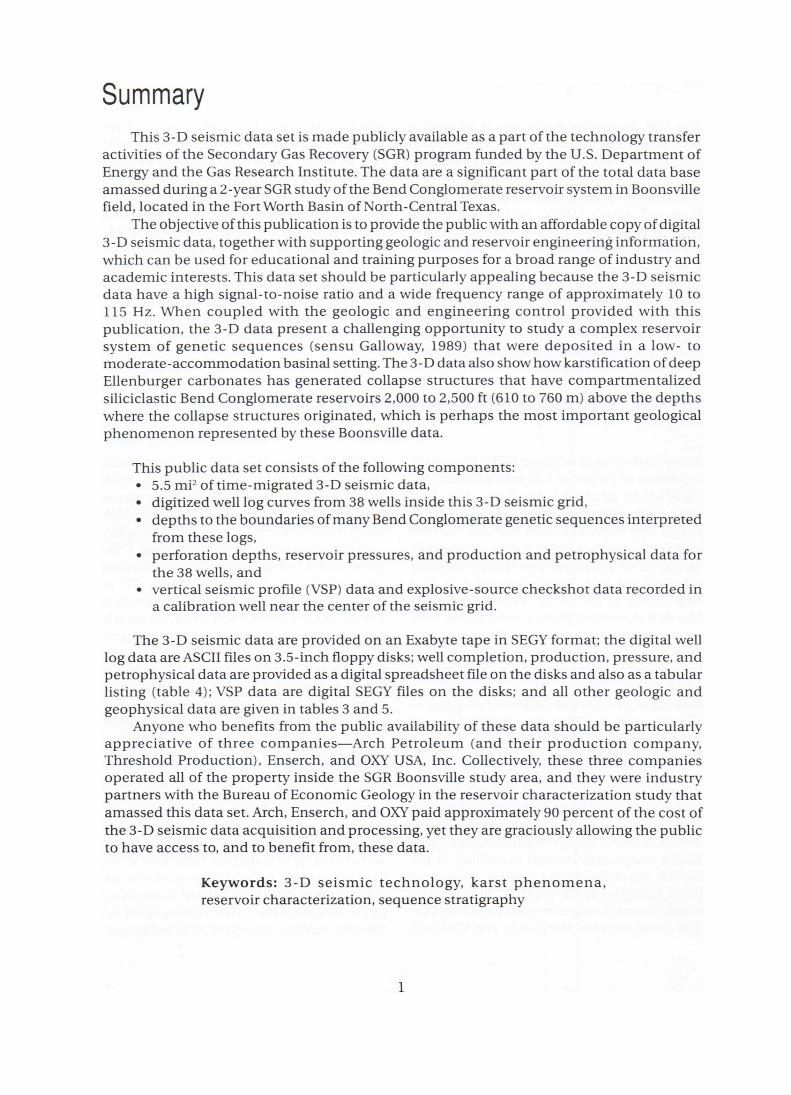
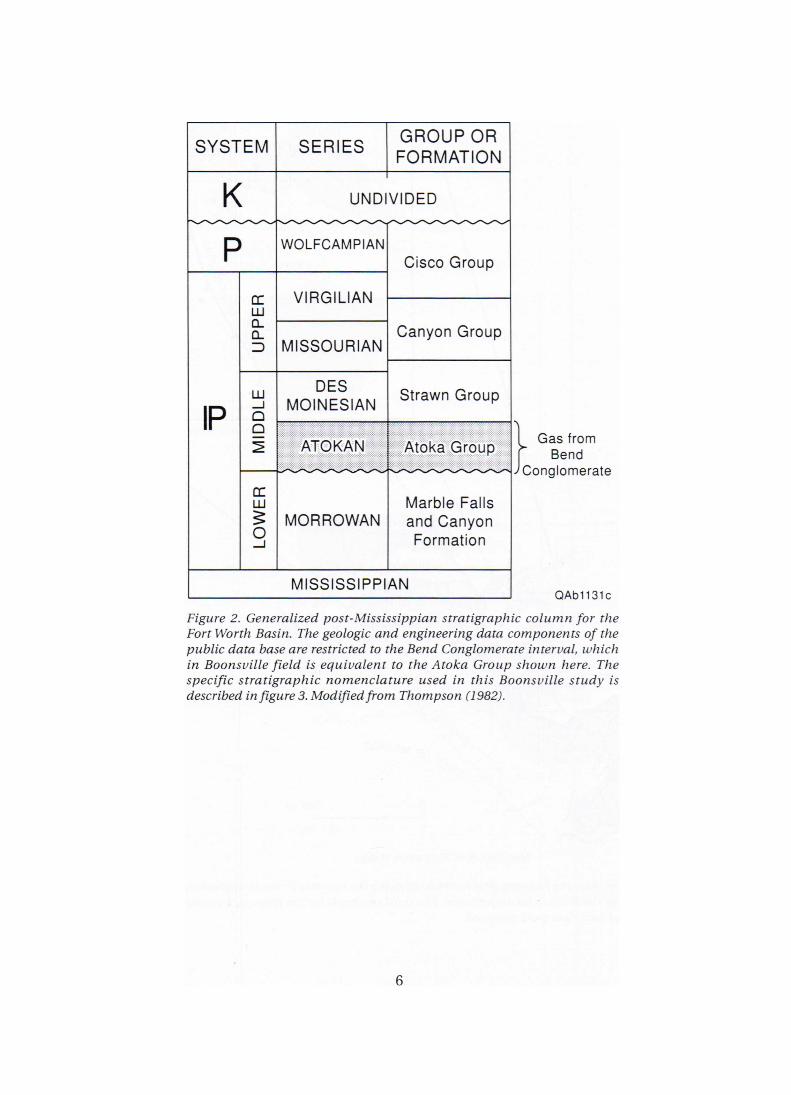
A generalized post-Mississippian descrip-tion of the stratigraphy of the Fort Worth Basin is shown by the stratigraphic column in figure 2. Several formations, extending from the Ellen-burger (Ordovician) to the Strawn (Middle Pennsylvanian), produce hydrocarbons in the
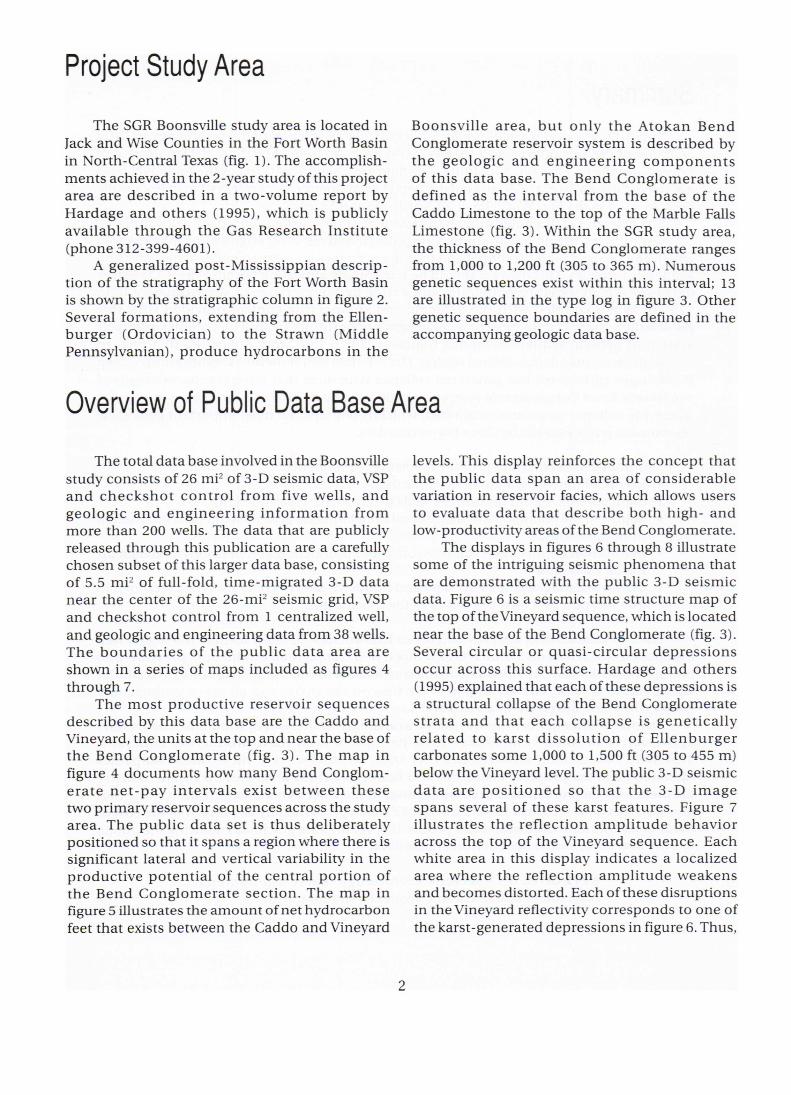
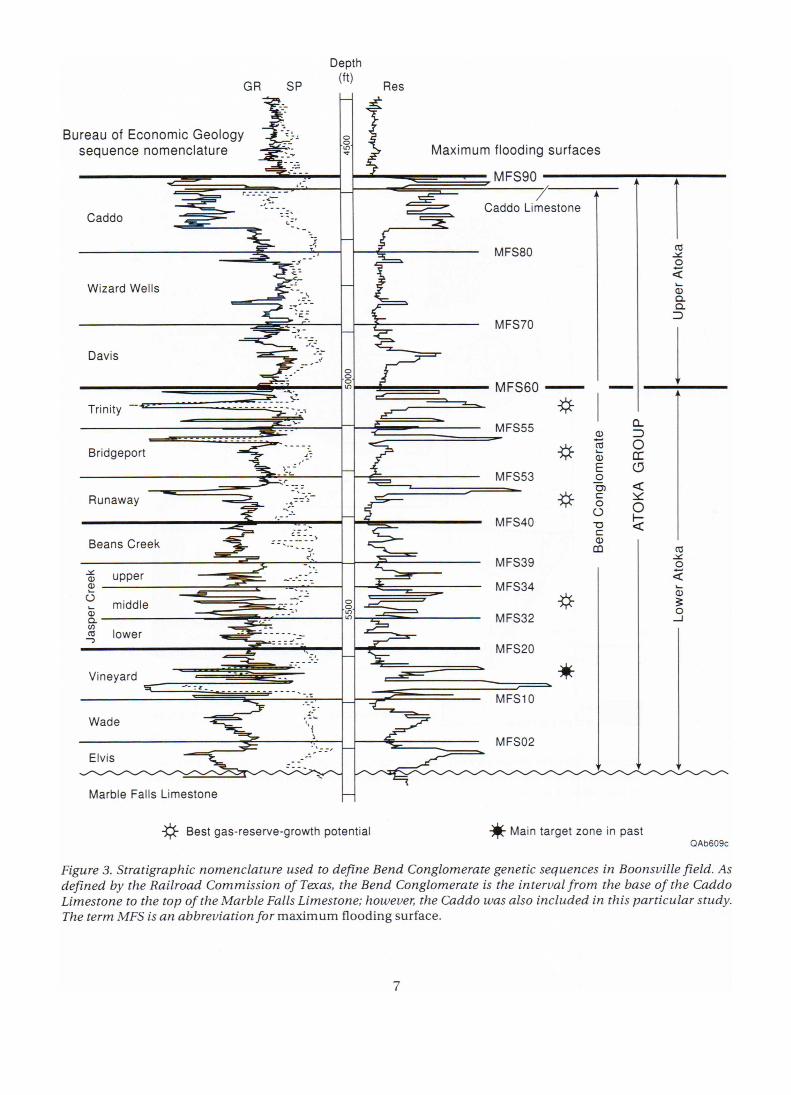
Boonsville area, but only the Atokan Bend Conglomerate reservoir system is described by the geologic and engineering components of this data base. The Bend Conglomerate is defined as the interval from the base of the Caddo Limestone to the top of the Marble Falls Limestone (fig. 3). Within the SGR study area, the thickness of the Bend Conglomerate ranges from 1,000 to 1,200 ft (305 to 365 m). Numerous genetic sequences exist within this interval; 13 are illustrated in the type log in figure 3. Other genetic sequence boundaries are defined in the accompanying geologic data base.
Overview of Public Data Base Area
The total data base involved in the Boonsville study consists of 26 mil of 3-D seismic data, VSP and checkshot control from five wells, and geologic and engineering information from more than 200 wells. The data that are publicly released through this publication are a carefully chosen subset of this larger data base, consisting of 5.5 mil of full-fold, time-migrated 3-D data near the center of the 26-mil seismic grid, VSP and checkshot control from 1 centralized well, and geologic and engineering data from 38 wells. The boundaries of the public data area are shown in a series of maps included as figures 4 through 7.
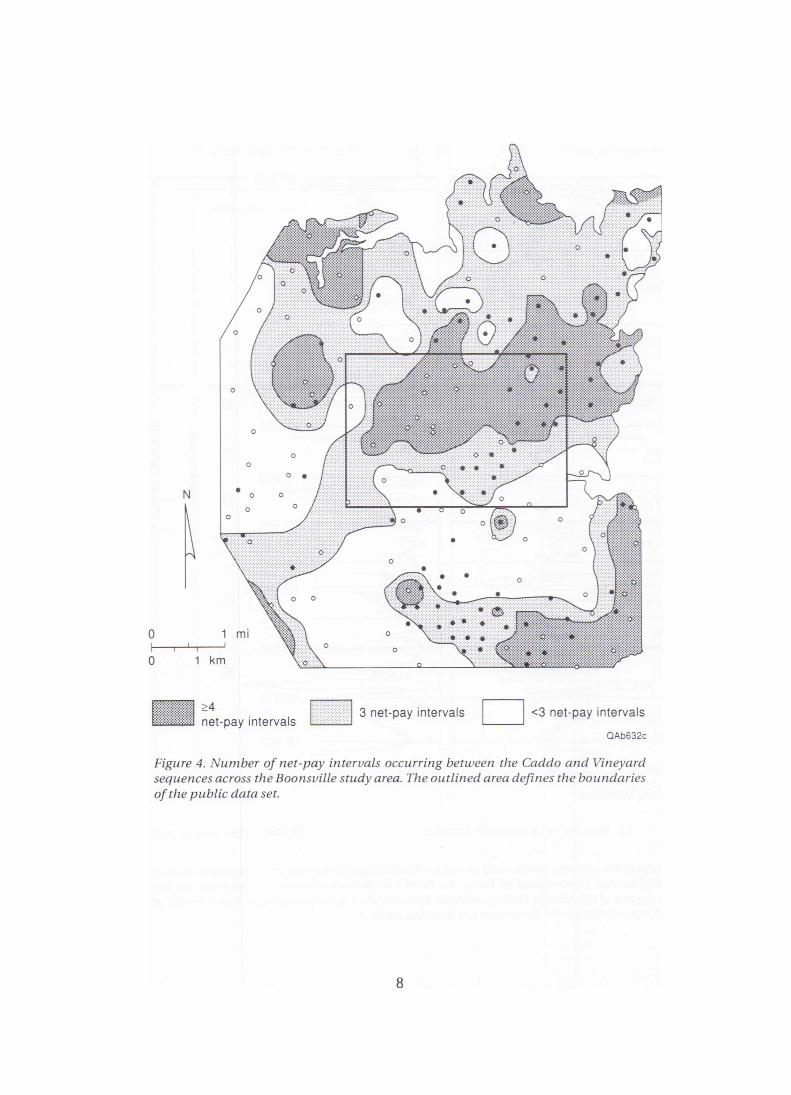
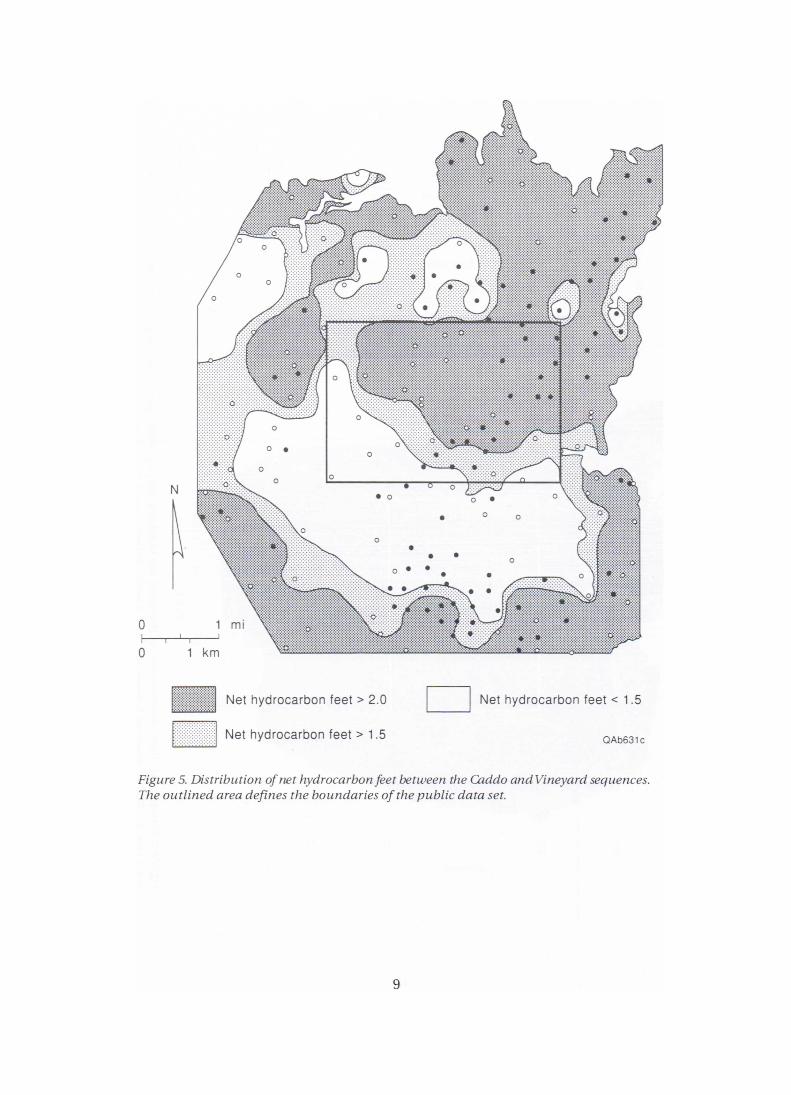
The most productive reservoir sequences described by this data base are the Caddo and Vineyard, the units at the top and near the base of the Bend Conglomerate (fig. 3). The map in figure 4 documents how many Bend Conglom-erate net-pay intervals exist between these two primary reservoir sequences across the study area. The public data set is thus deliberately positioned so that it spans a region where there is significant lateral and vertical variability in the productive potential of the central portion of the Bend Conglomerate section. The map in figure 5 illustrates the amount of net hydrocarbon feet that exists between the Caddo and Vineyard
levels. This display reinforces the concept that the public data span an area of considerable variation in reservoir facies, which allows users to evaluate data that describe both high- and low-productivity areas of the Bend Conglomerate.
The displays in figures 6 through 8 illustrate some of the intriguing seismic phenomena that are demonstrated with the public 3-D seismic data. Figure 6 is a seismic time structure map of the top of the Vineyard sequence, which is located near the base of the Bend Conglomerate (fig. 3). Several circular or quasi-circular depressions occur across this surface. Hardage and others (1995) explained that each of these depressions is a structural collapse of the Bend Conglomerate strata and that each collapse is genetically related to karst dissolution of Ellenburger carbonates some 1,000 to 1,500 ft (305 to 455 m) below the Vineyard level. The public 3-D seismic data are positioned so that the 3-D image spans several of these karst features. Figure 7 illustrates the reflection amplitude behavior across the top of the Vineyard sequence. Each white area in this display indicates a localized area where the reflection amplitude weakens and becomes distorted. Each of these disruptions in the Vineyard reflectivity corresponds to one of the karst-generated depressions in figure 6. Thus,
2
the public 3-D seismic data allow the reflection character of several of these karst phenomena to be studied in detail by those who wish to understand how deep carbonate dissolution affects overlying strata.
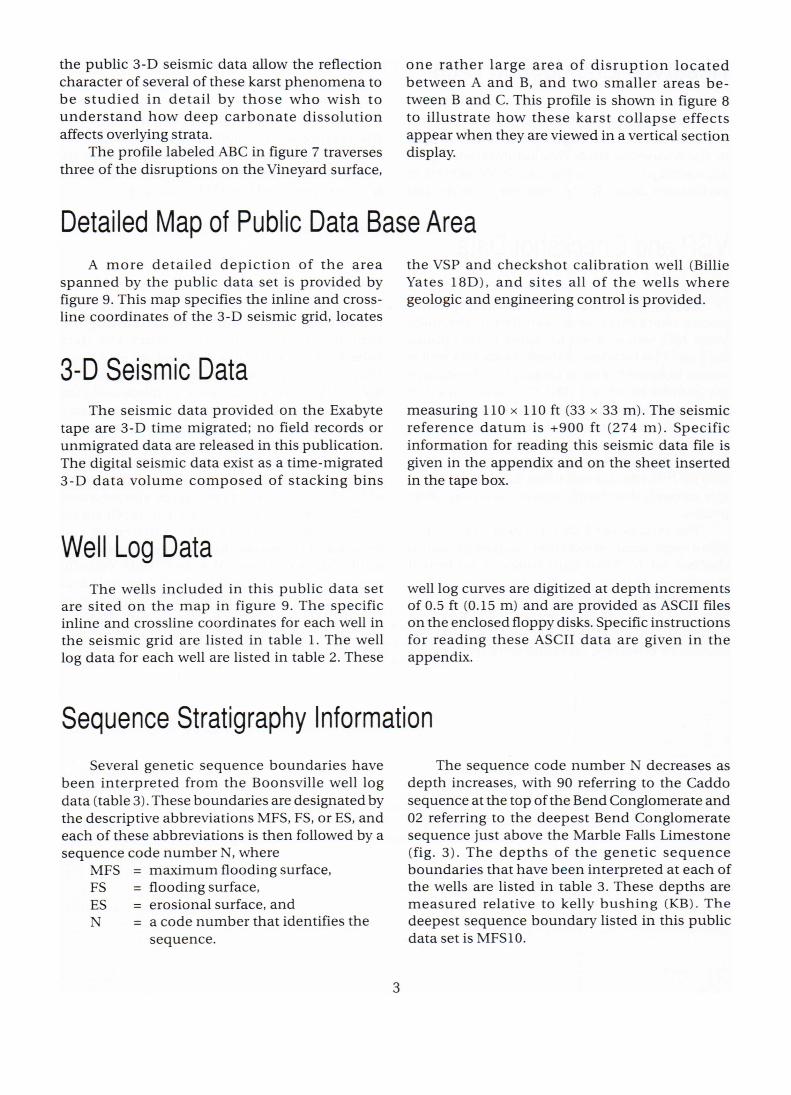
The profile labeled ABC in figure 7 traverses three of the disruptions on the Vineyard surface,
one rather large area of disruption located between A and B, and two smaller areas be-tween B and C. This profile is shown in figure 8 to illustrate how these karst collapse effects appear when they are viewed in a vertical section display.
Detailed Map of Public Data Base Area A more detailed depiction of the area
spanned by the public data set is provided by figure 9. This map specifies the inline and cross-line coordinates of the 3-D seismic grid, locates
3-D Seismic Data The seismic data provided on the Exabyte
tape are 3-D time migrated; no field records or unmigrated data are released in this publication. The digital seismic data exist as a time-migrated 3-D data volume composed of stacking bins
the VSP and checkshot calibration well (Billie Yates 18D), and sites all of the wells where geologic and engineering control is provided.
measuring 110 x 110 ft (33 x 33 m). The seismic reference datum is +900 ft (274 m). Specific information for reading this seismic data file is given in the appendix and on the sheet inserted in the tape box.
Well Log Data The wells included in this public data set
are sited on the map in figure 9. The specific inline and crossline coordinates for each well in the seismic grid are listed in table 1. The well log data for each well are listed in table 2. These
well log curves are digitized at depth increments of 0.5 ft (0.15 m) and are provided as ASCII files on the enclosed floppy disks. Specific instructions for reading these ASCII data are given in the appendix.
Sequence Stratigraphy Information Several genetic sequence boundaries have
been interpreted from the Boonsville well log data (table 3). These boundaries are designated by the descriptive abbreviations MFS, FS, or ES, and each of these abbreviations is then followed by a sequence code number N, where
MFS = maximum flooding surface, FS = flooding surface, ES = erosional surface, and N = a code number that identifies the
sequence.
The sequence code number N decreases as depth increases, with 90 referring to the Caddo sequence at the top of the Bend Conglomerate and 02 referring to the deepest Bend Conglomerate sequence just above the Marble Falls Limestone (fig. 3). The depths of the genetic sequence boundaries that have been interpreted at each of the wells are listed in table 3. These depths are measured relative to kelly bushing (KB). The deepest sequence boundary listed in this public data set is MFS10.
3
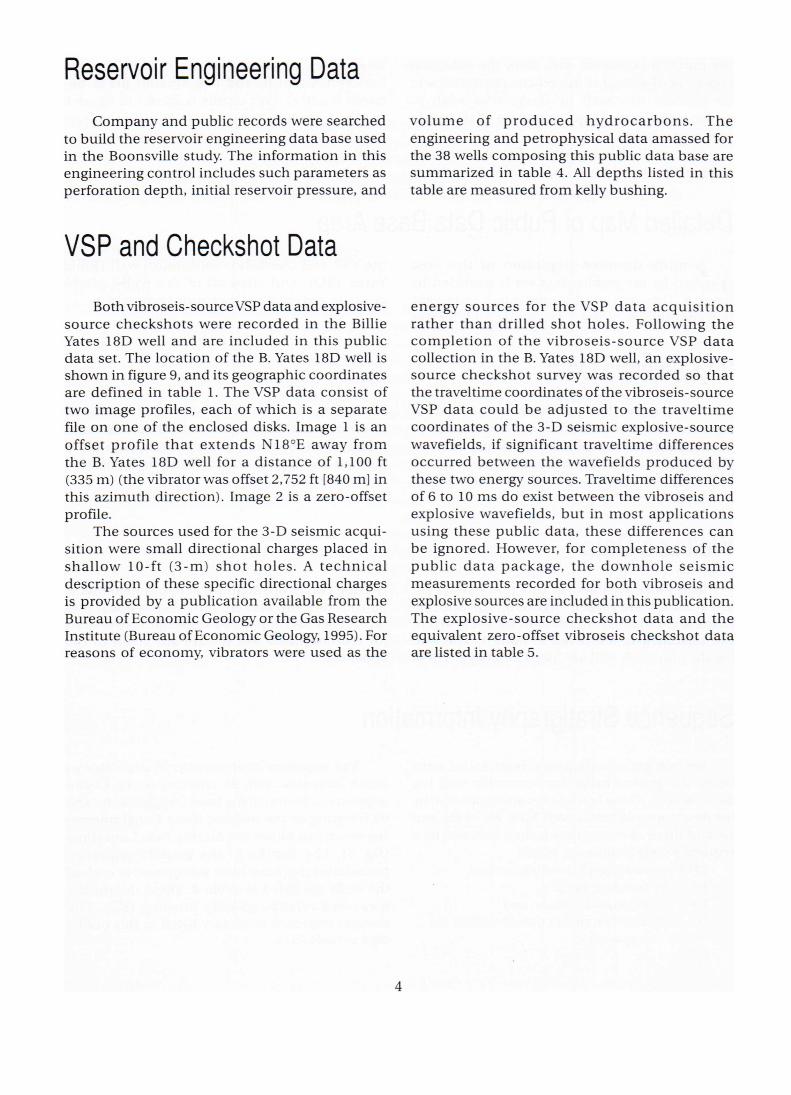
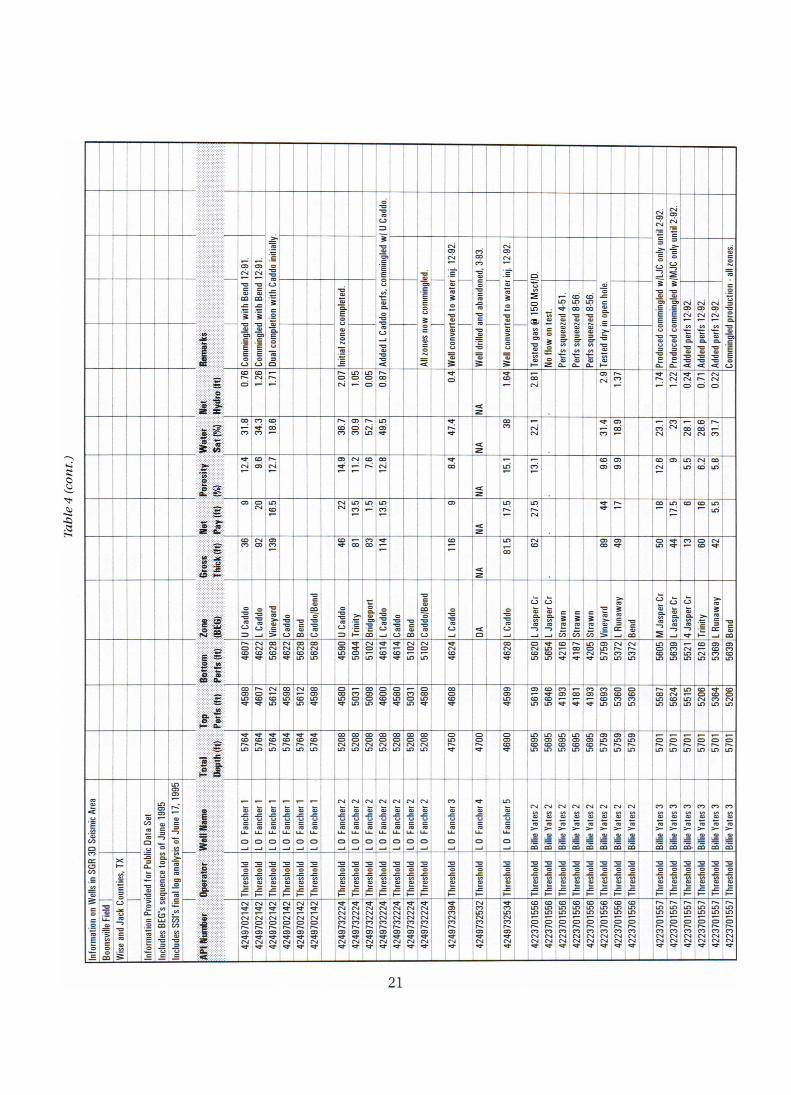
Reservoir Engineering Data
Company and public records were searched to build the reservoir engineering data base used in the Boonsville study. The information in this engineering control includes such parameters as perforation depth, initial reservoir pressure, and
volume of produced hydrocarbons. The engineering and petrophysical data amassed for the 38 wells composing this public data base are summarized in table 4. All depths listed in this table are measured from kelly bushing.
VSP and Checkshot Data
Both vibroseis-source VSP data and explosive-source checkshots were recorded in the Billie Yates 18D well and are included in this public data set. The location of the B. Yates 18D well is shown in figure 9, and its geographic coordinates are defined in table 1. The VSP data consist of two image profiles, each of which is a separate file on one of the enclosed disks. Image 1 is an offset profile that extends N18°E away from the B. Yates 18D well for a distance of 1,100 ft (335 m) (the vibrator was offset 2,752 ft [840 mi in this azimuth direction). Image 2 is a zero-offset profile.
The sources used for the 3-D seismic acqui-sition were small directional charges placed in shallow 10-ft (3-m) shot holes. A technical description of these specific directional charges is provided by a publication available from the Bureau of Economic Geology or the Gas Research Institute (Bureau of Economic Geology, 1995). For reasons of economy, vibrators were used as the
energy sources for the VSP data acquisition rather than drilled shot holes. Following the completion of the vibroseis-source VSP data collection in the B. Yates 18D well, an explosive-source checkshot survey was recorded so that the traveltime coordinates of the vibroseis-source VSP data could be adjusted to the traveltime coordinates of the 3-D seismic explosive-source wavefields, if significant traveltime differences occurred between the wavefields produced by these two energy sources. Traveltime differences of 6 to 10 ms do exist between the vibroseis and explosive wavefields, but in most applications using these public data, these differences can be ignored. However, for completeness of the public data package, the downhole seismic measurements recorded for both vibroseis and explosive sources are included in this publication. The explosive-source checkshot data and the equivalent zero-offset vibroseis checkshot data are listed in table 5.
4
N
A«h. Wictütà:
Booneville prdjeât area ~C~ w`is~
Boonsville gas field
Fort - Worth -o
~J
• Dallas
Abilene.
Fort Worth Basin i?
a
~tr •
OJ Waco
0 50 mi
0 80km
• Austin
Modified from Lahti and Huber (1982)
- Ozarka Uplift": ;:: N J J-
Val Verde Basin
Kerr Basin
Marathon Uplift ;:<:;!:; QC :.
o -~ ..G.~ OF MEXICO o ~' ~. F
ga. ~ ~ . m ,
~~ 0 300 mi d~ ~~~ ~
:
; I ~ 0 400 km
Modified from Thompson (1982) OAb607c
Figure 1. Middle Pennsylvanian paleogeographic map showing the Fort Worth Basin and other basins related to the Ouachita orogeny and the Boonsville project area. The solid rectangle on the Wise Jack county line designates the area where the 3-D seismic data were gathered.
I , gnl
5
SYSTEM SERIES GROUP OR FORMATION
K UNDIVIDED
p WOLFCAMPIAN
Cisco Group
IP
UP
PE
R VIRGILIAN
Canyon Group MISSOURIAN
Strawn Group
MID
DL
E DES
MOINESIAN
ATOKAN
MORROWAN
Atoka Group
Marble Falls and Canyon Formation L
OW
ER
MISSISSIPPIAN
Gas from Bend
Conglomerate
QAb1131 c
Figure 2. Generalized post-Mississippian stratigraphic column for the Fort Worth Basin. The geologic and engineering data components of the public data base are restricted to the Bend Conglomerate interval, which in Boonsville field is equivalent to the Atoka Group shown here. The specific stratigraphic nomenclature used in this Boonsville study is described in figure 3. Modified from Thompson (1982).
6
*Main target zone in past Best gas-reserve-growth potential
Runaway
Beans Creek
GR SP
Bureau of Economic Geology sequence nomenclature
Caddo
Davis
Bridgeport
upper
middle
lower
Vineyard
Wade
Elvis
Marble Falls Limestone
Res
Maximum flooding surfaces
MFS90
Caddo Limestone
MFS80
0 0 ° MFS60
MFS55
314"
MFS53
MFS40
MFS39
MFS34 O ~ r
MFS32
MFS20 — ~
MFS10
MFS02
Depth (ft)
~ <~
Jasp
er C
ree
k
Wizard Wells
Be
nd C
onglo
mera
te
QAb609c
Figure 3. Stratigraphic nomenclature used to define Bend Conglomerate genetic sequences in Boonsville field. As defined by the Railroad Commission of Texas, the Bend Conglomerate is the interval from the base of the Caddo Limestone to the top of the Marble Falls Limestone; however, the Caddo was also included in this particular study. The term MFS is an abbreviation for maximum flooding surface.
7
MFS70
AT
OK
A G
RO
UP
Low
er A
toka
a.
Trinity
:z _
?4 net-pay intervals
3 net-pay intervals <3 net-pay intervals
QAb632c
Figure 4. Number of net-pay intervals occurring between the Caddo and Vineyard sequences across the Boonsville study area. The outlined area defines the boundaries of the public data set.
8
Net hydrocarbon feet > 2.0
Net hydrocarbon feet > 1.5
Net hydrocarbon feet < 1.5
QAb631 c
Figure 5. Distribution of net hydrocarbon feet between the Caddo and Vineyard sequences. The outlined area defines the boundaries of the public data set.
9
C S
k \k
= E //: k / e 0 ~ c =
Q % Æ' 3 A 7 \E\
E é £ § k
2 ~ § § ô Q.,
&032 ~ o Q)) « ® 2 § § ) \ z':14q§ kk
§: \ ô
~(Ç a ~
//\ £
S § \ ci \ ~ ~ / c @
R t S ~ /\~7
§ L.
é
11H! •Ti"Sa
~ '••"' t ~~
S £ t U ~ a , ,4>£/ ~
§ ƒ ~«~_ \ 0.) @ °§
IUU § ~
t
/ k 7 \
c0?)\
2 § f 4 < 4 2 2 \ 2 \ § é C
~Æ\ Æ ~ q, 2 Æ )
~
Ç\ \ ~\ Æ 2 J \ 4
\b\ ~ § a§t«
§~§ 3 •
4 ~ & §
z
(sw)
\ \ \ ! ~
ÿ
10

z
) § ~ §/ /
/~/
= E J: ~
_ o a - ~
\ j (\~ c ~A~
~ \ .z3.)
3 ~ 2 ~
°°° \ \\ @ ~ - \ 2
~ /\ 4- -~
\ ) Z.
Ç\\ k~
\ (
t
\
C■1 0.1 o ~
] § £
2 Æ 3 t11
§q m q"`)\
2/ §
/ "t1
% § ` / E §\ £
ut
\ à
o % 2 („)
CO @$$ ~ u §
\ \ ~u%
¢~Q ~é/f ~
t ~ q % ~
@2/ 4E1. §
/ ~qk /$ Ft U
&'13 $ co , / a kk C=, 432 ~
epnlud u v \ %
11

0
0.6
0,7
0.8
c) E H
0.9
1.0
1.2
+127
0
-128
A
B
C
1°iR~n*.,~r _ A.,„
~ 1~~~:Y` -i .
' ~
.. •a•.~s . -
~ ... . .
~
,~a,~ •
•
ru
~ ~ ~~~"•
• M+.1 -
~t
'• r Lip- <..
•~
P • rs•11.,1111.,t
"'r., ..• ,,•wF,. ;Y - e
a. .
~ , • ~
a4 4,6 41.1;11.k .4.'-..
♦
... -
il ..
'
1
MVP . . .~. -i 'tri
v ~~.".b++~st f
~w
`~
-r~. s.~ 1~! ~
~
> ~/►
lailihrill . ..~ 5100601 ~
. ~ ~
f ~s~►~
• ~ .
~ ,.
•»
• 4r r ~
— ..- sr * . .
•' + " 1►~~ - _ .. ►
2
3
4
r~ ~~^"~r++
, , A 11,
-! ~. .
~• ~ ~ z-_
'wre►
' -+' . ~~ ti
_
Ire
._
..w ..--'
-tiwz,-_ ~ s
~
iN•swR ~ ~ w a r~
Karst
1 Caddo 2 Davis 3 Runaway
Karst
4 Vineyard 0Ab592c
Figure 8. Seismic profile ABC. This profile passes through a rather large area of seismic disruption betweenA and B and two smaller areas between B and C. Note that the karst collapse extends quite deep; the Ellenburger is below this data window at a two-way time of approximately 1.3 s. This profile view should help users recognize the appearance of karst-generated phenomena when reviewing the 3-D seismic data. Location of profile shown in figure 7.
12

190
180 —
206
QAb2601 c
170 a> its
ô 160 — 0
150 N cr) 0 U
140 —
201
130 —
120 —
• ' •
C. Yates 9 I Ashe B2
• B. Yates 3 ~ Ashe B3 Ashe C4•
•
Arch I • I Ashe C1
• B. Yates 2 I Ashe C6 Ashe C5 I •
• I B. Yates 7 I OXY •
Ashe C3 ♦
Fancher 4 •
I.G. Yates 21
• I.G. Yates 32 • • I.G. Yates 13 1
I.G. Yates 3 Fancher 5 I • • • 1 Craft Wtr. Bd.
• • Fancher 3 I
1 12-1
I.G. Yates 19 • Fancher 2 1
I.G. Yates 31 1 Enserch F. Yates 10 • I.G. Yates 9 . • • 1
I.G. Yates 18 • I.G. Yates 14 i • W. Dewbre 2 • F. Yates 7
I.G. Yates 4 1 • W. Dewbre 1 1
I I I T •
I I I I I I I 1 110 130 150 170 190 90
Inline coordinate
N
B. Yates 11
■ Craft Wtr. Bd. B. Yates 18D ♦ Ashe C21— — — — 21-2
• • • `♦ Craft Wtr.
B. Yates 15 — —I 21-1
• B. Yates 13
Fancher 1
• 1
110 — 105
74 2200 ft —1 670 m
Figure 9. Map of public data set area showing inline and crossline coordinates of the 3-D seismic grid and locations of the wells within the grid. Company names (Arch, Enserch, and OXY) indicate leaseholder at time of publication.
13
Tot
al
dep
th
fro
m K
B
( ft)
1 5880.0
1
0
~ LC)
~ 5953.0
1
57
10.0
1
1
4710.0
1 5788.0
1 572
7.0
1 58
19.0
1
o D1 ~ Ln
I 5701.0
1
577
3.0
1
5800.0
1
5800
.01
O '
w LC)
O Ô ~ LC) 5
763.0
1 5
945.0
1
59
10.0
1
o cD rn LC) 5
98
7. 0
1
575
1.0
1
47
00
.01
49
19
.01
46
90
.01
o Ô
~ v 4
87
5.0
1
57
64.0
1
4750
.01
470
0.0
1
585
1.0
570
1. 0
Dat
um
(g
round
le
vel [f
t]) O
N O
L 1038.0
0
é') O)
0
(ND co
O'C
L8
L 8
89
.0
89
8.0
952
. 0
10
25
.0
10
19
.0
O
ON) O)
o
~ O)
O
M O
I 1062
. 0
10
40
.0
O
M co
O
LO co
o
CO0 co
0
CO O)
104
0. 0
1
1037
.0
~1
072
. 0
0
CO~ O
0
~(D 00
0
00
0 ~
co
10
81
. 01 ~0'
006
0 0 O U
O) c0 O) 10
68.0
1 8
58
.01
0
~ c0
0
CD c0
0
~ co
0
LA co
0
.71- co 8
42. 0
1
Dat
um
(k
elly
b
ush
ing
[KB
], ft)
10
32
.0
104
0.0
O C7 V' O)
O N (1) CO
O 00 !~ CO
O N co 00
00
06
O O LC) 0) 1 0
29.0
102
2. 0
O 4 O) O)
O LC) 00 O)
104
2. 0
1072
. 0
O O LC) O
O I, ~ CO
O (D co CO 8
88.0
1
O
0 O) 10
46.0
104
6.0
10
74
.0
o V O) O 8
56
.0-1 O
M h co
O cd N. co
1 08
8.0
O LC) O O)
O O O O) co c0 O) 1
074
. 01
O
(D 00
O LC) Ln co
1
O O (D co
O Ln f~ c0 8
54
.01
848.0
1
850
.01
•N Q
a) Ç •~ ç coM r 1
80
N r 178
~ 8 ,- N
(p O N 17
3
N r N 1....
r-
94
^ 88
N r r r COO r CO r p ô~ N r
I L
L
co (+~ ('~ r
N~ r r
LC) r
~ r r
N~ ~ ~ r r r
~ r
r(ND r r
LOC) r
(nD r 1
67
CON r
COM r
C) d
C
E H .~ ô
0 ~ V
N r 189 ~
r 152
(MD r ~ r n r r r r r COM r (OD r CO (D r •~ r 1
50
LN r M r LN r Û r 0 0)
r N r CO r
LC) r
•71- r N r r r +M- r
t0 r 13
4
11
7
N r M r N r CO r (~ r N r Ô r ~ r
Sta
te p
lan
e Y
lo
ca
tio
n
560
65
5.9
6
L.NC)
Ô
~) LA 5
58
49
0.8
6
555506.9
3
(OD
CD
LOC) LC) 5
59
072.0
3
55757
9.6
3
5576
00
.98
557667. 2
8
559004
. 76
557
10
8.1
7
557418.6
7
554
662. 39
55
53
91
. 46
N
LoC) Lc) Û LC) 5
532
35
.32
55
55
01
. 19
55
5486.7
3
560830.9
8
550
86
2.0
5
552183.9
5
552
950.4
0
55
03
51. 3
4
55
13
00
.91
552
60
3.8
6
55
134
9.7
7
55
13
08
.78
552
63
6.6
7
5535
38.7
7
5517
5 3.2
6
5526
42.1
5 ~
5540
75.3
9
ÔO
L~n
Û in 55
3557
.55
J
L!)
v
(~f) LC) 5
53
00
1. 5
3
550
481.2
1
550954
.72
Sta
te p
lan
e
X lo
cat
ion
18
77058.8
6
18
76
632
.73
18
77
16
0.6
9
18
76
37
5.3
4
18
77
921
.50
18
79
328
.49
~ 18
79
52
7.8
3
18
75
82
9.7
4
18701
03
.82
187
0442.6
2
18
67
14
6.6
4
~ 1
865098
.47
186
6494.1
1
18
70
590.1
9
18691
19
.42
18
776
91
.27
187
787
7. 32
187
8813.3
4
186957
8.3
0
18652
51
. 46
18
67
579.0
7
187
1458.3
8
18
7 000
0.8
1
18
73
648.4
8
18
73
522
. 05
1 872
33
0.0
4
18
70754. 2
6
1872
586.0
2
18
73
547.1
4
187
1505.6
0
18694
07. 3
9 I
N •:1' C6 CO CO IC) ~ CO 1
87 4
545.5
8
187
432
4.2
7
18
751
51. 0
5
18
750
99
.15
187674
4. 5
7
1874
721.
00
41-a ~ ~
J 33.2
07
13
33.2
042
3
33.2
01
18
I 33.1
9297
O
O) r
coM 33.2
02
80
33.1
9870
33
.1987
2
33
.1988
4
(C) O N
coM 33
.1972
7
33.1
9810
33.1
9054
33.1
9259
33.1
93
01
33
.18674
33.1
92
97
_
O) O) r coM 3
3.2
07
53
33
.1800
8
N. CO r
M 33.1
8589
33
.17
8 73
33.1
8138
L_ 33.1
8496
33.1
8150
I 33.1
813
7
I 33.1
85
04
33.1
87
53
33.1
8260
33.1
85
02
1
1
33.1
89
03
O 00 r coM 3
3.1
8759
33
.19032
33.1
86
07
co ~ r
coM 33.1
8044
Lo
ngit
ud
e
co O)
O O) . ~ 9'
r (") .4 CO O O) . r~ 9'
O CO O O) . ~ 9'
r ~ co
O O) . ~ 9'
O) O O) O) co . ~ 9' -9
7. 8
9452
-97.
89385
-97
. 90
594
CO (0 V N O) . r~ rn -9
7.9
23
57
-97
. 934
32
-97.
9410
2
-97
. 93
642
-97.
92
30
4
LC) CO ~ N O) . ~ rn
O CO O) O) co . n rn -9
7. 8
992
2
CO
O O) co . r rn -9
7.9
264
2
-97. 9
4043
-97
.93
28
4
I-
o N O) . ~ rn
O O) v N O) . ~ rn
O) O) N_ O) . ~ rn -9
7.9
134
2
O M N. O) . ~ 9) -9
7.9
224
5
-97.9
164
8
-97. 9
1335
-97.9
2000
f~ CO CD N O) . ~ rn -9
7.9
0572
i~ O O_ O) . ~ rn
CO O O) . ~ rn -9
7.9
08
12
~ N CO O O) . ~ rn
(D CO N O co . n rn -9
7.9094
8
AP
I nu
mb
er
42
497
0137
800
I
42
49
701
37
70
0
42497
0137 4
00
42
49
70
1373
00
4
2497
013
7200
4
2497
01
37
10
01
424
9701
3700
0
I 42
49732
41700
142
2370
15
5600
142
2370
15
5700
1 42
23
70
26
1200
I 42
2373
0315
00
I 4
223
7356
6300
I 42
237
367
1100
I 42
237381
30
00
1 424970164200
I 42
497
0163
20
0
I 424
9701
6060
0
1 4223
730
2800
0
14
22
37
0259
900
I 4
2237
0259
600
1
42
23
70
25
93
00
0 0 N O) cf) N O (` CO N N V'
I 42497
3231
60
0
I 4
24
973243300
I 42497
3243400
I 42
23
734
6730
0 1
42
49 7
3247
800
424973251
40
0
4223
7367
0200
I
4223
7380
0600
I 4
24
970
2142
00
142
49
732
2240
0
I 42
4973
2394
00
4249
7325
3200
424
97
3253
400
424
9 70
1656
00
4249732
2730
0
We
ll n
ame
1Ash
e B
2
1Ash
e B
3
1Ash
e C
l
1Ash
e C
2
1Ash
e C
3
1Ash
e C
4
1Ash
e C
5
1Ash
e C
6
1B Y
ate
s 2
1B Y
ates
3
1B Y
ate
s 7
1B
Yat
es 1
1
1B Y
ate
s 13
1B Y
ate
s 1
5
B Ya
tes
18D
1Cra
ft W
B 12
-1
Cra
ft W
B 2
1-1
'Cra
ft W
B 21
-2
IC Y
ate
s 9
IF Y
ate
s 7
IF Y
ate
s 10
11.G
. Yat
es
3
11. G
. Yat
es 4
I. G. Y
ate
s 9
11. G
. Yat
es
13
11.G
. Ya
tes
14
11. G
. Ya
tes
18
11
. G. Y
ate
s 19
1 1.G. Y
ate
s 2
1
I. G. Y
ate
s 31
11.G
. Yat
es
32
1L. O
. F
anch
er
1
1L. O
. F
anch
er
2
L.O
. F
anch
er
3
1L. O
. F
anch
er
4
1L.O
. F
anch
er
5
1W
Dew
bre
1
W D
ewb
re 2
14

Tab
le 2
. Dig
ital lo
g d
ata
pro
vided
for
wel
ls.
J
N 2
X X X X X X X X X X X X X X X x X X X X X x X X X X X X X X x
J Q U
X X X X X X X X X X X X X
O cc v X X
I-
G X X X X
LL
â X X X X X X
CO
= C<
X X X X X X X X X X X X X
= a z
x X X X X X X x x x x
°C c) x x X X X X x X X X X X X X X x x
N x x x x x x x x x x x x x x x x x x x x x x x x x x x x x x x x x x I- 4 J
x x x
Z J X X
Z 0 X X X X X X X X X X X
0 CC (.7 cn
X
co J J
X X
CO
J X X X X X
J LL ci)
X X x X X X x X
2 J_ ~
X X X X X X X X X X X X X X X X
cm J_ ~
X X X X X X X X X X X X X X X X X x X X x X X X X X X X X X x
Lat
itu
de
3
3.2
07
13
j
CO N 'Tr O N M co 3
3.2
01
18
N- M N 0)
CO co
CO r CD 0)
CO co
~ 33.2
02
80
33.1
98
70
33.1
987
2
71- CO CO 0)
CO co
N LO N O N CO co 3
3.1
972
7
O ~ r CO0)
CO co
tn O 0)
CO co 3
3.1
92
59
33
19301
1 33
.18
67
4
33
.192
97
33
.19294
332
07
53
33
.18
008
V N- CO CO
CO co 3
3.1
858
9 1
33
.178
73
CO Co
M
CO co 3
3.1
849
6A
33
18150
N- co
07
CO co 3
3.1
85
04
I
33.1
875
3
33.1
82
60
N O tl) 00
CO co 3
3.1
89
03
N O •zr CO
CO co 3
3.1
8759
Lo
ng
itu
de
CD 0) ~ O 0) . N.: 0)
V co CO O
r` 0)
Q) .
-97.9
0160
CO *- ~ O Cn . ` O
0) O O 0)
r` (3)
CO .
-97
.89
452
-97
. 89385
~ O) ln O 0) . ~ 0)
CD CD ~ N
r` 0)
CT) .
-
97
. 92
35
7
-97
. 9343
2
N O
~
r` O -9
7. 9
36
42
-
97
.92304
0) .
-97.
927
85
-97
. 89980
-97
. 89922
CD
CD 0)
~ O -9
7. 9
264
2
CO
.
-97
.940
43
-97. 9
3284
n — O
Cc; ) . r` Q)
O 0 ~ N ~ 0) . r` 0)
0) Q) N
O) . r` 7)
N ~ CO
0) . ~ Q)
O Co f~
` m
O) .
-97
. 92
24
5 I
CO ~ CD
r\ 0)
M .
-97
. 91335
O O O N O . r` O
N- CO CD N M . ~ Cr)
N N- in O
r` 0)
0) .
-97
. 910
07 I
,— CO O
O) . ~ O)
AP
I nu
mb
er
424970
1378
00
42
49
701
37
700
42
49
701
37
400
42
49
70137300
42497
01
37
200
42
49
70
13
71
00
42
49
70137000
42
49
73
241
70
0
42
23
70
15
5600
4223
701
55700
42
23
702
61
20
0
42
2373031500
4223735
66
30
0
42237
36
71100
42
23
73
81
300
0
142
49
70
164
20
0
142
49
70
16
3200
142
49
70
160600
142
23
73
028000
142
23
70
259
900
142
23
70259
60
0
142
23
70
25
93
00
~42
23
70
25
9200
142
49
732
31
60
0
142
49
73243300
142
49
732
43
40
0
422373467300
24
97
3247
800
42497
32
51400
42
23
73
67
0200
422373800600
42
49
70
21
4200
42497
32224
00
424973239400
Well
na
me
IAsh
e B
2
CO CO
a) L up Q
U a) L cn Q A
sh
e C
2
Ash
e C
3
Ash
e C
4
Ash
e C
5
lAsh
e C
6
B Ya
tes
2
B Ya
tes
3
IB Ya
tes
7
N ra >- CO B
Yate
s 1
3
B Y
ate
s 15
B Y
ate
s 1
8D
Cra
ft W
B 1
2-1
Cra
ft W
B 2
1-1
Cra
ft W
B 2
1-2
IC Ya
tes
9
IF Y
ate
s 7
IF Y
ates
10
II G
. Ya
tes
3
II. G
. Y
ate
s 4
II. G
. Ya
tes
9
1I.G
. Y
ate
s 13
11.G
. Y
ate
s 1
4
IG. Y
ate
s 18
I. G.
Ya
tes
19
I. G.
Ya
tes
21
I. G.
Ya
tes
31
I.G.
Ya
tes
32
~L. O
. F
an
che
r 1
IL. O
. F
anch
er
2
IL. O
. F
anch
er
3
15
X X X X
J
U
X
o m U
2
I-- J W
o _ m
X
We
ll n
am
e
O.
Fanche
r 4
L.O
. F
anch
er
5
W D
ew
bre
1
W D
ewb
re 2
x a z cc ~
a ~ X X X X
f- *g( J z J z ~
X
CO
-J - J
X
X
J J
X
-J ~ Cf)
2 _ J ~
X X
J_ X X X X
d
03 J
CV M O
~
O CO
C') M
co O N-
C")
V O co
M
CV
CA O rn r rn
~ N CO O CT) r
co co N O an r
424
97
3227300
42
49
73
25
320
0
42
49
73
25
34
00
AP
I n
um
be
r
42
49
70165600
Tab
let (c
on
t.)
3 .E = a) co o E12
>,
~~
a) >. -5 Q) >
cs)o
> .? in ~
E ~
Ç
~'
-a -o~ U) > C ~~ > ~
~ v) ~ •~ > - O Û>„ ~
-> ~ 5 U~ _
-0Q) C O >>~ N >
C
~ O
,-- O ? >,C' 0 7.7) N Q) a O _ `. o S p cn ~ ~`.~ 0 _d ç
_
U -o >,~ ~ ü (t a ~> ~ U §~ 7 c — C) N mEE O ~~' Û C Q)
17
Q) C E
~_O
_ c:
°UQ0 0 o ~ O E C 2 V • CM L O 0 0~C V l
~ `` °' °~ ~ ° ai ts mmrLc Q Q) a c ti 0 c~ Q cc o .c o .0 cti U
0 ~ n J J c/) Cn J
J(n (~ U m d o2 U 2
II II II II II II II II II II II II II II II II II II
c a~J =
O L J~I
UJ J
CO L J7 Z ZQ~~~ 2 WW Q UP CE CC U) J _J U) (n J J (n C3 Z Œn_ 02 U 2
16
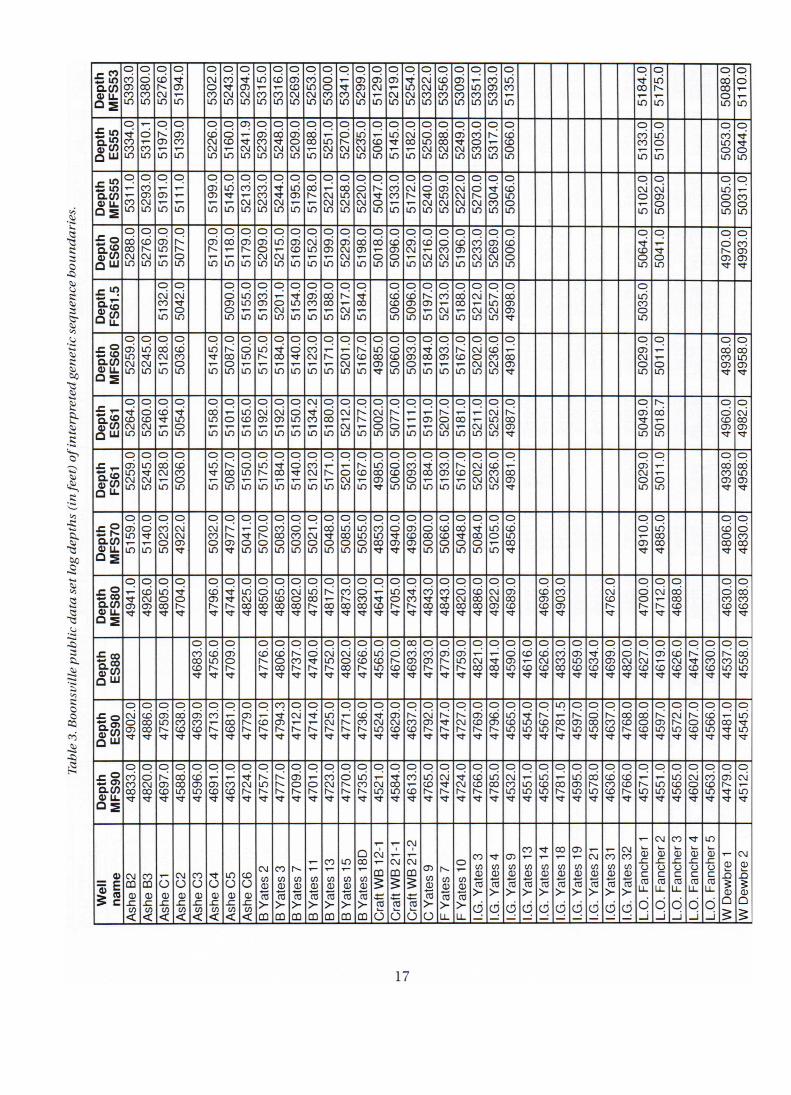
Table
3. B
oo
nsv
ille
pu
bli
c da
ta s
et lo
g d
ep
ths
(in
fee
t) o
f in
terp
rete
d g
en
eti
c se
qu
en
ce b
oun
da
r ies
.
Dep
th
MF
S53
53
93
.01
53
80
.01
1 5
27
6.0
1
0 4 67
LC)
0 N O4 CO LC)
0 CY)
N LC) 5
294. 0
1 5
315.0
1
53
16
. 01
526
9. 0
1
~
0 co Ln N Ln 5
300.0
1 01
5299.0
1
51 2
9.0
1
52
19
.0
0 ri in N Ln
0 N CV CO Ln
0 O II) CO Ln
0 6i O CO Ln 5
35
1. 0
1
5393.0
1
518
4. 0
1
517
5.0
1
50
88.0
1 5
11
0.0
1
De
pth
E
S55
53
34
.0
53
10
.1
519
7. 0
o 6 CO
Ln
O CD N
LC) 516
0.0
52
41. 9
O O CO
~~
O CX) 4
O 6 O
L N
f)
51 8
8.0
o
Ln
LN 52
70
.0
O in co C.Nn
1
50
61
.0
O Ln 4 LC)
O N co
Ln
1
52
50.0
1
52
88
.0
52
49
.0
O CO O
LMn 5317.0
1
O CD CD O~
O M CO
Ln 5105.0
1
co CO LC) OIn 5
04
4. 0
1
De
pth
M
FS
55
O
CO—
Ln 529
3.0
519
1. 0
51
11
. 0
51
99.0
O LC)
~ ,- Ln
O CO
N Ln
O CO co N Ln 5
244
. 0
r 51 9
5.0
r 51
7 8.0
Or
N N Ln
1
O CO
N Ln
O O
Ln 504
7.0
1 O CO CO
Ln
O 6)
Ln
O N
N Ln 5
27
0.0
O
O V OM Ln 5
056.0
O N
Ln 50
92.0
1
5005.0
~ 5031.0
1
De
pth
E
S60
O cd co N Ln 5
276.0
5159
.0
O I\ f` O Ln 5
17
9.0
511 8
.0
51
79
.0
5209.0
O Ln
N Ln 5
16
9.0
O N Ln
Ln
1-5
19
9.0
O CT N
Ln
O cd 6)
Ln N ,-00,-
O old 1-
LC)
O CO 6)
Ln
O 6) N
Ln 52
16
.0
52
30. 0
5
19
6.0
O CO CO N Ln
1 5
26
9.0
O CD O O Ln 5
064.0
1
50
41
. 0
49
70
.0
4993.0
1
FS
61
. 5
51
32. 0
504
2. 0
O O 6) O 1.
O Ln co r LO
O co 6) r Ln
O r O NLn 5
154
. 0
51 3
9.0
O CX) co
Ln 52
17
. 0
O V Cb
Ln
O CD CD O Ln
O CD Cr) O Ln 5
197. 0
1 O CO N Ln 5
188.
0 O N r N LC)
O N.: Ln N Ln
O cd Cr) 6) 7I-
r 5
035.
01
Dep
th
MF
S60
5259
.0
5245
.0 0
Cb N LC) 50
36.
0
514
5.0
50
87.0
5
150
.0
517
5.0
5
184.
0
514
0.0
51 2
3.0
517
1.0
O O N Ln 5
167.
0 49
85.0
O Cr:; CD O Ln
O CO Cr) O Ln 5
184
. 0
O CO Cr) ) Ln
O I< CD Ln 52
02.
0
5236
.0
4 981
.0
5029
.0 O
,-,-- O Ln
O COCO 6) Cr 49
58.0
1
Dep
th
ES
61
52
64. 0
52
60.0
51
46.0
50
54. 0
O CO Ln LC)
O r O Ln 5
165.
0
O N 6) Ln
O CV 6) Ln 5
150.
0
N 4 co Ln
O O coT LC)
O N r N Ln 51
77. 0
50
02. 0
50
77. 0
O — 1 LC)
O csi T Ln 52
07. 0
O co T Ln 52
11. 0
52
52. 0
O I< CX) CT .71-
O 6) V O Ln 50
18.
7 O O CD 6) V~
O N co Cr)
Dep
th
FS
61
O Q) LC) N Ln 52
45.0
O OJ N Ln 50
36.0
O Ln ~ Ln 50
87.0
O O 1.0 Ln
O Ln I,- Ln
O ~ CO Ln 5
1 40.
0
51 2
3.0
O N- r Ln
O O N Ln 5
167.
0
4985
.0
O O CD O Ln 50
93.0
5
184.
0
1
O CO 6) Ln 5
167.
0
5 202
. 0
O CD CO N LC)
O r CO 6) v 50
29.0
50
11.
0
4 938
.01 O
CIO LC) Cr) v
Dep
th
M F
S70
O O Ln LC) 5
140.
0
O CO N O Ln
O N N 6) "It
O N1-.: CO O LC)
O 1"-- 6) <Y 50
41. 0
50
70.0
O CO CO O LC)
L 5
030.
0
O N O LC)
1 50
48.
01
0 Ln CO O Ln
0 Ln ln O Ln
1 4 8
53.0
1 49
40.0
O 6 CD O) ~
I 50
80.0
O CD CO O Ln 50
48.
0
5084
.0
O Ln O LC)
1 48
56.
0
4910
.0
4885
.0
O CD O CO '7 48
30.0
1
Dep
th
MF
S80
~ 49
41. 0
~
4 926
.0
~ 48
05.0
47
04. 0
~ 47
96.0
~
4744
. 0
~ 48
25.0
~
4850
.0
~ 48
65.0
~
48
02.0
] ~
4785
.0
4817
. 01
~ 4 8
73.0
1 O O co co '71'
1 46
41. 0
1 47
05.0
1 47
34. 0
1
48
43.0
1
1 4 8
43.0
1 48
20.0
1
O CD CXo co 'zr
1 4 9
22. 0
O 6 co CD rt
O CD 6) CD rr
I 4 9
03.0
1
1 47
62.0
1
1 47
00.0
O N N. •:r 46
88.0
1 O O co co V
O cd co co ..zr
Dep
th
ES
88 O
CO co CD rt
O CD Ln r V
~ 4 7
09.0
1 4 7
76.0
~
4 806
.0
1 47
37. 0
1 47
40. 0
1 4 7
52.0
~
4802
.0 O
CD CO N. 4 4565
.0
4 670
.0
4693
.8
O CO CJ) r ~ 477
9.0
O O) Ln ~ 4
1 4 8
21.0
O ~ CO 4
~ 45
90.0
1 O CD CD 4 46
26.0
48
33.0
4 6
59.0
4 6
34.0
co 6) CS) CD 4 48
20.0
46
27. 0
O 6) CD 4 46
26.0
1 46
47. 0
1 46
30.0
1 f45
37. 0
1 45
58.0
Dep
th
ES
90
~ 49
02. 0
1 O CD co OD V 47
5 9.0
~
4 638
.0+
O Q) CO CO 4
~ 4 7
13.0
~
4 681
.0
~ 47
79.0
~
4761
. 0
4794
. 3
~ 47
12.
0 O •zi N. 4 47
25. 0
47
71. 0
47
3 6. 0
45
24. 0
4 6
29.0
4 6
37.0
47
92. 0
~
4747
. 0
L 47
27. 0
O CT CD ~ V
1 47
96.0
1 45
65.0
~
4554
. 0
4567
. 0
~ 47
81.
5 45
97. 0
L
45
80. 0
1 46
37.
0
1 47
68.0
46
08.0
45
97. 0
45
72. 0
46
07. 0
1 45
66.0
1 44
81. 0
45
45.0
Dep
th
MF
S90
48
33.0
4 8
20.0
4 6
97.0
45
88.0
45
96.0
O O) CO 4
co co CD 4 47
24. 0
47
57. 0
47
77. 0
47
09.0
47
01. 0
47
23.0
O O N. N. 4 47
35.0
45
21. 0
45
84. 0
O CO CD 4 47
65.0
47
42.
0 47
24. 0
O CD CD N. ~ 47
85.0
O N CO Ln 4
1 45
51.
0 O Ln CD Ln 4
1 47
81. 0
4
595.
0 45
78.0
~
4636
.0 O
CD CO N. 4
~ 45
71. 0
45
51.
0 45
65.0
46
02.
0 45
63.0
44
79. 0
O N U') 4
Wel
l na
me
lAsh
e B
2 lA
she
B3
1
U a) _C Cn Q lA
she
C2
lAsh
e C
3 lA
she
C4
lAs h
e C
5 lA
she
C6
B Y
a tes
2
B Y
a tes
3
B Y
ates
7
1B Y
ates
11
B Y
a tes
13
IB Y
ates
15
1 IB
Yat
es 1
8D
Cra
ft W
B 1
2-1
Cra
ft W
B 21
-1
Cra
ft W
B 21
-2
1C Y
ates
9
F Y
a tes
7
F Y
a tes
10
I I. G
. Y
ates
3
I. G.
Yat
es 4
1
I. G.
Yat
es 9
I. G
. Y
ates
13
II.G
Yat
es 1
4 I.G
. Y
ates
18
I. G.
Yat
es 1
9 I.G
. Y
ates
21
I.G.
Yat
es 3
1 I. G
. Y
ates
32
L.O
. F
anc
her 1
L.
O.
Fanc
her 2
L.
O.
Fa
nche
r 3 4
Cll L U C co LL p J L.
O.
Fa
nche
r 5
W D
ewbr
e 1
W D
ewbr
e 2
Dep
th
ES
34
5665.0
1 0 Ln coo ln
0 N l~f) in
1
54
75.0
1
cd in in
1 55
10.0
1
ô o co Ln
I
55
96.0
1 5607.0
1 5
51
7. 0
1 5
50
1.0
1 5
55
2.0
1 f
56
26.0
1 ô Lf) LoC') in 5
41
8.0
1 ~ 5501
. 51
553
7.0
1
ô 4 in in
1 5
63
2. 0
1
ô (D co Ln
1 5638.0
1 56
58
.01
54
80
.01
53
71
. 51
54
23
.01
Dept
h
FS34
5659.0
565
7. 0
o
,:r in in 5
473.0
N f~ r-. in in 5
51 0
.7
557
8.0
558
6.0
O O co Ln Ln
1
550
6.0
5
50
0.0
5
54
8.0
560
5.0
5
56
8.0
54
17. 0
55
35
.0
O co I---- Lf) Ln
O — Co CO in 5
57
6.0
O I< co CD in
1
565
7. 0
O Cn 771- Ln
1 548
0.01
01
5401.0
De
pth
E
S36
56
25
.0
56
26
.0
55
11.
0 o 4- Lf) 7:t- Lf)
~ 5
53
0.21
5
46
7.5,
--;t r Ln Ln Lf)
I 55
51
. 0
O C7) N Lf) in
1 5
46
2.0
5
45
2.0
5
50
5.0
5
560.0
5
52
8.0
5
40
8.5
5
500.2
55
04.0
55
36.0
55
77. 0
co N N in Ln 5
580.0
5
619.0
O Lf) CD co Ln
O C) I-- V Ln
co N in co Ln
o o Ln co Ln
Dept
h
MF
S36
56
20
.0
561
8.0
549
2.0
54
41
. 0
55
16
.6
1 55
41.0
553
2. 0
O Ln Ln •zr in
O Ln 4 71 II) 5
496.0
O O Ln in in 5
37
9.3
54
69
.7
54
93.0
O
co in in
11
5570.0
5
51 6
.0
556
6.0
56
10
.0
5349.0
5447. 0
1
co CD N co Ln 5
34
2. 0
1
Depth
E
S3
8
O 4 (D Ln 5
610.0
54
85
.0
542
4. 0
N 1--: O in Ln
O Ln CM 7:1- Ln
O C) N Ln Ln
O C) N Ln Ln
1 5
52
3.0
5448.0
5
440.0
5
48
3.0
5
544. 0
O O N Ln Ln
O Ln CD CO Ln 5
455.0
5477. 0
5
52
1. 0
5
55
7. 0
5
50
4.0
5
55
7.0
5593.0
5337. 0
54
23.0
1
529
8. 0
1
o V N CO Ln
Dep
th
FS
39
O Ln co L~C) 55
7 6.0
54
50.0
5
37
3.0
O r`-:(p L~C') 5
408.0
5
49
2. 0
O Ln O Ln 5
49
6.0
1
5437. 0
5
42
6.0
54
77.4
'
O
N Ln 5
48
9.0
O ~ N co 54
09.0
O N v L4n
O r o L~ 5
547. 0
1
549
2. 0
5
544. 0
O o I--.. L~C)
O CV N IÎ 5
384. 0
528
4.01
Dept
h
MF
S3
9
55
57
. 0
5549.0
5431.0
535
6.0
54
60
.0
53
90
.0
5465
546
2.0
54
64
. 0
5405
.0
5398.0
54
40.0
54
89.0
54
51.0
1
O N C7) N in 53
80
.0
5407.0
1 54
66.0
1
550
6.0
54
50.0
r 5
511. 0
5541. 0
~
5290
.0
5 35
3.0
1
5248
.0
5269
.01
Dep
th
ES
45
5279
.01
1 53
82.7
co (D I-- co Ln
O N CO co Ln
1 53
29.0
53
88.7
~ 54
15.0
O CO N- Co in 53
76.7
O cd 4 4 in
1 53
94.0
O Ln 4 Ln 54
92. 0
52
27. 0
5281
. 01
L o â ,J.
Ô W
Ln
5526
.0
5516
.01
0 V Q) CO
o O N CO in 54
23.0
1
O N Ln CO Ln
O N CO Ln V'71'
O CO Ln 54
31. 0
1 53
86.0
I< h CO in
CD 'Cr Ln
1 54
62.0
1 O N N 4 Ln
5
260.
01
I 53
47. 0
1 53
78.0
54
38. 0
1 54
75.0
54
26.0
1 5
4 83.
0 'O Ln r Ln Ln
O cc> Ln N Ln 53
15.0
1 O CD N N Ln 52
40. 0
1
Dep
th
FS
40
5502
. 0
1 54
91. 0
,
O 4 co co in 53
07. 0
1
5 407
. 0 1
5341
.01
5406
.0
1 54
24. 0
54
30.0
53
73. 0
53
66. 0
54
04. 0
54
51. 0
5 4
13.0
52
49.0
53
34.0
53
66.0
1 54
32. 0
1 54
68.0
54
17. 0
54
72. 0
55
05.0
1 ~
5252
. 01 O
O co Ln
Ln CO O N Ln
o O co N u)
Dep
th
MFS
40
I 5 4
59.0
I
545
1.0 O
f~ co CO Ln
I 52
77. 0
1 O C) O CO in
O N I~ CO Ln
O N co CO Ln
O in r---. CO Ln
O C) N CO Ln
O Cb NCO Ln
~ 53
72. 0
1_
5411
. 0
1 53
72. 0
o N N Ln
5
299.
0 o 7) N CO Ln
53
75. 0
5 4
39.0
o o 00C) CO •,:t in Ln 54
64. 0
1
5214
. 0
r4
5267
. 01 O
(D CO in 51
93.0_
1
Dep
th
ES
50
5 449
.0
I54
43
. 0 0
r CO Ln
0 co N Ln
1 53
68.0
1 0 CO N Lf7
1 53
71.0
1 0 Lf) CO Ln
1 5 3
69.0
o
CO Ln 531 6
.0
5340
.0
5388
.0
co N C) Ln
O CO CO Ln
1
5 286
.0
5 313
.0
5 365
.6
5404
. 0
5345
. 0
5394
. 0
5429
.0
518
2.0
5 249
.0 1
0 Lf) N Ln
0 Cp Ln Ln
Dep
th
ES
53
54
00.0
54
1 8.0
O CO C7) N Ln
O CO O N Ln 53
29.0
52
60. 0
53
17. 0
53
17. 0
53
17. 0
o C7) N. N Ln 52
56.0
53
02. 0
53
53.0
53
32. 0
O C7) Co Ln
1 52
27. 0
52
61. 0
o CO N Cn Ln
1 53
58.0
53
12. 0
53
69.0
54
00.0
O CO ct Ln 52
07. 0
1 CT) (D Cn LC) 5
103.
01
Wel
l na
me
lAsh
e B
2
Ash
e B
3 IA
she
C1
lAsh
e C2
lAs h
e C
3
IAsh
e C
4 IA
s he C
5
lAs h
e C
6 IB
Yat
es 2
B
Yat
es 3
B Yat
es 7
IB Y
ates
11
IB Y
a tes
13
IB Y
a tes
15
IB Y
a tes
18D
ICra
ft W
B 1
2-1
Cra
ft W
B 21
-1
ICra
ft W
B 21
-2
IC Yat
es 9
IF Y
a tes
7
F Y
ate
s 10
I. G
. Yat
es 3
II.G
. Yat
es 4
II.
G. Y
ates
9
I. G. Y
ates
13
II G
. Yat
es 1
4 I. G
. Yat
es 1
8 IIG
Yat
es 19
I. G. Y
ates
21
I. G. Y
ates
31
I. G. Y
ates
32
L.O
. Fan
cher
1
L.O
. Fan
cher
2
L.O
. Fan
cher
3
IL.O
. Fa
nche
r 4
L.O
. Fa
nche
r 5
W D
ewbr
e 1
W D
ewbr
e 2
18
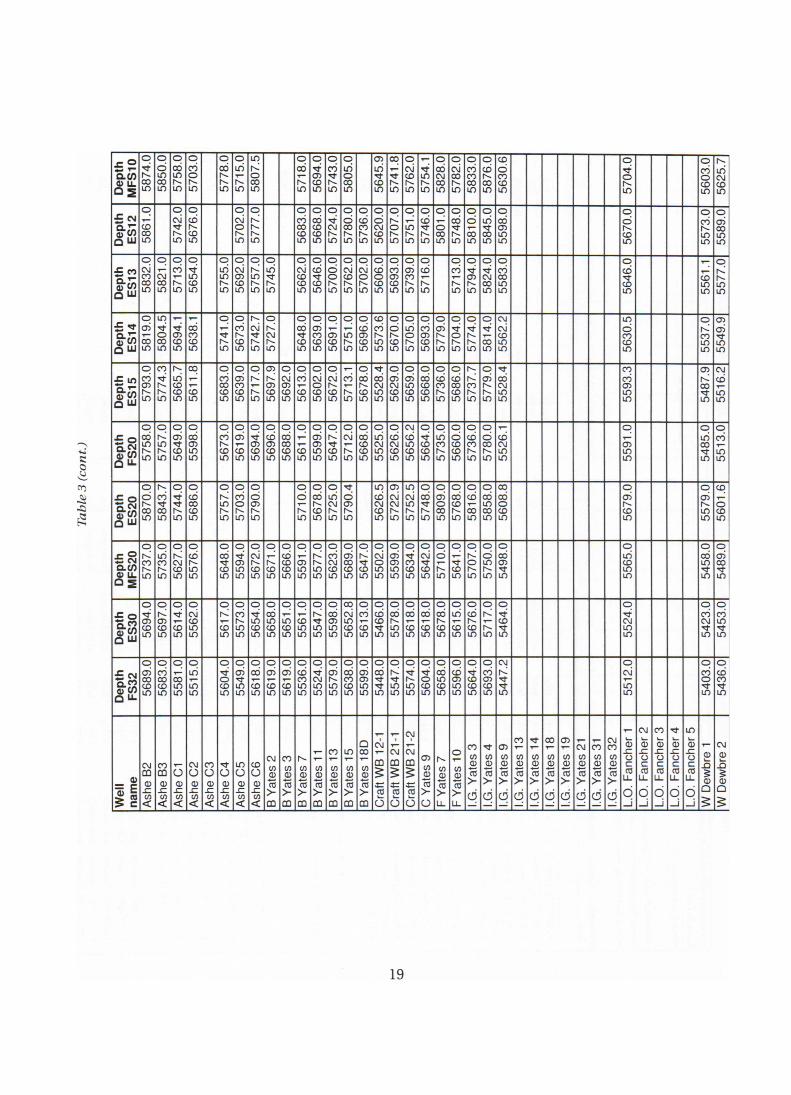
Tab
le 3
(co
nt.)
De
pth
M
FS
10
0 V ~ co
o Ô in co 57
58.0
I 57
03.0
1
I 5
778.
01
O xi ,-
1
5807
.51
1 01
56
94. 0
57
43.0
58
05.0
1 91
5741
. 8
01
,:i in N.
5828
.0
01 01
o cD ~ ~
co Ô co
~ 5704
. 01
5603
.0
56
25
.71
L N
ÿr fn
C) LU
1
5861
.0
0 CV ~ Ln
0 CD
CON- Ln
1 5
702.
0 57
77. 0
5683
.0
5668
.0
0 ~t ~ Ln 57
80.0
57
36.0
56
20.0
57
07.0
1
0 ~~
Ln
0 CO
Ln 580
1. 0
5748
. 0
0 Ô CO Lf) 58
45 Cil
0 N LOf) Ln
0 Ô CD in 55
73.0
1 55
89
.0
4-
Ô W
O
co L~
O
CNI L~f) 5
713
.0
1 56
54. 0
1
G
5755
.0
5692
.0
O
in N. 57
45.0
O
CO CO 56
46.0
O
O 5762
. 0
5702
. 0
O
0 ~
O
00 lÎ
O
CO lrI)
1 57
16.0
5713
.0
0
CD
~
r 58
24. 0
5583.
01
5646
.01 11
55
77
. 0
Dep
th
ES
14
5819
.0
5804
.5
V
COO L0
Cn
COO LC) 57
41. 0
56
73.0
57
42.7
O N:
n in
I 56
48.0
1 O Q)
cMD Ln 56
91
.0
1 o r
n Lf)
O co
COD U7 55
73.
6
567
0.0
5
705.0
56
93
.0
5779.0
57
04
.0
o V
n in
o V
CO Ln
N CV
L.On Ln 56
30. 5
1
O h
Ln in 55
49
.91
De
pth
ES15
O CO CO N. Lf)
1 5
77
4. 3
56
65.7
CO
CD in 56
83.0
O CO co CO in 5
71
7. 0
O h CO CD in 56
92. 0
O CO ,- cD if)
O N O (D Lf)
1 56
72
. 0 r
CO r (~ LC)
0Tr CO r~ CD LC)
N CV if) in 5629
.0
5659
.0 O
CD CD CD LC) 5736
.0 O
cri CO CO U) 5737
.71
5779
.0
5528
.41
5593
. 3 1
5487
. 91 CV
cD Ln Ln
Dep
th
FS
20
57
58.0
57
57. 0
56
49.0
55
98.0
5673
.0
561
9.0
5694
. 0
O (D CO (D in 56
88.0
0
CO in 5599
.0
5647
. 0
571
2.0
O CO CD (D in 55
25.0
56
26.0
N (D Ln CO Lf) 56
64.0
O if) CO N- Lf) 56
60.0
O (D CO N- Ln 57
80.0
(D CV Ln in 5591
. 01
5485
.01 0
M Lf) Ln
Dep
th
ES
20
5870
. 0
1 58
43.7
57
44. 0
O (D CO co Lf) 57
57. 0
57
03.0
O O CO N. LI) 57
10.0
56
78.0
57
25.0
57
90.4
5626
.5
5722
. 9
in N Ln r Lf) 57
48. 0
o O O CO Ln
0 o co r\ LI) 58
16.0
58
58.0
56
08.8
O CO ~ CO Lf) 55
79.0
56
01.6
Dep
th
MF
S2
0
5737
. 0
5735
.0
O N. CV l~n 55
76.0
5648
.0
O ~ CO I~
1 56
72. 0
56
71.0
O •co co CO
O r CO LÎ~ 55
77. 0
5 6
23.0
O CO co CO 56
47. 0
55
02.0
1 5
599
.0 O
T1 co ~ 56
42. 0
57
10.0
O ~ l~f) 57
07.0
1 57
50.0
1 54
98.0
l
O Ln co ~ 54
58.0
54
89.0
Dep
th
ES
30
5694
.0 O
N.: CO CO Lf)
O 4 r CO Lf)
O N co in Ln 56
17.
0
O CO N- Lf) Ln 56
54. 0
56
58.0
O if) co LO
O r CO LI) Lfl
O N. ~ Lf) if) 55
98.0
co CV Ln CD Lf)
O C') r CD if)
L 5
466.
0
1 55
78.0
56
18.
0
~ 5
618.
0 O cd h- (D LI)
O Lf) r~ CD Lf)
O cri (D Lf) 5717
.0
1 54
64. 0
L 55
24. 0
O C'') CV ~ 117
O C`') Ll) 3
Dep
th
FS
32
I
5689
.0 j O
CO CO CD in
O r CO Ln in
~ 55
15.01
5604
.0 1
5549
.0
5618
.0 O
CO CO Ln 56
19.0
O CD Cn LC) Ln 55
24. 0
55
79.0
1
1
5638
.0
5599
.0
5448
.0
5547
.0
5574
. 0
I 56
04.0
56
58.0
f55
96.0
1 56
64.0
O 03 CO CO Ln
CV I-: 'cr .71- Lf)
O CV Ln Ln 54
03.0
1 ~
5436
.01
Wel
l na
me
Ash
e B
2
lAsh
e B
3
U Cv L cn Q A
she
C2
lAsh
e C
3 lA
she
C4
lAsh
e C
5 lA
she
C6
I B
Ya t
es 2
B
Yat
es 3
1 B
Ya t
es 7
B
Yat
es 1
1 B
Ya t
es 1
3 B
Yat
es 1
5 B
Yat
es 1
8D
Cra
ft W
B 1
2-1
Cra
ft W
B 2
1-1
Cra
ft W
B 21
-2
IC Y
ates
9
IF Y
ates
7
IF Y
ates
10
11.G
. Yat
es 3
I.G
. Yat
es 4
11
. G. Y
ates
9
1 11
.G. Y
ates
13
I.G. Y
ates
14
I. G. Y
ates
18
I. G. Y
ates
19
1 I. G
. Yat
es 2
1 1
I. G. Y
ates
31
1 11
.G. Y
ates
32
L.O
. Fan
cher
1
L.
O. F
anc
her 2
1
L.O
. Fan
cher
3 I
1 L
.O. F
anch
er 4
1
1 L.O
. Fa
nche
r 5
1 W D
ewbr
e 1
W D
ewbr
e 2
19
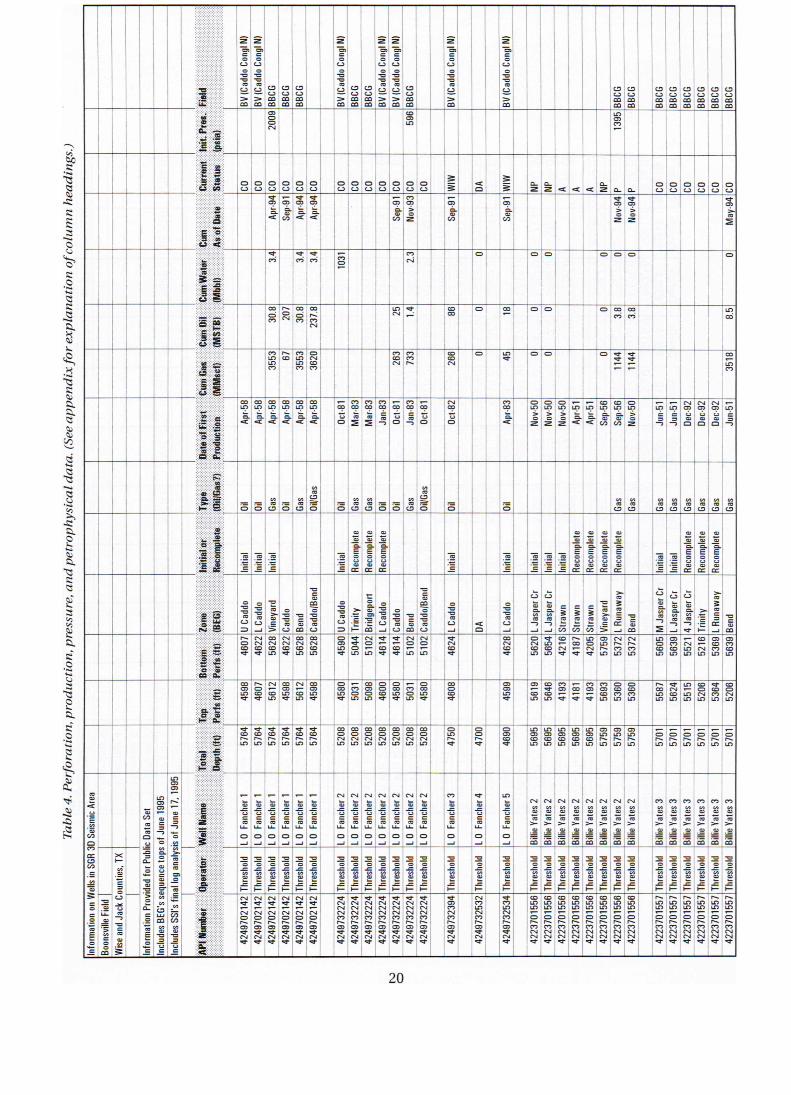
Tab
le 4
. Perf
ora
tion
, p
rodu
cti
on
, p
ress
ure
, an
d p
etr
op
hys
ica
l d
ata
. (S
ee a
ppen
dix
for
expla
nat i
on
of
colu
mn
headin
gs.
)
C.1 ~
BB
CG
I
BV ( C
addo
Con
gl N
I
BB
CG
BB
CG
BV (C
addo
Con
gl N)
BV (C
addo
Con
gl N
I
C9 1.3
BV (C
addo
Con
gl N)
I
BV
(Cad
do C
ongl N)
I
CO
BB
CG
I
BB
CG
BB
CG
BB
CG
f
C9 CJ CO
CD Li
CD C.3
BB
CG
I
O IO
M
000 acc
0000000 cccccc 6 3 ô 3
0.11- 0- z
00000
CN m aa
C C w
N Nov-9
31
m
V)
w
N é 2
é
Xa
2 w
M gr.... M Ô
M N
o 00 000
~ N
W m M.4: ~ ~
00 O m C PP
tn W
3553
36
20
L
2631
I
733
N
~
431
mm O~ 4 --
m Iÿ9 M
M "9
6 ~
Apr-5
8IAp
r-511
Apr
•5
Oct
-81
Mar
-83
M
ar- 8
3
Jan-
83
Oct-8
1
'
M.- œœ Ô
N m
Ô
A
pr-8
3
109•A
ON
O in
2 Nov-
50
Apr-5
1
Apr- 5
1 Se
p-56
Se
p-56
No
v-50 N N N
19 In a4 CA W Ln =won -3-31=c1=-2
Typ
e
IOhI
!Gas
?)
— 0 Ga
s ON
Gas
Oil
Gas
m z— C.7 O Ô O m?
m m
Ô rn O
1 _
p0
Gas
Gas
Gas
Gas
Gas
Gas
Gas
Gas
Initi
al
Reco
mpl
ete
Rec
ompl
ete
Rec
ompl
ete
m Ç
m ~Ç
.0
Ç
.0
~Ç Initi
al
Reco
mpl
ete
Reco
mplet
e R
ecom
ple
te
Rec
ompl
ete
Initi
al
Initi
al
Reco
mpl
ete
Re
com
plet
e
Reco
mpl
ete
Cadd
o 1
Bend
Cadd
o lBe
nd
O 9 ! O ' V C = F Br
idge
port
L Ca
ddo
Ca
ddo
Bend
C C
m
m C.l L C
addo
1
DA
I
O C m C7 J L
Jasp
er C
r
L Jas
per C
r St
rew
n
Stre
wn
St
rew
n Vi
neya
rd
L Ru
naw
ay
Be
nd
M J
aspe
r Cr
L J
aspe
r Cr
4
Jasp
er C
r
Trin
ity
L
Runa
way
Bend
N N CO CO CV N MM MW
..
CD Oi IH a tn
N ehme O Io Vi
N O In
O In
N {p Q
N
~ N ~
N I~ {p aD Ii) tn
m n a CO O N N a a a
m N N O n n n M M IO ü9 In
IC9 aD CO aO O M N Cn ao m In N M .....
m M m
O©f II~C
m m
Ii7 V
O CO M W ~
aD O O CO (Op m I~ O W
M 11~ O CO ~
m O W
Ca {CnD Q
q ~ t I~
M M O m O) ~ ~ ~
M O O m ~0j m IÂ In LL!
n a LL9 CO a m N O C7 IOn tÔ tlO LL7 Ill
CO O II7
S t[ ZS In ln
CO Ô Ô II ~ ~
Ô Ô Ô Ô Iü Iü LL7
Ô IIü
IOt) INn
Ô (Wp O m
IIl7 I~ m~ m ~ ~ 10 LL I! tlCl
LL09 ~~ 000000 4n l2 IO 1D LL I!
IInform
atio
n on
Wel
ls in
SGR
3D
Seis
mic A
rea
'Info
rma t
ion P
rovi
ded
for P
ublic
Dat
a Se
t
L 0
Fan
cher
1
I
L 0 Fa
nche
r 1
L 0 Fa
nche
r 1
L 0 Fa
nche
r 2
L 0 Fa
nche
r 2
L 0 Fa
nche
r 2
L 0 Fa
nche
r 2
L 0 Fa
nche
r 2
L 0
Fanc
her 2
L 0
Fanc
her 2
L 0 Fa
nche
r 3 —
1
L 0
Fanc
her 4
L 0
Fanc
her 5
Billi
e Yat
es 2
Billi
e Ya t
es 2
N '
m m
m
.07102E671
N E 72
m i
!Y>..>-!>.
N 61
m =
N
0
m —
N
â0
m — m
N E O
m — m Bi
llie Y
ates
3
Billie
Yat
es 3
Bi
llie Y
ates
3
Billie
Yat
es 3
Bi
llie Y
ates
3
M
E Vm Y m _ m
IBoo
nsvil
le F
ield
I
Wis
e and
Jack
Coun
ties,
TX
—
Ô .= CA
..-
O O a L m m L L
—m— O O Ly Ly m m C L
O O O L Lg Lm m C ` L L L
O Lffi
C L
O Ly m L
O Lg N L
o L
m L
m O a m ...
C 9 O O L L
m ` L i
C O L
m C
S O
..
9 O
C O
m t
m O fLg ` L
9 O L
` i
---m-- O o o O O ===== ` CA CD CA 0
` CO ~ m L L L L L
O L
E L
42497121
4248
7021
42
4248
7021
42
4248
7322
24
4248
7322
24
4249
7322
24
4248
7322
24
4249
7322
24
4249732224
~ 4249732224]
I 42
4973
2384
I 42
4973
2532
I
424
0732534
4223
7015
56
4223
7015
56
I 4223701556
S H9
O n M
~
I 42
2370
1556
] I
4223
7015
58
4223
7015
56
I
4223
7015
56
4223
7015
5 7
4223
7015
57
4223
7015
57
422 3
7015
57
4223
7015
57
I 422
3701
557
20
Tab
le 4
(c
on
t.)
!Due
l com
plet
ion
with
Cad
do in
itial
ly.
J
Adde
d L
Cadd
o p e
rfs, c
omm i
ngled
wI U
Cad
d~
Prod
uced
com
min
gled
wIL
JC o
n ly u
ntil 2
.92.
1
Prod
uced
com
min
gled
wIM
JC o
nly u
ntil
2.92
. 1
(Com
min
gled
with
Ben
d 12
.91.
Com
min
gled
with
Ben
d 12
.91.
All z
ones
now
com
min
gled
.
Wel
l con
verte
d to
wat
er in
j. 12.
92. J
Wel
l dril
led a
nd a
ban d
oned
, 3.8
3. 1
W
ell c
onve
rted
to w
ater
inj.
12. 9
2.
Com
min
gled
pro
duct
ion -
all z
ones
. T
~ntlia
l zon
e com
plet
ed.
Perts
squ
eeze
d 4.
51. 1
Adde
d pe
rfs 1
2.92
. J
Adde
d pe
rfs 1
2.92
.
CO h
p mIV
lm. h h
!'V 000
1n
4., 1n
Ô h m
Ô < ~
2
' ~
m
ca
.
CO h M
W h
~ N a N l...11...
.- Ô L7 N
Ô
m M
MW
~ ^
h
m M
Wh
Ô M N M
1n
Cl
W
W.
f~ <
2
m M
go-
LV N
.
ne.
M
m .-
Pf LV
MI-
N
m
m N
h
M
<
ci m h m!V
m N ~
m 1~
m ci
< m
2
r m l7
.
m m
m m
m LV
m m 1[1
N m
m 6
m 0 Na6
49
t.
NID C4 _
H7 K! ^
m
2
m ^
m
N
.
h m ~ ^ m m MM
~~
Cro
ss
i
hic k
(tt) X W ~
^ m -m.4
-
^ m
2
tn
m m
.
m~ _ ~
O
ô c =-i
O
C
Vine
yard
Cadd
o Be
nd
Cad
dolB
end
O
6 =l-
c
Brid
gepo
rt
O
6 J Ca
ddo
C ô 020
C O m
â >
L Ca
ddo
G
O
c J L
Jasp
er C
r
L Ja
sper
Cr
Stre
wn
;
V) ~ ~
31
N Vine
yard
L Ru
naw
ay
Bend
M J
aspe
r Cr
L Ja
sper
Cr
4 Ja
sper
Cr
:G
~...
H L Ru
naw
ay
Bend
h O
44
N N
m N
1mn
N m N N
4 1mn
m N
ImC/
O m
~ in
N O
1n
a L-
4 < N 1- O
4 Ln
N O
1n
< N ~
m N ~
O N 1c[
m ~ ~ 1mO ~~~
h CO
1O 0
m N N m h h
Ihn 1~ 1L7
1n O
~~~
m —mm M N
L1~
-mm
m
CO
~
GO CO IA ~
h
O
~
~
CO Ln
GON m m
~ m
m m 1n ~
~
1n W
M 00 LO
m CO
W
O
~
00.- m MW tf9 O ~ LL~
O
1A <
m O
~
m m 1n V
m
m M
M m
LOW
M m CO
< V
---comm
M O O m m CO
m LL7 LL!
h < ^ m N b m Id 1n M 1n
m O N üY
W. m M 1n
tO O N ID
a h 10
a h MM
a h 57
84
5784
57~
I
5208
52
0*
Ô N b
5208
1
Ô O N N LOW
Ô N 1n
1~ h <
h W.
COi CD R
rn La LO
rn m cO La LO Ln
Omi
(O LO
W' (O LO
ID 1[mf Ifmf h h h
. MM 1n
O O h h MM
Info
rmat
ion o
n W
ells
in S
GR
3D S
eismi
c Are
a I
Info
rmat
ion
Prov
ided
for P
ublic
Dat
a Se
t
L 0
Fanc
her 1
m
L,d C O
LL
O J L 0
Fanc
her 1
L 0 Fa
nche
r 1
L 0 Fa
nche
r 1
L 0 Fa
nche
r 1
~
L 0 Fa
nche
r 2
N
m
Û C O
1L
O J L 0
Fanc
her 2
[L 0 Fa
nche
r 2 J
L 0
Fanc
her 2
L 0
Fanc
her 2
L 0
Fanc
her 2
11 0 F
anch
er 3
1
L 0 Fa
nche
r 4
—1
L 0 Fa
nche
r 5
N
Ti ' r
_ m
N
CO r ' c d m
N N
~ W I Y , el ' ro ~ m
N
N r ai _ m
N _ i
N
m
N Ô~
~I To- Y N _ m
N
t~a r _ __ _
N
.-. Ÿ
m
M 61 Ii Y m
ell
M
~R Y Oi _
m !Billi
e Yat
es 3
I
IBoo
nsvi
lle F
ield
j_
! W
ise
and
Jack
Cou
ntie
s, T
X
LL
g
L Ô
L
====== L
Ô
L
o o
L LL
Ô y
LG
O
0
L
C
O ~
C
O yy
C
O 2~
s
O
C C O O
~p
C O
yy LC m L
C
L L
C
L C I C O O L L
dd
H H
O L
N
H
o L
d
r
======
O L
d
H
o L
m
H L
0 L
m
H m
o L
H
O L
m
H
===== 0 0 L L
mm
H H
O LL
y
H
0
yy
r
C 0 L
d
H
4249
7021
42
4249
7021
42
4249
7021
42
4249
7021
42
4249
7021
42
4249
7021
421
4249
7322
24
4249
7322
24
4249
7322
241
4249
7322
241
4249
7322
24
4249
7322
24
4249
7322
24
~
424
9732
394]
F42
4973
2532J
I 4
249
7325
34
I42
2370
1556
42
2370
1556
4223
7015
56
I 4
22
370
1556
1 I
4223
7015
56
I 4
22
3701
5561
42
2370
1556
I 4
22
370
1557
42
2370
1557
' 42
2370
1557
1
I
4223
7015
57
4223
7015
57
I
4223
7015
57
21

Tab
le 4
(c
on
t.)
I AP
I Num
be
r O
pera
tor
We
ll N
am
e T
otal
Top
B
ott
om
Z
on
e
Init
ial o
r T
ype
Dat
e o
f F
irst
Cum
Ga
s C
um O
il
Cum
Wa
ter C
um
C
urre
nt In
it. P
res.
Field
D
ep
th (ft)
Po
ils Iftl
Per
fs (ft
) .:
9
J...
.::
Re c
om
ple
te
( OilI
Gas
?)
Pt0
4fltt
ien
IMM
scf)
IM
ST
B)
(Mbbl)
As
of D
ate
S
tatu
s (p
s ial
C7 U m CO 1B
BCG
I
C7 C1 CO m
C7 C) m m
~
1BBC
G I
BB
CG
C1 C7 m O)
CD C1 CO CO
CD C3 CO CO
CD C1 CO CO 1B
BCG
I
C7 Ci CO O3
0 C2 CO m
Cf C. m iD
Cf C1 CO m
C7 C. CO CO
CD U CO CO
C7 C3 CO CO
C7 C1 m CO
•
CD C. m O]
0 C3 m CO B
BCG
Dees
(Ato
ka)
I
Iii Y O Q ~ mO B
BC
G
BBCG
BBCG
BBCG
BBCG
BB
CG
 N CO
CO 1 ~ Q
N 07
m m el
~ ^
07
N
O m
n
^ in n
< CJ d {1}
d O. C7 C.3 Cl C1 C. ~ C7 Cl C. Ci U C1 C. G Ci C. C. C1 C1 6 D_ d C. C/ Cl C1
~
X C
X C 6.
X C
O C
7 Jan-
94,
X C
"I
X C
7
Ô
•C
r Se
p-95
11
~ C
m C '
m C ' De
c-78
1
m 6 0 Z Oc
t-92
Ja
n-94
a
C 01 ~
a C O 7
N ID
N 10
I17 O9
ID m
O O CA n
Of n
N G
N p
n O p
1~ p
co nj
a.02 ri ri
O O O O CI rr G
Ô ~Ô
O O I, af
r 24;
O O Ci
O ci
n m
5722
1\ ~
W ~ CO CO
INi) 01
IND O ~
N ^ ^ N Nn.
2230
_1
Ô O N
Cl) N
V 122
n 1D g O
fA Sep-
57
Sep-
71
L
Jul-7
1
1 Ja
n-84
1
C O ~ M
ay-8
5 M
ay-8
5 M
ay-8
5
m > tel _.
m j q 2
Ô C p > Ap
r-951
Ap
r-95
Ap
r-95
W C r0 >
n C = ~
m O. O
CO
1` C J ~
CO
C O ~
n H O O De
c-78
1
CO
6 Q
Co
6 6 Ja
n-58
1
Sep-5
71
Oct-
92
{Û G
CO Feb-
581
CO
~ Feb-
58]
Feb-
58
N m 0 G
as
Gas N
o C7
os m
C7 cc m
CD 1Ges
Gas
Gas
boas
oc O
CD
a O
CD 1Gas
N m CD Ga
s
fA o i:!
Ao a CD
co o
CD
N 01
CD Gas 7
~Gas
I
q
Cf 0 ~
CD m 0
cc C7
m C7 Ga
s
Gas
N m CD
w m Cf
Cl m C7 Ga
s
Gas
Reco
mple
te
m -
~Ç
To ~Ç
To ~Ç
m ~Ç
m ~Ç
m ~Ç
â ~Ç
_ ce
~Ç
O I")
É O Y ¢
O m
É O H ¢ *c
ompl
ete
J
_ Ie C ~~
O m g. O u ¢
_ o G Ç Re
com
plet
e
Reco
mpl
ete
Reco
mpl
ete
Reco
mplet
e
Initi
al
Reco
mplet
e
m
~Ç m ~Ç
ô
~Ç
L Ja
sper
Cr
Vine
y ard
Bend
Vine
yard
C = O7 Vi
neya
rd
C = O7
> - 'C I- M
Jas
per C
r
1L Ja
sper
Cr
[vi
neya
rd
1
C m
CO U Ru
nawa
y 4
Jasp
er C
r LM
Jasp
er C
r
L Ja
sper
Cr
Bend
1
i ~= 'L I- Vi
neya
rd
Bend
Ç
m d C' ~I}
Z O
agi _> ç ~C c
CO H
Ô
r? = ¢
U
N w . CO
C O 07 Vi
neya
rd
L Ja
sper
Cr
—
C o CO Vi
neya
rd
1
_> C
Iç Brid
gepo
rt _]
Bend
m
10/7
O
100
In ~
~
N ~~
07
N ~ f0 ( fpp IO
N LL7
~~
O m~
M
In
LL7 n In
â n IO
~ M in
Lif O
W ^ ln IO m O
CO m I/7
O N 47
n IO
n O
I, n Iif
I n ~ N ln
I m N lC,
m ~ P~9 il,
l~7 ~ LO
1 1~ Â 1D
CO 1~ O^
ID 10 ID
Oi n ici
N
n 117
(7
N 1.0
N
P07 ID
N
n ID
10 CM ~ N ImD 100
CO
407
m
u07
O CO 100
O CO LL09
m N
LLN7
CO
u07 a u09
~ 17 n
n N
1Â
n
10if 0
O~ n ü7
N^ o D b
co o If l
co m
LLm7
07 o IÔ
m ID 10
t7 CO LLN9
hi N IN
C23 co M!
O A 0
N N b
N n CO
ID {OD 07 {OD
N ID
110
O N Of 1Ô 4N7
N
IÔ
 n 10
 A 1.0 57
731
100 1~ ID
IOO 1, sa
Ô CO O
Ô CO 0
m 07 ID
m m ID
m m O
122 m 1I7
m 07 1O
IOO A 10 57
50
{Oif n O
100 n b
~ n H9 57
83
m n ID
m n O 1/7 ~~~~ 1I7 112 ID 59
451
a in
m m LO 1.0 5907
O m~§
O O m O
Billie
Yat
es 1
Billie
Yat
es 7
1Bili
e Yat
es 7
Billie
Yat
es 11
Billie
Yat
es 1
1
Billie
Yat
es 13
Billie
Yat
es 13
Billie
Yat
es 15
Billie
Yat
es 1
5 1
^
61 m Y ca Di Bi
llie Y
ates
15
Billie
Yat
es 1
5
Billie
Yat
es 1
8D
Cl
Billie
Yat
es 1
8D
Bi
llie Y
ates
180
O Co
Clÿ N Y
_ m
O m
e }
_ m
N
~
Ô Ci
~ ÿ 7
m C.
co ÿ 7
m C.9
r ,
te Y
Ni
r~
A Y
Ô .....
r~
tC Y
Ni
r~ N d (D Y
m
h VI O O Y
Ni
laye
tte Y
ates
1
Faye
tte Y
ates
10
Faye
tte Y
ates
10
rFay
ette
Yat
es 1
0
I G Ya
tes
3 _ _
~
I G Ya
tes
3 IG
Yate
s 3
i7 co m m a-CD -
C O L
` L
V O .= Ô L
L O a m L
C O a m L 1--
C O .= Ô L 1-
1=1 O L CO L 1-
O
m L I-
6L p1
C O a O t H
C O Lgq O L 1-
O a m L I-
0:1 O a O L I-
O a m L I-
1=1 O a m L I-
O a O L I-
0:1 O a ~ .= I-
C O LN ` .= I-
C O Ly 61 L I-
C O a O
~
C O a ` L I-
C O a m L I-
C O a O a I-
C O Lyy m a I-
C O a O a I-
C O Ly ` a H
C O a m L I-
C O a m a I-
C C O O a a m Ô a L I- F-
C O L
m L I-
C O L
m L 1-
C C O O L L m m L L I- I-
C O L Cl
L r
4223
7028
121
4223
7028
121
4223
7028
121
I
4223
7303
151
4223
7303
151
I
4223
7358
631
4223
7356
831
4223
7387
111
4223
7387
111
4223
7367
111
4223
7367
111
4223
7387
111
4223
7381
301
4223
7381
301
I
4223
7381
301
4223
7381
301
4223
7381
301
4223
7302
801
4223
7302
801
I
4223
7302
80
4223
7025
98
r 422
3702
599 1
I
4223
7025
991
4223
7025
99
4223
7025
991
4223
7025
891
I 4223
7025
96
4223
7025
96
422370259
3
4223
702 5
93
4223
7025
93
4223
7025
93
22
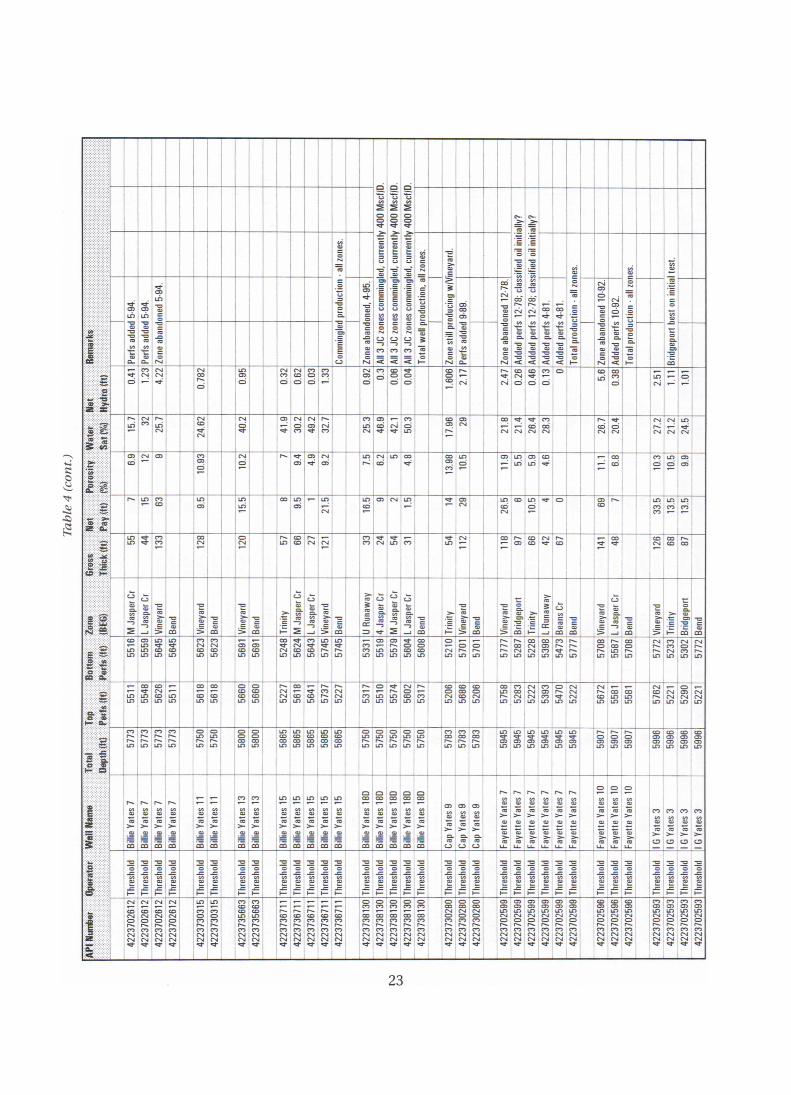
Tab
le 4
(c
on
t.)
AU
3 JC
zone
s com
min
gled
, cur
rent
ly 4
00
Msc
f!D.
All 3
JC
zone
s com
min
gled
, cur
rent
ly 4
00 M
scf!D
. I
Cr.
m
Adde
d pe
rfs 1
2-78
; cla
ssifi
ed o
il in
itial
ly?
I
(Com
min
gled
pro
duct
ion -
all
zone
s.
All 3
JC
zone
s com
min
gled
, cur
rent
ly To
tal w
ell p
rodu
ctio
n, a
ll zo
nes.
I
Zone
st il
l pro
duci
ng w
!Vin
eyar
d.
I
Adde
d pe
rfs 1
2-78
; cla
ssifi
ed oil initi
Tota
l pro
duct
ion -
all
zone
s.
I
Tota
l pro
duct
ion -
all
zone
s.
!
Brid
gepo
rt be
st o
n in
itial
test
. !
i I
IPer
fs a
dded
5-9
4.
IZon
e aba
ndon
ed 5-
94.
Zone
aba
ndon
ed, 4
-95.
IPer
fs a
dded
9-89
. I
Zone
aba
ndon
ed 12
.78.
1
Adde
d pe
rfs 4
.81.
Ad
ded
perfs
4-8
1.
Zone
aba
ndon
ed 10
.92.1
Ad
ded
perfs
10-
92.
^
I 4.
22
rG Ô
~mÔÔ
ÔÔ ~ ~
MO
80
'0
I 0.
04
Ô m r lV
I 2.
47
Ô O ô ~ O
If) 0.38
!
fV .- O .-
(No.. N N m N N V~~
r M
{MIl~l m
N4c-46 .-m 4m n
mm N
m N
4 N
a N M N
r N a N
N N .....1: N N
LL9
^ m M C
N Ô
r4 m m 4M
lV Ill r N m
10 m Q ~
mm Or
m ^
Ill If) m Ifl m V
.- ^ m m
M 666
m m
^ M m
Ill m
If) ~
m If) ~ m
Ill fV
LLl ~ m N ID
.- ^ m
N Ii) m
N
Ill O 4 O m mn IO
m.-.-M If) ID
m N
O N
r m r IL) m N N
M M ~ N M li)
MCA ~
m r m m m N Q m r ~ ~
cow m
Vine
yard
Be
nd
Vine
yard
I
m m Tr
inity
M
Jas
p er C
r L Ja
sper
Cr
Vine
yard
m m L
Runa
way
I
[4 Ja
sper
Cr
IM Ja
sper
Cr
IL Jas
per C
r
m m ^ 'Ç Iz
>.0 E > a. C y Be
nd
Vine
y ard
Brid
g epo
rt
> ~
•C e=_,
m 3 m C S
Bean
s Cr
I
Bend
1
Vine
yard
L Ja
sper
Cr
Bend
Vine
yard
Brid
gep o
rt Be
nd
L 55
18
mm PIN WW Nl Ill
m WW If) m
LLl
~ M ~ N ~ lV m If) If) IA
M) ~ r In
Ip ~ r Ill
M M ILf
If) IO
œœœ r IO In S m Ill O m LLl
O
M
.-00 C.41...1,
W M
r r r m r lV IO Ill
m N N IO
m m M~ m
M r r r r Ill
CO Or M
r CO WO I[) r MM
N r r In
M M N IO
N O M m
N r r m
cow WW DLL
O O mm mm MM
1...0
NW N iM
r ~
bO r m
N N m
r
M b O
m O m
a
r M
~ f M N
0 r N Lol
000 m N
l
m M
)m r N mm
N
N N O
M m
O
Opp~Ol
MM N O
r N N
N r IO
COMM m m
IlO m P.
m NN m 8 N N lD
N l
~ O 11[ r r MM
pO
mm MM
....pt
mmm If) K) If)
m IO m IO
~r m
~ r IO rr r IO Ill Ill
m r LL)
M O r LL)
m r ü')
Sa MM
~ M
m M
rn M
rn M If)
000 If) IL)
W If/ LLl
m m m ül If)
' MM .-
_
w
W
.- â
> m
M
m
m
m
.-.--...• W
â)
m
m
M
m
> m
m Billi
e Yat
es 15
» >>
Billi
e Yat
es 1
5
Billi
e Yat
es 1
8D
I
0 œ .- m
m
m
00 œ œ .-,-
_=
m v >>
m m
mm
0 œ .- d
m
m I
>
rn m
O C.)
m m
a O fi
CD
T -
rn â)
o m
C.3
I
r r
m m a
L i IL
~~
m m
r
m n
>>>>>> I L
r
â m a am
Om
r '
y ma
r d m a m
m L
O
m a> ~
>Ii COMM
WO
m
a
a >> LL LL
m
M ffi
— I G Y
ates
3
I G Ya
tes 3
I G Ya
tes 3
Thre
shol
d ]
mm O LL ym L r
e
d L I-
C
L d L I-
co C
L N ~ H
I C C o co L L d 6yl ~ L f= H
C
Lq m L H
C 0L Ô
1-
C 0L Ô
I— -CLL.....
C , C 9 000 LL L d 6) W
` I-
•= = O O
(Lp L m ~
L~ L I- I-
= O L
L H
I C O . L m = r
m C C C C O O 0 O O L L L L L d d d d d L IA ` ` L H t- H H H-
•= = =
_ O ~
d 6) Gi ` ` ` H 1- H
my 0 N H
0 . N ~ I-
C 0 .0 Ô L H
C 0 L d r H
4223
7358
83
I
4223
7356
631
I
4223736711
]
I 42
2373
8711
1
4223
7367
11
I 42
2373
6711
] r4
22
3736
711
4223
7381
30
4223
7381
30
4223
7381
30]
I 42
2373
8130
I
4223
7381
361
4223
7302
80
4223
7302
80
4223
7302
80
m O ul N
M CNI i .1.
000,0100
m l m O O O O 119 If) In NNN
MMMNNN I
O 0 u) N
MICSIQ .11.
m O If) N
M N
Co O Ic) N N. MN .11..Ir
cD O u) N
^ MN
<D MMMM O O) O) O O) IA) In Ic) LLl In N NNNN O
r 00=0
• MMMM N N •N < C C0. R
23
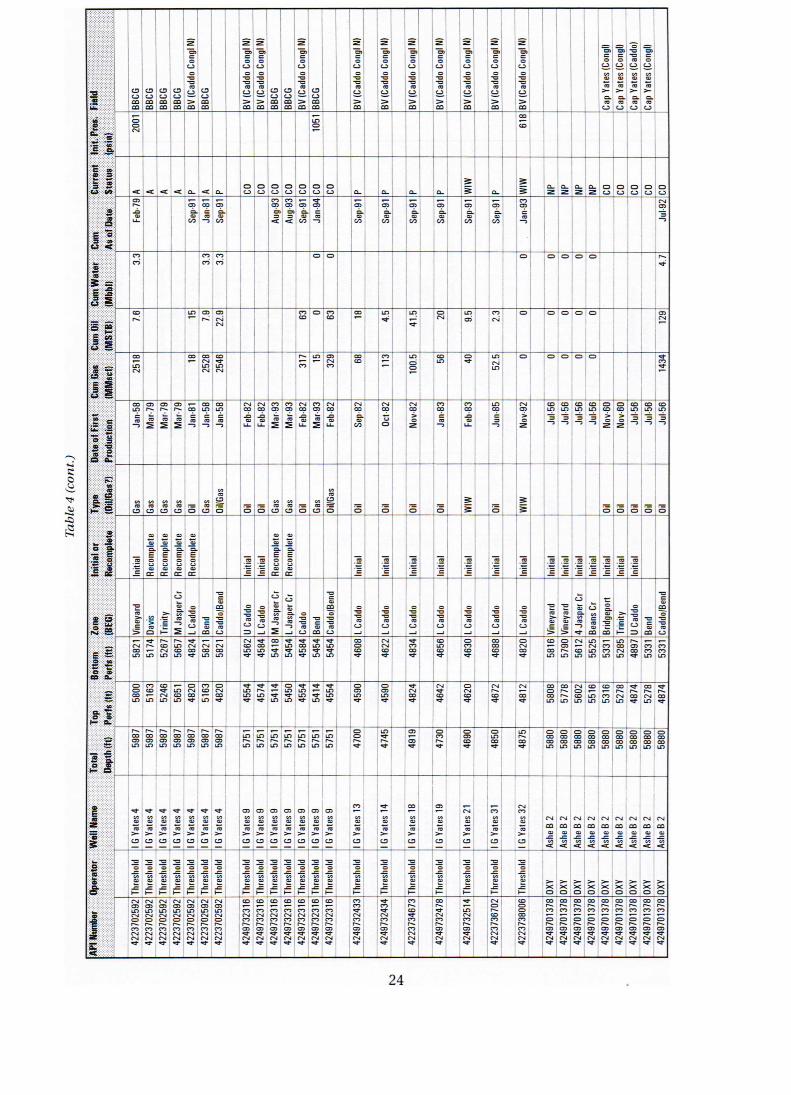
Tab
le 4
(co
nt.
)
API N
umbe
r O
p era
tor
We l
l Nam
e T
otal
Top
B
otto
m
lone
Init
ial o
r T
ype
Dat
e o
f Firs
t C
um G
as
Cum
Oil
Cum
Wa
ter C
um
C
urre
nt In
it. P
res.
F
ield
Dep
th ( H
) P
arts
(ttf P
orts
(It)
IBfiij
!,
Re c
omp
lete
(O
iI!G
as?)
P
rod
uct ion
' !(1M
Nic
1)
IMS
TB
) ( M
bbl)
As
of D
ate
S
tatu
s (p
s io
)
CD m CO BB
CG
I
CD CO CO
CD m CD BY
(Cad
do C
ongl
N)
I
C7 CO m BV
(Cad
do C
ongl N
)
BV (C
addo
Con
g l N
)
18B
CG
CD m m BV
(Cad
do C
ongl N)
I
CD m m BY
(Cad
do C
ongl N)
I
BV (C
addo
Con
gl N)
I
BV (C
addo
Con
gl N
) I
Z Ô e U O p p
Cmi i BY
(Cad
do C
ongl N)
I
BV (C
addo
Con
gl N)
I
BY (C
addo
Con
gl N)
I
c
CO Cap
Yate
s (Co
ngl)
I Ca
p Ya
tes (
Cong
l)
â p o 0 N m
Y
: C.) Cap
Yate
s (Go
ng!)
I
O O N O — O
m
c a c a O. c O. CO) CO.) CO.) Û CO.) CO.) CO.) d CL L L 3 d 3 c._ 2 la.. Z CO) CO~) CO) CO.) CO)
~ ~ Ci
W 6
VJ
m C ~
âo G V)
a~o •Ô 6
I Au
g-93
â) 6
N ~
~ C
L8-d es 1
m G V)
ô) p
N
âo p
V)
m 6
N
m 6 ÿ
m C
~
m s ~
O) C7
r 3.
3 C9 ri
O O O O O O O P. .11,
I m ri
I
IC) ..- ^ C9 CO
N Co) m co P) CO CO {O
V IA ~
O N LL) m
CO Yi
O O O O O CA ^
CO ii- N
r
CO ^
CO CsiN
CO N
r... C9
m COP
CO CO e O
~ 5 LL) O
O N
O O O O
Jan-
581
Mar
-791
M
ar-7
91
+
Mar
-791
CO C
> Jan-
581 CO
1C) C
> Feb-
82I
Feb-
82
Mar
-931
C.) CO W r2
N CO G ~
I M
ar-9
3 Fe
b-82
I N CD C. Cc) Oc
t-82I
N CO ! 2
CO CD C
~
CO CD L Ii
It) CO C r
N CO ~! e
CD II) 7 ~
CD b 7 ~
CO 07 7 ~
CO 1I) 7 ~ No
v-60
1 O CO ~ Z
CO IO 7 ~
CO I[f 7 -)
~ 7 ~
Gas
Gas
Gas
Gas
ô Gas
m 0 c~ ~ ô ô ~ Ga
s Ga
s
ô Gas
a 0 C~ ô ô ô ô ô
3 3 ô
3 3 ~ ô ç é ô
I I I_
~,In
~ Ç Reco
mpl
ete
I R
ecom
plet
e m m
E e u ¢ Re
com
ple t
e
ô ~Ç
ô ~Ç R
ecom
p let
e Re
com
plet
e I
ô •C
ô •Ç
ô ~Ç
m ~Ç
m ~C
ô ~Ç
ô •~
m •~
m ~~
Te .Ç
Te ~Ç
ô :E.
ô :Ç
ô •Ç
!Vin
eyar
d
•~ O L7 Tr
inity
M
Jas
per C
r
m
Ô U J Be
nd
Caddo lBend I
p p o
C.) r
C
W U J M
Jas
per C
r L
Jasp
er C
r Ca
ddo
Bend
pC m
LD Ô C o C.)
C m C] J
C Ô C) J L
Cadd
o C Ô C) J
C ~ U J IL C
addo
1
C pm C.) J Vi
ney a
rd
!Vin
eyar
d 4
Jasp
er C
r de
ans C
r
Brid
g epo
rt
Trin
ity
U Ca
ddo
Bend
p C o m Ô ~ W C)
1C) m~
Ii) CO O
m O ~
N CON LC) aND LC) 1~ V ~ V uV,
m~ ~ IO V
â LL)
I~C!
LL)
Ô N W
X 4 1C
Opd
â CC~Opf
V {mp R
pNp Q co
IA 0 LC)
CO 0
LC) C~~) LL) IA
CO
ua ego â
C~') LC)
M IC)
Ô
b m ii- O
R LC) O CO N
~ m IC)
N V
1VC) ~
n V
~ ~ ~ ~
~ 1.0 V V
an ~ V
m ~
W W
N W
N ~
N W
nLC) n 4
N ~
CO
IC
CO
O Ô I1~7
CO 0^ 1OA I~A 1[N)
p np V
CO LO
CD V
n CD 1Û
L 5
987 n
m 1~
n CO 10A
is CO ~
n CO tOA
n CD IOA
IA IL
1A IO
^ IA LL) ~ LC) IA 1[
I
1Î
~I ^Î^~
Ln
LL) LL) LL) V
1A V
CA
~ ~
O 0 O 48
501 lA
~
O O ~ O 3 CO m 3 m â ILOf ~ if 1D
O CD LLm) 5
88
O CO I~A
O CO CO
IG Ya
tes 4
IGY
ates4
CL m T O
CO m
Y O
~
CO m
! O
CA m
Y C7
C2) d
T O
CT
a U'
CO m
T O
~ m
T O I
G Ya
tes 1
4
IG Y
ates
1
8
0
2 Y O IG
Yate
s2l 1
!IG Y
ates
3l
~
CON ~
T O As
he B
2
AsheB
2
Ashe
B 2
Ashe
B 2
Ashe
B 2
AsheB
2
AsheB
2
Ashe
B 2
Ashe
B 2
Thre
shold
Lg Lyy m m L a I-r-
C ~ C
v
Lyy • L
lo
Lyy m L r•r-rr~~ I-
lo
Lyy m i
lo
Lpp • L
lo
Lyy m C
p
a m C
v
a m L I-
S t Ô L I-
S L E C I-
? LWq O L I- CO
? L P i I-
S a F a I-
3
O G Y
tqq Y Y T Y T T T T Y X X X X X X >C X X 000000000
I4223702592
4223
7025
92
I 42
4973
2318
1 I 4
2497
3231
6
I 42
4973
2316
I 42
4973
2316
I 4
2497
3231
6
I 42
4973
2316
I 4
249
7323
18
I 42
4973
2433
1
6 N C9 n 4 N V
I 42
2373
4873
1
es N C7 n 4 N V
I 42
4973
2514
I 42
2373
6702
I 42
2373
8006
4249
7013
78
4249
7013
78
4249
7013
78
4249
7013
78
4249
7013
78
4249
7013
78
4249
7013
78
4249
7013
78
4249
7013
78
24
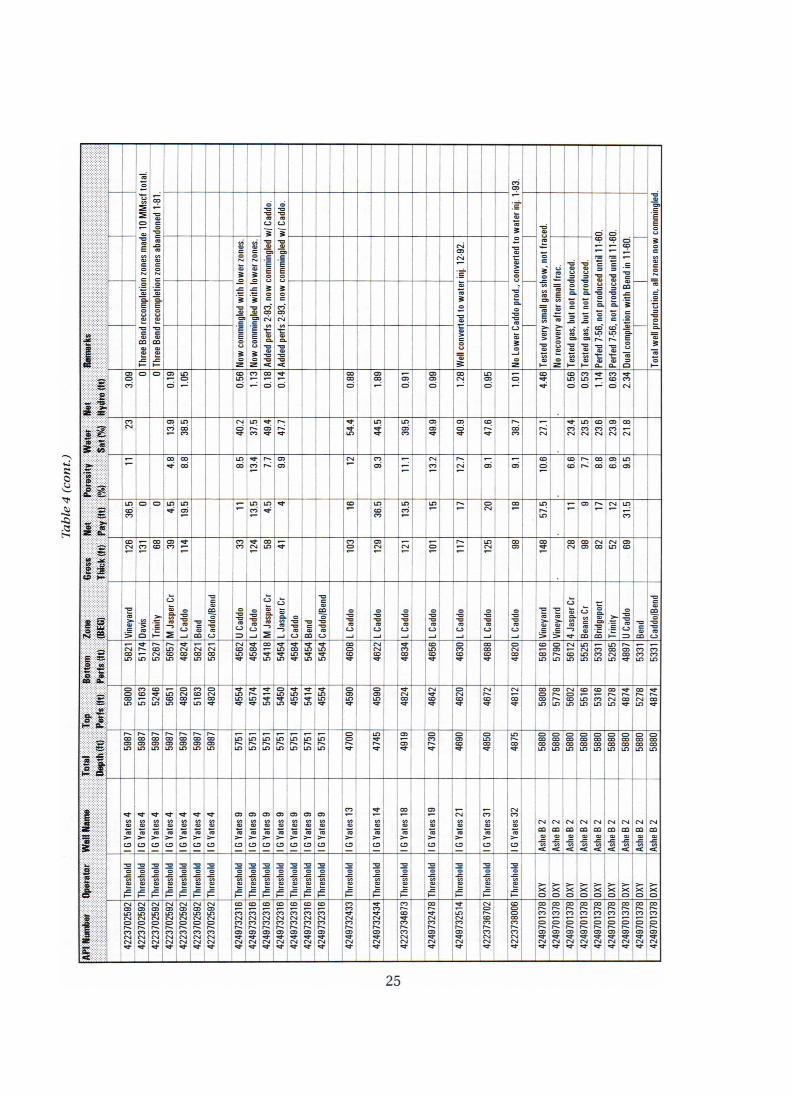
Tab
le 4
(co
nt.)
Tota
l To
p B
o tto
m Z
one
C
ross
N
et
Po
ros i
ty
Wat
er N
et
ttem
ar k
s
D p
th(M
Po
rts
Ittl
Perl
a (M
18
FG)
Thi
ck ( I
t) P
ay ( t
t l
W.)
Sat (
%1
Hyd
ro till
Thre
e Be
nd re
com
plet
ion z
ones
mad
e 10
MM
scf t
otal
. Th
ree
Bend
reco
mpl
etio
n zon
es a
ban d
oned
1-8
1.
I
1No
Low
er C
addo
pro
d., c
onve
rted
to w
ater
inj.
1.93
. I
Tota
l web
pro
duct
ion,
all
zone
s no
w c
omm
ing l
ed.
Adde
d pe
rfs 2
. 93,
now
com
min
gled
*Ca
ddo.
Adde
d pe
r fs 2
.93,
now
com
min
gled
wl C
addo
.
Tes t
ed v
ery
smal
l gas
sho
w, n
ot (r
aced
. 1
Porte
d 7-
58, n
o t p
rodu
ced
until 11-8
0.
Perfe
d 7-
56, n
ot p
rodu
ced
until
11-
80.
Duel
com
plet
ion
with
Ben
d in
11-
60.
Now
com
min
gled
with
low
er zo
nes.
No
w c
omm
ingl
ed w
ith lo
wer
zone
s.
Wel
l con
verte
d to
wat
er in
j. 12
.92.
1
No re
cove
ry a
fter s
mal
l fra
c.
Test
ed g
as, b
ut n
o t p
rodu
ced.
Te
sted
gas
, but
not
pro
duce
d.
0 0 ~
Ô
ID O '-
co in Ô.--
ri O ^
Ô O O O O
O co .
O O
~ Ô
co N ID O
Ô O ~
ni CO ID Ô
CD ID O
et .- •••:
M O O
V ce fV
O .M-'
in
!O•) pNp ~T
49 e? 1~
M w Q •f s
Kf Z
{O CD
m 4 p
Op R
O ~
1~
M N • ~
N W
N CO
N m
N CO
N
CO et
CO CO
It) CD
a n CO P7 1s: ai
N .— M W
N Of
1, IV m m
O Ô
O ID
n ri
CO m
W m
O ai
O O It) ~
O O
L- ~ 1O Il) et
^ ~ O ^
L
ID ~
ID ~
ID ~ 1■ ~ Cl N CO ~ LL) ^ ID
•
~ ~ O 1, ~ N ^
LL) •
M O O^ CO M CI M et CO N {O ~ M O O N N O 1~ LL7
N O O W
•
CO N CO O N CO
N ID
O CO
O W 'G
Trin
ity
M J
asp e
r Cr
L
Cadd
o
C C co
co
v c C O 9 C m C) U
Ca d
do
L
Cadd
o
M J
aspe
r Cr
L J
aspe
r Cr
Ca
ddo
[B
end
Cadd
o lBe
nd
L Ca
ddo
1
L Ca
ddo
1
e 1:1
C V J
e 'CI O V J
e .17
O V J
o C m V J L
Cadd
o 1
Vine
yard
[Vin
eyar
d 4
Jasp
er C
r
Bean
s Cr
Brid
gep o
rt
.0 C •= I—
0 Ç f0 U = Be
nd
Cadd
o lBe
nd ~
n O~
m LL I~
N ~
N Ln
N IÔ
m Ô~ gg ~ CO et et
V CO
~ N
~ g
~ O
~ ~ ~
CO
v N °~
~ IOD
W In
N IOD
N IIL
M IMn
COO
in
m etv
M IMD
M IL~
0 ~ O
ID ~ 11~
N 10
4
m 11f
N 4
I~ ~
n ~ IQ Op ~~ {D~
4 S {L1 W M O m ~
~ Q
N w
N
f N w
n w
N Ii■
w Ô
CO
in ü O ~ Ln IIÔ
O ^ LL/ in
n CO
CO
IND
n CO
n O O 4)
n n CO CD O O ID ID
n 04 O
1 59
87
n CO O ID
O 1~ H) 5 7
51
5751
57
51
5751
1D I~ LO
O 1~ ID 47
00
IO ~ 1~ ~
O
4 4730
1 O O 0 R
1
O LL) CO v 48
751 0 0
CO CO ID ID
0 CO In
0 CO ID
œœœœœœœœ 0 CO IO
0 CO LO
0 CO ID
0 CO lo
0 CO In
et
g m > CO IG
Yate
s 4
IG Y
ates
4
IG Ya
tes 4
IG Y
ates
4
IG Y
ates
4
IG Ya
tes
9 IG
Yat
es 9
IG
Yat
es 9
IG
Yate
s 9
IG Y
ates
9
IG Y
ates
9
IG Ya
tes 9
I G Ya
tes
13
IG Ya
tes 1
4
IG Ya
tes 1
8
I G Ya
tes 19
IG Ya
tes
2l
1 I G
Yat
es 31
I G Y
ates
3
2
Ashe
B 2
Ashe
B 2
Ashe
B 2
~
Ashe
B 2
I
Ashe
B 2
Ashe
B 2
1
N O i COn
N O L N C
N O L in 6
O
1-
OCCISE O O O O O
►- gggg
O s ~O ~O ~O ~O COXCO:C g H g FL•• H H
~O
F
.. ;
a
- m a
-...
a
....O g
~
O ..., O
g
a
~ O g
a
...,C g
a 0 0 0 Ô Ô Ô Ô Ô Ô
I
4223
7025
921
4223
7025
92
4223
7025
92
4223
7025
92
4223
7025
92
4223
7025
92
4249
7323
16
4249
7323
18
4249
7323
16
4249
7323
16
4248
7323
16
4249
7323
16
I 4
249
7323
16
I 42
49
7324
331
I 4
249
7324
341
I 42
2373
4873
1
I 42
4973
2478
1
I 42
49
7325
141
I 422
3736
7021
I 422
3738
0081
4249
7013
78
4249
7013
78
I 42
4970
1378
I
4249
7013
78
I
4248
7013
78
I 42
4970
1378
I
4249
7013
78
I 42
4970
1378
I 4
249
7013
78
25
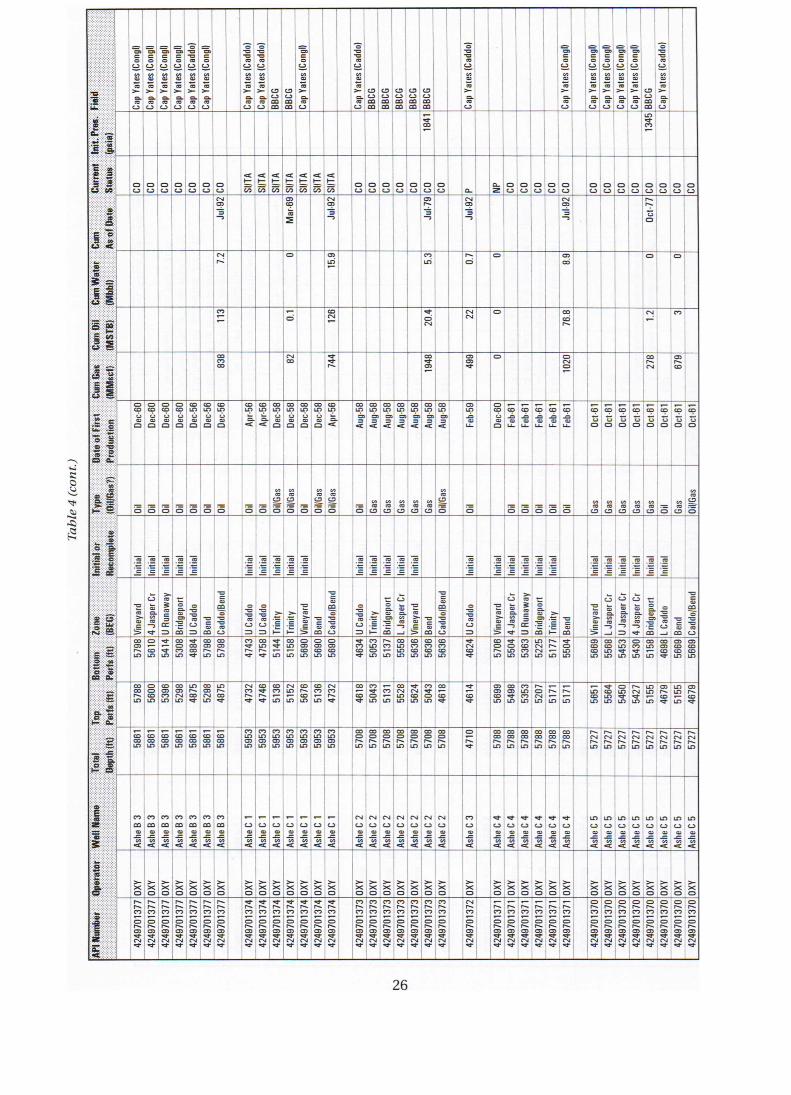
Tab
le 4
(co
nt.)
API N
umbe
r Op
eraW
r W
e11
Na
me
Tota
l To
p Bo
ttom
Zo
ne
Initi
al o
r Ty
pe
Date
of F
irst
Cum
Gas
C
unt O
il
Cum
Wat
er C
um
Cu
rren
t In
it. P
res.
Fie
ld
Dept
h(ft
) Pa
r ts (f
t) P
erk
(It)
(BEG
) Re
com
p le t
e .
!IOi l1
Gas ?
) Pr
oduc
tion
IMM
sct)
{MST
B)
(Mbb
ll As
of D
a te
Stat
us
(ps i
s)
Cap
Yate
s (C
ong l)
Cep
Yate
s (C
ongl
)
Cap
Yate
s (C
addo
)
Cap
Yate
s ( C
oup!)
Cap
Yate
s (C
addo
)
Cap
Yate
s (C
addo)
B
BC
G
6 m Ln Ca
p Ya
tes
(Gon
g!)
Cap
Yate
s (C
addo
)
C9 m
C7 m
C7 m
CD m BB
CG
I
Cap
Yate
s (C
addo
) I
mmmO m Ca
p Ya
tes
(Con
gl)
I
Cap
Yate
s (C
ongl
)
Cap
Yate
s (C
ongl
)
Cap
Yate
s (C
ong o
Ca
p Ya
tes
(Con
g l)
CD
m Cap
Yate
s (C
addo
) I
a.-.
E
Cl C.) .....
C) C1 C7
Q ~ N
Q ~ N
6 ~ N
6 ~ f%)
6 ~ fA
6 ~ CO
Q ~ N CO C1 6
........ U C~ V C) LL
d Z
o C)
D Ci
o CO
0 tl
0 C) V C1 C1 ........
CO Ci 6 6 C)
m
~ Ô 4. m ~
m
> >
n
>
m m
> Oct
-771
N n
O CD LL]
C. Ill
n t7
O CO CD
O O
^ .-
.- O
O ~
V O N
N N
O CO O n
^ te)
CO Cr) 02
0.I 4 n 1 V CD
N O 27
81
n co
O CO
m CO
Ô 000=1
O~ m
CO LL7 6 De
c-58
CO LL')
6 G
CO LD 6 < De
c-58
CO Ln m O De
c-50
De
c-58
Ap
r-58
Aug-
58
CD ID tT Q
CO ID m Q
CO LP Ca Q
CO tD O Q
CD LD 0 C
CO LD 0 C
CD b a LL
O m Y O
CO a LL
CO a LL
CO a W
O a LL
1tg -qei
m
O
tD '16 O
m Zi O 0c
1-611
t4
O Oct-611
Oct-6
1
Oct-8
1
— O
.T. O
ro O !i O
— Ô — i5 — El
~ C.D ~ Ô
~ CD ~ Ô — S
~ ~ CD ~ Ô
CD
5 = O Ga
s Ga
s
Ô CD Ga
s 1
g C9
ô
M. CD
O — Ô
— Ô
— a
— 3
— 0
— a
â CD
g CD
m CD
0 CD Ga
s
0 —43
m CO a. CD Ô
m 0 ~C —
m .0 C —
m .0 C —
m .0 C —
m .0 C —
—m .0 C —
—m .0 C —
CO .0 C —
m .0 C —
m CO .0 .0 C C — —
o t C —
m .ç C —
—m Z C —
CO .0 C —
m .0 C —
m .0 C —
CO ~ — C ~C
m
—
m ._ C —
CO .0 C —
m .0 — C ~C
CO
—
Ls ~ ~C —
CO .= C —
U Ru
naw
ay
Brid
gepo
rt I
O
W V = Be
nd
C a, CO C
m t..)
O
â U >
O
W C~ >
.L
.0 H
.0
.0 H Vi
neya
rd
Bend
No
O
~ ô C)
m
W
â Ca = Tr
inity
Brid
gepo
rt L J
aspe
r Cr
Vine
yard
Be
nd
Cadd
o lBe
nd
C. > ç > 4 Ja
sper
Cr
M
U R
unaw
ay
Ô~ .
C •C CO H Be
nd >
Vine
y ard
L
Jasp
er C
r l
U Ja
sper
Cr
4 Ja
sper
Cr
Brid
gep o
rt
L Ca
ddo
Ben d
Cadd
o Be
nd
et
~ b
CO
O
CO
ID
W LO I.
V LOCnJ
V ~ LO
~ LD
m m in ID
m LD
~ 4
Ô M LD O
tOD O
m m tD LD
m LD
N 4 LO
n ~ ~ LO tD
N n~
LO LO IL-2 CO LD
t0D ID
O V 01 O O
~ LD {D ~ CD DI
COO LD
CO CD Le) O
CO CD N LC)
in n ~
CO LO O n N LD ~
tV t7 n V
~ n V
CO Cr) LC)
N co
LD
CO CO n t7 O LD in
Cl tr) n V
O
~
O ~
P) It) LD
CO N ID 11)
V C. O O tD
O
~
V
~
co CD O LO
co co
CO LD
3 ......., N.
N LL) ü) in
LO CO LLY
V CO LO LO
0 n LD CO N LD n of ~ LD in ~
LL) 0 ID
CD n 4
O CO {D
CO CO LC)
CO CO LO
CO CO CO CO ü) LC)
l7 LD co LD
O LD CD LD
tr) ~ ~ LO
tr)
LD
01 07 LD in CD CD LO LL)
01 O CD ID
CO 0 n LL)
O CO 0 0 n n LD LO
CO 0 n LD
O CO 0 0 n n LO W
CO 0 n LO
O
n V
CO O n LO
O CO n LD
CO CO n LD
CO O CO CO n n LD LO
Co Co n LL)
n N n LO
n N n LD
n n n n N N N N In n n n LO LO LO LD
n N n LO
n N n LD
Ashe
B 3
Ashe
B 3
As
he B
3
Ashe
B 3
Ashe
B 3
C) L ç
C. CO
c IAsh
eC
1 —
1
CO L c
CO 0 L L
c s Ashe
C 1
` Ashe
C 2
Ashe
C 2
Ashe
C 2
As
he C
2
N N C.1 CO co a â ~ 1 A
she C
2
t7 V L â As
he C
4
[Ash
. C 4
Ashe
C 4
Ashe
C
4
As
he C
4
AsheC
4
_1
Ashe
C 5
Ashe
C 5
I
Ashe
C 5
Ashe
C 5
Ashe
C 5
Ashe
C
5
AsheC
5
Ashe
C 5
X arC 00000
X X X )rC 0 X 0 X 0 X 0 X X 00 X 0 X arC X 0000000
X X )rC arC X 0 X X X 000000
)r~C X X 0 X )rC
0
D.- X )rC )4 0D00
X 0
X 0
4249
7 013
771
4249
7013
771
4249
7013
771
4249
7013
771
4248
7013
77]
4249
7013
77
4249
7013
77
4249
7013
741
4249
7013
741
4249
7013
741
4249
7013
741
4249
7013
74
4249
7013
74
4249
7013
74]
4249
7013
731
4249
7013
73
4249
7013
73
4249
7013
731
4249
7013
73
424 8
7013
73
4249
7013
731
I
4249
7013
721
4249
7013
711
`
4249
7013
711 ._
0
n
4 N V 42
4870
1371
42
497 0
1371
42
4970
1371
1
4249
7013
701
` 424
9701
370
1 42
4970
1370
42
4970
1370
42
4970
1370
42
4970
1370
42
4970
1370
1
I42
4970
1370
26

Tab
le 4
(co
nt.)
'Tot
al w
ell p
rodu
ctio
n, a
ll zo
nes n
ow c
omm
ingl
ed.
1Com
min
gled
pro
d. fr
om all Be
nd z o
nes
thru
7.7
9.
Test
ed s
how
oil,
not
pro
duce
d af
ter b
reak
dow
n.
May
not
hav
e pro
duce
d un
til p
ost-
1972
.
'Par
ted
12.5
8, n
ot p
rodu
ced
until
12.
80.
1May
not
hav
e pr
oduc
ed u
ntil
post
-19 7
2.
Dual
com
plet
ion
with
Bend
in 1
2.80
.
— 10
i1 ini
tially
, rec
lass
ified
to g
as in
4.8
1.
Oil in
itial
ly, r
ecla
ssifi
ed to
gas
in 4
.81.
Prod
uctio
n fro
m B
ridge
port
thru
10.
77.
j
Uncl
ear i
f eve
r pro
duce
d.
1
'Don
't kn
ow C
addo
pro
duct
ion.
1
4
All z
ones
com
min
gled
10.7
7.
1
Don'
t kno
w C
addo
pro
duct
ion.
j
Only
par
tial c
um fo
r Be 1
l0 Ô
CO 10 N
CO l0 O
0 O O N
N CD O
•
0 0 •,-
Ni CO
0 n p
L_ _
0.4
N f\ CE
Cf ~ CA
N N CV
~~ ai
n
Ô
1L8'0 L
~ •-;
f\ 0 Ô
0 Cf
co G
Ce C! O
N CO O
co co ô
Ir ~
~ CJ N
CO IV N
n N
.- IV N
N CV Ni
• C) m N
Cp ai. N
Jr C) N
3- CD Cl
N Cf Ni
CO Ô N
IN
N 31. m N
0 x
Ni 4 Ni
CO C) Ni
CD m N
IN N
N ti Cf
Cf Cf el•
CA I~ ..—
CO m
N. m ce
a CD C)
sh I:
a IV
IO ai
CC f\
Cl eh n
C. CG
..- Ô'-'
O 0 CD
0 C)
Cl Ô
331. CD
V CV
CD m
CD IN N m
ie: ~
CJ ri
CO tri
N ai
N ri
ID CJ
CD r. N
O ^
Ln m CO Ni
• tn r.:
, O l'7 Ni
~ ~ ID 10 j ~j
CO Cl C~
10 ~ {0
CO ~ ~ IO N N
O ~ in r a
in ^ CO N .-
in CO Ni
CO N
CO C)
n co
0 0
N t0
Cf CO
, C)
O 10
10 n C) CO
n CO
n N ~ O ' ~ 0
O 0 O~
CO Ce O
Cl CD
C) Cl
CA CO CD
Ni CO
4 Ja
sper
Cr
~
U Ru
naw
ay
Brid
g epo
rt_
j
e
p V = Be
nd
Cadd
olBe
nd
e no ô Ce = U
Cadd
o
>
'C I— Tr
inity
1
Vine
yard
1
Bend
Cadd
o lBe
nd
~
e •Ic â V =
.0 C I- B
ridge
port
L Ja
sper
Cr
1 Vi
neya
rd
Bend
e
CO
ve Ô C> U C
addo
-
-ce
> al G > 4
Jasp
er C
r
U Ru
naw
ay I
Brid
gepo
rt 1
^ C
'C I— Be
nd
e
a
~, C s ~i L
Jasp
er C
r
U J
aspe
r Cr
4
Jasp
er C
r
Brid
gepo
rt
e ~ e V J
9C m ••
v
m
C Ct
ont
I00 u M! Ô~~~
e l0 I0
Ce ~
e I00
e ~ 10
I00
tD ~~ I00 I00
W I00
~ w
ID s
C)
Ln LL07
5 C09
b
~X s 1Ô
0N0 O
s
ID a
I00 Ô Ie0
N INO
n a
IO 1L) O 10
m 100
1MO
I ~M{ 10
10 bWM
m Ô Ô Il1
O O CO In
CO 0 C) In
CO CD Ni In
O n CD R
CO tn 0 N.
In v C) N. v
N 0
N ~ I~ ~
{0 C9 Iî,
N Itf
In
CD 1~ 0 LO
CO C1 în
N Ni f~ a
œ
~
E
IO Cf în
OD N {0 In
~ Ni CO IO
0
~ ~
W
m 0 CO In
CO ~
Cf 10 C! In
1N O Ni In
1~ In
I~ Iç,
IO 0 In
~ 10 10
O Iff of 10
I~ Ni O 10
in {D In
0 1~ 4
10 10 In
CO I~ 4
10 I0 534444
IL/ 5881
58
81
Ce tn IW
LO LO
~ ~
I~D 1~
I~0 Ln
I~0 Iü
1[) 100
~ 57
08]
CO
LL Ô in
~8019
O 10
~ {p 57
081 O
~
CO N.
CD
LL~
CO
10 5788
]
CO
in
CO
I~0 5727
N
l0 N I0
N 1~p
N ID 57
271
Ni IN
LL 5727
1
Ashe
B 3
Ashe
B
3
0
C c
Ce
L c As
he C
1
1
C3
i
s
Ce co
s
Ce
L c As
he C
1
1
Ashe
C
2
Ni Ce
L G As
he C
2
Ashe
C 2
Ashe
C 2
Ashe
C 2
Ashe
C 2
'
Cf 0
L c
43. C.
L c
44. U
L ç As
he C
4
Ashe
C 4
AsheC
4
AsheC
4
Ashe
C 5
Ashe
C 5
Ashe
C 5
Ashe
C 5
Ashe
C 5
Ashe
C 5
Ashe
C 5
Ashe
C 5
OX
Y
X X O O
X 0
X 0
X 0
eTC 0
X 0
X 0
X 0
X 0
X 0
X 0
X 0
X!g 0 0
X 0
X 0
X CO
X 0
X 0
X 0
X 0
X 0
X 0
X 0
X 0
X 0
X 0
X 0
X 0
X 0
I42
4970
1377
42
4970
1377
4249
7013
741
4249
7013
74
4249
7013
74
4248
7013
74
4249
7013
74
4249
7013
74
4249
7013
74
4249
7013
7*
I
4249
7013
73
4248
7013
73
I
4249
7013
73
I
4249
7013
73
I
4249
7013
73
4249
7013
73
I- 42
4970
1372
1
4249
7013
711
4248
7013
71
I- 42
4870
1371
I 4
249
7013
71
4249
7013
71
I 42
4970
1371
I 42
4970
1370
1 42
4810
1370
F
4249
7013
70
4249
7013
70
4249
7013
70
4249
7013
70
4249
7013
70
4249
7013
701
27
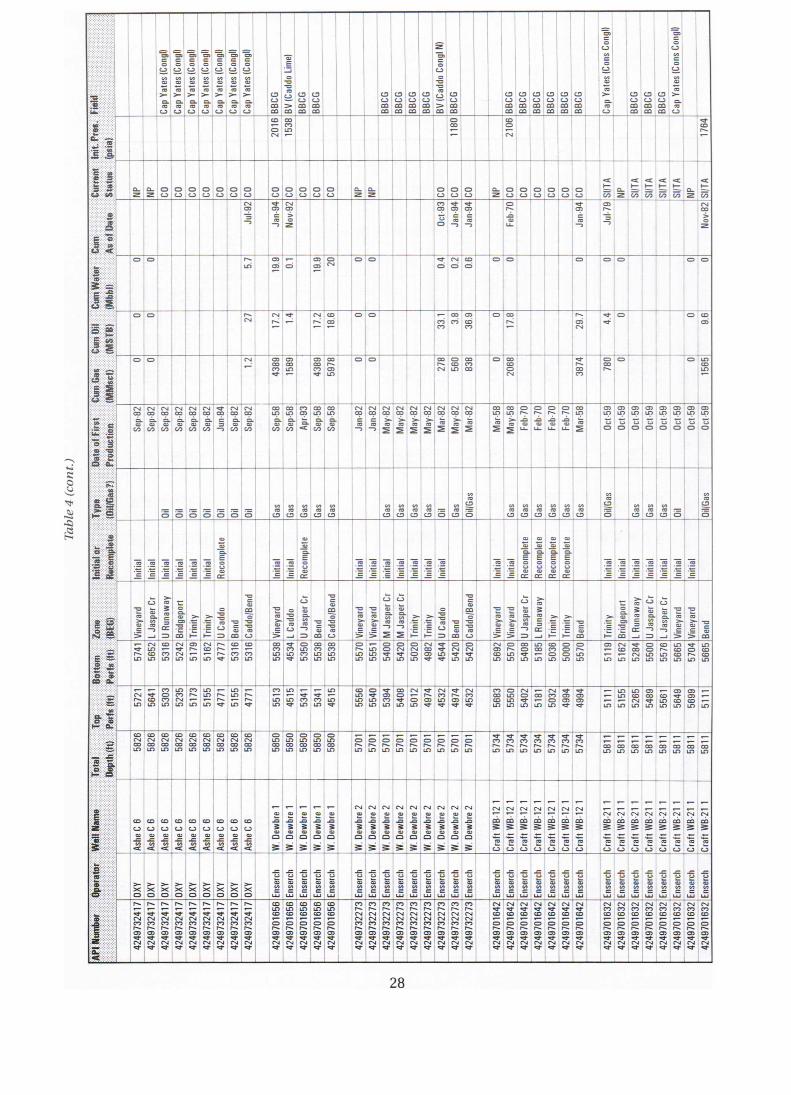
Tab
le 4
(co
nt.)
Cap
Yate
s (Go
ng')
Cap
Yate
s (G
ong))
Cep
Yate
s(C
ong 0
Cap
Yate
s (Co
ngt)
Cap
Yate
s (G
ong')
Cap
Yate
s (C
ong I)
Cap
Yate
s (Go
ng»
7 C.3 LO BV
(Cad
do L
ime )
C7
m m BB
CG
I
BBCG
I
CD m CO
CD m CO
CD m CO 1B
V (Ca
ddo
Gong! N)
I
©
m m BB
CG
1BBC
G
(BBCG
C7
m CO BBCG
I
C7
m m Ca
p Ya
tes
(Con
s Co
ngl)
I
CD m m BB
CG
BBCG
Cap
Yate
s (C
ons
CongO
03 CN
CO LD L-
m ._
ô N
S ~
0 C7
0 C7
0 C.
0 V
0 C.
0 U
0 C.
0 V
CD V 0 C.) CD C. 0 C. O.
2 a 2 O
C7 O C7
O C7
d 2
o C.
O C~
o CD 0
C7 0 C.
0 C7
G = Cl) 2
Q fN
d==~~ 6 V)
Q
N
6 C. 2 d
~ <
CO
~
~
~
~
~ 2
OMD
O
Of ~
~
~ Feb-
70
~
C
CO
~
m2. 2
n LL)
18' 8t
4- Ô
0 CE
O N
O O
0.4 N Ci CD
d CD O O O O O O
Cs. N
N a L~
N ^
CD CG
O O ~ C1 Cf
CO Cf
CO coi C)
O CO ^
1~ O1 N
a Q 0 O
O1~
~ CO I CD
ID N 11.
CO
.tir m et-
~ ~
CO
COL n
O O
278 m ~
O CD O~
O N n CO C7
~ O n
N CO p N
N CO LS
N
N CD G
C/o)
GD G
C/~)
N ~
C
~
N CD 6
V)
N CO G
V)
CO Ln 6
CO CO Ln 6
N
C) CL
6
CO CD 6 ai
CD Ln 6
CO
N CO a N CO C
» May
-821
M
ay-8
21
May
-821
N N CO CO >
~~~
N CO !
Mar
-82
Mar
-58 CO
Uf ! ~
I Fe
b-7
J
Feb-
70
O n .G Li
I__
O n
Li Mar
-58
L
CO CO Ln LL7 elt O O Oc
t-59
Ln
CO Ln
C~ Oct-5
9
CO Ln LI 0
CO
CI 0 Oc
t-59
O O O O O = O
3 O
N O
C7 Gas
1
Gas
1
C CO Ga
s I
Gas N
CC C.7
H C
CO
N O~
CD O O
co N ~
H O 7 O
C9 C CD 1G
es
H W
CD W m
~ CD H C
CD W m CD
L9 O CD ~ O
C~ W I C7
CC C.7
N CO C7 . O
N W CD
O
O _ C
.ç W
C
W C C ,
C Reco
mpl
ete
I
6 ._C
m . , _C IR
ecom
plet
e I
O ç C
O _ C ,
~
p .0
O ç = ~O C =
O ~0 .0 = - C
m
•~ ~
A
Reco
mpl
ete
Reco
mpl
ete
Reco
mpl
ete
C ~ 1lnit i
al
O
_ C
O
_ =
O
_ C
U Ru
naw
ay
Brid
gepo
rt 1
> .= C
'C H IU
Cadd
o
V C C m
2 CO O V V W
C. Vine
y ard
1
L Ca
ddo
U Ja
sper
Cr
Bend
at m O V V C
C7 Vine
yard
9 CC Y CO Ç
M J
aspe
r Cr
M J
aspe
r Cr
1
> ._ C
•C I-
O a ÿ . a C •C •I- 7 Be
nd
ut m O V V C
C7
_ Ç CO 04 m C ! 1V
iney
ard
IU J
aspe
r Cr
L Ru
naw
ay
Trin
ity
! . 'C H Be
nd
Ô 3 d
Y p: d d
~r CO, C m CV ••C •C CL ~, I- m J =
U G LO
J >>
~
CO
d C
1 t eu > Cu C
~ = m
CO C) Ln
CV a N Ln
W A
Ln
N ce Ln
1~ n n a
CO C) Ln
CD C) LD
CO C) Ln Ln
a C) LD a
0 Ln C) LD
CO C) LD Ln
CO C) ID Ln
O n Ln LD
O Ctf O Ln
O N
~
O N O Ln
N CO ~ a
O N a Cn
O N ~
N C) CD Ln
O n Ln Ln
CO ID m m Ca
~ O LD ID Ln
p O O n O LO Ln Ln
O N CO ~
N Cn LD Ln
O O LD LD
m n ID ID
LL'/ CO Co ID
a O n ' ID
Ln CD CD in
C9 O C) Ln
O C7 CV Ln
P) n Ln
in Ln Ln
1~ n a
Ln la Ln
1~ n a
C) ID Ln
IL') LLY a
~
Ln a Cf Ln
LD
~
CO LO In LO
O ~ ~ C)
u~7 Ln
CO p Ln
N O in Ln
a N n C) CO ID a a
a 1, pp O
N C) ID a
C) CO CD Ln
O LO in Ln
N N~ co C9 g O ~ Ln In
a CO CO a v
~ in Ln •~ in CO CV Ln Ln Ln
CO CO Ln
CO Ln Ln
fff000 ~ Ln
CO CO CD Ln
— C- Ln
L_
5828, m N CO ID
~ 58
281 m
N CD ln
~58
28
5826
cc N CO Lt)
O ' Ln LD Li')
O ' an CO Ln
O ln CO Ln 58
501
CO in O ^ Ln O O Ls n^ Ln ID
O ID 57
01
O O n A Ln LO 57
011
5701
1
~ ^ in 57
341 ~~~~~
n n A Ln LD O
n n Ln Ln 58
11
5811
58
11
CO L[)
CO LA
CD LO
CO Ln
CO ID
O
C. C V) Q
m
C~ L C
co C7 L Q As
he C
6 co
(.) L en G
m
C. L C
co C. C Q W
. Dew
bre
1
W. D
ewbr
e 1
m â
m O â
m â
m Cl â W
. Dew
bre 1
IW. D
ewbr
e 2
W
. Dew
bre 2
W. D
ewbr
e 2
W
. Dew
bre 2
W
. Dew
bre 2
W
. Dew
bre 2
W
. Dew
bre 2
W
. Dew
bre 2
W
. Dew
bre 2
Craf
t WB-1
21
Cr
aft W
B-121
Cr
aft W
B-12 1
Cr
aft W
B-1
2 1
Cr
aft W
B-1
2 1
Cr
aft W
B-121
Craf
t WB-
121
Craf
t WB-
21 1
Cr
aft W
B-2
1 1
Cr
aft W
B•2
1 1
Cr
aft W
B-21
1
Cr
aft W
B-21
1
Cr
aft W
B-21
1
1
Craf
t WB-
21 1
Craf
t WB-
21 1
1
Y X O
Y X e
Y X O
Y X CO Y X O
Y X O
Y X O
L u H C W
a U
H C W
a Li
H C W
L L)
H C W
.= H
H C W
a Y
H C W
L a G CL
H â C C W W
L G
H C W
L .L) H C W
L a Cl L)
H w C C W W
a Cl
H C W
a Y N C W
L L)
H C W
L G
H C W
L L L L L Y Ct Li d
H H H d d C C C C C W W W W W
I L L L G.1 L) U H H d C C C W W W
L ti N
C W
L d d
W
C L.l Cu W
Y d
Lû
CL d
C W
I 42
4973
2417
I
4248
1324
1'1
I
4249
7324
171
I 42
4973
2417
1 I 4
2497
3241
71
r 42
4973
2417
1 I
42
4973
2417
1
I 42
4970
1858
r
4249
7018
58
I 42
4970
1658
1 I
4249
7018
581 CC
Ln CO O n 4 N a
I 42
487322731
4249
7322
73
4249
7322
73
I
4249
7322
731
I 4
249
7322
73]
4249
7322
731
4249
7322
73
I 4249
7322
731
I 42
4873
2273
4249
7018
421
4249
7018
4 42
4870
1842
42
4970
1842
42
4870
1842
p4449701632
2497
0183
2 I
4249
7016
321
I 4249
7016
32]
r 42
4970
1832
I
4249
7018
321
I
4249
7018
321
28
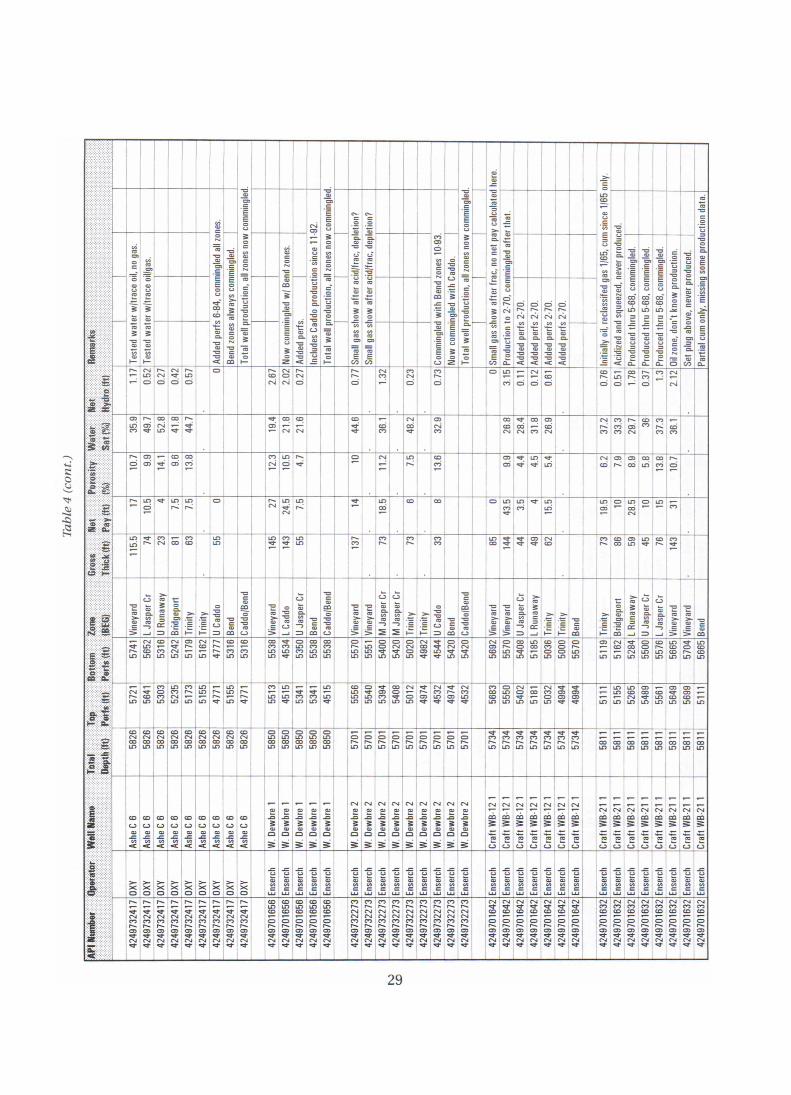
Tab
le 4
(c
on
t.)
Tota
l wel
l pro
duct
ion,
all
zone
s now
com
min
gled
. I
Smal
l gas
sho
w a
fter f
rac,
no n
et p
ay c
alcu
late
d he
re.
Bend
zone
s al
way
s co
mm
ing l
ed.
[Incl
udes
Cad
do p
rodu
ctio
n sin
ce 1
1.92
.
1 l I
Smal
l gas
sho
w a
fter a
cidl
frac,
dep
letio
n?
_ 1
[Sm
all g
as s
how
afte
r aci
dlfra
c, d
eplet
ion?
Now
com
min
gled
wl B
end
zone
s.
N ~ d O. 7 d NO C Q Pr
oduc
ed th
ru 5
. 68,
com
min
gle
n CO ' CV
N O N
1\ N Ô
n n Ô
N C) a-
C) N Ô
C) n
Ô
O ^
C! Ô
~ ~
Ô CO Ô
CO r Ô
O Ô
CO n .—
1~ Cf Ô
C) • ^
Ci
Q m
co
N
m ~
N co. • m
C)
• N ~
• m fV C)
co CD N
~ m N
0 :
C)
0 m N
• N 1~ C7
O Cl C)
n m N
co C)
C) 1\ C)
.-- m C)
•
C) IV
O Ô
n V
O .— N O ri
CO C)
LS m cal
a ID ci
a In
N Q;
O 1.4
W CD
m 1[f
m Ci
M1 Ô
•
N ' O
tQN ID n
^ • In CD
• O • CO O IO ~
10 C7 Q LO
^ • O
LÂ O ^
LO
N
O ~ ^
C) •
I 7a
in~ IInC M n n N m 4 4 W m  COO ~~~ â
'0 m
CO
9a
LD Ô O m m U Vi
ney a
rd
L Ca
ddo
IU Jas
per C
r
C
CO
amw m Ô C
V
'C
co 'C
Vine
yard
_
Vine
yard
M
Jas
per C
r LM
Jasp
er C
r 1
> l
1—
> I r [U
Cad
do
Bend
O g m Ô C Ô Gi Vine
yard
U Ja
sper
Cr
L Ru
naw
ay
Trin
ity
Trin
ity
C C
CO Brid
gep o
rt [
U Ja
sper
Ci7-1
L Ja
sper
Cr
Vine
y ard
Vi
ney a
rd
y ô m
O C) LO
_O O O
co C)
O O~
~ C) In
CO) In IC)
t07 In In
O 1[) O
1n In u7 ICI
N ~ O
N O LO
m~ ~~~~
O N N W^
CO O
Ln LL)
CO
~ m
O
CO
O H')
Ô~ O LL)
ILf ICJ
CO coN m — N
LC) u) Ln Ô ~ In I. 1' Ln ü')
O Ln
m~ n IO
m O IC)
LL) LL)
II) 1~r. ~
^ In {{O~
~ C X In
g In
^
~
O p~ In ~
IOn I1) IOn
COp Q O
N
{O Cl
v n ~
N f7 â
v r ~
N C) ~
C) CO
ILO)
O ID IOC
N
~ œ In
C) IOn N~~
~ 4
~~ u'i In .- ~ u'f CO In LLY LO
LA œ 1.0~
I ~ O LA
œ LC)
I O) v CO
ü')
O) ~ O) CO
œ Ln
~ ~ Ln
Ln
co
CD II)
co
O 10
COO IOO O CD ID H)
IOC) CD In
I00 O IC
IOC CC II)
0 0 0 f\ A 1~ In )O 4)
0 A Ln
E. ^ In
G. n In
E. A CO
0 n IO
0 A In
N Ln
n O
XXAXX n IC
n Ln
n II)
C) n In
n IC
~ œ IC)
œ Ln
œ LL)
œ LC)
CO C.)
t N Q
tO Cl
Z N Q W
. Dew
bre
1 ~
W. D
ewbr
e 1
1
W. D
ewbr
e 2
W. D
ewbr
e 2
W. D
ewbr
e 2
W. D
ewbr
e 2
W. D
ewbr
e 2
W. D
ewbr
e 2
W. D
ewbr
e 2
W. D
ewbr
e 2
W. D
ewbr
e 2
Craf
t WB-
12 1
1
,Cra
ft W
B•12 1
1 Cr
aft W
B•12 1
Craf
t WB-
12 1
1 Cr
aft W
B•12
1 1
Craf
t WB•
12 1
Cr
aft W
B•1
21
Craf
t WB•21 1
Cr
aft W
B•21
1
Craf
t WB•
21 1
Cr
aft W
B•21 1
Cr
aft W
B•21 1
Cr
aft W
B•21 1
N m ~• V ~ Ci Cr
aft W
B•21
1
1
Y X O
y C o
L ) m N C W
L H Ô N C L
L H ÔN C W
L L mN C W
a L m N C W
L a a L Y L mmm N N N CCC WWW
L Li m N C W
a ~ O
lY
L fi
m
W
a LJ Ô N C W
a H
Ô N C W
a L
Ô N C W
e O V C W
.0 Li m N C W
Y • N C W
d
C W
a
i d
w
H d
= Li d H C
L Ôi
C W
û d
C
.= d
C
L UÔ)
C
L Y Nm
I 4249732417
4249
7324
17
I
4249
7018
56
4249
7016
56
4249
7016
5)
4249
7016
58
4248
7016
58
4249
7322
73
4249
7322
73
4249
7322
73
I 4
249
7322
73
4249
7322
73
I 4
249
7322
73
I 4
249
7322
73
I 4
249
7322
73
4249
7322
73
I 4
249
7018
421
4249
7016
42
4249
7018
42
4249
7016
42
I 42
4970
1642
I 42
4970
1842
I
4249
7016
42
4249
7016
321
4249
7018
32
4249
7016
32
4249
7016
321
142
4970
1632
1
I 4
249
7016
32
29
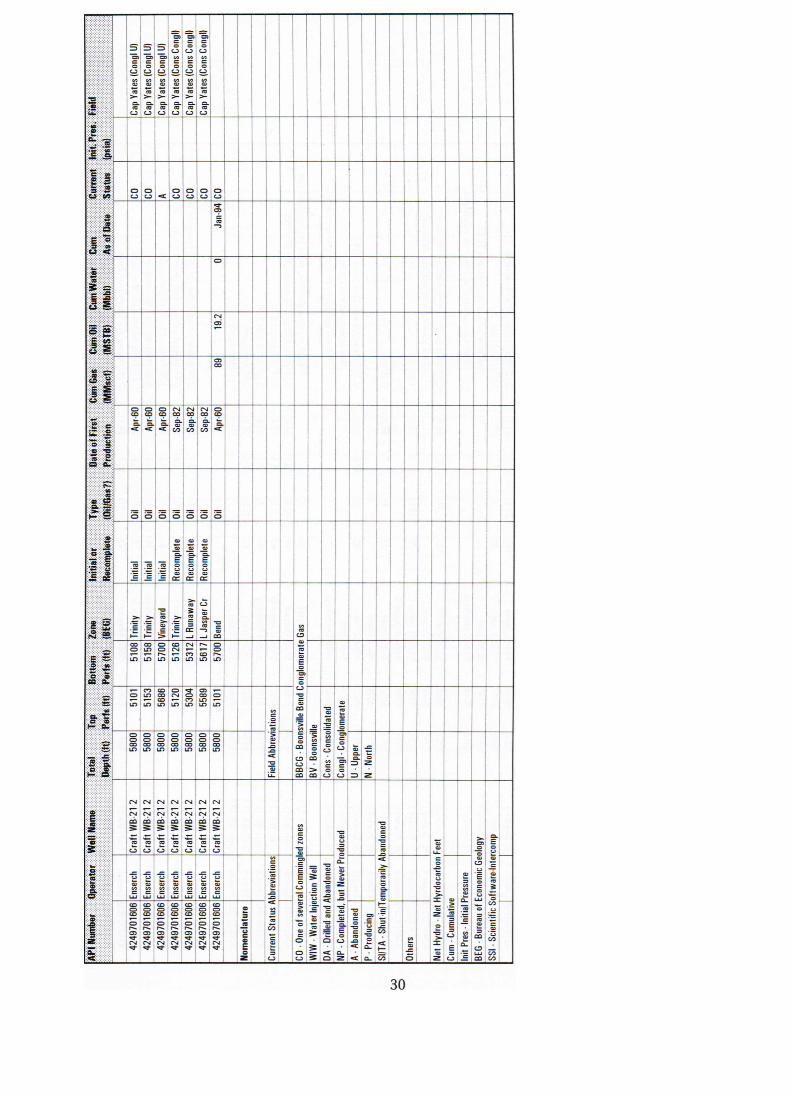
Cap
Yate
s (C
ons
Cong
q
,Cap
Yat
es (C
ons C
ong l)
1Cap
Yat
es (C
ons C
ong o
O 0
O 0
O 0
O C7
g C 4 '
O
N Q/
88
N CO
m CO Se
p-82
Se
p-82
O CO G a
Oil
SEISES
m m â E 0 c) as
OC Reco
mpl
ete
Re
com
plet
e
7.. C 'c I— L R
unaw
ay
L Ja
sper
Cr
~ S m
BBCG
- Bo
onsv
ille B
end C
ong l
omer
ate
Gas
1
CD N .— ICI
N 1... .— .— Col CO LC! LO
co O n ID
N .— 117
g CO O ID 10 LL7
O .— LL7
( Fiel
d Ab
brev
iatio
ns
1
BV -
Boon
svill
e
Cons
• Co
nsol
ida t
ed
Cong
l - C
ong l
omer
ate
O O IOG 58
00
5800
O O LL7
U -
Uppe
r 1
L Z e 2
2
Craf
t W
B•21 2
Craf
t WB•
2 1 2
Cr
aft W
B•21 2
Craf
t WB-
21 2
CO
.One
of s
ever
al C
omm
ingl
ed zo
nes
Vis
C
INP
• Com
plet
ed, b
ut N
ever
Pro
duced
ISIIT
A • S
hut•i
n lTe
mpo
raril
y Aba
ndon
ed
INet
Hyd
ro •
Net H
yrdo
carb
on F
eet
ISSI - Sc
ient
ific
Softw
are•
Inte
rcom
p
1
.= t) m C G W
L L' i) Y as as cos W W
a Y E cos C W
(Cur
rent
Sta
tus A
bbre
viat
ions
)
WIW
- W
ater
Inje
ctio
n W
ell
IDA
- Dril
led
and
Aban
done
d
ICum
- Cu
mu l
ativ
e
(nit
Pres
• In
itial
Pre
ssur
e
I
42487018081
4249
7018
08
4248
7018
08
I 42
4870
1808
2 7 O
4 E O Z IA
- Ab
ando
ned
1
e. C j ' C
1L a- 'O
ther
s J
30
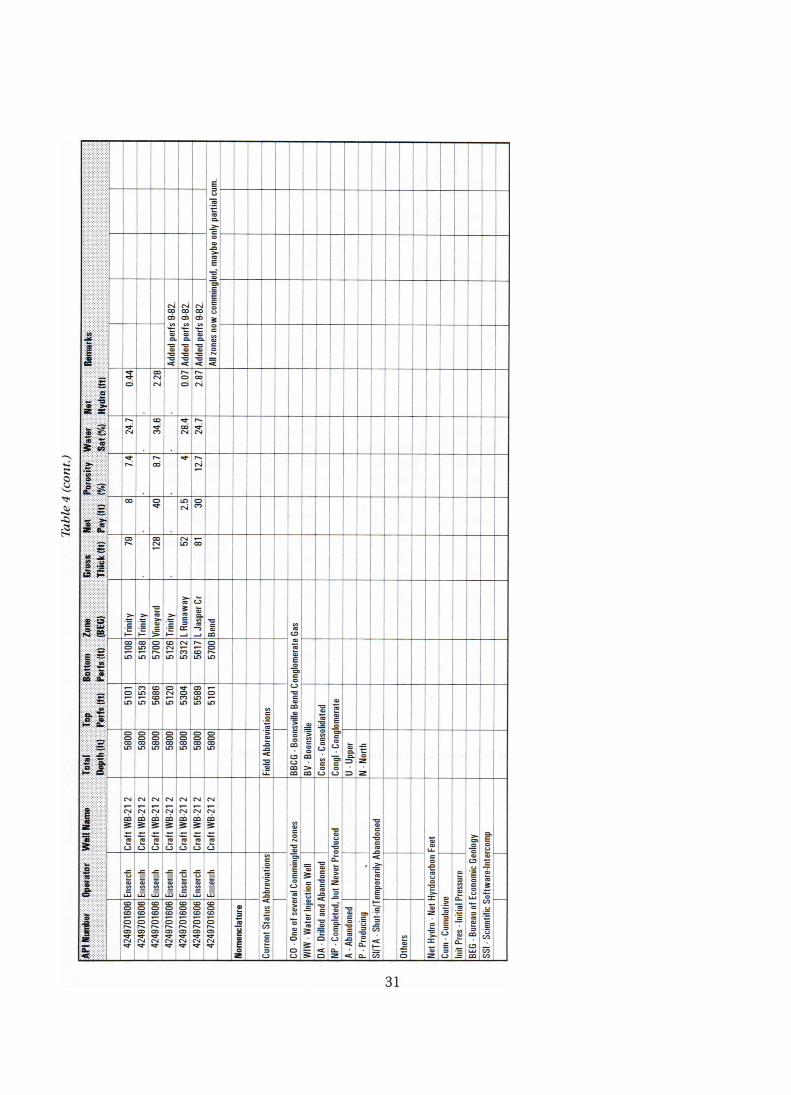
Tab
le 4
(c
on
t.)
API 'N
umbe
r O
per
ator
Well
Nam
e
Top
B
otto
m
zone
G
ross
N
et
Poro
sity
W
ater
;Net
Re
mar
ks
P
t !s
(ft! !N
ils(It
) T
hic k
Pay
l•)
~Ia
1 Hy
dro
IAll
zone
s now
com
min
gled
, may
be o
nly p
artia
l cum
. 1
'Add
ed p
erfs
9- 8
2.
Adde
d pe
r fs 9
.82.
Ad
ded
perfs
9- 8
2.
O
!V
n n O co Ô ni
O
X
~ A
N N
n CD
•
•Ct 1\ lV
O ON N
CO N
N ..- LL') CO
Auuul~ Vine
yard
Trin
ity
L Ru
naw
ay
L Ja
sper
Cr
Bend
BBCG
- B
oonv
ille B
end
Cong
lom
erat
e Ga
s
CO 0 1 ~
LL7 Ô n O
CO w- O
~ n C7 0 O in
Ô 1~ 10
IÂ ID
COD
LO N CD
~ OOD 111 1.0
O IO
Field
Abb
revi
atio
ns
BV - B
oons
v ige
Cons
• Co
nsol
idat
ed
Cong
l • C
ongl
omer
a te
I
5800
ô IOC/
ô ID 58
00
5800
ô IOt! G
O. =
=
C O 2
2
'Craft
WB•
21
2
Craf
t WB-
21
2
Cra f
t WB•
21
2
Craf
t WB-
21
2 Cr
aft W
B•21
2 Cr
aft W
B-21
2
CO. O
ne o
f sev
eral
Co m
min
gled
zone
s
INP
- Com
p let
ed, b
ut N
ever
Pro
duced
ISIIT
A • S
hut•i
n lTe
mpo
raril
y Aba
ndon
ed
Nat H
ydro
- Ne
t Hyr
doca
rbon
Fee
t
IBEG
• Bu
reau
of E
c ono
mic
Geo
logy
ISSI
• Sc
ient
ific S
oftw
are•
Inte
rcom
p
u
C
u
C
u
O
u u
CC
Y
C
'Cur
ren t
Sta
tus A
bbre
viat
ions
)
IWIW
• W
ater
Inje
ctio
n W
ell I
IDA
- Dril
le d a
nd Ab
ando
ned
Cum
- Cu
mu l
ativ
e
(nit
Pres
- In
itial Pres
sure
42497016061
I424
9701
808
CO O CO
n W N v 42
4970
1606
42
4970
1606
1 42
4970
1606
'Nom
enc l
atur
e I
IA -
Aban
doned
IP
• Pr
oduc
ing
'Oth
ers
I
31
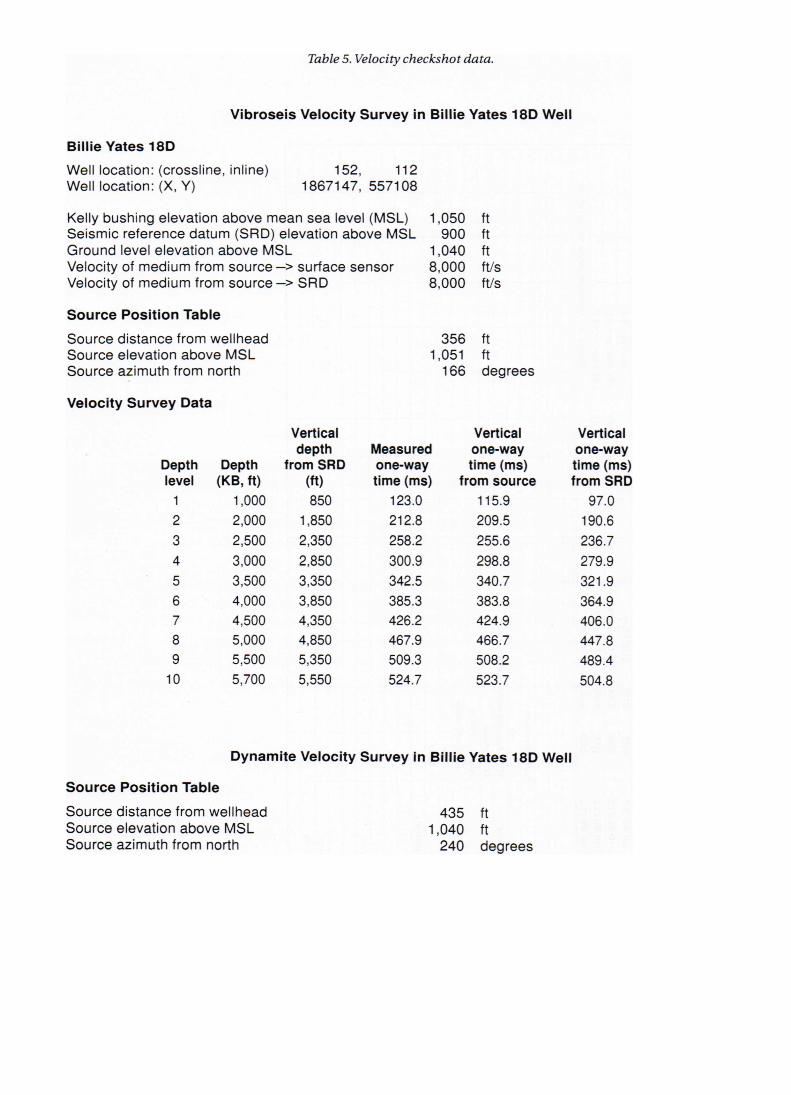
1,050 900
1,040 8,000 8,000
ft ft ft ft/s ft/s
Table 5. Velocity checkshot data.
Vibroseis Velocity Survey in Billie Yates 18D Well
Billie Yates 18D
Well location: (crossline, inline) 152, 112 Well location: (X, Y) 1867147, 557108
Kelly bushing elevation above mean sea level (MSL) Seismic reference datum (SRD) elevation above MSL Ground level elevation above MSL Velocity of medium from source -> surface sensor Velocity of medium from source -> SRD
Source Position Table
Source distance from wellhead Source elevation above MSL Source azimuth from north
356 ft 1,051 ft
166 degrees
Velocity Survey Data
Depth level
Depth (KB, ft)
Vertical depth
from SRD (ft)
Measured one-way time (ms)
Vertical one-way time (ms)
from source
Vertical one-way time (ms) from SRD
1 1,000 850 123.0 115.9 97.0 2 2,000 1,850 212.8 209.5 190.6 3 2,500 2,350 258.2 255.6 236.7 4 3,000 2,850 300.9 298.8 279.9 5 3,500 3,350 342.5 340.7 321.9 6 4,000 3,850 385.3 383.8 364.9 7 4,500 4,350 426.2 424.9 406.0 8 5,000 4,850 467.9 466.7 447.8 9 5,500 5,350 509.3 508.2 489.4
10 5,700 5,550 524.7 523.7 504.8
Dynamite Velocity Survey in Billie Yates 18D Well
Source Position Table
Source distance from wellhead
435 ft Source elevation above MSL
1,040 ft
Source azimuth from north
240 degrees

Table 5 (cont.)
Dynamite Velocity Survey in Billie Yates 18D (cont.)
Velocity Survey Data
Depth level
Depth (KB, ft)
Vertical depth
from SRD (ft)
Measured one-way time (ms)
Vertical one-way time (ms)
from source
Vertical one-way time (ms) from SRD
1 1,000 850 117.4 107.3 91.1 2 2,000 1,850 205.2 200.4 184.2
3 2,500 2,350 250.3 246.6 230.3 4 3,000 2,850 291.5 288.5 272.2 5 3,500 3,350 332.7 330.1 313.8 6 4,000 3,850 374.4 372.2 356.0 7 4,500 4,350 414.8 412.9 396.7
8 5,000 4,850 456.2 454.5 438.2
9 5,500 5,350 485.4 493.8 477.6
10 5,723 5,573 514.3 512.8 496.5
Dynamite Checkshot Data
Number of traces
30 Time samples per trace
3,000
Time sample rate
1 ms Trace data format
32-bit IBM floating point, 4 bytes/sample
These are three-component checkshot data There are 10 records, 3 traces per record Trace 1 = horizontal X-component Trace 2 = horizontal Y-component Trace 3 = vertical component
Trace Header Key Values
Bytes 1-4: Reel sequence number Bytes 13-16: Component flag (1 = horizontal X, 2 = horizontal Y, 3 = vertical) Bytes 41-44: Receiver depth (relative to kelly bushing) Bytes 105-108: First break time (ms) (picked by contractor)
Start time (ms): 0
End time: 3,000 Start trace: 1
End trace: 30
Input file: Number samples: 3,000 Format code: Bytes/sample: Float format: Bytes/trace: Sample rate: Length (ms):
1 (4 byte float) 4 IBM floating point 12,000 1 3,000
NOTE: End of file after sequential trace no. 30
33
Acknowledgments This work was funded by the U.S. Department
of Energy (contract no. DE-FG21-88MC25031) and Gas Research Institute (contract no. GRI-5093-212-2630) as a part of the Secondary Gas Recovery project. Additional funding was pro-vided by the State of Texas through the budget of the Bureau of Economic Geology. We thank Arch Petroleum, Enserch, and OXY USA, Inc., for allowing access to the study area and for provid-ing financial and technical support for the data collection and analysis. The 3-D seismic interpretation was done with software provided
by Landmark Graphics Corporation and work-station hardware provided by IBM Corporation. The 3-D seismic data were processed by Trend Technology, Midland, Texas.
Technical editing was by Tucker F. Hentz. Daniel D. Schultz-Ela reviewed the final draft. Figures were drafted by Randy Hitt, Susan Krepps, Joel L. Lardon, and Jana S. Robinson under the direction of Richard L. Dillon. Editing was by Susann Doenges. Word processing was by Susan Lloyd. Typesetting and design were by Margaret L. Evans.
References
Bureau of Economic Geology, 1995, The use of small, directionally focused charges as a 3-D seismic energy source: The University of Texas at Austin, Bureau of Economic Geology, technical summary of research conducted for the Gas Research Institute, U.S. Department of Energy, and State of Texas, GRI-94/0448, 10 p.
Galloway, W. E., 1989, Genetic stratigraphic sequences in basin analysis I: architecture and genesis of flooding-surface bounded depositional units: American Association of Petroleum Geologists Bulletin, v. 73, no. 2, p. 125-142.
Hardage, B. A., Carr, D. L., Finley, R. J., Lancaster, D. E., Elphick, R. Y., and Ballad, J. R., 1995, Secondary natural gas recovery: targeted applications for infield reserve growth in Midcontinent reservoirs, Boonsville field, Fort Worth Basin, Texas: The
University of Texas at Austin, Bureau of Economic Geology topical report prepared for the Gas Research Institute under contract no. 5093-212-2630 and the U.S. Department of Energy under contract no. DE-FG21-88MC25031, GRI-95 / 0454, two volumes variously paginated.
Lahti, V. R., and Huber, W. E, 1982, The Atoka Group (Pennsylvanian) of the Boonsville field area, North-Central Texas, in Martin, C. A., ed., Petroleum geology of the Fort Worth Basin and Bend Arch area: Dallas Geological Society, p. 377-399.
Thompson, D. M., 1982, Atoka Group (Lower to Middle Pennsylvanian), northern Fort Worth Basin, Texas: terrigenous depositional systems, diagenesis, and reservoir distribution and quality: The University of Texas at Austin, Bureau of Economic Geology Report of Investigations No. 125, 62 p.
34
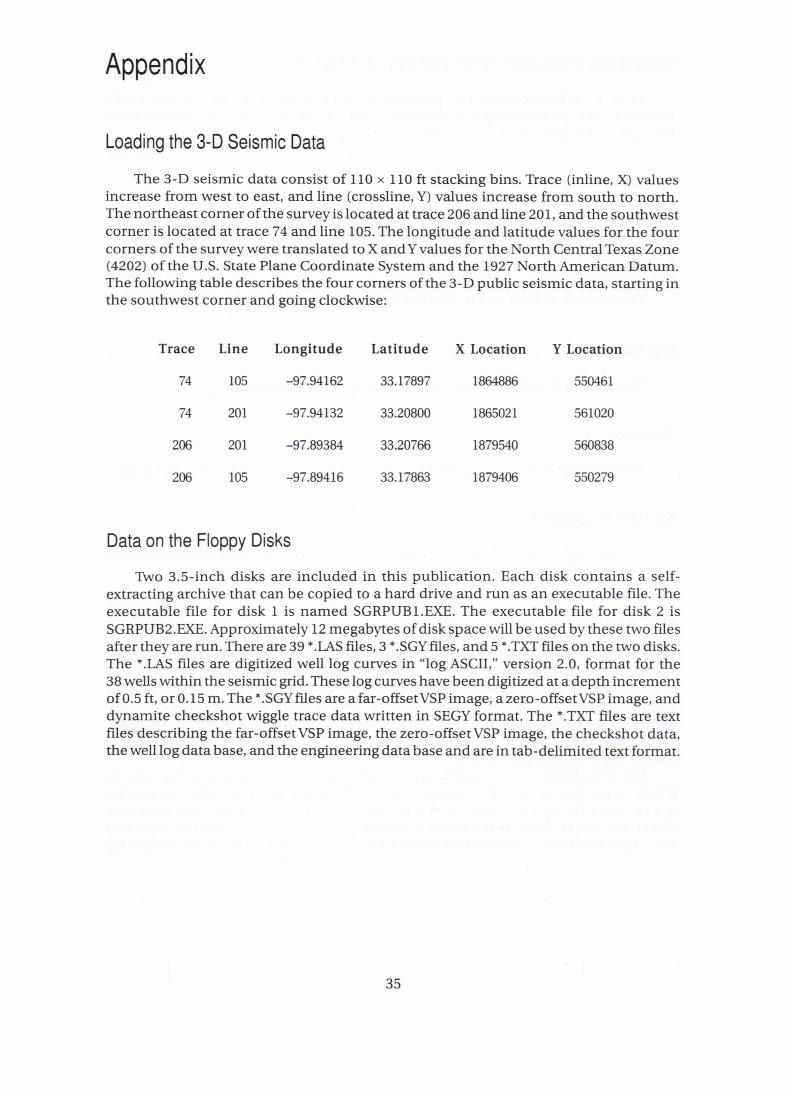
Appendix
Loading the 3-D Seismic Data
The 3-D seismic data consist of 110 x 110 ft stacking bins. Trace (inline, X) values increase from west to east, and line (crossline, Y) values increase from south to north. The northeast corner of the survey is located at trace 206 and line 201, and the southwest corner is located at trace 74 and line 105. The longitude and latitude values for the four corners of the survey were translated to X and Y values for the North Central Texas Zone (4202) of the U.S. State Plane Coordinate System and the 1927 North American Datum. The following table describes the four corners of the 3-D public seismic data, starting in the southwest corner and going clockwise:
Trace Line Longitude Latitude X Location Y Location
74 105 -97.94162 33.17897 1864886 550461
74 201 -97.94132 33.20800 1865021 561020
206 201 -97.89384 33.20766 1879540 560838
206 105 -97.89416 33.17863 1879406 550279
Data on the Floppy Disks
Two 3.5-inch disks are included in this publication. Each disk contains a self-extracting archive that can be copied to a hard drive and run as an executable file. The executable file for disk 1 is named SGRPUB1.EXE. The executable file for disk 2 is SGRPUB2.EXE. Approximately 12 megabytes of disk space will be used by these two files after they are run. There are 39 *.LAS files, 3 *.SGY files, and 5 *.TXT files on the two disks. The *.LAS files are digitized well log curves in "log ASCII," version 2.0, format for the 38 wells within the seismic grid. These log curves have been digitized at a depth increment of 0.5 ft, or 0.15 m. The *.SGY files are a far-offset VSP image, a zero-offset VSP image, and dynamite checkshot wiggle trace data written in SEGY format. The *.TXT files are text files describing the far-offset VSP image, the zero-offset VSP image, the checkshot data, the well log data base, and the engineering data base and are in tab-delimited text format.
35
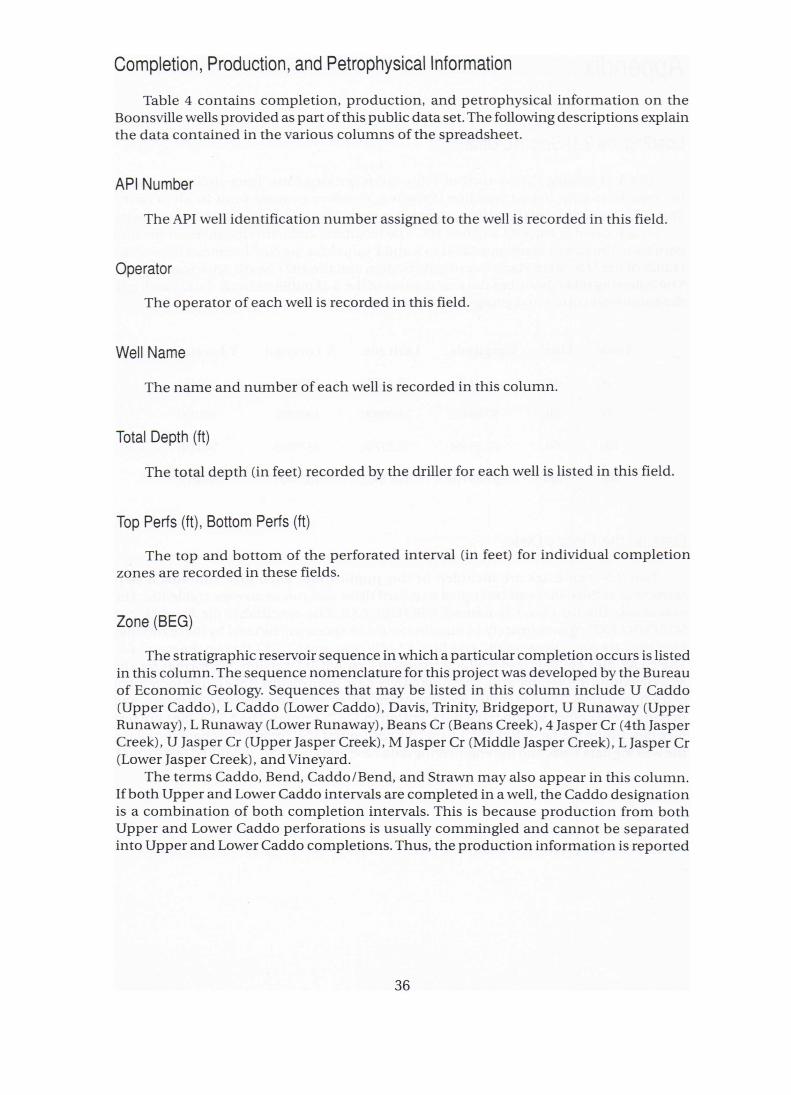
Completion, Production, and Petrophysical Information
Table 4 contains completion, production, and petrophysical information on the Boonsville wells provided as part of this public data set. The following descriptions explain the data contained in the various columns of the spreadsheet.
API Number
The API well identification number assigned to the well is recorded in this field.
Operator
The operator of each well is recorded in this field.
Well Name
The name and number of each well is recorded in this column.
Total Depth (ft)
The total depth (in feet) recorded by the driller for each well is listed in this field.
Top Perfs (ft), Bottom Perfs (ft)
The top and bottom of the perforated interval (in feet) for individual completion zones are recorded in these fields.
Zone (BEG)
The stratigraphic reservoir sequence in which a particular completion occurs is listed in this column. The sequence nomenclature for this project was developed by the Bureau of Economic Geology. Sequences that may be listed in this column include U Caddo (Upper Caddo), L Caddo (Lower Caddo), Davis, Trinity, Bridgeport, U Runaway (Upper Runaway), L Runaway (Lower Runaway), Beans Cr (Beans Creek), 4 Jasper Cr (4th Jasper Creek), U Jasper Cr (Upper Jasper Creek), M Jasper Cr (Middle Jasper Creek), L Jasper Cr (Lower Jasper Creek), and Vineyard.
The terms Caddo, Bend, Caddo/Bend, and Strawn may also appear in this column. If both Upper and Lower Caddo intervals are completed in a well, the Caddo designation is a combination of both completion intervals. This is because production from both Upper and Lower Caddo perforations is usually commingled and cannot be separated into Upper and Lower Caddo completions. Thus, the production information is reported
36
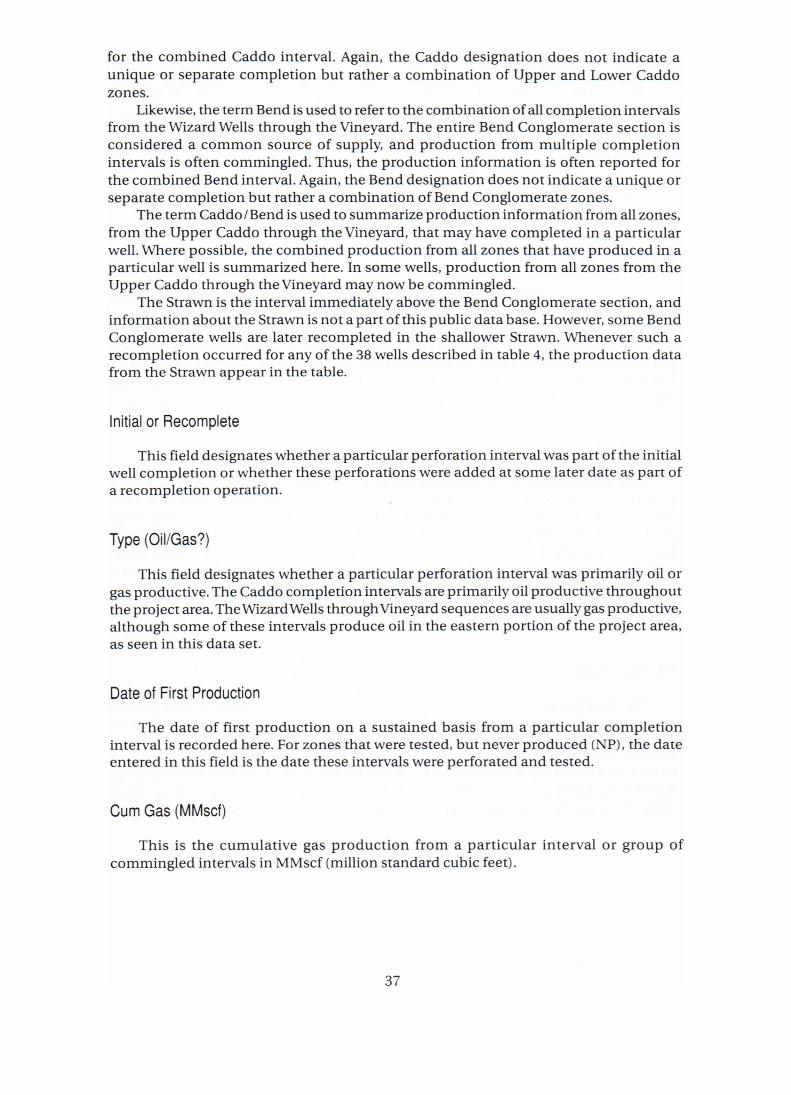
for the combined Caddo interval. Again, the Caddo designation does not indicate a unique or separate completion but rather a combination of Upper and Lower Caddo zones.
Likewise, the term Bend is used to refer to the combination of all completion intervals from the Wizard Wells through the Vineyard. The entire Bend Conglomerate section is considered a common source of supply, and production from multiple completion intervals is often commingled. Thus, the production information is often reported for the combined Bend interval. Again, the Bend designation does not indicate a unique or separate completion but rather a combination of Bend Conglomerate zones.
The term Caddo/Bend is used to summarize production information from all zones, from the Upper Caddo through the Vineyard, that may have completed in a particular well. Where possible, the combined production from all zones that have produced in a particular well is summarized here. In some wells, production from all zones from the Upper Caddo through the Vineyard may now be commingled.
The Strawn is the interval immediately above the Bend Conglomerate section, and information about the Strawn is not a part of this public data base. However, some Bend Conglomerate wells are later recompleted in the shallower Strawn. Whenever such a recompletion occurred for any of the 38 wells described in table 4, the production data from the Strawn appear in the table.
Initial or Recomplete
This field designates whether a particular perforation interval was part of the initial well completion or whether these perforations were added at some later date as part of a recompletion operation.
Type (Oil/Gas?)
This field designates whether a particular perforation interval was primarily oil or gas productive. The Caddo completion intervals are primarily oil productive throughout the project area. The Wizard Wells throughVineyard sequences are usually gas productive, although some of these intervals produce oil in the eastern portion of the project area, as seen in this data set.
Date of First Production
The date of first production on a sustained basis from a particular completion interval is recorded here. For zones that were tested, but never produced (NP), the date entered in this field is the date these intervals were perforated and tested.
Cum Gas (MMscf)
This is the cumulative gas production from a particular interval or group of commingled intervals in MMscf (million standard cubic feet).
37

Cum Oil (MSTB)
This is the cumulative oil production from a particular interval or group of commingled intervals in MSTB (thousand stock-tank barrels).
Cum Water (Mbbl)
This is the cumulative water production from a particular interval or group of commingled intervals in Mbbl (thousand barrels).
Cum As of Date
This is the date that corresponds to the cumulative gas, oil, and water production figures in the three previous fields. This date may vary from well to well and even among particular completion intervals within a given well. Often production from a completion zone that produced separately for several years will subsequently be commingled with production from zones added on recompletion. When possible, production attributed solely to this interval prior to commingling will be reflected in the three previous fields, and the last date of isolated production prior to commingling will be recorded here.
Current Status
This field designates the current status of a completion interval. It may be actively producing (P) isolated from other intervals, producing commingled (CO) with other intervals, shut in and temporarily abandoned (SI/TA), or abandoned (A) and no longer producing. Other designations include never produced (NP) for perforations that were tested but subsequently not produced, water injection well (WIW) for several Caddo wells that have been converted to water injection as part of a waterflood project, and drilled and abandoned (DA) for wells in the project area that were drilled and abandoned immediately as "dry" holes at the time of drilling, despite testing hydrocarbon potential in one or more of these wells.
Init. Pres. (psia)
This field designates the best estimate of initial reservoir pressure in psia (pounds per square inch, absolute), when available, for a particular completion interval. Initial pressure data are scarce throughout the project area and come from sources including drillstem tests, repeat formation tests, pressure buildup tests, and public data sources. When possible, initial pressure estimates are provided for individual completion intervals. Sometimes, initial pressure is measured only for a group of commingled intervals; in these cases, the initial pressure will be recorded in the Bend or Caddo summary fields.
38
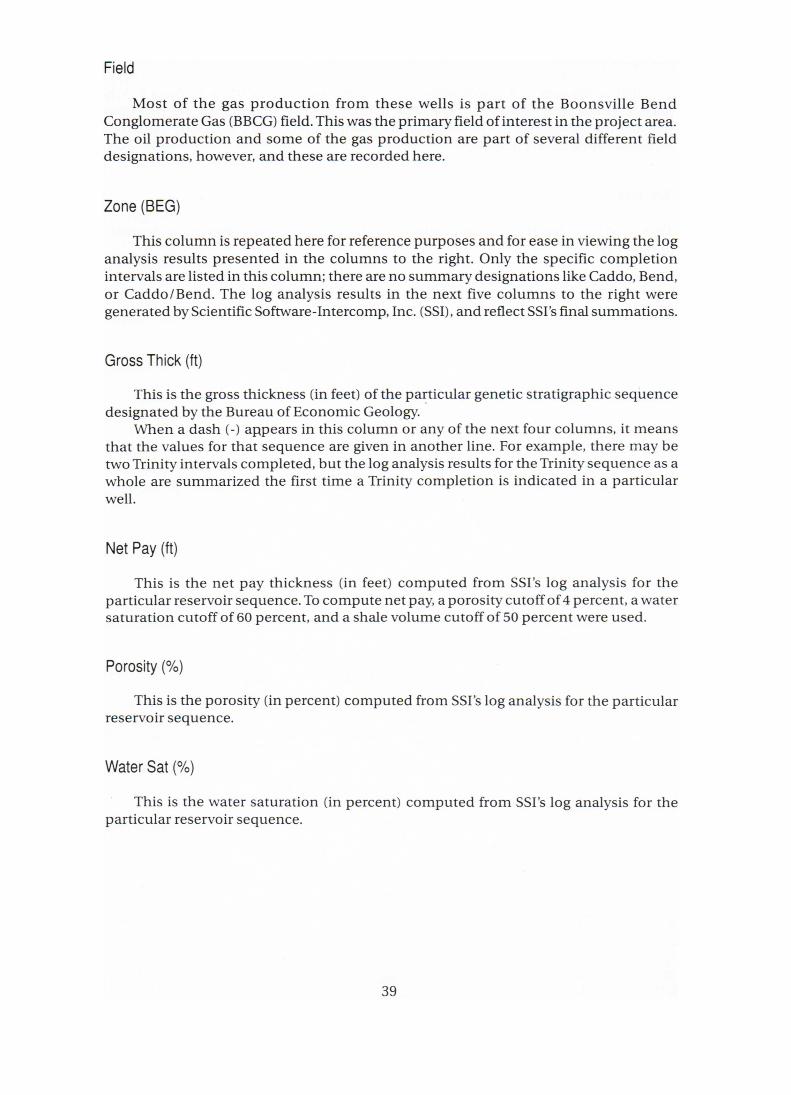
Field
Most of the gas production from these wells is part of the Boonsville Bend Conglomerate Gas (BBCG) field. This was the primary field of interest in the project area. The oil production and some of the gas production are part of several different field designations, however, and these are recorded here.
Zone (BEG)
This column is repeated here for reference purposes and for ease in viewing the log analysis results presented in the columns to the right. Only the specific completion intervals are listed in this column; there are no summary designations like Caddo, Bend, or Caddo/Bend. The log analysis results in the next five columns to the right were generated by Scientific Software-Intercomp, Inc. (SSI), and reflect SSI's final summations.
Gross Thick (ft)
This is the gross thickness (in feet) of the particular genetic stratigraphic sequence designated by the Bureau of Economic Geology.
When a dash (-) appears in this column or any of the next four columns, it means that the values for that sequence are given in another line. For example, there may be two Trinity intervals completed, but the log analysis results for the Trinity sequence as a whole are summarized the first time a Trinity completion is indicated in a particular well.
Net Pay (ft)
This is the net pay thickness (in feet) computed from SSI's log analysis for the particular reservoir sequence. To compute net pay, a porosity cutoff of 4 percent, a water saturation cutoff of 60 percent, and a shale volume cutoff of 50 percent were used.
Porosity (%)
This is the porosity (in percent) computed from SSI's log analysis for the particular reservoir sequence.
Water Sat (%)
This is the water saturation (in percent) computed from SSI's log analysis for the particular reservoir sequence.
39

Net Hydro (ft)
This is the total net hydrocarbon feet computed from SSI's log analysis for the particular reservoir sequence. This value is calculated by multiplying net pay times porosity times (1 minus the water saturation), with both porosity and water saturation expressed as decimal fractions.
Remarks
This field includes any relevant comments about a particular completion interval or intervals.
40
Related Documents