Wayne State University Wayne State University Wayne State University Dissertations January 2019 3d Scanning And The Impact Of The Digital Thread On 3d Scanning And The Impact Of The Digital Thread On Manufacturing And Re-Manufacturing Applications Manufacturing And Re-Manufacturing Applications Mojahed Alkhateeb Wayne State University, [email protected] Follow this and additional works at: https://digitalcommons.wayne.edu/oa_dissertations Part of the Engineering Commons Recommended Citation Recommended Citation Alkhateeb, Mojahed, "3d Scanning And The Impact Of The Digital Thread On Manufacturing And Re- Manufacturing Applications" (2019). Wayne State University Dissertations. 2251. https://digitalcommons.wayne.edu/oa_dissertations/2251 This Open Access Embargo is brought to you for free and open access by DigitalCommons@WayneState. It has been accepted for inclusion in Wayne State University Dissertations by an authorized administrator of DigitalCommons@WayneState.

Welcome message from author
This document is posted to help you gain knowledge. Please leave a comment to let me know what you think about it! Share it to your friends and learn new things together.
Transcript

Wayne State University Wayne State University
Wayne State University Dissertations
January 2019
3d Scanning And The Impact Of The Digital Thread On 3d Scanning And The Impact Of The Digital Thread On
Manufacturing And Re-Manufacturing Applications Manufacturing And Re-Manufacturing Applications
Mojahed Alkhateeb Wayne State University, [email protected]
Follow this and additional works at: https://digitalcommons.wayne.edu/oa_dissertations
Part of the Engineering Commons
Recommended Citation Recommended Citation Alkhateeb, Mojahed, "3d Scanning And The Impact Of The Digital Thread On Manufacturing And Re-Manufacturing Applications" (2019). Wayne State University Dissertations. 2251. https://digitalcommons.wayne.edu/oa_dissertations/2251
This Open Access Embargo is brought to you for free and open access by DigitalCommons@WayneState. It has been accepted for inclusion in Wayne State University Dissertations by an authorized administrator of DigitalCommons@WayneState.

3D SCANNING AND THE IMPACT OF THE DIGITAL THREAD ONMANUFACTURING AND RE-MANUFACTURING APPLICATIONS
by
MOJAHED MOHAMMAD F. ALKHATEEB
DISSERTATION
Submitted to the Graduate School
of Wayne State University,
Detroit, Michigan
in partial fulfillment of the requirements
for the degree of
DOCTOR OF PHILOSOPHY
2019
MAJOR: INDUSTRIAL ENGINEERING
Approved By:
Advisor Date

DEDICATION
To my parents and wonderful family
ii

ACKNOWLEDGEMENTS
First, I would like to thank Dr. Jeremy Rickli for his guidance, ideas and support
and also for allowing me to take the lead in the MaRSLab and work as a graduate research
assistant. I value his guidance, as well as his efficiency and responsiveness in reviewing my
work. I would also like to thank Dr. Ana Djurich for allowing me to use the robot in her
lab to conduct the experiments and being there when needed. I would also like to extend
my thanks and appreciations to Dr. Qingyu Yang and Dr. Evrim Dalkiran, who have
served as my dissertation committee members, for their valuable comments and constructive
suggestions on this work. The MaRSLab Lab has been like my home since I started my
Ph.D. journey. I would also like to thank King Abdulaziz University and the Government
of Saudi Arabia for providing the financial support throughout my study.
I would like to convey my appreciation to my friends Dr. Mahmoud Alzahrani for
his support in programming the point cloud comparison tool, Dr. Mohammad Mkaouer
for his support in programming and encouragement throughout my Ph.D. journey, and
my colleague Shengyu Liu for her help with conduction the CT scanning experiment, and
Nicholas Christoforou for his help with the analysis of the smoothing factors. I must also
express my sincere thanks to Ms. Sara Tipton for proofreading and editing my research.
My journey in pursuit of this research program would not have been possible without
the sacrifice and constant prayers from my family especially my parents, Eng. Mohammad
Alkhateeb and Dr. Omaima Abulfaraj, my wife, Amenah Baroum, and our wonderful daugh-
ter, Maha, who did not complain too much when I picked her up late from school. They are
the driving force in my life and career, and without them, the journey would have been less
meaningful.
I pray to Allah, whom I owe the knowledge, strength and determination to complete
this research, to bless us all.
iii

TABLE OF CONTENTS
DEDICATION ii
ACKNOWLEDGEMENTS iii
LIST OF FIGURES xi
LIST OF TABLES xii
CHAPTER 1: INTRODUCTION 1
1.1 BACKGROUND AND MOTIVATION . . . . . . . . . . . . . . . . . . . . . 1
1.1.1 Contact and Non-Contact Inspection . . . . . . . . . . . . . . . . . . 3
1.1.2 3D Scanning Technologies That Are Being Used for Various Application 4
1.1.3 Challenges in 3D laser line Scanning in Manufacturing . . . . . . . . 5
1.1.4 Motivation and Significance . . . . . . . . . . . . . . . . . . . . . . . 7
1.1.5 Research Problems . . . . . . . . . . . . . . . . . . . . . . . . . . . . 9
1.1.6 Research Challenges . . . . . . . . . . . . . . . . . . . . . . . . . . . 10
1.1.7 Research Objectives . . . . . . . . . . . . . . . . . . . . . . . . . . . 12
1.2 LITERATURE REVIEW . . . . . . . . . . . . . . . . . . . . . . . . . . . . 12
1.2.1 Free-form Surfaces Inspection Methods . . . . . . . . . . . . . . . . . 13
1.2.2 Computer Aided Inspection Planning . . . . . . . . . . . . . . . . . . 13
1.2.3 Point Cloud Quality for Contact and Non-Contact Inspection . . . . 18
1.2.4 3D Scanning Applications . . . . . . . . . . . . . . . . . . . . . . . . 18
1.2.5 Strategies for Improving Point Cloud . . . . . . . . . . . . . . . . . . 19
1.2.6 Point Cloud Analysis . . . . . . . . . . . . . . . . . . . . . . . . . . . 23
1.2.7 Factors That Affect Scanning Quality in Previous Studies . . . . . . . 24
1.2.8 Robot Kinematics . . . . . . . . . . . . . . . . . . . . . . . . . . . . . 27
1.2.9 3D scanning parameters . . . . . . . . . . . . . . . . . . . . . . . . . 29
1.2.10 Manufacturing Digital Thread And Point Cloud Smoothing . . . . . . 31
iv

1.3 APPROACH . . . . . . . . . . . . . . . . . . . . . . . . . . . . . . . . . . . 34
1.3.1 Linkage of C-Track in the Kinematic Model . . . . . . . . . . . . . . 35
1.3.2 Prediction of the Location of the Laser Beam . . . . . . . . . . . . . 36
1.3.3 Systematical Varied Scan Parameter Experiment . . . . . . . . . . . 37
1.3.4 Assumptions and Limitations . . . . . . . . . . . . . . . . . . . . . . 46
1.4 CONTRIBUTIONS . . . . . . . . . . . . . . . . . . . . . . . . . . . . . . . . 47
1.4.1 C-track Transform and Model Validation . . . . . . . . . . . . . . . . 47
1.4.2 The Role of the Right Parameter On the Scan Quality . . . . . . . . 48
1.4.3 Error Propagation in the Point Cloud for Remanufacturing Process
Planning . . . . . . . . . . . . . . . . . . . . . . . . . . . . . . . . . . 49
1.4.4 Using a Predictive Model to Optimize the Parameters of a CT- scanner 49
CHAPTER 2: LINKAGE BETWEEN MEASURED AND COLLECTED
POINTSWITHIN THE SCANNING PROCESS FOR THE INTEGRATED
AUTOMATED LASER LINE SCANNING INSPECTION SYSTEM 51
2.1 Abstract . . . . . . . . . . . . . . . . . . . . . . . . . . . . . . . . . . . . . . 51
2.2 Introduction . . . . . . . . . . . . . . . . . . . . . . . . . . . . . . . . . . . . 51
2.3 The Current System . . . . . . . . . . . . . . . . . . . . . . . . . . . . . . . 54
2.4 Elements of the Automated Laser Line Scanning System . . . . . . . . . . . 54
2.4.1 Laser Line Scanner . . . . . . . . . . . . . . . . . . . . . . . . . . . . 55
2.4.2 FANUC S-430 IW Robot . . . . . . . . . . . . . . . . . . . . . . . . . 56
2.5 Approach . . . . . . . . . . . . . . . . . . . . . . . . . . . . . . . . . . . . . 57
2.6 Methodology . . . . . . . . . . . . . . . . . . . . . . . . . . . . . . . . . . . 57
2.7 Kinematic Model and the Relationship between the C-track and the Robot
Reference Frame . . . . . . . . . . . . . . . . . . . . . . . . . . . . . . . . . 60
2.7.1 The Relationship between the C-track Reference Frame and the Robot
Reference Frame . . . . . . . . . . . . . . . . . . . . . . . . . . . . . 65
2.8 Summary . . . . . . . . . . . . . . . . . . . . . . . . . . . . . . . . . . . . . 67
v

CHAPTER 3: STUDYING THE EFFECT OF SCANNING SPEED AND
RESOLUTION ON POINT CLOUD QUALITY 68
3.1 Abstract . . . . . . . . . . . . . . . . . . . . . . . . . . . . . . . . . . . . . . 68
3.2 Introduction . . . . . . . . . . . . . . . . . . . . . . . . . . . . . . . . . . . . 69
3.3 Methodology . . . . . . . . . . . . . . . . . . . . . . . . . . . . . . . . . . . 73
3.4 Systematically Varied Scan Parameters Experiment . . . . . . . . . . . . . . 75
3.5 Aim of the Experiment . . . . . . . . . . . . . . . . . . . . . . . . . . . . . . 78
3.6 Approach . . . . . . . . . . . . . . . . . . . . . . . . . . . . . . . . . . . . . 78
3.7 Results . . . . . . . . . . . . . . . . . . . . . . . . . . . . . . . . . . . . . . . 79
3.8 Limitations . . . . . . . . . . . . . . . . . . . . . . . . . . . . . . . . . . . . 88
3.9 Strategies for Improving the Point Cloud Quality . . . . . . . . . . . . . . . 88
3.10 Summary . . . . . . . . . . . . . . . . . . . . . . . . . . . . . . . . . . . . . 89
CHAPTER 4: ERROR PROPAGATION IN DIGITAL ADDITIVE REMAN-
UFACTURING PROCESS PLANNING 90
4.1 Abstract . . . . . . . . . . . . . . . . . . . . . . . . . . . . . . . . . . . . . . 90
4.2 Introduction . . . . . . . . . . . . . . . . . . . . . . . . . . . . . . . . . . . . 90
4.3 Methodology . . . . . . . . . . . . . . . . . . . . . . . . . . . . . . . . . . . 92
4.3.1 Scanning Error . . . . . . . . . . . . . . . . . . . . . . . . . . . . . . 94
4.3.2 Smoothing Errors . . . . . . . . . . . . . . . . . . . . . . . . . . . . . 97
4.3.3 Meshing Error . . . . . . . . . . . . . . . . . . . . . . . . . . . . . . . 98
4.3.4 Slicing Error . . . . . . . . . . . . . . . . . . . . . . . . . . . . . . . . 100
4.3.5 Printing Error . . . . . . . . . . . . . . . . . . . . . . . . . . . . . . . 101
4.4 Experimental Design . . . . . . . . . . . . . . . . . . . . . . . . . . . . . . . 102
4.5 Results and Discussion . . . . . . . . . . . . . . . . . . . . . . . . . . . . . . 106
4.6 Summary . . . . . . . . . . . . . . . . . . . . . . . . . . . . . . . . . . . . . 109
vi

CHAPTER 5: USING A PREDICTIVE MODEL TO OPTIMIZE THE PA-
RAMETERS OF A CT SCANNER 110
5.1 Introduction . . . . . . . . . . . . . . . . . . . . . . . . . . . . . . . . . . . . 110
5.2 Methodology . . . . . . . . . . . . . . . . . . . . . . . . . . . . . . . . . . . 111
5.3 Results . . . . . . . . . . . . . . . . . . . . . . . . . . . . . . . . . . . . . . . 115
5.4 Discussion . . . . . . . . . . . . . . . . . . . . . . . . . . . . . . . . . . . . . 116
5.5 Summary . . . . . . . . . . . . . . . . . . . . . . . . . . . . . . . . . . . . . 117
CHAPTER 6: CONCLUSION 119
APPENDIX 121
REFERENCES 131
ABSTRACT 132
AUTOBIOGRAPHICAL STATEMENT 134
vii

LIST OF FIGURES
1.1 Point cloud artifacts C(a,b) collected by CMM and laser scanner [1] . . 4
1.2 Impression of a side of the object in one instance . . . . . . . . . . . . . 6
1.3 Bulk/Terrestrial scanners [2] . . . . . . . . . . . . . . . . . . . . . . . . 16
1.4 Triangulation scanners or shape scanners attached to a robot . . . . . . 17
1.5 (a) picture of the part; (b) raw data collected by the scanner; (c) com-
bined three method used in the literature; (d) the proposed method [3] 20
1.6 The systematic error of the scanned data in relation to the view angle
and standoff distance [4]. . . . . . . . . . . . . . . . . . . . . . . . . . . 22
1.7 Scanning errors "Typical artifacts of raw scanner data. Top Row: Holes
due to sensor restrictions, noise, outliers. Bottom Row: Low sampling
density due to gracing sensor views, low sampling density at delicate
surface details, and holes due to critical reflectance properties." [5] . . . 24
1.8 In plane and out of plane view angle [6]. . . . . . . . . . . . . . . . . . 30
1.9 Point collection of general laser line scanners to be used as end effectors
model [7] . . . . . . . . . . . . . . . . . . . . . . . . . . . . . . . . . . . 36
1.10 Point location validation board . . . . . . . . . . . . . . . . . . . . . . . 37
1.11 In-plane and out-of-plane view angle image [6]. . . . . . . . . . . . . . . 38
1.12 The effect of In-Plane vs Out-of-Plane angle image [6] . . . . . . . . . . 38
1.13 The used 3D scanner drawing from Creaform training materials . . . . 39
1.14 The actual used 3D scanner from Creaform training materials . . . . . . 40
1.15 The robot attached to the laser scanner. . . . . . . . . . . . . . . . . . 42
1.16 Experimental Components Selected . . . . . . . . . . . . . . . . . . . . 43
2.1 Point collection of general laser line scanners to be used as end effectors
model . . . . . . . . . . . . . . . . . . . . . . . . . . . . . . . . . . . . . 55
2.2 Offset of the Creaform MetraSCAN-R laser line scanner MetraSCAN
training PPT) . . . . . . . . . . . . . . . . . . . . . . . . . . . . . . . . 56
viii

2.3 The workspace of the robot (a): without the table (b): with the table. . 58
2.4 The robot calibrated and set up at zero position without the Scanner
installed . . . . . . . . . . . . . . . . . . . . . . . . . . . . . . . . . . . 59
2.5 Drawing the representation of the robot kinematics Djuric, (2007) [8] . 59
2.6 The robot calibrated and set up at zero position with the scanner in-
stalled and the table placed with the laser beam in the zero position . . 60
2.7 The robot work cell along with the calculation of the angles and the
measurement of the workspace. . . . . . . . . . . . . . . . . . . . . . . 61
2.8 Matlab prompt to get forward kinematics by inserting D-H parameters
and theta . . . . . . . . . . . . . . . . . . . . . . . . . . . . . . . . . . . 64
2.9 Matlab prompt to insert origin of the C-track . . . . . . . . . . . . . . . 66
3.1 The Test Setup with the 3D scanner mounted to the robot and the white
board as the flat surface . . . . . . . . . . . . . . . . . . . . . . . . . . 73
3.2 The shape of the scanned point cloud representing the defect. . . . . . . 74
3.3 The steps taken to design and perform the experiment . . . . . . . . . . 76
3.4 the scanner view angle in relationship to the part being scanned . . . . 77
3.5 The scanner attached to the robot with the white board in place . . . . 80
3.6 The scanner Path in the experiment . . . . . . . . . . . . . . . . . . . . 80
3.7 The area selected for the analysis . . . . . . . . . . . . . . . . . . . . . 81
3.8 All parameters fixed except speed at highest setting at 25% equal to 750
mm/s. . . . . . . . . . . . . . . . . . . . . . . . . . . . . . . . . . . . . 81
3.9 All parameters fixed except speed at medium setting at 15% equal to 450
mm/s. . . . . . . . . . . . . . . . . . . . . . . . . . . . . . . . . . . . . 82
3.10 All parameters fixed except speed at lowest setting at 5% equal to 150
mm/s. . . . . . . . . . . . . . . . . . . . . . . . . . . . . . . . . . . . . 82
3.11 Plot of the standoff distance view angle speed and resolution . . . . . . 85
3.12 Interaction plot of the speed and resolution . . . . . . . . . . . . . . . 85
ix

3.13 plot of the speed and resolution . . . . . . . . . . . . . . . . . . . . . . 86
3.14 Interaction plot of the speed and resolution . . . . . . . . . . . . . . . 86
4.1 Flowchart of the main steps of EoL core condition assessment and digi-
tization [9] . . . . . . . . . . . . . . . . . . . . . . . . . . . . . . . . . . 92
4.2 Effect of the density of the point cloud on preserving the features . . . . 94
4.3 Effect of the slice height on the manufacturing error . . . . . . . . . . . 95
4.5 The shape of the scanned point cloud representing the defect . . . . . . 95
4.4 Point cloud capturing and processing steps in the remanufacturing. . . . 96
4.6 The shape of the scanned point cloud representing the defect after smooth-
ing. . . . . . . . . . . . . . . . . . . . . . . . . . . . . . . . . . . . . . . 97
4.7 The shape of the scanned point cloud representing the defect after mesh-
ing the points. . . . . . . . . . . . . . . . . . . . . . . . . . . . . . . . . 99
4.8 The shape of the scanned point cloud of a defective part aligned with
the scanned point cloud of an intact part. . . . . . . . . . . . . . . . . . 100
4.9 The slicing material deposition plan. . . . . . . . . . . . . . . . . . . . . 100
4.10 Printing and actual material deposition error. . . . . . . . . . . . . . . . 102
4.11 blank (top left), 2mm defect (top right), 5mm defect (bottom left), 8mm
defect (bottom right). . . . . . . . . . . . . . . . . . . . . . . . . . . . . 103
4.12 8mm defect model with noise after removing the surrounding area from
the scanned data. . . . . . . . . . . . . . . . . . . . . . . . . . . . . . . 103
4.13 Threshold Distance and Threshold Angle Defect Detection Strategy. . . 105
4.15 Normalized Depth of 8mm and 2mm Defect Models. . . . . . . . . . . . 106
4.14 Height and width dimensions. . . . . . . . . . . . . . . . . . . . . . . . 106
4.16 Normalized Width of 8mm and 2mm Defect Models. . . . . . . . . . . . 107
4.17 Point cloud evolution as smoothing factor varies from 0.1 to 1.6 . . . . 108
5.1 Six L shape objects for experiment and scanning . . . . . . . . . . . . . 112
5.2 Selected materials weight on a high precision scale to calculate density . 112
x

5.3 Confusion Matrix for good and bad prediction for the current gathered
data with 70% model and 30% testing . . . . . . . . . . . . . . . . . . . 113
5.4 The model created to analyze the data predict the good/bad outcomes 114
5.5 Decision tree example . . . . . . . . . . . . . . . . . . . . . . . . . . . . 114
5.6 Wenzel exaCT-S device at Wayne State University . . . . . . . . . . . . 115
5.7 The accuracy of the model . . . . . . . . . . . . . . . . . . . . . . . . . 116
xi

LIST OF TABLES
1.2 Parameters and parameter controls for the experiment . . . . . . . . . . 44
1.1 Literature Review of Different Factors . . . . . . . . . . . . . . . . . . . 50
2.3 Robot D-H parameters . . . . . . . . . . . . . . . . . . . . . . . . . . . 62
3.4 Standoff Distance Levels . . . . . . . . . . . . . . . . . . . . . . . . . . 76
3.5 Scanner resolution . . . . . . . . . . . . . . . . . . . . . . . . . . . . . . 78
3.6 The Speed Levels . . . . . . . . . . . . . . . . . . . . . . . . . . . . . . 78
3.7 Scanner resolution . . . . . . . . . . . . . . . . . . . . . . . . . . . . . . 79
3.8 The Speed Levels . . . . . . . . . . . . . . . . . . . . . . . . . . . . . . 79
3.9 View Angle Levels . . . . . . . . . . . . . . . . . . . . . . . . . . . . . . 83
3.11 ANOVA table . . . . . . . . . . . . . . . . . . . . . . . . . . . . . . . . 84
3.12 ANOVA table . . . . . . . . . . . . . . . . . . . . . . . . . . . . . . . . 84
3.10 Factors and levels . . . . . . . . . . . . . . . . . . . . . . . . . . . . . . 84
3.13 General Factorial Regression Factors and Levels . . . . . . . . . . . . . 87
3.14 Analysis of Variance Resolution and Speed . . . . . . . . . . . . . . . . 87
3.15 Pearson correlation results for the 81 experiments . . . . . . . . . . . . 87
3.16 Pearson correlation results for the 27 experiments . . . . . . . . . . . . 87
5.17 Decision Tree Classifier Parameters . . . . . . . . . . . . . . . . . . . . 113
5.18 Material property information . . . . . . . . . . . . . . . . . . . . . . . 115
xii

1
CHAPTER 1: INTRODUCTION
1.1 BACKGROUND AND MOTIVATION
Traditional inspection methods in manufacturing required technical individuals that
use a variety of gauges and tools. These techniques require time which is not consistent
because performance involves human interaction. The issue is because of the variations
involved, there is no standard due to the nature of human error and variation. With the
increasing demand for quality and speed in manufacturing, the importance of automation in
the processes, and the use of machinery to conduct inspection, attracted developers to provide
automated solutions. Automation of inspection techniques has improved both the accuracy
and the speed of inspection processes. Developers have invented devices that measure the
coordinates of the part being inspected automatically by using a device called Coordinate
Measurement Machines (CMM). CMMs inspect the part by using a touch probe that contacts
the surface of the part and makes multiple contacts with the part being inspected to collect
points on the surface. These points are then fed to a computer device and compared with the
original value to decide if the measured part within the tolerance is specified. The technology
is very precise and accurate. However, the process is slow in acquiring the dimensional
information, as is it required to make a movement and contact the part each time a point is
collected [10]. Contacting the part in order to collect data points is not efficient for collecting
a large number of points and would require a long time in the manufacturing facility. Non-
contact inspection methods, such as laser line scanners, can obtain a large number of data
points in a short period of time [11] in comparison with the contact type of inspection [1].
However, in many non-contact inspection methods, human involvement is required, which is
a time-consuming technique that is run on a trial and error basis in manual inspection [12]. In
order to avoid human involvement in inspection and make the process more time efficient and
error free, it is important to facilitate the use of automated planning for inspection in laser
scanning [13]. 3D scanning technology can be automated to generate plans for inspections
for consistent and repetitive measurement. These consistent plans are dependent on the

2
dimensional information of the specific part that is being inspected and are tailored to the
specific features on the surface. In order to generate the best automated plan for the 3D
scanner to follow, the relationship between point cloud quality and scan parameters must be
defined. With the advances in CAD/CAM and machining technologies manufacturers are
able to make complex, compound curved parts, but parts need to be inspected. Traditional
methods may not capture all the data needed, especially if the parts have compound curves,
surfaces with multiple features, and other organic shapes. 3D scanners are the perfect tool
to use in order to inspect these organic shaped surfaces and ergonomically designed parts
[14]. In addition, traditional inspection of free-form surfaces requires highly skilled technical
individuals, which takes a long time. 3D scanners have made it possible to accurately and
quickly measure free-form surfaces due to their ability to measure a fine detailed surface
quickly and cover the surface faster than the CMMs while not having a visibility problem
[1]. When automating a 3D scanner, depending on the size and the type of the scanner, the
scanner is either mounted to a robotic arm and the part is on a turntable [15, 16, 17, 10]
or mounted on a robotic arm; the part is fixed, and the the scanner moves around the part
[18, 19], or it can be in place at the end probe in CMM [20]. In all cases the scanner is
programmed to make a movement over the part to scan it; these movements are based on
the location of the part being inspected in the robot/CMM workspace. When using the
scanner mounted to a robotic arm, the data gathered from the scanner are then stored in
the scanner workspace. In this dissertation, it will be referred to as the C-track workspace.
The relationship between the workspaces are not known, so there is a need for it to be derived
in order to reference a point on the surface of a part to be revisited. In this thesis I divided
the work into four tasks the that will be divided into four chapters. The first task is to
connect the workspaces together and find the relationship between the robot workspace and
the scanner workspace. The second task is to conduct experiments with systematically varied
parameters to study the effect on the scan quality caused by the view angle of the scanner
to the test object being inspected, the stand-off distance between the scanner and the test

3
object, and the speed of the movement of the reboot arm, as well as the resolution setting
selected on the scanner. The third task is to study the effect of the changes in the point
cloud or the digital representation of the object for the remanufacturing applications, this
will be following all the steps in the remanufacturing facility starting from the inspection and
digitization phase all the way to the remanufacturing phase that is material deposition. The
fourth task is to use machine learning to optimize the parameters of the scanning technology
in order to get the best scanning outcomes and study the accuracy of the model.
1.1.1 Contact and Non-Contact Inspection
Contact measurement methods acquire surface geometric information using tactile
sensors such as gauges and probes that physically touch the part being inspected such as
CMMs. (Figure 1.1.a). On the other hand, non-contact measurement methods acquire
surface geometric information by using some sensing devices such as laser/optical scanners,
X-rays, or CT-scanners [1].
In contact inspecting methods there are several factors that do not need to be taken
into consideration, since it would not affect the process of measurement dimensional informa-
tion of the inspected surface. These include view angle, standoff distance, and speed. Speed
is not critical for individual point measurement because CMM speed does not affect the abil-
ity to capture a point as long as the probe is making contact with the surface. The contact
inspection methods, such as CMM, is accurate although it does not allow for the collection
of many data points as quickly as a non-contact inspection method (Figure 1.1b). Optical
CMMs are one of the technologies that are not as clear in terms of contact or non-contact;
non-contact optical CMMs systems have an optical eye to measure the dimensions of the
object. However, they have some mechanical constraints as the part has to fit in the area
designated for use. The main difference between Optical CMMs and a 3D scanners is the
ability of the 3D scanner to collect more data points and scan larger objects. Portable opti-
cal CMMs come with a scanner and a portable probe that contacts the part while scanning.
Although it has a probe, it is considered contactless as it moves freely around the surface

4
Figure 1.1: Point cloud artifacts C(a,b) collected by CMM and laser scanner [1]
and only collects points based on its location on the part and on what angle it is. It provides
the ability to measure large objects by freely walking around them and has no mechanical
constraints. CT-scanners on the other hand provide a solution to inspect the geometry of
the part along with the internal structure and the condition of the part by projecting x-ray
signals in different frequencies and provide a visual representation of the part.
1.1.2 3D Scanning Technologies That Are Being Used for Various
Application
Commercial laser scanners can be attached to a robot or coordinate measuring ma-
chines (CMMs) for dimensional inspection, reverse engineering [21, 22], and re-manufacturing
[23]. Compared to a contact method, such as CMM using a touch-trigger probe, laser scan-

5
ners have the advantage due to their ability to gather many points in a short time with high
speed, high resolution, and without contact sensing [24]. This advantage has also attracted
non-manufacturing fields due to the technology’s ability to do touchless scanning. 3D scan-
ning has been used in many applications, some related to civil engineering and surveying,
and others related to medical applications and historical preservation of heritage [24]. This
includes historians who capture dimensional data about sculptures to digitally record and
preserve historical artifacts [25]. Physicians use laser scanners as a surface measuring tool
for clinical assessment of patients [26]. Depending on the intended use of a 3D scanner, there
are multiple scanners to select from. No one single scanner can fulfill all the required needs
of different applications. It depends on the size of the object being scanned and the scanner’s
features. Scanners can be categorized into two types: ranging scanners and triangulation
scanners. Ranging scanners scan buildings and large objects with lower precision compared
to triangulation scanners. These scanners are fixed in one place and a laser beam is projected
from the scanner to scan up to 360 degrees around the scanner; these scanners are not ideal
to scan objects as they only scan one side that is visible on the object. Scanners are not
the same in their abilities and features. Some are small and easy to transport and have the
ability to run on a battery, while others are bulky and hard to move. Other features are
related to the ability of the scanner such as resolution, speed, field of view, and range limits.
Scanners are also not the same in their ability to scan when there is interfering radiation
[27]. This research will be working with a triangulation scanner. Which has the ability to
scan medium to large objects such as a car hood or a door, and it also provides the ability
to be moved around the object to cover the surface from all angles.
1.1.3 Challenges in 3D laser line Scanning in Manufacturing
Although laser scanners can obtain a large number of data points in a short period
of time as shown in Figure 1.2, there are challenges that hinder their use as an inspection
tool in manufacturing applications, due to some trial and error and the iteration it is taken
by the workers in taking the measurements.

6
Figure 1.2: Impression of a side of the object in one instance
There is a need for development of automated laser scanning system models that
avoid the trial and error caused by manual scanning [12]. Since there is a lack of knowledge
on the effect of the different parameters the scan quality, the outcomes of automating the
process will not be a clear and accurate point cloud that can be used in the manufacturing
industry as a tool for inspection. When scanning manually, it is difficult to keep track of all
the details about the standoff distance, and the view angle due to fatigue that occur while
holding the scanner and inability to manually control it. Automating the process will make
it possible to scan a specific part while keeping track of scanning parameters such as view
angle and standoff distance by integrating it into the scan trajectory. This will result in
consistently getting a complete point cloud that represents the surface each time.

7
1.1.4 Motivation and Significance
There has been little research focused on the effect of scan quality by the integration
of the 3D scanner with a robotic arm and testing the system as a whole in an effort to
automate the system. Understanding the effect of integrating these components together is
important in designing an optimized trajectory path in the future. Analysis predicts that
there will be a compound annual growth rate of 13.81 % annually in the market of 3D
Scanning over the period of 2013-2018. ("Global 3D Scanning Market 2014-2018"). This
research is motivated by the importance of a defect detection method which can be used in
today’s fast paced manufacturing facility. There is a continued demand for better quality
in manufacturing. Manufacturers are concerned about utilization by having a flexible line
manufacturing facility that is able to handle multiple products with minimum modification
to the line itself [28]. Having flexible technology that can be used with different setups is
a key component in a flexible manufacturing facilities. 3D scanning can be used in flexible
manufacturing facilities as an inspection tool for defects due to its ability to scan a variety
of products with little modification [14]. However, the current manual approach, although
it is lean and flexible, needs to be automated, as that would reduce the inspection time
approximately 30% [29] and generate more consistent scan data. This can be solved by
generating a scan path trajectory based on each part using a vision system that identifies
the part on the production line and activates the specified scan trajectory for the part being
inspected. National Institute of Standards and Technology (NIST) is initiating a project
to demonstrate how a standardized 3D model of a product can integrate and streamline
production from the initial design through the final inspection in a continuous, coherent data-
driven process. This tightly integrated, seamless string of activities is what manufacturers
call a “digital thread” [30]. Products and Manufacturing Information (PMI), proposed by
NIST, will include non-geometric attributes in a 3D CAD model that will be important for
manufacturing product components and assemblies [31]. The automated laser line scanning
system will help in increasing the information content by adding the original manufactured

8
dimensional information to the digital thread, and making the scanned data more effective.
The availability of PMI will make it possible to reverse engineer a product and use the
scanning technology to collect geometric information. The collected scanned dimensional
information along with the PMI information can be used in remanufacturing applications
and inspecting the part to be remanufactured. This can also be used to sort the quality
of the parts received at the remanufacturing facility for quick decisions about accepting
or rejecting the part based on the feasibility of the part received. Despite the continued
improvement in accuracy, there is still a problem, as most of the current scanning techniques
and procedures cause very bad scanning artifacts, such as noise, outliers, missing areas, and
incomplete geometry [5]. Researchers have been addressing this with two strategies. The
first strategy is by point cloud processing to remove errors [5]. The second strategy is point
cloud path planning to minimize the amount of work in point cloud processing. Within
the second strategy there are researchers that are looking at the noise caused from the part
being inspected and the effect of the surface finish [32]. Others are looking at the problem
from the parameters on the scanning procedure [18, 6]. Understanding the effect of different
parameters on the quality of the scan is important as it can lead to better scan quality
and reduce the noise and inconsistency in the data; it also reduces the effort of cleaning
the dataset after scanning. Extensive cleaning can eliminate points that are important in
identifying the defect and make the technology not applicable for use as an inspection tool.
Having better scanning quality by using the right parameters will reduce the processing
time that will also save inspection time. It will also improve the quality of the generated
trajectory as it is generated based upon the best parameters in accordance to the curvature
of the part being scanned. Experiments in this study are expected to explain the effect of
the parameters on the scan quality that is required to benchmark future scan path planning
methods. In order to automate the technology and take it from its manual current state,
there is a need to investigate scanning techniques and define it based on the best outcomes
unlike its current trial and error technique. Manual scanning often results in numerous bad

9
scanning artifacts and can require scanning the same part multiple times to capture what
was missed. This is a time consuming process that has to be avoided in automatic inspection.
This cannot be achieved unless the parameters are defined and taken into consideration in
the scan planning process. It is important for any exploration and understanding of the
problem to understand the effect of the parameter in order to suggest an improvement or to
optimize the process [32]. Parameters effect on the scan quality are still not well addressed
in the literature along with the limitations of the 3D scanning technology.
1.1.5 Research Problems
Current point cloud measurement procedures are time consuming and do not produce
good scan quality. Because current scan procedures are based on manual trial and error, they
produce scans that cannot be used as a basis for inspection due to variability in the procedure
and noise in the scans that produce many artifacts and outliers. There is a need to develop
an automated laser scanning system to avoid these variations and have a consistent data
capable for identifying defects. In this research, I am investigating the cause of having an
artifacts in the point cloud data and studying its causes. In order to do so many components
need to be added to reach to the results. First, by learning how to program the robot using
a Teach Pendant, and became familiar with the process of scanning using the 3D scanner.
Also becoming familiar with the field and gather the necessary knowledge. The parameters
that were considered in designing the path were the standoff distance and the view angle.
The change in these parameters effects the distance between the two neighboring paths. The
lower the standoff distance, the smaller is the width of the laser beam. Also, when the view
angle is smaller and the scanner is perpendicular, the smaller the laser beam is. Due to
the complexity of the scanned object in the initial experiments, ideal point cloud were not
achieved. It wasn’t clear what the factors that impacted the scan quality were. Therefore, I
concluded that there is a need to study scan parameters in order to know the factors that
affect the scan quality that prevent having noise, outliers, holes, and low sampling density
of point clouds. This also showed that in order to get the right parameters there is a need

10
to select a test object that does not contribute to the noise in the scan and we can easily
distinguish the effect of the parameters by using a designed test bed. For doing so a test
bed that allow to hold some parameters constant while changing others to understand the
effect of individual parameter was designed. The selection of the test bed is very important
in characterizing the impact. Failure to design and select the right test bed will result in a
misleading information about the impact of the parameter on the scanning quality. However,
although in the optimal parameters were selected in the performed scan we found out the
resulting point cloud wasn’t clean as well and there are many noise, and outliers. This
prevent the use of the point cloud as gathered for digital additive remanufactuing and lead
us to the second phase of exploring the different phases that the point cloud go through in the
remanufactuing process that adds up to the total error. Finally, the need for optimizing the
parameter is important to get the optimal point cloud; therefore it is important to use some
optimization and machine learning tools to predict the right parameters. A study was made
to study the accuracy of the prediction tool in finding the right parameters based on the
results of an experiment made on CT-scanner; doing so will generate the knowledge needed
to automate the system. These activities led to a greater understanding on how to design
a trajectory and scan a part in the most optimized and efficient way. The robot that was
used is FANUC S-430 IW, and the scanner is Creaform MetraSCAN-R. This contribution is
significant because it is expected to automate the use of laser line scanners and make it more
consistent, reliable, and efficient as a quality monitoring tool for condition assessment in
the manufacturing and remanufacturing inspection operation. Thus, it eliminated variation
caused by manual scans.
1.1.6 Research Challenges
Currently there are two workspaces: the robot workspace and the C-track workspace.
The robot workspace is used to move the robot and record the location of the end effector
while moving. The C-track workspace is the dimensional information of the scanned object.
Deshmukh et al. [33] created a model that made it possible to determine the position and

11
orientation of a robot arm, laser scanner, laser beam, and component with respect to the
robot workspace. The points that are collected are stored in the VX element on a different
workspace; one of the challenges is finding the transformation matrix that connects the C-
track workspace to the robot workspaces. Understanding this relationship and the effect
of moving the C-track is important as it will affect the way the experiment is conducted.
The relationship is also important in identifying points to scan in the inspection process and
knowing what point the scanner is pointing at on the C-track while moving in the robot
workspace. After finding the relation and its effect, the experiment was made to validate
the model. Deshmukh et al. [33] worked on a model that integrates three components in
the automated laser line scanner as this is necessary to know in automating the system; the
three components are the robot, the laser scanner and the component surface. They created
the fundamental kinematic models required for advanced automated scan path planning and
generated the forward and inverse kinematics models. The model created was the first used
for this application and had some assumptions in the modeling of the kinematics equations.
This made it challenging to use the model as the results of using it are not known. One of
the challenges is how to define point cloud quality.There are four parameters that define the
quality of point cloud that were introduced by [34, 35]: density, completeness, noise, and
accuracy. Boehler et al. [32] measured the quality by the deviation of a single point from
the object’s surface. However, the deviation of a single point is not the right approach to
use as there are variations that prevent us from getting the exact point each time a scanning
is performed, as mentioned by the same researcher due to some variability in the rate the
scanner capture and the moving speed. In this research, I defined the quality as the density,
completeness, and noise of the gathered point cloud. Since selecting the right test object
affects the ability of the scanner to scan and produce a quality point cloud, part of it is
the lack of knowledge on the effect of the different parameters on the scan quality, and this
makes it challenging to select the right test object for the experiment. Not finding the right
test object will result in misleading information that will prevent us from knowing the effect

12
of the parameters.
1.1.7 Research Objectives
The research objectives are understanding the effect of: view angle, standoff distance,
scanning speed, and resolution setting on the scan quality by conducting a point cloud
measurement experiments with systematically varied scan parameters. This experiment will
help defining the effect of different parameters on the scan quality. Previous researches
did not address the effect of speed, view angle, standoff distance, and resolution and the
interaction between them in the scan quality; these are important in designing the automated
system. Understanding the effect of the parameter will be a foundation for designing the
automated scan system that will help achieve a faster inspection time that suite the industry.
This research is expected to model the location of a point on the surface in an attempt to
predict the measured point cloud, to model of relationship between the C-track workspace
and the robot workspace, to characterize the impact of point cloud measurement parameters
on the scan quality, and to verify the points prediction by feeding the location of the point to
be collected by the scanner. By accomplishing all three objectives linking the robot and the
scanner workspaces, predicting the location of the laser beam on the point being scanned,
designing the experiment with a systematically varied scan parameters, understanding the
error contribution factors from all the activities in the remanufactuing application, and the
possibility to optimize and predict the parameters of the scanner to achieved the best results
will addresses the research gaps in 3D scanning as an inspection tool and study the effect
of the scanning parameters on the scan quality. These steps will make it possible to have
an automated system capable of having a consistence scans that can be used as basis for
inspection for many applications.
1.2 LITERATURE REVIEW
This review covers the relevant literature in the area of the research in ten different
sections: free-form surface inspection methods; computer aided inspection planning; point
cloud quality for contact and non-contact inspection; 3D scanning applications; strategies

13
for improving the point cloud; point cloud analysis; factors that affect scanning quality in
other research papers; robot kinematics; 3D scanning parameters; and manufacturing digital
thread and the point cloud smoothing.
1.2.1 Free-form Surfaces Inspection Methods
Advances in CAD/CAM have given manufacturers the ability to make complex and
curved surfaces. With the demand for ergonomically designed parts that have multiple
features and other organic shapes, traditional inspection methods may not be the right
tool to use. The reason is that the surface being created from curves does not have a
specific feature or shape. 3D laser line scanners are ideal for inspecting a free-form surface
[14]. Free-form surfaces exist in many forms and fields around us from manufacturing and
designing of molds and dyes and to the first clay models of products such as a car body.
All CAD software has the ability to draw a free-form surface; this is important because it
gives the ability to generate dimensional information and compares it with the inspection
data. With the ability to make and machine a free-form surface, the demand for inspection
arises. Inspection techniques for free-form surfaces are not as mature as they are related
to products with regular features, like plane or cube. Future research on free-form surface
inspection is predicted to focus on the development of techniques that give better accuracy
and efficiency and reduce cost [13].
1.2.2 Computer Aided Inspection PlanningPast Technology
Research prior to 1995 showed the focus was on two and a half dimensional features,
and the goal of the system for Computer Aided Inspection (CAIP) was tolerance-driven or
geometry-based system driven [36]. The tolerance-driven CAIP system focuses on features
that have specific tolerance requirements. ElMaraghy et al. [37] developed one of the earliest
CAIP systems. The system depends on a knowledge-based approach in generating inspection
tasks. The system was developed using purpose logic programming language and uses a
feature oriented approach in modeling inspection. In designing the system, they considered
the characteristics of the CMMs, the geometry of the object being inspected and the function

14
of the object in designing the system. Most of the research at that time focused on developing
conceptual level CAIP systems for CMMs. These systems require inspection operator input
for feeding the system the important inspection features to look for or tolerances that need
to be checked. Geometry-based CAIP system focuses on planning how to obtain a complete
geometric description of an object using the inspection data. Inspection of part surfaces is
made automatically using a tactile sensor. The tactile sensor collects points on the part
surface; then the measured data are aligned with the CAD design data model, and the error
is calculated [38]. The system usually ignores tolerance information and focus is on the
matching geometry between the designed shape and the inspected object. Geometry-based
CAIP systems are not as widely used as tolerance-driven CAIP systems. Furthermore,
geometry-based CAIP systems tend to acquire more data points and thus require more
time; this caused the technology to become un-popular and made the industry search for
an alternative [36]. The alternative way had to be more efficient to gather a large number
of points in a short period of time such as 3D laser line scanners if they can be efficiently
implemented [36].
Recent TechnologyIn the past 20 years, researchers have started to look for computer-aided inspection
planning system with one or more modules. These include inspection feature selecting and
sequencing, measuring/sampling point’s selection and optimization, collision-free path plan-
ning and generation, and inspection execution [36]. On-Machine Inspection (OMI) has been
widely preferred to directly inspecting in manufacturing and quality control. This feature
is vital for an automated production system that identifies the error earlier in the machine
and saves time for. OMI processes integrate design, machining, and inspection aspects of
manufacturing and allow the product to be inspected and accepted on the machine while be-
ing made [36]. Inspection-related information, such as dimensions, tolerances and geometric
items, are becoming available for use and can be retrieved from Standard for the Exchange
of Product (STEP) model data and used in creating inspection process plans [36]. The
technology used in this research is stand-alone and not installed on-machine; this will allow

15
the technology to be used to inspect a variety of products. Non-contact devices, such as
3D optical scanners, are gradually maturing for use in inspection. This kind of research has
caused non-CMM measurement methods to become a major research trend [6]. Automated
planning for free-form surface inspection for CMM and laser-scanning is becoming important
as it reduces human involvement in order to make the process more time efficient and error
free [13].
Inspection Methods LimitationsLaser line scanners can be used as a substitute for tactile probes for CMMs. The dif-
ference is that it is not touching the surface, but only the laser line is projected on the surface;
it also has the ability to collect a larger number of data points compared to tactile CMMs,
and has the ability to measure larger objects than CMMs. There are many types of CMMs,
some with mechanical, optical, laser, or white light, and they are all used for inspection.
Although both types are used as inspection tools and to generate dimensional information,
procedures for evaluation differ between the CMM and laser line scanner. Therefore, error
specifications with the scanners are difficult because there are many factors that influence
scan quality such as surface quality, surface orientation, and scan depth. Nevertheless, there
are benefits for using each type of inspection methods. Inspection methods can be contact
and non-contact or a combination of both [13]. Contact sensors require touching the surface
of the object in order to register the coordinates of the point. It has to take the measurements
multiple times in different locations to have a data cloud of points that gives a dimensional
representation. As mentioned previously, the CMM is an example. Li and Gu [13] mentioned
that the visibility problem for a scanning system is similar to the accessibility problem for
CMM; they both require planning and optimizing of the scan path. When using the CAD
model, the important point to be inspected is generated based on the optimized path. Non-
contact measurement systems are systems that gather points on the surface of the part by
directing pulses of light and calculating the time it takes the pulse to return back to the
sensor. These 3D scanners are categorized in terms of use and accuracy into two categories:
Ranging/Terrestrial scanners and Triangulation/Shape scanners [27]. 3D scanners are used

16
Figure 1.3: Bulk/Terrestrial scanners [2]
for Modeling From Reality (MFR) as you are gathering dimensional coordinates from an ex-
isting product or a clay model. Li and Gu [13] suggested that many non-contact inspections,
human involvement is still required, which is a time-consuming technique. It is expected to
enhance the accuracy of a non-contact measure approach by using higher accuracy sensors
and optimizing the measurement parameter. 3D laser line scanners are important in quality
control as they have the ability to scan from 50-100 times faster than CMMs [13]. There
are two types of laser scanners; the first is ranging scanners - Bulk/Terrestrial scanners.
This type of scanner is used for scanning large objects with low procession. It is used in
many fields ranging from surveying in architecture, engineering, and construction (AEC)
to preservation of cultural heritage [39, 40, 25]. Terrestrial scanners work by placing the
scanner at the distance recommended by the manufacturer from the surface it is intended
to scan. Pulses are released, and their time traveled to the object and back to the scanner
is measured; the distances are calculated based on the time of travel, and a data point is
recorded see Figure 1.3 [27].
Due to their being no uniform method for measuring the accuracy of terrestrial laser
scanners and testing facilities until recently. The analysis works through different face poses

17
Figure 1.4: Triangulation scanners or shape scanners attached to a robot
using different scanners, compares the different scans together, and then ranks them by the
accuracy and repeatability of the scanner [41]. In addition, the results and the technology are
not the same as with dimensional laser scanners as terrestrial scanners have measurements
errors of magnitude greater than shape scanners. Furthermore, manuals and pamphlets
about product specifications should not be trusted; care given to the scanner and the the
setup and calibration of single setup varies between one product to another and one scan to
another [32]. The second type is triangulation scanners, such as shape scanners. This type
of scanner is used for scanning with high precision. Unlike the first scanner, this scanner
moves along the object it is going to scan, and a laser beam is projected on the surface of
the part being inspected. A camera predicts the distance from the lens to the surface based
on the shape of the laser beam, see Figure 1.4. This kind of scanner comes in single camera
solution - double camera solution [27]
Unfortunately, there haven’t been many complete studies on the triangulation scanner
as there have been for ranging scanners. There have been multiple studies on small aspects
in the scanning process. such as digitizing errors [4]; cleaning point cloud [5], effect of
standoff distance and view angle [4, 6]; and generating a path [10]. However, there has not
been a complete study of all the necessary parameters to be considered to have an accurate
consistent point cloud and make the system able to be automated while mounted to a robot.

18
1.2.3 Point Cloud Quality for Contact and Non-Contact Inspection
The advantage of using a 3D scanner over a touch trigger probe is the ability to
measure contactless and capture a large number of points in a short period of time. Touch
trigger probes capture one data point per touch. In order for a touch trigger probe to capture
the same number of data points that a 3D scanner collects it would take a long time and thus
makes the technology infeasible. On the other hand, the disadvantage of laser line scanning
at the moment is its limited accuracy and the strong influence of the surface quality on the
accuracy. As it is difficult to inspect shiny surfaces such as machine steel and aluminum
using a 3D laser line scanner [4]. Laser line scanners are less accurate than conventional
touch-trigger probes like CMMs. While there are standardized procedures to evaluate the
accuracy of touch-probe sensors, these are not appropriate for use with 3D scanners because
error specification 3D scanners are difficult due to influencing factors such as surface quality,
surface orientation, and scan depth that are not relevant in CMMs [6]. There is a need
for standardized procedures to evaluate 3D scanner accuracy due to uncertainties in the 3D
scanning such as surface quality, surface orientation and scan depth [6]. While it is known
that the best view angle for scanning is when the scanner is normal to the surface, this is not
always possible due to visibility problems [1]. The visibility problem for scanning systems is
similar to the accessibility problem for CMMs [13].
1.2.4 3D Scanning Applications
There is a global demand for a freeform and ergonomic product that comes in complex
shapes, but they are hard to design and require a long time to do so. Manufacturers are
using reverse engineering techniques in product design to save time and shorten time for
development by scanning existing shapes and modifying them [42]. They are also being
used for remanufacturing purposes in which commercial laser scanners have been mounted
on robots or CMMs and used for reverse engineering and re-manufacturing applications
[4, 43, 44, 12]. It also has been used to reproduce existing components [23]. Manufacturers

19
have also been using 3D scanners to design molds for use by scanning the clay model of
their first product, collecting the dimensional information and feeding it to CAD software
in the design process. In this work the applications will use the technology as an inspection
tool to gather the dimensional information for manufacturing and remanufacturing facility
by collecting all the necessary points from the surface.
1.2.5 Strategies for Improving Point Cloud
There are two strategies for improving point cloud. Researchers have been addressing
this in two ways. The first strategy is by working on the gathered point cloud and processing
it to remove errors. The second strategy is by working on the scan parameters, and investi-
gating the different parameters in an effort to understand their effects on the quality of the
point cloud.
Point Cloud ProcessingCleaning of the point cloud is a necessity at this time. When manually scanning
sometimes points are collected by mistake. These points can be the fixture of the part, a
hand movement in the background, or a loose wire. Point cloud processing works after the
point cloud is gathered to identify these outliers based on predefined boundaries and to clean
the data. Researchers have been working on point cloud processing for many reasons.

20
Figure 1.5: (a) picture of the part; (b) raw data collected by the scanner; (c) combined threemethod used in the literature; (d) the proposed method [3]
Wang and Feng [3] suggested that the collected point cloud is usually full of mea-
surement outliers. They classified the outliers as sparse outliers, or isolated or non-isolated
outlier clusters. They worked on developing a tool that works on all kinds of outliers. They
suggested that the non-isolated outlier clusters are the most challenging to detect and cur-
rent clustering methods will mix the non-isolated cluster with surface points, which will
cause a noise in the gathered point cloud. They studied all the existing tools such as plane
fitting criterion, miniball criterion, and nearest-neighbor reciprocity criterion [5], and they
developed a tool that works on the data gathered by using the majority voting principle
to make an improvement to the current outlier detection techniques see Figure 1.5. They
suggested that the outliers are known to be associated with the scan path and it is possible
to identify the outliers with redundant scans by changing the scan path.
Parameter InvestigationThis strategy includes both parameter investigations that are related to the setup
of the scan such as the view angel, standoff distance, as well as point cloud path planning.

21
Some researchers have studied the effect of in-plane and out-of-plane angles that have an
important effect on the measured standard deviations because the measurement noise is
mainly concentrated in the depth direction of the scanner. They have found that proper
orientation while scanning can reduce outlier extensity and that outliers are dependent on
the orientation of the scanner [6, 20].
Lee and Park (2000) [10] made an effort to automate the scanning process first by
generating a path that considers all the accessible directions while considering the constraint
in laser scanning operations. They made sure to fulfill the view angle, depth of view, in
relation to the part, avoiding collision with the probe as well. They then calculated the
number of scans and the most desired direction for each scan and generated the scan path that
gives the least scan time. They suggested that the algorithm they used will enable automatic
inspection by building a consistent and efficient scan plan. However, they concluded that
the accuracy and efficiency of algorithms need to be further improved. Furthermore, the
algorithm they used didn’t take into consideration the shape of the part and didn’t maintain
the curvature of the part and distance while scanning.
Feng et al. [4] studied the effect of standoff distance and view angle on scan quality.
In the experiment they mounted a commercial laser line scanner to a CMM robot. The
experimental results showed that the random errors of the scan data are close to the nominal
values provided by the manufacturers. Moreover, they found that there is a relationship
between scan depth (standoff distance) and the projected angle (view angle) see Figure 1.6
[4]. However, they did not study the effect of speed on the scan quality, but this is an
important factor to consider for the use of the technology as an inspection tool.

22
Figure 1.6: The systematic error of the scanned data in relation to the view angle andstandoff distance [4].
Researchers have studied the digitizing errors of 3D laser scanners, and have suggested
that the measurement is affected by object geometry and its position in the work window[4]
. Other researchers have investigated the influence of surface reflectance, wetness, and color
selection on the measurement of the terrestrial laser scanners and found that there is an effect
from surface wetness, color selection, and material scanned on the quality of the point cloud
measured, which has an effect on scan quality [45]. The accuracy information provided for
the laser scanner by the manufacturers is generated for a controlled environment and thus
cannot be generalized for the manufacturing environment [18]. Thus, there is a need to
investigate the accuracy and test the equipment to generate general knowledge on the best
use for the technology in order to mount it to a robot and automate it.
Although different parameters have been investigated in the literature by many re-
searchers, there has not been a complete study on all the necessary parameters to be consid-

23
ered as in the automated scanning system. The resolution setting and the speed of moving
the robotic arm are very important factors in automating the inspection process. If the
speed of the robot is causing noise to the gathered data cloud, understanding the speed and
the resolution effects are very important. Not knowing the effects of all the parameters will
make optimizing the measurement and achieving the best path plan impossible.
1.2.6 Point Cloud Analysis
Most 3D scanning technology is improving steadily. However, most available scanning
techniques still produce artifacts, such as noise, holes, outliers, or ghost geometry see Figure
1.7. Post processing is important for creating 3D model. The point cloud gathered from
the available scanning techniques showed a demand for a scan cleaning tool to work on
the acquired data points in order to create a digital 3D surface data. Weyrich et al. [5]
developed tools that work directly on the acquired point cloud to clean and improve it.
They also suggested that post processing of point cloud should be performed before surface
reconstruction could be made (they called their tool a point cloud cleaning toolbox). The
post processing of a 3D scan repair in point cloud is done by erasing irrelevant points,
removing outliers, Smoothing MLS, and doing point relaxation, MLS spray scanning, and
automatic hole fitting. It is challenging to scan a part and compare it to a point cloud as
shown in [32]. Points collected with a contact system were faster and easier to deal with in
processing due to the homogeneity of the points collected and the amount of points [1].
There are two methods of alignment between design and measurement data. The
first is automatic, where best fit and features are based on the alignment of the object. The
second is semi-automatic, where users need to do an initial alignment by manually arranging
the design model and closely measuring the data. Then, the system will do the remainder of
the registration operation. There are multiple commercial packages used for inspection and
comparison of contact and noncontact measurement. Most can handle free form surfaces;
however, user interference is often required. These packages have the function of inspection
and comparison. Some of the popular brand names for packages used for inspection are:

24
Figure 1.7: Scanning errors "Typical artifacts of raw scanner data. Top Row: Holes due tosensor restrictions, noise, outliers. Bottom Row: Low sampling density due to gracing sensorviews, low sampling density at delicate surface details, and holes due to critical reflectanceproperties." [5]
Polyworks, Rapid form, Geometric, Imageware, Metrics, and Spatial Analyzer [13].
1.2.7 Factors That Affect Scanning Quality in Previous Studies
The literature has covered factors that affect scan quality. Some are related to a
free form surface while others are irrelevant to the technology used in this study. The best
orientation is when the laser beam is normal to the surface. However, despite the effect
of the change in the angle, this is not always possible as there will be some accessibility
problem that will prevent achieving a normal angle [1]. Boehler et al. [32] investigated the
accuracy of different terrestrial 3D scanners by having different test targets and comparing
the quality of the measurement obtained. They studied plane surfaces with different re-
flectivity at different ranges and noise caused by the range or range effect on scan quality.
The parameters they looked at were angular accuracy (view angle effect), range accuracy
(standoff distance), resolution, edge effect, surface reflectivity (lighting), and environmental
conditions (temperature). They designed their experiment by selecting a box and a sphere.
The box studied the range accuracy, resolution, and surface reflectivity. The sphere to study

25
the angular accuracy since the way the scanner works is by changing the lens angle and
the mirror in a fixed increment and collect points; when the angle increment is large, fewer
details and resolution will represent the sphere. The experiment was done in a controlled
temperature room at about 20 degrees C. However, the technology they used is different
from the one used in this study as the application it is used for since in this technology the
scanner is fixed. However, the similarity will be in the surface reflectivity, and the speed of
movement if it is faster than the scanner capturing capabilities. Martins et al. [46] worked
on a model to prove the effectiveness of automated laser line scanners and their ability to
substitute manual scanning. They concluded that the technology can be used. However, it
requires optimizing the number of viewpoints and the path to be taken in order to get more
reduction in scanning costs and improve the performance of the system [46]. Manorathna et
al. [18] showed that the angle of steepness affects the number of points collected, and thus
the angle hinders the scanner ability to collect data points. In the experiment they compared
the number of ideal laser lines that can capture around 1280 laser points when normal to the
surface versus when it is on an angle. Li and Gu [13] suggested that the accuracy of the non-
contact measurement approach is expected to be enhanced by optimizing the measurement
parameters. Optimizing the measurement parameters comes after knowing the relationship
that the parameters have on the scan quality. Without knowing this, it is difficult to get
meaningful information. This led me to the importance of studying scanning parameters
in order to know the relationship and define it. With all the development in the accuracy
of these instruments, the most available scanning techniques cause severe scanning artifacts
such as noise and errors in the scans that are not present in the actual model [5]. Thus,
there is a need to study 3D shape scanner techniques. In recent years, some researchers have
proposed to developing automated planning for visual or laser inspections [13]. However, in
order to successfully develop automated planning for visual or laser inspections that does
not produce artifacts or missing points and holes, there is a need to understand what causes
the artifacts or outliers to avoid them. By experimentally testing the scan parameter and

26
its effect on the scan quality, a better automated system can be developed. There is a need
for standardized procedures to evaluate 3D scanners accuracy due to uncertainties in the 3D
scanning such as surface quality, surface orientation and scan depth [6]. In order to achieve
a standardized procedure, there is a need to accomplish four tasks that will make it possible.
First is linking the workspace of the robot to the scanner workspace. This will let me know
the location of the robot on the surface of the part being inspected and will collect the right
point cloud. The second task is designing an experiment with a systematically varied scan
parameters to study the effect of the parameters on the quality of collecting point clouds.
Third, is studying the effect of the parameters and the post procession application on the
point cloud in the remanufacturing digital thread. Finally, is by studying the alternative for
quality perdition by selecting the right parameters for the CT-Scanning application, which
can be generalize for other scanning technology. In the experiment I studied factors that
hindered me from getting a consistent and efficient scan plan to be able to get quality scans
with the least amount of noise and outliers in the scan and the least amount of post pro-
cessing effort to make a decision about the condition of the part. Thus, the interactions
between the different scan parameters are important, and from the literature done, there has
not been one complete study that provides the necessary knowledge to generate a scan path.
Moreover, past studies do not provide quantitative details that can be used as constraints
for future scan trajectory, but they were based on the best results for an individual setup.
Because speed is an important factor in the manufacturing environment, Li and Gu, [13]
suggested that the increasing of speed and using of higher accuracy sensors and optimizing
measurement parameters to use the technology for inspection purposes should be fully ex-
plored, in the experiment I am going to test the effect of standoff distance, view angle, speed,
and resolution and their effects on scan quality. While the investigation of the accuracy of
different kinds of surveying scanners has been done, there is still need for results that can
be generalized to be used as input for the industry for inspection purposes in order to get
the best point cloud quality that is consistent and clear.

27
1.2.8 Robot Kinematics
Commercial laser line scanners can be attached to a robot or coordinate measur-
ing machines (CMMs) for dimensional inspection, reverse engineering [21, 22], and re-
manufacturing [23]. Laser line scanners have an advantage due to their ability to gather
many points in a short time with high speed, and high resolution, and without contact sens-
ing [24]. This advantage has also attracted non-manufacturing fields due to its ability to
scan without contact. 3D scanners are designed for different applications. There are scanners
that are small and easy to transport and have the ability to run on a battery while others
are bulky and hard to move. Other features are related to the ability of the scanner such as
resolution, speed, field of view, and range limits. Also, scanners are not the same in their
ability to scan when there is interfering radiation [27]. The Creaform MetraScan-R scanner
is one that was be used for the work. It is a triangulation scanner that can scan medium to
large objects such as a car hood or a door, and it provides the ability to move around the
object covering the surface from all angles. Although laser line scanners can obtain many
data points in a short period, there are challenges that hinder its use as an inspection tool
in manufacturing applications. Currently the process is labor intensive. There is a need for
development of automated laser line scanning system models to avoid the trial and error
caused by manual scanning [12]. Since there is a lack of knowledge on the effect of the dif-
ferent parameters on scan quality, the outcomes of automating the process are not perfectly
predictable. When scanning manually, it is difficult to keep track of all the details about the
standoff distance and the view angle due to fatigue that occurs while holding the scanner and
the inability to manually control it. Automating the process will make it possible to scan
a specific part while keeping track of scanning parameters such as view angle and standoff
distance by integrating it into the scan trajectory. This will result in consistently getting a
complete point cloud that represents the surface each time. Martins et al. [46] worked on a
model to prove the effectiveness of automated laser line scanners and its ability to substitute
manual scanning. They concluded that the technology can be used. However, it requires

28
optimizing the number of viewpoints and the scan path trajectory in order to get more re-
duction in scanning costs and improve the performance of the system [46]. Previous research
has developed algorithms that determine robot poses in relation to component surface [47],
and the relationship between a six degree of freedom robot and laser line scanner with and
without an external tracking device [17, 48, 49]. The length of the laser beam is considered
as the stand-off distance between the component surface and the scanner; it is assumed to be
constant [12] and in our experiment was set at 300 mm. Larsson and Kjellander [19] created
an automated system with a turntable that captures the component surfaces automatically
in the form of point cloud datasets by having a preprogrammed path with pre-determined
scan parameters.
There have been few efforts focused on the points collected on the surface of an object
in addition to the position and orientation of the robot end effector [33]. Deshmukh et al. [33]
linked the automated laser line scanning system with the component surface and established
the forward and inverse kinematic models that are required for advanced automated scan
path planning. What is missing is the relationship between the component surface and the
data gathered from the C-track and the relationship of the C-track to the data gathered.
The location of an external tracker such as the C-Track is a less explored area that is
important to fully discover and understand in order to create a trajectory that fully covers
the points in the inspection process and create a trajectory that saves time while fulfilling
the purpose. Thus, knowing the kinematic relationship between the robot workspace and
the location of the laser beam and the relationship between the robot workspace and the
C-track workspace is important.
In our system the scanner collects data points by moving the robot from one location
to another. The location of the scanner is registered by the C-Track in the data collection
process. Knowing the kinematics of the robot and the location of the laser beam is important
as it will link the two workspaces, the C-track and the robot.

29
1.2.9 3D scanning parameters
Previous studies have focused on some parameters that affect the cleanliness of the
collected point cloud from the noise. Based on the nature of these parameters, we can divide
them into two general categories: hard parameters and soft parameters. Hard parameters,
such as view angle, standoff distance, and speed, would require a physical change while soft
parameters, such as lighting, color, and resolution, require changes in the parameters that
have no movement or angle or distance or speed change from the object being scanned. In
this research, the main focus will be on hard parameters and only one soft parameter will
be addressed, resolution.
Hard parameters have been the focus of several studies. Gistel et al. [6] along with
Wang et al. [20] and Gerbino et al. [50] studied the influence of changing the view angle on
the laser scanner 3D point cloud quality. Based on their observations, using different view
angles resulted in different standard deviation of the collected points and, as a result, different
scanning qualities [6, 20, 50]. In addition, Wang et al. [20] found that using an appropriate
view angle can particularly reduce the outlier’s intensity and improve the scanning quality
[20].
Based on the findings of Martinez et al. [1], the best orientation is when the laser
beam is normal to the surface. However, despite the effect of the change in the angle, this is
not always possible as there will be some accessibility problems that will prevent having a
normal angle. This was confirmed by a similar study done by Manorathna et al. [18]. They
compared the number of points captured by the scanner when it is normal to the surface
versus when it is on an angle. Based on their findings, best results are achieved when the
laser beam is normal to the surface. Both Feng et al. [4] and Van et al. [6] studied the effect
of the view angle in conjunction with the standoff distance on the quality of the collected
point cloud. They did several experiments with different standoff distances and view angles
as can be seen in Figure 1.8, and based on the results, both parameters had a significant
effect on the scanning quality.

30
Figure 1.8: In plane and out of plane view angle [6].
On the other hand, some researchers have focused on the soft parameters. Blanco
et al. [51] showed that different light sources have different impacts on the quality of a
digitized surface [51]. This is particularly important when scanning a reflective surface such
as machined aluminum. Rico et al. [52] studied another soft parameter named surface
roughness. They introduced a measure called flatness value which is an index for the surface
roughness. Their findings showed that using different flatness values results in changing the
scanning quality [52].
Other researchers have investigated the effect of a combination of hard and soft pa-
rameters on the scanning quality. Vukavsinovic et al. [53] studied the influence of the view
angle, distance, object color, and scanning resolution on the scanning quality. They sug-
gested a set of guidelines to be followed in order to achieve a better point cloud quality.
Based on these guidelines, it is important to maintain a uniform color and the right thick-
ness on the whole surface when coating. In addition, the object being scanned should be as
close as possible to the measuring sensor. Finally, the trajectory should follow the object
geometry and maintain the same stand off distance to the object being scanned in order to
reduce the noise generated. Bohler et al. [32] investigated the accuracy of different terrestrial

31
3D scanners by having different test targets and comparing the quality of the measurement
obtained [32]. They studied plane surfaces with different reflectivities at different ranges
and the noise caused by the range or range effect on the scanning quality. They examined
several parameters including angular accuracy (view angle effect), range accuracy (standoff
distance), resolution, edge effect, surface reflectivity (lighting), and environmental conditions
(temperature). They designed their experiment by selecting a box and a sphere. The box
was used to study the range accuracy, resolution, and surface reflectivity.
Moreover, some studies have focused on the general aspect of the feasibility of using 3D
laser scanners as inspection tools and their efficiency. Martins et al. [46] worked on a model to
prove the effectiveness of automated laser line scanners and their ability to substitute manual
scanning. Based on their conclusion, this technology is applicable. However, it requires
optimizing the number of viewpoints and paths to be taken in order to get more reduction
in scanning costs and improve the performance of the system [46]. Li et al. (2004) suggested
that the accuracy of the non-contact measurement approach is expected to be enhanced by
optimizing the measurement parameters. Optimizing the measurement parameters requires
knowing their effects on the scanning quality [13]. Without knowing these effects, it is
difficult to obtain meaningful information. With all the development in the accuracy of the
instruments, most available scanning techniques cause severe noise and errors in the scans
that are not present in the actual model [5]. Although previous studies have investigated the
effect of several parameters on the scanning quality as indicated in Table 1.1 at the end of the
Introduction chapter on page 50, they did not cover two particularly important parameters,
the scanning speed and resolution [53]. These two parameters should be further investigated
before using the 3D scanning technology as an efficient inspection tool in the industry.
1.2.10 Manufacturing Digital Thread And Point Cloud Smoothing
Additive manufacturing is flexible with workpiece geometry and can be used when
many other manufacturing methods cannot be implemented [60]. It has been shown that
material deposition along with the complimentary operations can satisfactorily provide the

32
flexibility and agility needed to remanufacture high value EoL cores to original equipment
manufacturer specifications [61, 62, 63, 64, 65, 66]. However, there are challenges preventing
the technology from being the mainstream, such as production rate and cost of production
[64]. This is because the deposition rate is slow, so making a single part requires hours or days
depending on the size of the object. Thus, remanufacturing using additive manufacturing
should be optimized to remanufacture a product that has higher imbedded energy as the
time spent in longer than when using traditional manufacturing methods. Rickli et. al
[9] made some progress towards describing the framework for salvaging failed builds and
remanufacturing via additive manufacturing; however, significant theoretical and practical
challenges still exist. In order to proceed with additive remanufacturing processes, digital
translation of the physical shape needs to be captured [63]. This allows the realization of the
defect and generates the appropriate corrective additive manufacturing procedure. While
laser line scanners have been used more often for inspection and reverse engineering in
industry [66], it is also being used for remanufacturing purposes where commercial scanners
are mounted on a robot or CMM and used for reverse engineering and remanufacturing
applications [4]. Because speed is an important factor in the manufacturing environment,
Li et al [13] suggested the increment of speed, sensor accuracy, and measurement parameter
optimization should be fully explored for technology implementation and to understand the
effect that the speed has on the quality of the collected point cloud. Digital translation
of a part is captured by a point cloud output from 3D scanning the surface of the object.
The points are collected in Cartesian coordinate form and then converted to a mesh format.
However, raw data from optical devices such as 3D laser scanner contain noise. Studying
the effect of this noise and how it propagates within additive remanufacturing is essential to
compensate for the error in meshing and slicing operations. Moreover, this will only reduce
the errors to a certain extent and will give a better point cloud that have fewer errors.
Smoothing a point cloud can be done by taking the original point cloud and applying the
nearest neighbor algorithm to correct the noise in the gathered point cloud, though other

33
smoothing algorithms do exist. Rosli et. al [67] created a model that could adapt the density
of the model based on bootstrap error estimation to avoid over smoothing using Bilateral
Filtering. However, point cloud smoothing can eliminate some important features from the
point cloud such as sharp edges. This is a common limitation for the point smoothing
because it is based on averaging of neighboring points. With the additive remanufacturing
model presented in this paper, it is essential that smoothing preserve the features of an end-
of-use part that require reprocessing. Bi and Wang [68] summarize a general point cloud
processing procedure that features six key steps. First, the point cloud must be filtered of
noise and unwanted surfaces. Next, the point cloud is registered with a model to locate
similar and dissimilar dimensions. Third, surfaces not fully captured by the scanner and/or
lost in the noise filtering are reconstructed. Fourth, the point cloud is smoothed. Fifth, a
feature detection algorithm is used to compare the scanned point cloud with model. Last,
a data comparison tool is used to compare the model with the gathered data. While Bi
and Wang [68] provide a useful strategy to process point clouds, variation still exists in each
of their six steps, depending on the application. For example, Piya et al [69] demonstrate
how their prominent cross-section (PCS) method serves to repair damaged turbine blades.
The PCS method is an adjusted point cloud processing approach that groups the final four
steps of Bi and Wang’s [68] workflow into one algorithm. Although Piya et al [69] show a
successfully rebuilt turbine blade, their method is limited to 2.5-D geometries. As mentioned
in the introduction, multiple researchers have developed smoothing strategies that attempt to
retain model integrity [70, 71]. Their strategies are tested on damage-free models; however,
applications with damaged models could contribute to determining the effects smoothing
has on the damaged regions. Brown et al. [60] investigated the nonsystematic translation
errors on the digital design and their root causes on the steps of additive manufacturing
by proposing feedback loops to ensure digital design integrity starting from tessellation all
the way to toolpath generation. Brown et al. [60] focused on CAD to mesh in the additive
manufacturing sequence. This literature is relevant as it focuses on the digital design integrity

34
for additive manufacturing, and since the technology that is used in this remanufacturing
work are additive manufacturing the paper offers an additional aspect that is important
regarding digital design data integrity. This paper attempts to propose a model for the effect
of the point cloud data of each of the five steps in the remanufacturing process. These steps
include scanning, smoothing, meshing, slicing, and material deposition. This paper covers
the changes in the point cloud collected by the 3D scanner from the collection phase to the
material deposition phase. As a result, it is critical to investigate the scanning process for
the collection of the point cloud and the smoothing of the point cloud up until a satisfactory
point cloud is achieved. The generated point cloud then can be used to proceed with the
following steps in the remanufacturing activity while ensuring that the errors generated in
these steps are determined to compensate for it in the following steps to achieve the desired
results.
1.3 APPROACH
There are multiple tasks that were addressed to answer the proposed research ques-
tion. This first task is linking the C-track workspace to the robot workspace and defining
the relationship between the two workspaces as this is important to plan for the trajectory
of the scanner and the point cloud reconstruction. The second task is to know the effect of
the different scanning parameters on the overall point cloud quality. Knowing this will make
it possible for future optimization of the parameters to be selected right in order to decrees
the noise in the point cloud made by the process of the scanning as it was shown in the
literature and the primary experiment it is very important to select the right parameter to
eliminate or reduce the noise in the point cloud. In this task, experiments were conducted
with systematical varied scan parameters. These parameters will be the view angle, standoff
distance, speed, and resolution. The goal of the research is to establish the knowledge of
the impact of measurement parameters on the scan comparing to the CAD model of the
test object being scanned. This will lead to a good understanding of scan parameter effects
on quality and inspection method performance that will allow for an automated inspection

35
system capable of capturing consistent, accurate, and clean point clouds. The third task was
to study the effect the point cloud on the remanufacturing digital thread. The parameters
of the 3D scanner can only be improved to a certain extent. The noises on the point cloud
can be generated due to many factor other than the parameters. Therefore, in order to use
the point collected form the 3D scanner for remanufacturing application. There is a need
to clean the point cloud. This task follow the point cloud life cycle for the remanufacturing
application and address all the processes that effect the point cloud such as the smoothing
and cleaning the point cloud, meshing, slicing, and the actual material deposition and de-
termine the sources of error and the extent of error from each step. The fourth task is to
study the applicability of the implementation of predictive model to optimize the parameters
of a CT-Scanner. As the parameter of the scanner need to be optimized in order to select
the right parameters to select and get the best scan quality. For this task experiments were
made with five parameters that are the voltage of the x-ray source, the current or the x-ray
source, the filterer installed on the x-ray source, and the integration time of the CT-Scanner.
The results were analyzed and the predictive model were found to be applicable.
1.3.1 Linkage of C-Track in the Kinematic Model
Automated Laser Line Scanning (ALLS) is used for inspection by collecting the point
cloud of the surface and storing it to a computer. The elements of an ALLS system are
a laser line scanner attached to a six degree of freedom FANUC S-430 IW robot and a
computer to collect the point cloud and make the comparison [33]. Creaform MetraScan-R
system contains a laser projector, lens, and image sensor. The reflection of the laser light
on the measured surface passes through the lens and is recorded via the image sensor. It
forms a triangle between the scanner and the object and the camera, see Figure 1.9, (i.e.
triangulation). The (x,y,z) of a point on a measured surface is determined from the coordinate
system of the laser projector, the coordinate system of the lens, and the coordinate system
of the image sensor.
The link between the robot workspace and the C-track workspace is not known. The

36
Figure 1.9: Point collection of general laser line scanners to be used as end effectors model[7]
scanner is running in the C-track workspace. The robot is running in the robot workspace.
The relationship between the two workspaces must be known in order to design a trajectory
that takes into consideration the dimensional information of the test object being inspected.
In the model made by Deshmukh et al. [33] all the equations were defined in relation to
the robot workspace including the component surface. However, the point on the surface
and acquired point cloud collected by the 3D scanner cannot be compared because the
relationship between the C-track (scanner) workspace and the robot workspace was not
found. In this task I will select a specific point to scan and gather the data from the scanner
in the C-track workspace, measure the location of the point in the robot workspace, and
derive the equation for the kinematic relationship between the two workspaces.
1.3.2 Prediction of the Location of the Laser Beam
Using equations by Deshmukh et al. [33], I validated the model by creating a test
board that has four points that are pre-selected. The location of the four points within the

37
Figure 1.10: Point location validation board
robot workspace are known. Then, using the inverse kinematics equation provided from her
model I derive the location of the robot end effector to have the laser beam exactly on the
center of the points A, B, C, and D see Figure 1.10. After getting the laser beam on the
point selected, the location of the point in the C-track workspace was be recorded for future
reference to define the transformation matrix between the two workspaces.
1.3.3 Systematical Varied Scan Parameter Experiment
The objective of this task is to understand the impact of point cloud measurement
parameters on scan quality. Collecting a large point cloud dataset with systematically var-
ied scan parameters is important in understanding the impact of parameters. Automated
point cloud measurement is critical to isolate all sources of variation that is caused by man-
ual scanning. The approach that will be used to obtain a sufficient database is physical
measurements using the automated point cloud measurement test bed in the engineering
technology lab with varied scan parameters. In doing this experiment, six tasks are to be
completed as the following sections listed below:
Understanding the Difference Between Vertical and Horizontal View AnglesPrevious researchers have studied the view angle for scanners that have only one laser
line [6]. In their test they studied the effect of vertical vs horizontal change in the view angle
see Figure 1.11 and they found that there is an effect on the noise by changing the angle
Figure 1.12.

38
Figure 1.11: In-plane and out-of-plane view angle image [6].
Figure 1.12: The effect of In-Plane vs Out-of-Plane angle image [6]

39
Figure 1.13: The used 3D scanner drawing from Creaform training materials
However, because there are two laser lines in the scanner used in my experiment, I
would like to study if the results from the previous studies are relevant to this experiment,
and thus whether the effect that the angle has on the scan quality for the vertical angle
is different than the horizontal angle or if it is irrelevant in our type of scanner. In order
to know if the results they received would be similar to what I would expect and to know
the characteristics of the scanner, I repeated the experiments they performed exactly and
compare the results for this reason and also to test the model used for comparing the point
cloud in my experiment.
Since the shape of the scanner is not the same as the scanner they used, I will define
the angle that is vertical from the scanner as the Out-of-Plane Angle. This angle is vertical
to the two cameras on the scanner around the x-axis see Figure 1.12. The other angle is
horizontal from the scanner as the In-Plane Angle around the y-axis. An experiment will
be conducted, and three different view angles will be made to understand the effect between
the vertical and horizontal angles. The three inputs parameters were 70 degree angle, 80
degree angle, and 90 degree angle. The previous study changed one factor at a time and
compared the effect by the number of data points gathered using each view angle. However,
I compared the results by running a simple one line trajectory to scan a flat surface. This
is an important step as the outputs from this step will be given to the next experiment,

40
Figure 1.14: The actual used 3D scanner from Creaform training materials
which will involve multiple parameters with multiple levels. Knowing the importance of the
orientation of the scanner is essential in order to generate the ideal trajectory to scan any
part in the future. With hand held scanner, the two cameras are always on top, but when it
is attached to the robot, the orientation is not being accounted for while moving. This test
will define the importance of keeping track of the orientation of the scanner while scanning.
Designing the Trajectory for the ScanIn generating the trajectory, I used what ElMaraghy and Yang [29] did. Based on
the CAD model of the test object selected, they decomposed the whole surface into different
patches based on the view angle and standoff distance and generated a linear zigzag path to
scan the patches. I created a tool with Matlab that generate the zigzag based on the dimen-
sion of the test object and the view angle and the standoff distance. The kinematic model
will be added into consideration to know the location of the point that I am collecting, as it
will contribute to the knowledge of standoff distance and view angle in designing the trajec-
tory. The trajectory will then be programmed to the robot software which is ROBOGUIDE.
The setting for the viewing and standoff distance will be added to the path in the program.
Each setting will require a separate program to execute.

41
Setting Up and Designing the Point Cloud Measurement Test BedThis test setup provided the required tools to investigate the effect of the view angle
on the component surface, stand-off distance, and scan speed on scanning quality. Since
Manorathna et al. [18] suggested that the accuracy of the information provided for the laser
scanner by the manufacturers is generated for a controlled environment, it thus cannot be
generalized for the manufacturing environment. The experiments were done in the manufac-
turing engineering laboratory with a setup similar to the manufacturing environment, and
the robot used is similar to the robots used in industry to test the influence of certain factors.
The robot that was used is 6-DOF Fanuc S430iw industrial robot Figure 1.15. The laser
line scanner Creaform MetraSCAN-R is attached to the robot as the end effector and uses
as external locating system separate from the robot location system to locate the laser line
scanner and obtain the position in space of measured point (x,y,z) coordinates. In designing
the test bed, I took into consideration the reachability of the component surface based on
the limitation of the robot, especially the selected measurement parameters. This is critical
as it insures elimination of user-induced system noise. The software that will be used for
simulation is Fanuc ROBOGUIDE.

42
Figure 1.15: The robot attached to the laser scanner.
Designing a Component Surface Electronically and Material SelectionIn designing the component surface, the first step is to design a similar surface elec-
tronically using CAD software. The CAD model will be then converted to triangles and
points will be generated to represent the dimensional information of the part. In selecting
the material to be used it is important to consider the surface finish of the test object. Spec-
ular, shiny, dark surfaces must be avoided because they generate spurious points that do not
lie on the actual object surface [1]. Therefore, I used a white board with matte finish as the
experimental components as recommended by Manorathna et al. [18] as it is the best surface
to use in order to avoid noises in the measurement process. My goal in doing the experiment
to test the parameters and surface reflectivity is not one of them. Thus, I should eliminate
all factors that might affect surface reflectivity in order to minimize possible errors.
Designing An Experimental Component Surface And Fixture DesignIt is crucial to design the experiment to reduce or eliminate the chance of having an
un-controlled variation in point cloud measurement and inspection from unexpected source
such as a complicated component surface geometry or surface reflectance. The goal of the

43
component(s) is to represent a benchmark surface able to characterize the effect of scanner
view angle, stand-off distance, and scan speed on scanning quality. The selected component
surface as mentioned will be simple, with three edges to test the effect of the characteristics.
Once a scan path has been designed and generated for the experiment. It will remain the
same and won’t change for all the replication throughout the duration of the project to
control the variation caused by the scan trajectory as much as possible since it is not under
the scope of study. The experiment will determine the factors that affect the accuracy of
the scan quality. This will also increase the quantifying effect of the parameter on the scan
quality. The part selected is a flat work piece surfaces. This work-piece is a simple flat
surface with no curvature or features to show the effect of changing the parameters.
Figure 1.16: Experimental Components Selected
Scanners run on a frequency in collecting data points, when scanning the same test
object twice using the same path and parameter will not collect the exact same point twice
but will collect points that represent the shape[32]. However, automation will reduce varia-
tion and improve consistency in the point cloud measurement. The first component, Figure
1.16, is a simple, flat surface with no curvature or features. The flat surface is selected for
the experimental test object because it is trivial and does not contain any surface features
also as recommended by Gestel et al. [6] artifact that are complex, which gives results that
are difficult to analyze; also flat surfaces are easy and fast to scan and can easily represent
the measurement task. Therefore, I used the flat surface for the experiment. A half-sphere
won’t allow me to study the effect of the factors one at a time since the sphere is curved;
also, the scanner will be able to collect multiple points at multiple distances and view angles
and won’t show the effect as clear compared to the flat surface.

44
The Design of Point Cloud MeasurementExperiments performed with the automated point cloud measurement test bed will
target four scanning parameters: (1) view angle of the laser line scanner to the component
surface, (2) scanner stand-off distance, and (3) scan speed and (4) resolution. While there
might be other parameters that are important that have an impact on point cloud quality,
the focus will be on only the four mentioned parameters due to the expected improvements
that these parameters will have on the point cloud quality by optimizing the parameters
settings. The settings that were selected for each parameter tested are provide in Table
1.2. The values used are within the limits specified. The view angles values used for the
scanner are within the limits specified, and the stand-off distance is within the minimum
and maximum distance. The speed of movement was within the camera ability to capture.
The resolution was within the camera’s resolution ability. The experiment were conducted
based on the plan provided in Table1.2.
Table 1.2: Parameters and parameter controls for the experiment
Parameter Parameter Control Number of inputs ResponseView Angle Angle (di) 3
Quality (Q)Stand-off Distance (L-Pi) 3Scan Speed mm/sec 3Resolution mm 3
In Table 1.2, the four parameters targeted in this research are controlled by four fac-
tors: the normality angle to the surface (di), stand-off distance (L-Pi), scan speed which is
determined by the robot arm settings (mm/sec), and the selected scan resolution (mm). The
study will investigate three normality inputs, three stand-off inputs, three scan speed inputs,
and three resolution inputs. Normality input parameters will be the minimum angle, max-
imum angle, and normal to point surface. Stand-off distance inputs parameters will be the
minimum distance, maximum distance, ideal distance. The scan speed input parameter will
be high speed, ideal speed, and slow speed. The resolution parameter will be high resolution,
ideal resolution, and low resolution based on the guidelines of the Creaform MetraSCAN-R

45
laser line scanner. The proposed multilevel factorial design for the experiment of the point
cloud measurement experiments will yield eighty-one unique parameter combinations. The
automated scan path for each of the proposed surfaces will be pre-programmed and will
not be modified throughout the point cloud measurement experiments to reduce variation.
However, there will be changes in the parameter being tested such as the laser line scanner
normality, stand-off distance, scan speed, and the resolution parameters. All the parameters
were be saved with the trajectory and loaded to the robot and ready for run prior to the
experiment. In this experiment I had 81 runs. Each run took on average half an hour to
conduct with a total running time for the experiments of 40 hours. Raw data were be col-
lected along with the run order to look for variation or outliers if they exist in the process.
The experiments took about two weeks once all the programming and setup were completed.
Gestel et al. [6] mentioned that there are four parameters that define the quality of point
cloud: noise, density, completeness, and accuracy. In their research they only studied noise
and accuracy [6]. Lartigue et al. [35] suggested that noise is an indicator of data sampling
errors and evaluated by the deviations between the points gathered and the surface model.
The density is related to the point cloud density and the number of points collected that rep-
resent the part; the completeness is an indication or gaps in the point cloud; accuracy is an
indication of measurement uncertainty [35] In my research I studied density, completeness,
and noise. The data gathered from the test object were be compared to the data generated
from the CAD model, the number of data points gathered does not affect the accuracy of
the scan, but its coordinate will. I used the several measures including Mean Square Error
(MSE) [32] . The mean-squared error (MSE) between two captured data c(x,y,z) and g(x,y,z)
c is the data gathered from the CAD model and g is the data gathered from scanner. Boehler
et al. [27] measured the quality by the deviation of a single point from the object’s surface;
in the process they noticed that while it is possible to record dimensional information of an
object several times from different scanned points, it is impossible collect the exact same
points in each time. Therefore, they collect the points then model it in a 3D shape, and

46
finally calculate the quality by the deviation of a single pint from each observation. Two
strategies for scan path generation can be used. For the plane surface the global strategy
was be used; it scans the test object all at once and maintains the same standoff distance
above the artifact. However, this strategy might not fit right for other edged surface because
there are multiple surfaces. The appropriate strategy to use is the multi oriented strategy
where the artifact will be patched into small patches and scanned each patch individually
on certain orientations, then travel to the other patch [1] .
1.3.4 Assumptions and Limitations
Limitations are the four mentioned parameters. In selecting the shape to scan and do
the experiments on I selected the surface that is recommended in the literature that does not
cause noise in the scanning process. different surfaces will not be taken into consideration.
The same surface will be used in the two made models. I am not going to test different
shapes other than the proposed shape as this shape test for what is need to know about the
parameters. Moreover, this shape is supposed to study the parameters that I am testing and
provide accurate results and thus the results might be generalized. While there is an effect on
the surface reflectivity and the material used, I am not going to address this in the research,
and it will not be within the scope of this work. In the literature it is recommended to
stay away from using specular, shiny, dark surfaces because they cause noise in the gathered
data [1]. It is recommended to use white and matte surfaces in designing the experimental
components [18]. I followed these recommendations by MartÃŋnez and Manorathna [1, 18]
in designing the test object. My assumption is that their recommendations will work with
all 3D scanners, and by following their recommendations, I am reducing or eliminating the
noise effect on the gathered data. There are factors that I am not going to investigate in the
experiment, as these factors might add noise to the experiment such as signal radiation and
the effect of sunlight in the experiment. All the experiment were made in the same setting
in a similar time frame to reduce the variation that is caused by these factors. I also used
one scanner calibration to reduce the effect of scanner calibration in the experiment. Results

47
were from the equipment tested and not general to all other devices and scanners.
1.4 CONTRIBUTIONS
There are four expected contributions that this work adds to the research knowledge
and to the application field to achieve an automated inspection system. First is defining
the relationship between the C-track workspace and the robot workspace this is necessary to
know what is the point that is being collected on the surface and that it can be referenced
in the robot workspace. The second contribution is on the role of the right parameter on
the scan quality. The third is to show the error propagation in the point cloud for the
remanufacturing process planning and how the digital thread is affected by the point cloud
processing. The fourth is the use of the machine learning to optimize the scanning technology
and predict the scan quality, the machine that was used in this work is CT-scanner.
1.4.1 C-track Transform and Model Validation
3D scanners digitally capture the shape of physical objects. Robots move the 3D
scanner over the surface of on object to collect the point cloud of the surface, which are
collected to form a digital representation of an object. In Deshmuk et al. [33] the component
surface, robot, and scanner in three workspaces, but only the link that reflects the location of
the component surface in the robot workspace was found. However, the point on the surface
and acquired point cloud collected by the 3D scanner could not be compared because the
relationship between the C-track (scanner) workspace and the robot workspace was not
found. In this work, I derived the transformation for the robot space and C-track camera
space to be able to know the location on the robot workspace that is derived by the 3D
scanner. Knowing the relationship between all the workspaces is necessary for integrating
the system and designing the Automated Laser Line Scanning systems (ALLS). Failure to
connect the workspaces together will result in a disintegrated system. This will make me
unable to use the gathered information about the component surface in designing a trajectory
to scan a specific test object, or know the location of the test object in relation to the robot
and the accurate location of the scanner. After linking the coordinate of the component

48
surface with the coordinates of the robot in the robot workspace, I will validate the model
by comparing a single point on the surface with single point cloud point on the gathered
scanned data. In this experiment I used a FANUC S430i robot, a Creaform MetraSCAN-R
scanner, robot offline programming software such as Roboguide will be used to program
the robot as well as the kinematic models that connect the component surface to the robot
workspace [33] and a test object to validate the proposed link between the robot workspace
and the component surface. Validating the model will provide the ground work to build upon
for future applications with the ALLS, and this will make it possible to have an integrated
system capable of knowing the points that should be visited in order to collect all the
necessary points on the component surface. There are assumptions made in modeling the
kinematics equations, one of which is that the laser beam is in the center of the scanner and
at a specific distance from the robot end effector. However, in the actual scanner the laser
beam is not located in the center of the scanner it is displaced from the center. This requires
the model to be modified to fit the actual scanner. This is a necessary step to make as it will
validate the model as well as it will like the C-track and robot workspaces. This work will be
the basis for future applications with the 3D scanner. By knowing the relationship among
all the workspaces, we will be able to design a system capable of identifying the location
of the surface that was missing in the scan and to revisit it in the inspection process. It is
essential to know where the defect is located exactly on the component to then easily revisit
a specific area on the test object just by feeding the point to the robot.
1.4.2 The Role of the Right Parameter On the Scan Quality
The outcome of this research task is to find the effect of different parameters on scan
quality. This is important as it works as the input for future optimization tasks and also for
programming future scan paths [46, 72]. The long-term goal of the tasks is to develop an
initial step towards 100% on line point cloud measurements in manufacturing systems. It
will make the technology practical to advance the field and practice of manufacturing quality
monitoring as it reduce the amount of noise and will increase accuracy and consistency in

49
the point cloud. It will also save time in the inspection process and make the technology
appealing for the manufacturing industry.
1.4.3 Error Propagation in the Point Cloud for Remanufacturing
Process Planning
In this research the sources of errors in the remanufacturing digital thread for additive
manufacturing were studied, and the overall error was measured in different steps, starting
from the scanning error after reducing the error by selecting the right parameters, to the error
that is generated from smoothing and cleaning the point cloud, to the error generated from
meshing the point cloud of the scan for measuring the amount of the defect to generate the
correction plan for the material deposition, to the error of slicing in the plan for the movement
of the material deposition, and finally to the error generated by the actual manufacturing
and material deposition. The errors were calculated for the scanning phase, the smoothing
phase and the mathematical models. Errors were found in the scanning, smoothing, meshing,
and slicing.
1.4.4 Using a Predictive Model to Optimize the Parameters of a
CT- scanner
The final goal of this research is to test the use of machine learning in predicting
the scanner parameter. This research was conducted on a different type of scanner a CT
scanner, which shows both the surface structure as well as the internal structure of the part.
This can lead to a tool that can be integrated into a different scanner. In our case this can
be integrated into the CT scanning software in which users would be prompted to input
the approximate density and thickness of the item to be scanned. The tool would use our
prediction models as a basis for simulating scan parameters and output a set of recommended
parameters. The preliminary testing of the accuracy of the prediction shows that the model
can be used as a prediction tool for the CT scanning application.

50
Table1.1:
Literature
Review
ofDifferentFa
ctors
Pap
erView
Ang
leStdff
distan
ceSp
eed
Resolution
Color
Accuracy
Glossiness
Ambientlig
htMaterial
Geometry
Rou
ghness
Laserintensity
Zaim
ovic
etal.(2010)[54]
--
--
X-
X-
--
--
LemeÅ
ąet
al.(2009)
[55]
--
--
--
-X
--
--
Voisinet
al.(2007)
[56]
--
--
--
-X
--
--
Voegtle
etal.(2008)
[57]
--
--
--
--
X-
--
Lichtiet
al.(2002)
[58]
--
--
--
X-
X-
--
Gerbino
etal.(2016)
[50]
X-
--
-X
-X
--
--
Wan
get
al.(2016)
[20]
X-
--
--
--
--
--
Gestele
tal.(2009)
[6]
XX
--
--
--
--
--
Feng
etal.(2001)
[4]
XX
--
--
--
-X
--
Blancoet
al.(2009)[51]
--
--
--
-X
--
--
Vuk
asinov
icet
al.(2010)
[53]
XX
--
X-
--
--
--
Cuestaet
al.(2009)[52]
--
--
--
--
--
X-
Pop
ovet
al.(2010)[59]
-X
--
-X
--
--
-X
MartÃ
ŋnez
etal.(2010)
[1]
X-
--
X-
X-
--
--
Martins
etal.(2005)
[46]
XX
--
--
--
--
--
Liet
al.(2004)
[13]
--
--
--
--
--
--
Weyrich
etal.(2004)[5]
--
--
--
--
--
--
Man
orathn
aet
al.(2014)[18]
XX
--
--
X-
--
X-
Boehler
etal.(2003)
[32]
-X
--
--
X-
-X
--
Alkha
teeb
etal.(2019)
XX
XX
--
--
--
--

51
CHAPTER 2: LINKAGE BETWEEN MEASURED AND
COLLECTED POINTS WITHIN THE SCANNING PROCESS
FOR THE INTEGRATED AUTOMATED LASER LINE
SCANNING INSPECTION SYSTEM
2.1 Abstract
3D laser line scanning is a cutting-edge technology that digitally captures the shape
of physical objects. 3D laser line scanner is skillfully designed and mounted onto the robot
(FANUC S-430 iW) to automate the scan path and quality inspection processes. The robot’s
primary function is to transport the 3D laser line scanner above the surface of an object
to collect point cloud datasets of the surface. Point clouds of the surface are collected
and form a digital representation of an object. The kinematic relationship between the
component surface of the part being scanned,the robot, and the scanner were previously
derived. However, the location of the point on the physical surface and acquired point
cloud collected by the 3D laser line scanner cannot be compared because a relationship
between the robot and scanner workspaces was not found. In this work the transformation
of the robot workspace and the scanner workspace was derived (C-track camera space) to be
able to know the location of a point being collected on the robot workspace. Knowing the
relationship between all the workspaces is necessary for integrating the system and designing
an Automated Laser Line Scanning system (ALLS) with an external tracker. It will help in
trajectory planning for the 3D scanner, which can lead to an autonomous system capable
of automatically scanning and collecting points. Failure to connect the workspaces together
will result in disintegrated systems, which would limit the ability to design a trajectory to
scan a specific part, or know the location of the part in relation to the robot workspaces and
laser line scanner.
2.2 Introduction
3D scanning is recognized as an advanced technology used for speed, accuracy, and
coverage. With automated 3D technology, users can improve quality and compliance without

52
slowing down production. The processes used for 3D scanning make it faster to scan a
part with complex dimensions while reducing time consuming orientation and alignment
processes. As a result of remanufacturers encountering high uncertainties in component
quality and factors related to sustainability, it is necessary to incorporate this advanced
technology for the effectiveness and efficiency of quality inspection and condition assessment
operations. By understanding the relationship of the missing links, which are the location of
the C-track in the robot work cell and the point that is being collected, a trajectory can be
created that takes into consideration points collected from one location to the next, which
in turn allows users to make careful predictions. Within the automated system there are
several components that contribute to the function of the automated scanning system. The
components utilized consist of the robot, laser line scanner (Creaform MetraScan-R), and the
C-track. The C-track has dual camera sensors fitted with high quality optics and lighting,
enabling it to measure all reflectors in the parameters of the workspace. Besides the tracking
capability of the whole systems reference model, the C-track ensures the exact localization of
the laser line scanner (Metra Scan-R), in turn offering high end automated scanning solutions
like scan trajectory optimization algorithms and optimized meshing output. There has been
considerable research on automated scanning systems regarding path planning strategies
[19]. However, there is no exact solution to explain the relationship between the robot and
the C-track. Systems with encoders linking the robot arm and the scanner do not require
this relationship. The relationship between the C-track and robot are required here because
the C-track is external and independent of the robot. The relationship of the two is very
important for this research because it will integrate the zero position of the C-track compared
with both the end effector and the base frame of the robot. Knowing the location of the
C-track is very important as when the area being scanned is in front of the C-track it can
be reached by the robot. However, when the end effector is at this position it is causing
an occlusion to the C-track. Thus, this area can’t be scanned, so the locations shouldn’t
be considered while planning the trajectory, but another end effector view angle should be

53
considered. In this study, the link between the measured and collected points in the scanning
process was investigated. To do this, the location of all the components in the workspace
were taken into consideration. These components are the center of the robot, the kinematic
model of the robot, the location of the end effector, the location of the end of the laser line
scanner, the location of the laser beam in the space, and finally the location of the C-track in
the work cell. These models establish an understanding of the relationship between scanning
procedures and measured point cloud datasets and are the foundation for automated laser line
scan monitoring and assessment. In the absence of these models, laser line scanning would
continue to be a time and resource intensive monitoring and assessment strategy and have
little relevance except in single workspace instances. The long-term goal that this research
contributes to is to transform quality monitoring methods in new product manufacturing
and condition assessment methods in remanufacturing operations. This can only become
possible through laser line scan automation and scan trajectory optimization. However,
efficient automation and scan trajectory optimization require a fundamental understanding
of the kinematics of automated laser line scan systems (ALLS). After linking the coordinates
of the component surface with the coordinates of the robot in the robot workspace, the
model will be validated by comparing a single point on a surface with a single point. This
experiment uses a FANUC S-430Iw robot, a MetraSCAN-R laser line scanner, robot offline
programming software (Roboguide, Robcad, Workspace), and a test object to validate the
proposed link between the robot workspace and the component surface. Validating the model
will provide the foundation for future applications with the ALLS, and this will allow us to
have an integrated system capable of knowing the points that should be visited in order to
collect all the necessary points on the component surface. This work will be the base for
future applications with scan path planning for 3D laser line scanning. In CMMs and other
types of measuring systems there is a direct link between the internal moving system or the
robot arm and the external scanner. In the scanning process the point cloud is encoded
with the location of the point being collected. However, in the current system these two

54
components are not linked, which makes it challenging to predict the point to be collected
by moving the robotic arm from one location to another without connecting the C-track and
robot workspaces. The knowledge that will be gained from this work will make it possible
to encode the point collected by the laser line scanner to the movement of the robot arm.
The location of the reference frame of the C-track is also determined. In this experiment the
zero frame of the robot and the C-track is measured while using all the tools needed to know
its location precisely. All these steps and the outcomes of this work will improve trajectory
planning for 3D laser line scanning.
2.3 The Current System
3D scanners have been mounted to robotic arms or other types of mechanical devices
such as CMMS in an effort to automate the data acquisition process and inspect a part
[21, 22]. This will substitute the old way of manual data acquisition which generates an
inconsistent point cloud that cause noises and variability in inspection processes. Mounting
the scanner to a robot with an external track results in two disintegrated workspaces The
robot moves in the robot workspacem and the scanner moves in the workspace created by
the C-track.
To my knowledge, this has not been studied before. It is important to find the
relationship between the points that are being collected and the location of the scanner in
the workspace because this will allow for the creation of a scan trajectory based on the
feature of the part being inspected.
2.4 Elements of the Automated Laser Line Scanning System
The Automated Laser Line Scanning System (ALLS) studied here consists of a laser
line scanner attached to a six degree of freedom FANUC S-430 IW robot as the tool frame, a
robot controller, a program to move the robot, cables, a scanner controller, C-track, a power
supply for the scanner, a computer, and software to collect and process the data points
collected.

55
Figure 2.1: Point collection of general laser line scanners to be used as end effectors model(image from Bracun et al., 2006) [7]
2.4.1 Laser Line Scanner
As mentioned in Deshmukh et al. [33], the Creaform MetraSCAN-R scanner operates
by the steering of laser beams, followed by a distance measurement at every pointing direc-
tion. A 3D laser scanner consists of a laser, a ranging unit, a control data unit, and a location
tracker (C-track). The laser unit produces the laser beam that is needed for measurement.
The ranging unit determines the distances and angles. When a laser stripe projects onto
a surface of a component, the reflected beam is detected by cameras; this determines the
distance based on the shape and speed of the reflection. The Creaform MetraScan-R system
contains a laser projector, a lens, and an image sensor. The reflection of the laser light on
the measured surface passes through the lens and is recorded via the image sensor. It forms a
triangle between the scanner and the object and the camera (i.e. triangulation). The (X, Y,
Z) of a point on the measured surface is determined from the coordinate system of the laser
beam, see Figure 2.1. However, in our system the locations of the points are determined in
relation to the location of the C-track.
The link between the robot workspace and the camera workspace (C-track) is not
known. The scanner is running in the C-track workspace. The robot is running in the robot

56
Figure 2.2: Offset of the Creaform MetraSCAN-R laser line scanner MetraSCAN trainingPPT)
workspace. The relationship between the two workspaces has to be known in order to design
a trajectory that takes into consideration the dimensional information of the test object
being inspected. In the model made by Deshmukh et al. [33] all the equations were defined
in relation to the robot workspace including the component surface. However, the point on
surface and acquired point cloud collected by the 3D scanner could not be compared because
the relationship between the C-track (scanner) workspace and the robot workspace was not
found.
2.4.2 FANUC S-430 IW Robot
The FANUC S-430 IW robot arm has six joints with six degree of freedom. The
kinematics of each of the joint will be shown in the kinematic section (J1, J2, J3, J4, J5,
and J6). The scanner is attached to the robot end effector J6 as a standoff distance. This
distance is to account for the laser beam and the dimensions of the scanner. The tool center
point of the laser scanner is defined in the tool frame to create a Z-offset that is the distance
from the end of robot arm to the scanner end effector, see Figure 2.2.

57
2.5 Approach
In this experiment, tools such as a water level device, protractor, and laser pointer
were used to measure and identify the angles and distance between the components in the
work cell. First, the kinematics model for the FANUC S- 430 iW robot was validated by
using the model suggested by Deshmukh et al. [33] as well as by adding the dimensions
of the scanner and the laser beam along with the physical model. A simple program for
the robot was created to locate a point on the work space. The scanner was left collecting
points until enough data points were collected in the intersection between the two laser
beams. In order to get accurate measurements and a collection of point cloud datasets that
represent a specific point, the robot was in static mode and was not moving, which made
it challenging to collect points. The point clouds collected were saved in a text file with
three taped columns. To locate the reference frame for the C-track, another experiment was
done, a manual scanning to determine of the actual axis (X, Y, and Z). The first step for
the manual scanning was to scan the floor in the X-axis. Then a manual scanning for the
Y-axis was done, followed by the Z-axis. After collecting the cloud measurement data, the
data was plotted to determine the desired point for the actual study and further references.
Moreover, the data gave a better reading for the axis of the research that was done earlier.
The manual scanning showed the differences in X-axis, Y-axis and Z-axis, which made it clear
that the reference frame for the C-track is between the two cameras in the C-track. Thus,
the calculation for the location of the C-track used earlier will be the same in both cases,
making it possible to predict the points to be collected by the scanner based on location of
the C-track in a specific position with a specific orientation.
2.6 Methodology
The 3D scanner was attached to the end effector of Fanuc S- 430-iW and the C-track
was placed on the negative Y-axis of the robot world frame Figure 2.3(a).
The distance between the robot and the C-track was measured using a measuring tape
Figure 2.3. Also, the distance between the C-track and the Laser sensor that was attached

58
(a) (b)
Figure 2.3: The workspace of the robot (a): without the table (b): with the table.
to the robot’s end effector was measured Figure 2.6. The robot was calibrated and set to
the zero position for exact measurement Figure 2.4. Then, validation was performed on the
robot to check the zero position using the kinematic model of the robot and compared with
the actual data collected from the robot controller using the Teach Pendant see Figure 2.5.
The kinematics equation was implemented in Maple 17 to get the end effector position.
After that, the MetraScan-R was attached to the end effector of the robot and the dimensions
of the laser scanner were taken into account along with the standoff distance for the laser
beam, the kinematic model that represents the actual setup was developed, Figure 2.5.
In Figure 2.4, A blank sheet of paper was placed on the test bed underneath the laser
beams to test the trajectory, and the laser sensors were placed within range of the C-track
in order to collect the point cloud datasets.
The distance between the laser sensor was then measured using a measure tape in
order to validate the measurement in Maple 17 later on. Moreover, the workspace was
measured and marked using tape for more accurate position repeatability of the process,

59
Figure 2.4: The robot calibrated and set up at zero position without the Scanner installed
Figure 2.5: Drawing the representation of the robot kinematics Djuric, (2007) [8]

60
(a) (b)
Figure 2.6: The robot calibrated and set up at zero position with the scanner installed andthe table placed with the laser beam in the zero position
Figure 2.6.
2.7 Kinematic Model and the Relationship between the C-track
and the Robot Reference Frame
The relationship between the C-track and the robot reference frame was derived using
forward kinematics and validated physically on the actual robot. To know the location of
the robot end effector, the location of the laser beam on the workspace was noted along with
the measurement of the 3D scanner, Figure 2.7. Using kinematic equations for six degree
of freedom FANUC S430 IW, the robot end effectors was moved to a fixed point named
the home position. The joint angles of the robot (θ1 − θ6) were determined while taking
into consideration the limitation of the joints and validated with the actual robot based
on research by [73, 74] while ensuring that the selected position for the home position was
not in singularity[75]. The home position using the equations and the actual space of the
robot in the work cell for FANUC S-430 IW robot with the model obtained by [74] was
validated. Work by Deshmukh et al. [33] work was extended by incorporating the location
of the C-track to the location of the point on the surface determined by the laser beam by
using forward kinematic equations to obtain the validated position for the FANUC S-430 IW
robot, laser scanner, and laser beam. The robot was calibrated and set to the zero position
then joint 5 was moved -90 degrees to the ground see the robot D-H Parameters Table 2.3.

61
Figure 2.7: The robot work cell along with the calculation of the angles and the measurementof the workspace.
The equations for the forward kinematics are as follows: The general homogeneous
transformation matrix for all the robot joints.
A =
cos(θ)−cos(α) ∗ sin(θ) sin(α) ∗ cos(θ) a ∗ cos(θ)
sin(θ) cos(α) ∗ cos(θ) −sin(α) ∗ cos(θ) a ∗ sin(θ)
0 sin(α) cos(α) d
0 0 0 1
(2.1)
Equation 2.1: The Homogenous Transformation Matrix A01 the relationship between
reference frame and joint 1 in the robot.

62
Table 2.3: Robot D-H parameters
Th1: 0.00 D1: 740.0 A1: 305.0 Al1: -90.0Th2: -90 D2: 0.00 A2: 925.0 Al2: 180.0Th3: 180.0 D3: 0.00 A3: -250.0 Al3: 90.0Th4: 0.00 D4: -1110 A4: 0.00 Al4: -90.0Th5: -90.00 D5: 0.00 A5: 0.0 Al5: 90.0Th6: 180.0 D6: -260.0+605 A6: 0.00 Al6: 180.0
A01 =
cos(θ1)−cos(α1) ∗ sin(θ1) sin(α1) ∗ cos(θ1) a1 ∗ cos(θ1)
sin(θ1) cos(α1) ∗ cos(θ1) −sin(α1) ∗ cos(θ1)a1 ∗ sin(θ1)
0 sin(α1) cos(α1) d
0 0 0 1
(2.2)
Equation 2.2: The Homogenous Transformation Matrix A12 the relationship between
joint 1 and joint 2 in the robot.
A12 =
cos(θ2)−cos(α2) ∗ sin(θ2) sin(α2) ∗ cos(θ2) a2 ∗ cos(θ2)
sin(θ2) cos(α2) ∗ cos(θ2) −sin(α2) ∗ cos(θ2)a2 ∗ sin(θ2)
0 sin(α2) cos(α2) d
0 0 0 1
(2.3)
Equation 2.3: The Homogenous Transformation Matrix A23 the relationship between
joint 2 and joint 3 in the robot
A23 =
cos(θ3)−cos(α3) ∗ sin(θ3) sin(α3) ∗ cos(θ3) a3 ∗ cos(θ3)
sin(θ3) cos(α3) ∗ cos(θ3) −sin(α3) ∗ cos(θ3)a3 ∗ sin(θ3)
0 sin(α3) cos(α3) d
0 0 0 1
(2.4)

63
Equation 2.4: The Homogenous Transformation Matrix A34 the relationship between
joint 3 and joint 4 in the robot
A34 =
cos(θ4)−cos(α4) ∗ sin(θ4) sin(α4) ∗ cos(θ4) a4 ∗ cos(θ4)
sin(θ4) cos(α4) ∗ cos(θ4) −sin(α4) ∗ cos(θ4)a4 ∗ sin(θ4)
0 sin(α4) cos(α4) d
0 0 0 1
(2.5)
Equation 2.5: The Homogenous Transformation Matrix A45 the relationship between
joint 4 and joint 5 in the robot
A45 =
cos(θ5)−cos(α5) ∗ sin(θ5) sin(α5) ∗ cos(θ5) a5 ∗ cos(θ5)
sin(θ5) cos(α5) ∗ cos(θ5) −sin(α5) ∗ cos(θ5)a5 ∗ sin(θ5)
0 sin(α5) cos(α5) d
0 0 0 1
(2.6)
Equation 2.6: The Homogenous Transformation Matrix A56 the relationship between
joint 5 joint 6 in the robot
A56 =
cos(θ6)−cos(α6) ∗ sin(θ6) sin(α6) ∗ cos(θ6) a6 ∗ cos(θ6)
sin(θ6) cos(α6) ∗ cos(θ6) −sin(α6) ∗ cos(θ6)a6 ∗ sin(θ6)
0 sin(α6) cos(α6) d
0 0 0 1
(2.7)
To get the location of the laser beam, all the joint homogeneous equations were multiplied
as given in equation 2.7.
T06 = A01 ∗ A12 ∗ A23 ∗ A34 ∗ A45 ∗ A56 (2.8)
For the previous equations, a program was made in Matlab to give the location of the end

64
Figure 2.8: Matlab prompt to get forward kinematics by inserting D-H parameters and theta
effector using forward kinematics by taking the D-H parameters in an input dialogue length
and angles of all joints of the robotic arm Figure 2.8. Defaults for the robot were inserted,
and a theta value was given for a specific location
The location of the C-track in relation to the robot end effector is given by equation
2.9.
~A = ~B + ~C (2.9)
The current location of the C-track is measured and given by the vector C-track and
the location of the end-effector in the workcell space is given by T06
Ctrack =
0
−1330
1530
(2.10)

65
T06 =
1415
0
1050
(2.11)
The relationship between the location of the laser beam and the Ctrack is given by
equation 2.12
Xfinal = Ctrack − T06 =
−1415
−1330
480
(2.12)
2.7.1 The Relationship between the C-track Reference Frame and
the Robot Reference Frame
In this step the location of the origin of the C-track workspace was validated. The
data collected by the scanning process was saved in (X, Y, Z) points. The points that
were gathered did not consider the reference point as the center of the test object. The
relationship between the point being collected and the shape of the part was not known. It
was determined that the points gathered change every time the C-track is moved. However,
this could not be linked to a specific reference, so three coordinates of three different points
were collected. The coordinates of these points were gathered in relation to the camera
workspace and the robot workspace. The relationship between the two workspaces were
derived and programmed. The program takes the location of the C-track in relationship to
the robot, and two points on the part were manually inserted; this will translate any point
on the part from the robot workspace to the scanner workspace that the scanner gathered
while scanning. The program worked by inserting the location of the C-track in the robot
workspace, which is the origin of the camera workspace along with points on the X axis of

66
Figure 2.9: Matlab prompt to insert origin of the C-track
the C-track and points that lie on the XY plane of the C-track or on the XZ plane of the
C-track. Points XY and XY along with the points on the X axis set up the orientation of
the C-track and define the relation ship. The software that does this was made and can be
seen in the Figure 2.9 below.
The results will give two mattresses, R and R_back; R is the relationship between a
point in the global as seen from the local which means the location of the part being scanned
with a known location in the robot workspace in the C-track workspace. To get this, the
location of the point in the robot workspace is multiplied it by R in matrix 2.13. R_back is
the Point in the local as seen from the global which means the point in the scanner workspace
can be converted to the global workspace that is the robot workspace by multiplying it by
R_back in matrix 2.14.
R = 10e+ 03 ×
0.0006−0.0008−0.0001 2.1252
0.0008 0.0006 −0.0001−0.9384
0.0002 0.0000 0.0010 −1.3391
0 0 0 0.0010
(2.13)

67
R_back = 10e+ 03 ×
0.0006 0.0008 0.0002−0.3048
−0.0008 0.0006 0.0000 2.2606
−0.0001−0.00010.0010 1.4097
0 0 0 0.0010
(2.14)
2.8 Summary
This chapter showed the relationship between the locations of the reference frame
of the C-track in relation to the robot workspace. The kinematic model that represents
the relationship between the workspaces was derived along with the center of data points
collected. Multiple experiments were done to locate and validate the location of the scanner
in the C-track workspace, and it was determined that the location of the workspace of the C-
track is the center of the two cameras of the C-track. These outcomes provide an opportunity
to generate an optimum scan path planning technique capable of knowing the points to be
collected beforehand. Knowing the positions of the robot arm, the 3D laser line scanner,
and the C-track position while scanning along with the shape of the object being scanned
can lead to creation of scan trajectories that take into consideration the dimension of the
part being scanned. The limitation of the work is that the relationship between the location
of the C-track and the location of the robot end effector is not always the same equation;
it only depends on the current robot setup provided along with the current location of the
C-track. Moving the C-track will not give the same results. By using the results, points
collected from the scanner at this given position can be predicted. Future work will be
generalizing the model and creating software that takes all the positions and orientations of
the components in the work cell, such as the location of the C-track and orientation along
with the location and orientation of the robot, to predict the location of given points on the
C-track workspace.

68
CHAPTER 3: STUDYING THE EFFECT OF SCANNING
SPEED AND RESOLUTION ON POINT CLOUD QUALITY
3.1 Abstract
3D scanning can be used for many applications in manufacturing and remanufactur-
ing by offering a sustainable solution to end-of-use (EoU) core disposal and recovery. These
manufacturing and remanufacturing activities require an accurate identification of the dam-
age in order to generate recovery plans that suit the known damaged parts. Using 3D laser
scanners as an inspection tool can facilitate this process by measuring the defect. In the
preliminary study conducted, an error caused by different parameters was found in the point
cloud gathered from the scanning process. Therefore, it was necessary to investigate the fac-
tors affecting the scanning accuracy and minimize the scanning errors in order to generate
appropriate material deposition paths. Previous studies have identified several factors such
as the view angle and standoff distance and investigated their effects on scanning quality.
However, scanning speed and resolution are two additional factors affecting the accuracy
of captured point cloud that have not been studied so far. Therefore, in this chapter, the
effect of scanning speed and resolution is investigated in conjunction with the view angle
and standoff distance on the scanning quality. An experiment was designed with four fac-
tors, three levels and three replications. Root Mean Square Error (RMSE) was used as the
performance measure to analyze the difference between the laser-scanned 3D point cloud
data and the model point cloud. Preliminary findings confirmed the results of the previous
studies that changing the view angle and standoff distance affects the quality of the point
cloud. Moreover, the findings showed that the scanning resolution is negatively associated
with the scanning accuracy, meaning increasing the scanning resolution will decrease the
scanning accuracy. In addition, the findings showed that the scanning speed has a negative
relationship with the scanning accuracy.

69
3.2 Introduction
There are many types of technology for gathering dimensional information of a specific
object. Two of the major technologies are touch probe and 3D scanning, each of which has
its own advantages and disadvantages. The main advantages of using a 3D scanner over
traditional Coordinate Measurement Machine (CMM) is that the CMM has a touch trigger
probe that needs to make contact with the surface it is measuring and collect one coordinate
point per touch, unlike the 3D scanner that has the ability to measure points without any
contact with the object and capture a large number of points in a short period of time. In
general, Coordinate Measure Machines (CMM) are used to extract data points, but they
are relatively slow and have low resolution. On the other hand, non-contact methods using
non-contact probes enhance accuracy by eliminating noise and giving the best possible fit
according to the shape of the object [59]. CMM takes a long time for the touch trigger
probe to capture the same number of data points that the 3D scanner collects since it
captures one data point per touch. On the other hand, laser line scanners are less accurate
than conventional touch-trigger probes such as CMMs. The accuracy of 3D scanners is
strongly influenced by the characteristics of the object surface, shape, reflection, roughness,
transparency and other properties. For example, it is difficult to scan and inspect shiny
surfaces such as machine steel and aluminum using a 3D laser line scanner [4]. In addition,
there are standardized procedures to evaluate the accuracy of touch-probe sensors by using
a ball artifact. These procedures are not applicable for 3D scanning.Before developing an
automated planning for laser inspections in industry, it is necessary to understand what
causes outliers in scanning outputs. This can be achieved by experimentally testing the
scanning parameters and analyzing their effects on scanning quality. Bevsic et al. [76] studied
both measurement methods using the same evaluation procedure for the CMM on a sand
blasted aluminum part that was designed to include complicated shapes and common parts
such as planes and cylinders. They concluded that the same tools can’t be used because the
accuracy of the laser scanner is influenced by the characteristics, so further tests are needed

70
to take all of the influences into account, such as surface quality, surface orientation, and scan
depth, which are not the case for CMMs. [76] [6]. The basic purpose of a 3D laser scanner is
to gather data pertaining to the shape of an actual object so that it could build 3D models
by propagating a laser beam on the surface of the target and then detect its shape through
the reflections. There are several types of 3D laser scanners that can be used in various fields
such as dentistry, mining, urban topography, reverse engineering, archaeology, etc. Time-of-
flight 3D laser scanners, projected pattern 3D scanners, and modulated 3D light scanners
are only a few examples of the different types of non-contact active 3D scanners [54]. There
are many parameters that affect the output of 3D scanning, one of which is the influence
of light that has been well studied and documented. Optimum results could be achieved
when the colors have a strong red component, such as red, white and yellow, requiring a
color setting at the light side while black and green surfaces give the poorest results [54]. In
addition, gray surfaces do not have an impact on the results and thus, can be used in the
scanning process [54]. Generally, white and matte surfaces tend to deliver more accurate
point cloud data compared to black surfaces [18]. In addition to surface lighting and colors,
surface glossiness is another factor that affects scanning quality [50]. The influence of light,
color and brightness levels on the measurements can be reduced by doing a careful analysis
of the reflected light time evolution which is imaged in the digitizing system’s sensors [52].
Martinez et al. 2010 analyzed a touch-trigger probe system against a conventional Laser
Tracking System (LTS) system and compared the results for reconstructed surfaces with
different structured light intensity [1].
Scanning orientation is another factor that may affect the accuracy of any 3D laser
scanner through influencing the incidence angle of the scanner, which is the angle between
the normal vector of the surface and the laser beam itself [4, 50, 20]. The incidence angle is
known to be closely linked to signal deterioration, where a larger angle would have a more
stretched out footprint and the reflected signal is wider while having a low magnitude causing
the sensor-to-surface relative position to be of great importance [50]. Due to the electro-

71
optical nature of the scanners and the principle of optical triangulation, the geometry and
position inside the scanning window, which determines the incidence angle, tends to influence
the measurement accuracy [4]. The main problem arises because of the falsely recorded
outliers.These points are measured from different valid measurement points but usually do
not really exist on the actual surface due to using different incidence angles. Outlier points
particularly cause some difficulties in CAD/CAM applications [20]. The incidence angle also
affects the reflectorless distance measurement of 3D laser scanners.
One of the more obvious factors that affect 3D Laser scanner measurements is the
distance of the object from the sensor, which can have a significant influence on the quality
of results. In very simplified terms, the shorter the distance of the object from the sensor,
the higher the resolution and, thus, the lower the noise levels, and vice versa [6]. This can
be explained by the Gaussian beam propagation, principle which dictates that the beam
does not travel in a parallel manner but rather converges until a certain distance and then
diverges. This divergence affects the quality of the results since the beams are not entirely
reflected. This has been experimentally proven where a laser beam was directly aimed at
a camera CCD sensor and its profile was measured at 20 mm increments from 40-200 mm.
Since the sensor pixel size was known, it was easy to determine the varying width of the
beam for confirming the Gaussian principle [53]. Too close or too far a distance can both be
detrimental to the results since placing an object too far would put it out of the range of the
laser but bringing it too close would open up the possibility of collisions between the points
[46]. The relationship between the standoff distance/height and the accuracy of the scanning
results can be determined by incrementally changing the distance between the object and
the beam propagation point until an optimum working range can be found [18].
Any limitations related to the instruments and hardware can often lead to systematic
errors in the propagation of the laser beam and the accumulation of the reflected light. The
emission is affected by three factors: the beam divergence deviation, the beam deflection
unit, and the axes error including three axes which are seldom aligned and stable. This is

72
usually dependent on the scanner resolution, which is related to the accuracy of the results
[50].Resolution, in this context, refers to the capability of the scanner to detect minute
features in the point cloud determined by the combination of two factors: the minimum
angle increment between two continuous points and the laser spot’s size [32]. Physical
limitations of the scanner often cause noise in the gathered point cloud data, which could
lead to deteriorated results such as holes in the artifacts scanned. In addition, herd to reach
areas for the sensors are usually in grooves with low light, often which leads to low sampling
density which can again cause the results to be inaccurate [5].
Most commercial scanners often face limitations in precise dimensional inspection
of manufactured parts since there is at least one magnitude that is digitally less accurate
compared to touch-trigger probes [4]. The surface material also affects the laser scanner
measurements in a few cases such as reflective surface material in time-of-flight laser scanners.
Moreover, roughness of the surface material creates variations in the final scan as it has been
shown in many studies that the surface roughness of a flat surface correlates to a higher
degree of laser beam scattering that leads to a higher noise level in the gathered point
cloud [52]. Additionally, if the surface is shiny, e.g. aluminum or machined steel, then the
accuracy will be severely affected since diffuse reflection is required to align the camera with
the projected laser line, which is difficult for shiny surfaces [6].
There are several other material properties that affect the quality of scanning results
through the reflectivity and roughness of the surface material [18]. Free-form surfaces, are
common in many design and manufacturing fields such as marine propellers, is a good exam-
ple. These surfaces contain a complicated sculpture that could potentially lead to a higher
magnitude of errors if the measurements are not precise [13].
There are other factors that may potentially affect scanning quality. Scanning speed is
one of the measurement parameters that needs to be fully explored before using 3D scanning
technology for inspection purposes [13]. Furthermore, using scanners with higher resolution
could potentially enhance the quality of gathered point cloud [53].

73
Although the scanning speed and resolution were mentioned in previous studies, the
effect of changing these parameters on the scanning quality remains unknown. In this chap-
ter, scanning speed and resolution are considered in conjunction with the previously studied
parameters, i.e. standoff distance and view angle, to investigate their influence on scanning
quality.
3.3 Methodology
In this work an experiment was designed with systematically varied scan parame-
ters to study the effect of scanning speed and the resolution on the quality of the collected
point cloud. This research examines the factors affecting scanning quality in order to obtain
the least amount of noise in the scanning results and minimize the post processing efforts.
Although the parameters of interest for this research are speed and resolution to test the
methodology, an experiment was done involving parameters already discussed in the liter-
ature such as the standoff distance and view angle to make sure that the analysis of the
results is correct. The findings confirmed the literature by using Root Mean Square (RMS)
of the deviation.
Figure 3.1: The Test Setup with the 3D scanner mounted to the robot and the white boardas the flat surface
The scanning errors are generated from the actual 3D scanner being used.There are

74
multiple factors that contribute to the scanning error. For example, in 3.2, the scanning
error is noise in the surface, which does not represent the actual defect in the object. These
errors are greater when the surface is not straight and the view angle of the scanner is not
perpendicular to the scanner.
Figure 3.2: The shape of the scanned point cloud representing the defect.
There are n number of data points, and each data point is represented by a point
in the x-axis, y-axis, and z-axis, which form d as shown in equation 3.1 below where dn is
an individual point on the surface of the scan. The scanning errors can be determined by
a point-to-point objective quality metric which is based on comparing the scanned model
with the CAD model and calculating the Root Mean Square Error (RMSE) of the variations
[77]. For additive re-manufacturing, this would theoretically be the difference between the
captured point cloud and the actual damage observed on a part. This functions by obtaining
the value of the mean distance (root mean square error of distance), which is the change in
the Z-axis between the scanned model and the CAD model. The ideal RMSE value is zero,
meaning the lower the RMSE value, the closer the scan is to the CAD model.However, this
is rare as the scanner collects noise because it is functioning due to many factors, some of
which can be avoided while others can not. In Figure 3.2 the noise inside the circle does not
come from the actual part, and in the part where the surface is smooth, the noise came from
points in air and not on the actual surface made by the scanner while scanning.

75
EScanning = ERMS =
√1
n(d21 + d22 + d23 + ...+ d2n). (3.1)
where dn = ∆nscan − ∆nCAD (3.2)
3.4 Systematically Varied Scan Parameters Experiment
The objective of this task is to understand the impact of point cloud measurement pa-
rameters on scanning quality. Collecting a large point cloud data with systematically varied
scan parameters is important for understanding the impact of those parameters. Automated
point cloud measurement is critical to isolate all sources of variation caused by manual scan-
ning. In this experiment the approach used was obtaining a sufficient database of physical
measurements using the automated point cloud measurement test bed with varied scanning
parameters by mounting the scanner to a robot to have a precise measurement that can be
repeated and distinguished with different levels. In Figure 3.3 six tasks were accomplished
in this experiment. First, a design for the test bed was made taking in consideration the
limitation of the robot and the capability of the scanner used. Second, the experiment was
designed and all the possible factors that are going to be studied along with the interaction
of the other parameters were identified. Third, the levels were identified for each factor after
knowing the limits of the view angles and the standoff distance then the scanner can function
on. Fourth, the data was collected and the actual experiment was performed. Fifth, the right
method was selected to compare the data. Sixth, the data gathered with the CAD model of
the part being tested were compared. Following are the factors tested and the levels used in
the experiment for the four parameters. The angle in which the scanner is in relation to the
object being scanned is shown in Figure 3.4
The distance between the scanner and the object being scanned is shown in Table
3.4 and can be seen in Figure 3.4 as the offset Z. Scan line resolution of the experiment are
shown in Table 3.5. The speed in which the joints of the robot are moving while preforming

76
Figure 3.3: The steps taken to design and perform the experiment
Table 3.4: Standoff Distance Levels
Level Value1 11 Inch2 8.8 Inch3 6 Inch
the scanning process is defined as the scanning speed.The speed in relation to the robot
maximum speed and how the robot is using it are shown in Table 3.6. Because the robot is

77
Figure 3.4: the scanner view angle in relationship to the part being scanned
for education purposes, the maximum speed limit is 1500mm/s at 50% which this means for
the values in Table 3.6, the speeds of 5 to 25% are 150mm/s to 750 mm/s. After doing the
previous experiment and getting the results, another experiment was designed using different
levels and only the concerned parameters to validate the findings. In the new experiment
levels were rearranged in ascending order and increments were even for both the speed and
the resolution. The resolution levels for the new suggested values for validation are in Table
3.7
Therefore, the speed levels for the new suggested values for validation are in Table
3.8. These tables were selected based on observations from previous experiments and the
limitation of the scanner. In this experiment the speed levels were higher than the first
experiment as the change in the speeds was not noticeable because the values were set up
next to each other and there was little change in each level. In this experiment the limits of
the robot and scanner were identified to distinguish the effect of the change in the speed on

78
Table 3.5: Scanner resolution
Level Value1 1.0mm2 0.8mm3 0.2mm
Table 3.6: The Speed Levels
Level Value1 5%2 15%3 25%
the point cloud collected, and the maximum speed changed from 25% the maximum speed
of the robot to 45% of the maximum speed to make the values spread across the spectrum
of the range. These values translate to 150mm/s to 1350 mm/s.
3.5 Aim of the Experiment
To address this gap, this research seeks to answer the question of whether the quality
of the point cloud is affected by changing the speed and resolution while scanning. In order to
do this, these parameters need to be further studied to identify their effects on the scanning
quality. This is important to give any future recommendations or to design a better scan
trajectory, the effect of the parameters changes must be known to see if it is significant or not
in order to design trajectories and select the appropriate parameters to perform a specific
scanning task.
3.6 Approach
All the experiments were conducted with all the given levels and parameters, and the
results were analyzed. It is better to over sample and work on a larger surface and keep
the record to avoid redoing the experiment. Therefore, a trajectory was created to study
multiple aspects in one run. The trajectory studied the repetition of the movement of the

79
Table 3.7: Scanner resolution
Level Value1 1.0 mm2 0.6 mm3 0.2 mm
Table 3.8: The Speed Levels
Level Value1 5%2 25%3 45%
robot over a specific section, which was the center of the flat surface. The data can be used
when necessary to also test the effect of the direction of the movement from right to left or
left to right along with the other parameters in each and every iteration as shown in Figure
3.6. The points selected on the white board are marked with a small marker and matched
with the location of the trajectory, created in Figure 3.6 ,when the robot is moving.
A small section was cut from the collect point cloud and the analysis and results were
based only on this section, as seen in Figure 3.7
3.7 Results
The gathered point cloud is shown the following three figures, which represent a
scan of exactly the same shape using the same pattern, standoff distance, view angle, and
resolution. The only difference is in the speed in which the scanner is moving with. As can
be seen in Figure 3.8, there are many empty spots due to the speed in which the scanner is
moving, and this is at level 1 in the experiment Figure 3.9 shows the point cloud when the
speed is at level 2 in the experiment, Figure 3.10 shows the point cloud when the speed is
at level 3.
The collected point clouds were segmented, and the area under study shown in Figure
3.7 was compared to the original CAD model. This area was selected because it has no scan

80
Figure 3.5: The scanner attached to the robot with the white board in place
Figure 3.6: The scanner Path in the experiment

81
Figure 3.7: The area selected for the analysis
Figure 3.8: All parameters fixed except speed at highest setting at 25% equal to 750 mm/s.

82
Figure 3.9: All parameters fixed except speed at medium setting at 15% equal to 450 mm/s.
Figure 3.10: All parameters fixed except speed at lowest setting at 5% equal to 150 mm/s.

83
repetition, which is part of the scope of the study. Results were analyzed using analysis of
variance (ANOVA) and also Pearson correlation. The results of the 81 experiments with
all four factors with three levels shows that all four factors are significant as can be seen in
Table 3.11. This confirms the literature regarding the standoff distance and the view angle.
This also proves the validity of the algorithm and the tool used to analyze the point cloud.
Table 3.9: View Angle Levels
Level Value1 70°2 80°3 90°
As can be see in the table, the change is negative in the increment in the levels of
the view angle and the stand off distance, because the levels are in descending order as can
be seen in Table 3.9. For the view angle, the lowest level (1) has the highest deviation from
normal in the angle and the highest level (3) has the lowest deviation from normal. Table
3.4 shows that the stand off distance of the lowest level (1) has the highest distance from the
part and the highest level (3) has the lowest distance. This is unlike resolution and speed
where it is arranged in ascending order as can be seen in Table 3.5 where the resolution
lowest level (1) has the lowest resolution and the highest level (3) has the highest resolution.
For speed as shown in Table 3.6, lowest level (1) has the lowest speed and the highest level
(3) has the highest speed. The error is decreasing as we head toward the norm for the view
angle and as we decrease the distance. and it is increasing as we increase the speed and the
resolution as can be seen in Figure 3.11

84
Table 3.11: ANOVA table
Source DF SS MS F PView Angle 2 3.9476 1.9738 4.58 0.013
Standoff Distance 2 5.4058 2.7029 6.28 0.003Resolution 2 37.4559 18.7279 43.48 0.000
Speed 2 7.3822 3.6911 8.57 0.000Error 72 31.0107 0.4307Total 80 85.2022
Table 3.12: ANOVA table
Table 3.10: Factors and levels
Factor Type Levels ValuesView angle fixed 3 1, 2, 3Standoff dist fixed 3 1, 2, 3Resolution fixed 3 1, 2, 3
Speed fixed 3 1, 2, 3
ANOVA: Response 1 versus View angle, Standoff distance, Speed, Resolution
Analysis of Variance for Response
As can be seen from Figure 3.13 after analyzing the data for validation, the error
is increasing as we increase the speed and resolution. The same results were found for the
initial experiment. However, the curve is not identical due to the different values that were
selected for the validation experiment as can be seen in Table 3.5 for the resolution and
Table 3.6 for the speed in comparison with Table 3.7 and Table 3.8, respectively.
It is increasing as we increase the speed and the resolution as can be seen in Figure
3.13
General Factorial Regression: Average error versus Resolution and Speed
Using Pearson correlation to validate the relationship of the change of the speed and
resolution on the quality of the point cloud, a positive correlation were found as can be seen

85
Figure 3.11: Plot of the standoff distance view angle speed and resolution
Figure 3.12: Interaction plot of the speed and resolution

86
Figure 3.13: plot of the speed and resolution
Figure 3.14: Interaction plot of the speed and resolution

87
Table 3.13: General Factorial Regression Factors and Levels
Factor Levels ValuesSpeed 3 1, 2, 3
Resolution 3 1, 2, 3
Table 3.14: Analysis of Variance Resolution and Speed
Source DF SS MS F PModel 8 432.373 54.047 162.28 0.000Linear 4 295.701 73.925 221.96 0.000Speed 2 69.068 34.534 103.69 0.000
Resolution 2 226.633 113.317 340.24 0.000Interactions 4 136.672 34.168 102.59 0.000
Error 18 5.995 0.333Total 26 438.368
in Table 3.15 and 3.16 this means that as the speed increase the is an increase in the noise
or error in the point cloud. Table 3.15 shows the correlation for the experiment where I used
all the four parameters, while Table 3.16 shows only for the validation experiment where I
only studied the speed and the resolution.
Table 3.15: Pearson correlation results for the 81 experiments
Factor correlationSpeed 0.2905554
Resolution 0.5834091
After validation see Table 3.16
Table 3.16: Pearson correlation results for the 27 experiments
Factor correlationSpeed 0.3953238
Resolution 0.6239086

88
3.8 Limitations
In this experiment and analysis the movement direction was not part of the study, and
the impact of repetition over the same area was not investigated. Each path was performed
once over the same area. It was also assumed that there is no influence from the robot
movement or vibration on noise created in point cloud as the robot is rigid and carries heavy
items and our scanner is a very light scanner. Experiments were performed on a white matte
surface and the results shown are only for this surface. The effect on different surfaces is not
known but assumed to be the same. Finally the effect of ambient light was assumed to be
irrelevant as the experiments were performed at the same time of day over several days.
3.9 Strategies for Improving the Point Cloud Quality
There are many strategies for improving the point cloud quality some of it related
to the parameters while other are related to point Cloud Post Processing. Although post
processing decrease the noise in the gathered point cloud, It can add up to the overall error
in the point cloud if the wrong methods were used. Also, It is very important to select the
right parameters and avoid collecting a large point cloud when the surface being inspected
do not require a high resolution due to the surface simplicity. This leads to the importance of
knowing the right parameters as it reduces the demand for processing power that consume
time and resources. In the experiment with a simple flat surface it was evident that the
increase in the resolution do not increase the quality of the gathered point cloud and in
fact it adds to the error in the point cloud and thus selecting the right resolution level
is important. With surfaces that has curvatures and arcs, it is important to increase the
resolution of the scanner as it will capture the curvatures in a higher precision and will
decrease the error in the point cloud. Smoothing and cleaning the point cloud can add to
the overall error and will be shown in chapter 4 and this makes studying the parameters and
increasing the accuracy of the scanner a very important task for the point cloud to be used
for manufacturing and remanufacturing applications. Also, working in improving a good
scanner point cloud is better than improving the point cloud that has a huge noise and this

89
leads to the importance of studying the parameters and the scanning procedures over the
post processing of the point cloud.
3.10 Summary
As can be seen regarding the scanner used and the speeds that were selected, the
change in the speeds was significant along with the change in the resolutions. Changing the
resolution should result in a better results. However, that occurred to a certain extent, and
then the effect become negative as the point cloud size got bigger and resulted in error as
the point being sampled and calculated was higher. Therefore, further study is needed to
make a final conclusion. The significant effect of the standoff distance and the view angle
on the scanning quality was also confirmed in this experiment, and it supports the findings
from the literature.
The future plan is to test the scanner using higher speeds and compare these results
to generalize the findings. Then the scanning parameters need to be connected to the defect
in the point cloud to monitor the quality of the manufactured parts. Therefore, machine
learning most be used to predict the changes in the parameters on the point cloud. Knowing
the effect of the parameters on the point cloud is important to compensate for it in the future
steps in the re manufacturing digital thread an to reduce the effect of the parameters by
having the right parameters for the scanner by setting up the optimal trajectory to preform
the scanning task.

90
CHAPTER 4: ERROR PROPAGATION IN DIGITAL ADDITIVE
REMANUFACTURING PROCESS PLANNING
4.1 Abstract
A point cloud is a digital representation of a part that consists of a set of data points
in space. Typically point clouds are produced by 3D scanners that hover above a part and
record a large number of points that represent the external surface of a part. Additive re-
manufacturing offers a sustainable solution to end-of-use (EoU) core disposal and recovery
and requires quantification of part damage or wear that requires reprocessing. This chap-
ter proposes an error propagation approach that models the interaction of each step of the
additive remanufacturing process. This proposed model is formulated, and results of the er-
ror generated from the parameters of the scanner and point cloud smoothing are presented.
Smoothing is an important step to reduce the noise generated from scanning, knowing that
the right smoothing factor is important since over smoothing results in dimensional inaccu-
racies and errors, especially in cores with smaller degrees of damage. It is important to know
the error generated from scanning and point cloud smoothing to compensate for the following
steps and generate appropriate material deposition paths. Inaccuracies in 3D model renders
can impact the remainder of the additive remanufacturing accuracy, especially because there
are multiple steps in the process. Sources of error from smoothing, meshing, slicing, and
material deposition are proposed in the error propagation model for additive remanufactur-
ing. Results of efforts to quantify the scanning and smoothing steps within this model are
presented.
4.2 Introduction
To be more sustainable and reduce material waste, Nasr et al. [78] suggested the
use of remanufacturing as it plays a significant role in value recovery. Due to the flexibil-
ity of additive manufacturing processes, it offers a sustainable solution to end-of-use (EoU)
core disposal and recovery [61, 62, 63, 64]. Despite the advantages and potential of addi-

91
tive manufacturing (AM), the accuracy of the geometry continues to be a limitation to its
wider application [60]. While physical processes are important factors in the overall quality
of manufacturing, failed builds were found that can be traced back to errors in the digital
translations, with leads to the actual physical processes [60]. These errors are relevant to
additive remanufacturing applications that aim to leverage additive processes for targeted
material deposition and part reprocessing to original equipment manufacturer part specifica-
tions [79]. Thus far, error propagation in the digital thread of the additive remanufacturing
processes has not been realized. Rickli et al. (2014) [9] describe a framework for an addi-
tive remanufacturing system that uses a 3D laser-line scanner to capture external defects.
This framework is divided into three parts: condition assessment and digitization, material
deposition, and re-processing and inspection. The steps that are taken in the condition as-
sessment and digitization phase of this additive remanufacturing framework are scanning,
smoothing, meshing and slicing, leading to tool path planning for material deposition (Fig-
ure 4.1). In this chapter, the focus is on the processes that affect the point cloud in order
to use it in additive remanufacturing applications. Essentially, the defective part is received
by a remanufacturing facility. The first step is to collect the 3D point cloud of the damaged
part; there is some noise that the point cloud contains and this leads to the second step,
smoothing the point cloud to reduce noise. In order to generate the tool path plan for ad-
ditive remanufacturing, a meshed point cloud is needed to be used for slicing, Slicing is the
plan for the material deposition in regard to the trajectory and the thickness of the layer in
the additive manufacturing process and the actual material deposition. Smoothing reduces
the noise in the point cloud and makes the neighboring points closer in features because it is
based on the averaging of neighboring points. To generate the smoothed surface, points that
are noise and not near the surface must be eliminated first; then a smoothing algorithm can
be implemented. Smoothing is important to clean out errors that are not actually present
in the object under the remanufacturing process, so this step is important as it influences
subsequent meshing and slicing steps.

92
Figure 4.1: Flowchart of the main steps of EoL core condition assessment and digitization[9]
In this work experiments were conducted that demonstrate the error propagated in
the remanufacturing digital thread. The focus of this chapter is on how the different steps
in the remanufacturing process contribute to the overall error as each step adds up to the
overall error. Specific contributions are: (1) The importance of the scanning factors in the
remanufacturing digital thread and the overall error propagation in the process, and (2) The
effect of the smoothing on error propagation and the effect it has in the remanufacturing
process. The remainder of this chapter is organized as follows. Section 2 proposes error
propagation models and outlines steps in the additive remanufacturing process. Section 4
present the results of the scanning and smoothing process within the context of additive
remanufacturing, and section 5 presents the conclusions and future work.
4.3 Methodology
In this section, the proposed model for how the error is propagated in additive re-
manufacturing from the scanning to the material deposition is explained. Figure 4.4 lists

93
the digital additive remanufacturing factors that are considered in the proposed model in
this chapter. Scanning is the first step, and it has the initial effect as it is the phase that is
collecting the point cloud that is the base for subsequent steps that work on this collected
point cloud. Smoothing work on the collected point cloud from the scanner removes outlier
data points or brings it closer to the surface and reduces the error generated by the scanning
phase. However, sometimes smoothing increases the error in the point cloud depending on if
the outlier feature is present on the scanned object or it is just a noise in the scan. Meshing
is transforming the point cloud by the creation of vertices, edges and faces which defines the
shape of a polyhedral object to prepare the model for slicing. Depending on how dense is
the point cloud this can adds up to the overall error as the dense point cloud represent the
surface with more details and preserve the important features as shown in Figure 4.2 by [80]
Slicing uses the mesh generated from the smoothed point cloud to create a material
deposition path plan for additive remanufacturing. Depending on the layer height the error
can be added or decrease as using a higher layer height increase the error in the manufactured
part as it is not confirming to the features in the object as shown in Figure 4.3 by [81]
. Material deposition is the final phase in which the plan that was generated from
the part scan is executed.
There are errors generated in all the activities above, and the overall error equation
4.1 is listed below. It sums all the errors from additive remanufacturing steps, Figure 4.4.
Here, error is defined as the difference between the scan, mesh, or slicing and the dam-
age/defect geometry that is being remanufactured. The error generated from each of these
steps is explained in detail in the following subsections. Since the objective of additive re-
manufacturing is to correct a damaged part, it is critical that the damage be captured and
planned for accurately.
ETotal = Escanning + Esmoothing + Emeshing + Eslicing + Eprinting (4.1)

94
Figure 4.2: Effect of the density of the point cloud on preserving the features
4.3.1 Scanning Error
Scanning errors are generated from the actual 3D scanner being used. There are
multiple factors that contribute to scanning error, in Figure 4.5 show that the scanning
error is noise on the surface that does not represent an actual defect in the object. These
errors are greater when the surface is not straight and the view angle of the scanner is
not perpendicular to the scanner. Changes in scanner parameters affect the quality of the
gathered point cloud. Thus, it is important to select the right parameters when scanning a
part for remanufacturing to get a quality point cloud that is efficient for smoothing, meshing,
and slicing steps..

95
Figure 4.3: Effect of the slice height on the manufacturing error
Figure 4.5: The shape of the scanned point cloud representing the defect
The scanning errors can be captured by comparing the scanned model with the CAD
model and calculating the Root Mean Square (RMS) of the variation in comparison to the
CAD model, classified by Javaheri et al. [77] as point-to-point objective quality metrics. For
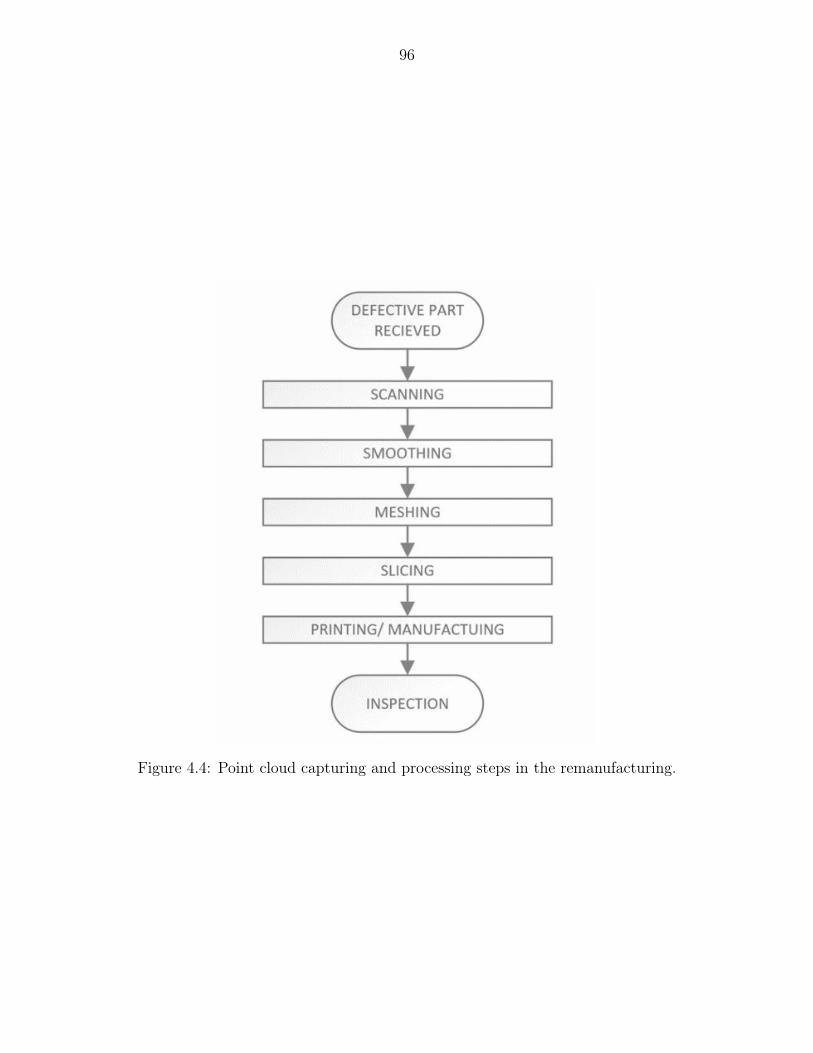
96
Figure 4.4: Point cloud capturing and processing steps in the remanufacturing.

97
additive remanufacturing, this would theoretically be the difference between the captured
point cloud and the actual damage observed on a part. This functions by obtaining the value
of the mean distance. d_RMS is equal to the root mean square of the distance, which is the
change in the Z-axis between the scanned model and the CAD model. The lower the RMS
value the closer the scan is to the CAD model, and the ideal is 0. There are n number of
data points and each data point is represented by
EScanning = dRMS =√
1/n(d21 + d22 + d23 + + d2n) (4.2)
dn = ∆nScan − ∆nCAD (4.3)
4.3.2 Smoothing Errors
Smoothing errors are generated from processing the point cloud after it was scanned.
In Figure 4.6 below the smoothing reduces some of the noise data that are on the surface.
However, although a smoothing algorithm cleans the point cloud, it can lead to errors in
capturing the volume/surface. Therefore, some of the details necessary in the digital repre-
sentation of the part might get compromised depending on the number of iterations and/or
the smoothing factor.
Figure 4.6: The shape of the scanned point cloud representing the defect after smoothing.
Numerous smoothing techniques exist that aim to reduce noise without affecting
the accuracy of the scanned point cloud. For instance, Laplacian smoothing is a localized
moving-point average smoothing function that takes the surrounding points and calculates

98
the average as it is moving from one location to another. This transforms the points in
the point cloud to a new location based on the smoothing factor. The ’Smoothing Factor’
essentially determines the influence of the nearest neighbors in point relocation. The higher
the ’Smoothing Factor’, the more influence the nearest neighbors have, thus leading to more
smoothing. The comparison between the CAD and the scanned data is calculated by equation
4.4.
ESmoothing =k∑i=1
min(Ps − PCAD)2 (4.4)
Where k is the number of adjacent vertices to node i, x̄j is the position of the jth
adjacent vertex and x̄i is the new position for node i. and ESmoothing is the error between
the point cloud after smoothing and the CAD model were ps is the point cloud scanned and
pCAD is the point cloud from the CAD model
4.3.3 Meshing Error
Meshing is the process of converting the scattered point cloud into triangles. Although
this step may not essential in additive remanufacturing processes, it remains a part of digital
processes due to practical reasons [60] as it offers a convenient interchange format to share
the file without sharing the CAD file [82]. In Figure 4.7, meshing uses the point cloud to
make a triangular mesh; therefore, when the number of the point cloud is low the curved
surfaces may be sharper and more accurate as can be seen in the bottom of the groove
compared to Figure 4.6.
The sources of the errors are dependent on the first two activities. In addition, the
size and the density of the point cloud around the curved and detailed area affect the overall
error. A larger point cloud will theoretically decrease the meshing error as it represents a
higher details to the actual model as possible. Equations 4.4-4.7 are based on Sikder et al.
[81] regarding slicing error, but they share similar concepts in calculating the error, When
triangles are generated depending on a location of the triangle and the shape it takes, some

99
Figure 4.7: The shape of the scanned point cloud representing the defect after meshing thepoints.
features might be omitted or altered, for example, the circular shapes become more like n-gon
(a polygon with n sides) shapes depending on the number of faces. The error is calculated
by the difference between the faces and the CAD model. Meshing error where ef is the
meshing error and EMeshing is the total surface error.
ef =
µ∑i=1
min(ν2i , η2i ) (4.5)
Surface error at ith face
εi =λ∑j=1
ep (4.6)
Total surface face error
EMeshing =k∑i=1
εi (4.7)
Where νi, ηi is the vertical and Euclidian distance to the vertical and horizontal plane
on the smoothed point cloud. By selecting the face of the represented shape closest to the
mesh of the CAD model of the object, the calculated error is the distance between the CAD
model and the triangulated mesh.

100
4.3.4 Slicing Error
In the slicing phase, the plan to create the material deposition or printing is done to
correcting the defect. The areas that need to be filled are shown in Figure 4.8 below, which
represent the point cloud of the defect aligned with the point cloud of the intact part.
Figure 4.8: The shape of the scanned point cloud of a defective part aligned with the scannedpoint cloud of an intact part.
The slicing error is generated when the defect geometry captured by the smoothed
point cloud and mesh is converted into slices for material deposition. In Figure 4.9, the
slicing plan shows that there are some small areas that are not covered due to the layer
heights specified during slicing. These gaps can change depending on the slice height.
Figure 4.9: The slicing material deposition plan.
Sikder et al. [81] suggested an adaptive slicing algorithm to minimize the error based
on the details needed at each layer. To minimize the surface error, they created an adaptive
slicing algorithm that minimizes the slice thickness; then they calculated the error by using
this technique. In Equation 4.8 the slicing error is calculated by the minimum distance
between each slice and the surface in the created mesh. This covers the empty area that

101
is considered error an by selecting the closest point from the point cloud to the mesh. The
calculated error is the distance between the triangle created in the meshing phase to the
slices created in this phase, which is represented by the white area shown in Figure 4.9
above. Equation 4.9 is the total error in that slice. Equation 4.10 is the total slicing error.
ep =
µ∑i=1
min(ν2i , η2i ) (4.8)
Surface error at ith face
εi =λ∑j=1
ep (4.9)
Total surface face error
Eslicing =k∑i=1
εi (4.10)
Where νi, ηi is the vertical and Euclidian distance to the vertical and horizontal plane
on the smoothed point cloud.
4.3.5 Printing Error
A printing error can be caused BY multiple factors in the printing process (the actual
material deposition) or from previous steps to the actual material deposition mentioned
(error 1-4) that might not completely cover the shape of the defect and thus generate a
slicing plan that does not completely fill the defect space or overfills the defect space as
shown in Figure 4.10.

102
Figure 4.10: Printing and actual material deposition error.
Material deposition errors that may exist include a missing filament in the extruder,
the inability to reach the specific location to add materials, and/or a smaller feature than
the layer height of the material to be deposited. Brown and Pierson (2018) [60] suggested
that errors are caused by three main sources: that include toolpath distortions, process
capability errors, and process interaction errors. The errors in this phase are not known until
the remanufactured part is inspected via destructive or non-destructive methods. Currently,
this error is represented as Eprinting and is planned to be estimated through experiments
in future research activities. The equations used for the scanning error can also be used to
study error in this step. As noted in equation 4.1 the overall error in printing is an error
propagated through the four previous steps, and it is shown into the inspection phase where
the CAD model is compared with the gathered post production point cloud.
4.4 Experimental Design
Experiments were conducted based on scanning four models including three increasing
degrees of defect, 2mm, 5mm and 8mm, and a blank model containing no defect. (The
number corresponds to the depth of the defect). Each model was scanned three times at a
resolution of 0.5mm. Consistency between scans of identical models was confirmed by using
exactly the same path and attaching the scanner to a robotic arm
The selection of the resolution at 0.5 mm showed that it produces the least error
based on the selected settings. And the speed, standoff distance, and view angle were ideal
to ensure that the errors are at minimal levels. Figure 4.12 (below) shows the obtained

103
Figure 4.11: blank (top left), 2mm defect (top right), 5mm defect (bottom left), 8mm defect(bottom right).
Figure 4.12: 8mm defect model with noise after removing the surrounding area from thescanned data.
point-cloud of the 8mm defect model.
The model above was selected to compare the 8mm defect scan with the blank scan.
Registration was needed to place the scan and the CAD model in the same coordinate system.
The iterative close point algorithm (ICP) was used to roughly align the scans. Total errors
are the summation of all the errors from all the processes. Scanning properties were set to
ensure the best quality generated point cloud. A Metra-Scan 3D laser scanner was used to
digitize parts. The scanner was bolted to the end-effector of a six-axis robot arm. The scan
path was automated and chosen to fully cover the top surface of the part at a scan speed
that ensured complete coverage. The scanner was prompted to begin scanning while the

104
part of interest was outside of the scanners capture frame as points in the initial scanning
frame are often noisy or lost by the scanner. Lastly, to ensure that surrounding objects
would not be included in the scan, the part of interest was raised up from the scanning
table by a thin support that was undetectable by the laser-scanner as it moved on the scan
path. In total, four models were scanned including three increasing degrees of defect, 2mm,
5mm and 8mm, and a blank model containing no defect. (The number corresponds to the
depth of the defect). Each model was scanned 3 times at a resolution of 0.5mm. Consistency
between scans of identical models was confirmed at a later point. Isolating the defect is key
to evaluating the smoothing process via the ’Data Comparison’ step. Without isolation, it is
challenging to distinguish the effects of smoothing on the defect vs the effects on the entirety
of the model. After the scan was performed, every point in the point cloud was represented
and for each point the algorithm finds the nearest point to it in comparison to the blank
that has no defect. Then the normal of each point was calculated, and from the normal the
distance between the point was calculated. If the angle is less than the threshold, then the
point chosen is inlier. Otherwise, if it exceeds the threshold, the point is outlier see Figure
4.13.

105
Figure 4.13: Threshold Distance and Threshold Angle Defect Detection Strategy.
The difficulty in defect detection is distinguishing defect points that are close to the
blank surface. A distance comparison can only operate on a range outside of the resolution
of the scanner, in this case 0.5 mm. This means that any points within 0.5mm of the actual
surface are not captured. To compensate for these points, an angle comparison strategy
was used that compares the vertex normal of each point in the defect point cloud to the
corresponding point on the blank point cloud. The vertex normal was calculated in Matlab
by fitting a plane to the nearest neighbors of the point of interest. The shape comparison
algorithm by Avagyan et al. [83] was used by performing a detailed comparison of the
shape of a model by geometrically adjusting its rotation and translated so they are in the
same workspace with the scanned data using new viewpoint algorithms that they developed.
The metric used involves measuring the height and width of the defect at each stage in
the smoothing process. In this research, the ”Number of Iterations” was kept constant at
20 iterations, and the ”Smoothing Factor’ varied from 0.1 to 1.6. Figure 4.14 depicts the

106
Figure 4.15: Normalized Depth of 8mm and 2mm Defect Models.
dimensions that were measured. The height is the depth of the defect and the width is the
width of the defect. The green line is the actual collected scan data and the purple line is
the CAD model.
Figure 4.14: Height and width dimensions.
4.5 Results and Discussion
The major results are summarized in Figure 4.15 and Figure 4.16 (below). The
graphs plot the normalized height and width on the y-axis and the smoothing factor on the
x-axis. The normalization is the measured value divided by the expected value, thus the red
horizontal line (at 100%) represents the true value of the defect, for reference.
Both Figure 4.15 and Figure 4.16 show the ’2mm Defect’ being more affected, rela-
tively, by increasing smoothing in comparison to the ’8mm Defect’. At a smoothing factor

107
Figure 4.16: Normalized Width of 8mm and 2mm Defect Models.
of 1.0, the depth of the ’2mm Defect’ was 50% of its original value while the depth of the
’8mm Defect’ was 85% of its original value. Similarly, at a smoothing factor of 1.0, the width
of the ’2mm Defect’ was 230% of its original value while the width of the ’8mm Defect’ was
130% of its original value. In absolute terms, at a smoothing factor of 1.0, the depth of both
defects was smaller by about 1 millimeter, and the width was larger by about 2.5 millimeters.
Error was more significant in measuring the width than the depth of the defect, as made
obvious by the larger error bars in Figure 4.16. Due to the nature of the defect detection
algorithm, points very close to the surface were not always recognized. This made it difficult
to accurately define the width of the defect region. In Figure 4.17, this is illustrated by the
widening of the contact point between point clouds, as the smoothing factor is increased.
However, the depth measurements were unaffected by this, and any error in depth can be
attributed to noise in the scan. Figure 4.17 (below) shows the evolution of the defect point
cloud as smoothing is increased. Initially, increased smoothing rounds the left edge of the
defect point cloud (orange) and flattens it near the face of the blank point cloud (blue).
However, at a smoothing factor of 1.5 noise is generated within the defect point cloud, but
at a smoothing factor of 1.6, the defect point cloud blows up.

108
Figure 4.17: Point cloud evolution as smoothing factor varies from 0.1 to 1.6
In theory, over smoothing should continually flatten the defect point cloud; however,
in the case of Laplacian smoothing, the point cloud starts expanding after a certain smoothing
factor. Noise is generated as points try to move farther away from the actual surface, resulting
in a much less accurate point cloud. This makes it important to carefully select the right
smoothing factor. When taking the part with an 8mm defect and comparing the scanned
data with the CAD model the RMS was 0.218 mm. After smoothing the part with an 8mm
defect and comparing the scanned data with the CAD model the RMS was 0.20264; this is
better than the prior smoothing that was 0.21851 mm. In this work error generated in the
two studied phases were calculated. In the scanning phase, errors were generated due to
two sources, systematic variation and random variation. The systematic errors are related
to the factors that being used while executing the scanning process and are repeatable. The
random errors are not related to factors being used dependent on where the part is located or
the material of the part being scanned. In the second phase, smoothing, errors are generated
due to the use of the wrong smoothing factors in the smoothing process; this increases the
error in the scanned model and move or omit necessary feature in the scanned part. In the
experiment, E-scanning and E-smoothing were calculated; the E-scanning was calculated to
be +/- .218, and the E-smoothing was calculated to be +/- .20264. The total error for the
first two phases is calculated in the following equation 4.11 the error is either negative or
positive depending on the direction of the error. If the material deposition or the point cloud
is getting less material to be deposited, then the error is negative. Otherwise, the error is

109
positive.
Etotal two phases = ±EScanning ± ESmoothing (4.11)
The remaining phases of the digital additive remanufacturing steps are currently being
studied. However, it is important to study all the phases and calculate the overall error and
later introduce a way to compensate for the error in the following step. Errors are not
necessarily positive enough where it need to be subtracted; sometimes the error is negative
and can be compensated for in the next phase by adding more material or decreasing some
material to get the intended outcome.
4.6 Summary
Remanufacturing consists of three sub-processes: condition assessment and digitiza-
tion, material deposition, and reprocessing and inspection. This research aimed to improve
the condition assessment and digitization phase by studying the effect that all the steps have
on the point cloud quality used in the remanufacturing preprocessing. Scanning parame-
ters influence the captured point cloud accuracy, and smoothing has an effect on correcting
the point cloud to a certain extent. Inaccuracies in the digitization of end-of-life cores can
result in incomplete material deposition and a failing additive remanufacturing procedure.
The next step in this research is to quantify the error generated by meshing, slicing, and
printing and how to compensate for it either positively or negatively in the prior or later
activity. Outcomes from this work will aid researchers in creating point-cloud pre processing
programs by knowing the effect of all the steps, integrating it in the planning phase of the
remanufacturing activities, and designing a reconstruction plan for a defective part that is a
crucial element in the additive remanufacturing framework.

110
CHAPTER 5: USING A PREDICTIVE MODEL TO OPTIMIZE
THE PARAMETERS OF A CT SCANNER
5.1 Introduction
Although computed tomography (CT) scanning technologies have been well used to
inspect a wide range of products, due to their inconstant material density and thickness, the
CT scanner always requires an adjustment to the scanning parameters whenever a new object
is loaded. This disadvantage makes the scanning process tedious and requires the involvement
of a technician to execute the inspection task for the adjustments. Besides, the performance
is not guaranteed every time. Thus, selecting the right scanning parameter is crucial to
avoid wasting time as repeating the process can lead to a catastrophe in the manufacturing
process if the decisions are not made about the production promptly and correctly. In order
to improve the scanning parameter decision-making process, the Wenzel exaCT-S device
was tested. Perception based on the that machine learning-based CT scanning parameter
predictive method should be accessible in Wenzel’s CT scanning software was tested. The
users would be prompted to type in the density and thickness of the scanned item, and
then the tool would use the inputs as the basis to simulate the scan setting and output
a set of suggested parameter ranges that likely provide error-free scans. These predictive
suggestions could reduce the time required to set scanning parameters (more valuable in
future automated scanning procedures) and, if combined with continuous data collection in
the future, predict wear or defection in a machine (i.e., scanning parameters that previously
worked are no longer sufficient). 3D scanning technology has been developed for several
years and classified by contact and non-contact types; the non-contact solution is further
divided into active and passive forms. CT scanning belongs to active non-contact scanning
technologies. Combining CT scanning with additive manufacturing is a popular research
topic. Karme, A. et al. determined the possibilities and limitations of using CT-scanning as
a quality control method in laser additive manufacturing (LAM) fabricated parts [84]. Du
Plessis, A. et al. reviewed additive manufacturing (AM) applications, such as porosity and

111
defect analysis, volumetric density measurement, dimensional measurement, deformation,
surface roughness or topography, multiscale CT and fast scanning, powder analysis, multi-
materials, and also discussed the practicality and limitations of each [85]. Researchers mostly
focus on product design measurement or defect analysis, but there have been few studies on
how to improve the CT scanning setup, which is essential for the subsequent scanning process.
Hothorn, T., and Lausen, B. derived a classifier with good performance on clinical image
data to reduce glaucoma misclassification errors by comparing bagged classification trees
(bagged-CTREE) to single classification trees and linear discriminate analysis (LDA) [86].
Considering that they introduced a knowledge-based decision support strategy to support
routine clinical work, it is also helpful that a decision support model, such as a predictive
method, can be applied to the scanning process.
This technology is related to the 3D scanning as they both has a scanner that can
use different parameters to scan and gather the dimensional information. However, the CT-
scanner can gather the internal structure as well. The methodology used was discussed in
section 2 were a predictive model was made to optimize scanning setup parameters of a CT
scanner with object density and thickness. In section 3, The results about the accuracy of
the model were reveled and the results and discussions are and conclusion are in sections 4
and 5.
5.2 Methodology
Considering the property of a CT scanner, we designed 6 L shaped objects with
different materials in this research. Their shapes are approximately the same for machining
simplicity, and the material types are aluminum, clear plexiglass, brass, white nylon, black
nylon, oak wood,as shown from left to right in Figure 5.1.
The density of the selected materials varied from 0.688 to 8.1397 mg/cm3̂ by weighting
them on a high-precision scale, shown below in Figure5.2. The exaCT-S scanning parameter
setup process repeats for each sample material. After the scan parameter is set, the scan
performance can be evaluated by observable blue, yellow, grey, black, and white areas on

112
Figure 5.1: Six L shape objects for experiment and scanning
the user interface. The scan setting parameters with observations of no blue or yellow areas
are classified error-free scan setting parameters.
Figure 5.2: Selected materials weight on a high precision scale to calculate density
Collected observations use five different filters, three voltage levels, three current
levels, and three integration times in the experiment. In total, we collected 1620 observations
(6 type materials * 5 filters * 3 voltages * 3 current * 3 integration times * 2 thicknesses), of
which 70% were used to train a decision tree model (Figure 5.5) to predict and, 30% were
used to test the model as shown in Figure 5.3 below.

113
Figure 5.3: Confusion Matrix for good and bad prediction for the current gathered data with70% model and 30% testing
There are four parameters that the technician changes each time a new part is loaded
in the CT scanner. These input parameters are Filter Number, Voltage, Current, and Inte-
gration Time. The operator usually starts with the lowest filter and keeps adding the filter,
the voltage, the current and finally the integration time until there are no blue or yellow
spots in the software view. An experiment was designed to collect observations Various
materials were tested with known densities and thicknesses. A large number of experiments
were conducted, and all the observations were recorded. The observations were classified
from good to not good based on the background color and the part color in the scanning
software.A model designed to analyze the data to predict the good/bad outcomes can be
found in Figure 5.4
A decision tree classifier created 100 decision trees based on the given data gathered
in Table 5.17 these decision trees can be found in Figure 5.5.
Table 5.17: Decision Tree Classifier Parameters
Setting ValueNumber Of Leaves 20Minimum Leaf Instances 10Learning Rate 0.2Number Of Trees 100Allow Unknown Levels True
Using machine learning, a boosted decision tree was created to predict the outcomes of
the new given parameters based on the experimental observation. For each input parameter,

114
Figure 5.4: The model created to analyze the data predict the good/bad outcomes
Figure 5.5: Decision tree example

115
Figure 5.6: Wenzel exaCT-S device at Wayne State University
such as the thickness and the material density, a suggested range of material parameters is
predicted based on the historical data information.
5.3 Results
Through machine learning and classification algorithms, Wayne State University un-
dertook a pilot study to learn and predict viable scanning parameters for the Wenzel exaCT-S
device for a selection of material densities and thicknesses, as shown in Figure 5.6.
The material information is summarized below. Table 5.18.
Table 5.18: Material property information
Material Up Thickness/mm Bottom Thickness/mm Volume/cm3 Weight/mg Density (mg/cm3)White Nylon 10.52 36.15 17.89644 16.9 0.944Clear Plexiglass 11.13 37.95 18.86 22.43 1.19Black Nylon 11.07 36.4 19.17 26.93 1.405Brass 10.98 35.4 18.43 150.00 8.14Oak Wood 11.1 36.01 17.86 12.29 0.688Aluminum 11.15 36.32 18.54 52.03 2.81
The objective of this study was to demonstrate the ability to predict whether a scan-
ning process on the exaCT-S would be successful given the filter number, voltage, current,
integration time, material density, and material thickness. Results indicated that prediction
model could be applied to guide the exaCT-S device’s scan parameter selection process and
reduce the time required to converge to feasible scanning parameters favorably. The results

116
(as can be seen from the confusion matrix) showed the ability to predict a scan with errors
of 95% accuracy and 97% precision.
Figure 5.7: The accuracy of the model
These outcomes are promising and indicate that 1) the exaCT-S scan parameter
selection process may be enhanced by integrating machine learning classification models that
can suggest scan settings, and 2) more detailed studies are warranted to develop applicable
ready scan parameter prediction models as can be seen in the graph in Figure 5.7 .
5.4 Discussion
The improvement we suggest to the existing software is that when the user first opens
the software to scan, a pop-up window will appear called the assistive scanning tool. This
tool suggests proper setting parameters for the intended scanning part according to density
and thickness. This tool will have two empty boxes: 1) The first box will be for the material
density and 2) the second box for the thickness of the longest edge or the spot that needs to
be scanned. The pop-up windows or the application will be looking for approximate inputs
in a database saved in the cloud that are shared among all the users of the scanner, match
the model number, and suggest the four parameters. The user can click on and select the
suggested parameters or modify it and execute the scan. The settings will be sent to the

117
cloud if changed and will be saved in the software. After the scan is complete, another
pop-up window will appear and ask about rating the results of the performed scan. If the
user chooses to accept, then the previously shared parameters will be reinforced as good
scanning parameters; otherwise, it will be classified as bad scanning parameters. If a user
keeps reporting bad scans results to a selected parameter that is reported by many users
as good scanning parameters, then periodic maintenance is suggested to the CT scanner,
and the user can will receive a phone call within a week from the company suggesting the
service visit to replace the recommended part such as the reflector or do the recommended
preventive maintenance. Investing in a prediction model to preset the optimal settings for the
CT scanner can save the company money and reduce reliance on human capital to execute
the task; it can also lead to less demand on buying other inspection devices as it reduces
the bottleneck in the inspection stage. This model can be implemented and used for any
CT scanner across multiple companies and organizations by having the data gathered or
shared from similar CT scanners. This will provide a of understanding about the internal
components of the CT scanner and its effect on the scanning quality. For the scanner used
and the speeds that were selected, the change in the speeds was insignificant. Changing the
resolution results in better quality scans to a certain extent, and after that, it has a negative
effect. However, further study is needed to make a final conclusion The significant effect
of the standoff distance and the view angle on the scanning quality were confirmed in this
experiment, and it supports the findings of previous studies.
5.5 Summary
The preliminary results show that the prediction mode is accurate. Therefore, it is
feasible to work on an optimization model to predict the right parameters. Currently I am
working on several improvements and advancements to create an automated tool to predict
the optimal parameters just by knowing the thickness and density of the part. The model
has been created and many decision trees were generated to simulate different scenarios.
This model needs to be inverted to give the parameters instead of taking the parameters and

118
knowing if the scan results are good or bad. I am also investigating ways to improve the
scanning results by sharing the results across different platforms and connecting the gathered
images of objects to the cloud. I will share it when ready in future publications.

119
CHAPTER 6: CONCLUSION
3D scanning parameters strongly affect the quality of the point cloud. Without
knowing these effects and considering them in generating what is made might not be ideal
and can miss-lead the inspection process as it will create a point cloud with many errors. In
this dissertation, the focus was on studying the effect of the parameters on the point cloud
that add up to the total error in the inspection and re manufacturing application. Although
different parameters have been studied in the past and their effect was known, the effect
of the speed and the scanner resolution had not investigated, get their effect is significant.
For this work a robot was attached to the endeffector of a robot to make the experiment
precise and reproducible and to eliminate the external factors and have specific levels for the
parameters being tested. In chapter 2, we developed a link between the two work spaces,
the scanner and the robot cell, as they are not integrated and the relationship between the
two systems were not defined. A transformational relationship was found that can link the
location of any point in the robot work space back to the scanner work space,which will help
in knowing the points that will be collected and set the expectation of the scanner to the
points that will be gathered. In chapter 3, we designed an experiment using the 3D scanner
attached to the robot to investigate two additional parameters beyond than those studied
in the literature. A literature review was done to identify the studied parameters, and the
gap was identified. The two parameters that needed to be studied were the speed of the
movement of the robot arm and the scanner resolution. These two parameters were studied
along with two other known parameters in the literature. This was made to first validate
the findings of the literature and make sure that the methodology used in the comparison
was valid. The two parameters that were studied along with the speed and resolution are
the standoff distance and the view angle of the scanner in relationship to the surface being
scanned. The findings confirmed the literature and indicated that the changes in the speed
and the scanner resolution are significant in the errors being generated to the point cloud that
are not actually in the surface being scanned. In chapter 4, we proposed an error propagation

120
approach that models the interaction of each step of the additive remanufacturing process
by incorporating all the processes that the point cloud undergo. Typically point clouds
are collected in the first phases in the remanufacturing facility to identify the defects and
generate the appropriate remanufacturing plan. There are errors that come with this point
cloud due to the scanner parameters. These errors need to be added to the overall error of
the point cloud that will be added to it in the remanufacturing data. This proposed model
was formulated and results of the error generated from the parameters of the scanner and
point cloud smoothing were presented. It is important to know the error generated from
each step or process to be able to compensate for it in the following steps and generate
appropriate material deposition paths. Sources of error from scanning, smoothing, meshing,
slicing, and material deposition were proposed in the error propagation model for additive
remanufacturing. In chapter 5, we tested parameter optimization on the scans with an
experiment done on a CT scanner. We used machine learning to predict the ability to
identify the outcomes of the scanner either good or a bad, by designing a machine learning
algorithm and creating many classification trees. The results show the ability to use these
techniques to predict the ability with high accuracy. The outcomes from this work will
aid researchers in creating point-cloud preprocessing programs by knowing the effect of all
the steps, integrating them in the planning phase of the remanufacturing activities, and
designing a reconstruction plan for a defective part that is a crucial element in the additive
remanufacturing framework.

121
APPENDIX
Journal Publications To Be Submitted
R1. M. Alkhateeb, M. Alzahrani, J. Rickli, “The influence of scanning speed and scanner
resolution on the digital thread of the remanufacturing using additive manufacturing
technologies,”
Conference Publications
C1. M. Mojahed, J. Rickli, N. Christoforou, “Error propagation in digital additive remanu-
facturing process planning,” ASME 2019 14th International Manufacturing Science and
Engineering Conference MSEC 2019. American Society of Mechanical Engineers, 2019.
(MSEC’19), Erie,PA USA, June 2019.

122
REFERENCES
[1] S. Martínez, E. Cuesta, J. Barreiro, and B. Álvarez, “Analysis of laser scanning and
strategies for dimensional and geometrical control,” The International Journal of Ad-
vanced Manufacturing Technology, vol. 46, no. 5-8, pp. 621–629, 2010.
[2] i3mainz, “terrestrial laserscanning : inschriften im bezugssystem des raumes (ibr),”
http://www.spatialhumanities.de/en/ibr/technology/terrestrial-laserscanning.html, 06
2019.
[3] Y. Wang and H.-Y. Feng, “Outlier detection for scanned point clouds using majority
voting,” Computer-Aided Design, vol. 62, pp. 31–43, 2015.
[4] H.-Y. Feng, Y. Liu, and F. Xi, “Analysis of digitizing errors of a laser scanning system,”
Precision Engineering, vol. 25, no. 3, pp. 185–191, 2001.
[5] T. Weyrich, M. Pauly, R. Keiser, S. Heinzle, S. Scandella, and M. H. Gross, “Post-
processing of scanned 3d surface data.” SPBG, vol. 4, pp. 85–94, 2004.
[6] N. Van Gestel, S. Cuypers, P. Bleys, and J.-P. Kruth, “A performance evaluation test
for laser line scanners on cmms,” Optics and lasers in engineering, vol. 47, no. 3-4, pp.
336–342, 2009.
[7] D. Bračun, M. Jezeršek, and J. Diaci, “Triangulation model taking into account light
sheet curvature,” Measurement Science and Technology, vol. 17, no. 8, p. 2191, 2006.
[8] A. Djuric, “Reconfigurable kinematics, dynamics and control process for industrial
robots.” 2007.
[9] J. L. Rickli, A. K. Dasgupta, and G. P. Dinda, “A descriptive framework for additive
remanufacturing systems,” International Journal of Rapid Manufacturing, vol. 4, no.
2-4, pp. 199–218, 2014.
[10] K. H. Lee and H.-p. Park, “Automated inspection planning of free-form shape parts by
laser scanning,” Robotics and Computer-Integrated Manufacturing, vol. 16, no. 4, pp.
201–210, 2000.

123
[11] F. Xi and C. Shu, “Cad-based path planning for 3-d line laser scanning,” Computer-Aided
Design, vol. 31, no. 7, pp. 473–479, 1999.
[12] S. Son, H. Park, and K. H. Lee, “Automated laser scanning system for reverse engineering
and inspection,” International Journal of Machine Tools and Manufacture, vol. 42, no. 8,
pp. 889–897, 2002.
[13] Y. Li and P. Gu, “Free-form surface inspection techniques state of the art review,”
Computer-Aided Design, vol. 36, no. 13, pp. 1395–1417, 2004.
[14] B. Morey, “Auto manufacturing focuses on vision,” Manufacturing Engineering, vol. 149,
no. 3, pp. 115–125, 2012.
[15] M. Rahayem, J. Kjellander, and S. Larsson, “Accuracy analysis of a 3d measurement
system based on a laser profile scanner mounted on an industrial robot with a turntable,”
in Emerging Technologies and Factory Automation, 2007. ETFA. IEEE Conference on.
IEEE, 2007, pp. 880–883.
[16] M. Callieri, A. Fasano, G. Impoco, P. Cignoni, R. Scopigno, G. Parrini, and G. Biagini,
“Roboscan: an automatic system for accurate and unattended 3d scanning,” in 3D
Data Processing, Visualization and Transmission, 2004. 3DPVT 2004. Proceedings. 2nd
International Symposium on. IEEE, 2004, pp. 805–812.
[17] S. Larsson and J. Kjellander, “Motion control and data capturing for laser scanning
with an industrial robot,” Robotics and Autonomous Systems, vol. 54, no. 6, pp. 453–
460, 2006.
[18] P. Manorathna, P. Ogun, S. Marimuthu, L. Justham, and M. Jackson, “Performance
evaluation of a three dimensional laser scanner for industrial applications,” in Infor-
mation and Automation for Sustainability (ICIAfS), 2014 7th International Conference
on. IEEE, 2014, pp. 1–6.
[19] S. Larsson and J. A. Kjellander, “Path planning for laser scanning with an industrial
robot,” Robotics and autonomous systems, vol. 56, no. 7, pp. 615–624, 2008.

124
[20] Y. Wang and H.-Y. Feng, “Effects of scanning orientation on outlier formation in 3d
laser scanning of reflective surfaces,” Optics and Lasers in Engineering, vol. 81, pp.
35–45, 2016.
[21] A. Yao, “Applications of 3d scanning and reverse engineering techniques for quality con-
trol of quick response products,” The international journal of advanced manufacturing
technology, vol. 26, no. 11-12, pp. 1284–1288, 2005.
[22] M. Korosec, J. Duhovnik, and N. Vukasinovic, “Identification and optimization of key
process parameters in noncontact laser scanning for reverse engineering,” Computer-
Aided Design, vol. 42, no. 8, pp. 744–748, 2010.
[23] J. Chow, “Reproducing aircraft structural components using laser scanning,” The Inter-
national Journal of Advanced Manufacturing Technology, vol. 13, no. 10, pp. 723–728,
1997.
[24] R. G. Nedelcu and A. S. Persson, “Scanning accuracy and precision in 4 intraoral scan-
ners: an in vitro comparison based on 3-dimensional analysis,” The Journal of prosthetic
dentistry, vol. 112, no. 6, pp. 1461–1471, 2014.
[25] M. Pieraccini, G. Guidi, and C. Atzeni, “3d digitizing of cultural heritage,” Journal of
Cultural Heritage, vol. 2, no. 1, pp. 63–70, 2001.
[26] S. Aung, R. Ngim, and S. Lee, “Evaluation of the laser scanner as a surface measur-
ing tool and its accuracy compared with direct facial anthropometric measurements,”
British journal of plastic surgery, vol. 48, no. 8, pp. 551–558, 1995.
[27] W. Boehler and A. Marbs, “3d scanning instruments,” Proceedings of the CIPA WG,
vol. 6, pp. 9–18, 2002.
[28] G. Reinhart and W. Tekouo, “Automatic programming of robot-mounted 3d optical
scanning devices to easily measure parts in high-variant assembly,” CIRP annals, vol. 58,
no. 1, pp. 25–28, 2009.
[29] H. ElMaraghy and X. Yang, “Computer-aided planning of laser scanning of complex
geometries,” CIRP Annals-Manufacturing Technology, vol. 52, no. 1, pp. 411–414, 2003.

125
[30] T. Hedberg, J. Lubell, L. Fischer, L. Maggiano, and A. B. Feeney, “Testing the digital
thread in support of model-based manufacturing and inspection,” Journal of Computing
and Information Science in Engineering, vol. 16, no. 2, p. 021001, 2016.
[31] H. Zhao, J.-P. Kruth, N. Van Gestel, B. Boeckmans, and P. Bleys, “Automated dimen-
sional inspection planning using the combination of laser scanner and tactile probe,”
Measurement, vol. 45, no. 5, pp. 1057–1066, 2012.
[32] W. Boehler, M. B. Vicent, and A. Marbs, “Investigating laser scanner accuracy,” The
International Archives of Photogrammetry, Remote Sensing and Spatial Information
Sciences, vol. 34, no. Part 5, pp. 696–701, 2003.
[33] K. Deshmukh, J. L. Rickli, and A. Djuric, “Kinematic modeling of an automated laser
line point cloud scanning system,” Procedia Manufacturing, vol. 5, pp. 1075–1091, 2016.
[34] A. Contri, P. Bourdet, and C. Lartigue, “Quality of 3d digitised points obtained with
non-contact optical sensors,” CIRP Annals-Manufacturing Technology, vol. 51, no. 1,
pp. 443–446, 2002.
[35] C. Lartigue, A. Contri, and P. Bourdet, “Digitised point quality in relation with point
exploitation,” Measurement, vol. 32, no. 3, pp. 193–203, 2002.
[36] F. Zhao, X. Xu, and S. Q. Xie, “Computer-aided inspection planningâĂŤthe state of
the art,” Computers in industry, vol. 60, no. 7, pp. 453–466, 2009.
[37] H. ElMaraghy, P. Gu, and J. Bollinger, “Expert system for inspection planning,” CIRP
Annals-Manufacturing Technology, vol. 36, no. 1, pp. 85–89, 1987.
[38] C.-H. Menq, H.-T. Yau, and G.-Y. Lai, “Automated precision measurement of surface
profile in cad-directed inspection,” IEEE Transactions on Robotics and Automation,
vol. 8, no. 2, pp. 268–278, 1992.
[39] M. L. Kersten, S. Manegold et al., “Cracking the database store,” in CIDR, vol. 5, 2005,
pp. 4–7.
[40] C. Gordon, F. Boukamp, D. Huber, E. Latimer, K. Park, and B. Akinci, “Combining
reality capture technologies for construction defect detection: A case study,” in EIA9:

126
E-Activities and Intelligent Support in Design and the Built Environment, 9th EuropIA
International Conference, 2003, pp. 99–108.
[41] C. Boehnen and P. Flynn, “Accuracy of 3d scanning technologies in a face scanning
scenario,” in 3-D Digital Imaging and Modeling, 2005. 3DIM 2005. Fifth International
Conference on. IEEE, 2005, pp. 310–317.
[42] M. Sokovic, M. Cedilnik, and J. Kopac, “Use of 3d-scanning and reverse engineering by
manufacturing of complex shapes,” in Proceedings of the 13th International Scientific
Conference Achievements in Mechanical and Materials Engineering, AMME, 2005, pp.
601–604.
[43] G. Dalton, “Reverse engineering using laser metrology,” Sensor review, vol. 18, no. 2,
pp. 92–96, 1998.
[44] J. Chow, T. Xu, S.-M. Lee, and K. Kengkool, “Development of an integrated laser-
based reverse engineering and machining system,” The International Journal of Ad-
vanced Manufacturing Technology, vol. 19, no. 3, pp. 186–191, 2002.
[45] Y. Reshetyuk, “Investigation of the influence of surface reflectance on the measurements
with the terrestrial laser scanner leica hds 3000,” Zeitschrift für Geodasie, Geoinforma-
tion und Landmanagement, vol. 131, no. 2, pp. 96–103, 2006.
[46] F. A. R. Martins, J. G. García-Bermejo, E. Z. Casanova, and J. R. P. González, “Au-
tomated 3d surface scanning based on cad model,” Mechatronics, vol. 15, no. 7, pp.
837–857, 2005.
[47] X. Jin and X. Yang, “Off-line programming of a robot for laser re-manufacturing,”
Tsinghua Science & Technology, vol. 14, pp. 186–191, 2009.
[48] C. Shen and S. Zhu, “A robotic system for surface measurement via 3d laser scanner,”
reconstruction, vol. 1, p. 2, 2012.
[49] S. Yin, Y. Ren, Y. Guo, J. Zhu, S. Yang, and S. Ye, “Development and calibration of an
integrated 3d scanning system for high-accuracy large-scale metrology,” Measurement,
vol. 54, pp. 65–76, 2014.

127
[50] S. Gerbino, D. M. Del Giudice, G. Staiano, A. Lanzotti, and M. Martorelli, “On the
influence of scanning factors on the laser scanner-based 3d inspection process,” The
International Journal of Advanced Manufacturing Technology, vol. 84, no. 9-12, pp.
1787–1799, 2016.
[51] D. Blanco, P. Fernández, G. Valiño, J. Rico, and A. Rodríguez, “Influence of ambient
light on the repeatability of laser triangulation digitized point clouds when scanning en
aw 6082 flat faced features,” in AIP Conference Proceedings, vol. 1181, no. 1. AIP,
2009, pp. 509–520.
[52] E. Cuesta, J. C. Rico, P. Fernández, D. Blanco, and G. Valiño, “Influence of roughness
on surface scanning by means of a laser stripe system,” The International Journal of
Advanced Manufacturing Technology, vol. 43, no. 11-12, p. 1157, 2009.
[53] N. Vukašinović, D. Bračun, J. Možina, and J. Duhovnik, “The influence of incident
angle, object colour and distance on cnc laser scanning,” The International Journal of
Advanced Manufacturing Technology, vol. 50, no. 1-4, pp. 265–274, 2010.
[54] N. Zaimovic-Uzunovic and S. Lemes, “Influences of surface parameters on laser 3d scan-
ning,” in IMEKO Conference Proceedings: International Symposium on Measurement
and Quality Control: Osaka, Japan, 2010, pp. D024–026.
[55] S. Lemeš and N. Zaimović-Uzunović, “Study of ambient light influence on laser 3d
scanning,” in Proceedings of the 7th International Conference on Industrial Tools and
Material Processing Technologies, 2009, pp. 327–330.
[56] S. Voisin, S. Foufou, F. Truchetet, D. L. Page, and M. A. Abidi, “Study of ambient light
influence for three-dimensional scanners based on structured light,” Optical Engineering,
vol. 46, no. 3, p. 030502, 2007.
[57] T. Voegtle, I. Schwab, and T. Landes, “Influences of different materials on the measure-
ments of a terrestrial laser scanner (tls),” in Proc. of the XXI Congress, The Interna-
tional Society for Photogrammetry and Remote Sensing, ISPRS2008, vol. 37, 2008, pp.
1061–1066.

128
[58] D. D. Lichti and B. Harvey, “The effects of reflecting surface material properties on
time-of-flight laser scanner measurements,” tc, vol. 2, p. 1, 2002.
[59] I. Popov, S. Onuh, and K. Dotchev, “Dimensional error analysis in point cloud-based
inspection using a non-contact method for data acquisition,” Measurement Science and
Technology, vol. 21, no. 7, p. 075303, 2010.
[60] S. L. Brown and H. A. Pierson, “Digital design integrity for additive manufacturing:
examining reliability issues in the digital preproduction process,” International Journal
of Rapid Manufacturing, vol. 7, no. 1, pp. 43–58, 2018.
[61] M. Hedges and N. Calder, “Near net shape rapid manufacture & repair by lens,” in Cost
Effective Manufacture via Net-Shape Processing, Meeting Proceedings RTO-MP-AVT-
139, Paper, vol. 13, 2006.
[62] R. P. Mudge and N. R. Wald, “Laser engineered net shaping advances additive manu-
facturing and repair,” Welding Journal-New York-, vol. 86, no. 1, p. 44, 2007.
[63] O. Yilmaz, N. Gindy, and J. Gao, “A repair and overhaul methodology for aeroengine
components,” Robotics and Computer-Integrated Manufacturing, vol. 26, no. 2, pp. 190–
201, 2010.
[64] N. Gupta, C. Weber, and S. Newsome, “Additive manufacturing: Status and opportu-
nities,” Science and Technology Policy Institute, Washington, 2012.
[65] J. Wang, S. Prakash, Y. Joshi, and F. Liou, “Laser aided part repair-a review,” in
Proceedings of the thirteenth annual solid freeform fabrication symposium, Austin, TX.
Citeseer, 2002.
[66] C. Chen, Y. Wang, H. Ou, Y. He, and X. Tang, “A review on remanufacture of dies and
moulds,” Journal of Cleaner Production, vol. 64, pp. 13–23, 2014.
[67] N. A. I. M. Rosli and A. Ramli, “Mapping bootstrap error for bilateral smoothing on
point set,” in AIP Conference Proceedings, vol. 1605, no. 1. AIP, 2014, pp. 149–154.

129
[68] Z. M. Bi and L. Wang, “Advances in 3d data acquisition and processing for industrial
applications,” Robotics and Computer-Integrated Manufacturing, vol. 26, no. 5, pp. 403–
413, 2010.
[69] C. Piya, J. M. Wilson, S. Murugappan, Y. Shin, and K. Ramani, “Virtual repair: ge-
ometric reconstruction for remanufacturing gas turbine blades,” in ASME 2011 Inter-
national Design Engineering Technical Conferences and Computers and Information in
Engineering Conference. American Society of Mechanical Engineers, 2011, pp. 895–904.
[70] L. A. Freitag, “On combining laplacian and optimization-based mesh smoothing tech-
niques,” ASME applied mechanics division-publications-amd, vol. 220, pp. 37–44, 1997.
[71] M. Pauly, N. J. Mitra, and L. J. Guibas, “Uncertainty and variability in point cloud
surface data.” SPBG, vol. 4, pp. 77–84, 2004.
[72] R. Lindenbergh, N. Pfeifer, and T. Rabbani, “Accuracy analysis of the leica hds3000 and
feasibility of tunnel deformation monitoring,” in Proceedings of the ISPRS Workshop,
Laser scanning, vol. 36, 2005, p. 3.
[73] S. M. Odeyinka and A. M. Djuric, “Fanuc family inverse kinematics modeling, validation
and visualization,” SAE Technical Paper, Tech. Rep., 2016.
[74] P. Arachchige, M. Abderrahmane, and A. M. Djuric, “Modeling and validation of rapid
prototyping related available workspace,” SAE International Journal of Materials and
Manufacturing, vol. 7, no. 2, pp. 291–299, 2014.
[75] M. Abderrahmane, A. M. Djuric, W. Chen, and C. Yeh, “Study and validation of
singularities for a fanuc lr mate 200ic robot,” in IEEE International Conference on
Electro/Information Technology. IEEE, 2014, pp. 432–437.
[76] I. Bešić, N. Van Gestel, J.-P. Kruth, P. Bleys, and J. Hodolič, “Accuracy improvement of
laser line scanning for feature measurements on cmm,” Optics and Lasers in Engineering,
vol. 49, no. 11, pp. 1274–1280, 2011.

130
[77] A. Javaheri, C. Brites, F. Pereira, and J. Ascenso, “Subjective and objective quality
evaluation of 3d point cloud denoising algorithms,” in Multimedia & Expo Workshops
(ICMEW), 2017 IEEE International Conference on. IEEE, 2017, pp. 1–6.
[78] N. Nasr and M. Thurston, “Remanufacturing: A key enabler to sustainable product
systems,” Rochester Institute of Technology, pp. 15–18, 2006.
[79] S. Ford and M. Despeisse, “Additive manufacturing and sustainability: an exploratory
study of the advantages and challenges,” Journal of Cleaner Production, vol. 137, pp.
1573–1587, 2016.
[80] W. Frei, “Meshing considerations for linear static problems,” URL: https://www. comsol.
com/blogs/meshing-considerations-linear-staticproblems, 2013.
[81] S. Sikder, A. Barari, and H. Kishawy, “Effect of adaptive slicing on surface integrity
in additive manufacturing,” in ASME 2014 International Design Engineering Technical
Conferences and Computers and Information in Engineering Conference. American
Society of Mechanical Engineers, 2014, pp. V01AT02A052–V01AT02A052.
[82] I. Gibson, D. W. Rosen, and B. Stucker, “Design for additive manufacturing,” in Additive
Manufacturing Technologies. Springer, 2010, pp. 299–332.
[83] V. Avagyan, A. Zakarian, and P. Mohanty, “Scanned three-dimensional model matching
and comparison algorithms for manufacturing applications,” Journal of Manufacturing
Science and Engineering, vol. 129, no. 1, pp. 190–201, 2007.
[84] A. Karme, A. Kallonen, V.-P. Matilainen, H. Piili, and A. Salminen, “Possibilities of ct
scanning as analysis method in laser additive manufacturing,” Physics Procedia, vol. 78,
pp. 347–356, 2015.
[85] A. Du Plessis, I. Yadroitsev, I. Yadroitsava, and S. G. Le Roux, “X-ray microcomputed
tomography in additive manufacturing: a review of the current technology and appli-
cations,” 3D Printing and Additive Manufacturing, vol. 5, no. 3, pp. 227–247, 2018.

131
[86] T. Hothorn and B. Lausen, “Bagging tree classifiers for laser scanning images: a data-
and simulation-based strategy,” Artificial intelligence in medicine, vol. 27, no. 1, pp.
65–79, 2003.

132
ABSTRACT
3D SCANNING AND THE IMPACT OF THE DIGITAL THREAD ONMANUFACTURING AND RE-MANUFACTURING APPLICATIONS
by
MOJAHED MOHAMMAD F. ALKHATEEB
August 2019
Advisor: Dr. Jeremy L. Rickli
Major: Industrial Engineering
Degree: Doctor of Philosophy
3D laser line scanners are becoming a powerful technology for capturing point cloud
datasets and collecting dimensional information for many objects. However, the use of point
cloud is limited due to many factors. These include the lack of on deep understanding of
the effect of point cloud parameters on scan quality. This knowledge is critical to gaining
an understanding of the measurement in point cloud. Currently, there are no adequate
measurement procedures for 3D scanners. There is a need for standardized measurement
procedures to evaluate 3D scanner accuracy due to uncertainties in 3D scanning, such as
surface quality, surface orientation and scan depth [6]. The lack of standardized procedures
does not allow the technology to be fully automated and used in manufacturing facilities
that would allow 100% in-line inspection. In this dissertation I worked on accomplishing
four tasks that will achieve the objective of having a standardized measurement procedure
that is critical to develop an automated laser scanning system to avoid variations and have
consistent data capable of identifying defects. The four tasks are: (1) linking the robot
workspace with the scanner workspace; (2) studying the effect of the scanning speed and the
resolution on point cloud quality by conducting an experiment with systematically varied
scan parameters on scan quality. The parameters that were tested are the effect of view
angle, standoff distance, speed, and resolution. Knowing the effect of these parameters is
important in order to generate the scan path that provides the best coverage and quality of
points collected; (3) studying the overall error of that is associated with the transformation

133
of the point cloud in a remanufacturing facility using additive manufacturing. There is
also a need to know the impact of all the scanning parameters especially the speed and
the resolution; (4) modeling a machine learning tool to optimize the parameters of different
scanning techniques after collecting the scanning results to select the optimal ones that
provide the best scan quality. With the success of this work, the advancement and practice
of automated quality monitoring in manufacturing will increase.

134
AUTOBIOGRAPHICAL STATEMENT
Mojahed Mohammad F. Alkhateeb is currently a doctoral candidate in the depart-
ment of industrial and systems engineering at Wayne State University. He received a M.Sc.
degree in industrial and systems engineering from the University of Michigan - Dearborn,
MI USA in 2013. Prior to that he received a B.Sc. degree in industrial engineering from
King Abdulaziz University - Jeddah, Saudi Arabia in 2009. His primary research interests
include testing the effect of different scanning parameters on the quality of the scanning out-
come. His research has been published in MSEC. He has participated in many conferences
in WSU and other organizations including ISERC, and ASME where his paper was accepted
and recommended for journal publication. He also received an NSF travel award to attend
the conference. Mojahed will start as an assistant professor in the department of industrial
engineering at King Abdulaziz University - Rabigh, Saudi Arabia in Fall 2019.
Related Documents