SPECIAL ISSUE PATTERNS & PHENOTYPES 3D Expression Patterns of Cell Cycle Genes in the Developing Chick Wing and Comparison With Expression Patterns of Genes Implicated in Digit Specification Monique Welten, Gordana Pavlovska, Yu Chen, Yuko Teruoka, Malcolm Fisher, † Fiona Bangs Matthew Towers, and Cheryll Tickle* Sonic hedgehog (Shh) signalling controls integrated specification of digit pattern and growth in the chick wing but downstream gene networks remain to be unravelled. We analysed 3D expression patterns of genes encoding cell cycle regulators using Optical Projection Tomography. Hierarchical clustering of spa- tial matrices of gene expression revealed a dorsal layer of the wing bud, in which almost all genes were expressed, and that genes encoding positive cell cycle regulators had similar expression patterns while those of N-myc and CyclinD2 were distinct but closely related. We compared these patterns computation- ally with those of genes implicated in digit specification and Ptch1, 50 genes in total. Nineteen genes have similar posterior expression to Ptch1, including Hoxd13, Sall1, Hoxd11, and Bmp2, all likely Gli targets in mouse limb, and cell cycle genes, N-myc, CyclinD2. We suggest that these genes contribute to a network integrating digit specification and growth in response to Shh. Developmental Dynamics 240:1278–1288, 2011. V C 2011 Wiley-Liss, Inc. Key words: chick; limb; OPT; cell cycle genes; Hoxd13; Ptch1 Accepted 2 March 2011 INTRODUCTION The chick wing is a major model for investigating mechanisms involved in pattern formation in vertebrate embryos with specification of digit pattern being integrated with growth (Towers et al., 2008). The three digits arise from the posterior part of the wing bud (Vargesson et al., 1997) and are arranged in the pattern 2,3,4 (running from anterior to posterior; in the hand, the antero-posterior axis runs from thumb to little finger). Digit pattern formation is controlled by signaling of the polarizing region, a small group of mesenchyme cells at the posterior margin of the wing bud (Saunders and Gasseling, 1968). When the polarizing region from one wing bud is grafted to the anterior margin of a second bud, six digits form with an additional set of digits developing in mirror image symmetry with the normal set giving the pat- tern 432234. It was proposed that the polarizing region produces a diffusible morphogen that sets up a concentra- tion gradient in cells adjacent to the polarizing region, the local morphogen concentration providing cells with posi- tional information and cells then using this information to form the appropri- ate digit (Wolpert, 1969). It was also shown that polarizing region grafts induce cell proliferation in responding cells (Cooke and Summerbell, 1980). John Fallon was one of the embryol- ogists who carried out early studies on the polarizing region, showing, for Developmental Dynamics Additional Supporting Information may be found in the online version of this article. Department of Biology and Biochemistry, University of Bath, Claverton Down, Bath, United Kingdom †Malcolm Fisher’s present address is The Roslin Institute and Royal (Dick) School of Veterinary Studies, University of Edinburgh, Roslin, Midlothian, Scotland, UK Grant sponsor: BBSRC; Grant number: BB/G00093X/1; Grant sponsor: MRC; Grant number: G9806660 and G0801092; Grant sponsor: The Royal Society. *Correspondence to: Cheryll Tickle, Department of Biology & Biochemistry, University of Bath, Claverton Down, Bath, BA2 7AY, UK. E-mail: [email protected] DOI 10.1002/dvdy.22633 Published online 20 April 2011 in Wiley Online Library (wileyonlinelibrary.com). DEVELOPMENTAL DYNAMICS 240:1278–1288, 2011 V C 2011 Wiley-Liss, Inc.

Welcome message from author
This document is posted to help you gain knowledge. Please leave a comment to let me know what you think about it! Share it to your friends and learn new things together.
Transcript
a SPECIAL ISSUE PATTERNS & PHENOTYPES
3D Expression Patterns of Cell Cycle Genes inthe Developing Chick Wing and ComparisonWith Expression Patterns of Genes Implicatedin Digit SpecificationMonique Welten, Gordana Pavlovska, Yu Chen, Yuko Teruoka, Malcolm Fisher,† Fiona BangsMatthew Towers, and Cheryll Tickle*
Sonic hedgehog (Shh) signalling controls integrated specification of digit pattern and growth in the chickwing but downstream gene networks remain to be unravelled. We analysed 3D expression patterns ofgenes encoding cell cycle regulators using Optical Projection Tomography. Hierarchical clustering of spa-tial matrices of gene expression revealed a dorsal layer of the wing bud, in which almost all genes wereexpressed, and that genes encoding positive cell cycle regulators had similar expression patterns whilethose of N-myc and CyclinD2 were distinct but closely related. We compared these patterns computation-ally with those of genes implicated in digit specification and Ptch1, 50 genes in total. Nineteen genes havesimilar posterior expression to Ptch1, including Hoxd13, Sall1, Hoxd11, and Bmp2, all likely Gli targets inmouse limb, and cell cycle genes, N-myc, CyclinD2. We suggest that these genes contribute to a networkintegrating digit specification and growth in response to Shh. Developmental Dynamics 240:1278–1288,2011. VC 2011 Wiley-Liss, Inc.
Key words: chick; limb; OPT; cell cycle genes; Hoxd13; Ptch1
Accepted 2 March 2011
INTRODUCTION
The chick wing is a major model forinvestigating mechanisms involvedin pattern formation in vertebrateembryos with specification of digitpattern being integrated with growth(Towers et al., 2008). The three digitsarise from the posterior part of thewing bud (Vargesson et al., 1997) andare arranged in the pattern 2,3,4(running from anterior to posterior; inthe hand, the antero-posterior axisruns from thumb to little finger).
Digit pattern formation is controlled
by signaling of the polarizing region,
a small group of mesenchyme cells at
the posterior margin of the wing bud
(Saunders and Gasseling, 1968).
When the polarizing region from one
wing bud is grafted to the anterior
margin of a second bud, six digits
form with an additional set of digits
developing in mirror image symmetry
with the normal set giving the pat-
tern 432234. It was proposed that the
polarizing region produces a diffusible
morphogen that sets up a concentra-
tion gradient in cells adjacent to the
polarizing region, the local morphogen
concentration providing cells with posi-
tional information and cells then using
this information to form the appropri-
ate digit (Wolpert, 1969). It was also
shown that polarizing region grafts
induce cell proliferation in responding
cells (Cooke and Summerbell, 1980).John Fallon was one of the embryol-
ogists who carried out early studieson the polarizing region, showing, for
Dev
elop
men
tal D
ynam
ics
Additional Supporting Information may be found in the online version of this article.
Department of Biology and Biochemistry, University of Bath, Claverton Down, Bath, United Kingdom†Malcolm Fisher’s present address is The Roslin Institute and Royal (Dick) School of Veterinary Studies, University of Edinburgh,Roslin, Midlothian, Scotland, UKGrant sponsor: BBSRC; Grant number: BB/G00093X/1; Grant sponsor: MRC; Grant number: G9806660 and G0801092; Grant sponsor:The Royal Society.*Correspondence to: Cheryll Tickle, Department of Biology & Biochemistry, University of Bath, Claverton Down, Bath,BA2 7AY, UK. E-mail: [email protected]
DOI 10.1002/dvdy.22633Published online 20 April 2011 in Wiley Online Library (wileyonlinelibrary.com).
DEVELOPMENTAL DYNAMICS 240:1278–1288, 2011
VC 2011 Wiley-Liss, Inc.
example, that limb buds of other ver-tebrates had a polarizing region thatcould induce additional digits whentransplanted to the chick wing bud(Fallon and Crosby, 1977). However,at that time, there was completeignorance about molecules involvedin digit patterning and nature ofpostulated morphogen and growthcontrolling factor(s) produced by thepolarizing region. It is now knownthat the polarizing region expressesShh, which encodes a secreted mole-cule (Riddle et al., 1993) and it is wellestablished that Shh is pivotal in digitpatterning. We have also recentlyshown that Shh signaling controlsgrowth of the digit-forming region ofthe wing bud (Towers et al., 2008).Therefore, identifying genes down-stream of Shh signalling in limbshould provide information about thegene networks involved in both pat-terning and growth.
Considerable progress has beenmade in unravelling how Shh signalsare transduced. The transcriptionaleffectors of Shh signalling are Gli pro-teins; in the absence of Shh, Gli2 andGli3 proteins are processed into formsthat act as repressors, while in thepresence of Shh, Gli1, Gli2, and Gli3proteins function as activators. Shhsignaling is pivotal in digit pattern-ing, mainly acting by relieving repres-sion of target genes by Gli3 in theposterior digit-forming region of thelimb bud (Litingtung et al., 2002;te Welscher et al., 2002). Relatively lit-tle is known, however, about the targetgenes in the limb bud whose expres-sion is either activated or de-repressedin response to Shh signalling.
Several transcription factors havebeen implicated in digit patterningincluding Hoxd13, Tbx2, Tbx3, Sall1(reviewed in Tickle, 2006) andrecently Vokes and colleagues (Vokeset al., 2008) identified Hoxd13 andSall1 as direct Gli targets in themouse limb. Hoxd13 is expressed inthe posterior region of both chick andmouse limbs due to the relief of Gli3repression by Shh signalling (Liting-tung et al., 2002, te Welscher et al.,2002). We also identified a set of genesin the chick wing that are likely to beexpressed downstream of Shh signal-ling and whose expression is regu-lated in the same way as Hoxd13using microarray analysis of tissues
from both normal and talpid3 chickenmutant wing buds (Bangs et al.,2010). Both Gli activator and Glirepressor functions fail in talpid3 cellsdue to lack of primary cilia (Yin et al.,2009) and in talpid3 wing buds,Hoxd13 is ectopically expressed in theanterior region due to failure of Gli3repression. With respect to genesinvolved in growth downstream ofShh signalling in the chick wing, wehave shown experimentally thatexpression of genes encoding the cellcycle regulators, N-myc and Cyclin D,depends on Shh signalling (Towerset al., 2008). We have also describedwhole mount in situ hybridizationexpression patterns of E2F transcrip-tion factors in developing chick wing(Towers et al., 2009) but how expres-sion of these cell cycle genes is regu-lated is not known.
In order to compare multiple pat-terns of gene expression in the devel-oping chick wing and thus identifygenes that are expressed in similarspatial patterns and likely to be regu-lated in the same way and/or may befunctionally related, we have visual-ized 3D expression patterns usingOptical Projection Tomography (OPT;Sharpe et al., 2002) and then ana-lyzed the digital data computationally(Fisher et al., 2008; Bangs et al.,2010). Expression patterns are accu-mulated onto a digitized referencewing bud, which is then subdividedinto spatial domains and the levels ofexpression of each gene in all thesedomains throughout the wing bud canbe computed. Hierarchical clusteringof the data can be used to reveal clus-ters of spatial domains of gene expres-sion, thus dividing the wing bud intomutually exclusive regions withunique gene transcriptional signa-tures, and to reveal clusters of mutu-ally exclusive groups of genes that areexpressed in similar patterns, groupsof syn-expressed genes. It should benoted, however, that genes can beexpressed in more than one spatialdomain cluster.
Here we have mapped 3D expres-sion of 12 cell cycle genes in stage-24chick wing buds and identified uniquespatial domains of expression andgroups of syn-expressed genes. Wethen compared the 3D expression pat-terns of these cell cycle genes withthose of genes implicated in digit
specification (mostly data from Bangset al., 2010) and Tbx2, Tbx3, andSall3 (Fisher et al., 2011). We alsoincluded in the analysis the 3D pat-tern of expression of Ptch1, whichreports cells responding to Shh, andShh itself. Hierarchical clusteringwas then carried out on all the 3Dmapped data, a total of 50 geneexpression patterns (see Supp. Fig. S1,which is available online, for detailsof the 50 genes mapped and used forcomputational analysis). We werethen able to identify unique spatialdomains of gene expression withinthe wing bud in which both cell cycleand ‘‘patterning’’ genes are expressedand also groups of syn-expressed cellcycle and ‘‘patterning’’ genes thatcould represent the network that inte-grates growth and digit specification.The addition of Ptch1 to the analysisalso provides a way of confirming thatexpression of the genes identified islikely to be downstream of Shhsignalling.
RESULTS
Cell Cycle Genes
3D expression patterns of 12 cell cyclegenes (CyclinD1, D2, and D3,E2F1,2,3,5,7,8, C-myc, N-myc, PCNA)were visualized in stage-24 chickwing buds following whole mount insitu hybridization using OPT. PCNAgene expression is a marker for prolif-erating cells (Kohler et al., 2005).Expression patterns obtained in thisseries of experiments generallymatched those previously reported.Figure 1 shows representative 3D
expression data for PCNA, N-myc,CyclinD2, and E2F8. PCNA tran-scripts are abundant throughout mostof the wing bud except the proximalcentral region (near base of wing bud)indicating that proliferation is wide-spread (Fig. 1A, B). Figure 1C illus-trates PCNA expression mapped on tostage-24 reference wing bud visual-ised using the Amira isosurface fea-ture. The region of weaker expressioncan be seen more clearly using acolor-mapped volume rendering(Amira voltex feature) that producesa heat map (Fig. 1D). In contrast tothe almost ubiquitous expression ofPCNA, expression of N-myc andCyclin D2 is more distally and
Dev
elop
men
tal D
ynam
ics
3D GENE EXPRESSION IN CHICK WING 1279
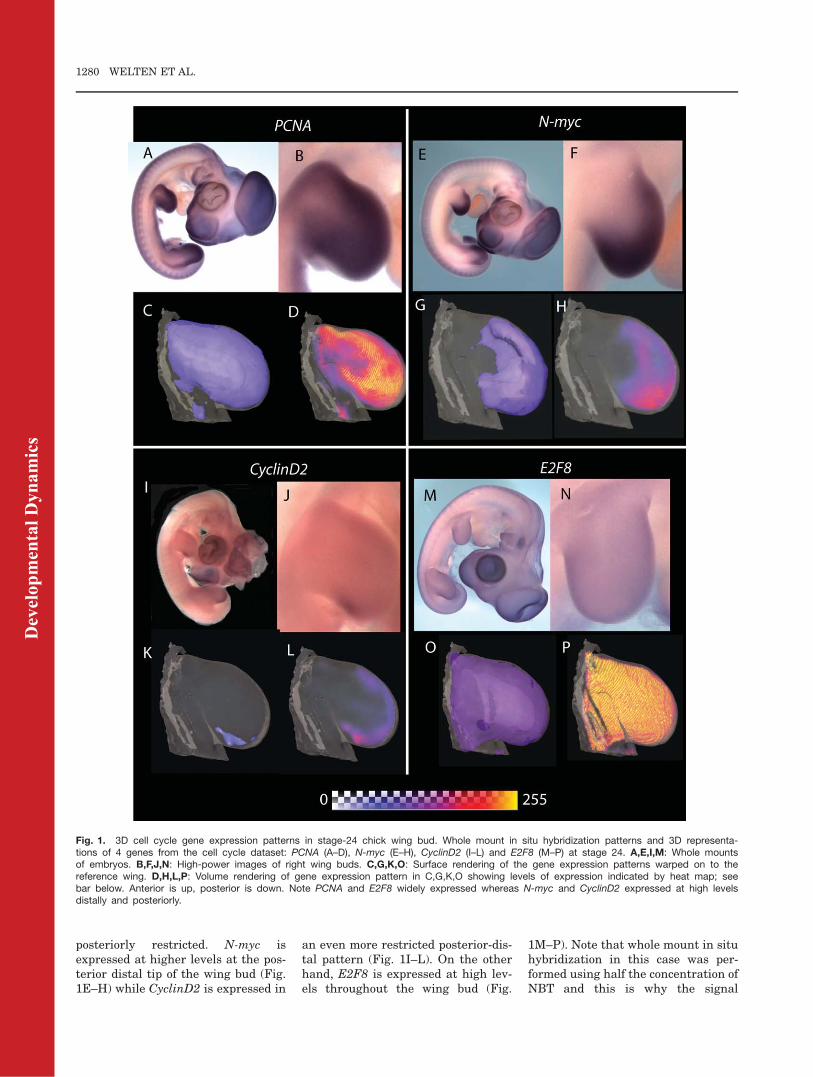
posteriorly restricted. N-myc isexpressed at higher levels at the pos-terior distal tip of the wing bud (Fig.1E–H) while CyclinD2 is expressed in
an even more restricted posterior-dis-tal pattern (Fig. 1I–L). On the otherhand, E2F8 is expressed at high lev-els throughout the wing bud (Fig.
1M–P). Note that whole mount in situhybridization in this case was per-formed using half the concentration ofNBT and this is why the signal
Fig. 1. 3D cell cycle gene expression patterns in stage-24 chick wing bud. Whole mount in situ hybridization patterns and 3D representa-tions of 4 genes from the cell cycle dataset: PCNA (A–D), N-myc (E–H), CyclinD2 (I–L) and E2F8 (M–P) at stage 24. A,E,I,M: Whole mountsof embryos. B,F,J,N: High-power images of right wing buds. C,G,K,O: Surface rendering of the gene expression patterns warped on to thereference wing. D,H,L,P: Volume rendering of gene expression pattern in C,G,K,O showing levels of expression indicated by heat map; seebar below. Anterior is up, posterior is down. Note PCNA and E2F8 widely expressed whereas N-myc and CyclinD2 expressed at high levelsdistally and posteriorly.
Dev
elop
men
tal D
ynam
ics
1280 WELTEN ET AL.
appears faint (Fig. 1 M, N). Wholemount in situ hybridization data forall the other cell cycle genes and allthe 3D expression patterns can beviewed at https://www.echickatlas.org/submission/login (username GUEST,password guest).
3D expression data for the 12 genes(3 replicates for each) were mappedonto the stage-24 reference wing budand the median for each gene wasderived. The reference limb withmapped median expression patternswas then divided into 2,072 spatialdomains, from hereon referred to astiles, using MRC HGU software.Expression levels of each gene in allthe different tiles were computed.These data were then tabulated in atab-delimited file to generate a matrixof gene expression across all tiles. Ahierarchical clustering method (Pear-son Correlation) was applied to thetiles to cluster spatial domains ofgene expression; gene expression datawere clustered to define gene synex-pression groups.
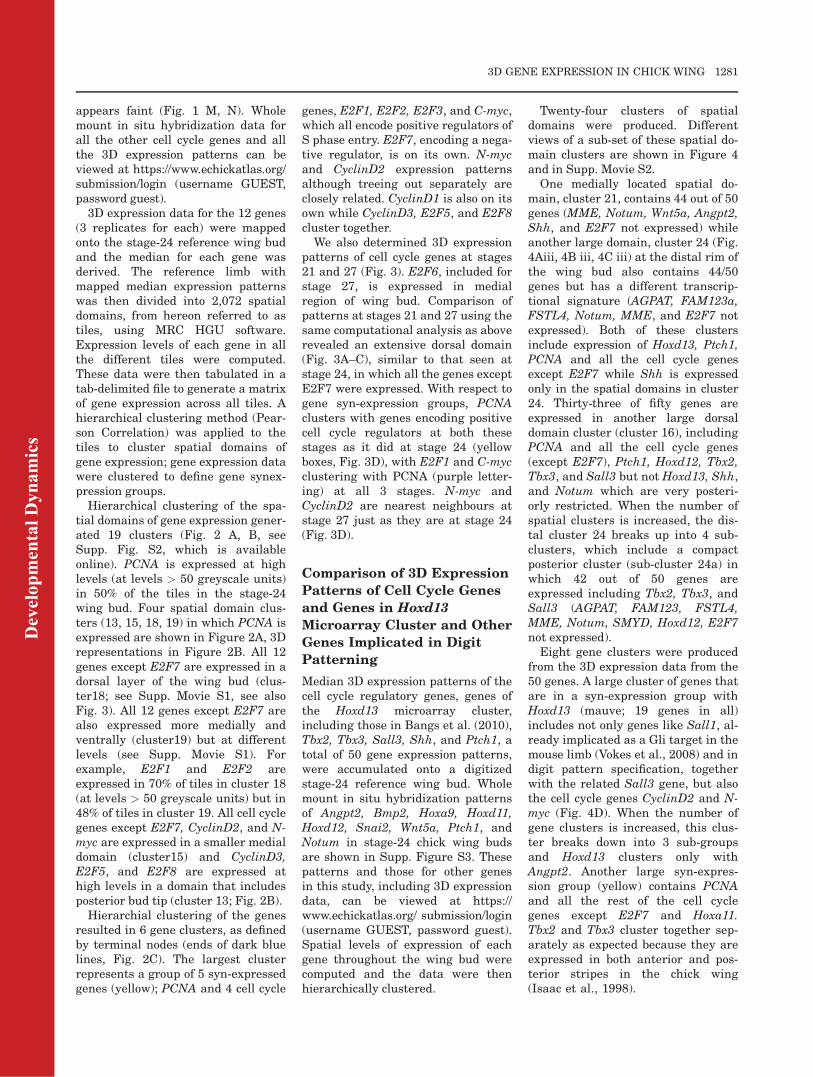
Hierarchical clustering of the spa-tial domains of gene expression gener-ated 19 clusters (Fig. 2 A, B, seeSupp. Fig. S2, which is availableonline). PCNA is expressed at highlevels (at levels > 50 greyscale units)in 50% of the tiles in the stage-24wing bud. Four spatial domain clus-ters (13, 15, 18, 19) in which PCNA isexpressed are shown in Figure 2A, 3Drepresentations in Figure 2B. All 12genes except E2F7 are expressed in adorsal layer of the wing bud (clus-ter18; see Supp. Movie S1, see alsoFig. 3). All 12 genes except E2F7 arealso expressed more medially andventrally (cluster19) but at differentlevels (see Supp. Movie S1). Forexample, E2F1 and E2F2 areexpressed in 70% of tiles in cluster 18(at levels > 50 greyscale units) but in48% of tiles in cluster 19. All cell cyclegenes except E2F7, CyclinD2, and N-myc are expressed in a smaller medialdomain (cluster15) and CyclinD3,E2F5, and E2F8 are expressed athigh levels in a domain that includesposterior bud tip (cluster 13; Fig. 2B).
Hierarchial clustering of the genesresulted in 6 gene clusters, as definedby terminal nodes (ends of dark bluelines, Fig. 2C). The largest clusterrepresents a group of 5 syn-expressedgenes (yellow); PCNA and 4 cell cycle
genes, E2F1, E2F2, E2F3, and C-myc,which all encode positive regulators ofS phase entry. E2F7, encoding a nega-tive regulator, is on its own. N-mycand CyclinD2 expression patternsalthough treeing out separately areclosely related. CyclinD1 is also on itsown while CyclinD3, E2F5, and E2F8cluster together.
We also determined 3D expressionpatterns of cell cycle genes at stages21 and 27 (Fig. 3). E2F6, included forstage 27, is expressed in medialregion of wing bud. Comparison ofpatterns at stages 21 and 27 using thesame computational analysis as aboverevealed an extensive dorsal domain(Fig. 3A–C), similar to that seen atstage 24, in which all the genes exceptE2F7 were expressed. With respect togene syn-expression groups, PCNAclusters with genes encoding positivecell cycle regulators at both thesestages as it did at stage 24 (yellowboxes, Fig. 3D), with E2F1 and C-mycclustering with PCNA (purple letter-ing) at all 3 stages. N-myc andCyclinD2 are nearest neighbours atstage 27 just as they are at stage 24(Fig. 3D).
Comparison of 3D Expression
Patterns of Cell Cycle Genes
and Genes in Hoxd13
Microarray Cluster and Other
Genes Implicated in Digit
Patterning
Median 3D expression patterns of thecell cycle regulatory genes, genes ofthe Hoxd13 microarray cluster,including those in Bangs et al. (2010),Tbx2, Tbx3, Sall3, Shh, and Ptch1, atotal of 50 gene expression patterns,were accumulated onto a digitizedstage-24 reference wing bud. Wholemount in situ hybridization patternsof Angpt2, Bmp2, Hoxa9, Hoxd11,Hoxd12, Snai2, Wnt5a, Ptch1, andNotum in stage-24 chick wing budsare shown in Supp. Figure S3. Thesepatterns and those for other genesin this study, including 3D expressiondata, can be viewed at https://www.echickatlas.org/ submission/login(username GUEST, password guest).Spatial levels of expression of eachgene throughout the wing bud werecomputed and the data were thenhierarchically clustered.
Twenty-four clusters of spatialdomains were produced. Differentviews of a sub-set of these spatial do-main clusters are shown in Figure 4and in Supp. Movie S2.One medially located spatial do-
main, cluster 21, contains 44 out of 50genes (MME, Notum, Wnt5a, Angpt2,Shh, and E2F7 not expressed) whileanother large domain, cluster 24 (Fig.4Aiii, 4B iii, 4C iii) at the distal rim ofthe wing bud also contains 44/50genes but has a different transcrip-tional signature (AGPAT, FAM123a,FSTL4, Notum, MME, and E2F7 notexpressed). Both of these clustersinclude expression of Hoxd13, Ptch1,PCNA and all the cell cycle genesexcept E2F7 while Shh is expressedonly in the spatial domains in cluster24. Thirty-three of fifty genes areexpressed in another large dorsaldomain cluster (cluster 16), includingPCNA and all the cell cycle genes(except E2F7), Ptch1, Hoxd12, Tbx2,Tbx3, and Sall3 but not Hoxd13, Shh,and Notum which are very posteri-orly restricted. When the number ofspatial clusters is increased, the dis-tal cluster 24 breaks up into 4 sub-clusters, which include a compactposterior cluster (sub-cluster 24a) inwhich 42 out of 50 genes areexpressed including Tbx2, Tbx3, andSall3 (AGPAT, FAM123, FSTL4,MME, Notum, SMYD, Hoxd12, E2F7not expressed).Eight gene clusters were produced
from the 3D expression data from the50 genes. A large cluster of genes thatare in a syn-expression group withHoxd13 (mauve; 19 genes in all)includes not only genes like Sall1, al-ready implicated as a Gli target in themouse limb (Vokes et al., 2008) and indigit pattern specification, togetherwith the related Sall3 gene, but alsothe cell cycle genes CyclinD2 and N-myc (Fig. 4D). When the number ofgene clusters is increased, this clus-ter breaks down into 3 sub-groupsand Hoxd13 clusters only withAngpt2. Another large syn-expres-sion group (yellow) contains PCNAand all the rest of the cell cyclegenes except E2F7 and Hoxa11.Tbx2 and Tbx3 cluster together sep-arately as expected because they areexpressed in both anterior and pos-terior stripes in the chick wing(Isaac et al., 1998).
Dev
elop
men
tal D
ynam
ics
3D GENE EXPRESSION IN CHICK WING 1281
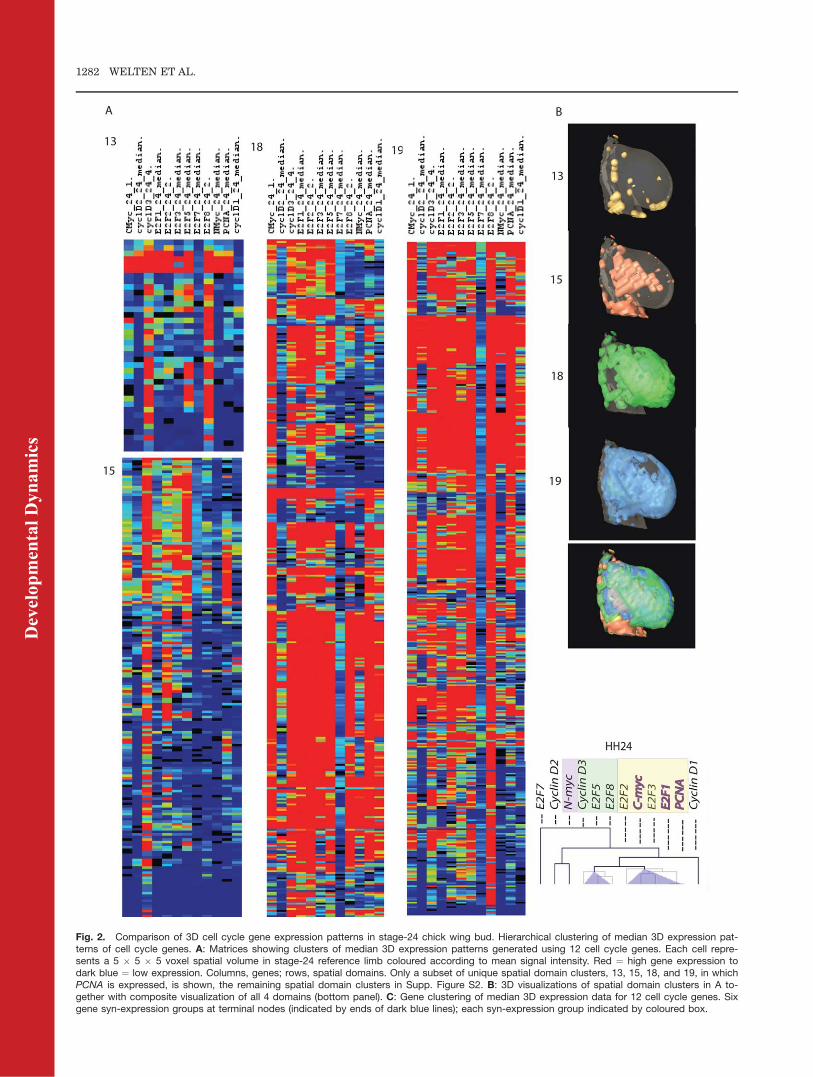
Fig. 2. Comparison of 3D cell cycle gene expression patterns in stage-24 chick wing bud. Hierarchical clustering of median 3D expression pat-terns of cell cycle genes. A: Matrices showing clusters of median 3D expression patterns generated using 12 cell cycle genes. Each cell repre-sents a 5 � 5 � 5 voxel spatial volume in stage-24 reference limb coloured according to mean signal intensity. Red ¼ high gene expression todark blue ¼ low expression. Columns, genes; rows, spatial domains. Only a subset of unique spatial domain clusters, 13, 15, 18, and 19, in whichPCNA is expressed, is shown, the remaining spatial domain clusters in Supp. Figure S2. B: 3D visualizations of spatial domain clusters in A to-gether with composite visualization of all 4 domains (bottom panel). C: Gene clustering of median 3D expression data for 12 cell cycle genes. Sixgene syn-expression groups at terminal nodes (indicated by ends of dark blue lines); each syn-expression group indicated by coloured box.
Dev
elop
men
tal D
ynam
ics
1282 WELTEN ET AL.
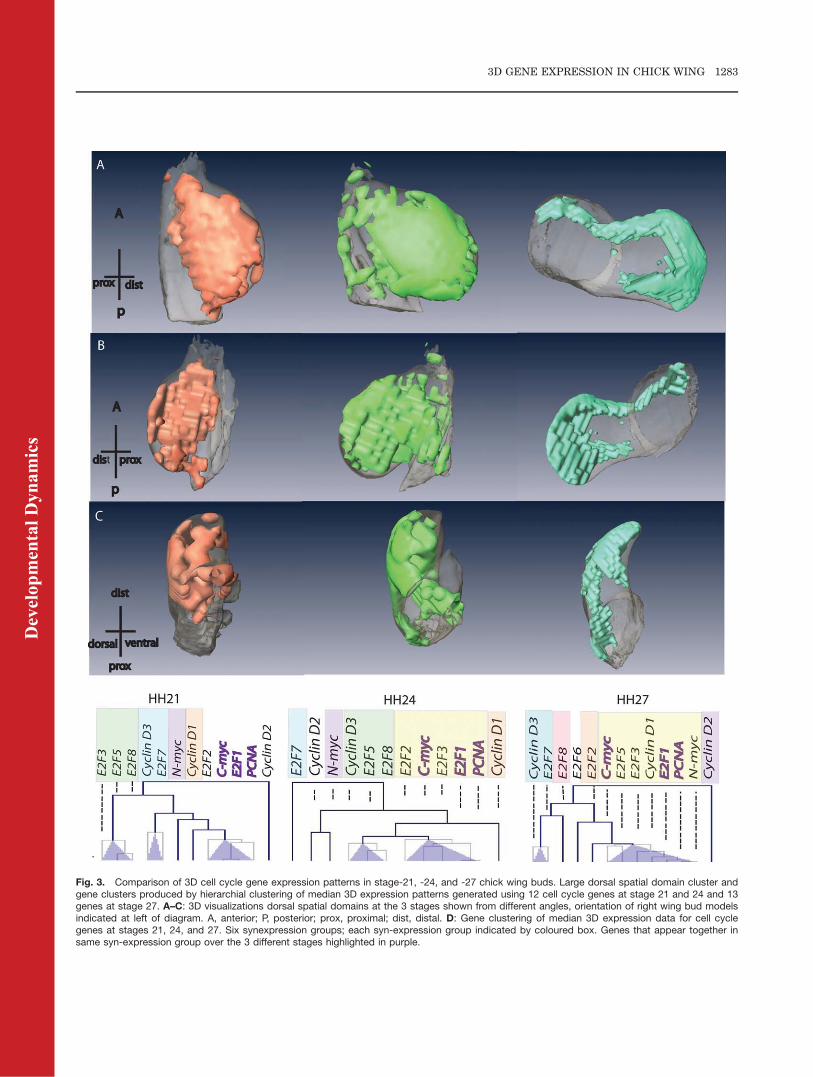
Fig. 3. Comparison of 3D cell cycle gene expression patterns in stage-21, -24, and -27 chick wing buds. Large dorsal spatial domain cluster andgene clusters produced by hierarchial clustering of median 3D expression patterns generated using 12 cell cycle genes at stage 21 and 24 and 13genes at stage 27. A–C: 3D visualizations dorsal spatial domains at the 3 stages shown from different angles, orientation of right wing bud modelsindicated at left of diagram. A, anterior; P, posterior; prox, proximal; dist, distal. D: Gene clustering of median 3D expression data for cell cyclegenes at stages 21, 24, and 27. Six synexpression groups; each syn-expression group indicated by coloured box. Genes that appear together insame syn-expression group over the 3 different stages highlighted in purple.
Dev
elop
men
tal D
ynam
ics
3D GENE EXPRESSION IN CHICK WING 1283
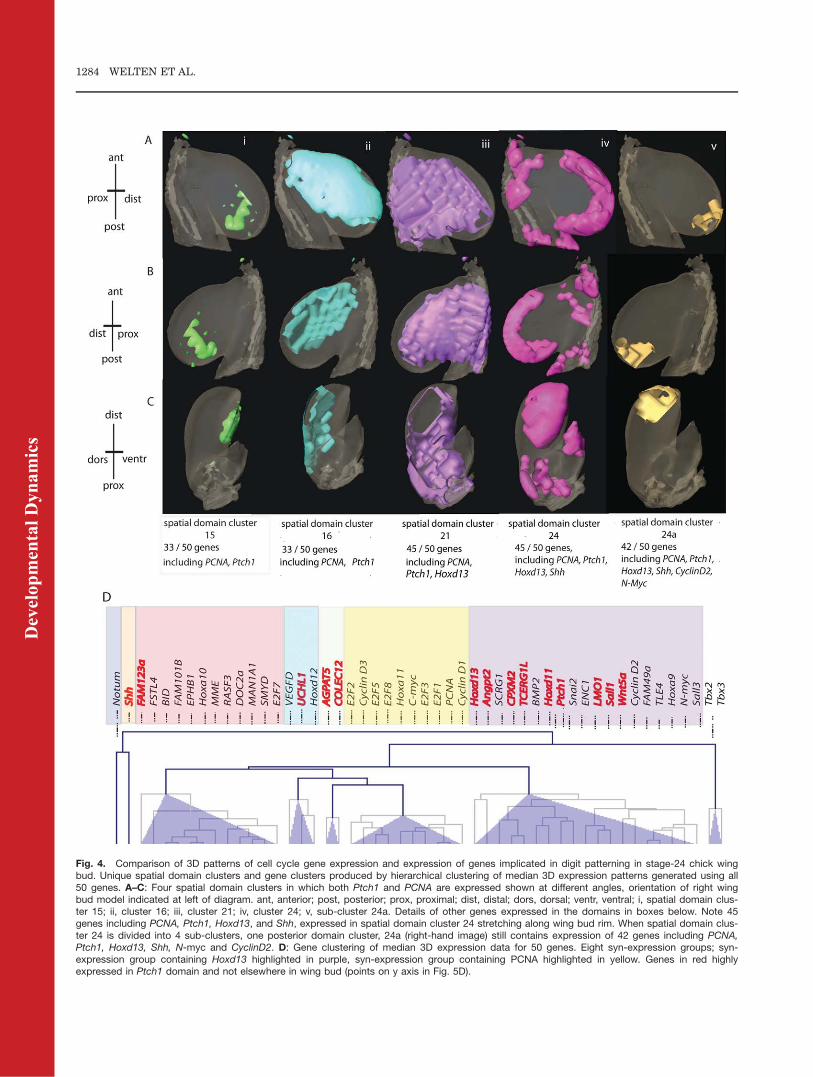
Fig. 4. Comparison of 3D patterns of cell cycle gene expression and expression of genes implicated in digit patterning in stage-24 chick wingbud. Unique spatial domain clusters and gene clusters produced by hierarchical clustering of median 3D expression patterns generated using all50 genes. A–C: Four spatial domain clusters in which both Ptch1 and PCNA are expressed shown at different angles, orientation of right wingbud model indicated at left of diagram. ant, anterior; post, posterior; prox, proximal; dist, distal; dors, dorsal; ventr, ventral; i, spatial domain clus-ter 15; ii, cluster 16; iii, cluster 21; iv, cluster 24; v, sub-cluster 24a. Details of other genes expressed in the domains in boxes below. Note 45genes including PCNA, Ptch1, Hoxd13, and Shh, expressed in spatial domain cluster 24 stretching along wing bud rim. When spatial domain clus-ter 24 is divided into 4 sub-clusters, one posterior domain cluster, 24a (right-hand image) still contains expression of 42 genes including PCNA,Ptch1, Hoxd13, Shh, N-myc and CyclinD2. D: Gene clustering of median 3D expression data for 50 genes. Eight syn-expression groups; syn-expression group containing Hoxd13 highlighted in purple, syn-expression group containing PCNA highlighted in yellow. Genes in red highlyexpressed in Ptch1 domain and not elsewhere in wing bud (points on y axis in Fig. 5D).
Dev
elop
men
tal D
ynam
ics
1284 WELTEN ET AL.
Identification of Genes
Expressed in Cells
Responding to Shh
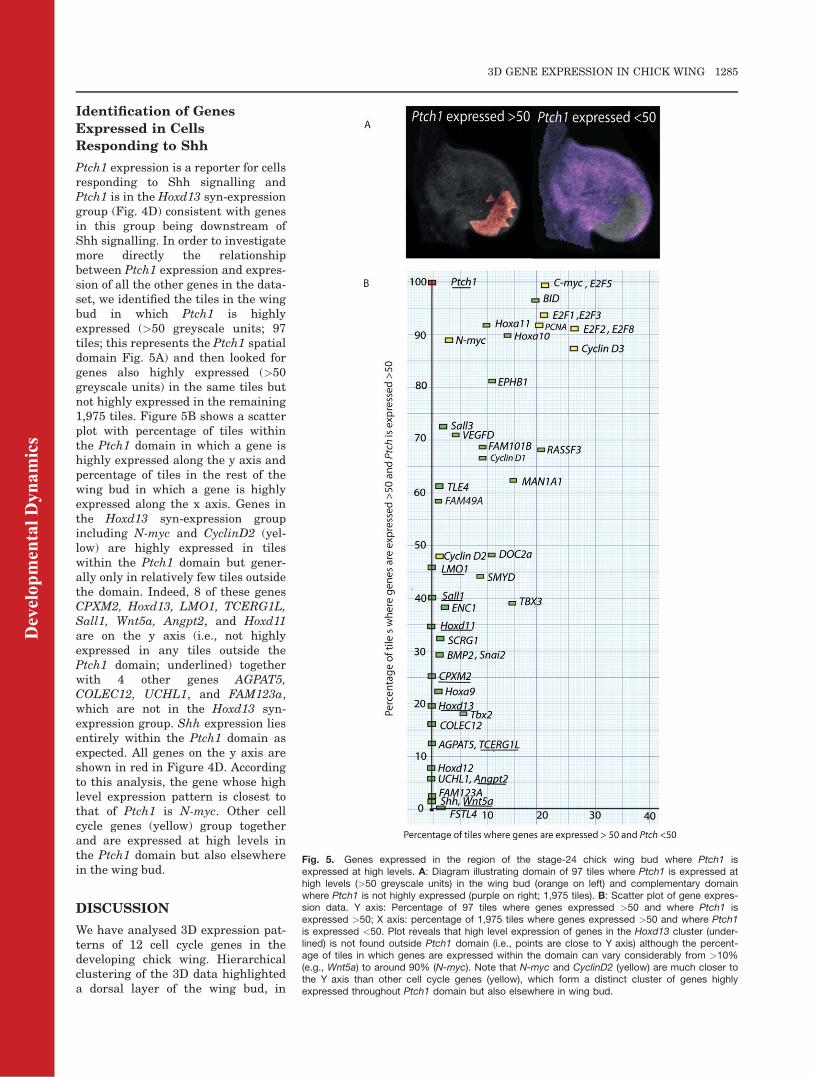
Ptch1 expression is a reporter for cellsresponding to Shh signalling andPtch1 is in the Hoxd13 syn-expressiongroup (Fig. 4D) consistent with genesin this group being downstream ofShh signalling. In order to investigatemore directly the relationshipbetween Ptch1 expression and expres-sion of all the other genes in the data-set, we identified the tiles in the wingbud in which Ptch1 is highlyexpressed (>50 greyscale units; 97tiles; this represents the Ptch1 spatialdomain Fig. 5A) and then looked forgenes also highly expressed (>50greyscale units) in the same tiles butnot highly expressed in the remaining1,975 tiles. Figure 5B shows a scatterplot with percentage of tiles withinthe Ptch1 domain in which a gene ishighly expressed along the y axis andpercentage of tiles in the rest of thewing bud in which a gene is highlyexpressed along the x axis. Genes inthe Hoxd13 syn-expression groupincluding N-myc and CyclinD2 (yel-low) are highly expressed in tileswithin the Ptch1 domain but gener-ally only in relatively few tiles outsidethe domain. Indeed, 8 of these genesCPXM2, Hoxd13, LMO1, TCERG1L,Sall1, Wnt5a, Angpt2, and Hoxd11are on the y axis (i.e., not highlyexpressed in any tiles outside thePtch1 domain; underlined) togetherwith 4 other genes AGPAT5,COLEC12, UCHL1, and FAM123a,which are not in the Hoxd13 syn-expression group. Shh expression liesentirely within the Ptch1 domain asexpected. All genes on the y axis areshown in red in Figure 4D. Accordingto this analysis, the gene whose highlevel expression pattern is closest tothat of Ptch1 is N-myc. Other cellcycle genes (yellow) group togetherand are expressed at high levels inthe Ptch1 domain but also elsewherein the wing bud.
DISCUSSION
We have analysed 3D expression pat-terns of 12 cell cycle genes in thedeveloping chick wing. Hierarchicalclustering of the 3D data highlighteda dorsal layer of the wing bud, in
Fig. 5. Genes expressed in the region of the stage-24 chick wing bud where Ptch1 isexpressed at high levels. A: Diagram illustrating domain of 97 tiles where Ptch1 is expressed athigh levels (>50 greyscale units) in the wing bud (orange on left) and complementary domainwhere Ptch1 is not highly expressed (purple on right; 1,975 tiles). B: Scatter plot of gene expres-sion data. Y axis: Percentage of 97 tiles where genes expressed >50 and where Ptch1 isexpressed >50; X axis: percentage of 1,975 tiles where genes expressed >50 and where Ptch1is expressed <50. Plot reveals that high level expression of genes in the Hoxd13 cluster (under-lined) is not found outside Ptch1 domain (i.e., points are close to Y axis) although the percent-age of tiles in which genes are expressed within the domain can vary considerably from >10%(e.g., Wnt5a) to around 90% (N-myc). Note that N-myc and CyclinD2 (yellow) are much closer tothe Y axis than other cell cycle genes (yellow), which form a distinct cluster of genes highlyexpressed throughout Ptch1 domain but also elsewhere in wing bud.
Dev
elop
men
tal D
ynam
ics
3D GENE EXPRESSION IN CHICK WING 1285
which all cell cycle genes except E2F7were expressed at stages 21, 24, and27. Preferential growth of the wingbud dorsally could be important inproducing the ventral curling of thebud. This elevated dorsal expressionof cell cycle genes was not previouslyappreciated and demonstrates how3D analysis can highlight dorso-ven-tral differences in expression. Itseems likely that expression of thecell cycle genes in this syn-expressiongroup could be regulated in the sameway, by Wnt and FGF signals fromthe dorsal ectoderm and/or from theapical ectodermal ridge, respectively.In addition to finding clusters of spa-tial domains of gene expression, wealso identified clusters of syn-expressed cell cycle genes. Positiveregulators of the cell cycle tend to besimilarly expressed with PCNA,E2F1, and C-myc having similarexpression patterns across all threestages together with E2F3 at laterstages (both E2F1 and E2F3 encodepositive regulators of the G1/S transi-tion). E2F7 encodes an inhibitor ofG2/M transition and is very weaklyexpressed throughout the wing bud.Expression patterns of N-myc andCyclinD2, also encoding positive regu-lators of the G1/S transition, are dis-tinct but closely related.
When we compared 3D expressionpatterns of these cell cycle genes andgenes identified by microarray analy-sis as being downstream of Shh sig-nalling and/or implicated in digit pat-terning, most genes, including cellcycle genes (except E2F7), wereexpressed at the very posterior wingbud tip overlapping with Shh andPtch1 expression, but many of these,particularly cell cycle genes, werealso expressed more widely. We alsoidentified a gene syn-expressiongroup comprising 19 posteriorlyexpressed genes; Hoxd13, most of thegenes in the Hoxd13 cluster previ-ously found to be in the same syn-expression group as Hoxd13 (Bangset al., 2010), other genes implicated indigit patterning, and the cell cyclegenes, N-myc and CyclinD2. Thisgroup also included Ptch1, and directcomparison between Ptch1 andexpression of the other 49 genesconfirmed that the 19 genes in theHoxd13 syn-expression group to-gether with a few other genes are
highly expressed specifically in cellsresponding to Shh. We suggest thatgenes in this group contribute to anetwork integrating digit patterningand growth in the wing downstreamof Shh signalling.
N-myc and CyclinD2, the two cellcycle genes in the Hoxd13 syn-expres-sion group, may play a specific role inmediating growth of the digit-formingfield required for proper digit pattern-ing. CyclinD2 expression is directlyregulated by N-myc (Bouchard et al.,1999) and, in posterior wing bud, isvery sensitive to inhibition of Shh sig-naling by cyclopamine. Like othergenes in the syn-expression group, N-myc and CyclinD2 are expressedthroughout the distal region of talpid3
chicken mutant wing buds (Towerset al., 2008) suggesting that expres-sion in normal wing buds is restrictedposteriorly due to Gli3 repressionanteriorly. Thus the dramaticincrease in growth in talpid3 chickenmutant wing buds is due to lack ofGli3 repressor function. Although Glibinding sites have been identified inpromoters of both N-myc andCyclinD2 human genes (Katoh andKatoh, 2009), these genes were notidentified as being direct Gli targetsin mouse limb (Vokes et al., 2008).Failure to identify these cell cyclegenes in the mouse could be due tothe fact that the limbs were analysedat a later stage in development.
Five genes in the Hoxd13 syn-expression group found here have al-ready been shown to be likely Gli tar-gets in the mouse with Hoxd13,Hoxd11 and Sall1 being regulated byGli3 repressor and and Bmp2 by Gliactivator (Vokes et al., 2008; Fig. 5,Table S6). However, Bmp2 isexpressed throughout the distal regionof talpid3 chicken mutant wing buds(Francis-West et al., 1995) and is alsoextended anteriorly in limb buds ofGli3�/� and Gli3�/� Shh�/� mouseembryos (Litingtung et al., 2002) sug-gesting regulation via Gli3 repression.
Other genes found to be syn-expressed with Hoxd13 include Snai2(formerly known as Slug) and Wnt5a.Snai2 encodes a member of the Snailfamily of zinc finger transcriptionfactors (Nieto, 2002). Microarrayanalysis of mouse limbs also identi-fied Snail as a gene preferentiallyexpressed posteriorly but no Gli-binding
sites were detected in the mouse genepromoter suggesting that Snail is anindirect target of Shh signalling(Table S6, Vokes et al., 2008). Snai2has been suggested to be involved inchick wing outgrowth (Ros et al.,1997; Buxton et al., 1997) but has abetter known role in chick neuralcrest cell migration and epithelial-mesenchymal transition, whichinvolves changes in cell polarity(Nieto, 2002). Interestingly, Wnt5ahas recently been suggested to act asa chemotactic factor for cells in thelimb bud and thus play a role in out-growth (Wyngaarden et al., 2010).Our analysis suggests that expressionof these two genes may be regulatedby Shh signalling, perhaps indicatinganother aspect of the way in whichpatterning and growth are integratedin the developing limb.
EXPERIMENTAL
PROCEDURES
Embryo Preparation
Fertilized White Leghorn chick eggswere incubated in a humidified incu-bator at 38�C until embryos were at adesired developmental stage (Ham-burger and Hamilton stages 21, 24,and 27; Hamburger and Hamilton,1951). Embryos were removed toice-cold Phosphate Buffered Saline(PBS; 0.02 M phosphate, 0.15 MNaCl) and cleaned of extra-embryonicmembranes. Eyes and forebrain werepunctured with a tungsten needle toreduce trapping of riboprobe andhearts punctured to allow escape ofblood, which would give a false signaldue to auto-flourescence.. Embryoswere transferred to 4% ice-cold para-formaldehyde (PFA) overnight, thenput through graded methanol seriesat 4�C; ending in 2 � 100% methanolwashes, stored at �20�C and usedwithin 6 weeks.
Probe Synthesis and In Situ
Hybridization
Probes were synthesized using astandard method and in situ hybrid-ization was carried out using a proto-col adapted from Nieto et al. (1993)(http://www.echickatlas.org/submission/protocols).
Dev
elop
men
tal D
ynam
ics
1286 WELTEN ET AL.
For E2F cell cycle genes, embryostaining with NBT/BCIP was carriedout using half the normal concentra-tion of NBT (http://www.echickatlas.org/submission/protocols/show/10) forscanning with a Bioptonics 3001 OPTscanner. (A Bioptonics Scanner has astronger UV lamp than the prototypescanner, causing excess NBT/BCIP todevelop background color and inter-fere with the gene expression signal.)After in situ hybridization, embryoswere embedded in 1% low meltingpoint agarose, dehydrated in Metha-nol, and cleared in Benzyl Alcohol –Benzyl Benzoate for subsequentOptical Projection Tomography (OPT;Sharpe et al., 2002).
OPT Scanning
OPT scanning was carried out usingeither a Bioptonics 3001 scanner(www.bioptonics.com) or a prototypeOPT scanner. A GFP channel wasused to scan the outline and anatomyof embryos, a bright-field channel wasused to visualize gene expression pat-terns. Resulting bitmap stacks (Biop-tonics) and wlz objects (prototypescanner) (http://genex.hgu.mrc.ac.uk/Software/woolz/) were imported intoAmira 5.2 software (http://www.amira.com/) and surface renderings ofembryo and volume renderings ofgene expression pattern generatedusing isosurface and voltex features,respectively. Surface renderings usedfor warping and volume renderingsproduced heat maps indicating levelsof expression.
Mapping and Computational
Analysis
Mapping of 3D gene expression dataon to reference models of stage-21,-24, and -27 chick wing buds was per-formed using Amira 5.2 software.Right wing buds were electronicallycropped from samples and data to bemapped were first roughly alignedwith the reference model, then, corre-sponding sets of landmarks, based onprominent morphological features ofthe wing bud, were set up betweenthe reference wing bud and the ana-tomical surface of the sample. Thesedata were then warped using a Book-stein thin plate spline method pro-vided by Amira. The same warp was
then applied to gene expression datafor that sample wing. For all 50genes, 3 duplicates were warped ontothe same stage-24 reference wing.Three duplicates of cell cycle geneswere also warped on to the same ref-erence wings at stage 21 and 27.Mapped gene expression data werethen converted to wlz objects (web-site), which hold mapped gene-expres-sion data as a grey-level image, from0–255 shades of grey (on an 8-bitgreyscale), where 0 is black/no geneexpression signal and 255 is white/high gene expression signal. Mappeddata were processed with in-housesoftware to derive a median expres-sion pattern for each gene (MRCHGU, Edinburgh, http://genex.hgu.mrc.ac.uk/MouseAtlasCD/html/guides/WlzUtilities). Each reference wingwith the median mapped data wasthen divided into tiles (i.e., uniquespatial domains measuring 5 � 5 � 5voxels); 923 tiles for stage 21, 2,071 forstage 24 and 4,444 for stage 27. Foreach tile, mean signal intensity valuesof each gene expression pattern werecalculated using in-house software(MRC HGU, Edinburgh) (Fisher et al.,2008; Bangs et al., 2010). These datawere organized in a tab-delimited filethat can be imported into TMeV(http://www.tm4.org/mev/) software,where they can be visualised in a 2Dmatrix and analyzed using hierarchi-cal clustering algorithms. Hierarchi-cal clustering using Pearson Correla-tion was applied to gene expressiondata to produce trees showing clus-ters of genes; and to the tiles to pro-duce trees showing clusters of spa-tial domains of gene expression.Clusters of spatial domains of geneexpression were imported intoAmira to produce 3D visualizations.The tab-delimited file can be proc-essed with EXCEL to calculate per-centage of tiles in a spatial domainin which expression of a gene is >50on an 8-bit greyscale.
ACKNOWLEDGMENTSWe thank Dave Burt (Roslin Institute)and Richard Baldock (MRC HGU,Edinburgh) for their initial inputs thatenabled this particular project to becarried out. This work was funded bythe following grants: BBSRC grantBB/G00093X/1 (to M.W., G.P., C.T.),
MRC grants G9806660 and G0801092(to M.F., M.T., C.T., F.B.), and TheRoyal Society (to C.T.).
REFERENCES
Bangs F, Welten M, Davey MG, Fisher M,Yin Y, Downie H, Paton B, Baldock R,Burt DW, Tickle E. 2010. Identificationof genes downstream of the Shh signal-ling in the developing chick wing andsyn-expressed with Hoxd13 usingmicroarray and 3D computational anal-ysis. Mech Dev 127:428–441.
Bouchard C, Thieke K, Maier A, SaffrichR, Hanley-Hyde J, Ansorge W, Reed S,Sicinski P, Bartek J, Eilers M. 1999.Direct induction of cyclin D2 by Myccontributes to cell cycle progression andsequestration of p27. EMBO J 18:5321–5333.
Buxton P, Kostakopoulou K, Brickel P,Thorogood P, Feretti P. 1997. Expres-sion of the transcription factor slug cor-relates with growth of the limb bud andis regulated by FGF-4 and retinoic acid.Int J Dev Biol 41:559–568.
Cooke J, Summerbell D. 1980. Cell cycleand experimental pattern duplication inthe chick wing during embryonic devel-opment. Nature 287:697–701.
Fallon JF, Crosby GM. 1977. Polarizing ac-tivity in limb buds of amniotes. In: EdeDA, Hincliffe JR, Balls M, editors. Verte-brate limb and somite morphogenesis.Cambridge: Cambridge University Press.
Fisher M, Clelland AK, Bain A, BaldockR, Murphy P, Downie H, Ticke C,Davidson D, Buckland RA. 2008. Inte-grating technologies for comparing 3Dgene expression domains in the devel-oping chick limb. Dev Biol 317:13–23.
Fisher M, Downie H, Welten M, DelgadoI, Bain A, Planzer T, Sherman A, SangH, Baldock R, Tickle C. 2011. Compara-tive analysis of 3D expression patternsof transcription factor genes in thedeveloping chick wing and digit fatemaps. PLoS ONE (in press).
Francis-West PH, Robertson KE, Ede DA,Rodriguez C, Izpisua-Belmonte JC,Houston B, Burd DW, Gribbin C,Brickel PM, Tickle C. 1995. Expressionof genes encoding bone morphogeneticproteins and sonic hedgehog in talpid(ta3) limb buds: their relationships inthe signalling cascade involved in limbpatterning. Dev Dyn 203:187–197.
Hamburger V, Hamilton H. 1951. A seriesof normal stages in the development ofthe chick embryo. J Morphol 88:49–92.
Isaac A, Rodriguez-Esteban C, Ryan A,Altabef M, Tsukui T, Patel K, Tickle C,Izpisua-Belmonte JC. 1998. Tbx genesand limb identity in chick embryodevelopment. Development 125:1867–1875.
Katoh Y, Katoh M. 2009. Hedgehog targetgenes: mechanisms of carcinogenesisinduced by aberrant hedgehog signalingactivation. Curr Mol Med 9:873–886.
Kohler T, Prols F, Brand-Saberi B. 2005.PCNA in situ hybridisation: a noveland reliable tool for detection of
Dev
elop
men
tal D
ynam
ics
3D GENE EXPRESSION IN CHICK WING 1287
dynamic changes in proliferative activ-ity. Histochem Cell Biol 123:315–327.
Litingtung Y, Dahn R, Li Y, Fallon JF,Chiang C. 2002. Shh and Gli3 are dis-pensable for limb skeleton formationbut regulate digit number and identity.Nature 418:979–983.
Nieto MA. 2002. The snail superfamily ofzinc-finger transcription factors. NatRev Mol Cell Biol 3:155–166.
Nieto MA, Patel K, Wilkinson DG. 1996.In situ hybridization analysis of chickembryos in whole mount and tissue sec-tions. Methods Cell Biol 51:219–235.
Riddle RD, Johnson RL, Laufer E, TabinC. 1993. Sonic hedgehog mediates thepolarizing activity of the ZPA. Cell 75:1401–1416.
Ros MA, Sefton M, Nieto MA. 1997. Slug,a zinc finger gene previously implicatedin the early patterning of the mesodermand the neural crest, is also involved inchick limb development. Development124:1821–1829
Saunders JW Jr, Gasseling MT. 1968.Ectoderm-mesenchymal interaction in
the origins of wing symmetry. In:Fleischmajer R, Billingham RE, editors.Epithelial-mesenchymal interactions.Baltimore: Williams and Wilkins. p 19.
Sharpe J, Ahlgren U, Perry P, Hill B,Ross A, Hecksher-Sorensen J, BaldockR, Davidson D. 2002. Optical projectiontomography as a tool for 3D microscopyand gene expression studies. Science296:541–545.
teWelscher P, Zuniga A, Kuijper S, Drenth T,Goedemans HJ, Meijlink F, Zeller R. 2002.Progression of vertebrate limb develop-ment through SHH-mediated counterac-tion ofGLI3. Science 298:827–830.
Tickle C. 2006. Making digit patterns inthe vertebrate limb. Nat Rev Mol CellBiol 7:45–53.
Towers M, Mahood R, Yin Y, Tickle C.2008. Integration of growth and specifi-cation in chick wing digit-patterning.Nature 452:882–886.
TowersM,FisunovG, TickleC. 2009. Expres-sion of E2F transcription factor familygenes during chick wing development.GeneExpression Patterns 9:528–531.
Vargesson N, Clarke JD, Vincent K, ColesC, Wolpert L, Tickle C. 1997. Cell fatein the chick limb bud and relationshipto gene expression. Development 124:1909–1918.
Vokes SA, Ji H, Wong WH, McMahon AP.2008. A genome-scale analysis of thecis-regulatory circuitry underlying sonichedgehog-mediated patterning of themammalian limb. Genes Dev 22:2651–2663.
Wolpert L. 1969. Positional informationand the spatial pattern of cellular for-mation. J Theor Biol 25:1–47.
Wyngaarden LA, Vogeli KM, Ciruna BG,Wells M, Hadjantonakis AK, Hopyan S.2010. Oriented cell motility and divisionunderlie early limb bud morphogenesis.Development 137:2551–2558.
Yin Y, Bangs F, Paton IR, Prescott A,James J, Davey MG, Whitley P,Genikhovich G, Technau U, Burt DW,Tickle C. 2009. The Talpid3 gene(KIAA0586) encodes a centrosomal pro-tein that is essential for primary ciliaformation. Development 136:655–664.
Dev
elop
men
tal D
ynam
ics
1288 WELTEN ET AL.
Related Documents


