[Review] 3D Change Detection – Approaches and Applications - ISPRS J. of Photogram. and Rem. Sens. 1 3D change detection – approaches and applications Rongjun Qin a, b,* , Jiaojiao Tian c , Peter Reinartz c a Department of Civil, Environmental and Geodetic Engineering, The Ohio State University, 218B Bolz Hall, 2036 Neil Avenue, Columbus, OH 43210, USA. Tel: +1 614 292 4356. Email: [email protected] b Department of Electrical and Computer Engineering, The Ohio State University, 205 Dreese Labs, 2015 Neil Avenue, Columbus, OH, 43210, USA c German Aerospace Center (DLR), Remote Sensing Technology Institute (IMF), 82234 Wessling, Germany Abstract: Due to the unprecedented technology development of sensors, platforms and algorithms for 3D data acquisition and generation, 3D spaceborne, airborne and close-range data, in the form of image based, Light Detection and Ranging (LiDAR) based point clouds, Digital Elevation Models (DEM) and 3D city models, become more accessible than ever before. Change detection (CD) or time-series data analysis in 3D has gained great attention due to its capability of providing volumetric dynamics to facilitate more applications and provide more accurate results. The state-of-the-art CD reviews aim to provide a comprehensive synthesis and to simplify the taxonomy of the traditional remote sensing CD techniques, which mainly sit within the boundary of 2D image/spectrum analysis, largely ignoring the particularities of 3D aspects of the data. The inclusion of 3D data for change detection (termed 3D CD), not only provides a source with different modality for analysis, but also transcends the border of traditional top-view 2D pixel/object-based analysis to highly detailed, oblique view or voxel-based geometric analysis. This paper reviews the recent developments and applications of 3D CD using remote sensing and close-range data, in support of both academia and industry researchers who seek for solutions in detecting and analyzing 3D dynamics of various objects of interest. We first describe the general considerations of 3D CD problems in different processing stages and identify CD types based on the information used, being the geometric comparison and geometric-spectral analysis. We then summarize relevant works and practices in urban, environment, ecology and civil applications, etc. Given the broad spectrum of applications and different types of 3D data, we discuss important issues in 3D CD methods. Finally, we present concluding remarks in algorithmic aspects of 3D CD. Keywords: 3D Change Detection; Digital Surface Models; Oblique Images; LiDAR; Land-cover Classification; Very High Resolution 1. Introduction Notations of spatial resolution defined in this article: LTMR: Low-to-medium Resolution; refers to remote sensing data with a spatial resolution lower than 4 meters. HR: High resolution; Refers to remote sensing data with a spatial resolution of 1-4 meters VHR: Very high resolution; Refers to remote sensing data with a spatial resolution of 0.3-1 meters. UHR: Ultra-high resolution; Refers to remote sensing data with a spatial resolution less than 0.3 meters. Change detection (CD) and analysis is one of the major topics in remote sensing. It is referred by Singh (1989) as “the process of identifying differences in the state of object or phenomenon by observing it

Welcome message from author
This document is posted to help you gain knowledge. Please leave a comment to let me know what you think about it! Share it to your friends and learn new things together.
Transcript
[Review] 3D Change Detection – Approaches and Applications - ISPRS J. of Photogram. and Rem. Sens.
1
3D change detection – approaches and applications
Rongjun Qina, b,*, Jiaojiao Tianc, Peter Reinartzc
aDepartment of Civil, Environmental and Geodetic Engineering, The Ohio State University, 218B Bolz Hall, 2036 Neil
Avenue, Columbus, OH 43210, USA. Tel: +1 614 292 4356. Email: [email protected] bDepartment of Electrical and Computer Engineering, The Ohio State University, 205 Dreese Labs, 2015 Neil
Avenue, Columbus, OH, 43210, USA cGerman Aerospace Center (DLR), Remote Sensing Technology Institute (IMF), 82234 Wessling, Germany
Abstract: Due to the unprecedented technology development of sensors, platforms and algorithms for
3D data acquisition and generation, 3D spaceborne, airborne and close-range data, in the form of image
based, Light Detection and Ranging (LiDAR) based point clouds, Digital Elevation Models (DEM) and 3D
city models, become more accessible than ever before. Change detection (CD) or time-series data
analysis in 3D has gained great attention due to its capability of providing volumetric dynamics to
facilitate more applications and provide more accurate results. The state-of-the-art CD reviews aim to
provide a comprehensive synthesis and to simplify the taxonomy of the traditional remote sensing CD
techniques, which mainly sit within the boundary of 2D image/spectrum analysis, largely ignoring the
particularities of 3D aspects of the data. The inclusion of 3D data for change detection (termed 3D CD),
not only provides a source with different modality for analysis, but also transcends the border of
traditional top-view 2D pixel/object-based analysis to highly detailed, oblique view or voxel-based
geometric analysis. This paper reviews the recent developments and applications of 3D CD using remote
sensing and close-range data, in support of both academia and industry researchers who seek for
solutions in detecting and analyzing 3D dynamics of various objects of interest. We first describe the
general considerations of 3D CD problems in different processing stages and identify CD types based on
the information used, being the geometric comparison and geometric-spectral analysis. We then
summarize relevant works and practices in urban, environment, ecology and civil applications, etc.
Given the broad spectrum of applications and different types of 3D data, we discuss important issues in
3D CD methods. Finally, we present concluding remarks in algorithmic aspects of 3D CD.
Keywords: 3D Change Detection; Digital Surface Models; Oblique Images; LiDAR; Land-cover
Classification; Very High Resolution
1. Introduction
Notations of spatial resolution defined in this article:
LTMR: Low-to-medium Resolution; refers to remote sensing data with a spatial resolution lower than 4 meters.
HR: High resolution; Refers to remote sensing data with a spatial resolution of 1-4 meters
VHR: Very high resolution; Refers to remote sensing data with a spatial resolution of 0.3-1 meters.
UHR: Ultra-high resolution; Refers to remote sensing data with a spatial resolution less than 0.3 meters.
Change detection (CD) and analysis is one of the major topics in remote sensing. It is referred by Singh
(1989) as “the process of identifying differences in the state of object or phenomenon by observing it
[Review] 3D Change Detection – Approaches and Applications - ISPRS J. of Photogram. and Rem. Sens.
2
at different times”. Three-dimensional (3D) CD, as a subset of the general remote sensing CD problem, is
featured by its additional data source (height, depth, or full 3D information) and the possible outcomes
(volumetric/height differences). The data can be 3D models, point clouds or digital elevation models
(DEM) that provide explicit 3D positions/shapes of the ground objects, or stereo-view/multi-view images
that have potentials to generate such explicit 3D information. 3D CD is a relatively new topic, greatly
driven by the growing accessibility of 3D data and need in 3D smart cities (Daniel and Doran, 2013;
Gruen, 2013). With this new dimensional information, the scope of CD applications can be greatly
expanded to a full 3D space, with flexibilities of detecting change in any viewing perspective and level of
detail, including but not limited to 3D deformation analysis in landslides, fault rupture detection, 3D city
model updating, 3D structure and construction monitoring, 3D object tracking, tree growth monitoring
and biomass estimation etc. (Choi and Lee, 2011; Kim et al., 2013; Miller et al., 2000; Rebolj et al., 2008;
Torres-Sánchez et al., 2014). Moreover, the 3D geometric information reflects the physical geometry of
the objects, which has a great potential to improve the performance and overcome some of the limits of
traditional 2D image-based CD.
1.1. Existing challenges and limits in traditional 2D image-based change detection
For a long time, many CD studies have been conducted using 2D remote sensing images on large-scale
problems such as forest monitoring, urban sprawl, earthquake assessment, etc. (Brunner et al., 2010;
Coppin et al., 2004; Hayes and Sader, 2001; Lu et al., 2004; Ram and Kolarkar, 1993; Saito et al., 2004;
Song et al., 2014; Tewkesbury et al., 2015). Among these works, most of the CD tasks were performed
using low-to-medium resolution (LTMR) images on a landscape level (Ingram et al., 1981; Lambin and
Ehrlich, 1997; Lu et al., 2002; Mas, 1999; Metternicht, 1999; Singh, 1986). A few of them investigated
the possibility of using very high resolution (VHR) images for 2D CD in a finer level (Bouziani et al., 2010;
Brunner et al., 2010; Huang et al., 2014; Košecka, 2012; Vakalopoulou et al., 2015). However, as the
image resolution reaches a finer level, several problems emerge in 2D CD:
1). Higher spectral variability: Pixels in VHR images reveal more detailed information, which greatly
reduced the mixed-pixel effect in comparison to LTMR (Foody, 1996). However, it also brings higher
spectral variability for ground objects, since an object can be represented by a group of pixels with
different spectral values (Blaschke, 2010). This makes the CD results more sensitive to techniques
related to pixel-wise comparison such as image differencing and ratioing (Lu et al., 2004; Singh, 1989).
2) Perspective distortion: Image registration is a crucial step for 2D CD requiring per-pixel
correspondences, which is usually modeled by 2D transformations (rigid, similarity and projection, etc.).
The 2D transformations approximate the ground as a planar surface, which might be reasonable for
LTMR images whereas they are too coarse for VHR images, consequently leading to the problem of
multi-sensor image registration (Chen et al., 2014; Qin et al., 2013). To a technically more extreme yet
common example, i.e. close-range images in a complex street environment (Qin and Gruen, 2014; Xiao
et al., 2015), purely 2D image-based CD is less likely to be considered due to the large differences of
viewing angle and perspective effects. Therefore, most of the 2D CD works limit their study scope to
images that have similar viewing angles and are captured by the same or similar sensors (Bouziani et al.,
2010; Pacifici et al., 2007), largely restricted to top-view remote sensing data.
[Review] 3D Change Detection – Approaches and Applications - ISPRS J. of Photogram. and Rem. Sens.
3
3) Lack of volumetric information. 2D CD can extract planimetric changes such as
appearing/disappearing, shrinking/expanding. However, these results do not suffice the need of
applications requiring the vertical information, such as quantitative estimation of landslides volume,
tree growth and building construction progress monitoring (Martha et al., 2010; Tian et al., 2014b;
Waser et al., 2008).
Techniques were used to address the first two problems in 2D CD for VHR image (Noh and Howat, 2015).
As for the first problem, post-classification methods (Pacifici et al., 2007) are usually applied to label the
multi-temporal images to bypass the direct comparison of the image spectral values. The object-based
analysis is also regarded as an approach that reduces the spectral value variation for change detection
(Hussain et al., 2013). To address the perspective differences (problem 2), object-based methods are
adopted to segment the image into pixel groups (also called super pixels or regions) (Hussain et al.,
2013), with the intention to increase the overlap of identical objects for reducing misregistration errors
(Chen et al., 2014; Desclée et al., 2006; Durieux et al., 2008). Another approach adopts image pyramids
for hierarchical result fusion, which takes the CD results of the coarse image level and gradually applies
them to a finer level (Carvalho et al., 2001). These techniques partially addressed the perspective-
induced misregistration to a certain level, while the compromise of resolution and granularity brings a
lot of detection errors. Indeed, though object-based methods seem to be a fair trick to increase the
tolerance of 2D image comparison to perspectively distorted images, it is still quite sensitive to
registration errors (Chen et al., 2014).
1.2. Advantages and challenges in 3D change detection
1.2.1. Advantages
3D CD has clearly more advantages towards the limitations of 2D CD (as shown in Table 1), as the 3D
geometric information is free of illumination variations and perspective distortions. The co-registration
of 3D data can be rigorously modeled and the pixel/object/surface correspondences can be more
precisely achieved (Gruen and Akca, 2005), with all range of objects in CD applications. These
advantages have been known for a long time (Murakami et al., 1999), while the major barrier of 3D CD
applications was the cost and accessibility of accurate 3D data: Airborne LiDAR flights were usually
expensive, and high accuracy photogrammetric stereo measurements from images still required manual
involvement. Nowadays we get much better access to accurate 3D data: low-cost lightweight LiDAR and
terrestrial LiDAR system are becoming more affordable, and the recent development of automated
image geo-referencing (Pierrot-Deseilligny et al., 2011; Snavely et al., 2006) and advanced dense image
matching (DIM) techniques have dramatically raised the availability of image-based 3D information
(Remondino et al., 2014) with improved quality. Image data from UAV (unmanned aerial vehicle) and
satellite platforms can be readily processed automatically, flowing from images to point clouds and
digital surface models (DSM). It is capable of automatically generating LiDAR comparable dense point
clouds within a reasonable processing time (Gehrke et al., 2010). Additionally, improved optical satellite
sensors enable acquiring large scale (even multi-view) stereo images with sub-meter spatial resolution
(such as Worldview, GeoEye images), with short revisit cycles. Nano satellite systems (Barnhart et al.,
2007), which coordinate a series of low-cost optical satellites in the orbit, can constantly acquire high
[Review] 3D Change Detection – Approaches and Applications - ISPRS J. of Photogram. and Rem. Sens.
4
resolution images with a global coverage on a daily basis. These sources make the 3D information more
accessible and thereby have motivated great interest in using such 3D data for CD problems.
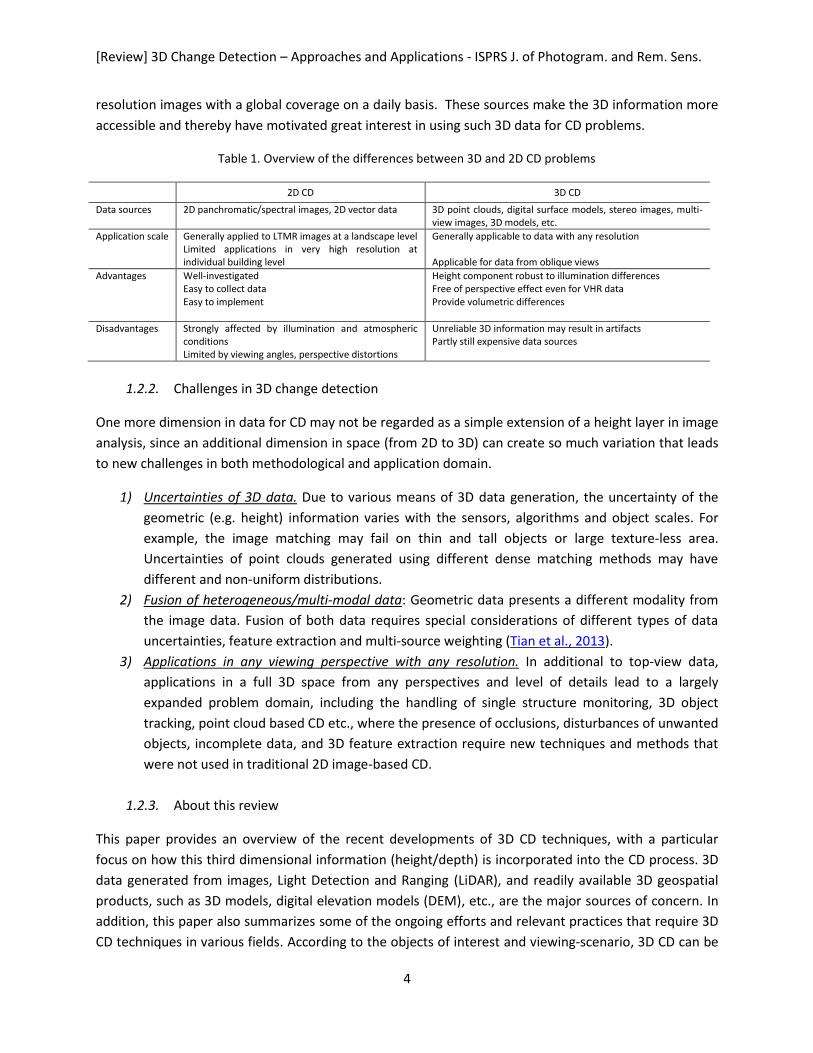
Table 1. Overview of the differences between 3D and 2D CD problems
2D CD 3D CD
Data sources 2D panchromatic/spectral images, 2D vector data 3D point clouds, digital surface models, stereo images, multi-view images, 3D models, etc.
Application scale Generally applied to LTMR images at a landscape level Limited applications in very high resolution at individual building level
Generally applicable to data with any resolution Applicable for data from oblique views
Advantages Well-investigated Easy to collect data Easy to implement
Height component robust to illumination differences Free of perspective effect even for VHR data Provide volumetric differences
Disadvantages Strongly affected by illumination and atmospheric conditions Limited by viewing angles, perspective distortions
Unreliable 3D information may result in artifacts Partly still expensive data sources
1.2.2. Challenges in 3D change detection
One more dimension in data for CD may not be regarded as a simple extension of a height layer in image
analysis, since an additional dimension in space (from 2D to 3D) can create so much variation that leads
to new challenges in both methodological and application domain.
1) Uncertainties of 3D data. Due to various means of 3D data generation, the uncertainty of the
geometric (e.g. height) information varies with the sensors, algorithms and object scales. For
example, the image matching may fail on thin and tall objects or large texture-less area.
Uncertainties of point clouds generated using different dense matching methods may have
different and non-uniform distributions.
2) Fusion of heterogeneous/multi-modal data: Geometric data presents a different modality from
the image data. Fusion of both data requires special considerations of different types of data
uncertainties, feature extraction and multi-source weighting (Tian et al., 2013).
3) Applications in any viewing perspective with any resolution. In additional to top-view data,
applications in a full 3D space from any perspectives and level of details lead to a largely
expanded problem domain, including the handling of single structure monitoring, 3D object
tracking, point cloud based CD etc., where the presence of occlusions, disturbances of unwanted
objects, incomplete data, and 3D feature extraction require new techniques and methods that
were not used in traditional 2D image-based CD.
1.2.3. About this review
This paper provides an overview of the recent developments of 3D CD techniques, with a particular
focus on how this third dimensional information (height/depth) is incorporated into the CD process. 3D
data generated from images, Light Detection and Ranging (LiDAR), and readily available 3D geospatial
products, such as 3D models, digital elevation models (DEM), etc., are the major sources of concern. In
addition, this paper also summarizes some of the ongoing efforts and relevant practices that require 3D
CD techniques in various fields. According to the objects of interest and viewing-scenario, 3D CD can be
[Review] 3D Change Detection – Approaches and Applications - ISPRS J. of Photogram. and Rem. Sens.
5
applied to both remote sensing data (captured from a top-view) and close-range/oblique data. Although
applications and data are highly different, two fundamental utilizations of the 3D data can largely
encapsulate the current 3D CD techniques: 1) Geometric comparison and 2) geometric-spectral analysis.
We first present the major steps of a 3D CD problem in section 2, and address the technical details of
these two points in section 3. In section 4, we categorize and identify applications and works based on
different fields supported by 3D CD. In section 5, we discuss the potential problems and remaining
challenges by summarizing the presented methods. Section 6 summarizes this survey and provides
recommendations on 3D CD solutions.
2. General considerations
3D change detection techniques are highly disparate for many applications. Different applications vary
in the object of interest, resolution, quality of available 3D information, etc. Similar to traditional 2D
image-based CD, 3D CD tasks typically have three processing steps: (a) Data acquisition/selection; (b)
Data co-registration; (c) Change analysis. The first two steps are regarded as the preprocessing steps
that generate and align multi-temporal 3D data for change detection and analysis. When 3D information
is incorporated in the process, each step requires special considerations (summarized in Table 2). This
section outlines the important aspects of 3D data acquisition/generation, co-registration and the change
representation in 3D.
Table 2. Key considerations in a 3D CD task
Steps Descriptions Considerations
Data acquisition Data co-registration
3D-IMP: multi-view or stereo view images 3D-EXP: point clouds, 3D models, DSMs etc. Acquire/select 3D multi-temporal data (at least two dates). Data can be either 3D-IMP or 3D-EXP. Platforms: Airplane, UAV, satellite, balloon, mobile vehicle, terrestrial stations, etc. Sensors: Optical camera, range camera, LiDAR, SAR. Align two different datasets in a common coordinates system for point-by-point comparisons, with generally one of the following three methods: 1. Using imaging sensor geometry (bundle adjustment); 2. Local method: direct 3D transformation using a set of point correspondences; 3. Global method: iterative 3D
Cross-seasonal effects may induce geometric changes. The collection of input data should avoid extreme weather conditions such as heavy snows and drought of rivers.
Resolution and accuracy should match the range of the object. The resolution should be higher such that the object of interest can be recorded by tenths of points or hundreds of pixels for robust estimation.
Top-view image blocks should be acquired following photogrammetric standards, e.g. 60-80% in forward and side overlap.
For satellite stereo images, intersection angle should be within the range of 15 to 25 degrees to obtain good DSM for methods such as SGM (Semi-global Matching) in urban areas, and can be slightly larger (up to 40 degrees) for smooth terrain (suburban, mountainous areas).
For off-track stereo images, capturing dates of two images should be within a few months, and the radiometric difference of two images should not be large.
In oblique and close-range case, incomplete/occluded data may lead to false detection. Convergence images, and/or multi-scan LiDAR point clouds are needed to close gaps.
Co-registration of 3D-IMP data or the mixture of 3D-IMP and 3D-EXP should be performed using imaging sensor geometry.
Co-registration of 3D-IMP data should be done before turning them into 3D-EXP data.
The 3D transformation of 3D-EXP data can be performed combing both local and global methods to achieve higher accuracy.
Co-registration for oblique-view datasets is more
[Review] 3D Change Detection – Approaches and Applications - ISPRS J. of Photogram. and Rem. Sens.
6
Change representation
transformation using all points of the datasets (e.g. Least squares 3D surface matching) and ICP (iterative closest point). Determine whether a point/group of points is changed between two datasets. There are three types of change presentations: 1. Binary change mask (change/non-change); 2. Triple change mask (positive, negative change, or non-change); 3. Type change (requiring post-classification).
complicated and may require initial values for co-registration
For a final representation of a triple change mask, the
height/depth information should be used independently of
the spectral image.
Height/depth information can be used to increase the classification accuracy.
Both the spectral and height/depth information infer change detection. An optimally combined use is a key to produce good CD results.
2.1 Data acquisition and generation
The selection/acquisition of data is an important issue to address a CD problem (Lu et al., 2004).
Different applications consider objects with different ranges (from millimeter to kilometers); data with a
matching resolution and accuracy to the object of interest is always desirable for computation and
storage considerations (Tewkesbury et al., 2015). Sometimes we are not so “free” to select or acquire
optimal datasets, e.g. time specific data such as pre-earthquake data or data of a particular day, in which
we basically need to rely on what we have to tackle the relevant problems. Here in this subsection, we
consider that in most cases we have certain flexibilities for 3D data acquisition and generation with
common approaches. Input 3D data can be in various forms such as stereo images, DEM, point clouds
and 3D models (vector data) that spatially represent the ground geometry.
2.1.1. Seasonal effects
Seasonal variation is an undesired factor for traditional 2D CD, of which the humidity, snows and color
change of tree/flowers etc. are all disturbances for detecting actual changes. 3D data are more robust
towards this issue. However, in the case that the ground geometry also changes, such as leaves on/off,
dryness of the river and high-level of snow coverage (Qin et al., 2015b), seasonal effects may still create
disturbances for 3D CD. It is still important to avoid such extreme seasonal discrepancies when selecting
data for 3D CD, but this is generally less restrictive than for 2D cases (Hussain et al., 2013), which stated
that images should be acquired at nearly the same time of a year.
2.1.2. 3D data acquisition
Acquiring high-quality 3D data is an important starting point. The quality of the 3D data usually refers to
the accuracy in geometry, completeness, and resolution. Accuracy and resolution requirement for a CD
task usually depend on the range of the objects of interest. Data with a matching resolution and
accuracy refers to data that exhibit at least equal resolution and accuracy to the object scale. Slightly
higher resolution and accuracy are often desired, such that the object of interest can be recorded by
tens of points or hundreds of pixels, as it will provide detailed information for object-based analysis
(Blaschke, 2010).
[Review] 3D Change Detection – Approaches and Applications - ISPRS J. of Photogram. and Rem. Sens.
7
(a) LiDAR data
3D data from LiDAR have consistent ranging accuracies. Depending on the platforms and sensors, the
resolution/point density varies greatly from a few points per m2 to thousands of points per m2. Airborne
LiDAR data is usually regarded as a reliable data source for CD. Every single measurement is highly
accurate and in a top-view set up for data capture, and there is not much occlusion. However, when
close-range data is considered, such as terrestrial or mobile LiDAR, data completeness becomes a critical
issue for change detection, as very likely the occluded area will be identified as changes. Therefore
getting complete data requires multiple scans, or to keep the multi-temporal data constantly have the
same occlusions.
(b) Image-derived 3D data
For 3D data derived from images, the achievable geo-referencing accuracy is largely correlated to the
resolution. Though theoretically other factors, such as sensor distortion, image noise may affect the
accuracy as well, these may not be critical issues nowadays for professional or even consumer grade
cameras. A major factor for the geo-referencing accuracy is the camera network design (Alsadik et al.,
2013) which will be decisive to the performance of image geo-referencing (or bundle adjustment). For
aerial and UAV photogrammetry, image blocks with at least 60-80% overlap in both forward and side
direction usually renders good ray-intersection, thus giving good accuracy in spatial resection. Such
requirements are fairly easy to achieve with automated piloting and shuttering system (Chao et al.,
2010): camera shutters are triggered when onboard location reading from the GPS (global positioning
system) aligns with the pre-defined waypoints. Nowadays even consumer grade UAVs are equipped with
such system (Colomina and Molina, 2014).
Satellite stereo imagery is another important 3D data source of consideration. Often the providers offer
on-track stereo images, the intersection (or convergence) angle of which should be kept within 15-25
degrees to get small parallax for narrow-baseline matching methods such as SGM (d'Angelo et al., 2014).
It can be slightly larger (up to 40 degrees) for smooth terrain or mountains. Off-track stereo images (two
images taken from different days) refer to image pairs that are not intended to capture as stereo images.
Such pairs are selected from single images taken at different dates, of which the capture dates,
radiometric properties, and intersection angle needs to be carefully evaluated: capturing date should be
within a few months to avoid significant changes between two images of the stereo pair. The
radiometric difference of two images should not be significant to affect image matching performances.
Data occlusion (incompleteness) is not a significant problem for top-view data (from aerial/UAV).
However, this is an important concern when acquiring image data in oblique or terrestrial scenarios to
cover every façade of the objects. Convergence images (Remondino and El‐Hakim, 2006) are necessary
to cover occluded parts of the objects, such as the corner of the walls.
2.1.3. Image matching algorithm
Image derived 3D point clouds are generated from geo-referenced images by dense image matching
(DIM) techniques, the performance of which is decisive on the quality of the resulting point clouds. DIM
[Review] 3D Change Detection – Approaches and Applications - ISPRS J. of Photogram. and Rem. Sens.
8
methods with multiple images fall generally into two categories according to how images are structured
(Remondino et al., 2014), 1) multi-stereo matching (MSM); 2) Multi-view matching (MVM). MSM is a
direct extension of two-view stereo matching, in which images are paired and point clouds of each pair
are fused/filtered to form a final point cloud (Haala and Rothermel, 2012; Hirschmüller, 2005). MVM
considers matching points across multiple images simultaneously (Baltsavias, 1991; Furukawa and Ponce,
2010). MVM is a more rigorous way to incorporate redundant information, but often more complicated
to implement. A recent review (Remondino et al., 2014) in DIM compared different software packages
(contain methods from both MSM and MVM categories) in generating point clouds from consumer
grade images. No specific conclusions were given on the performance of all test methods, due to the
complex test cases and flexibility of tunable parameters. Both types of methods have advantages and
disadvantages, and their performances vary with the camera network, scene content, and complexity,
strategies for point matching (global or local) etc. Our own experience is that generally for top-view
photogrammetric images blocks (60-80% overlap for frame images and 15-25 degrees of intersection
angle for satellite images), the MSM methods such as SGM (semi-global matching) appear to be a good
choice, it leverages both speed and performances (d’Angelo and Reinartz, 2011; Krauß et al., 2013).
However for images taken from terrestrial and mobile platforms, especially for those that form large
baselines and poor camera networks, MVM methods in general produce more complete point clouds,
since the visibility are modeled while many stereo algorithms tend to resist objects with large parallax
(Morgan et al., 2010; Seitz et al., 2006).
2.2. Data co-registration
To compare two datasets captured in different times, spatial co-registration is a key step to building up
point-to-point, patch-to-patch or point-to-patch correspondences. An apparent advantage of the 3D co-
registration is that the 3D data alignment can be well-modeled by 3D rigid (Besl and Mckay, 1992) or
similarity transformations (Gruen and Akca, 2005). Here we differentiate two types of 3D data: 1) data
contain explicit 3D information (3D-EXP) such as 3D point clouds, DSM, 3D models; 2) data contain
implicit 3D information (3D-IMP) such as multi-view/stereo-view images. Depending on the input multi-
temporal data pairs (3D-EXP, 3D-IMP or mixture), the co-registration can be applied either under the
constraint of the imaging sensor geometry (Fischler and Bolles, 1981) or by direct 3D transformations. A
common approach to co-register two sets of 3DIMP data or mixture (one with 3D-EXP, and the other
with 3D-IMP) is to use a set of GCPs (ground control points) and corresponding points, through the
process of bundle adjustment (Fraser and Hanley, 2003; Triggs et al., 2000). When GCPs are not
available, virtual GCPs can be measured from 3D-EXP data for bundle adjustment. The co-registration
between two 3D-IMP data can be performed with free-network bundle adjustment without control
points. In particular, if a large amount of correspondences are used under a rigorous sensor model, high-
accuracy data alignment can be achieved (Qin, 2014b) for bi-temporal and multi-temporal data sets (Qin
et al., 2015b). It is recommended to co-register two 3D-IMP datasets before converting them into 3D-
EXP datasets, as the process of generating 3D-EXP data from 3D-IMP data (e.g. DSM generation from
image blocks) may produce errors and uncertainties (Qin, 2014a; Qin, 2014b; Qin and Gruen, 2014).
To co-register two sets of 3D-EXP data, both local and global 3D transformations can be applied. Local
methods directly compute 3D transformations using a selected set of point correspondences (Theiler et
[Review] 3D Change Detection – Approaches and Applications - ISPRS J. of Photogram. and Rem. Sens.
9
al., 2014), while the global methods minimizes the summed squared error of point-to-point or point-to-
surface distances, such as least squares 3D matching (Gruen and Akca, 2005) and Iterative closest point
(ICP) algorithm (Besl and Mckay, 1992; Chen and Medioni, 1992; Zhang, 1994). These global methods
have outlier removal procedures that are robust to data with a certain level of noise (Pilgrim, 1996).
Descriptions of similar methods that minimize point-to-surface distances can be found in (Habib and
Schenk, 1999; Karras and Petsa, 1993; Maas, 2000; Schenk et al., 2000). For the co-registration of two
DSMs, the process is usually simplified by estimating a 3D shift between two datasets and minimizing
the differences in height (Zhang and Cen, 2008). Terrestrial 3D-EXP data are often more complicated for
co-registration due to the complex geometry and occlusions. Moreover, two acquisitions may not be in a
common coordinate system, and initial values for the 3D transformation are needed. The local and
global methods are very often applied in a combined fashion: 3D correspondences are first used to
perform a coarse estimation of the transformation parameters, and then LS3D (Least Squares 3D Surface
Matching) or ICP are applied to achieve point/pixel level registration.
2.3. Change representation
In general, the information of change can be represented in three categories: 1) binary change (Radke et
al., 2005); 2) triple change mask: positive, negative and non-change (Tian et al., 2010) and 3) type
change (Lu et al., 2004). The binary change provides a binary indicator on change/non-change area. The
second type is a triple indicator that labels the status of the change in geometry: “positive” refers to
increased height/reduced depth and negative refers to the opposite. Type change is the most general
and complete representation for CD tasks (Lu et al., 2004). It requires a full change matrix that specifies
the change direction of the land-cover in a bi-temporal basis, and the positive/negative change can be
additionally incorporated to each type changes.
These three categories of change representation could largely encapsulate general cases. Both category
2) and category 3) are mainly considered in top-view data scenarios, in which the third-dimensional
information is provided as height and depth. In such cases, the presentation is similar to 2D CD, with the
smallest unit being a pixel, object or 3D surface patch. For category 2), the height/depth information
plays a major role in change representation, and the spectral information may be used to assist the
change analysis (Tian et al., 2010). Post-classification is usually needed for calculating the type changes
for category 3), and the use of height/depth information may be effective to improve the classification
accuracy of the urban area (Huang et al., 2011) (Qin et al., 2015a) (Zhang et al., 2015).
The final change determination is usually performed through the comparison of the geometric
(height/depth) and/or spectral information (Sasagawa et al., 2013; Stal et al., 2013). Both the geometric
and spectral differences infer cues of possible changes, while such cues may have strong conflicting
evidence that may require proper weighting scheme between them (Tian and Reinartz, 2013; Zebedin et
al., 2008).
3. Change detection techniques with 3D information
The process of change detection and analysis is to find out the differences of the registered 3D data,
optionally with associated spectral information. The 3D data can be in various formats. A DSM is a
[Review] 3D Change Detection – Approaches and Applications - ISPRS J. of Photogram. and Rem. Sens.
10
simple and compatible 3D format for top-view CD, as it can be converted directly from point clouds, or
resampled from complex data such as 3D polygonal models (Qin, 2014a). For DSMs generated using DIM,
the associated images (panchromatic, multispectral, hyperspectral or color) can be corrected to true
orthophotos, with per-pixel correspondence to the DSM grids; thereby each pixel contains both height
and spectral information. Oblique-view or close-range data are more complex due to the complicated
multi-layer 3D structures and occlusions. 3D geometric information plays a key role in 3D CD on oblique-
view data, whereas the spectral information is less considered as change evidence due to the large
luminance variation and artifacts created by texture mapping problems.
Essentially, the 3D geometric information reveals two properties: 1) Geometric property – it provides
physical measurements of the ground scene in the object space. 2) Information property – the geometry
can be seen as an information source of the ground scene, enabling features (such as shapes, volumes,
etc.) to be extracted for analysis. Although the geometric information can be used in various ways for 3D
CD tasks, the basic concepts behind the methods can be simply differentiated according to these two
properties. Therefore, our introduction to the current 3D CD methods will follow two rationales: 1)
Geometric comparison - methods that measure the 3D geometric differences; 2) Geometric - spectral
analysis - methods that take into account the geometric and/or spectral information for change analysis.
It should be noted that these two ways of using the 3D geometric information are not completely
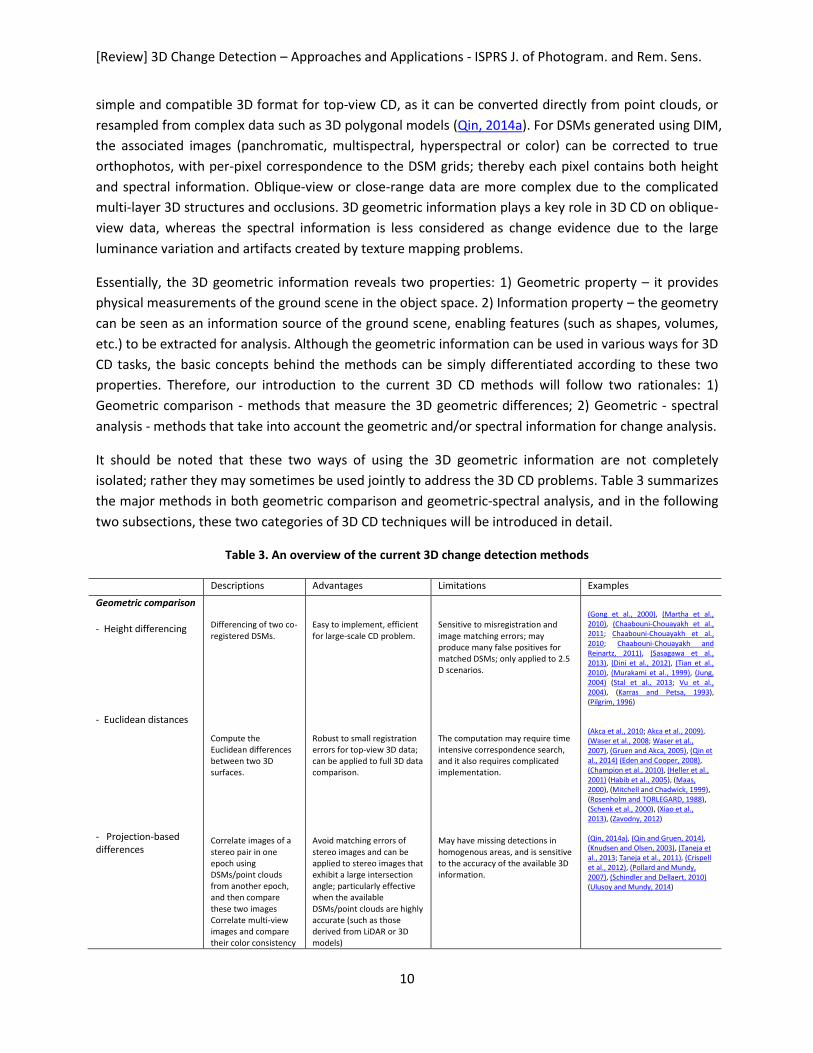
isolated; rather they may sometimes be used jointly to address the 3D CD problems. Table 3 summarizes
the major methods in both geometric comparison and geometric-spectral analysis, and in the following
two subsections, these two categories of 3D CD techniques will be introduced in detail.
Table 3. An overview of the current 3D change detection methods
Descriptions Advantages Limitations Examples
Geometric comparison - Height differencing - Euclidean distances - Projection-based differences
Differencing of two co-registered DSMs. Compute the Euclidean differences between two 3D surfaces. Correlate images of a stereo pair in one epoch using DSMs/point clouds from another epoch, and then compare these two images Correlate multi-view images and compare their color consistency
Easy to implement, efficient for large-scale CD problem. Robust to small registration errors for top-view 3D data; can be applied to full 3D data comparison. Avoid matching errors of stereo images and can be applied to stereo images that exhibit a large intersection angle; particularly effective when the available DSMs/point clouds are highly accurate (such as those derived from LiDAR or 3D models)
Sensitive to misregistration and image matching errors; may produce many false positives for matched DSMs; only applied to 2.5 D scenarios. The computation may require time intensive correspondence search, and it also requires complicated implementation. May have missing detections in homogenous areas, and is sensitive to the accuracy of the available 3D information.
(Gong et al., 2000), (Martha et al., 2010), (Chaabouni-Chouayakh et al., 2011; Chaabouni-Chouayakh et al., 2010; Chaabouni-Chouayakh and Reinartz, 2011), (Sasagawa et al., 2013), (Dini et al., 2012), (Tian et al., 2010), (Murakami et al., 1999), (Jung, 2004) (Stal et al., 2013; Vu et al., 2004), (Karras and Petsa, 1993), (Pilgrim, 1996) (Akca et al., 2010; Akca et al., 2009), (Waser et al., 2008; Waser et al., 2007), (Gruen and Akca, 2005), (Qin et al., 2014) (Eden and Cooper, 2008), (Champion et al., 2010), (Heller et al., 2001) (Habib et al., 2005), (Maas, 2000), (Mitchell and Chadwick, 1999), (Rosenholm and TORLEGARD, 1988), (Schenk et al., 2000), (Xiao et al., 2013), (Zavodny, 2012) (Qin, 2014a), (Qin and Gruen, 2014), (Knudsen and Olsen, 2003), (Taneja et al., 2013; Taneja et al., 2011), (Crispell et al., 2012), (Pollard and Mundy, 2007), (Schindler and Dellaert, 2010) (Ulusoy and Mundy, 2014)
[Review] 3D Change Detection – Approaches and Applications - ISPRS J. of Photogram. and Rem. Sens.
11
Geometry–spectrum Analysis - Post-refinement -Direct feature fusion - Post-classification
Results from geometric comparison (e.g. DSM difference) are refined with geometric and spectral information Simultaneously consider the geometric and spectral features through a fusion algorithm to compute change evidence Firstly perform object detection or classification to each dataset, and then compare the resulting object labels for analysis
The algorithms are flexible and quite efficient. Parameters are easy to understand and straightforward to tune.
Consider both geometric and spectral information at the same time; can easily combine other sources of information without additional modification of the algorithm. The 3D information can greatly enhance the classification and object detection accuracies; Training samples/rules are from each dataset, which avoids a direct comparison of uncalibrated geometric and spectral information, being more robust to temporal variations.
Initial change results solely depend on the geometric comparison, and missing changes cannot be recovered in the subsequent steps. Critical to configure the parameters in the fusion algorithms; Inappropriate parameters may propagate errors of each individual source to the final results. The CD results highly depend on the classification accuracies that may require careful sample collection and feature design.
(Sasagawa et al., 2008), (Fan et al., 1999; Liu et al., 2003; Pang et al., 2014), (Chaabouni-Chouayakh et al., 2010; Choi et al., 2009; Zhu et al., 2008), (Chaabouni-Chouayakh and Reinartz, 2011), (Guerin et al., 2014), (Qin, 2014b) (Tian, 2013), (Tian et al., 2014b), (Tian et al., 2014a) , (Nemmour and Chibani, 2006; Qin, 2014a; Trinder and Salah, 2012) (Olsen, 2004), (Walter, 2004), (Matikainen et al., 2010), (Champion, 2007), (Olsen and Knudsen, 2005), (Rottensteiner et al., 2007), (Qin et al., 2015a), (Tian, 2013), (Nebiker et al., 2014), (Champion et al., 2009),
3.1. Geometric comparison
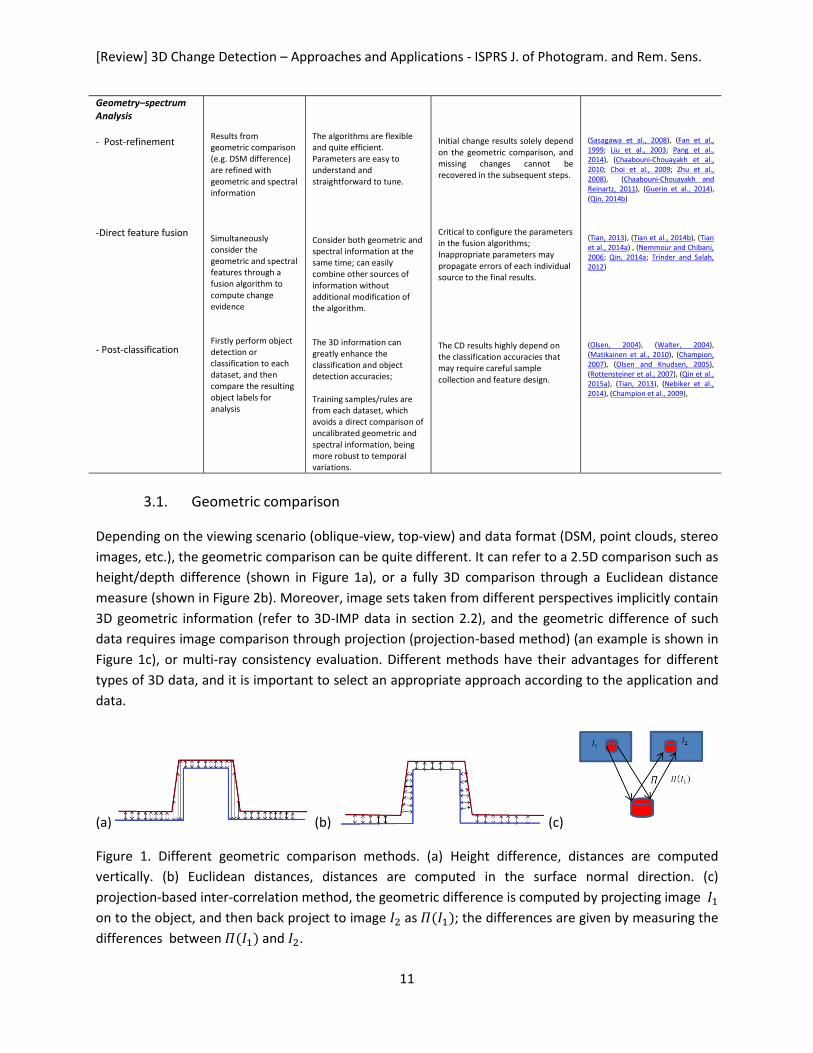
Depending on the viewing scenario (oblique-view, top-view) and data format (DSM, point clouds, stereo
images, etc.), the geometric comparison can be quite different. It can refer to a 2.5D comparison such as
height/depth difference (shown in Figure 1a), or a fully 3D comparison through a Euclidean distance
measure (shown in Figure 2b). Moreover, image sets taken from different perspectives implicitly contain
3D geometric information (refer to 3D-IMP data in section 2.2), and the geometric difference of such
data requires image comparison through projection (projection-based method) (an example is shown in
Figure 1c), or multi-ray consistency evaluation. Different methods have their advantages for different
types of 3D data, and it is important to select an appropriate approach according to the application and
data.
(a) (b) (c)
Figure 1. Different geometric comparison methods. (a) Height difference, distances are computed
vertically. (b) Euclidean distances, distances are computed in the surface normal direction. (c)
projection-based inter-correlation method, the geometric difference is computed by projecting image
on to the object, and then back project to image as ; the differences are given by measuring the
differences between and .
[Review] 3D Change Detection – Approaches and Applications - ISPRS J. of Photogram. and Rem. Sens.
12
3.1.1. Height differencing
The DSM provides height/depth information in the form of a map grid, which essentially treats the 3D
information as 2.5D by projecting the 3D information to a plane, either in horizontal (height) or in
vertical (depth). Some algorithms tend to find the minimal planes (Schenk et al., 2000), and often this is
determined by the application context. Height differencing is a straightforward derivation of image
differencing, which applies a simple subtraction to multi-temporal DSMs, resulting in height residual
maps to indicate potential changes. This has been widely used in applications such as tree growth
monitoring (Gong et al., 2000; Stepper et al., 2015; Waser et al., 2008; Waser et al., 2007), earthquakes
and damage assessment (Menderes et al., 2015; Turker and Cetinkaya, 2005) etc. It was also applied to
urban areas. Sasagawa et al. (2013) applied the height differencing in the urban area using DSMs
generated from ALOS (Advanced Land Observation Satellite) triplets to indicate changes on individual
buildings. Turker and Cetinkaya (2005) used the DSMs generated from pre- and post-earthquake stereo
aerial images to detect collapsed buildings. However, many artifacts were observed for small buildings.
The height residuals are directly related to the co-registration and DSM accuracy. It gives a good
approximation of the volumetric difference area-wise, while it is not accurate enough to infer
conclusions on individual objects due to the presence of DSM noise (especially for those generated from
images).
To reduce the errors induced by height differencing, window-based or object-based methods were
proposed to average the height differences. Tian et al. (2010) took the minimal height differences over a
shifting window to reduce DSM noise occurring at the object borders. In their later work (Tian et al.,
2013), panchromatic image-derived objects were used as the height differencing unit, which further
reduced false positives. Such strategy is effective to reduce noise for large urban objects; however there
remain potential risks of discarding actual changes on small objects. Very often, if the objective of CD
was to detect the change status of individual objects (such as buildings), the height differences usually
served as an initial step for further refinements (Chaabouni-Chouayakh and Reinartz, 2011; Jung, 2004;
Wang, 2005). Such refinements can be performed using additional features such as geometric primitives,
textural/spectral features, or external data sources such as from GIS (Geographical Information System)
database (Dini et al., 2012).
The height threshold, as one of the most important parameters to obtain the final change mask, is
influenced by the accuracy of the data, as well as the co-registration result. One way for threshold
determination is to use a priori information such as the pre-assessment of the DSM quality and empirical
choices, or trial-and-error tests (Lu et al., 2004; Murakami et al., 1999). Another way is to estimate the
threshold from the data themselves, such as from the histogram of the height residual statistics
(Chaabouni-Chouayakh and Reinartz, 2011). In Turker and Cetinkaya (2005), the sensitivities of the
threshold selection were tested using their experimental dataset (bi-temporal DSMs generated from
aerial stereo images). By tuning the height threshold from 1 to 10 m, they compared the resulting
change mask to the reference mask, with an observation that in one test delivered the best kappa
index (KIA) and rendered the best producer’s accuracy. However, these values changed when the
test areas were different. To avoid single threshold truncation, multiple thresholds can be also used to
indicate different levels of confidence (Qin et al., 2015a). Regions with a very high confidence of being
[Review] 3D Change Detection – Approaches and Applications - ISPRS J. of Photogram. and Rem. Sens.
13
changed can be used directly as the CD output, while uncertain ones could be sent for operator’s
decision.
3.1.2. 3D Euclidean distances
A major problem of height differencing is its high sensitivity to misregistration and artifacts, which may
lead to significant errors around object boundaries (e.g. building edges). This is because the height
differences consider the distance between two surfaces in a projected space (map projection), not
necessarily their Euclidean difference (in the surface normal direction). The Euclidean distance of two
surfaces take the three degrees of freedom for 3D geometry into account by computing the distance in
the normal direction, which is theoretically more rigorous. The difference between the Euclidean and
height distance can be easily understood in Figure 1(a-b). Techniques in this category are generally
developed in the domain of surface co-registration and change detection, where in surface co-
registration, changes are regarded as outliers. An example of the technique in this category proposed by
Gruen and Akca (2005) through a least squares framework, combining co-registration and Euclidean
distance estimation. It was later applied by Waser et al. (2008) for estimating the forest volume
dynamics between two image-derived DSMs. Under the context of 3D model quality control, Akca et al.
(2010) adopted the LS3D method to detect the 3D geometric modeling error against the LiDAR
measurements. Euclidean differences are also closely tied to co-registration methods, the goal of which
is to minimize the Euclidean differences of two 3D surfaces, and the readers may refer to the global
methods that minimize point-to-surface or surface-to-surface distances (Habib et al., 2005; Karras and
Petsa, 1993; Maas, 2000; Mitchell and Chadwick, 1999; Pilgrim, 1996; Rosenholm and TORLEGARD, 1988;
Schenk et al., 2000), where the outliers of the co-registration can be detected as changes.
Although Euclidean distance is theoretically more rigorous than height difference, its advantages on
processing the DSMs can be sometimes compensated by post-processing techniques after height
difference. However, its capabilities on oblique data are irreplaceable. Occlusions and incompleteness of
3D data generated from oblique-view images and/or terrestrial/mobile LiDAR present much more
complex scenarios than remote sensing top-view data. Co-registration is more difficult in such a case,
hence it requires strict solutions. Akca (2007) showed various successful CD examples using Euclidean
distance measure in close range applications under the context of deformation analysis and quality
control (Akca et al., 2010). Other derivative measures based on Euclidean distance can be also used for
CD. Girardeau-Montaut et al. (2005) applied an octree structure to divide the 3D spaces, and the
Hausdorff measure was employed to compute the distance between different spaces. Similarly, Kang
and Lu (2011) adopted the Hausdorff distance (Huttenlocher et al., 1993) to detect the difference
between LiDAR scanning data and a reference 3D model. Instead of using the octree structure, they
applied the Hausdorff measure on the point segments, and occluded parts are estimated using the
depth images of the scan. In an indoor environment, Núñez et al. (2010) modeled the environmental
geometry with a Gaussian Mixture Model (GMM), and distance of the new LiDAR scan to the GMM are
computed to detect the changes.
Sometimes the pixel-wise geometric comparison may render many artifacts, while certain extracted
geometric features may be more robust. Eden and Cooper (2008) measured the differences of 3D lines
[Review] 3D Change Detection – Approaches and Applications - ISPRS J. of Photogram. and Rem. Sens.
14
across two multi-view image sets, which significantly reduced the noise and disturbances. Under the
same concept, Champion et al. (2010) extracted 3D lines from stereo images to verify the existence of
buildings by comparing them to the GIS database. Heller et al. (2001) extracted changes by comparing
the co-registered 3D data derived from images taken from different sensors. Changes were represented
by multiple feature points that were significantly different in the geometric comparison. Nevertheless,
failing to detect such features may omit some important changes. Therefore, feature-based methods
should only be applied under the context that the object of interest can be represented by certain
features.
3.1.3. Projection-based geometric differences
Poorly captured stereo images, such as those with large intersection angles, leading to large parallaxes,
may not be able to produce usable DSMs/point clouds for CD using even the most advanced DIM
algorithms. If relatively reliable DSM or point cloud is available at one date and images are geo-
referenced with respect to the 3D data, the projection-based geometric difference can be used to assess
the geometric consistency between the stereo images and 3D data. It correlates, one image of the
stereo pair, using the DSM or point cloud, with the other image, and compares their
radiometric/spectral differences (shown in Figure 1c). In principle, these two correlated images should
be the same if the stereo pair is consistent with the DSM/point clouds. Qin (2014a) applied inter-
correlation in the process of 3D model updating , where two satellite stereo images are correlated using
3D polygonal models, and the correlated image patches are evaluated using the energy produced by
SGM (Semi-global matching) algorithm (Hirschmüller, 2008). In Knudsen and Olsen (2003), 3D models
were projected onto 2D photos, followed by supervised classification for change detection.
This technique is particularly effective to the oblique-view images and point clouds/3D models, as a
direct comparison using point clouds generated via DIM usually produces many artifacts. Taneja et al.
(2011) applied inter-correlation of a stereo pair to an image-derived surface model, and the differences
in color were used as change evidence. Qin and Gruen (2014) extended inter-correlation to a multi-
stereo case to determine view-based change evidence by comparing a strip of images with mobile LiDAR
point clouds. Due to a fine co-registration and high accuracy of the LiDAR data, over 70% changes were
detected in their experiments.
Another streamline of the projection-based method divides the 3D spaces into voxel/object
representations. In each voxel, consistencies of the projected color from multi-view images are
evaluated statistically. Voxels with significant color differences will be spotted as changes, examples are
Crispell et al. (2012), Pollard and Mundy (2007), Schindler and Dellaert (2010), Ulusoy and Mundy (2014).
Pollard and Mundy (2007) performed CD with two sets of oblique imageries. They first computed the
surface of the scene using a space carving method, where probabilities of change for each voxel were
assigned according to the color inconsistencies projected to that voxel. Schindler and Dellaert (2010)
took 3D objects grouped by sparse points as change unit for color consistency check. Such color-
consistency check implicitly applied a multi-ray point matching strategy, where false positives might be
present in occluded areas and false negative might occur in non-texture areas. Very often after the
[Review] 3D Change Detection – Approaches and Applications - ISPRS J. of Photogram. and Rem. Sens.
15
probability assignment, Markov interfering processes (Blake et al., 2011) were applied to reduce noise
effects.
The projection-based method is an effective strategy to provide raw change evidence when the 3D
scene is rather complex, as it does not necessarily require explicit 3D data. It can be seen as an inverse
operation of matching, while this again, still depends on the quality of the available 3D data and may not
be able to handle areas with insignificant texture features.
3.2. Combined geometric and spectral analysis
3D geometric information (DSMs, point clouds and 3D models, etc.), as an information source, can be
applied for various analysis, such as object extraction/recognition, shape analysis. Very often the
geometric information comes with spectral information, such as multispectral/hyperspectral orthophoto
and image texture. It is straightforward to understand that additional channels of information may lead
to enhanced CD results, as it can compensate errors induced by single sources. However they bring both
advantages and error sources: the combined use of geometric and spectral information could be
beneficial to each other, while on the other hand, it faces the risk of propagating both of their
deficiencies to the CD results. Therefore, the main challenge of geometric-spectral analysis methods
remains on how to appropriately address the advantages of the different information sources without
bringing too many additional errors. In general, there are three ways to integrate the geometric and
spectral features as information sources into a 3D CD process: 1) Post-refinement. 2) Direct feature
fusion. 3) Post-classification. Post-refinement refers to the process of using geometric and/or spectral
information to refine the initial change evidence resulting from the geometric comparison. The second
approach takes into account the geometric and spectral information (or their transformed features) as
cues of changes, and these features are used jointly to determine the presence of change. The third
approach is very popular in 2D change detection, which first classifies both datasets or detects the
objects of interest, and then compares the resulting labels of the two datasets.
3.2.1. Post-refinement
The results of geometric comparison vary with the quality and accuracy of the 3D data. False
positives/negatives occur due to artifacts of the DSM/point clouds, or incomplete 3D models. Sometimes
such errors may reveal certain patterns, such as the observation that artifacts often occur at object
boundaries, or in vegetation classes. Such problems can be well-addressed if additional information can
be extracted from the geometric or spectral data. Images have sharper boundaries, and if near-infrared is
available, NDVI (normalized difference vegetation index) can be used to eliminate disturbances from the
seasonal varying vegetation. Following the initial change evidence computed from geometry comparison,
the geometric and spectral information can be strategically placed as an important source for refining the
result. Attempt for such consideration was given for manual interpretations (Sasagawa et al., 2008),
where the radiometric difference of the images was used as a double-check for DSM subtraction results.
To automate the process, change “candidates” can be further classified by using spectral and textural
information of the original images (Fan et al., 1999; Liu et al., 2003; Pang et al., 2014).
[Review] 3D Change Detection – Approaches and Applications - ISPRS J. of Photogram. and Rem. Sens.
16
Due to the presence of noise effects in DSM subtraction, some noise-removal approaches, for instance,
morphological filtering can be used to improve the initial change masks (Chaabouni-Chouayakh et al.,
2010; Choi et al., 2009; Zhu et al., 2008). When only a certain type of object is of interest, shape features
from the DSM can be used to refine the change mask using either supervised (Chaabouni-Chouayakh and
Reinartz, 2011) or unsupervised methods. Geometric regularities can also be used to improve the initial
change masks. Tian et al. (2010) applied a box-fitting method to regularize extracted building boundaries.
James et al. (2012) adopted the map boundaries to constrain the DSM difference to a certain area of
interest. Choi et al. (2009) adopted a supervised method on the initial change mask. Various shape
features such as roughness, size, and height of the change segments were used to classify them into
different types of objects. Based on the assumption that the change maps are globally smooth, Guerin et
al. (2014) applied a global optimization that employs this spatial context using a generalized dynamic
programming to eliminate potential inaccuracies resulting from DSM subtractions. Markov random field
as a powerful refinement model, were used in 2D CD approaches (Bruzzone and Prieto, 2002; Kasetkasem
and Varshney, 2002), and similar methods were also developed under a 3D context (Pollard and Mundy,
2007; Qin and Gruen, 2014; Taneja et al., 2015). under the contexts of CD with UAV (unmanned aerial
vehicle) images, Qin (2014b) hierarchically refined the initial change masks using various levels of
segmentation combining both the orthophoto and DSM information. Different levels of segmentation
encode the local spatial dependence between different segments. This work refined the mask using
spatial consistencies of these segments, and reported that the method can monitor even sub-building
sized urban objects (such as vehicles).
The “post-refinement” approaches employ a hierarchical structure, where initial change evidence are
given by geometric comparison, followed by geometric and spectral analysis for result refinements.
Parameters are often easy to understand and straightforward to tune. Such methods are flexible to be
decomposed or re-composed according to different CD applications, and the step-wise process makes
such methods computationally efficient. However, the initial CD result solely depends on the geometric
comparison, and missing changes in the initial step cannot be recovered in the subsequent refinement.
3.2.2. Direct feature fusion
Contrary to the hierarchical “post-refinement” approaches, direct feature fusion simultaneously
considers all channels of information. Such feature fusion can be performed in either the feature level or
decision level, meaning either the geometric/spectral features (e.g. height differences, shape indexes,
spectral differences, NDVI. etc) are fused to generate change evidence, or change evidence resulting from
all the sources are fused as the final change cues. Although existing works in “direct feature fusion”
mainly consider the fusion of multi-sources images (Longbotham et al., 2012; Nemmour and Chibani,
2006) for change detection, there are still some works that fused both geometric and spectral
information directly for CD.
Tian et al. (2013) directly fused the height and radiometric differences of Cartosat-1 datasets (only
panchromatic images are available) under a change vector analysis (CVA) (Johnson and Kasischke, 1998)
framework, which finally resulted in a single change indicator for thresholding. The geometric and
radiometric information is weighted with empirical values. A subsequent work in Tian et al. (2014b)
adopts a Kernel Minimum Noise Fraction (KMNF) to minimize the noise statistically presented in both the
[Review] 3D Change Detection – Approaches and Applications - ISPRS J. of Photogram. and Rem. Sens.
17
height and radiometric difference for fusion, and Iterated Canonical Discriminant Analysis (ICDA) for
generating the final change masks. The experiments were conducted on forest areas using Cartosat-1
images, in which they reported a notable improvement compared to simple DSM/radiometric subtraction
and CVA fusion, and to other traditional classification methods like SVM (Vapnik, 1963; Vapnik and Kotz,
1982; Wang, 2005), and random forest (Breiman, 2001). Other information fusion theories have also
been tested using satellite datasets. With multispectral orthophotos together with the DSMs, Tian et al.
(2014a) adopted the Dempster-Shafer (DS) fusion to integrate several change cues extracted from DSMs,
panchromatic and multispectral images. In their approach, the changes extracted from DSMs and images
were used separately. The fusion model was built by assuming changes from images indicating changes of
all object classes, while changes in height indicated change only for a subset of the objects (e.g. buildings,
trees). Vögtle and Steinle (2004) proposed a two-step change detection approach based on LiDAR data.
Firstly the building object and non-building objects were separated. Then the height change information
was fused with the building object map to deliver a detailed change detection results. A similar research
was performed by Teo and Shih (2013), in which the above ground objects were classified into buildings
and vegetation according to the surface roughness. The object map was fused with the height difference
map to obtain four types of changes. Under a 3D model updating process, Qin (2014a) fused multiple
change evidence resulting from DSM and spectral features via unsupervised self-organizing maps (SOM)
(Kohonen, 1982; Moosavi and Qin, 2012), where the a priori information (the quality of the change
evidence) can be used to weight individual change indicators to obtain the final change evidence for
change determination.
Training features extracted directly from different sources and performing supervised classification also
fall into the “direct feature fusion” category. Feature vectors are usually formed with the differences of
geometric (Chehata et al., 2009) and/or spectral information (Nemmour and Chibani, 2006; Pacifici et al.,
2007), and these features are combined into a classifier to identify change and non-change area (Chen et
al., 2016; Trinder and Salah, 2012). The “direct feature fusion” methods consider both the geometric and
spectral information as pure information sources. Different kinds of information can be combined
appropriately to achieve optimal CD results. Such methods can be easily incorporated into other kinds of
information without additional re-design of the algorithm. It is critical to determine the individual
contribution of each information source when using linear fusion models. Classifier-based models may be
able to learn the weights of information sources, such as Random Forests (Breiman, 2001) and Neural
Network (Foody, 1996), while this requires accurate training samples. For unsupervised fusion models
(e.g. CVA), an equal contribution may not render the best results. Therefore a priori information or trial-
and-error test may be needed to obtain an optimal parameter configuration.
3.2.3. Post-classification comparison
The temporally varying conditions may greatly disturb the geometric and spectral comparison of two
datasets. Post-classification methods propose to detect objects of interest or perform land-cover
classification first, and then compare the resulting labels (classes), which avoid direct comparison of the
spectral and height information. A core advantage of such method is that the 3D information may
potentially increase the accuracy of object detection/classification, leading to improved CD results. A
number of studies (Huang et al., 2011; Mayer, 1999; Sohn and Dowman, 2007; Zhang et al., 2015) have
[Review] 3D Change Detection – Approaches and Applications - ISPRS J. of Photogram. and Rem. Sens.
18
proven that the height information can increase the accuracy of land-cover classification to a notable
level.
In the classification or object extraction procedure, DSMs from LiDAR or stereo images can be essentially
seen as an additional channel of information, which is equally free to be applied into popular classifiers.
Researchers have investigated such a strategy via a number of classification approaches, such as in
ISODATA (Olsen, 2004), maximum likelihood (Walter, 2004) decision tree (Matikainen et al., 2010), rule-
based method (Champion, 2007; Olsen and Knudsen, 2005) and decision-fusion method (Nebiker et al.,
2014; Rottensteiner et al., 2007)
In an urban environment, buildings are one of the most relevant object types. “Building detection +
Change detection” is a popular strategy to detect changes of buildings. Under this framework, Qin et al.
(2015a) integrated the height information to a supervised framework for building detection using
scanned aerial survey photos. Building objects were then compared by considering both the height and
texture dissimilarities. In their approach, the integration of the height information was mainly three-fold:
1) in image segmentation; 2) in feature extraction for classification 3) in building change evaluation. This
approach was particularly effective for rebuilt buildings, as it evaluated each building object using various
features such as height, texture, as well as shapes.
Supervised methods may require training samples. By assuming the amount of changes in the scene is
not significant, existing GIS data can be used as training data (Champion et al., 2009; Matikainen et al.,
2010; Walter, 2004) to assist building detection. They can either be used directly as training samples
(Walter, 2004), or modified using some other cues based on geometric and spectral features (Champion
et al., 2009; Qin et al., 2015b).
The post-classification method is regarded as a popular method, since it transforms the direct
geometric/spectral comparison to label changes, which tends to be more robust towards disturbances
induced by acquisition conditions (season, luminance differences, etc.), on the other hand, it is able to
provide a type change matrix. However, in most cases, the CD results of this method highly depend on
the classification/object detection results, which it subsequently requires careful sample collection and
feature design.
4. 3D change detection applications
The development of 3D CD can greatly facilitate many new and existing applications. In this section, we
outline existing attempts and works that adopt 3D CD techniques across various domains. Due to space
restrictions, not all potential applications and references are included in this survey; we show several
examples of research works in this context to demonstrate the growing demands and possibilities for 3D
CD in various fields. A summary of 3D CD applications is included under Urban, Environment & Ecology,
and Civil contexts:
- Urban – building/infrastructure/urban canopy change detection, 3D city model update, disaster
assessment.
[Review] 3D Change Detection – Approaches and Applications - ISPRS J. of Photogram. and Rem. Sens.
19
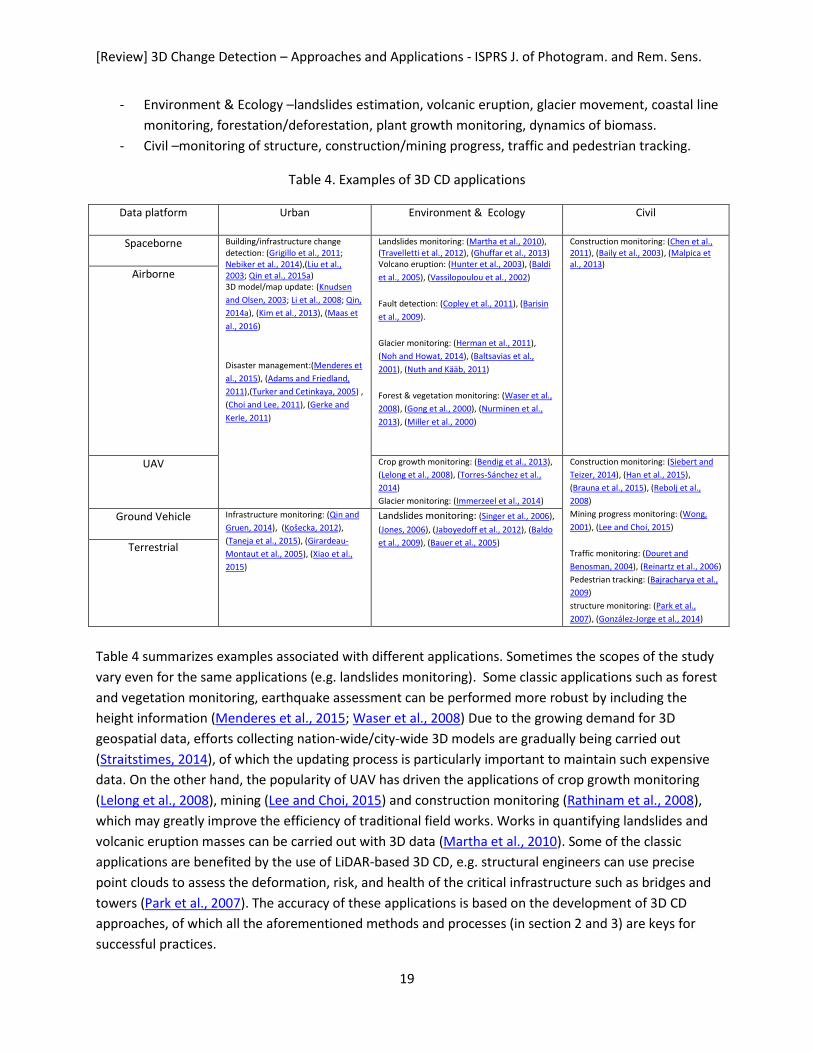
- Environment & Ecology –landslides estimation, volcanic eruption, glacier movement, coastal line
monitoring, forestation/deforestation, plant growth monitoring, dynamics of biomass.
- Civil –monitoring of structure, construction/mining progress, traffic and pedestrian tracking.
Table 4. Examples of 3D CD applications
Data platform Urban Environment & Ecology Civil
Spaceborne Building/infrastructure change detection: (Grigillo et al., 2011; Nebiker et al., 2014),(Liu et al., 2003; Qin et al., 2015a) 3D model/map update: (Knudsen
and Olsen, 2003; Li et al., 2008; Qin,
2014a), (Kim et al., 2013), (Maas et
al., 2016)
Disaster management:(Menderes et
al., 2015), (Adams and Friedland,
2011),(Turker and Cetinkaya, 2005) ,
(Choi and Lee, 2011), (Gerke and
Kerle, 2011)
Landslides monitoring: (Martha et al., 2010), (Travelletti et al., 2012), (Ghuffar et al., 2013) Volcano eruption: (Hunter et al., 2003), (Baldi
et al., 2005), (Vassilopoulou et al., 2002)
Fault detection: (Copley et al., 2011), (Barisin
et al., 2009).
Glacier monitoring: (Herman et al., 2011),
(Noh and Howat, 2014), (Baltsavias et al.,
2001), (Nuth and Kääb, 2011)
Forest & vegetation monitoring: (Waser et al.,
2008), (Gong et al., 2000), (Nurminen et al.,
2013), (Miller et al., 2000)
Construction monitoring: (Chen et al., 2011), (Baily et al., 2003), (Malpica et al., 2013)
Airborne
UAV Crop growth monitoring: (Bendig et al., 2013),
(Lelong et al., 2008), (Torres-Sánchez et al.,
2014)
Glacier monitoring: (Immerzeel et al., 2014)
Construction monitoring: (Siebert and
Teizer, 2014), (Han et al., 2015),
(Brauna et al., 2015), (Rebolj et al.,
2008)
Mining progress monitoring: (Wong,
2001), (Lee and Choi, 2015)
Traffic monitoring: (Douret and
Benosman, 2004), (Reinartz et al., 2006)
Pedestrian tracking: (Bajracharya et al.,
2009)
structure monitoring: (Park et al.,
2007), (González-Jorge et al., 2014)
Ground Vehicle Infrastructure monitoring: (Qin and
Gruen, 2014), (Košecka, 2012),
(Taneja et al., 2015), (Girardeau-
Montaut et al., 2005), (Xiao et al.,
2015)
Landslides monitoring: (Singer et al., 2006),
(Jones, 2006), (Jaboyedoff et al., 2012), (Baldo
et al., 2009), (Bauer et al., 2005)
Terrestrial
Table 4 summarizes examples associated with different applications. Sometimes the scopes of the study
vary even for the same applications (e.g. landslides monitoring). Some classic applications such as forest
and vegetation monitoring, earthquake assessment can be performed more robust by including the
height information (Menderes et al., 2015; Waser et al., 2008) Due to the growing demand for 3D
geospatial data, efforts collecting nation-wide/city-wide 3D models are gradually being carried out
(Straitstimes, 2014), of which the updating process is particularly important to maintain such expensive
data. On the other hand, the popularity of UAV has driven the applications of crop growth monitoring
(Lelong et al., 2008), mining (Lee and Choi, 2015) and construction monitoring (Rathinam et al., 2008),
which may greatly improve the efficiency of traditional field works. Works in quantifying landslides and
volcanic eruption masses can be carried out with 3D data (Martha et al., 2010). Some of the classic
applications are benefited by the use of LiDAR-based 3D CD, e.g. structural engineers can use precise
point clouds to assess the deformation, risk, and health of the critical infrastructure such as bridges and
towers (Park et al., 2007). The accuracy of these applications is based on the development of 3D CD
approaches, of which all the aforementioned methods and processes (in section 2 and 3) are keys for
successful practices.
[Review] 3D Change Detection – Approaches and Applications - ISPRS J. of Photogram. and Rem. Sens.
20
5. Discussions
3D CD tasks aim to find all the differences in a scene or for particular types of objects using multiple
acquisitions of 3D data. Therefore in most cases, a CD problem is not only a simple data differentiation,
but also an identification of changes for meaningful objects. Both issues are indispensable to form
successful solutions for 3D CD. The “data differentiation” and “identification of meaningful objects” are
in line with two properties of the 3D data introduced in section 3, being geometric and information
properties: geometries are compared to obtain the geometric differences, and objects of interest are
identified through cues and features extracted from 3D information. Here in this subsection we
extensively discuss these techniques, and other specific issues related to 3D CD techniques and
applications.
5.1. Geometric comparison
Height differencing remains to be the most convenient method for an initial check on the data quality,
although it leads to potential errors due to misregistration and data quality issues. A first attempt at
developing a 3D CD algorithm with top-view data is usually to test if the DSM subtraction could already
reveal a certain amount of significant changes based on the given data, further strategies and analytical
methods can be formulated from this point. The Euclidean distance measure is often coupled with a co-
registration, for which finding the normal direction and corresponding points are computationally heavy.
In 3D CD using DSM (2.5D) and images, the Euclidean distance does not really offer many advantages in
terms of geometric measurement in practical applications, as the relative rotation between DSMs is not
significant (Waser et al., 2008), and errors in the object boundaries can be eliminated by post-filtering
techniques. Height differences can describe the geometric discrepancies well for registered DSMs (Qin,
2014a). The Euclidean distance measure is of particular value for oblique or close-range data, where
more precise registration and requirements for blunder eliminations are necessary.
When the 3D geometry of the scene is so complex that even the most advanced DIM method could not
generate reliable point clouds (often occurring in close-range applications), the projection-based
method may be used as a smart trick to measure the geometric differences. It has the capability to
eliminate potential geometric differences in a projected plane, or in the 3D voxel/object space, as it
measures the color consistencies in a projected plane or voxel (or a 3D object). Its major problem is that
it may omit areas with insignificant textures. Moreover, the voxelization of the space may result in
aliasing problems in the final results.
5.2. Geometric – spectral analysis
Three categories of methods using geometric and/or spectral information have been described in
section 3.2. These methods are mainly applied to top-view remote sensing data (“DSMs + orthophoto”).
Among all the investigated methods, “post-refinement” appears to be the top choice when using high
accuracy DSMs. This is because DSMs generated using advanced DIM methods nowadays are quite
reliable, hence it can render good initial “change candidates” for further “post-refinement”, which is
easy to implement and straightforward to understand. However, the refinements in the current works
mainly focus on removing the false detections and some noise effects. Recovering of the false negatives
[Review] 3D Change Detection – Approaches and Applications - ISPRS J. of Photogram. and Rem. Sens.
21
is very difficult and has not yet been tested to the author’s best knowledge. The ‘direct feature fusion’,
which fuses the height changes from DSM and spectral changes from images, is further proposed under
the concept of information fusion. The advantage of this method is that it is effective to lower resolution
data and there are many readily available fusion algorithm such as CVA and kernel CD (Johnson and
Kasischke, 1998; Tian et al., 2014b).
It should be noted, that “post-classification” methods are in some cases able to produce accurate results.
It is not sensitive to temporal variances of the spectral information as it brings semantic information into
the datasets. Indeed a combinational use of both strategies (post-refinement and post-classification)
might produce better results. When available, existing GIS data can be very helpful in both change
refinement (for regularization) (Dini et al., 2012) and classification (for sample collection) (Maas et al.,
2016) .
5.3. Pixels, Objects, Voxels
The pros and cons about object/pixel-based techniques in remote sensing image processing have been
frequently discussed. Although they differ in the processing units, the underlying algorithmic concepts
are very similar in many cases as indicated by Tewkesbury et al. (2015). As this paper mainly focuses on
VHR data, we do not particularly differentiate between these two concepts, rather keep in mind that for
object-based methods, we gain a special property, which is the shape of the segments. For analyzing
individual objects, the object-based concept is necessary as the shape features are very important to
differentiate one type of object from another (Benediktsson et al., 2003). There is a potential risk that
wrongly segmented objects may lead to erroneous results, while this could be alleviated since the
segmentation can be improved by incorporating the available height information (Qin et al., 2015a).
Pixel-based concepts in 3D CD is usually used for large-scale volumetric estimation, or in the initial
height differencing step of a 3D CD task, where analysis of individual objects is not yet necessary. The
concept of voxels is mainly applied for the oblique-view/close-range data, where the 3D geometry
cannot be simply represented as a 2.5D map grids. Voxelization of the space produces regular 3D grid,
and the classic 2D inferences algorithm (Blake et al., 2011) can be extended directly to 3D. Nevertheless,
dividing the 3D space into regular cubes may dramatically increase the memory consumption with
possible overflow, leading to high computation burden. If we increase the granularity of the voxels to
reduce their amount, it may induce inaccuracy and aliasing problems. Recent attempts tried to use
coarse-to-fine strategies to form adaptive voxels to reduce the memory and computation time (Bláha et
al., 2016). 3D object-based methods have the potential to reduce memory consumption, and have been
demonstrated already (Schindler and Dellaert, 2010), whereas it also poses complicated issues such as
ray-tracing, neighborhood indexing and 3D shape analysis.
5.4. LiDAR and images
A very basic question for a 3D CD task is to select/acquire appropriate data source. In section 2.1, we
have suggested acquiring data with a resolution to reduce the cost depending on the problem to solve,
the amount of data and computation. LiDAR and images are the major choices sensor-wise in the scope
of this paper. Both sensors are available in major platforms such airborne, UAV, ground vehicles,
[Review] 3D Change Detection – Approaches and Applications - ISPRS J. of Photogram. and Rem. Sens.
22
terrestrial stations, except for spaceborne platforms, where only images are available. LiDAR has a
consistent ranging accuracy and provides reliable measurements. Nowadays low-cost and lightweight
LiDAR (Lin et al., 2011; Wallace et al., 2012) is available to be mounted on smaller platforms such as UAV.
Terrestrial LiDAR and mobile LiDAR are quite mature in terms system integration and processing
software. For airborne acquisition, LiDAR scanning is similarly expensive as using traditional aerial
photogrammetric image acquisition. In terrestrial/close-range cases, LIDAR has a great advantage to
offer high accuracy geometric information for a complex environment, in which images may fail to
deliver good results.
For tasks using UAV platforms, images may be more accessible than LiDAR. Although there is progress
being reported in UAV-LiDAR system, the varying quality of output point clouds is highly dependent on a
good GPS receiver, the base station, the signal quality in the low altitude flying environment, as well as
good attitude determination. UAV image processing software (such as pix4d, photoscan, photomodeler,
acute3D, etc.) (Remondino et al., 2014) is now quite mature on the market. Though the
photogrammetric process is rather complicated, the enabling techniques and processing software allow
the data to be processed largely or even fully automatically, flowing from importing images to the final
point clouds/DSM/orthophoto/Mesh generation. Nowadays even non-photogrammetry experts can
operate their UAVs and generate 3D data with these tools (Colomina and Molina, 2014).
Due to the advanced development of satellite optical sensors, the resolution is not anymore an apparent
disadvantage, as the highest resolution of commercial satellite goes up to 31 cm (Worldview 3)
(DigitalGlobe, 2016). For wide-area 3D CD (a few hundreds of km2), the cost of satellite data is lower
than for airborne images. It is more economical to acquire satellite data if the area can be covered by
only a few stereo pairs. The disadvantage of satellite image may be that they are less flexible in image
configuration, and more importantly, the aerial platform is still the major carrier of multi-camera
systems that capture large-scale oblique images.
6. Summary and Recommendations
Nowadays we have easier access to 3D data. This paper provides a critical review of the current 3D
change detection techniques. 3D CD is an extension of the very classic yet popular research - remote
sensing change detection, where 3D information is used in the CD process. This has essentially
facilitated a lot of new and existing applications that require 3D dynamics of the objects. The review
presents the current development of 3D CD research following two rationales: 1) geometric comparison;
2) geometric-spectral analysis, on how the 3D information is implemented into the CD procedure. In
addition, we also present the growing demands of 3D CD by summarizing existing and new applications
in various fields.
The summary of different methods and the use of 3D data for CD applications have shown a great
potential in 3D CD development. Various research works have demonstrated that 3D CD can significantly
improve the reliability on CD at a very high level of detail. Height differences remain to be the most
straightforward way to compute the geometric differences of two DSMs. Euclidean distance measure is
slightly complicated but particularly useful for co-registration of 3D oblique data/close-range data.
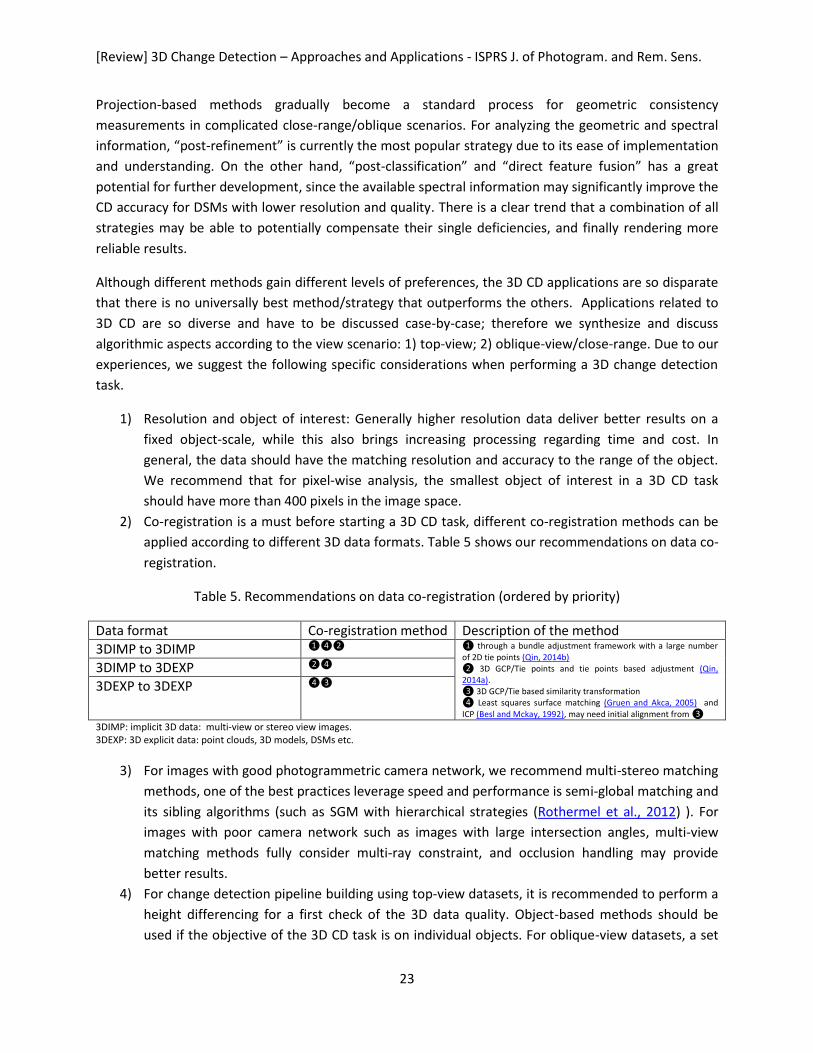
[Review] 3D Change Detection – Approaches and Applications - ISPRS J. of Photogram. and Rem. Sens.
23
Projection-based methods gradually become a standard process for geometric consistency
measurements in complicated close-range/oblique scenarios. For analyzing the geometric and spectral
information, “post-refinement” is currently the most popular strategy due to its ease of implementation
and understanding. On the other hand, “post-classification” and “direct feature fusion” has a great
potential for further development, since the available spectral information may significantly improve the
CD accuracy for DSMs with lower resolution and quality. There is a clear trend that a combination of all
strategies may be able to potentially compensate their single deficiencies, and finally rendering more
reliable results.
Although different methods gain different levels of preferences, the 3D CD applications are so disparate
that there is no universally best method/strategy that outperforms the others. Applications related to
3D CD are so diverse and have to be discussed case-by-case; therefore we synthesize and discuss
algorithmic aspects according to the view scenario: 1) top-view; 2) oblique-view/close-range. Due to our
experiences, we suggest the following specific considerations when performing a 3D change detection
task.
1) Resolution and object of interest: Generally higher resolution data deliver better results on a
fixed object-scale, while this also brings increasing processing regarding time and cost. In
general, the data should have the matching resolution and accuracy to the range of the object.
We recommend that for pixel-wise analysis, the smallest object of interest in a 3D CD task
should have more than 400 pixels in the image space.
2) Co-registration is a must before starting a 3D CD task, different co-registration methods can be
applied according to different 3D data formats. Table 5 shows our recommendations on data co-
registration.
Table 5. Recommendations on data co-registration (ordered by priority)
Data format Co-registration method Description of the method
3DIMP to 3DIMP ❶❹❷ ❶ through a bundle adjustment framework with a large number of 2D tie points (Qin, 2014b) ❷ 3D GCP/Tie points and tie points based adjustment (Qin, 2014a). ❸ 3D GCP/Tie based similarity transformation ❹ Least squares surface matching (Gruen and Akca, 2005) and ICP (Besl and Mckay, 1992), may need initial alignment from ❸
3DIMP to 3DEXP ❷❹
3DEXP to 3DEXP ❹❸
3DIMP: implicit 3D data: multi-view or stereo view images. 3DEXP: 3D explicit data: point clouds, 3D models, DSMs etc.
3) For images with good photogrammetric camera network, we recommend multi-stereo matching
methods, one of the best practices leverage speed and performance is semi-global matching and
its sibling algorithms (such as SGM with hierarchical strategies (Rothermel et al., 2012) ). For
images with poor camera network such as images with large intersection angles, multi-view
matching methods fully consider multi-ray constraint, and occlusion handling may provide
better results.
4) For change detection pipeline building using top-view datasets, it is recommended to perform a
height differencing for a first check of the 3D data quality. Object-based methods should be
used if the objective of the 3D CD task is on individual objects. For oblique-view datasets, a set
[Review] 3D Change Detection – Approaches and Applications - ISPRS J. of Photogram. and Rem. Sens.
24
of GCP is needed for a coarse co-registration. It is recommended to use projection-based
methods for a first evaluation on the correct match of the dataset.
5) “Post-classification” method is recommended when the dataset is strongly affected by seasonal
variations, this avoids direct comparison of geometric and spectral data.
6) “Direct feature fusion” method is recommended when DSMs have potential errors or drawbacks
and pre- and post-event spectral images from the same dates are also available.
7) “Post-refinement + post-classification” is recommended as a potentially optimal strategy, and
who goes first depends on the 3D data quality: “Post-refinement” should be applied first if the
DSM quality is satisfactory, otherwise the opposite.
It may not be always comprehensive to cover all kinds of different scenarios in a CD task. If we look into
the 3D CD algorithm itself, we realize that in most of the cases, the 3D CD methods rely heavily on two
fundamental issues: 1) Advanced image matching algorithm for 3D data generation; 2) high-level feature
extraction and machine learning techniques based on geometric and spectral data. Therefore, apart
from the CD algorithm itself, the development of 3D CD techniques depends on the future endeavor of
these two research aspects, where both “reliable image matching” and “high-level image understanding”
techniques are important keys to push forward further successes of 3D CD methods.
References
Adams, S. M. and C. J. Friedland, 2011. A survey of unmanned aerial vehicle (UAV) usage for imagery collection in disaster research and management. publisher not identified,
Akca, D., 2007, Least Squares 3D surface matching. Ph.D Thesis, Swiss Federal Institute of Technology, ETH, Zürich.
Akca, D., M. Freeman, I. Sargent and A. Gruen, 2010. Quality assessment of 3D building data. The Photogrammetric Record 25 (132), 339-355.
Akca, D., A. Gruen, M. Freeman and I. Sargent, 2009. Fast quality control of 3D city models. In: The International LIDAR Mapping Forum, New Orleans, Louisiana, USA, January 26-28, pp.
Alsadik, B., M. Gerke and G. Vosselman, 2013. Automated camera network design for 3D modeling of cultural heritage objects. Journal of Cultural Heritage 14 (6), 515-526.
Baily, B., P. Collier, P. Farres, R. Inkpen and A. Pearson, 2003. Comparative assessment of analytical and digital photogrammetric methods in the construction of DEMs of geomorphological forms. Earth Surface Processes and Landforms 28 (3), 307-320.
Bajracharya, M., B. Moghaddam, A. Howard, S. Brennan and L. H. Matthies, 2009. A fast stereo-based system for detecting and tracking pedestrians from a moving vehicle. The International Journal of Robotics Research 28 (11-12), 1466-1485.
Baldi, P., M. Fabris, M. Marsella and R. Monticelli, 2005. Monitoring the morphological evolution of the Sciara del Fuoco during the 2002–2003 Stromboli eruption using multi-temporal photogrammetry. ISPRS Journal of Photogrammetry and Remote Sensing 59 (4), 199-211.
Baldo, M., C. Bicocchi, U. Chiocchini, D. Giordan and G. Lollino, 2009. LIDAR monitoring of mass wasting processes: The Radicofani landslide, Province of Siena, Central Italy. Geomorphology 105 (3), 193-201.
Baltsavias, E. P., 1991, Multiphoto geometrically constrained matching. Ph.D Thesis, Instittute of Geodesy and Photogrammetry, Swiss Federal Institute of Technology, ETH, Zürich.
Baltsavias, E. P., E. Favey, A. Bauder, H. Bosch and M. Pateraki, 2001. Digital surface modelling by airborne laser scanning and digital photogrammetry for glacier monitoring. The Photogrammetric Record
[Review] 3D Change Detection – Approaches and Applications - ISPRS J. of Photogram. and Rem. Sens.
25
17 (98), 243-273. Barisin, I., S. Leprince, B. Parsons and T. Wright, 2009. Surface displacements in the September 2005
Afar rifting event from satellite image matching: Asymmetric uplift and faulting. Geophysical Research Letters 36 (7),
Barnhart, D. J., T. Vladimirova and M. N. Sweeting, 2007. Very-small-satellite design for distributed space missions. Journal of Spacecraft and Rockets 44 (6), 1294-1306.
Bauer, A., G. Paar and A. Kaltenböck, 2005. Mass movement monitoring using terrestrial laser scanner for rock fall management. Springer, 393-406.
Bendig, J., A. Bolten and G. Bareth, 2013. UAV-based Imaging for Multi-Temporal, very high Resolution Crop Surface Models to monitor Crop Growth VariabilityMonitoring des Pflanzenwachstums mit Hilfe multitemporaler und hoch auflösender Oberflächenmodelle von Getreidebeständen auf Basis von Bildern aus UAV-Befliegungen. Photogrammetrie-Fernerkundung-Geoinformation 2013 (6), 551-562.
Benediktsson, J. A., M. Pesaresi and K. Amason, 2003. Classification and feature extraction for remote sensing images from urban areas based on morphological transformations. IEEE Transactions on Geoscience and Remote Sensing 41 (9), 1940-1949.
Besl, P. and N. Mckay, 1992. A method for registration of 3-D shapes. IEEE Transactions on Pattern Analysis and Machine Intelligence 14 (2), 239-256.
Bláha, M., C. Vogel, A. Richard, J. D. Wegner, T. Pock and K. Schindler, 2016. Large-Scale Semantic 3D Reconstruction: an Adaptive Multi-Resolution Model for Multi-Class Volumetric Labeling. IEEE Conference on Computer Vision and Pattern Recognition (CVPR), 3176-3184.
Blake, A., P. Kohli and C. Rother, 2011. Markov random fields for vision and image processing. The MIT Press, 463.
Blaschke, T., 2010. Object based image analysis for remote sensing. ISPRS Journal of Photogrammetry and Remote Sensing 65 (1), 2-16.
Bouziani, M., K. Goïta and D.-C. He, 2010. Automatic change detection of buildings in urban environment from very high spatial resolution images using existing geodatabase and prior knowledge. ISPRS Journal of Photogrammetry and Remote Sensing 65 (1), 143-153.
Brauna, A., S. Tuttasb, A. Borrmanna and U. Stillab, 2015. Automated progress monitoring based on photogrammetric point clouds and precedence relationship graphs. In: ISARC. Proceedings of the International Symposium on Automation and Robotics in Construction, pp. 1.
Breiman, L., 2001. Random forests. Machine learning 45 (1), 5-32. Brunner, D., G. Lemoine and L. Bruzzone, 2010. Earthquake damage assessment of buildings using
VHR optical and SAR imagery. Geoscience and Remote Sensing, IEEE Transactions on 48 (5), 2403-2420. Bruzzone, L. and D. F. Prieto, 2002. An adaptive semiparametric and context-based approach to
unsupervised change detection in multitemporal remote-sensing images. IEEE Transactions on Image Processing 11 (4), 452-466.
Carvalho, L. d., L. Fonseca, F. Murtagh and J. Clevers, 2001. Digital change detection with the aid of multiresolution wavelet analysis. International Journal of Remote Sensing 22 (18), 3871-3876.
Chaabouni-Chouayakh, H., P. d'Angelo, T. Krauss and P. Reinartz, 2011. Automatic urban area monitoring using digital surface models and shape features. In: Urban Remote Sensing Event (JURSE), 2011 Joint, pp. 85-88.
Chaabouni-Chouayakh, H., T. Krauss, P. d’Angelo and P. Reinartz, 2010. 3D Change Detection Inside Urban Areas Using Different Digital Surface Models. International Archives of Photogrammetry, Remote Sensing and Spatial Information Sciences 38 86-91.
Chaabouni-Chouayakh, H. and P. Reinartz, 2011. Towards automatic 3D change detection inside urban areas by combining height and shape information. Photogrammetrie-Fernerkundung-Geoinformation 2011 (4), 205-217.
Champion, N., 2007. 2D building change detection from high resolution aerial images and
[Review] 3D Change Detection – Approaches and Applications - ISPRS J. of Photogram. and Rem. Sens.
26
correlation digital surface models. International Archives of Photogrammetry, Remote Sensing and Spatial Information Sciences 36 (3/W49A), 197-202.
Champion, N., D. Boldo, M. Pierrot-Deseilligny and G. Stamon, 2010. 2D building change detection from high resolution satelliteimagery: A two-step hierarchical method based on 3D invariant primitives. Pattern Recognition Letters 31 (10), 1138-1147.
Champion, N., F. Rottensteiner, L. Matikainen, X. Liang, J. Hyyppä and B. Olsen, 2009. A test of automatic building change detection approaches. International Achieves of Photogrammetry, Remote Sensing and Spatial Information Sciences 38 (Part 3/W4), 145-150.
Chao, H., Y. Cao and Y. Chen, 2010. Autopilots for small unmanned aerial vehicles: a survey. International Journal of Control, Automation and Systems 8 (1), 36-44.
Chehata, N., L. Guo and C. Mallet, 2009. Airborne lidar feature selection for urban classification using random forests. International Archives of Photogrammetry, Remote Sensing and Spatial Information Sciences 38 (Part 3), W8.
Chen, B., Z. Chen, L. Deng, Y. Duan and J. Zhou, 2016. Building change detection with RGB-D map generated from UAV images. Neurocomputing
Chen, G., K. Zhao and R. Powers, 2014. Assessment of the image misregistration effects on object-based change detection. ISPRS Journal of Photogrammetry and Remote Sensing 87 (2014), 19-27.
Chen, S.-E., C. Rice, C. Boyle and E. Hauser, 2011. Small-format aerial photography for highway-bridge monitoring. Journal of Performance of Constructed Facilities 25 (2), 105-112.
Chen, Y. and G. Medioni, 1992. Object modelling by registration of multiple range images. Image and Vision Computing 10 (3), 145-155.
Choi, K. and I. Lee, 2011. A UAV-based close-range rapid aerial monitoring system for emergency responses. Int. Arch. Photogramm. Remote Sens. Spat. Inf. Sci 38 247-252.
Choi, K., I. Lee and S. Kim, 2009. A feature based approach to automatic change detection from Lidar data in urban areas. International Archives of Photogrammetry, Remote Sensing and Spatial Information Sciences 38 (Part 3/W8), 259-264.
Colomina, I. and P. Molina, 2014. Unmanned aerial systems for photogrammetry and remote sensing: A review. ISPRS Journal of Photogrammetry and Remote Sensing 92 79-97.
Copley, A., J. P. Avouac, J. Hollingsworth and S. Leprince, 2011. The 2001 Mw 7.6 Bhuj earthquake, low fault friction, and the crustal support of plate driving forces in India. Journal of Geophysical Research: Solid Earth 116 (B8),
Coppin, P., I. Jonckheere, K. Nackaerts, B. Muys and E. Lambin, 2004. Digital change detection methods in ecosystem monitoring: a review. International Journal of Remote Sensing 25 (9), 1565-1596.
Crispell, D., J. Mundy and G. Taubin, 2012. A variable-resolution probabilistic three-dimensional model for change detection. Geoscience and Remote Sensing, IEEE Transactions on 50 (2), 489-500.
d'Angelo, P., C. Rossi, C. Minet, M. Eineder, M. Flory and I. Niemeyer, 2014. High Resolution 3D Earth Observation Data Analysis for Safeguards Activities. In: Symposium on International Safeguards, pp. 1-8.
d’Angelo, P. and P. Reinartz, 2011. Semiglobal matching results on the ISPRS stereo matching benchmark. In: ISPRS Hannover Workshop 2011: High-Resolution Earth Imaging for Geospatial Information, Hannover, Germany, 14-17 June, 2011, pp. 79-84.
Daniel, S. and M.-A. Doran, 2013. geoSmartCity: geomatics contribution to the smart city. In: Proceedings of the 14th Annual International Conference on Digital Government Research, pp. 65-71.
Desclée, B., P. Bogaert and P. Defourny, 2006. Forest change detection by statistical object-based method. Remote Sensing of Environment 102 (1), 1-11.
DigitalGlobe, 2016. Worldview-3, http://worldview3.digitalglobe.com/. (accessed 02.07.2016) Dini, G., K. Jacobsen, F. Rottensteiner, M. Al Rajhi and C. Heipke, 2012. 3D Building Change
Detection Using High Resolution Stereo Images and a GIS Database. ISPRS-International Archives of the Photogrammetry, Remote Sensing and Spatial Information Sciences 1 299-304.
[Review] 3D Change Detection – Approaches and Applications - ISPRS J. of Photogram. and Rem. Sens.
27
Douret, J. and R. Benosman, 2004. A multi-cameras 3d volumetric method for outdoor scenes: a road traffic monitoring application. In: Pattern Recognition, 2004. ICPR 2004. Proceedings of the 17th International Conference on, pp. 334-337.
Durieux, L., E. Lagabrielle and A. Nelson, 2008. A method for monitoring building construction in urban sprawl areas using object-based analysis of Spot 5 images and existing GIS data. ISPRS Journal of Photogrammetry and Remote Sensing 63 (4), 399-408.
Eden, I. and D. B. Cooper, 2008. Using 3D line segments for robust and efficient change detection from multiple noisy images. In: 10th European Conference on Computer Vision, Marseille, France, 12-18, October, pp. 172-185.
Fan, H., J. Zhang, Z. Zhang and Z. Liu, 1999. House change detection based on DSM of aerial image in urban area. Geo-spatial Information Science 2 (1), 68-72.
Fischler, M. A. and R. C. Bolles, 1981. Random sample consensus: a paradigm for model fitting with applications to image analysis and automated cartography. Communications of the ACM 24 (6), 381-395.
Foody, G. M., 1996. Relating the land-cover composition of mixed pixels to artificial neural network classification output. Photogrammetric engineering and remote sensing 62 (5), 491-498.
Fraser, C. S. and H. B. Hanley, 2003. Bias compensation in rational functions for IKONOS satellite imagery. Photogrammetric engineering and remote sensing 69 (1), 53-58.
Furukawa, Y. and J. Ponce, 2010. Accurate, dense, and robust multiview stereopsis. Pattern Analysis and Machine Intelligence, IEEE Transactions on 32 (8), 1362-1376.
Gehrke, S., K. Morin, M. Downey, N. Boehrer and T. Fuchs, 2010. Semi-global matching: An alternative to LIDAR for DSM generation. International Archives of the Photogrammetry, Remote Sensing and Spatial Information Sciences, Calgary, AB, 38 (B1) 6.
Gerke, M. and N. Kerle, 2011. Automatic structural seismic damage assessment with airborne oblique Pictometry© imagery. Photogrammetric Engineering & Remote Sensing 77 (9), 885-898.
Ghuffar, S., B. Székely, A. Roncat and N. Pfeifer, 2013. Landslide displacement monitoring using 3D range flow on airborne and terrestrial LiDAR data. Remote Sensing 5 (6), 2720-2745.
Girardeau-Montaut, D., M. Rouxa, R. Marcb and G. Thibaultb, 2005. Change detection on point cloud data acquired with a ground Laser scanner. The International Archives of Photogrammetry, Remote Sensing and Spatial Information Sciences 36 (Part 3/W19), pp. 30-35.
Gong, P., Greg.S. Biging and R. Standiford, 2000. Technical Note: Use of Digital Surface Model for Hardwood Rangeland Monitoring. Journal of Range Management 53 (6), 622-626.
González-Jorge, H., I. Puente, D. Roca, J. Martínez-Sánchez, B. Conde and P. Arias, 2014. UAV photogrammetry application to the monitoring of rubble mound breakwaters. Journal of Performance of Constructed Facilities 30 (1), 04014194.
Grigillo, D., M. Kosmatin Fras and D. Petrovič, 2011. Automatic extraction and building change detection from digital surface model and multispectral orthophoto. Geodetski Vestnik 55 (1), 28-45.
Gruen, A., 2013. Next generation smart cities-the role of geomatics. BBC 26.17: 32.81 G 547 (25), 25.
Gruen, A. and D. Akca, 2005. Least squares 3D surface and curve matching. ISPRS Journal of Photogrammetry and Remote Sensing 59 (3), 151-174.
Guerin, C., R. Binet and M. Pierrot-Deseilligny, 2014. Automatic Detection of Elevation Changes by Differential DSM Analysis: Application to Urban Areas. IEEE Journal of Selected Topics in Applied Earth Observations and Remote Sensing 7 (10), 4020-4037.
Haala, N. and M. Rothermel, 2012. Dense multiple stereo matching of highly overlapping UAV imagery. ISPRS-International Archives of the Photogrammetry, Remote Sensing and Spatial Information Sciences 39 B1.
Habib, A., M. Ghanma, M. Morgan and R. Al-Ruzouq, 2005. Photogrammetric and LiDAR data registration using linear features. Photogrammetric Engineering & Remote Sensing 71 (6), 699-707.
[Review] 3D Change Detection – Approaches and Applications - ISPRS J. of Photogram. and Rem. Sens.
28
Habib, A. and T. Schenk, 1999. A new approach for matching surfaces from laser scanners and optical scanners. International Archives of Photogrammetry and Remote Sensing 32 (3/W14), 55-61.
Han, K., J. Lin and M. Golparvar-Fard, 2015. A formalism for utilization of autonomous vision-based systems and integrated project models for construction progress monitoring. In: Proc., 2015 Conference on Autonomous and Robotic Construction of Infrastructure, pp.
Hayes, D. J. and S. A. Sader, 2001. Comparison of change-detection techniques for monitoring tropical forest clearing and vegetation regrowth in a time series. Photogrammetric Engineering and Remote Sensing 67 (9), 1067-1075.
Heller, A. J., Y. G. Leclerc and Q.-T. Luong, 2001. Framework for robust 3D change detection. In: International Symposium on Remote Sensing, pp. 639-649.
Herman, F., B. Anderson and S. Leprince, 2011. Mountain glacier velocity variation during a retreat/advance cycle quantified using sub-pixel analysis of ASTER images. Journal of Glaciology 57 (202), 197-207.
Hirschmüller, H., 2005. Accurate and efficient stereo processing by semi-global matching and mutual information. In: IEEE Computer Society Conference on Computer Vision and Pattern Recognition, pp. 807-814.
Hirschmüller, H., 2008. Stereo processing by semiglobal matching and mutual information. IEEE Transactions on Pattern Analysis and Machine Intelligence 30 (2), 328-341.
Huang, X., L. Zhang and W. Gong, 2011. Information fusion of aerial images and LIDAR data in urban areas: vector-stacking, re-classification and post-processing approaches. International Journal of Remote Sensing 32 (1), 69-84.
Huang, X., L. Zhang and T. Zhu, 2014. Building change detection from multitemporal high-resolution remotely sensed images based on a morphological building index. Selected Topics in Applied Earth Observations and Remote Sensing, IEEE Journal of 7 (1), 105-115.
Hunter, G., H. Pinkerton, R. Airey and S. Calvari, 2003. The application of a long-range laser scanner for monitoring volcanic activity on Mount Etna. Journal of Volcanology and Geothermal Research 123 (1), 203-210.
Hussain, M., D. Chen, A. Cheng, H. Wei and D. Stanley, 2013. Change detection from remotely sensed images: From pixel-based to object-based approaches. ISPRS Journal of Photogrammetry and Remote Sensing 80 (2013), 91-106.
Huttenlocher, D. P., G. A. Klanderman and W. J. Rucklidge, 1993. Comparing images using the Hausdorff distance. IEEE Transactions on Pattern Analysis and Machine Intelligence 15 (9), 850-863.
Immerzeel, W., P. Kraaijenbrink, J. Shea, A. Shrestha, F. Pellicciotti, M. Bierkens and S. De Jong, 2014. High-resolution monitoring of Himalayan glacier dynamics using unmanned aerial vehicles. Remote Sensing of Environment 150 93-103.
Ingram, K., E. Knapp and J. Robinson, 1981. Change detection technique development for improved urbanized area delineation. In: Technical Memorandum CSC/TM-81, Computer Sciences Corporation, Silver Springs, Maryland, U.S.A., pp.
Jaboyedoff, M., T. Oppikofer, A. Abellán, M.-H. Derron, A. Loye, R. Metzger and A. Pedrazzini, 2012. Use of LIDAR in landslide investigations: a review. Natural hazards 61 (1), 5-28.
James, L. A., M. E. Hodgson, S. Ghoshal and M. M. Latiolais, 2012. Geomorphic change detection using historic maps and DEM differencing: The temporal dimension of geospatial analysis. Geomorphology 137 (1), 181-198.
Johnson, R. D. and E. Kasischke, 1998. Change vector analysis: a technique for the multispectral monitoring of land cover and condition. International Journal of Remote Sensing 19 (3), 411-426.
Jones, L., 2006. Monitoring landslides in hazardous terrain using terrestrial LiDAR: an example from Montserrat. Quarterly journal of engineering geology and hydrogeology 39 (4), 371-373.
Jung, F., 2004. Detecting building changes from multitemporal aerial stereopairs. ISPRS Journal of
[Review] 3D Change Detection – Approaches and Applications - ISPRS J. of Photogram. and Rem. Sens.
29
Photogrammetry and Remote Sensing 58 (3), 187-201. Kang, Z. and Z. Lu, 2011. The change detection of building models using epochs of terrestrial point
clouds. In: IEEE International Workshop on Multi-Platform/Multi-Sensor Remote Sensing and Mapping Xiamen, China, 10-12 January, pp. 1-6.
Karras, G. E. and E. Petsa, 1993. DEM matching and detection of deformation in close-range photogrammetry without control. Photogrammetric engineering and remote sensing 59 (9), 1419-1424.
Kasetkasem, T. and P. K. Varshney, 2002. An image change detection algorithm based on Markov random field models. IEEE Transactions on Geoscience and Remote Sensing 40 (8), 1815-1823.
Kim, C., B. Kim and H. Kim, 2013. 4D CAD model updating using image processing-based construction progress monitoring. Automation in Construction 35 44-52.
Knudsen, T. and B. P. Olsen, 2003. Automated change detection for updates of digital map databases. Photogrammetric Engineering and Remote Sensing 69 (11), 1289-1296.
Kohonen, T., 1982. Self-organized formation of topologically correct feature maps. Biological cybernetics 43 (1), 59-69.
Košecka, J., 2012. Detecting changes in images of street scenes. In: Asian Conference on Computer Vision, pp. 590-601.
Krauß, T., P. d'Angelo, M. Schneider and V. Gstaiger, 2013. The Fully Automatic Optical Processing System CATENA at DLR. International Archives of the Photogrammetry, Remote Sensing and Spatial Information Sciences 177-181.
Lambin, E. F. and D. Ehrlich, 1997. Land-cover changes in sub-Saharan Africa (1982–1991): Application of a change index based on remotely sensed surface temperature and vegetation indices at a continental scale. Remote Sensing of Environment 61 (2), 181-200.
Lee, S. and Y. Choi, 2015. Topographic survey at small-scale open-pit mines using a popular rotary-wing unmanned aerial vehicle (drone). Tunnel and Underground Space 25 (5), 462-469.
Lelong, C. C., P. Burger, G. Jubelin, B. Roux, S. Labbé and F. Baret, 2008. Assessment of unmanned aerial vehicles imagery for quantitative monitoring of wheat crop in small plots. Sensors 8 (5), 3557-3585.
Li, M., L. Cheng, J. Gong, Y. Liu, Z. Chen, F. Li, G. Chen, D. Chen and X. Song, 2008. Post-earthquake assessment of building damage degree using LiDAR data and imagery. Science in China Series E: Technological Sciences 51 (2), 133-143.
Lin, Y., J. Hyyppa and A. Jaakkola, 2011. Mini-UAV-borne LIDAR for fine-scale mapping. IEEE Geoscience and Remote Sensing Letters 8 (3), 426-430.
Liu, Z., J. Zhang, Z. Zhang and H. Fan, 2003. Change detection based on DSM and image features in urban areas. Geo-spatial Information Science 6 (2), 35-41.
Longbotham, N., F. Pacifici, T. Glenn, A. Zare, M. Volpi, D. Tuia, E. Christophe, J. Michel, J. Inglada and J. Chanussot, 2012. Multi-modal change detection, application to the detection of flooded areas: Outcome of the 2009–2010 data fusion contest. IEEE Journal of Selected Topics in Applied Earth Observations and Remote Sensing 5 (1), 331-342.
Lu, D., P. Mausel, E. Brondizio and E. Moran, 2004. Change detection techniques. International Journal of Remote Sensing 25 (12), 2365-2401.
Lu, D., P. Mausel, E. Brondızio and E. Moran, 2002. Change detection of successional and mature forests based on forest stand characteristics using multitemporal TM data in Altamira, Brazil. In: XXII FIG International Congress, ACSM–ASPRS Annual Conference Proceedings, Washington, DC, USA, pp. 19-26.
Maas, A., F. Rottensteiner and C. Heipke, 2016. Using Label Noise Robust Logistic Regression for Automated Updating of Topographic Geospatial Databases. ISPRS Annals of Photogrammetry, Remote Sensing and Spatial Information Sciences 133-140.
Maas, H.-G., 2000. Least-Squares Matching with airborne laserscanning data in a TIN structure. International Archives of Photogrammetry and Remote Sensing 33 (B3/1; PART 3), 548-555.
[Review] 3D Change Detection – Approaches and Applications - ISPRS J. of Photogram. and Rem. Sens.
30
Malpica, J. A., M. C. Alonso, F. Papí, A. Arozarena and A. Martínez De Agirre, 2013. Change detection of buildings from satellite imagery and lidar data. International Journal of Remote Sensing 34 (5), 1652-1675.
Martha, T. R., N. Kerle, V. Jetten, C. J. van Westen and K. V. Kumar, 2010. Landslide volumetric analysis using Cartosat-1-derived DEMs. IEEE Geoscience and Remote Sensing Letters 7 (3), 582-586.
Mas, J.-F., 1999. Monitoring land-cover changes: a comparison of change detection techniques. International Journal of Remote Sensing 20 (1), 139-152.
Matikainen, L., J. Hyyppä, E. Ahokas, L. Markelin and H. Kaartinen, 2010. Automatic detection of buildings and changes in buildings for updating of maps. Remote Sensing 2 (5), 1217-1248.
Mayer, H., 1999. Automatic object extraction from aerial imagery—a survey focusing on buildings. Computer vision and image understanding 74 (2), 138-149.
Menderes, A., A. Erener and G. Sarp, 2015. Automatic Detection of Damaged Buildings after Earthquake Hazard by Using Remote Sensing and Information Technologies. Procedia Earth and Planetary Science 15 257-262.
Metternicht, G., 1999. Change detection assessment using fuzzy sets and remotely sensed data: an application of topographic map revision. ISPRS Journal of Photogrammetry and Remote Sensing 54 (4), 221-233.
Miller, D. R., C. P. Quine and W. Hadley, 2000. An investigation of the potential of digital photogrammetry to provide measurements of forest characteristics and abiotic damage. Forest Ecology and Management 135 (1), 279-288.
Mitchell, H. and R. Chadwick, 1999. Digital photogrammetric concepts applied to surface deformation studies. Geomatica 53 (4), 405-414.
Moosavi, S. V. and R. Qin, 2012. A New Automated Hierarchical Clustering Algorithm Based on Emergent Self Organizing Maps. In: 16th International Conference on Information Visualisation (IV) pp. 264-269.
Morgan, G. L. K., J. G. Liu and H. Yan, 2010. Precise subpixel disparity measurement from very narrow baseline stereo. IEEE Transactions on Geoscience and Remote Sensing 48 (9), 3424-3433.
Murakami, H., K. Nakagawa, H. Hasegawa, T. Shibata and E. Iwanami, 1999. Change detection of buildings using an airborne laser scanner. ISPRS Journal of Photogrammetry and Remote Sensing 54 (2), 148-152.
Nebiker, S., N. Lack and M. Deuber, 2014. Building Change Detection from Historical Aerial Photographs Using Dense Image Matching and Object-Based Image Analysis. Remote Sensing 6 (9), 8310-8336.
Nemmour, H. and Y. Chibani, 2006. Multiple support vector machines for land cover change detection: An application for mapping urban extensions. ISPRS Journal of Photogrammetry and Remote Sensing 61 (2), 125-133.
Noh, M.-J. and I. M. Howat, 2014. Automated coregistration of repeat digital elevation models for surface elevation change measurement using geometric constraints. IEEE Transactions on Geoscience and Remote Sensing 52 (4), 2247-2260.
Noh, M.-J. and I. M. Howat, 2015. Automated stereo-photogrammetric DEM generation at high latitudes: Surface Extraction with TIN-based Search-space Minimization (SETSM) validation and demonstration over glaciated regions. GIScience & Remote Sensing 52 (2), 198-217.
Núñez, P., P. Drews, A. Bandera, R. Rocha, M. Campos and J. Dias, 2010. Change detection in 3D environments based on Gaussian Mixture Model and robust structural matching for autonomous robotic applications. In: Intelligent Robots and Systems (IROS), 2010 IEEE/RSJ International Conference on, pp. 2633-2638.
Nurminen, K., M. Karjalainen, X. Yu, J. Hyyppä and E. Honkavaara, 2013. Performance of dense digital surface models based on image matching in the estimation of plot-level forest variables. ISPRS
[Review] 3D Change Detection – Approaches and Applications - ISPRS J. of Photogram. and Rem. Sens.
31
Journal of Photogrammetry and Remote Sensing 83 104-115. Nuth, C. and A. Kääb, 2011. Co-registration and bias corrections of satellite elevation data sets for
quantifying glacier thickness change. The Cryosphere 5 (1), 271-290. Olsen, B. P., 2004. Automatic change detection for validation of digital map databases. International
Archives of Photogrammetry and Remote Sensing 34 (Part B2), 569-574. Olsen, B. P. and T. Knudsen, 2005. Automated change detection for validation and update of
geodata. In: 6th Geomatic Week Conference, Barcelone, Spain, pp. Pacifici, F., F. Del Frate, C. Solimini and W. J. Emery, 2007. An innovative neural-net method to detect
temporal changes in high-resolution optical satellite imagery. IEEE Transactions on Geoscience and Remote Sensing 45 (9), 2940-2952.
Pang, S., X. Hu, Z. Wang and Y. Lu, 2014. Object-Based Analysis of Airborne LiDAR Data for Building Change Detection. Remote Sensing 6 (11), 10733-10749.
Park, H., H. Lee, H. Adeli and I. Lee, 2007. A new approach for health monitoring of structures:
terrestrial laser scanning. Computer‐Aided Civil and Infrastructure Engineering 22 (1), 19-30. Pierrot-Deseilligny, M., L. De Luca and F. Remondino, 2011. Automated image-based procedures for
accurate artifacts 3D modeling and orthoimage generation. Geoinformatics FCE CTU 6 291-299. Pilgrim, L., 1996. Robust estimation applied to surface matching. ISPRS Journal of Photogrammetry
and Remote Sensing 51 (5), 243-257. Pollard, T. and J. L. Mundy, 2007. Change detection in a 3-d world. In: IEEE Computer Society
Conference on Computer Vision and Pattern Recognition, Minneapolis, Minnesota, USA, 18-23 June, pp. 1-6.
Qin, R., 2014a. Change detection on LOD 2 building models with very high resolution spaceborne stereo imagery. ISPRS Journal of Photogrammetry and Remote Sensing 96 (2014), 179-192.
Qin, R., 2014b. An object-based hierarchical method for change detection using unmanned aerial vehicle images. Remote Sensing 6 (9), 7911-7932.
Qin, R., J. Gong, H. Li and X. Huang, 2013. A Coarse Elevation Map-based Registration Method for Super-resolution of Three-line Scanner Images. Photogrammetric Engineering and Remote Sensing 79 (8), 717-730.
Qin, R. and A. Gruen, 2014. 3D change detection at street level using mobile laser scanning point clouds and terrestrial images. ISPRS Journal of Photogrammetry and Remote Sensing 90 (2014), 23-35.
Qin, R., A. Gruen and C. Fraser, 2014. Quality Assessment of Image Matchers for DSM Generation - A Comparative Study Based on UAV Images. In: Asian Conference on Remote Sensing, Nay Pyi Taw, Myanmar, 27-31, Octomber, 2014, pp.
Qin, R., X. Huang, A. Gruen and G. Schmitt, 2015a. Object-Based 3-D Building Change Detection on Multitemporal Stereo Images. IEEE Journal of Selected Topics in Applied Earth Observations and Remote Sensing 5 (8), 2125-2137.10.1109/JSTARS.2015.2424275
Qin, R., J. Tian and P. Reinartz, 2015b. Spatiotemporal inferences for use in building detection using series of very-high-resolution space-borne stereo images. International Journal of Remote Sensing DOI: 10.1080/01431161.2015.1066527 (ahead-of-print),
Radke, R. J., S. Andra, O. Al-Kofahi and B. Roysam, 2005. Image change detection algorithms: a systematic survey. IEEE Transactions on Image Processing 14 (3), 294-307.
Ram, B. and A. Kolarkar, 1993. Remote sensing application in monitoring land-use changes in arid Rajasthan. International Journal of Remote Sensing 14 (17), 3191-3200.
Rathinam, S., Z. W. Kim and R. Sengupta, 2008. Vision-based monitoring of locally linear structures using an unmanned aerial vehicle 1. Journal of Infrastructure Systems 14 (1), 52-63.
Rebolj, D., N. Č. Babič, A. Magdič, P. Podbreznik and M. Pšunder, 2008. Automated construction activity monitoring system. Advanced engineering informatics 22 (4), 493-503.
Reinartz, P., M. Lachaise, E. Schmeer, T. Krauss and H. Runge, 2006. Traffic monitoring with serial
[Review] 3D Change Detection – Approaches and Applications - ISPRS J. of Photogram. and Rem. Sens.
32
images from airborne cameras. ISPRS Journal of Photogrammetry and Remote Sensing 61 (3), 149-158.
Remondino, F. and S. El‐Hakim, 2006. Image‐based 3D modelling: A review. The Photogrammetric Record 21 (115), 269-291.
Remondino, F., M. G. Spera, E. Nocerino, F. Menna and F. Nex, 2014. State of the art in high density image matching. The Photogrammetric Record 29 (146), 144-166.
Rosenholm, D. and K. TORLEGARD, 1988. Three-dimensional absolute orientation of stereo models using digital elevation models. Photogrammetric engineering and remote sensing 54 1385-1389.
Rothermel, M., K. Wenzel, D. Fritsch and N. Haala, 2012. SURE: Photogrammetric Surface Reconstruction from Imagery. In: Proceedings LC3D Workshop, Berlin, pp.
Rottensteiner, F., J. Trinder, S. Clode and K. Kubik, 2007. Building detection by fusion of airborne laser scanner data and multi-spectral images: Performance evaluation and sensitivity analysis. ISPRS Journal of Photogrammetry and Remote Sensing 62 (2), 135-149.
Saito, K., R. J. Spence, C. Going and M. Markus, 2004. Using high-resolution satellite images for post-earthquake building damage assessment: a study following the 26 January 2001 Gujarat earthquake. Earthquake Spectra 20 (1), 145-169.
Sasagawa, A., E. Baltsavias, S. K. Aksakal and J. D. Wegner, 2013. Investigation on automatic change detection using pixel-changes and DSM-changes with ALOS-PRISM triplet images. ISPRS-International Archives of the Photogrammetry, Remote Sensing and Spatial Information Sciences 1 (2), 213-217.
Sasagawa, A., K. Watanabe, S. Nakajima, K. Koido, H. Ohno and H. Fujimura, 2008. Automatic change detection based on pixel-change and DSM-change. The International Archives of the Photogrammetry, Remote Sensing and Spatial Information Sciences 37 (Part B7), 1645-1650.
Schenk, T., A. Krupnik and Y. Postolov, 2000. Comparative study of surface matching algorithms. International Archives of Photogrammetry and Remote Sensing 33 (B4), 518-524.
Schindler, G. and F. Dellaert, 2010. Probabilistic temporal inference on reconstructed 3d scenes. In: IEEE Conference on Computer Vision and Pattern Recognition, pp. 1410-1417.
Seitz, S. M., B. Curless, J. Diebel, D. Scharstein and R. Szeliski, 2006. A comparison and evaluation of multi-view stereo reconstruction algorithms. In: 2006 IEEE Computer Society Conference on Computer Vision and Pattern Recognition (CVPR'06), pp. 519-528.
Siebert, S. and J. Teizer, 2014. Mobile 3D mapping for surveying earthwork projects using an Unmanned Aerial Vehicle (UAV) system. Automation in Construction 41 1-14.
Singer, J., K. Thuro and U. Sambeth, 2006. Development of a continuous 3d-monitoring system for unstable slopes using time domain reflectometry. Felsbau 24 (3), 16-23.
Singh, A., 1986. Change detection in the tropical forest environment of northeastern India using Landsat. Remote sensing and tropical land management 237-254.
Singh, A., 1989. Digital Change Detection Techniques Using Remotely-Sensed Data. International Journal of Remote Sensing 10 (6), 989-1003.
Snavely, N., S. M. Seitz and R. Szeliski, 2006. Photo tourism: exploring photo collections in 3D. In: ACM transactions on graphics (TOG), pp. 835-846.
Sohn, G. and I. Dowman, 2007. Data fusion of high-resolution satellite imagery and LiDAR data for automatic building extraction. ISPRS Journal of Photogrammetry and Remote Sensing 62 (1), 43-63.
Song, D.-X., C. Huang, J. O. Sexton, S. Channan, M. Feng and J. R. Townshend, 2014. Use of Landsat and Corona data for mapping forest cover change from the mid-1960s to 2000s: Case studies from the Eastern United States and Central Brazil. ISPRS Journal of Photogrammetry and Remote Sensing
Stal, C., F. Tack, P. De Maeyer, A. De Wulf and R. Goossens, 2013. Airborne photogrammetry and lidar for DSM extraction and 3D change detection over an urban area–a comparative study. International Journal of Remote Sensing 34 (4), 1087-1110.
Stepper, C., C. Straub and H. Pretzsch, 2015. Assessing height changes in a highly structured forest using regularly acquired aerial image data. Forestry 88 (3), 304-316.
[Review] 3D Change Detection – Approaches and Applications - ISPRS J. of Photogram. and Rem. Sens.
33
Straitstimes, 2014. Interactive 3-D map of Singapore to be ready by 2017: National Research Foundation, http://www.straitstimes.com/singapore/interactive-3-d-map-of-singapore-to-be-ready-by-2017-national-research-foundation. (accessed 23.06.2016)
Taneja, A., L. Ballan and M. Pollefeys, 2013. City-Scale Change Detection in Cadastral 3D Models Using Images. In: IEEE Conference on Computer Vision and Pattern Recognition pp. 113-120.
Taneja, A., L. Ballan and M. Pollefeys, 2015. Geometric change detection in urban environments using images. IEEE Transactions on Pattern Analysis and Machine Intelligence 37 (11), 2193-2206.
Taneja, A., L. Ballan and M. Pollefeys, 2011. Image based detection of geometric changes in urban environments. In: Proceedings of IEEE International Conference on Computer Vision, Barcelona, Spain, 6-13 November, pp. 2336-2343.
Teo, T.-A. and T.-Y. Shih, 2013. LiDAR-based change detection and change-type determination in urban areas. International Journal of Remote Sensing 34 (3), 968-981.
Tewkesbury, A. P., A. J. Comber, N. J. Tate, A. Lamb and P. F. Fisher, 2015. A critical synthesis of remotely sensed optical image change detection techniques. Remote Sensing of Environment 160 1-14.
Theiler, P. W., J. D. Wegner and K. Schindler, 2014. Keypoint-based 4-Points Congruent Sets–Automated marker-less registration of laser scans. ISPRS Journal of Photogrammetry and Remote Sensing 96 149-163.
Tian, J., 2013, 3D change detection from high and very high resolution satellite stereo imagery. Ph.D Thesis, Institute for Geoinformatics and Remote Sensing (IGF) University of Osnabrück.
Tian, J., H. Chaabouni-Chouayakh, P. Reinartz, T. Krauß and P. d'Angelo, 2010. Automatic 3D change detection based on optical satellite stereo imagery. International Archives of Photogrammetry, Remote Sensing and Spatial Information Sciences 38 (Part 7B), 586-591.
Tian, J., S. Cui and P. Reinartz, 2014a. Building change detection based on satellite stereo imagery and digital surface models. IEEE Transactions on Geoscience and Remote Sensing 52 (1), 406-417.
Tian, J., A. A. Nielsen and P. Reinartz, 2014b. Improving change detection in forest areas based on stereo panchromatic imagery using kernel MNF. IEEE Transactions on Geoscience and Remote Sensing 52 (11), 7130 - 7139.
Tian, J. and P. Reinartz, 2013. Fusion of multi-spectral bands and DSM from Worldview-2 Stereo imagery for building extraction. In: Urban Remote Sensing Event (JURSE), 2013 Joint, pp. 135-138.
Tian, J., P. Reinartz, P. d’Angelo and M. Ehlers, 2013. Region-based automatic building and forest change detection on Cartosat-1 stereo imagery. ISPRS Journal of Photogrammetry and Remote Sensing 79 226-239.
Torres-Sánchez, J., J. Peña, A. De Castro and F. López-Granados, 2014. Multi-temporal mapping of the vegetation fraction in early-season wheat fields using images from UAV. Computers and Electronics in Agriculture 103 104-113.
Travelletti, J., C. Delacourt, P. Allemand, J.-P. Malet, J. Schmittbuhl, R. Toussaint and M. Bastard, 2012. Correlation of multi-temporal ground-based optical images for landslide monitoring: Application, potential and limitations. ISPRS Journal of Photogrammetry and Remote Sensing 70 39-55.
Triggs, B., P. F. McLauchlan, R. I. Hartley and A. W. Fitzgibbon, 2000. Bundle adjustment—a modern synthesis. Springer, 298-372.
Trinder, J. and M. Salah, 2012. Aerial images and LiDAR data fusion for disaster change detection. ISPRS Ann. Photogramm. Remote Sens. Spat. Inf. Sci 1 227-232.
Turker, M. and B. Cetinkaya, 2005. Automatic detection of earthquake‐damaged buildings using
DEMs created from pre‐and post‐earthquake stereo aerial photographs. International Journal of Remote Sensing 26 (4), 823-832.
Ulusoy, A. O. and J. L. Mundy, 2014. Image-based 4-d reconstruction using 3-d change detection. In: European Conference on Computer Vision, pp. 31-45.
Vakalopoulou, M., K. Karantzalos, N. Komodakis and N. Paragios, 2015. Simultaneous registration
[Review] 3D Change Detection – Approaches and Applications - ISPRS J. of Photogram. and Rem. Sens.
34
and change detection in multitemporal, very high resolution remote sensing data. In: Proceedings of the IEEE Conference on Computer Vision and Pattern Recognition Workshops, pp. 61-69.
Vapnik, V., 1963. Pattern recognition using generalized portrait method. Automation and remote control 24 774-780.
Vapnik, V. N. and S. Kotz, 1982. Estimation of dependences based on empirical data. Springer-Verlag New York,
Vassilopoulou, S., L. Hurni, V. Dietrich, E. Baltsavias, M. Pateraki, E. Lagios and I. Parcharidis, 2002. Orthophoto generation using IKONOS imagery and high-resolution DEM: a case study on volcanic hazard monitoring of Nisyros Island (Greece). ISPRS Journal of Photogrammetry and Remote Sensing 57 (1), 24-38.
Vögtle, T. and E. Steinle, 2004. Detection and recognition of changes in building geometry derived from multitemporal laserscanning data. International Archives of the Photogrammetry, Remote Sensing and Spatial Information Sciences 35 (B2), 428-433.
Vu, T. T., M. Matsuoka and F. Yamazaki, 2004. LIDAR-based change detection of buildings in dense urban areas. In: Geoscience and Remote Sensing Symposium, 2004. IGARSS'04. Proceedings. 2004 IEEE International, pp. 3413-3416.
Wallace, L., A. Lucieer, C. Watson and D. Turner, 2012. Development of a UAV-LiDAR system with application to forest inventory. Remote Sensing 4 (6), 1519-1543.
Walter, V., 2004. Object-based classification of remote sensing data for change detection. ISPRS Journal of Photogrammetry and Remote Sensing 58 (3), 225-238.
Wang, L., 2005. Support Vector Machines: theory and applications. Springer, 431. Waser, L., E. Baltsavias, K. Ecker, H. Eisenbeiss, E. Feldmeyer-Christe, C. Ginzler, M. Küchler and L.
Zhang, 2008. Assessing changes of forest area and shrub encroachment in a mire ecosystem using digital surface models and CIR aerial images. Remote Sensing of Environment 112 (5), 1956-1968.
Waser, L. T., E. Baltsavias, H. Eisenbeiss, C. Ginzler, A. Gruen, M. Kuechler and P. Thee, 2007. Change Detection in Mire Ecosystems: Assessing Changes of Forest Area using Airborne Remote Sensing Data. In: The international archives of the photogrammetry, remote sensing and spatial information sciences, pp. 313-318.
Wong, K., 2001. Survey of regional developments: Civil applications. In: UAV Australia Conference, Melbourne, Australia, pp. 8-9.
Xiao, W., B. Vallet, M. Brédif and N. Paparoditis, 2015. Street environment change detection from mobile laser scanning point clouds. ISPRS Journal of Photogrammetry and Remote Sensing 107 38-49.
Xiao, W., B. Vallet and N. Paparoditis, 2013. Change detection in 3D point clouds acquired by a mobile mapping system. ISPRS Annals of Photogrammetry, Remote Sensing and Spatial Information Sciences 1 (2), 331-336.
Zavodny, A. G., 2012, Change detection in lidar scans of urban environments. Computer Science and Engineering, University of Notre Dame.
Zebedin, L., J. Bauer, K. Karner and H. Bischof, 2008. Fusion of feature-and area-based information for urban buildings modeling from aerial imagery. In: European Conference on Computer Vision, pp. 873-886.
Zhang, Q., R. Qin, X. Huang, Y. Fang and L. Liu, 2015. Classification of Ultra-High Resolution Orthophotos Combined with DSM Using a Dual Morphological Top Hat Profile. Remote Sensing 7 (12), 16422-16440.
Zhang, T. and M. Cen, 2008. Robust DEM co-registration method for terrain changes assessment using least trimmed squares estimator. Advances in Space Research 41 (11), 1827-1835.
Zhang, Z., 1994. Iterative point matching for registration of free-form curves and surfaces. International Journal of Computer Vision 13 (2), 119-152.
Zhu, L., H. Shimamura, K. Tachibana, Y. Li and P. Gong, 2008. Building change detection based on

[Review] 3D Change Detection – Approaches and Applications - ISPRS J. of Photogram. and Rem. Sens.
35
object extraction in dense urban areas. International Archives of Photogrammetry, Remote Sensing and Spatial Information Sciences 37 (Part B7), 905-908.
Related Documents


