Haala 19 3D Building Reconstruction using Linear Edge Segments NORBERT HAALA, Stuttgart ABSTRACT In this article an algorithm aiming on the automatic reconstruction of buildingsis described. For this purpose three-dimensional line segments representing roof break-lines are used. Basic idea of the algorithm is to simplify the image interpretation necessary for the building reconstruction by the integration of height data. 1. INTRODUCTION In recent times the acquisition of three-dimensional databases for urban areas has become a topic of growing interest to the photogrammetric community. Simulations that require the representation, management and analysis of three-dimensional descriptions have become standard applications for planning purposes in built-up areas. One example is the propagation of electro-magnetic waves that can be simulated for planning optimal locations of transmitter stations. A similar application is the simulation of the propagation of noise or exhaust fumes near planned roads in build-up areas. Analyzing the impact of new buildings or parks on the micro-climate in urban areas is another topic. A widespread application is the computation of arbitrary perspectives or even animated fly-throughs to visualize urban scenes. Thereby the impression of new buildings within their surrounding can be presented effectively to persons involved in the planning process. The great market for this kind of applications is shown by the fact that architectural offices spend approximately 20% of their budget for the representation of their concepts. Realistic rendering of urban scenes is achieved by techniques like shading the object surfaces due to arbitrary light sources, or by texture mapping to represent different surface materials. If terrestrial images of the building facades are available they can be projected to the building faces. Terms like virtual reality or cyber space stand for the rapid progress and the growing number of applications in this area. Objects relevant for the description of urban areas are buildings, streets and Digital Terrain Models; this article concentrates on the reconstruction of buildings. The acquisition of the database for urban areas is frequently done by the analysis of aerial imagery since photogrammetric data is three-dimensional, exact, largely complete and up-to-date. Because manual interpretation is very time consuming, a lot of effort has been spend to speed up this process by automatic or semi-automatic procedures. In the short- and middle-term the human visual system will be superior to existing computer vision algorithms in interpreting complex, natural scenes like they occur frequently in aerial images. The idea beyond semi-automatic approaches is to utilize the specific strengths of the human observer and the computer. The interpretation is done by the human operator who e.g. has to select a building model from a library of basic building types and project it into the image. The exact measurement of the building parameters within the image then can be performed automatically. Examples of semi-automatic systems are given in (Quam & Strat 1991) or (Lang & Schickler 1993). Especially in town centers or medieval towns the shape of buildings can be very complex. Still in many regions, like suburbs or industrial areas, buildings can be described by a small number of simple basic types. Within these regions of relatively small complexity, the use of automatic procedures for building reconstruction like the one presented in this article is very promising. A common technique used by most existing procedures is to utilize linear edge segments as initial primitives. This makes use of the very general knowledge, that buildings consist of a number of straight three-dimensional lines. In the next step rectangular structures which are typical for the presence of buildings in aerial imagery are detected by combining these line segments on relations like 'Photogrammetric Week '95', D. Fritsch & D. Hobbie, Eds., Wichmann Verlag, Heidelberg, 1995

Welcome message from author
This document is posted to help you gain knowledge. Please leave a comment to let me know what you think about it! Share it to your friends and learn new things together.
Transcript
Haala 19
3D Building Reconstruction using Linear Edge Segments
NORBERT HAALA, Stuttgart
ABSTRACT
In this article an algorithm aiming on the automatic reconstruction of buildingsis described. For this purpose three-dimensionalline segments representing roof break-lines are used. Basic idea of the algorithm is to simplify the image interpretation necessaryfor the building reconstruction by the integration of height data.
1. INTRODUCTION
In recent times the acquisition of three-dimensional databases for urban areas has become a topic ofgrowing interest to the photogrammetric community. Simulations that require the representation,management and analysis of three-dimensional descriptions have become standard applications forplanning purposes in built-up areas. One example is the propagation of electro-magnetic waves that canbe simulated for planning optimal locations of transmitter stations. A similar application is thesimulation of the propagation of noise or exhaust fumes near planned roads in build-up areas.Analyzing the impact of new buildings or parks on the micro-climate in urban areas is another topic.A widespread application is the computation of arbitrary perspectives or even animated fly-throughsto visualize urban scenes. Thereby the impression of new buildings within their surrounding can bepresented effectively to persons involved in the planning process. The great market for this kind ofapplications is shown by the fact that architectural offices spend approximately 20% of their budget forthe representation of their concepts. Realistic rendering of urban scenes is achieved by techniques likeshading the object surfaces due to arbitrary light sources, or by texture mapping to represent differentsurface materials. If terrestrial images of the building facades are available they can be projected to thebuilding faces. Terms like virtual reality or cyber space stand for the rapid progress and the growingnumber of applications in this area.Objects relevant for the description of urban areas are buildings, streets and Digital Terrain Models;this article concentrates on the reconstruction of buildings. The acquisition of the database for urbanareas is frequently done by the analysis of aerial imagery since photogrammetric data isthree-dimensional, exact, largely complete and up-to-date. Because manual interpretation is very timeconsuming, a lot of effort has been spend to speed up this process by automatic or semi-automaticprocedures. In the short- and middle-term the human visual system will be superior to existingcomputer vision algorithms in interpreting complex, natural scenes like they occur frequently in aerialimages. The idea beyond semi-automatic approaches is to utilize the specific strengths of the humanobserver and the computer. The interpretation is done by the human operator who e.g. has to select abuilding model from a library of basic building types and project it into the image. The exactmeasurement of the building parameters within the image then can be performed automatically.Examples of semi-automatic systems are given in (Quam & Strat 1991) or (Lang & Schickler 1993).Especially in town centers or medieval towns the shape of buildings can be very complex. Still in manyregions, like suburbs or industrial areas, buildings can be described by a small number of simple basictypes. Within these regions of relatively small complexity, the use of automatic procedures for buildingreconstruction like the one presented in this article is very promising.A common technique used by most existing procedures is to utilize linear edge segments as initialprimitives. This makes use of the very general knowledge, that buildings consist of a number ofstraight three-dimensional lines. In the next step rectangular structures which are typical for thepresence of buildings in aerial imagery are detected by combining these line segments on relations like
'Photogrammetric Week '95', D. Fritsch & D. Hobbie, Eds., Wichmann Verlag, Heidelberg, 1995
20 Haala
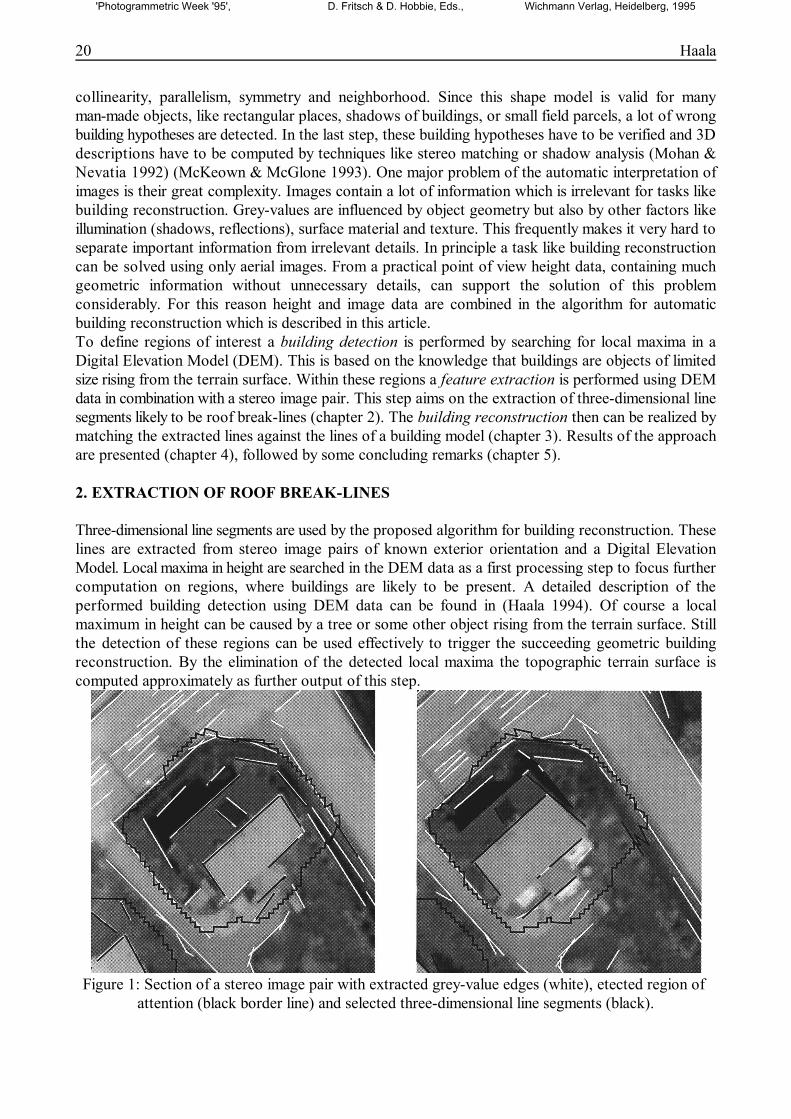
Figure 1: Section of a stereo image pair with extracted grey-value edges (white), etected region of attention (black border line) and selected three-dimensional line segments (black).
collinearity, parallelism, symmetry and neighborhood. Since this shape model is valid for manyman-made objects, like rectangular places, shadows of buildings, or small field parcels, a lot of wrongbuilding hypotheses are detected. In the last step, these building hypotheses have to be verified and 3Ddescriptions have to be computed by techniques like stereo matching or shadow analysis (Mohan &Nevatia 1992) (McKeown & McGlone 1993). One major problem of the automatic interpretation ofimages is their great complexity. Images contain a lot of information which is irrelevant for tasks likebuilding reconstruction. Grey-values are influenced by object geometry but also by other factors likeillumination (shadows, reflections), surface material and texture. This frequently makes it very hard toseparate important information from irrelevant details. In principle a task like building reconstructioncan be solved using only aerial images. From a practical point of view height data, containing muchgeometric information without unnecessary details, can support the solution of this problemconsiderably. For this reason height and image data are combined in the algorithm for automaticbuilding reconstruction which is described in this article.To define regions of interest a building detection is performed by searching for local maxima in aDigital Elevation Model (DEM). This is based on the knowledge that buildings are objects of limitedsize rising from the terrain surface. Within these regions a feature extraction is performed using DEMdata in combination with a stereo image pair. This step aims on the extraction of three-dimensional linesegments likely to be roof break-lines (chapter 2). The building reconstruction then can be realized bymatching the extracted lines against the lines of a building model (chapter 3). Results of the approachare presented (chapter 4), followed by some concluding remarks (chapter 5).
2. EXTRACTION OF ROOF BREAK-LINES
Three-dimensional line segments are used by the proposed algorithm for building reconstruction. Theselines are extracted from stereo image pairs of known exterior orientation and a Digital ElevationModel. Local maxima in height are searched in the DEM data as a first processing step to focus furthercomputation on regions, where buildings are likely to be present. A detailed description of theperformed building detection using DEM data can be found in (Haala 1994). Of course a localmaximum in height can be caused by a tree or some other object rising from the terrain surface. Stillthe detection of these regions can be used effectively to trigger the succeeding geometric buildingreconstruction. By the elimination of the detected local maxima the topographic terrain surface iscomputed approximately as further output of this step.
'Photogrammetric Week '95', D. Fritsch & D. Hobbie, Eds., Wichmann Verlag, Heidelberg, 1995

Haala 21
Figure 3: DEM and corresponding image section with extracted DEM break-lines.
Figure 2: DEM section corresponding tofigure 1.
One method to acquire three-dimensional linear segments used for building reconstruction is to extractlines from a stereo image pair. Figure 1 presents results of detected regions of interest and the featureextraction, illustrated by a small part of the stereo image pair. Grey-value edges approximated tostraight line segments are extracted by an algorithm proposed by Burns, Hansen & Riseman (1986).These lines are superimposed as white lines to the grey-level images. The DEM section shown in figure2 was used to detect the region of attention which is represented by a black polygon. The black straightline segments are a subset of the white lines. These lines could be determined three-dimensionally bystereo line matching. For this purpose the DEM is used to provide approximate values for theparallaxes of corresponding line pairs. The matching restricts to lines which are located in the regionof attention where a building is expected. For the reconstruction only the black 3-D line segments areused.Image matching techniques like those employed in the program MATCH-T (Ackermann & Krzystek1991) which was used to provide all height data in this article, show good results in open terrain, butsuffer from problems in built-up areas due to occlusions and height discontinuities. Besides factors likeimage scale and viewpoint, the DEM quality in urban areas mainly depends on the presence of textureat roof regions and the amount of contrast between roof and terrain surface, if image matchingtechniques are used. This results in considerable differences of DEM quality at roof regions, even inthe same image pair. In recent times attempts have been made to improve the results of image matchingin urban areas, e.g. using multiple overlapping images or by the integration of potential roof break-linesduring the matching process (Maitre & Luo 1992). Due to the independence on the presence of texture,direct DEM measurement by laser scanners is another technique showing very promising results inurban areas (Kilian 1994).In figure 2 the DEM corresponding to the imagesection of figure 1 is presented. For this example thebuilding results in a lumpwithin the computedsurface. This information is sufficient to detect thebuilding.If the height data is dense and accurateenough, even surface break-lines can beobtaineddirectly from the DEM. Figure 3 showscorresponding sections of a DEM and an image ofanother data set. For this example the large imagescale, the good contrast between roof and terrainsurface, and the presence of sufficient texture at roof regions resulted in a very accurate computationof the surface geometry. Therefore the DEM could be used to extract three-dimensional line segmentsby curvature analysis at convex surface break-lines. These lines extracted from the DEM wereprojected to the image shown in figure 3.
'Photogrammetric Week '95', D. Fritsch & D. Hobbie, Eds., Wichmann Verlag, Heidelberg, 1995

22 Haala
Figure 4: Parametric model of a rectangularbuilding with saddle roof.
Figure 5: Rectangular buildings with different roof shapes.
3. RECONSTRUCTION
Recognition and reconstruction presumes knowledge about the perceived objects. This knowledge isrepresented by object models. Since we are interested in reconstructing the building geometry, therequired model has to represent the shape of the buildings. Reconstruction implies matching primitiveswhich were extracted from the observed data against primitives of the object model. For this reasoncorrespondences between the extracted three-dimensional line segments and the lines of the buildingmodel have to be found. These correspondences then can be used to reconstruct the shape of theobserved buildings.
3.1 Parametric building model
Many applications where three-dimensional descriptionsof buildings are used do not demand too much detail. Tocompute realistic simulations or visualizations not eachchimney, bay or ledge has to be represented. For thisreason the shape of many buildings can be describedsufficiently by a few basic models. A common waytodescribe objects of fairly simple shape is to useparametric models. By this kind ofmodel, objects of thesame type are represented by a fixed set of parameters.The individual objects only differ in the parametervalues. The shape of the used typeof building which isshown in figure 4, can be described by the length andwidth of the building, the slope of the roof, and theheight between the roof eaves and the terrain surface.The position of the building within the geographiccoordinatesystem is defined by the X , Y , Z coordinates0 0 0of a selected point, the orientation of the building isdefined by the orientation ν of the ridge line. To
determine these parameter values for observed buildings, the lines of this building model have to bematched against extracted three-dimensional line segments.At the moment only rectangular buildings with saddle roof are reconstructed by the proposedalgorithm. Even though other models, like those shown in figure 5 will have to be added, this singlemodel is sufficient to reconstruct a considerable portion of buildings.
3.2 Matching
Due to perspective, projection and occlusion, vertical walls of buildings in general are not visible in anaerial image. Despite from occlusion by other objects like trees or larger buildings this is not a problemfor the roof of a building. Therefore, the linear 3-D segments, extracted in the preceding steps, are used
'Photogrammetric Week '95', D. Fritsch & D. Hobbie, Eds., Wichmann Verlag, Heidelberg, 1995

Haala 23
Figure 6: Different types of roof-lines. Figure 7: Part of the ortho image, extractedline segments (black) and detected groupings
(white).
to reconstruct the roof of the building. The height of the building can be determined in a second stepby computing the differences between the eaves and terrain heights.
Aiming on object reconstruction, correspondences between the observed primitives and the objectprimitives have to be found, i.e. the extracted line segments have to be matched against correspondinglines of the roof model. The used model consists of 5 different types of roof lines. These lines arelabeled by the numbers 1 to 5 in figure 6. A roof can be reconstructed by extracted line segments, ifcorrespondences are defined for both gable lines (labels 2 and 4) and for two of the roof lines parallelto the ridge (labels 1, 3 and 5). In that case the group of matched lines is arranged rectangular.Therefore groups of lines, that can be used to reconstruct a roof, are detected by searching forrectangular combinations of the extracted three-dimensional line segments. These structures can bedetected by a process which combines four lines respectively, applying relations like proximity,parallelism and right angles.Figure 7 shows the detected rectangles and the used linear segments projected into the ortho image.The slope and relative height of the four grouped linear segments are essential features for establishingcorrespondences between model lines and observed lines. One pair of opposite lines of the fourgrouped lines is parallel to the ground plane. If both lines are of the same height, they define the eavesof the roof (labels 1 and 3), if one of these two lines is higher than the other then this line defines theridge of the roof (label 5). The second pair fits to the front sides of the building and defines gable linesof the roof (labels 2 and 4). The example presented in figure 7 shows several grouping results in whichlines representing break-lines of the roof are involved as well as texture and shadow lines. Mismatchedlines are another reason for the multiple overlapping rectangles constructed by the grouping. Becausea lot of wrong correspondences are defined which have to be rejected, the detected groupings have tobe evaluated in a further step.
3.3 Estimation of roof parameters
The matching results in possible correspondences between extracted lines and model lines. To evaluatethese matching hypotheses, i.e. to decide whether the four combined lines really fit to the used roofmodel, a least squares adjustment is performed. Within this step the parameters (X , Y , Z , ν , length,0 0 0width and slope) are estimated by minimizing the distances between the observed linear segments and
'Photogrammetric Week '95', D. Fritsch & D. Hobbie, Eds., Wichmann Verlag, Heidelberg, 1995

XBuilding + width/2 =
cosν @ ( XTerrain-X0 ) - sinν @ ( YTerrain-Y0 ) + width/2 = ri (1)
ZTerrain-Z0 = rj (2)PXTerrain
24 Haala
the corresponding model lines, i.e. the shape and position of the roof is determined. The error of theresidual sum of squares of the least squares adjustment measures the overall discrepancy between theobserved lines and the fitted roof model. This measure is used to accept or reject a reconstruction, i.e.the matching can be verified.Residuals are defined by the endpoints of the matched three-dimensional line segments. An exampleof a line segment, corresponding to an eaves line of the roof (label 1) is given by the followingequations.
The perpendicular distance of the point to the corresponding model line is split into a partparallel to the ground plane, defining the residual r and a part in the direction of the Z-axis whichidefines the residual r . The other matched lines are treated in a similar way, so the four grouped linesjresult in 16 observations which are used to estimate the 7 parameters of a roof. If a combination oflines results in a small error and is accepted for this reason, further lines are included in the estimationprocess. Therefor extracted line segments are matched against proximate lines of the reconstructedbuilding. Finally the reconstruction with the smallest error σ is selected for each detected region of0interest.
4. RESULTS
To demonstrate the capabilities of the proposed approach it was applied to the ISPRS WG 3 test datasets (Fritsch, Sester & Schenk 1994). Figure 8 shows the left stereo image of a suburban test area,including all reconstructed buildings and the lines used for the parameter estimation. Figure 9 showsa perspective view of that area, computed by projecting image data to the terrain surface. This terrainsurface was generated by eliminating the detected local height maxima from the original DEM data;it was also used to compute the height of the building which is defined by the difference between theeaves of the reconstructed roof and the terrain. A building can be reconstructed by the proposedalgorithm, if correspondences were found for at least four different lines of the roof model. Thereconstruction fails, if one side of a building is completely missing, e.g. due to occlusion by an objectlike a tree or due to very low contrast in one of the stereo images. This is the reason why 20% of thehouses could not be reconstructed in the suburban data set presented in figure 8. The accuracy ofstraight lines extracted from digital images usually is in the order of 0.3 pixel, corresponding to 10 cmon the terrain surface for the used data sets. In principle, this is the limiting factor for the accuracywhich can be achieved by the building reconstruction. This number could be confirmed by thedifferences between the reconstructed roof corners and points measured manually in the stereo imagepair. Of course this is only true, if the shape of the reconstructed building really can be described by theused model. Other reasons for discrepancies between a real building and its extracted description areadditional object parts like out-buildings or bays which are not contained in the model and thereforecan not be reconstructed.
'Photogrammetric Week '95', D. Fritsch & D. Hobbie, Eds., Wichmann Verlag, Heidelberg, 1995

Haala 25
Figure 9: Perspective view of reconstructed 3-D urban model.
Figure 8: Left image with reconstructed buildings and used linear segments.
In chapter 2 the extraction of potential roof break-lines from stereo images or, alternatively, from DEMdata was described. Figure 2 in this chapter shows a typical section of the height data available for thesuburban test area which is presented in figure 8. Due to the small size of the buildings and the absenceof sufficient texture at roof regions, the quality of the height data for this area is quite poor. Thereforeit could only be used to detect regions of interest by searching for local maxima; the reconstruction ofthe buildings was performed using line segments which were determined by stereo matching ofextracted grey-value edges. The second test data set which is presented in figure 10, shows a group of
'Photogrammetric Week '95', D. Fritsch & D. Hobbie, Eds., Wichmann Verlag, Heidelberg, 1995

26 Haala
Figure 10: Reconstruction using extracted DEM break-lines.
larger buildings. In chapter 2 an example of the height data available for this region is given in the leftimage of figure 3. For this data set the good quality of the height data allowed a direct extraction ofsurface break-lines. Even though extracted image lines would also be sufficient for reconstruction,surface break-lines were used to demonstrate their potential. Figure 10 shows the reconstructedbuildings and the used DEM break-lines. For this data set one building could not be reconstructed sincethe extraction of roof break-lines failed due to the poor DEM quality within this region.
Grey-value edges are not only caused by surface break-lines or object borders, but also by shadows,reflections or texture. Additionally, a lot of arbitrary lines occur due to mismatching, especially if theheight data used to provide approximate parallaxes is of poor quality. For these reasons frequentlythree-dimensional line segments are generated which are no roof break-lines. Since all these lines haveto be grouped, matched against model lines, and finally rejected, the building reconstruction using thistype of lines can be quite time consuming. Lines extracted from the DEM actually are surfacebreak-lines and therefore are more likely to be roof break-lines. On the other hand these lines have lessgeometric accuracy due to the lower point density of the original data compared to images. Surfacebreak-lines are maxima in the second derivative of the original DEM data, grey-value edges aremaxima of the first derivative of the original image data. Since derivation enlarges the effects of noise,this is another reason for line segments extracted from a DEM beeing less accurate. To utilize thebenefits of both data sources the building reconstruction can initially be performed by the DEMbreak-lines which are more likely to be roof break-lines. In a second step the reconstruction can berefined by the lines extracted from the stereo image pair which are more accurate. A result of thisprocedure is presented in figures 11 and 12. The initial reconstruction and the used DEM lines areshown in figure 11, the refined reconstruction with the used stereo image lines presented in 12. Othermethods of data fusion, e.g. combining DEM lines and image lines during the feature extraction arealso possible and will have to be a topic of future interest.
'Photogrammetric Week '95', D. Fritsch & D. Hobbie, Eds., Wichmann Verlag, Heidelberg, 1995

Haala 27
Figure 11: Initial reconstruction using DEMbreak-lines.
Figure 12: Refined reconstruction using stereoimage lines.
5. CONCLUSIONS
The integration of image and height data for building reconstruction proved to be very successful, sincethe object recognition can be simplified considerably compared to pure image interpretation. Heightdata was mainly used to detect regions of attention, where buildings are expected, but it is also possibleto extract the three-dimensional line segments required for reconstruction from the DEM. Up to whatextent height data can be used strongly depends on the DEM quality. Techniques like directmeasurement of terrain heights by laser scanners are very promising to improve the quality of availableheight data, so the importance of this kind of data is likely to increase. Integration of other data sourceslike digital ground plans available for a considerable number of buildings can also be done. Eventhough this kind of information is very useful for three-dimensional building reconstruction, a majorproblem that has to be solved is to transform the ground plan into a description which is more suitablefor the reconstruction step.At the moment only one basic type of building is reconstructed by the proposed algorithm. Though inmany regions a lot of buildings can be described by the used model, it will be necessary to includesome more basic types of buildings. Of course parametric models have their limits, if more complexbuildings have to be reconstructed. Therefore the acquisition of more general models which are alsoable to cope with small modifications of shape, will have to be a topic of future research.
6.REFERENCES
Ackermann, F. & Krzystek, P. (1991), .MATCH-T: Automatic Mensuration of Digital ElevationModels*, Presented paper to the 3rd Technical Seminar of the Sociedad Espanola de CartografiaFotogrametria y Teledeteccion.
Burns, J., Hansen, A. & Riseman, E. (1986), *Extracting straight lines*, IEEE Transactions on PatternAnalysis and Machine Intelligence.
Fritsch, D., Sester, M. & Schenk, T. (1994), Test on image understanding, in *Proc. ISPRS CongressComm. III*, München, pp.243-248.
Haala, N. (1994), *Detection of buildings by fusion of range and image data*, Zeitschrift fürPhotogrammetrie und Fernerkundung pp.161-167.
'Photogrammetric Week '95', D. Fritsch & D. Hobbie, Eds., Wichmann Verlag, Heidelberg, 1995

28 Haala
Kilian, J. (1994), Calibration Methods for Airborne Laser Systems, in *Proc. ISPRS CongressComm. I*, Como.
Lang, F. & Schickler, W. (1993), *Semiautomatische 3D-Gebäudeerfassung aus digitalen Bildern*,Zeitschrift für Photogrammetrie und Fernerkundung pp.193-200.
Maitre, H. & Luo, W. (1992), *Using models to improve stereo reconstruction*, IEEE Transactions onPattern Analysis and Machine Intelligence 14(2),269-277.
McKeown, D. & McGlone, J. (1993), Integration of Photogrammetric Cues into Cartographic FeatureExtraction, in *SPIE Conference on Integrating Photogrammetric Techniques with Scene Analysisand Machine Vision*, Orlando, Florida, pp.2-15.
Mohan, R. & Nevatia, R. (1992), *Perceptual Organization for Scene Segmentation and Description*,IEEE Transactions on Pattern Analysis and Machine Intelligence.
Quam, L. & Strat, T. (1991), SRI Image understanding Research in Cartographic Feature Extraction,in H.Ebner, D.Fritsch & C.Heipke, eds, *Digital Photogrammetric Systems*, Herbert WichmannVerlag, GmbH, Karlsruhe, pp.111-122.
'Photogrammetric Week '95', D. Fritsch & D. Hobbie, Eds., Wichmann Verlag, Heidelberg, 1995
Related Documents