39-1 Behavior of Reinforced Concrete Core Wall- Perimeter Steel Frame Hybrid Structure under Dynamic and Static Analysis Wei LI 1 ・ Akihiko KAWANO 2 ・ Kenji SAKINO 3 ・ Hiroyuki NAKAHARA 4 1 Member, Doctor Candidate, Department of Architecture, Graduate School of Human-Environment Studies, Kyushu University (〒○10-6-1 Hakozaki, Higashi-ku, Fukuoka, 812-8581, Japan) E-mail: [email protected] 2 Member, Professor, Department of Architecture and Urban Design, Faculty of Human-Environment Studies, Kyushu University (〒○10-6-1 Hakozaki, Higashi-ku, Fukuoka, 812-8581, Japan) E-mail: [email protected] 3 Member, Professor, Department of Architecture and Urban Design, Faculty of Human-Environment Studies, Kyushu University (〒○10-6-1 Hakozaki, Higashi-ku, Fukuoka, 812-8581, Japan) E-mail: [email protected] 4 Member, Associate Professor, Department of Architecture and Urban Design, Faculty of Human-Environment Studies, Kyushu University (〒○10-6-1 Hakozaki, Higashi-ku, Fukuoka, 812-8581, Japan) E-mail: [email protected] We have studied the behavior of Hybrid Structure with reinforced concrete core wall-perimeter steel frame under dynamic and static loads with incremental dynamic analysis (IDA) and static pushover analysis. Three different storey models, 12-storey, 20-storey and 30-storey with fishbone-shaped frame and diagonally-braced frame have been analyzed. Twenty seismic ground motion records (FEMA) are used to obtain an average response optimally in IDA. We have compared the storey shear force between IDA (ten different intensities, PGV from 10kine to 100kine) and static pushover analysis to estimate more thoroughly structural performance with plastic development; additionally, we have discussed the interstorey shear force amplificatory ratio γ between IDA and static pushover analysis, found it’s quite related to the input intensity and location along the building. Finally we have discussed the ratio α to obtain the change rule about the ratio γ of frame and wall towards the ratio γ of total storey. Key Words: RC Core Wall, Steel Frame, Hybrid Structure, Incremental Dynamics Analysis, Pushover 1. Introduction According to the general knowledge, a hybrid structure means that the structures are combined by at least two component parts of different materials. The combination is supposed to obtain the excellent performance after mixing two or more kinds of structure systems reasonably which simplex structure system doesn’t have. The hybrid structure is mostly applied to high-rise and extremely high-rise buildings. It varies in forms and names for the combination of materials, cross sections and structure forms. There are three kinds of hybrid structures in common use 1) . The first is Concrete-Filled Steel Tubes Column Systems (CFTs). CFTs offer a number of advantages when used in seismic-resistant frames. The concrete infill confined by the steel tubes provides increased axial stiffness and load capacity. The concrete fill also restrains local buckling of the tube, and increases member ductility, while permitting more slender steel elements. The second is Reinforced Concrete/Steel Reinforced Concrete Column Systems (RCs/SRCs). The RCs systems are moment frames consisting of RC columns and steel beams. They provide excellent stiffness with RC columns and energy dissipation capacity through steel beams. As opposed to conventional steel or RC moment frames, the problems associated with connections are greatly reduced, and the RCs frames are generally more economical than the purely steel or RC moment frames. The third is Reinforced Concrete/Steel Reinforced Concrete Hybrid Wall Systems. Hybrid wall systems consist of RC or SRC walls to provide resistance against lateral forces and steel-beam and column-frame systems to support the gravity loads. Most of the lateral strength and stiffness to the system is provided by the walls. The floor system, in addition to supporting the gravity loads, also serves to transfer the lateral forces to the walls. The focus of this paper is on the third one. This efficient hybrid structure system is obtained when reinforced concrete core walls are used in conjunction with steel perimeter frames. For low-to-moderate-rise buildings, up to 25 to 30 stories, the core can be used to provide a majority of the lateral force resistance for earthquake and wind. For taller buildings, the use of dual systems is more common, where the perimeter frames are engaged with the core. The hybrid structure system has large lateral stiffness in each direction, the perimeter frames mainly (39) 第8回複合・合成構造の活用に関するシンポジウム

Welcome message from author
This document is posted to help you gain knowledge. Please leave a comment to let me know what you think about it! Share it to your friends and learn new things together.
Transcript
39-1
Behavior of Reinforced Concrete Core Wall-Perimeter Steel Frame Hybrid Structure under
Dynamic and Static Analysis
Wei LI 1・Akihiko KAWANO 2・Kenji SAKINO 3・Hiroyuki NAKAHARA 4
1Member, Doctor Candidate, Department of Architecture, Graduate School of Human-Environment Studies, Kyushu University (〒○10-6-1 Hakozaki, Higashi-ku, Fukuoka, 812-8581, Japan)
E-mail: [email protected], Professor, Department of Architecture and Urban Design, Faculty of Human-Environment Studies, Kyushu University (〒○10-6-1 Hakozaki, Higashi-ku, Fukuoka, 812-8581, Japan)
E-mail: [email protected], Professor, Department of Architecture and Urban Design, Faculty of Human-Environment Studies, Kyushu University (〒○10-6-1 Hakozaki, Higashi-ku, Fukuoka, 812-8581, Japan)
E-mail: [email protected], Associate Professor, Department of Architecture and Urban Design, Faculty of Human-Environment Studies, Kyushu University (〒○10-6-1 Hakozaki, Higashi-ku, Fukuoka, 812-8581, Japan)
E-mail: [email protected]
We have studied the behavior of Hybrid Structure with reinforced concrete core wall-perimeter steel frame under dynamic and static loads with incremental dynamic analysis (IDA) and static pushover analysis. Three different storey models, 12-storey, 20-storey and 30-storey with fishbone-shaped frame and diagonally-braced frame have been analyzed. Twenty seismic ground motion records (FEMA) are used to obtain an average response optimally in IDA. We have compared the storey shear force between IDA (ten different intensities, PGV from 10kine to 100kine) and static pushover analysis to estimate more thoroughly structural performance with plastic development; additionally, we have discussed the interstorey shear force amplificatory ratio γ between IDA and static pushover analysis, found it’s quite related to the input intensity and location along the building. Finally we have discussed the ratio α to obtain the change rule about the ratio γ of frame and wall towards the ratio γ of total storey.
Key Words: RC Core Wall, Steel Frame, Hybrid Structure, Incremental Dynamics Analysis, Pushover
1. Introduction According to the general knowledge, a hybrid structure means that the structures are combined by at least two component parts of different materials. The combination is supposed to obtain the excellent performance after mixing two or more kinds of structure systems reasonably which simplex structure system doesn’t have. The hybrid structure is mostly applied to high-rise and extremely high-rise buildings. It varies in forms and names for the combination of materials, cross sections and structure forms. There are three kinds of hybrid structures in common use 1). The first is Concrete-Filled Steel Tubes Column Systems (CFTs). CFTs offer a number of advantages when used in seismic-resistant frames. The concrete infill confined by the steel tubes provides increased axial stiffness and load capacity. The concrete fill also restrains local buckling of the tube, and increases member ductility, while permitting more slender steel elements. The second is Reinforced Concrete/Steel Reinforced Concrete Column Systems (RCs/SRCs). The RCs systems are moment frames consisting of RC columns and steel beams. They provide excellent stiffness with RC columns
and energy dissipation capacity through steel beams. As opposed to conventional steel or RC moment frames, the problems associated with connections are greatly reduced, and the RCs frames are generally more economical than the purely steel or RC moment frames. The third is Reinforced Concrete/Steel Reinforced Concrete Hybrid Wall Systems. Hybrid wall systems consist of RC or SRC walls to provide resistance against lateral forces and steel-beam and column-frame systems to support the gravity loads. Most of the lateral strength and stiffness to the system is provided by the walls. The floor system, in addition to supporting the gravity loads, also serves to transfer the lateral forces to the walls. The focus of this paper is on the third one. This efficient hybrid structure system is obtained when reinforced concrete core walls are used in conjunction with steel perimeter frames. For low-to-moderate-rise buildings, up to 25 to 30 stories, the core can be used to provide a majority of the lateral force resistance for earthquake and wind. For taller buildings, the use of dual systems is more common, where the perimeter frames are engaged with the core. The hybrid structure system has large lateral stiffness in each direction, the perimeter frames mainly
(39)第8回複合・合成構造の活用に関するシンポジウム
39-2
support vertical loads and some part of horizontal loads which are distributed based on the lateral stiffness of dual systems. The lateral stiffness of reinforced concrete core wall accounts for more proportion of the total stiffness, thus the core walls resist more horizontal loads. Specially according to yield strength of sub-structure, the yield strength of reinforced concrete core walls is much smaller than that of perimeter frames, so the core walls have relatively redundant stiffness but insufficient strength which reduce its anti-earthquake performance. The plastic hinges of the hybrid structure appear in the core walls under severe earthquake, and this kind of plastic hinge mechanism is very harmful to the structure system. With excessive deformation and damage in the core walls, the whole structure or its sub-structure would lose stabilization and collapse. The successful performance of such hybrid structural systems depends on the adequacy of the primary individual components which are the core walls, steel frames, and frame-core connections 2). In this paper, the authors mainly think about finding the rule of the storey shear force distribution in different proportion of core walls and perimeter frames, and interstorey shear force amplificatory ratio γ of different intensity between static and dynamic analysis.
2. Incremental Dynamic Analysis Incremental Dynamic Analysis (IDA) 3, 4) is a parametric analysis method that has recently emerged in several different forms to estimate more thoroughly structural performance under seismic loads. It involves subjecting a structural model to one (or more) ground motion record(s), each scaled to multiple levels of intensity, thus producing one (or more) curve(s) of response parameterized versus intensity level. The growth in computer processing power has made possible a continuous drive towards increasingly accurate but at the same time more complex analysis methods. Thus the state of the art has progressively moved from elastic static analysis to dynamic elastic, nonlinear static and finally nonlinear dynamic analysis. In the last case the convention has been to run one to several different records, each once, producing one to several analyses, mostly used for checking the designed structure. On the other hand methods like the nonlinear static pushover (SPO) (ATC, 1996) or the capacity spectrum method (ATC, 1996) offer, by suitable scaling of the static force pattern, a “continuous” picture as the complete range of structural behavior is investigated, from elasticity to yielding and finally collapse, thus greatly facilitating our understanding. By analogy with passing from a single static analysis to the incremental static pushover, one arrives at the extension of a single time-history analysis into an incremental one, where the seismic “loading” is scaled. It has also been adopted by the U.S. Federal Emergency Management Agency (FEMA) guidelines (FEMA, 2000a, b) as the Incremental Dynamic Analysis (IDA) and established as the state-of-the-art method to determine global collapse capacity.
As a first step, let us define the fundamental concept of scaling an acceleration time history that we need. Assume we are given a single acceleration time-history, selected from a ground motion database which will be referred to as the base, “as-recorded” (although it may have been pre-processed by seismologists, e.g., baseline corrected, filtered and rotated), unscaled accelerogram α1 , a vector with elements α1(ti), ti = t1, t2,…,tn. To account for more severe or milder ground motions, a simple transformation is introduced by uniformly scaling up or down the amplitudes by a scalar λ ∈ [0, +∞): αλ = λ•α1. Such an operation can also be conveniently thought of as scaling the elastic acceleration spectrum by λ or equivalently. Usually we use Peak Ground Velocity (PGV) to control the input seismic intensity, by using this scaling method we get twenty seismic earthquake records, PGV from 10kine to 100kine.
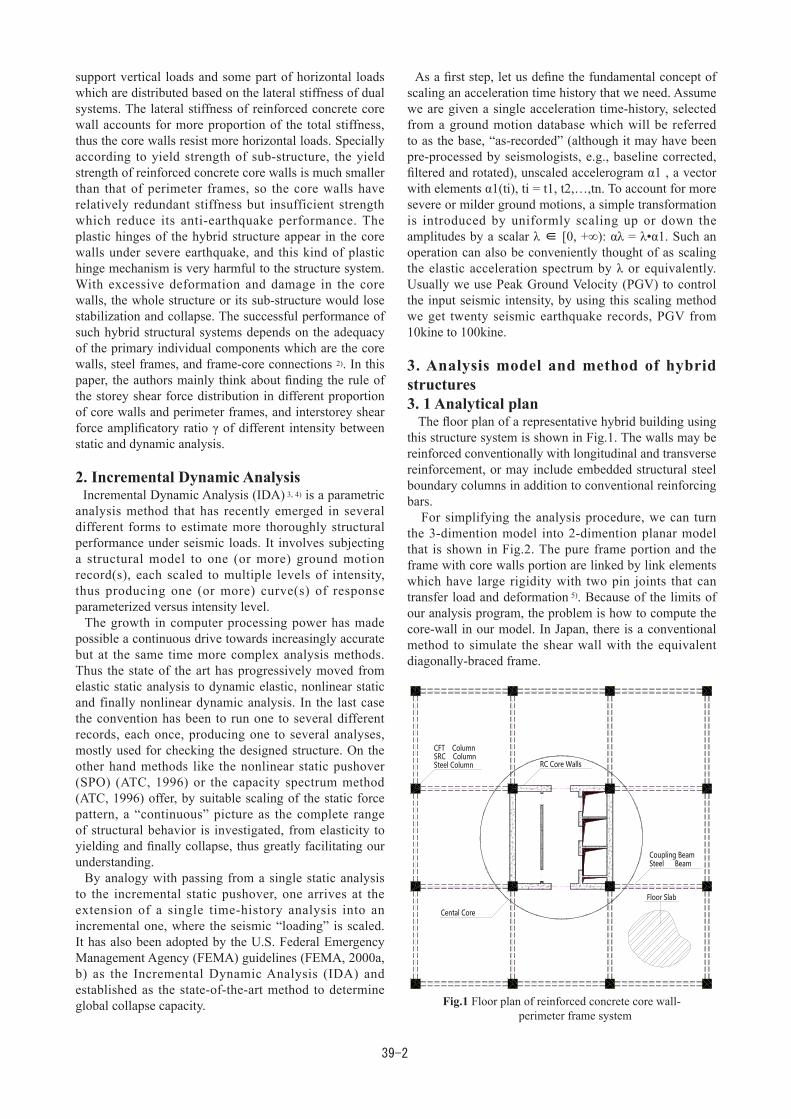
3. Analysis model and method of hybrid structures3. 1 Analytical plan The floor plan of a representative hybrid building using this structure system is shown in Fig.1. The walls may be reinforced conventionally with longitudinal and transverse reinforcement, or may include embedded structural steel boundary columns in addition to conventional reinforcing bars. For simplifying the analysis procedure, we can turn the 3-dimention model into 2-dimention planar model that is shown in Fig.2. The pure frame portion and the frame with core walls portion are linked by link elements which have large rigidity with two pin joints that can transfer load and deformation 5). Because of the limits of our analysis program, the problem is how to compute the core-wall in our model. In Japan, there is a conventional method to simulate the shear wall with the equivalent diagonally-braced frame.
Fig.1 Floor plan of reinforced concrete core wall- perimeter frame system

39-3
3. 2 Equivalent Method for Shear Wall The equivalent method is mentioned in Masafumi Inoue and Masahide Tomii's paper named Method of estimation of rotational rigidity of the corner connections of framed shear walls for their equivalent diagonally-braced frames 6). The cross sectional area, Ab, of the braces in the equivalent frame is determined by equalizing the shear rigidity of the shear wall to that of the equivalent frame. The drift, δws , due to shearing deformation of the shear wall is given by Eq. (1)(see Fig. 3 (a)).
' '2(1 )w wws
w w
k h k hX XGA EA
+ νδ = = (1)
where E: Young's modulusν: Poisson's ratiokw
': shape factor for shearing deformation of shear wallG: shear rigidity [=E/2(1+ν)]h: story heightAw: horizontal sectional area of wallX: horizontal force The drift, δbs , of the equivalent frame is given by Eq. (2)(see Fig. 3 (b))
2 2 1.5
2
1 ( )2bs
b
h l XEA l
•+
δ = (2)
where l: distance from center to center of edge columns The cross sectional area, Ab, of each brace in the equivalent frame is given by Eq. (3) when δws and δbs respectively given by Eqs. (1) and (2) are made equal.
2 2 1.5
'
( )2b
w
G h lA tE k lh
+= (3)
where t: thickness of wall The cross sectional area, Abc, of columns in the equivalent frame is determined by equalizing the flexural rigidity, EIw, of the horizontal sectional area of the shear wall to the flexural rigidity, EIb, of the equivalent frame. The EIw is given by Eq. (4).
'322 ( )
2 12w wc wcl tlEI E I A
= + + (4)
where Iwc: moment of inertia of the cross sectional area of the edge columns of a shear wallAwc: cross sectional area of each edge column of a shear walll': clear span of the boundary frame of a shear wall The EIb is given by Eq. (5).
22 ( )2b bclEI EA= (5)
The Abc given by Eq. (6) is obtained by equalizing EIw and EIb respectively given by Eqs. (4) and (5).
'3
2 2
46bc wc wctlA I A
l l= + + (6)
The equivalent frames of shear walls are determined by using the values of Ab and Abc respectively given by Eqs. (3) and (6).
3. 3 Material hysteresis property Two types of Steel materials are used in our analysis model, SN490 is used for H shape Steel beam and reinforced bar in concrete and BCR295 for □ shape steel perimeter columns. The following figs (4, 5, 6, 7) have shown their hysteresis property and stress-strain relation.
3. 4 Analytical Model Three kinds of models were analyzed, 12-storey, 20-storey, and 30-storey which include low-rise, moderate-rise and high-rise buildings in practical use. The analytical model is shown in Fig.8 and 9 with fishbone-shaped frame model which can easily display the behavior of frame and represent prevalent structure characteristic in different forms, and reduce the analysis time 7); the numbers on the top are the mass for each storey. The average mass is 1.0ton/m2, the story height is 3.6m except 4.0m at the first story, the region coefficient equals to 1.0, the standard base shear coefficient equals to 0.2 at first level and 1.0 at second level. The static pushover load distribution equals to Ai distribution according to the Japanese code (Fig.8 a) 8). The seismic waves of the ground motion records for the incremental dynamic time-history analysis are
Fig.2 Planar model of hybrid structural system
Fig. 3 Model to determine the sectional area of the braces in equivalent frame
l
h
X
l
h
XAb
bc bc

39-4
LA1-LA20 (FEMA). Newmark β method is used in the dynamic analysis, the damping factor of the first and the second mode shape equals to 0.03, the factor β equals to 0.25. The PGV of the seismic waves from LA01 to LA20 is equal to 10, 20, 30, 40, 50, 60, 70, 80, 90, 100kine. The fishbone-shaped frame part has 4 different stiffness, the first one is basic, the others are 2, 3, and 6 times stiffness to the basic one. on account of the limited space of the paper, only basic one and 6 times models results are showed here to express the influence of stiffness between frame and wall parts. 4. Analytical results and discussion4.1 Comparison Rule When we compare the difference of the responses of the structure between dynamic analysis and static pushover analysis, the key question is how to compare, we should make a rule to compare the result. So we define a rule as follows,
Find the center of the Ai distribution Load (Get the 1. storey number as shown in Fig. 8),Find the maximum deformation of this storey under 2. the Dynamic Time-History analysis,Find the step of the static pushover analysis that the 3. deformation of this storey probably equals to the deformation we find in step 2.
From the rule, we get the state that is able to be discussed as shown in Fig.10. The thin dash line means the result for each seismic wave under Time-History Analysis, the wide line means the average of the result, and the wide dash line means the result for static
pushover analysis, we can see that the profile deformation in different analysis perfectly match. So in this state, we can discuss the storey-drift angle, shear distribution, etc between dynamic and static analysis.
4.2 Results and Discussion Our analytical models are three kinds of different height hybrid structures including perimeter steel frame and reinforced concrete core wall, each of them has its own property and deformation pattern. For example, pure frame has a shear deformation pattern and reinforced concrete core wall has a bending deformation pattern, especially the core wall has a large stiffness but a very smaller deformation than pure frame, when shear wall begin to crack, the frame is still elastic, when frame begin to yield, the shear wall almost reach its ultimate status. The behavior of this kind of hybrid structure is very complex, only static pushover analysis can't describe its behavior clearly, so dynamic analysis is needed. We modify the PGV equal to 10kine, 20kine, 30kine, 40kine, 50kine, 60kine, 70kine, 80kine, 90kine, and 100kine for each earthquake waves to change the intensity of the input ground motion, just like a dynamic pushover analysis. So we can think about the behavior of the hybrid structure in different deformation status. Fig. 11 is interstorey shear force for only one storey under pushover static analysis and incremental dynamic analysis(IDA). For each storey, it clearly shows the difference and the relationship between two kinds of analysis with enhancing intensity. It gives the essential descriptions of the capacity ability of the buildings
Fig.4 Stress-strain relation for steel Fig.5 Akiyama and Kato model
Fig.6 Ohi's rule for skeleton part moving Fig.7 Stress-strain relation for concrete

39-5
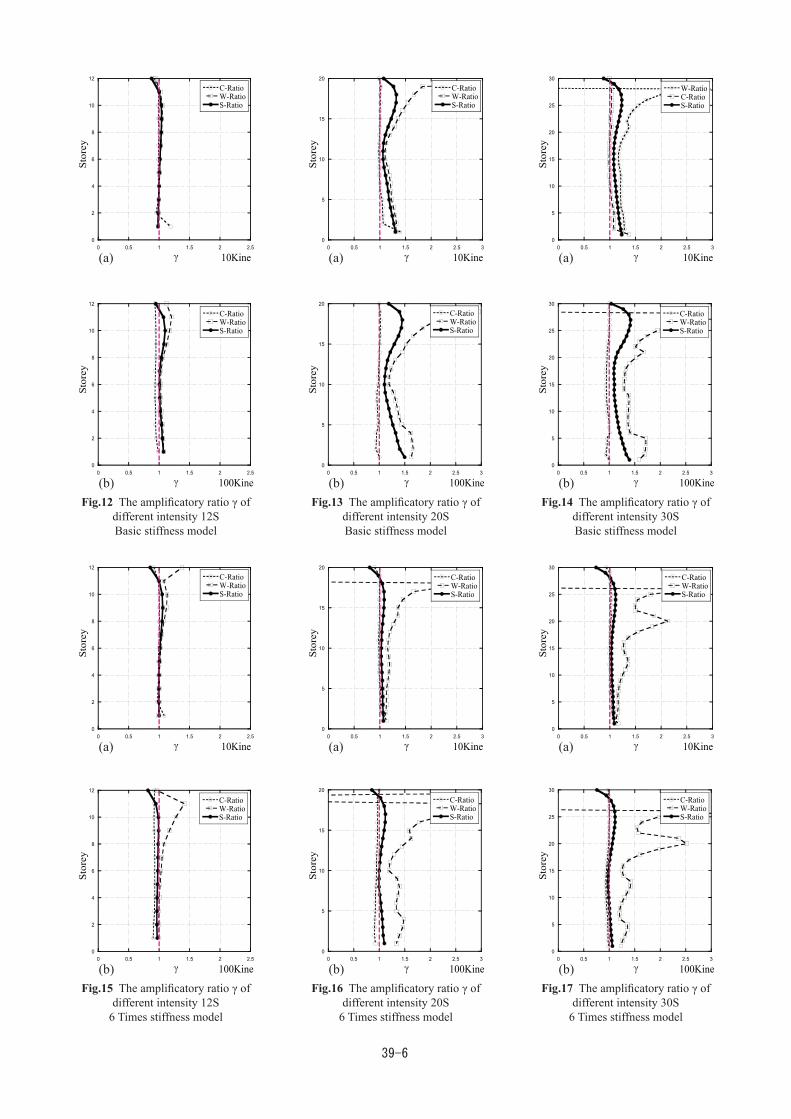
from elastic to plastic status, while the seismic intensity changing from 10kine to 100kine, the difference becomes larger because of the plastic development in the structure, this phenomena has a complex relationship with plastic character of building and character of seismic records. Though the growth in computer processing has made possible to run a large number of dynamic analysis, but it still need much time to get the result especially the building more higher and more complex now. It tells us one can easily understand the behavior of the hybrid structure under seismic dynamic loads from the results of the static pushover analysis. To investigate the whole building`s behavior, an amplificatory ratio γ was defined which equals to dynamic shear force divide static shear force(γ=QD/QS) . Figs. 12, 13 and 14 show the ratio γ for each storey of three different height model under enhancing intensity with basic stiffness fishbone-shaped frame, Figs. 15, 16 and 17 for 6 times stiffness fishbone-shaped frame. In the legends, C-Ratio, W-Ratio and S-Ratio mean ratio γF , γW , and γS respectively which will be explained next. One can see the behaviors of frame columns and core shear walls are quite different. Because the deformation pattern between frame and wall is different, frames have shear deformation pattern, walls have flexure deformation pattern, the deformation pattern of the whole building have both of these two deformation character, so the
50005000 10000 8000 10000
behavior of frames and walls is quite different under dynamic and static analysis, the variety of the ratio γ of frames is smoother than that of walls, the ratio γ of walls is more sensitive, especially shear walls are the main part of the building to provide resistance against lateral forces, most of the lateral strength and stiffness is provided by walls, it's so important to understand the behavior of the building under seismic dynamic loads. While the input intensity becomes higher, the ratio γ of the whole storey becomes larger in three different height models because of the plastic development in the model which prominently affect the behavior under seismic dynamic loads. In basic model, γS of 12 storey changes from 1.05 to 1.15, γS of 20 and 30 storey changes from 1.3 to 1.5 with enhancing intensity; In 6 times model, γS of 12 storey changes very small, γS of 20 and 30 storey changes from 1.05 to 1.2 with enhancing intensity; while the stiffness of fishbone-shaped frame enhancing, ratio γS has tendency to change smaller. Usually we care the relationship of the interstorey shear force of the frame and wall with the interstorey shear force of the storey, so we standardize these figs. The definition is given by Eq. (7) and (8):
αF = γF / γS (7) αW = γW / γS (8)
Fig.8 Ai distribition Load and Analytical model with equivalent diagonally-braced frame
(a) (b)Fig.9 Analytical model (a)12-, (b)20-,
and (c)30-Storey
(a) (b) (c)
0 100 200 300 400 500 6000
2
4
6
8
10
12
LA 1~20AverageStatic
Displacement (mm)
+
Stor
ey
Fig.10 Comparison Rule
0
5 106
1 107
1.5 107
2 107
2.5 107
3 107
3.5 107
0 0.0005 0.001 0.0015 0.002 0.0025
PushoverIDA
Shea
r Fo
rce(
N)
SDA(rad) 1Storey
100Kine
80Kine
10Kine
50Kine
20Kine
30Kine
40Kine
60Kine
70Kine
90Kine
Fig.11 Pushover and IDA difference for one storey
Mass
39-6
γ0 0.5 1 1.5 2 2.5 3
0
5
10
15
20
25
30
W-RatioC-RatioS-Ratio
Stor
ey
10Kineγ0 0.5 1 1.5 2 2.5 3
0
5
10
15
20
C-RatioW-RatioS-Ratio
Stor
ey
10Kineγ0 0.5 1 1.5 2 2.5
0
2
4
6
8
10
12
C-RatioW-RatioS-Ratio
Stor
ey
10Kine (a) (a) (a)
Fig.14 The amplificatory ratio γ of different intensity 30SBasic stiffness model
Fig.12 The amplificatory ratio γ of different intensity 12SBasic stiffness model
Fig.13 The amplificatory ratio γ of different intensity 20SBasic stiffness model
γ0 0.5 1 1.5 2 2.5 3
0
5
10
15
20
25
30
C-RatioW-RatioS-Ratio
Stor
ey
100Kineγ0 0.5 1 1.5 2 2.5 3
0
5
10
15
20
C-RatioW-RatioS-Ratio
Stor
ey
100Kineγ0 0.5 1 1.5 2 2.5
0
2
4
6
8
10
12
C-RatioW-RatioS-Ratio
Stor
ey
100Kine (b) (b) (b)
γ0 0.5 1 1.5 2 2.5 3
0
5
10
15
20
25
30
C-RatioW-RatioS-Ratio
Stor
ey
10Kineγ0 0.5 1 1.5 2 2.5 3
0
5
10
15
20
C-RatioW-RatioS-Ratio
Stor
ey
10Kineγ0 0.5 1 1.5 2 2.5
0
2
4
6
8
10
12
C-RatioW-RatioS-Ratio
Stor
ey
10Kine (a) (a) (a)
Fig.17 The amplificatory ratio γ of different intensity 30S
6 Times stiffness model
Fig.15 The amplificatory ratio γ of different intensity 12S
6 Times stiffness model
Fig.16 The amplificatory ratio γ of different intensity 20S
6 Times stiffness model
γ0 0.5 1 1.5 2 2.5 3
0
5
10
15
20
25
30
C-RatioW-RatioS-Ratio
Stor
ey
100Kineγ0 0.5 1 1.5 2 2.5 3
0
5
10
15
20
C-RatioW-RatioS-Ratio
Stor
ey
100Kineγ0 0.5 1 1.5 2 2.5
0
2
4
6
8
10
12
C-RatioW-RatioS-Ratio
Stor
ey
100Kine (b) (b) (b)

39-7
αF, αW
0 0.5 1 1.5 2 2.5 30
5
10
15
20
25
30
C/SW/SS/S
Stor
ey
10KineαF, αW
0 0.5 1 1.5 2 2.5 30
5
10
15
20
C/SW/SS/S
Stor
ey
10KineαF, αW
0 0.5 1 1.5 2 2.50
2
4
6
8
10
12
C/SW/SS/S
Stor
ey
10Kine (a) (a) (a)
αF, αW
0 0.5 1 1.5 2 2.5 30
5
10
15
20
25
30
C/SW/SS/S
Stor
ey
100KineαF, αW
0 0.5 1 1.5 2 2.5 30
5
10
15
20
C/SW/SS/S
Stor
ey
100KineαF, αW
0 0.5 1 1.5 2 2.50
2
4
6
8
10
12
C/SW/SS/S
Stor
ey
100Kine (b) (b) (b)Fig.20 The ratio α of different
intensity 20SBasic stiffness model
Fig.18 The ratio α of different intensity 12S
Basic stiffness model
Fig.19 The ratio α of different intensity 20S
Basic stiffness model
αF, αW
0 0.5 1 1.5 2 2.5 30
5
10
15
20
25
30
C/SW/SS/S
Stor
ey
10KineαF, αW
0 0.5 1 1.5 2 2.5 30
5
10
15
20
C/SW/SS/S
Stor
ey
10KineαF, αW
0 0.5 1 1.5 2 2.50
2
4
6
8
10
12
C/SW/SS/S
Stor
ey
10Kine (a) (a) (a)
αF, αW
0 0.5 1 1.5 2 2.5 30
5
10
15
20
25
30
C/SW/SS/S
Stor
ey
100KineαF, αW
0 0.5 1 1.5 2 2.5 30
5
10
15
20
C/SW/SS/S
Stor
ey
100KineαF, αW
0 0.5 1 1.5 2 2.50
2
4
6
8
10
12
C/SW/SS/S
Stor
ey
100Kine (b) (b) (b)Fig.23 The ratio α of different
intensity 20S6 Times stiffness model
Fig.21 The ratio α of different intensity 12S
6 Times stiffness model
Fig.22 The ratio α of different intensity 20S
6 Times stiffness model

39-8
whereγF : the amplificatory ratio of frameγW : the amplificatory ratio of wallγS : the amplificatory ratio of storey By using Eq. (7) and (8), we get the figs. 18, 19 and 20 for basic stiffness models; figs. 21, 22 and 23 for 6 times stiffness modes. In the legends, the symbols C/S means ratio γF, W/S means ratio γW, The change rule of three different height models is very similar, the ratio αF of the frame changes smaller, the ratio αW of the wall changes larger, but it's not prominent. Below the two thirds of the height of the model, the ratio αF and αW almost don't changes, Upon the two thirds of the model especially the top three storeies, the ratio αW of wall is very large, there are two reasons to explain this phenomena, the first is whipping effect of the model under seismic dynamic load, and the second is that the deformation pattern between frame and wall is different, frames have shear deformation pattern, walls have flexure deformation pattern, especially at the top storeys of the building. while the model is higher, the effect is more obvious. While the stiffness of fishbone-shaped frame enhancing, the frame stiffness take more propotion of whole storey, so αF becomes closer to αS, on the contrary αW becomes more far to αS. Through the ratio γ, αF and αW, one can clearly understand and describe the behavior of the frame and wall separately under dynamic and static analysis.
5. Conclusive remarks
From the analytical results above paragraphs, we can get some valuable points of view to supervise the real practical design method as follows,
Incremental Dynamic Analysis (IDA) is a useful 1. parametric analysis method to estimate more thoroughly structural performance under seismic loads; and it can be adopted to determine global collapse capacity of the building.The rule to compare static and dynamic analysis 2. defined is viable, it can be adopted in any different height buildings.The result of nonlinear plastic time-history dynamic 3. analysis is based upon the character of the seismic record we select; it's sensitive for each seismic record. Basically it's impossible to compare the result between dynamic and static pushover analysis through only one or several seismic records. One should select large numbers of records to reduce the affection of certain specific record in the statistical sense.Through the pushover and IDA curve for each storey, 4. one can easily understand the behavior of the hybrid structure under seismic dynamic loads from the results of the static pushover analysis quickly.The interstorey shear force tends to become larger 5. under seismic dynamic loads than static pushover analysis, also it is related to input intensity of seismic records. The amplificatory ratio γ of frame, wall and storey is different in each storey, the change rule is
similar in three different height models. Through the ratio γ, αF and αW one can compare the interstorey shear force of frame, wall and storey under dynamic and static analysis separately.when one calculates amplificatory ratio of dynamic 6. analysis for design, one should take into account the wall ratio, in other words, the stiffness distribution between wall and frame should be taken into account.
Acknowledgments This research is a part of the international cooperative program of China-Japan research on seismic performance of hybrid structures of steel-concrete in the high seismic intensity region. Many investigators are involved in this program. A large number of numerical analysis will be done on the Japanese side by the nonlinear finite element analysis program of Prof. Kawano, and some large-scale experiments will be done on the Chinese side by Xi’an Architecture Technology University, they will analyses the hybrid structure system by Ansys too.
References1) Goel, S. C. (2004). "United States-Japan Cooperative
Earthquake Engineering Research Program on Composite and Hybrid Structures." J. Journal of Structural Engineering. ASCE, No.2, 157-158.
2) Shahrooz, B. M., and Gong, B., Tunc, G. and Deason. J. T. (2001). "An Overview of Reinforced Concrete Core Wall-Steel Frame Hybrid Structures." J. Prog. Struct. Engng Mater, ASCE, NO.3, 149-158.
3) Vamvatsikos, D., and Cornell, C. A. (2002). "Incremental dynamic analysis." Earthquake Engng Struct. Dyn, 31, 491-514.
4) S a n g , W. H . a n d C h o p r a , A . K . ( 2 0 0 6 ) . "Approximate incremental dynamic analysis using the modal pushover analysis procedure." Earthquake Engng Struct. Dyn, 35. 1853-1873.
5) Hikata, T., Futatsugi, S., and Sakino, K. (2007). "Analytical study on ductility and strength demand for a new-type composite shear wall system.", Journal of structural and construction engineering. Transactions of AIJ, J. Struct. Constr. Eng., AIJ, No.613, PP. 81-87.
6) Inoue, M. and Tomii, M. (1984). "Method of estimation of rotational rigidity of the corner connections of framed shear walls for their equivalent diagonally-braced frames." Trans. of AIJ, No. 336, 53-63.
7) Koji Ogawa, Hisaya Kamura and Kazuo Inoue. (1999). "Modeling of the moment resistant frame to fishbone-shaped frame for the response analysis", Journal of structural and construction engineering. Transactions of AIJ, J. Struct. Constr. Eng., AIJ, No.521, PP. 119-126.
8) Architectural Institute of Japan, (1990). Design Guideline for Earthquake Resistant Reinforced Concrete Buildings Based on Ultimate Strength Concept".
Related Documents