3.6 Ratio Analysis Topic 3– Part 1

3.6 Ratio Analysis Topic 3– Part 1. The Purpose of Ratio Analysis The profitability of a company is not the whole story of its financial health. Does.
Dec 15, 2015
Welcome message from author
This document is posted to help you gain knowledge. Please leave a comment to let me know what you think about it! Share it to your friends and learn new things together.
Transcript

3.6 Ratio Analysis
Topic 3– Part 1
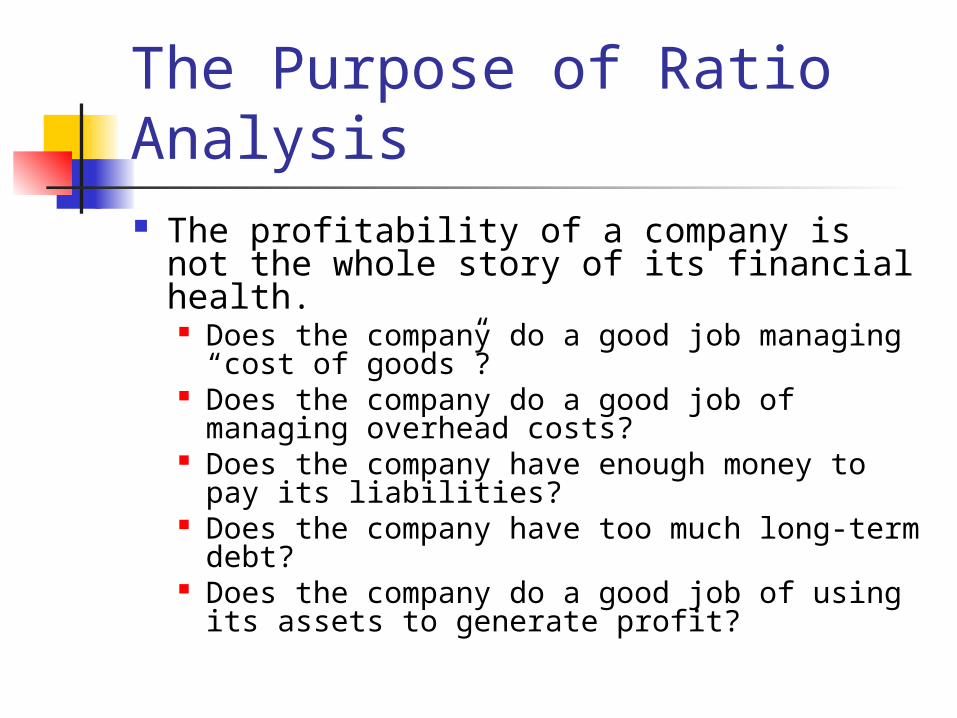
The Purpose of Ratio Analysis The profitability of a company is not the
whole story of its financial health. Does the company do a good job managing
“cost of goods”? Does the company do a good job of
managing overhead costs? Does the company have enough money to
pay its liabilities? Does the company have too much long-term
debt? Does the company do a good job of using its
assets to generate profit?

Ratio Analysis
Ratios fall into 5 different categories Profitability Ratios Liquidity Ratios Financial Efficiency Ratios Shareholder or Investment Ratios Gearing Ratios

Ratio Analysis
Profitability Ratios Liquidity Ratios Financial Efficiency Ratios Shareholder or Investment Ratios Gearing Ratios

Profitability Ratios - Margins
Purpose: Measures the ability to convert sales revenue into profit.
Gross Profit Margin % of gross profit to total sales revenue
Net Profit Margin % of net profit to total sales revenue

Gross Profit Margin
Sales Revenue
Cost of Goods Sold
Current Assets
Current Liabilities
Stocks(Inventory)
Accts Recvble
Net Profit
Gross Profit
ABC, Inc. 250 125
XYZ Corp.
3200 800
Gross Profit / Sales Revenue X 100 = Gross Profit Margin %
ABC Inc: 125/250 X 100=50%
XYZ Corp: 800/3200 X 100 = 25%
Which company is maximizing its profit at the GROSS profit level?
(Sales – Cost of Goods Sold) = Gross Profit
Purpose: How well are we generating profits before overhead expenses?

Net Profit Margin
Sales Revenue
Cost of Goods Sold
Current Assets
Current Liabilities
Stocks(Inventory)
Accts Recvble
Net Profit
Gross Profit
ABC, Inc. 250 50 125
XYZ Corp.
3200 500 800
Net Profit / Sales Revenue X 100 = Net Profit Margin %
ABC Inc: 50/250 X 100=20%
XYZ Corp: 500/3200 X 100 = 16%
Which company is maximizing its profit at the Net profit level?
(Sales – Cost of Goods Sold – Overhead Expenses) = Net Profit
Purpose: How well are we generating profits after overhead expenses?

Profitability Ratios- RoCE Purpose: Measures the ability of using capital
employed effectively to earn a profit
The higher the % the greater return on your investment
It can be compared with past performance to see if the ability to earn a profit is improving
Can be compared with interest earned from other investments
Should be compared with the interest rate of borrowing money. If it is less than the interest rate, borrowing money will further reduce returns to shareholders.

Return on Capital Employed (RoCE) (Primary efficiency ratio)
Sales Revenue
Cost ofGoods Sold
Current Assets
Current Liabilities
Stocks(Inventory)
*CapitalEmployed
Net Profit
Gross Profit
ABC, Inc. 400 50
XYZ Corp.
5000 500
Net Profit / Capital Employed X 100 = Return on Capital Employed
ABC Inc: 50/400 X 100=12.5%
XYZ Corp: 500/5000 X 100 = 10%
Which company is maximizing its capital resources to generate a profit?
(What are capital resources…long term loans, debentures, cash generated by sale of stock, retained earnings “ploughed back” into the company)
Purpose: How effective is the capital invested in the company at earning a profit?
*capital employed = non-current liabilities + shareholders equity

Ratio Analysis
Profitability Ratios Liquidity Ratios Financial Efficiency Ratios Shareholder or Investment Ratios Gearing Ratios

Liquidity Ratios
Purpose: Measures the ability to payoff current debt.
Current Ratio Current assets to current liabilities
Acid Test Ratio Liquid assets to current liabilities

Current Ratio
Sales Revenue
Cost of Goods Sold
Current Assets
Current Liabilities
Stocks(Inventory)
AccountsRecvble
Net Profit
Gross Profit
ABC, Inc. 60 30
XYZ Corp.
240 240
Current Assets / Current Liabilities
ABC Inc: 60/30 = 2
XYZ Corp: 240/240 = 1
Which company has the larger capacity to payoff debts?
(Cash + Accts Receivable + Inventory) – Accts Payable
Purpose: Do we have the ability to payoff our current debts?
A healthy current ratio is 1.5-2.0
For every $1.50 - $2 of assets I can pay off $1 of liabilities.

Current Ratio Purpose: Measures the capacity to
payoff current debt
Most firms are advised to have a ratio of 1.5-2.0 to be in a safe position
Low ratios may not be unusual for high-volume cash businesses like grocery stores, fast food restaurants, or gas stations
Results over 2 might suggest that too much money is tied up in inventory or long credit terms to debtors (Accounts Receivables)

Acid Test Ratio
Sales Revenue
Cost of Goods Sold
Current Assets
Current Liabilities
Stocks(Inventory)
AccountsRecvble
Net Profit
Gross Profit
ABC, Inc. 60 30 30
XYC Corp.
240 240 60
Liquid Assets / Current Liabilities
ABC Inc: 30/30 X 100=1
XYZ Corp: 180/240 X 100 = .75
Which company has the larger capacity to payoff debts?
(Cash + Accts Receivable) – Accts Payable
Purpose: Do we have the CASH to payoff our current debts?
A healthy current ratio is 1 or above
For every $1 – liquid assets I can pay off $1 of liabilities.
Liquid Assets = Current Assets - Stocks

Acid Test Ratio Purpose: Measures the capacity to
payoff current debt with liquid assets
Results below 1 are viewed with caution as there might not be enough cash to short-term debt.
View the ratio results in context with last year….are we improving or declining?
What is the natural inventory level expectations for your type of business? This will affect your ratio so it must be viewed in context with your type of business.
Related Documents