Quantitative Real Time PCR assessment of hormonal receptors and HER2 status on fine-needle aspiration pre-operatory specimens from a prospectively accrued cohort of women with suspect breast malignant lesions Anna Garuti, Ilaria Rocco, Gabriella Cirmena, Maurizio Chiaramondia, Paola Baccini, Massimo Calabrese, Claudia Palermo, Daniele Friedman, Gabriele Zoppoli, Alberto Ballestrero PII: S0090-8258(13)01342-5 DOI: doi: 10.1016/j.ygyno.2013.11.020 Reference: YGYNO 975271 To appear in: Gynecologic Oncology Received date: 21 August 2013 Accepted date: 14 November 2013 Please cite this article as: Garuti Anna, Rocco Ilaria, Cirmena Gabriella, Chiaramondia Maurizio, Baccini Paola, Calabrese Massimo, Palermo Claudia, Friedman Daniele, Zop- poli Gabriele, Ballestrero Alberto, Quantitative Real Time PCR assessment of hormonal receptors and HER2 status on fine-needle aspiration pre-operatory specimens from a prospectively accrued cohort of women with suspect breast malignant lesions, Gyneco- logic Oncology (2013), doi: 10.1016/j.ygyno.2013.11.020 This is a PDF file of an unedited manuscript that has been accepted for publication. As a service to our customers we are providing this early version of the manuscript. The manuscript will undergo copyediting, typesetting, and review of the resulting proof before it is published in its final form. Please note that during the production process errors may be discovered which could affect the content, and all legal disclaimers that apply to the journal pertain.

Welcome message from author
This document is posted to help you gain knowledge. Please leave a comment to let me know what you think about it! Share it to your friends and learn new things together.
Transcript
�������� ����� ��
Quantitative Real Time PCR assessment of hormonal receptors and HER2status on fine-needle aspiration pre-operatory specimens from a prospectivelyaccrued cohort of women with suspect breast malignant lesions
Anna Garuti, Ilaria Rocco, Gabriella Cirmena, Maurizio Chiaramondia,Paola Baccini, Massimo Calabrese, Claudia Palermo, Daniele Friedman,Gabriele Zoppoli, Alberto Ballestrero
PII: S0090-8258(13)01342-5DOI: doi: 10.1016/j.ygyno.2013.11.020Reference: YGYNO 975271
To appear in: Gynecologic Oncology
Received date: 21 August 2013Accepted date: 14 November 2013
Please cite this article as: Garuti Anna, Rocco Ilaria, Cirmena Gabriella, ChiaramondiaMaurizio, Baccini Paola, Calabrese Massimo, Palermo Claudia, Friedman Daniele, Zop-poli Gabriele, Ballestrero Alberto, Quantitative Real Time PCR assessment of hormonalreceptors and HER2 status on fine-needle aspiration pre-operatory specimens from aprospectively accrued cohort of women with suspect breast malignant lesions, Gyneco-logic Oncology (2013), doi: 10.1016/j.ygyno.2013.11.020
This is a PDF file of an unedited manuscript that has been accepted for publication.As a service to our customers we are providing this early version of the manuscript.The manuscript will undergo copyediting, typesetting, and review of the resulting proofbefore it is published in its final form. Please note that during the production processerrors may be discovered which could affect the content, and all legal disclaimers thatapply to the journal pertain.
ACC
EPTE
D M
ANU
SCR
IPT
ACCEPTED MANUSCRIPT
1
Title: Quantitative Real Time PCR assessment of hormonal receptors and HER2 status on
fine-needle aspiration pre-operatory specimens from a prospectively accrued cohort of
women with suspect breast malignant lesions
Authors: Anna Garuti1,*, Ilaria Rocco1,*, Gabriella Cirmena1, Maurizio Chiaramondia2, Paola
Baccini3, Massimo Calabrese4, Claudia Palermo1, Daniele Friedman5, Gabriele Zoppoli1,#, and
Alberto Ballestrero1
Affiliations:
1Department of Internal Medicine, Istituto di Ricerca a Carattere Clinico e Scientifico (IRCCS),
Azienda Ospedaliera Universitaria (AOU) San Martino Istituto Nazionale Tumori (IST), Genoa, Italy
2Division of Pathology, Busto Arsizio Hospital, Busto Arsizio (Varese), Italy
3Department of Surgical Sciences and Integrated Diagnostics, University of Genoa and Anatomic
Pathology Service, IRCCS AOU San Martino IST, Genoa, Italy
4Department of Radiology, IRCCS AOU San Martino IST, Genoa, Italy
5Breast Surgery Unit, Department of Surgery, University of Genoa and IRCCS AOU San Martino
IST, Genoa, Italy
*These authors contributed equally to the present study
Running title: Expression of hormonal receptors and HER2 on FNA in breast cancer
#To whom correspondence and re-prints should be sent:
Dr. Gabriele Zoppoli - Department of Internal Medicine and IRCCS AOU San Martino IST - Viale
Benedetto XV 6, 16132 Genoa Italy - E-mail: [email protected] - Tel. +390103537968
ACC
EPTE
D M
ANU
SCR
IPT
ACCEPTED MANUSCRIPT
2
Abstract:
Objectives: Reliable assessment of estrogen, progesterone (ER and PR), and HER2 receptors
status are essential in breast cancer (BC) treatment. Immunohistochemical methods are limited by
intra- and inter-laboratory variability. Furthermore, current methods are not the ideal approach for
reproducing the biological continuum of ER, PR, and HER2 receptor levels, due to their intrinsic,
semi-quantitative nature, relying in part on subjective interpretation.
Methods: In the present study, we tested a molecular approach to define ER, PR, and HER2 status
in fine-needle-aspirate (FNA) samples from patients with early BC. We performed flow cytometry
analysis on 88 FNA specimens from suspect BC patients to determine cellularity. We used
quantitative real time PCR (QRT-PCR) to assess ER, PR, HER2 status, and qPCR for HER2 gene
copy number (GCN).
Results: ER and PR mRNA levels showed a highly significant correlation with IHC data on surgical
samples. qPCR showed greater accuracy than IHC in defining HER2 status. QRT-PCR defined
better than IHC the continuous spectrum of the expression of the assessed receptors. Moreover,
PCR analysis demonstrated a strict correlation between HER2 status and higher levels of its
transcript, correctly stratifying HER2+ and HER2- patients. Finally, there was a strongly significant
agreement between HER2 GCN assessed on FNA specimens by qPCR and FISH data obtained
on pathological tissue specimens.
Conclusions: The present results support a comprehensive approach to determine ER, PR, and
HER2 status by PCR (QRT-PCR and qPCR) in FNA specimens, with high relevance for
therapeutic strategies like neoadjuvant treatment.
Keywords:
Breast cancer, fine needle aspiration, PCR, hormonal receptors, HER2
ACC
EPTE
D M
ANU
SCR
IPT
ACCEPTED MANUSCRIPT
3
Introduction:
Estrogen (ER), progesterone (PR) and HER2 receptors are key factors in determining breast
cancer sensitivity to endocrine and anti-HER2 treatments. As a consequence, accurate and
reliable assessment of ER, PR and HER2 status is of paramount relevance for clinical
management.
Current tests to assess the status of these receptors have some limitations that give rise to
concern in the clinical decision-making setting. Two key points are relevant.
The first problem involves correct patient classification that can alter the predictive value of the
test. In fact, there is considerable intra- and inter- laboratory variability in the diagnostic methods
for both the hormone receptor by immunohistochemical (IHC) and HER2 by fluorescence-in-situ-
hybridization (FISH) determination [1, 2].
For example, variability is high in low ER expressing tumors [3] and may potentially interfere with
the correct allocation of patients within the clinically relevant grey zone of incomplete endocrine
responsiveness [4]. Equivocal results may also be obtained through FISH HER2 testing in specific
cases, for example when the values are in the intermediate range, or with polisomy of
chromosome 17 [2].
Secondly, current methods are not the ideal way to reproduce the biological continuum of hormone
and HER2 receptor levels due to their intrinsic, semi-quantitative nature, which depends on the
partially subjective interpretation of the IHC and FISH specimens by the pathologist. The
importance of the quantitative assessment of hormone receptors and HER2 is highlighted by
several clinical trials. Indeed, the quantitative levels of these receptors correlate with patient
outcome after chemo-endocrine or anti-HER2 treatment [5, 6].
These results point out the possible clinical relevance of the quantitative levels of hormone and
HER2 receptor expression rather than the use of an absolute cut-off criterion.
On the basis of the good correlation between the amount of hormone receptors and Her-2 protein
and their transcripts [7], nucleic acid-based molecular analysis may be a useful approach to
overcome the above mentioned limits.
Microarray gene expression profile is a reliable method for the quantitative assessment of ER, PR
ACC
EPTE
D M
ANU
SCR
IPT
ACCEPTED MANUSCRIPT
4
and HER2 mRNA levels in several types of tissue samples, including whole sections, core
biopsies, and fine-needle aspiration biopsies [8, 9].
Quantitative polymerase chain reaction (PCR) is easy, fast, independent of specific reagents like
antibodies, and it has presently reached a high level of sensitivity and accuracy. All these factors
contribute in supporting its use as a reliable method for accurate measurement of gene transcripts.
Therefore, it is now considered the most appropriate method for validating microarray results and
would appear to be a suitable technique to replace microarray technology in diagnostic medical
applications [10].
In the present study, we suggest a comprehensive approach to the definition of ER, PR and HER2
status by both a Real Time quantitative Reverse Transcription PCR (QRT-PCR) method to
measure the mRNA levels of the three receptors and a Real Time quantitative PCR (qPCR)
method to detect the HER2 gene copy number. The tissue samples used for the measurements
were collected by fine needle aspiration (FNA), which is an easy sampling method. FNA allows the
quick collection of cancer cells from fresh tumor tissues and the immediate analysis of intra-cellular
nucleic acids, thus avoiding any bias due to tissue preserving techniques.
Materials and methods
Patients and samples: This study involved 88 prospectively enrolled cases of women with
suspect breast lesions (BI-RADS category 4 or 5) referred to the Breast Diagnostic Center at
IRCCS AOU San Martino IST, Genoa, Italy.
A single experienced cytopathologist performed all FNA procedures using a 23-gauge needle and
a 13 MHz transducer under image-guidance using stereotactic ultrasound.
On the basis of the study design, we performed cytological analysis to determine cell composition,
cytometric evaluation of leukocyte contamination, and quantitative PCR determination of ER, PR
and HER2 status of all FNA samples. Sixty patients confirmed to bear a malignant lesion
(cytological category C5) were included in the present study.
The first 10 patients underwent a single FNA, while the subsequent 50 patients underwent two
ACC
EPTE
D M
ANU
SCR
IPT
ACCEPTED MANUSCRIPT
5
FNA procedures, the first for the conventional cytological diagnosis and the other for the planned
study analyses. Samples for molecular analysis from 10 of the 50 patients who underwent double
aspiration were collected into ATL buffer for total DNA extraction (QIAGEN, Valencia, CA). A small
portion of each aspiration sample (1:10 of the total) was used for cytometric cellular analyses and
the remaining cell suspension was collected into a vial containing 0.5 mL of RNAlater solution
(Ambion, Austin, TX, USA), kept at room temperature for no more than 1 hour and stored at -80°C
until total RNA extraction.
Cell composition of the FNA samples was determined by cell counts of the Diff-Quik-stained slides
using light microscopy at high magnification (X400). In a representative area of the slide, the first
300 cells were classified as tumor cells, leukocytes or stromal cells. The results were recorded as
percentages.
Leukocyte contamination was also analyzed by flow cytometry by evaluating two cell surface
antigens, i.e., CD19 and CD45, which are typically expressed in leukocytes.
Ethics committee approval was granted (n°6/2010 director: Dr. Luigi Francesco Meloni).
Determination of hormonal-receptors and HER2 status in tumor specimens: Hormonal
receptor and HER2 status for all study patients was determined by IHC on formalin-fixed, paraffin-
embedded tumor samples that were examined after surgical removal. Hormonal status was
identified by monoclonal antibodies 1D5 (M7047, Dako, Glostrup, Denmark) and 1A6 (M3569
Dako, DK-2600 Glostrup Denmark), respectively for ER and PR. Samples showing nuclear staining
in at least 10% of cancer cells were defined as positive for ER or PR receptors. The Allred score,
which is a composite of the percentage of cells that stained and the intensity of their staining, was
also determined for all patients. The percentage of stained cells is classified from 0 through 5,
while the intensity of cell staining is rated as 1, 2 or 3 [11]. DAKO HercepTest kit (polyclonal
antibody DA485, K5206, Dako DK-2600 Glostrup Denmark), a Food and Drug Administration
(FDA) approved specific reagent, was used to determine the amplification status of HER2. Tumors
with a score of 1+, 2+ or 3+ were confirmed by FISH (PathVision kit, Vysis AutoVysion Downers
Grove, IL, USA). A positive HER2 test was defined according to ASCO guidelines [2].
ACC
EPTE
D M
ANU
SCR
IPT
ACCEPTED MANUSCRIPT
6
RNA isolation, cDNA and QRT-PCR: RNA was extracted from 50 of the 60 FNA samples that
were taken, using the RNAeasy Micro Kit (Qiagen, Valencia, CA) according to the manufacturer’s
instructions.The amount and quality of RNA were assessed using ExperionTM RNA HighSens
Chips (Bio-Rad, Hercules CA). Total RNA was reverse transcribed using random hexamers in a
final volume of 50µl as previously described [12]. The expression levels of the target genes, ER,
PR and HER2, were measured in each sample by QRT-PCR amplification performed with TaqMan
Gene Expression Assays products in an ABI PRISM 7900 HT Fast Real Time PCR System
(Applied Biosystem Monza, Italy). RPLP0 was used as the internal control gene. Primers and
probes were obtained from Applied Biosystems (Applied Biosystems, Monza, Italy). All
measurements were performed in triplicate. The following QRT-PCR run protocol was used:
activation Taq program (50°C for 2 min and 95°C for 10 min), amplification and quantification
program repeated 50 times (95°C for 15 sec, 60°C for 1 min with a single fluorescence
measurement). In the 6 cases with low extraction yield, RNA was linearly amplified with a
PreAmplified Kit (Applied Biosystems, Monza, Italy) as previously described [13]. QRT-PCR
reaction was carried out in a final volume of 20µl starting from 2µl of cDNA.
DNA isolation and qPCR: Genomic DNA was extracted from 10 of the 60 FNA samples that were
taken, using the DNeasy Blood & Tissue Kit (Qiagen, Valencia, CA) according to the manufactures
instructions. The amount and quality of DNA were assessed with NanoDrop ND-1000 (Celbio, MI,
Italy). Then, 5ng of DNA were used for qPCR amplification with TaqMan system (ABI PRISM 7900
HT Fast Real Time PCR System, Applied Biosystems Monza, Italy) for HER2 and APP,
respectively as the target and internal control genes; the reaction was performed in a final volume
of 20 µl. HER2 and APP primers and probes were derived from the literature [14]. All
measurements were performed in triplicate. The following qPCR run protocol was used: activation
Taq program (50°C for 2 min and 95°C for 10 min), amplification and quantification program
repeated 40 times (95°C for 15 sec, 60°C for 1 min with a single fluorescence measurement).
In each experiment, DNA extracted from MCF7 and SKBR-3 breast cancer cell lines was included
ACC
EPTE
D M
ANU
SCR
IPT
ACCEPTED MANUSCRIPT
7
as the control for non-amplified and amplified HER2 genes, respectively.
The DNA samples from thirty-five healthy volunteers were used to calculate the cut-off values for
amplification (range 0.91-1.48) [15]. Values below 1.5 were considered as non-amplified, those
greater than 2.0 were considered as amplified, and those greater than 5.0 were scored as high-
level amplification.
Data Analysis: We used the comparative cycle threshold (Ct) method to determine both the
amount of mRNA encoded by each target gene and the HER2 gene copy number [16]. In
particular, the changes in the target gene expression levels measured in tumor samples as
compared to normal mammary tissue were calculated according to the 2-ΔΔCt method using the
following formula:
ΔΔCt = (Ct,Target gene - Ct,control gene) breast tumor - (Ct,Target gene - Ct,control gene) normal
breast.
RPLP0 was the internal control gene. HER2 gene copy number was also measured from qPCR
data according to the previous formula where HER2 is the target gene and APP is the internal
control gene. Human Mammary Gland RNA (Clontech laboratories Inc) and Human genomic DNA
(Clontech laboratories Inc) were used as calibrators for gene expression assay and gene copy
number determination, respectively. Cut-off values discriminating negative from positive ER, PR
and HER2 mRNA measurements were determined by receiver operating characteristic (ROC)
analysis. Correlations between ER and PR mRNA expression and IHC hormonal-receptor status
and between HER2 mRNA expression and IHC/FISH HER2 status were calculated by Spearman’s
rank correlation coefficient.
Results
Cellular composition of FNA samples: Samples of cells collected by echo-guided FNA from 60
ACC
EPTE
D M
ANU
SCR
IPT
ACCEPTED MANUSCRIPT
8
consecutively screened women with suspect malignant nodules were analyzed. The first ten
samples were obtained from a single FNA that was split into two parts for diagnostic cytology and
study analyses, respectively. However, the number of cells that were obtained from these samples
was too small to allow us to perform all the planned cellular and molecular analyses, i.e., cytology,
flow cytometry and PCR. Therefore, the subsequent 50 patients underwent two FNAs, the second
of which was entirely dedicated to the planned analyses. The percentage of tumor cells in these 50
samples, as evaluated by cytological examination, was equal to or greater than 80% (mean
91.51%, median 97.76 % range 80-99.8 %), which suffices for molecular evaluation [17]. The
mean value of leukocyte contamination of the sample, as determined by flow cytometry, was =
1.98% (range 0.3-14.3).
RNA and DNA total extraction: RNA and DNA extractions were performed on 40 and 10 of the
50 dedicated FNA samples, respectively. The total amount of RNA we extracted from 34 out of 40
samples was equal to or greater than 100ng (mean 1021ng, range 108-4035ng), which was
enough for the direct QRT-PCR measurement of ER, PR and HER2 gene expression. Total RNA
yield in the other 6 samples was below 100ng, mean value 28ng (range 5-91ng), so these samples
underwent a pre-amplification procedure before PCR analysis. DNA extraction performed on the
10 FNA samples dedicated to HER2 gene copy number determination yielded enough high quality
DNA to allow qPCR analysis to be carried out. In fact, the mean value of total DNA extraction per
sample was 510ng (range 218-1719ng).
RNA pre-amplification: RNA pre-amplification was carried out on the 6 cases that had a total
RNA yield below 100ng. It is noteworthy that this procedure can be performed in the range from 1
to 250ng of extracted RNA [18, 19]. The pre-amplification procedure was successful in all cases
and allowed us to obtain an RNA yield that was suitable for QRT-PCR analysis. In particular, we
obtained more than 400ng of amplified RNA for each case, which proved to be sufficient to perform
not only the planned PCR analysis of the three target genes but also multiple gene assays, such
as low density array. Therefore, the RNA pre-amplification technique allowed us to perform
ACC
EPTE
D M
ANU
SCR
IPT
ACCEPTED MANUSCRIPT
9
molecular analysis on all FNA samples.
Evaluation of ER and PR status by molecular analysis: ER and PR mRNA expression levels
were measured in all 40 FNA samples by QRT-PCR. The results represent the quantitative
measurement of gene expression in tumor cells relative to the normal breast tissue used as a
calibrator. In each case, QRT-PCR expression data were compared to the matched IHC data
obtained from surgically removed primary tumors.
When mRNA expression data are listed as a monotonic series there is a ROC analysis-determined
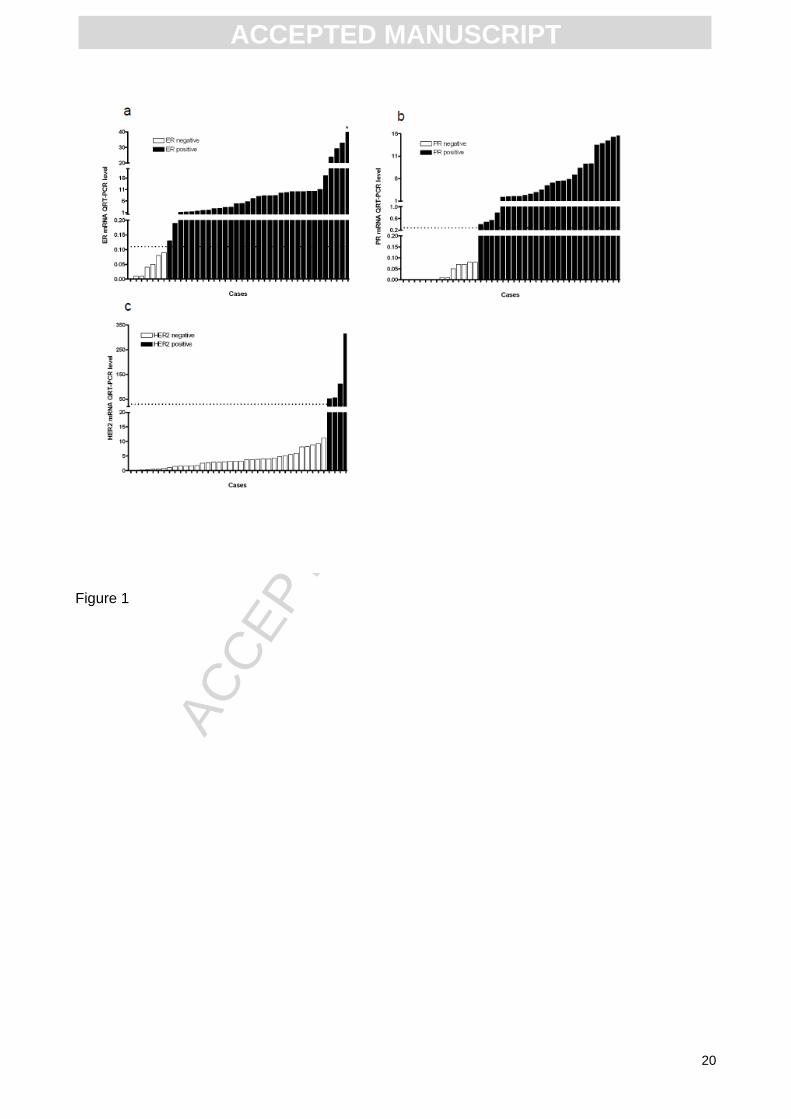
cut-off value that discriminates negative subgroups from positive ones (Fig 1a and 1b). In fact,
there was perfect agreement (kappa test = 1) between IHC and QRT-PCR in classifying patients
into negative and positive groups. Therefore, routine IHC and FNA QRT-PCR carried out on
patients enrolled in this study performed just as well in the dichotomous allocation of patients with
regards to ER and PR.
According to IHC analysis, ER and PR data can be considered both as a continuous variable,
when gathered as a percentage of staining cells, or as a discrete variable, when gathered
according to Allred’s score. When considered as continuous variables, IHC data show a highly
significant correlation with ER and PR mRNA levels. In fact, the Spearman correlation coefficients
were 0.85 (95%CI 0.73-0.92; p<0.0001) and 0.88 (95%CI 0.77-0.93; p<0.0001), for ER and PR,
respectively. However, by considering the distribution of the mRNA values within each
homogeneous percentage class as defined by IHC, it is noteworthy that within each class there
was a wide range of values which reached a maximum of 70- and 8-fold for ER and PR,
respectively. This also implies some overlapping of mRNA values when ranked according to the
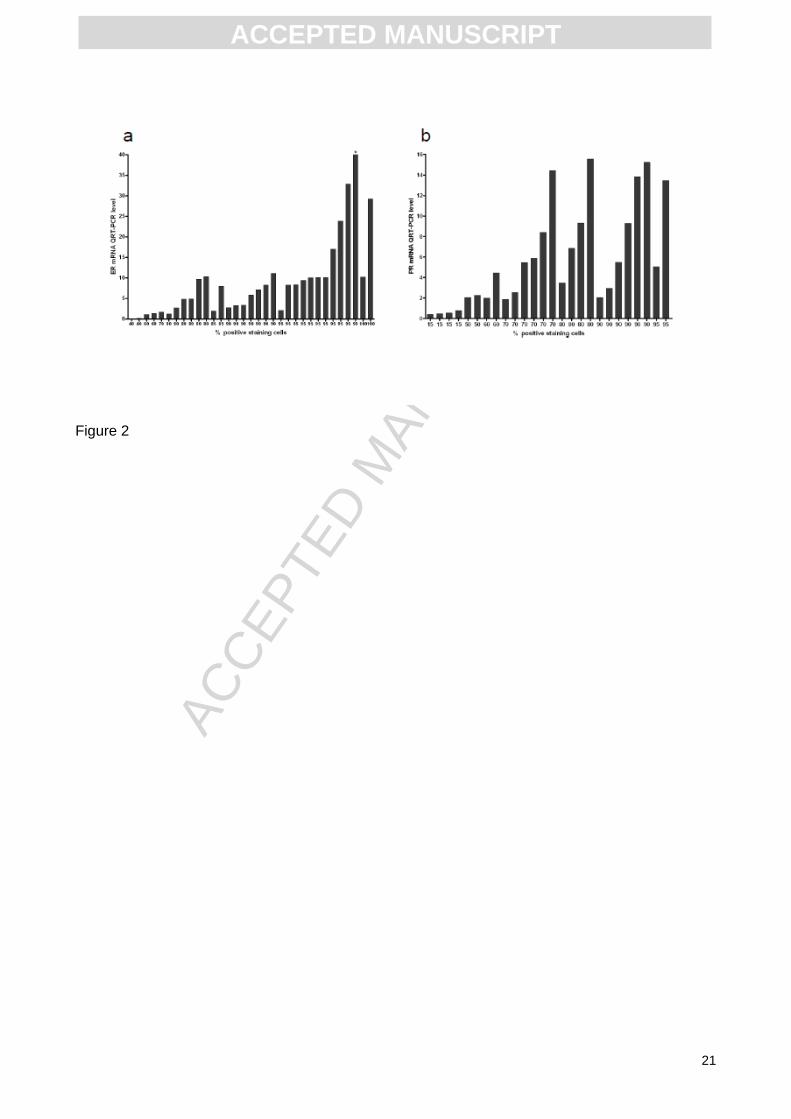
percentage of IHC positive cells (Fig 2a and 2b). For instance, in the group with 50% or higher
positive staining for ER, that conventionally defines patients who are highly responsive to
endocrine therapy, the quantity values were scattered over a 100-fold wide range. These data
suggest that in terms of clinical behavior, apparently IHC homogeneous patients could encompass
various degrees of hormonal dependency.
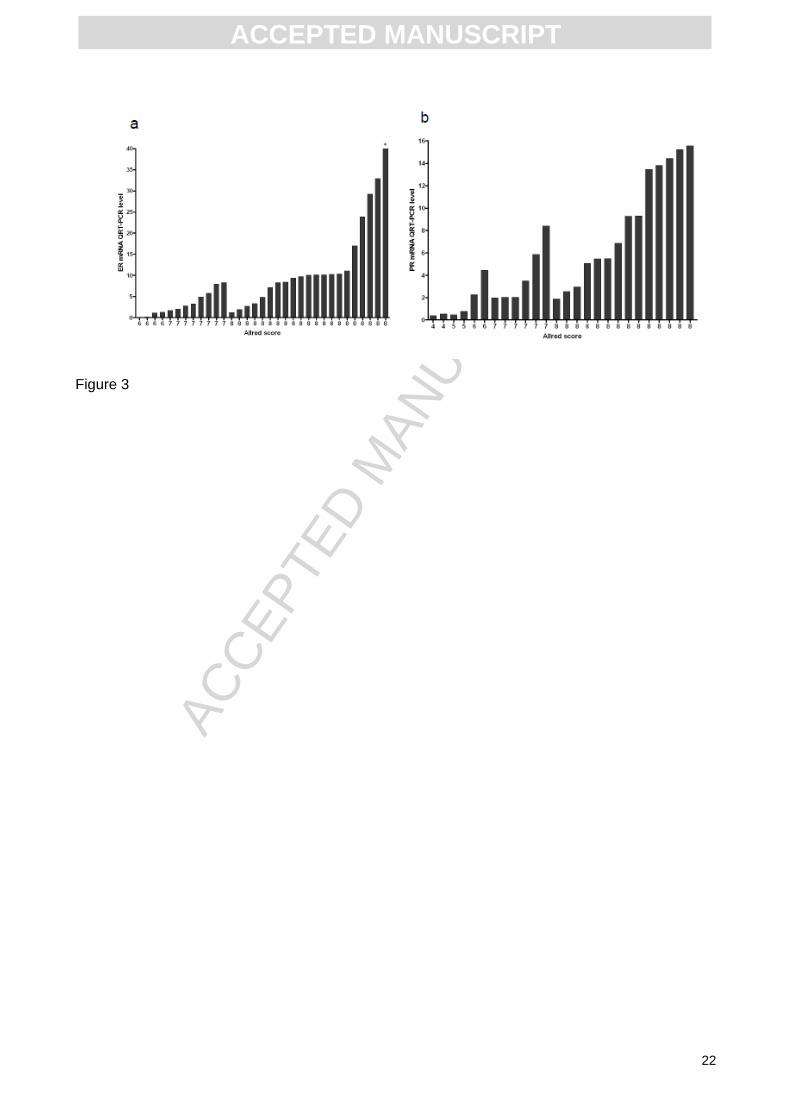
Similar observations can be made if one considers ER and PR IHC data as discrete variables
ACC
EPTE
D M
ANU
SCR
IPT
ACCEPTED MANUSCRIPT
10
according to Allred’s score that integrates the percentage of positive-staining tumor cells with
staining intensity. Despite the high correlation between the mRNA levels and Allred’s score,
correlation coefficients of 0.82 (95%CI 0.68-0.90; p < .0001) and 0.90 (95%CI 0.82-0.95,
p<0.0001) for ER and PR, respectively, there is a wide distribution of the mRNA values within each
homogeneous Allred’s class (Fig 3a and 3b).
Although derived from a small patient group, the present data suggest that quantitative molecular
analysis may be more accurate than semi quantitative IHC to describe the continuous spectrum of
variation of ER and PR into tumor tissue.
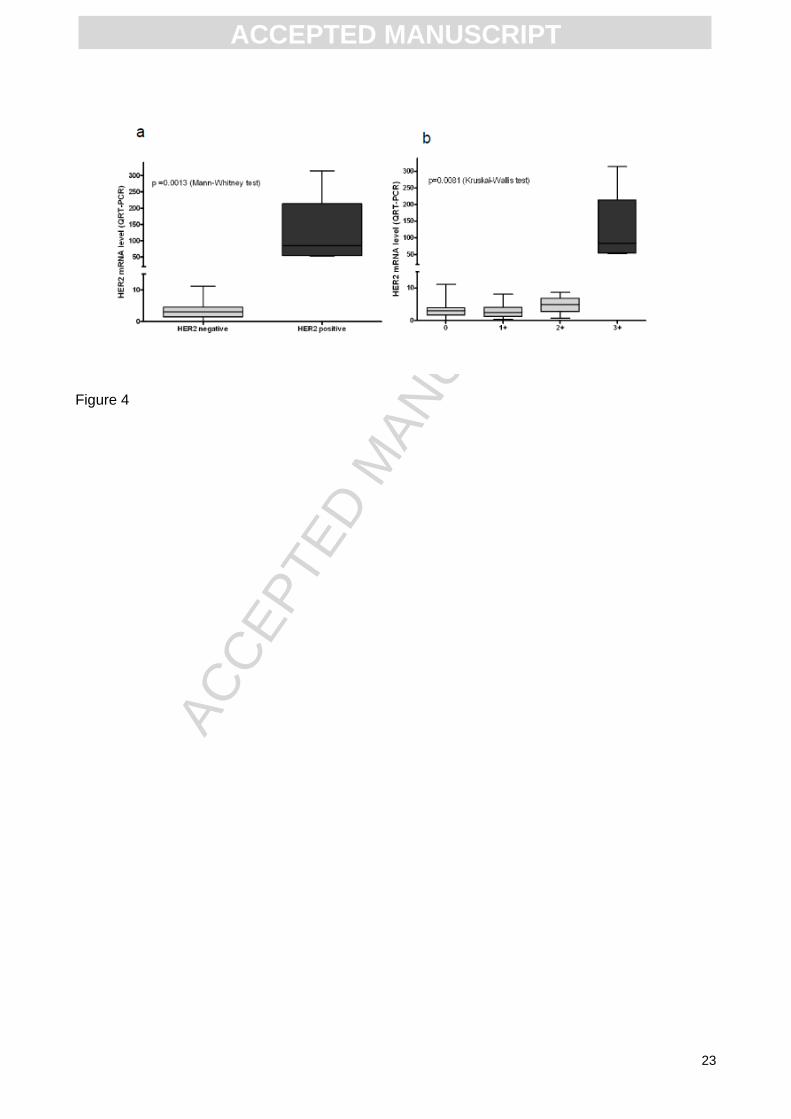
HER2 status definition by molecular analysis: In the present series of 50 patients, 44 were
HER2 negative according to IHC (score 0 in 28, 1+ in 12 and 2+ in 4), while only 6 patients were
HER2 positive (score 3+). FISH analysis was performed on all patients whose IHC scores were 1+
or more and confirmed IHC results. The amplification status of the HER2 gene can be molecularly
assessed by both mRNA level measurement and DNA gene copy number. HER2 mRNA
expression in the 40 patients evaluated by QRT-PCR shows a cut-off value, as determined by
ROC analysis, that discriminates negative subgroups from positive ones (Fig 1c). In fact the
molecular test was able to cluster these patients into two definitely distinct groups, corresponding
to amplified and non-amplified cases (Fig 4a). The difference between these two groups is highly
significant (p = 0.001) and very robust. As a matter of fact, positive patients had a median value of
84.6, which was more than 25 times the median value of negative patients. In the HER2 negative
patient group, no significant differences were observed between the three IHC score groups that
define the negative status (Fig 4b).
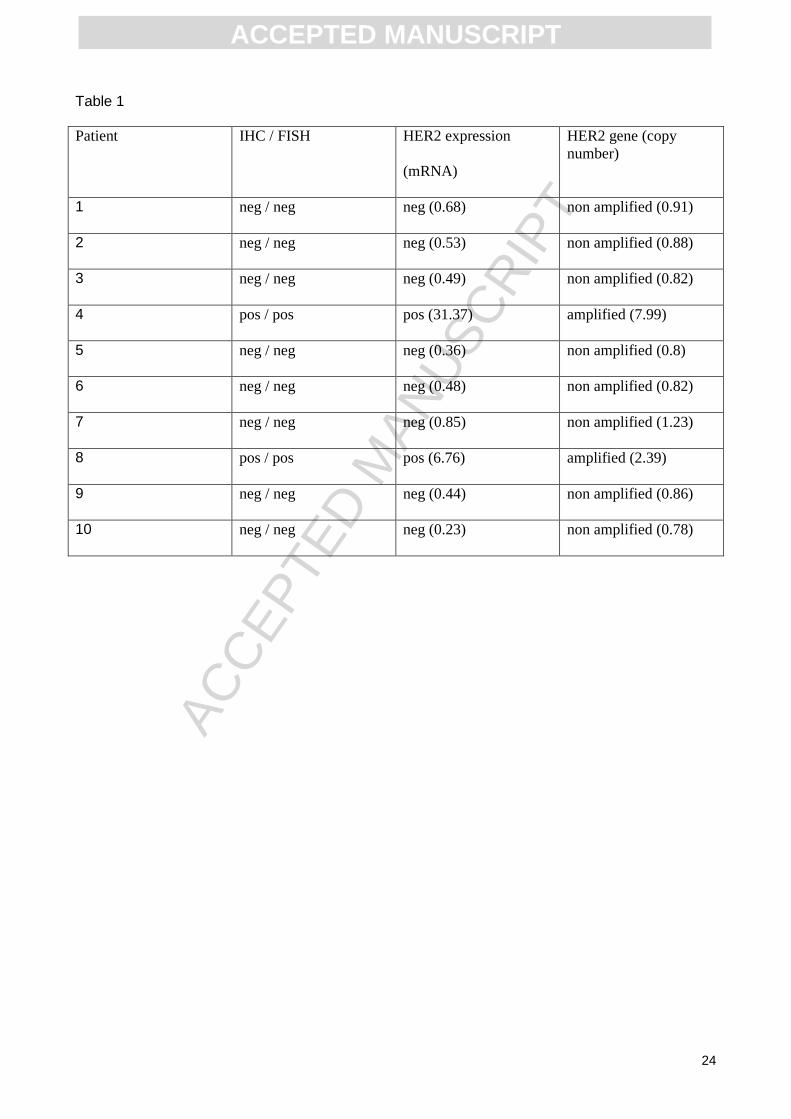
The HER2 gene was found to be amplified in two of the 10 patients evaluated by qPCR, 2.39 and
7.99 gene copies respectively, whereas it was not amplified in the remaining patients. These
results were in agreement with the IHC/FISH and mRNA analysis (Table 1), performed on surgical
samples as a control. Thus, the arranged use of the two molecular tests, copy number and gene
expression analysis, could be a robust way to correctly define the HER2 status in virtually all breast
cancer patients.
ACC
EPTE
D M
ANU
SCR
IPT
ACCEPTED MANUSCRIPT
11
Discussion
FNA is an easy sampling method that allows for the collection of enriched cancer cells and the
direct analysis of nucleic acids, thereby avoiding any bias due to tissue preserving techniques.
Currently existing methods allow for extraction of high-quality total RNA, which is suitable for cDNA
microarray or qPCR analysis from more than 70% of FNA samples [9, 20].
In the present study, we report how FNA, performed by a trained cytopathologist, allowed us to
collect a percentage of tumor cells > 80% in all the analyzed patients, with a total RNA or DNA
yield > 100ng in the majority of cases. Six patients in our series had an RNA yield below 100ng.
However, this number of inadequate samples is likely overestimated because of the initial study
design that foresaw the use of part of the same FNA sample for both cytometric cellular analyses,
and the consequent low quantity of material suitable for RNA extraction without additional, time-
and money-consuming pre-amplification steps. These six patients underwent molecular analysis
after linear RNA amplification, developed in collaboration with Applied Biosystems Inc [13].
In the present study, we tested a molecular approach for defining simultaneously hormonal
receptors and HER2 status in FNA specimens from patients with suspect early breast cancer. This
approach is not new, since other Authors demonstrated the feasibility and valuable results of HER2
and/or hormone receptor status determination on diagnostic samples, either by PCR [21, 22] or
IHC-based methods [23]. However, our results expand such analysis to include ER and PR
determination by QRT-PCR. The results we obtained demonstrate that QRT-PCR performs
optimally in the dichotomous allocation of patients with respect to both ER and PR status in FNA
specimens. Of interest, unlike conventional IHC, QRT-PCR was able to discriminate between
positive and negative samples without discordant results even in spite of the small available
material (Fig 1a and 1b). Using a QRT-PCR approach, Uzan et al. [20] also reported a low
discordance rate of roughly 10% in ER status determination. These results were obtained in two
small patient groups. However, similar results were obtained [8] by using cDNA microarray in a
larger data set, confirming the validity of nucleic acid determination in pre-operatory samples.
ACC
EPTE
D M
ANU
SCR
IPT
ACCEPTED MANUSCRIPT
12
In order to reach high performance levels, QRT-PCR methods applied to FNA samples have to
fulfill several conditions. In particular, a trained cytopathologist must be available to perform FNA,
to carry out the microscopic evaluation of the collected cells, and to follow material collection
protocols correctly. Ideally, such as in our experience, a single cytopathologist should be the
referent for such studies to avoid inter-operator variability. Furthermore, mRNA transcript
assessment by QRT-PCR requires a suitable reference gene and an adequate calibrator tissue
[16]. We chose RPLP0 as a reference gene for data normalization, since we found it to be stably
expressed in both breast carcinomas and in normal breast tissue (our unpublished observations
and [24]). The reliability of hormonal receptors and HER2 status definition by standard immune
staining-based methods and FISH techniques is suboptimal in terms of both intra- and inter-
laboratory reproducibility, as well as for true quantitative assessment of protein expression [25].
These limitations raise some concerns in clinical practice due to the critical role of these
parameters in determining treatment strategies, especially in the neoadjuvant setting. Therefore,
accurate pre-operatory testing of hormonal receptors and HER2 status with a reliable method such
as PCR is of high clinical relevance [4]. The use of technique is an attractive and potentially cost-
effective way to overcome the limits of current, standard analytical methods. Moreover, while FNA
is an easier and more common sampling methodology than core-biopsy procedures, it is scarcely
amenable to FISH analysis.
Several authors have proposed the use of cDNA microarray technology for the molecular
characterization of breast cancer samples derived from FNA [8, 9, 26, 27]. In particular, in a large
series of patients [8], Gong et al. showed that the DNA microarray technique is able to reliably
determine ER and HER2 status and can provide better quantification than currently available,
semi-quantitative methods (like IHC and FISH) thus leading to an increase in the predictive value
of the test with regards to the possible clinical benefits. However, microarray technologies appears
less cost-effective than PCR for the determination of single genes, show strong inter-operator and
inter-platform variability, are not widely available, and require dedicated bioinformatical personnel,
thus not appearing as an easily applicable methodology for routine diagnostics. On the contrary,
PCR is easily standardizable, fast, and does not depend on costly and difficult-to-handle reagents.
ACC
EPTE
D M
ANU
SCR
IPT
ACCEPTED MANUSCRIPT
13
Furthermore, it has presently reached high levels of sensitivity and accuracy, which strongly
support its use in clinical practice.
In our experience, although ER and PR mRNA levels had a highly significant correlation with IHC
data, QRT-PCR was able to detect wider expression ranges for both genes than IHC (either
expressed as a percentage of stained cells or as Allred’s score, see Fig 2a and 2b). These data
suggest that QRT-PCR describes the continuous spectrum of these receptors more accurately
than IHC. Also, the cost of commercially available QRT-PCR primers has been steadily declining
over the last few years, so much so that it is often comparable with, when not smaller than the
price of IHC-grade antibodies. Hence, when the correlation of transcripts and their protein products
is very high, and detecting post-translational protein modifications is not the purpose of an
experiment, we believe the use of QRT-PCR as performed in our study is actually cost-effective
compared to traditional immune-based cyto- or histochemistry.
Specific quantitative assessment of ER and PR expression is of potentially great clinical value for
several reasons. It can improve the accuracy of hormonal status definition by reducing the negative
effect of the intra- and inter-laboratory variability observed in IHC methods [1, 28]. Furthermore, the
QRT-PCR approach might allow us to define a more reliable cut-off to predict endocrine response
in the patients within the “grey zone” of incomplete endocrine responsiveness [4, 29]. Finally, more
precise measurement of hormone receptor quantitative levels may also improve their prognostic
and predictive value, as suggested by recent results from the central evaluation of randomized
clinical trials that established a significant relationship between IHC values and patient outcome [5,
30].
Concerning HER2 status assessment, our data support the usefulness of the molecular test. In our
patient series, QRT-PCR analysis correctly identified the four HER2 positive patients, whose
mRNA levels were on average 25 times higher than HER2 negative patients. Furthermore, the
gene copy number measured on FNA specimens was consistent with the mRNA and FISH data
obtained on pathological tissue samples in the ten additional patients who underwent qPCR
analysis (see Table1). Of course, these results require validation in larger patient cohorts.
However, they represent the proof of principle for a double test approach combining both DNA
ACC
EPTE
D M
ANU
SCR
IPT
ACCEPTED MANUSCRIPT
14
copy number and mRNA transcript quantification. This approach may in part overcome the present
limitations of IHC and FISH tests, in particular by resolving the issue of equivocal results due to
both borderline FISH results and polysomy 17 (Garuti A. et al., manuscript in preparation).
In conclusion, the present results support a comprehensive PCR-based approach to define
hormone receptor and HER2 status in pre-operatory FNA specimens. To our knowledge, the
present work is one of the few prospectively enrolled FNA sets tested by PCR for both hormone
receptors and HER2 status. This approach has strong clinical implications in the neoadjuvant
treatment setting. Furthermore, our results point toward a high agreement with conventional
analyses performed on surgical tissues, and may even be superior in specific settings, by
combining qPCR with QRT-PCR for HER2 status determination. Nonetheless, we are aware that
our results are preliminary and require validation in larger patient cohorts.
Abbreviations:
estrogen (ER),
progesterone (PR),
immunohistochemical (IHC)
fine-needle aspirates (FNA)
Real Time quantitative Reverse Transcription PCR (QRT-PCR)
Real Time quantitative PCR (qPCR)
fluorescence in situ hybridization (FISH)
cycle threshold (Ct)
Acknowledgments:
This study was mainly supported by grants from the Associazione Italiana per la Lotta alle
Leucemie e ai Linfomi (AIL), from Compagnia del San Paolo and Banca CARIGE. GZ is supported
by an AIRC “My First AIRC Grant” no. MFAG10570. We wish to thank Dr. P. Ciotti, Dr. P. Mandich
ACC
EPTE
D M
ANU
SCR
IPT
ACCEPTED MANUSCRIPT
15
(Department of Neuroscience, Ophthalmology and Genetics, Section of Medical Genetics,
University of Genoa, Genoa, Italy), Dr. F. Murelli (Breast Surgery Unit, Department of Surgery,
University of Genoa and IRCCS AOU San Martino IST, Genoa, Italy), Dr. E. Carminati
(Department of Internal Medicine, Istituto di Ricerca a Carattere Clinico e Scientifico (IRCCS),
Azienda Ospedaliera Universitaria (AOU) San Martino Istituto Nazionale Tumori (IST), Genoa,
Italy).
Authors’ Contributions:
AG, IL,, GC, CP and participated in the study design, performed the analyses, and carried out the
experiments on RNA and DNA; PB, DF and FM supplied patients, performed FNA and evaluated
the IHC and FISH analysis; MC performed ultrasound image-guidance; GZ and EC analyzed data;
PM, GZ and AB wrote the manuscript. All authors have read and approved the final manuscript.
Legends:
Table 1: HER2 status in tissue samples as determined by IHC/FISH, gene expression and gene
copy-number in FNA samples. In the copy number analysis, values smaller than 1.5 were
considered as non-amplified, whereas those greater than 2.0 were considered as amplified. HER2
expression was performed on FFPE samples and HER2 gene was considered over-expressed
when the mRNA value was greater than 2.5.
Figure 1: Rank ordered mRNA expression levels of ER (a), PR (b) and HER2 (c). Each sample is
identified as negative (green column) or positive (red column) according to IHC for ER and PR
status and according to IHC and FISH for HER2 status. Horizontal dotted lines indicate the
threshold values as defined by ROC curves that discriminate patient subgroups optimally: ER =
0.11; PR = 0.28; HER2=30.
* This data is out of scale, the real value is 138.1
ACC
EPTE
D M
ANU
SCR
IPT
ACCEPTED MANUSCRIPT
16
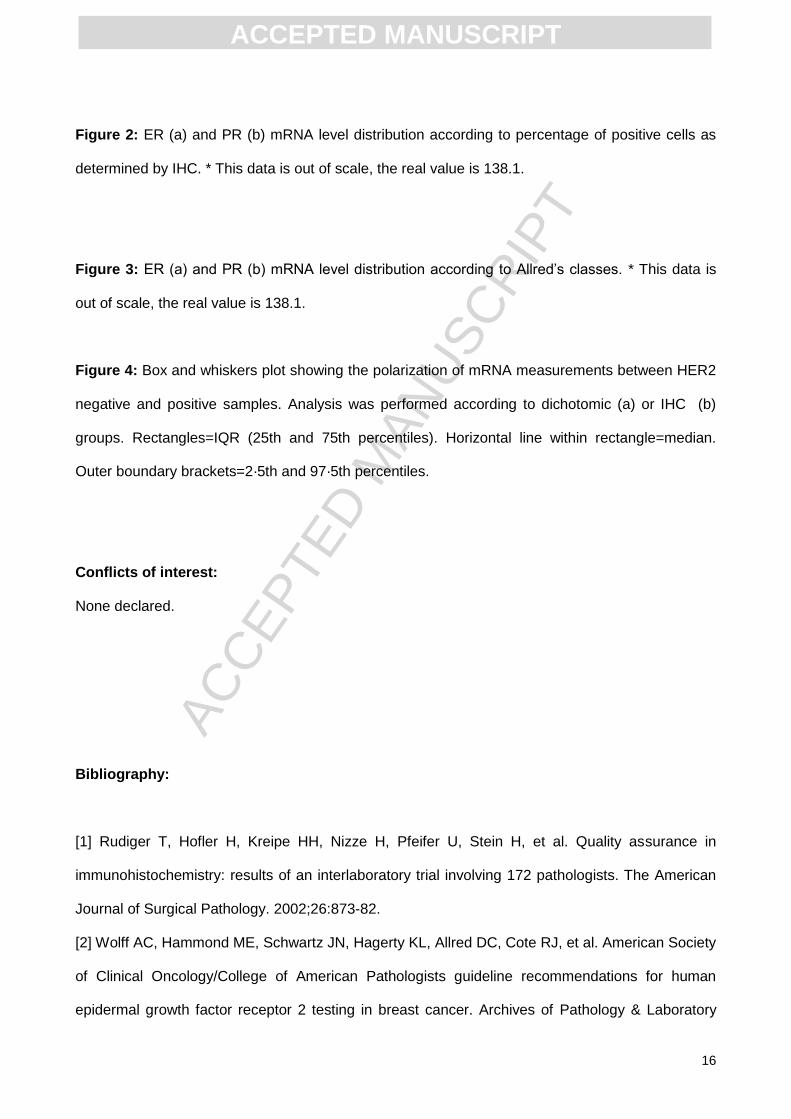
Figure 2: ER (a) and PR (b) mRNA level distribution according to percentage of positive cells as
determined by IHC. * This data is out of scale, the real value is 138.1.
Figure 3: ER (a) and PR (b) mRNA level distribution according to Allred’s classes. * This data is
out of scale, the real value is 138.1.
Figure 4: Box and whiskers plot showing the polarization of mRNA measurements between HER2
negative and positive samples. Analysis was performed according to dichotomic (a) or IHC (b)
groups. Rectangles=IQR (25th and 75th percentiles). Horizontal line within rectangle=median.
Outer boundary brackets=2·5th and 97·5th percentiles.
Conflicts of interest:
None declared.
Bibliography:
[1] Rudiger T, Hofler H, Kreipe HH, Nizze H, Pfeifer U, Stein H, et al. Quality assurance in
immunohistochemistry: results of an interlaboratory trial involving 172 pathologists. The American
Journal of Surgical Pathology. 2002;26:873-82.
[2] Wolff AC, Hammond ME, Schwartz JN, Hagerty KL, Allred DC, Cote RJ, et al. American Society
of Clinical Oncology/College of American Pathologists guideline recommendations for human
epidermal growth factor receptor 2 testing in breast cancer. Archives of Pathology & Laboratory

ACC
EPTE
D M
ANU
SCR
IPT
ACCEPTED MANUSCRIPT
17
Medicine. 2007;131:18-43.
[3] Rhodes A, Jasani B, Barnes DM, Bobrow LG, Miller KD. Reliability of Immunohistochemical
demonstration of oestrogen receptors in routine practice: interlaboratory variance in the sensitivity
of detection and evaluation of scoring systems. Journal of Clinical Pathology. 2000;53:125-30.
[4] Goldhirsch A, Wood WC, Gelber RD, Coates AS, Thurlimann B, Senn HJ. Progress and
promise: highlights of the international expert consensus on the primary therapy of early breast
cancer 2007. Annals of Oncology. 2007;18:1133-44.
[5] Dowsett M, Allred C, Knox J, Quinn E, Salter J, Wale C, et al. Relationship between quantitative
estrogen and progesterone receptor expression and human epidermal growth factor receptor 2
(HER-2) status with recurrence in the Arimidex, Tamoxifen, Alone or in Combination trial. Journal
of Clinical Oncology. 2008;26:1059-65.
[6] Krop IE, Winer EP. Ten years of HER2-directed therapy: still questions after all these years.
Breast Cancer Research and Treatment. 2009;113:207-9.
[7] Brown PO, Botstein D. Exploring the new world of the genome with DNA microarrays. Nature
Genetics. 1999;21:33-7.
[8] Gong Y, Yan K, Lin F, Anderson K, Sotiriou C, Andre F, et al. Determination of oestrogen-
receptor status and ERBB2 status of breast carcinoma: a gene-expression profiling study. The
Lancet Oncology. 2007;8:203-11.
[9] Symmans WF, Ayers M, Clark EA, Stec J, Hess KR, Sneige N, et al. Total RNA yield and
microarray gene expression profiles from fine-needle aspiration biopsy and core-needle biopsy
samples of breast carcinoma. Cancer. 2003;97:2960-71.
[10] Perez-Diez A, Morgun A, Shulzhenko N. Microarrays for cancer diagnosis and classification.
Advances in Experimental Medicine and Biology. 2007;593:74-85.
[11] Harvey JM, Clark GM, Osborne CK, Allred DC. Estrogen receptor status by
immunohistochemistry is superior to the ligand-binding assay for predicting response to adjuvant
endocrine therapy in breast cancer. Journal of Clinical Oncology. 1999;17:1474-81.
[12] Ballestrero A, Coviello DA, Garuti A, Nencioni A, Fama A, Rocco I, et al. Reverse-
transcriptase polymerase chain reaction of the maspin gene in the detection of bone marrow breast
ACC
EPTE
D M
ANU
SCR
IPT
ACCEPTED MANUSCRIPT
18
carcinoma cell contamination. Cancer. 2001;92:2030-5.
[13] Ciotti P, Garuti A, Ballestrero A, Cirmena G, Chiaramondia M, Baccini P, et al. Reliability and
reproducibility of a RNA preamplification method for low-density array analysis from formalin-fixed
paraffin-embedded breast cancer samples. Diagnostic Molecular Pathology. 2009;18:112-8.
[14] Lehmann U, Glockner S, Kleeberger W, von Wasielewski HF, Kreipe H. Detection of gene
amplification in archival breast cancer specimens by laser-assisted microdissection and
quantitative real-time polymerase chain reaction. The American Journal of Pathology.
2000;156:1855-64.
[15] Konigshoff M, Wilhelm J, Bohle RM, Pingoud A, Hahn M. HER-2/neu gene copy number
quantified by real-time PCR: comparison of gene amplification, heterozygosity, and
immunohistochemical status in breast cancer tissue. Clinical Chemistry. 2003;49:219-29.
[16] Livak KJ, Schmittgen TD. Analysis of relative gene expression data using real-time
quantitative PCR and the 2(-Delta Delta C(T)) Method. Methods (San Diego, Calif). 2001;25:402-8.
[17] Wang Y, Klijn JG, Zhang Y, Sieuwerts AM, Look MP, Yang F, et al. Gene-expression profiles
to predict distant metastasis of lymph-node-negative primary breast cancer. Lancet. 2005;365:671-
9.
[18] Li J, Smyth P, Cahill S, Denning K, Flavin R, Aherne S, et al. Improved RNA quality and
TaqMan Pre-amplification method (PreAmp) to enhance expression analysis from formalin fixed
paraffin embedded (FFPE) materials. BMC Biotechnology. 2008;8:10.
[19] Mengual L, Burset M, Marin-Aguilera M, Ribal MJ, Alcaraz A. Multiplex preamplification of
specific cDNA targets prior to gene expression analysis by TaqMan Arrays. BMC Research Notes.
2008;1:21.
[20] Uzan C, Andre F, Scott V, Laurent I, Azria E, Suciu V, et al. Fine-needle aspiration for nucleic
acid-ased molecular analyses in breast cancer. Cancer. 2009;117:32-9.
[21] Susini T, Bussani C, Marini G, Nori J, Olivieri S, Molino C, et al. Preoperative assessment of
HER-2/neu status in breast carcinoma: the role of quantitative real-time PCR on core-biopsy
specimens. Gynecologic Oncology. 2010;116:234-9.
[22] Konofaos P, Kontzoglou K, Parakeva P, Kittas C, Margari N, Giaxnaki E, et al. The role of

ACC
EPTE
D M
ANU
SCR
IPT
ACCEPTED MANUSCRIPT
19
ThinPrep cytology in the investigation of ki-67 index, p53 and HER-2 detection in fine-needle
aspirates of breast tumors. Journal of BUON : official journal of the Balkan Union of Oncology.
2013;18:352-8.
[23] Tamaki K, Sasano H, Ishida T, Miyashita M, Takeda M, Amari M, et al. Comparison of core
needle biopsy (CNB) and surgical specimens for accurate preoperative evaluation of ER, PgR and
HER2 status of breast cancer patients. Cancer science. 2010;101:2074-9.
[24] Lyng MB, Laenkholm AV, Pallisgaard N, Ditzel HJ. Identification of genes for normalization of
real-time RT-PCR data in breast carcinomas. BMC Cancer. 2008;8:20.
[25] Hayes DF. Quantitative measures of oestrogen receptor and ERBB2 expression. The Lancet
Oncology. 2007;8:184-5.
[26] Assersohn L, Gangi L, Zhao Y, Dowsett M, Simon R, Powles TJ, et al. The feasibility of using
fine needle aspiration from primary breast cancers for cDNA microarray analyses. Clinical Cancer
Research. 2002;8:794-801.
[27] Sotiriou C, Powles TJ, Dowsett M, Jazaeri AA, Feldman AL, Assersohn L, et al. Gene
expression profiles derived from fine needle aspiration correlate with response to systemic
chemotherapy in breast cancer. Breast Cancer Research. 2002;4:R3.
[28] Roche PC, Suman VJ, Jenkins RB, Davidson NE, Martino S, Kaufman PA, et al. Concordance
between local and central laboratory HER2 testing in the breast intergroup trial N9831. Journal of
the National Cancer Institute. 2002;94:855-7.
[29] Increasing steroid hormone receptors expression defines breast cancer subtypes non
responsive to preoperative chemotherapy. Breast Cancer Research and Treatment. 2009;116:359-
69.
[30] Chemoendocrine compared with endocrine adjuvant therapies for node-negative breast
cancer: predictive value of centrally reviewed expression of estrogen and progesterone receptors--
International Breast Cancer Study Group. Journal of Clinical Oncology. 2008;26:1404-10.
ACC
EPTE
D M
ANU
SCR
IPT
ACCEPTED MANUSCRIPT
20
Figure 1
ACC
EPTE
D M
ANU
SCR
IPT
ACCEPTED MANUSCRIPT
21
Figure 2
ACC
EPTE
D M
ANU
SCR
IPT
ACCEPTED MANUSCRIPT
22
Figure 3
ACC
EPTE
D M
ANU
SCR
IPT
ACCEPTED MANUSCRIPT
23
Figure 4
ACC
EPTE
D M
ANU
SCR
IPT
ACCEPTED MANUSCRIPT
24
Table 1
Patient IHC / FISH HER2 expression
(mRNA)
HER2 gene (copy
number)
1 neg / neg neg (0.68) non amplified (0.91)
2 neg / neg neg (0.53) non amplified (0.88)
3 neg / neg neg (0.49) non amplified (0.82)
4 pos / pos pos (31.37) amplified (7.99)
5 neg / neg neg (0.36) non amplified (0.8)
6 neg / neg neg (0.48) non amplified (0.82)
7 neg / neg neg (0.85) non amplified (1.23)
8 pos / pos pos (6.76) amplified (2.39)
9 neg / neg neg (0.44) non amplified (0.86)
10 neg / neg neg (0.23) non amplified (0.78)

ACC
EPTE
D M
ANU
SCR
IPT
ACCEPTED MANUSCRIPT
25
Highlights:
Hormone receptors and Her2 are essential biomarkers in breast cancer; which we
assessed using PCR in fine needle aspiration samples
By combining flow cytometry and PCR we obtain extremely accurate results with extremely
small samples using an inexpensive technique
Our approach is extremely feasible and has high clinical relevance, especially in breast
cancer neoadjuvant treatment
Related Documents