j 2013 4 ¡ L 2015 i U ª Computation of Ceiling Price based on Aug-2015 Data under Para 4 of DPCO 2013 Number of Companies consisting of Market Share of 1% & Above 2 6.4.3.4.4 RITONAVIR 100 MG TABLET Per Tablet Sum of MAT value considered for price calculation (in Lakhs) 86.93 Sum of PTR per unit considered for price calculation 47.70 Number of Packs considered 2 Average PTR 23.85 Add : 16% Retailer Margin 3.82 Ceiling Price (without local taxes) 27.67 % Reduction with compared to Highest Price 3.99% WPI Reduction wef 1.4.2016 @ -2.7105% 0.75 Final Ceiling Price (without local taxes) 26.92 Minimum Price (Rs.) 22.86 Maximum Price (Rs.) 24.84 Average of all considered (Rs.) 23.85 Ceiling Price (Rs.) 27.67 TOTAL MAT 8,692,850 100% S. No. Unique No. as per NLEM Composition as per NLEM o Pack Description BRAND Company Strength Pack Size Unit PTR (Rs.) MAT (Rs.) SKU wise MAT % Qualify (Y/N) Y=Yes N=No Price per Unit (Rs.) Price per Unit (Rs.) Considered 1 6.4.3.4.4 RITONAVIR | J5B9 RITOMUNE 100 MG TABLET 60 RITOMUNE CIPLA LTD. 100 MG 60 TABLET 1,371.43 3,903,090 44.90% Y 22.86 22.86 2 RITONAVIR | J5B9 EMPETUS 100 MG TABLET 30 EMPETUS EMCURE PHARMACEUTICALS LTD 100 MG 30 TABLET 745.14 4,789,760 55.10% Y 24.84 24.84

Welcome message from author
This document is posted to help you gain knowledge. Please leave a comment to let me know what you think about it! Share it to your friends and learn new things together.
Transcript
???? ?j �2013 ??�????� 4 ??�� ¡� , \?è��2015 ??�] ?? °?�??�] ??i?� , ? Uã?� ?� ??? ??Computation of Ceiling Price based on Aug-2015 Data under Para 4 of DPCO 2013
Number of Companies consisting of Market Share of 1% & Above 26.4.3.4.4 RITONAVIR 100 MG TABLET Per Tablet Sum of MAT value considered for price calculation (in Lakhs) 86.93
Sum of PTR per unit considered for price calculation 47.70Number of Packs considered 2Average PTR 23.85Add : 16% Retailer Margin 3.82Ceiling Price (without local taxes) 27.67% Reduction with compared to Highest Price 3.99%WPI Reduction wef 1.4.2016 @ -2.7105% 0.75Final Ceiling Price (without local taxes) 26.92
Minimum Price (Rs.) 22.86Maximum Price (Rs.) 24.84Average of all considered (Rs.) 23.85Ceiling Price (Rs.) 27.67
TOTAL MAT 8,692,850 100%S. No.
Unique No. as per NLEM
Composition as per NLEM
??? � o��??Pack Description
? ??BRAND
?????Company
Strength Pack Size
Unit PTR (Rs.) MAT (Rs.) SKU wise MAT %
Qualify (Y/N)Y=YesN=No
Price per Unit (Rs.)
Price per Unit (Rs.) Considered
1 6.4.3.4.4 RITONAVIR | J5B9 RITOMUNE 100 MG TABLET 60 RITOMUNE CIPLA LTD. 100 MG 60 TABLET 1,371.43 3,903,090 44.90% Y 22.86 22.862 RITONAVIR | J5B9 EMPETUS 100 MG TABLET 30 EMPETUS EMCURE PHARMACEUTICALS LTD 100 MG 30 TABLET 745.14 4,789,760 55.10% Y 24.84 24.84
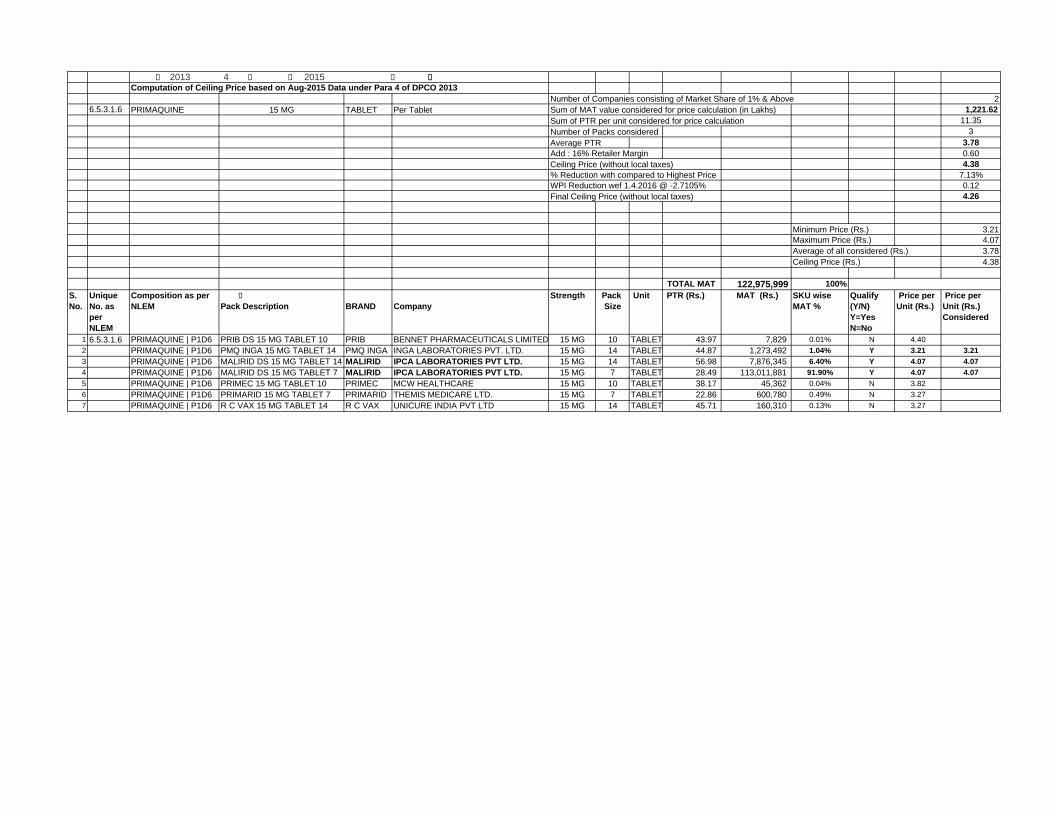
???? ?j �2013 ??�????� 4 ??�� ¡� , \?è��2015 ??�] ?? °?�??�] ??i?� , ?Uã?� ?� ??? ??Computation of Ceiling Price based on Aug-2015 Data under Para 4 of DPCO 2013
Number of Companies consisting of Market Share of 1% & Above 26.5.3.1.6 PRIMAQUINE 15 MG TABLET Per Tablet Sum of MAT value considered for price calculation (in Lakhs) 1,221.62
Sum of PTR per unit considered for price calculation 11.35Number of Packs considered 3Average PTR 3.78Add : 16% Retailer Margin 0.60Ceiling Price (without local taxes) 4.38% Reduction with compared to Highest Price 7.13%WPI Reduction wef 1.4.2016 @ -2.7105% 0.12Final Ceiling Price (without local taxes) 4.26
Minimum Price (Rs.) 3.21Maximum Price (Rs.) 4.07Average of all considered (Rs.) 3.78Ceiling Price (Rs.) 4.38
TOTAL MAT 122,975,999 100%S. No.
Unique No. as per NLEM
Composition as per NLEM
??? � o��??Pack Description
? ??BRAND
?????Company
Strength Pack Size
Unit PTR (Rs.) MAT (Rs.) SKU wise MAT %
Qualify (Y/N)Y=YesN=No
Price per Unit (Rs.)
Price per Unit (Rs.) Considered
1 6.5.3.1.6 PRIMAQUINE | P1D6 PRIB DS 15 MG TABLET 10 PRIB BENNET PHARMACEUTICALS LIMITED 15 MG 10 TABLET 43.97 7,829 0.01% N 4.402 PRIMAQUINE | P1D6 PMQ INGA 15 MG TABLET 14 PMQ INGA INGA LABORATORIES PVT. LTD. 15 MG 14 TABLET 44.87 1,273,492 1.04% Y 3.21 3.213 PRIMAQUINE | P1D6 MALIRID DS 15 MG TABLET 14 MALIRID IPCA LABORATORIES PVT LTD. 15 MG 14 TABLET 56.98 7,876,345 6.40% Y 4.07 4.074 PRIMAQUINE | P1D6 MALIRID DS 15 MG TABLET 7 MALIRID IPCA LABORATORIES PVT LTD. 15 MG 7 TABLET 28.49 113,011,881 91.90% Y 4.07 4.075 PRIMAQUINE | P1D6 PRIMEC 15 MG TABLET 10 PRIMEC MCW HEALTHCARE 15 MG 10 TABLET 38.17 45,362 0.04% N 3.826 PRIMAQUINE | P1D6 PRIMARID 15 MG TABLET 7 PRIMARID THEMIS MEDICARE LTD. 15 MG 7 TABLET 22.86 600,780 0.49% N 3.277 PRIMAQUINE | P1D6 R C VAX 15 MG TABLET 14 R C VAX UNICURE INDIA PVT LTD 15 MG 14 TABLET 45.71 160,310 0.13% N 3.27
???? ?j �2013 ??�????� 4 ??�� ¡� , \?è��2015 ??�] ?? °?�??�] ??i?� , ? Uã?� ?� ??? ??Computation of Ceiling Price based on Aug-2015 Data under Para 4 of DPCO 2013
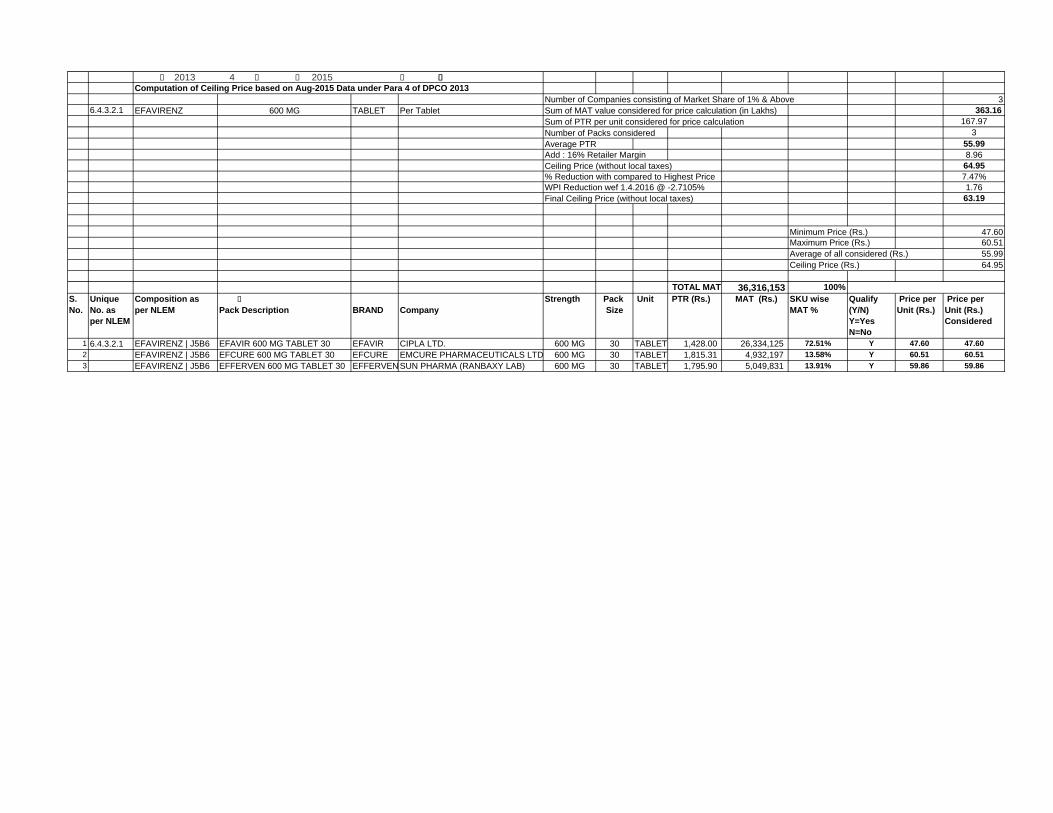
Number of Companies consisting of Market Share of 1% & Above 36.4.3.2.1 EFAVIRENZ 600 MG TABLET Per Tablet Sum of MAT value considered for price calculation (in Lakhs) 363.16
Sum of PTR per unit considered for price calculation 167.97Number of Packs considered 3Average PTR 55.99Add : 16% Retailer Margin 8.96Ceiling Price (without local taxes) 64.95% Reduction with compared to Highest Price 7.47%WPI Reduction wef 1.4.2016 @ -2.7105% 1.76Final Ceiling Price (without local taxes) 63.19
Minimum Price (Rs.) 47.60Maximum Price (Rs.) 60.51Average of all considered (Rs.) 55.99Ceiling Price (Rs.) 64.95
TOTAL MAT 36,316,153 100%S. No.
Unique No. as per NLEM
Composition as per NLEM
??? � o��??Pack Description
? ??BRAND
?????Company
Strength Pack Size
Unit PTR (Rs.) MAT (Rs.) SKU wise MAT %
Qualify (Y/N)Y=YesN=No
Price per Unit (Rs.)
Price per Unit (Rs.) Considered
1 6.4.3.2.1 EFAVIRENZ | J5B6 EFAVIR 600 MG TABLET 30 EFAVIR CIPLA LTD. 600 MG 30 TABLET 1,428.00 26,334,125 72.51% Y 47.60 47.602 EFAVIRENZ | J5B6 EFCURE 600 MG TABLET 30 EFCURE EMCURE PHARMACEUTICALS LTD 600 MG 30 TABLET 1,815.31 4,932,197 13.58% Y 60.51 60.513 EFAVIRENZ | J5B6 EFFERVEN 600 MG TABLET 30 EFFERVEN SUN PHARMA (RANBAXY LAB) 600 MG 30 TABLET 1,795.90 5,049,831 13.91% Y 59.86 59.86
???? ?j �2013 ??�????� 4 ??�� ¡� , \?è��2015 ??�] ?? °?�??�] ??i?� , ? Uã?� ?� ??? ??Computation of Ceiling Price based on Aug-2015 Data under Para 4 of DPCO 2013
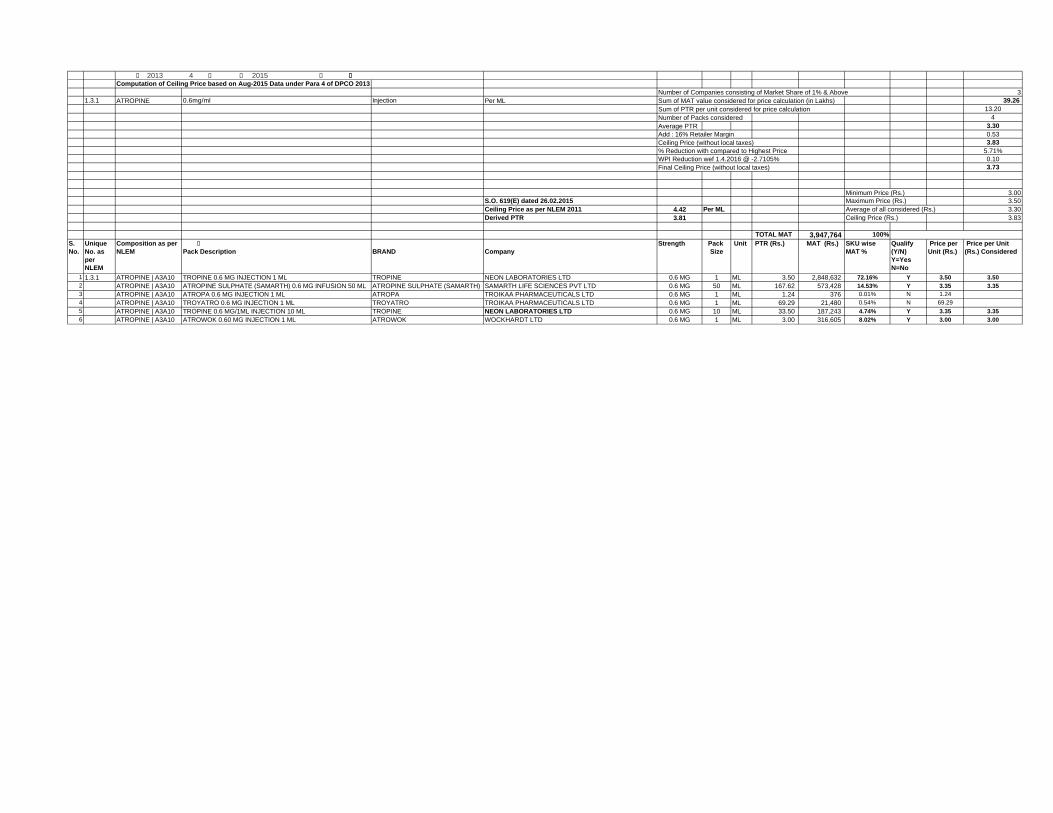
Number of Companies consisting of Market Share of 1% & Above 31.3.1 ATROPINE 0.6mg/ml Injection Per ML Sum of MAT value considered for price calculation (in Lakhs) 39.26
Sum of PTR per unit considered for price calculation 13.20Number of Packs considered 4Average PTR 3.30Add : 16% Retailer Margin 0.53Ceiling Price (without local taxes) 3.83% Reduction with compared to Highest Price 5.71%WPI Reduction wef 1.4.2016 @ -2.7105% 0.10Final Ceiling Price (without local taxes) 3.73
Minimum Price (Rs.) 3.00S.O. 619(E) dated 26.02.2015 Maximum Price (Rs.) 3.50Ceiling Price as per NLEM 2011 4.42 Per ML Average of all considered (Rs.) 3.30Derived PTR 3.81 Ceiling Price (Rs.) 3.83
TOTAL MAT 3,947,764 100%S. No.
Unique No. as per NLEM
Composition as per NLEM
??? � o��??Pack Description
? ??BRAND
?????Company
Strength Pack Size
Unit PTR (Rs.) MAT (Rs.) SKU wise MAT %
Qualify (Y/N)Y=YesN=No
Price per Unit (Rs.)
Price per Unit (Rs.) Considered
1 1.3.1 ATROPINE | A3A10 TROPINE 0.6 MG INJECTION 1 ML TROPINE NEON LABORATORIES LTD 0.6 MG 1 ML 3.50 2,848,632 72.16% Y 3.50 3.502 ATROPINE | A3A10 ATROPINE SULPHATE (SAMARTH) 0.6 MG INFUSION 50 ML ATROPINE SULPHATE (SAMARTH) SAMARTH LIFE SCIENCES PVT LTD 0.6 MG 50 ML 167.62 573,428 14.53% Y 3.35 3.353 ATROPINE | A3A10 ATROPA 0.6 MG INJECTION 1 ML ATROPA TROIKAA PHARMACEUTICALS LTD 0.6 MG 1 ML 1.24 376 0.01% N 1.244 ATROPINE | A3A10 TROYATRO 0.6 MG INJECTION 1 ML TROYATRO TROIKAA PHARMACEUTICALS LTD 0.6 MG 1 ML 69.29 21,480 0.54% N 69.295 ATROPINE | A3A10 TROPINE 0.6 MG/1ML INJECTION 10 ML TROPINE NEON LABORATORIES LTD 0.6 MG 10 ML 33.50 187,243 4.74% Y 3.35 3.356 ATROPINE | A3A10 ATROWOK 0.60 MG INJECTION 1 ML ATROWOK WOCKHARDT LTD 0.6 MG 1 ML 3.00 316,605 8.02% Y 3.00 3.00
???? ?j �2013 ??�????� 4 ??�� ¡� , \?è��2015 ??�] ?? °?�??�] ??i?� , ?Uã?� ?� ??? ??Computation of Ceiling Price based on Aug-2015 Data under Para 4 of DPCO 2013
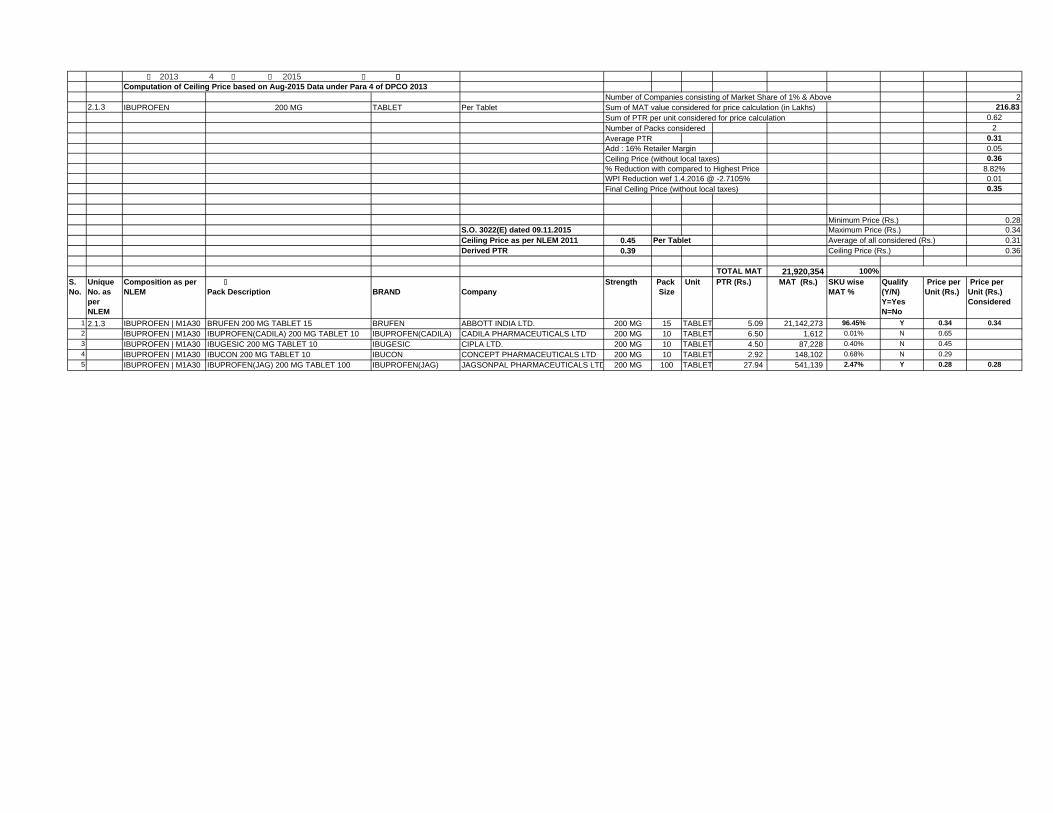
Number of Companies consisting of Market Share of 1% & Above 22.1.3 IBUPROFEN 200 MG TABLET Per Tablet Sum of MAT value considered for price calculation (in Lakhs) 216.83
Sum of PTR per unit considered for price calculation 0.62Number of Packs considered 2Average PTR 0.31Add : 16% Retailer Margin 0.05Ceiling Price (without local taxes) 0.36% Reduction with compared to Highest Price 8.82%WPI Reduction wef 1.4.2016 @ -2.7105% 0.01Final Ceiling Price (without local taxes) 0.35
Minimum Price (Rs.) 0.28S.O. 3022(E) dated 09.11.2015 Maximum Price (Rs.) 0.34Ceiling Price as per NLEM 2011 0.45 Per Tablet Average of all considered (Rs.) 0.31Derived PTR 0.39 Ceiling Price (Rs.) 0.36
TOTAL MAT 21,920,354 100%S. No.
Unique No. as per NLEM
Composition as per NLEM
??? � o��??Pack Description
? ??BRAND
?????Company
Strength Pack Size
Unit PTR (Rs.) MAT (Rs.) SKU wise MAT %
Qualify (Y/N)Y=YesN=No
Price per Unit (Rs.)
Price per Unit (Rs.) Considered
1 2.1.3 IBUPROFEN | M1A30 BRUFEN 200 MG TABLET 15 BRUFEN ABBOTT INDIA LTD. 200 MG 15 TABLET 5.09 21,142,273 96.45% Y 0.34 0.342 IBUPROFEN | M1A30 IBUPROFEN(CADILA) 200 MG TABLET 10 IBUPROFEN(CADILA) CADILA PHARMACEUTICALS LTD 200 MG 10 TABLET 6.50 1,612 0.01% N 0.653 IBUPROFEN | M1A30 IBUGESIC 200 MG TABLET 10 IBUGESIC CIPLA LTD. 200 MG 10 TABLET 4.50 87,228 0.40% N 0.454 IBUPROFEN | M1A30 IBUCON 200 MG TABLET 10 IBUCON CONCEPT PHARMACEUTICALS LTD 200 MG 10 TABLET 2.92 148,102 0.68% N 0.295 IBUPROFEN | M1A30 IBUPROFEN(JAG) 200 MG TABLET 100 IBUPROFEN(JAG) JAGSONPAL PHARMACEUTICALS LTD 200 MG 100 TABLET 27.94 541,139 2.47% Y 0.28 0.28
???? ?j �2013 ??�????� 4 ??�� ¡� , \?è��2015 ??�] ?? °?�??�] ??i?� , ?Uã?� ?� ??? ??Computation of Ceiling Price based on Aug-2015 Data under Para 4 of DPCO 2013
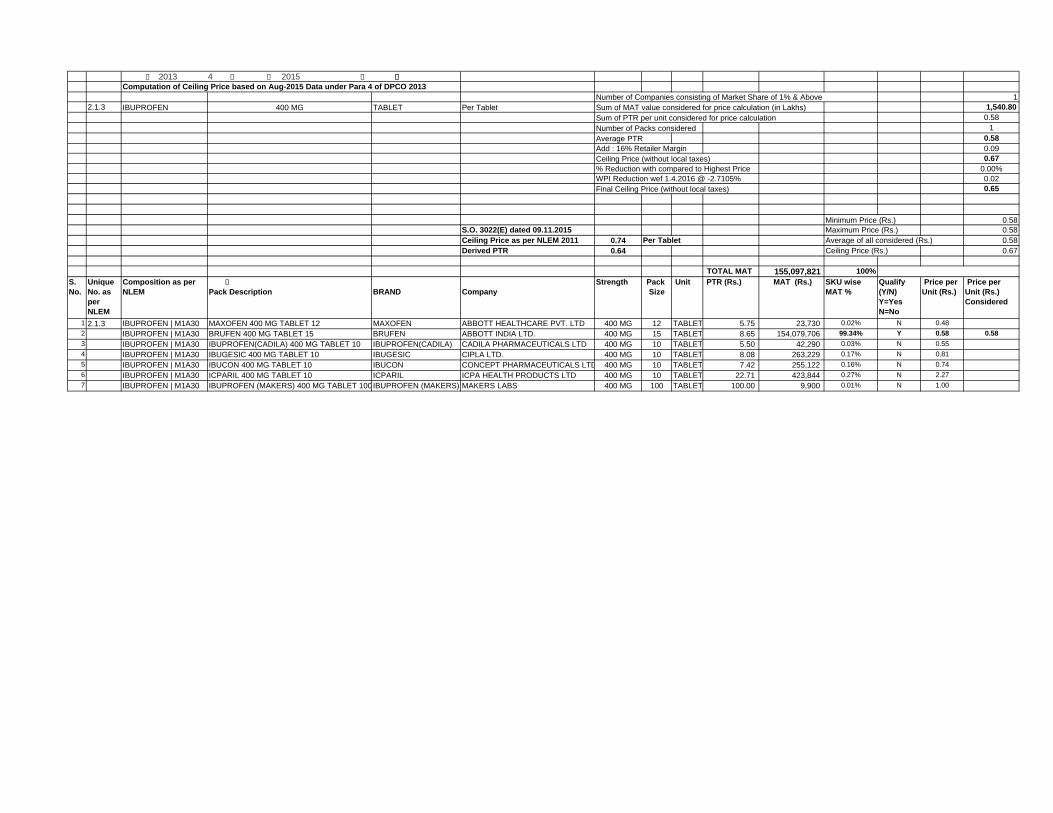
Number of Companies consisting of Market Share of 1% & Above 12.1.3 IBUPROFEN 400 MG TABLET Per Tablet Sum of MAT value considered for price calculation (in Lakhs) 1,540.80
Sum of PTR per unit considered for price calculation 0.58Number of Packs considered 1Average PTR 0.58Add : 16% Retailer Margin 0.09Ceiling Price (without local taxes) 0.67% Reduction with compared to Highest Price 0.00%WPI Reduction wef 1.4.2016 @ -2.7105% 0.02Final Ceiling Price (without local taxes) 0.65
Minimum Price (Rs.) 0.58S.O. 3022(E) dated 09.11.2015 Maximum Price (Rs.) 0.58Ceiling Price as per NLEM 2011 0.74 Per Tablet Average of all considered (Rs.) 0.58Derived PTR 0.64 Ceiling Price (Rs.) 0.67
TOTAL MAT 155,097,821 100%S. No.
Unique No. as per NLEM
Composition as per NLEM
??? � o��??Pack Description
? ??BRAND
?????Company
Strength Pack Size
Unit PTR (Rs.) MAT (Rs.) SKU wise MAT %
Qualify (Y/N)Y=YesN=No
Price per Unit (Rs.)
Price per Unit (Rs.) Considered
1 2.1.3 IBUPROFEN | M1A30 MAXOFEN 400 MG TABLET 12 MAXOFEN ABBOTT HEALTHCARE PVT. LTD 400 MG 12 TABLET 5.75 23,730 0.02% N 0.482 IBUPROFEN | M1A30 BRUFEN 400 MG TABLET 15 BRUFEN ABBOTT INDIA LTD. 400 MG 15 TABLET 8.65 154,079,706 99.34% Y 0.58 0.583 IBUPROFEN | M1A30 IBUPROFEN(CADILA) 400 MG TABLET 10 IBUPROFEN(CADILA) CADILA PHARMACEUTICALS LTD 400 MG 10 TABLET 5.50 42,290 0.03% N 0.554 IBUPROFEN | M1A30 IBUGESIC 400 MG TABLET 10 IBUGESIC CIPLA LTD. 400 MG 10 TABLET 8.08 263,229 0.17% N 0.815 IBUPROFEN | M1A30 IBUCON 400 MG TABLET 10 IBUCON CONCEPT PHARMACEUTICALS LTD 400 MG 10 TABLET 7.42 255,122 0.16% N 0.746 IBUPROFEN | M1A30 ICPARIL 400 MG TABLET 10 ICPARIL ICPA HEALTH PRODUCTS LTD 400 MG 10 TABLET 22.71 423,844 0.27% N 2.277 IBUPROFEN | M1A30 IBUPROFEN (MAKERS) 400 MG TABLET 100IBUPROFEN (MAKERS) MAKERS LABS 400 MG 100 TABLET 100.00 9,900 0.01% N 1.00
???? ?j �2013 ??�????� 4 ??�� ¡� , \?è��2015 ??�] ?? °?�??�] ??i?� , ? Uã?� ?� ??? ??Computation of Ceiling Price based on Aug-2015 Data under Para 4 of DPCO 2013
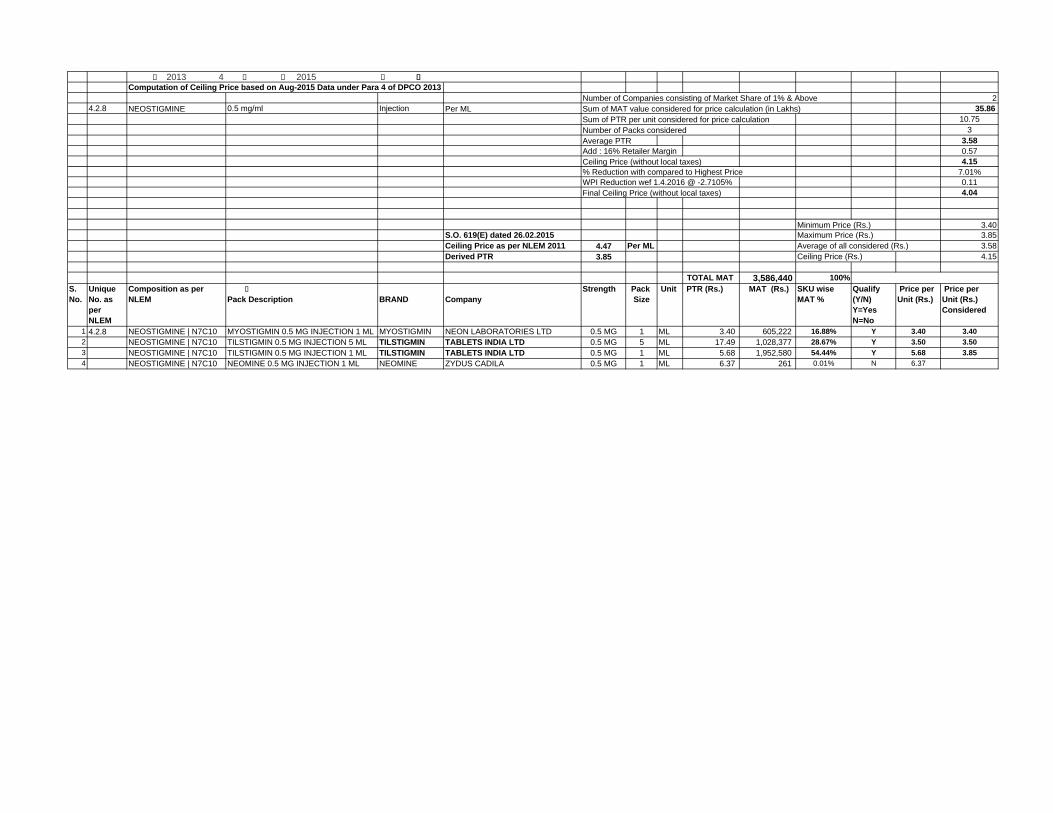
Number of Companies consisting of Market Share of 1% & Above 24.2.8 NEOSTIGMINE 0.5 mg/ml Injection Per ML Sum of MAT value considered for price calculation (in Lakhs) 35.86
Sum of PTR per unit considered for price calculation 10.75Number of Packs considered 3Average PTR 3.58Add : 16% Retailer Margin 0.57Ceiling Price (without local taxes) 4.15% Reduction with compared to Highest Price 7.01%WPI Reduction wef 1.4.2016 @ -2.7105% 0.11Final Ceiling Price (without local taxes) 4.04
Minimum Price (Rs.) 3.40S.O. 619(E) dated 26.02.2015 Maximum Price (Rs.) 3.85Ceiling Price as per NLEM 2011 4.47 Per ML Average of all considered (Rs.) 3.58Derived PTR 3.85 Ceiling Price (Rs.) 4.15
TOTAL MAT 3,586,440 100%S. No.
Unique No. as per NLEM
Composition as per NLEM
??? � o��??Pack Description
? ??BRAND
?????Company
Strength Pack Size
Unit PTR (Rs.) MAT (Rs.) SKU wise MAT %
Qualify (Y/N)Y=YesN=No
Price per Unit (Rs.)
Price per Unit (Rs.) Considered
1 4.2.8 NEOSTIGMINE | N7C10 MYOSTIGMIN 0.5 MG INJECTION 1 ML MYOSTIGMIN NEON LABORATORIES LTD 0.5 MG 1 ML 3.40 605,222 16.88% Y 3.40 3.402 NEOSTIGMINE | N7C10 TILSTIGMIN 0.5 MG INJECTION 5 ML TILSTIGMIN TABLETS INDIA LTD 0.5 MG 5 ML 17.49 1,028,377 28.67% Y 3.50 3.503 NEOSTIGMINE | N7C10 TILSTIGMIN 0.5 MG INJECTION 1 ML TILSTIGMIN TABLETS INDIA LTD 0.5 MG 1 ML 5.68 1,952,580 54.44% Y 5.68 3.854 NEOSTIGMINE | N7C10 NEOMINE 0.5 MG INJECTION 1 ML NEOMINE ZYDUS CADILA 0.5 MG 1 ML 6.37 261 0.01% N 6.37
???? ?j �2013 ??�????� 4 ??�� ¡� , \?è��2015 ??�] ?? °?�??�] ??i?� , ?Uã?� ?� ??? ??Computation of Ceiling Price based on Aug-2015 Data under Para 4 of DPCO 2013
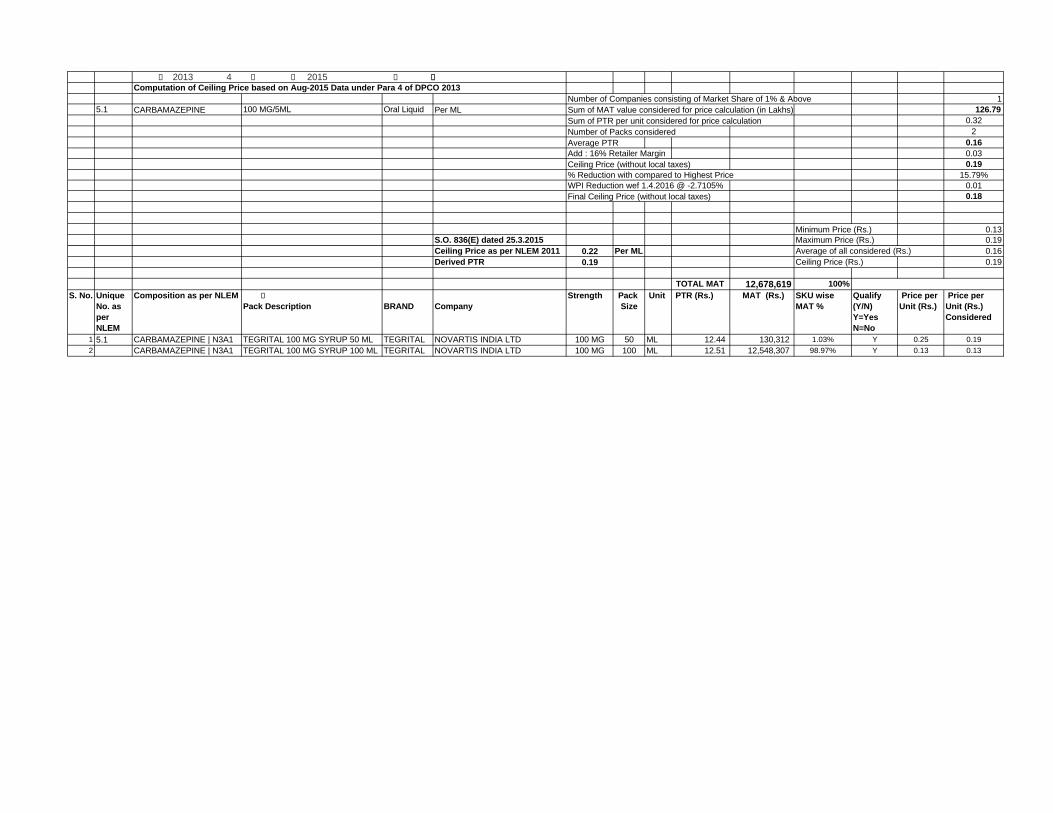
Number of Companies consisting of Market Share of 1% & Above 15.1 CARBAMAZEPINE 100 MG/5ML Oral Liquid Per ML Sum of MAT value considered for price calculation (in Lakhs) 126.79
Sum of PTR per unit considered for price calculation 0.32Number of Packs considered 2Average PTR 0.16Add : 16% Retailer Margin 0.03Ceiling Price (without local taxes) 0.19% Reduction with compared to Highest Price 15.79%WPI Reduction wef 1.4.2016 @ -2.7105% 0.01Final Ceiling Price (without local taxes) 0.18
Minimum Price (Rs.) 0.13S.O. 836(E) dated 25.3.2015 Maximum Price (Rs.) 0.19Ceiling Price as per NLEM 2011 0.22 Per ML Average of all considered (Rs.) 0.16Derived PTR 0.19 Ceiling Price (Rs.) 0.19
TOTAL MAT 12,678,619 100%S. No. Unique
No. as per NLEM
Composition as per NLEM ??? � o��??Pack Description
? ??BRAND
?????Company
Strength Pack Size
Unit PTR (Rs.) MAT (Rs.) SKU wise MAT %
Qualify (Y/N)Y=YesN=No
Price per Unit (Rs.)
Price per Unit (Rs.) Considered
1 5.1 CARBAMAZEPINE | N3A1 TEGRITAL 100 MG SYRUP 50 ML TEGRITAL NOVARTIS INDIA LTD 100 MG 50 ML 12.44 130,312 1.03% Y 0.25 0.192 CARBAMAZEPINE | N3A1 TEGRITAL 100 MG SYRUP 100 ML TEGRITAL NOVARTIS INDIA LTD 100 MG 100 ML 12.51 12,548,307 98.97% Y 0.13 0.13
???? ?j �2013 ??�????� 4 ??�� ¡� , \?è��2015 ??�] ?? °?�??�] ??i?� , ? Uã?� ?� ??? ??Computation of Ceiling Price based on Aug-2015 Data under Para 4 of DPCO 2013
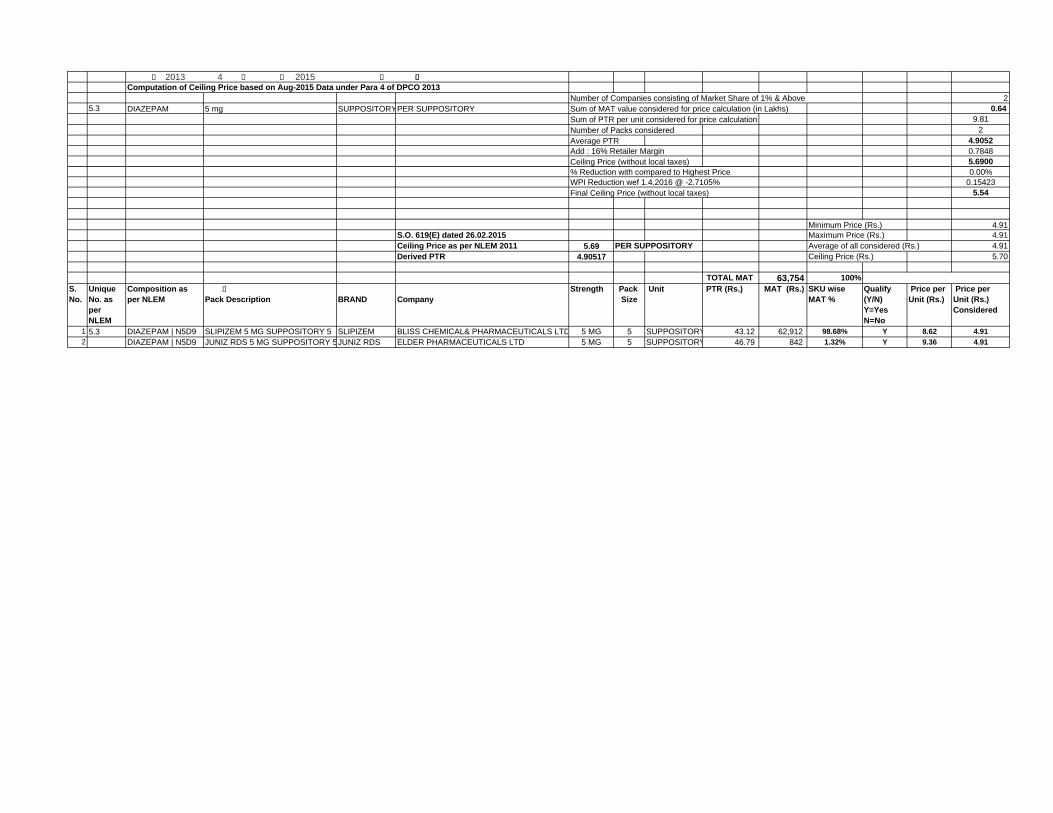
Number of Companies consisting of Market Share of 1% & Above 25.3 DIAZEPAM 5 mg SUPPOSITORYPER SUPPOSITORY Sum of MAT value considered for price calculation (in Lakhs) 0.64
Sum of PTR per unit considered for price calculation 9.81Number of Packs considered 2Average PTR 4.9052Add : 16% Retailer Margin 0.7848Ceiling Price (without local taxes) 5.6900% Reduction with compared to Highest Price 0.00%WPI Reduction wef 1.4.2016 @ -2.7105% 0.15423Final Ceiling Price (without local taxes) 5.54
Minimum Price (Rs.) 4.91S.O. 619(E) dated 26.02.2015 Maximum Price (Rs.) 4.91Ceiling Price as per NLEM 2011 5.69 PER SUPPOSITORY Average of all considered (Rs.) 4.91Derived PTR 4.90517 Ceiling Price (Rs.) 5.70
TOTAL MAT 63,754 100%S. No.
Unique No. as per NLEM
Composition as per NLEM
??? � o��??Pack Description
? ??BRAND
?????Company
Strength Pack Size
Unit PTR (Rs.) MAT (Rs.) SKU wise MAT %
Qualify (Y/N)Y=YesN=No
Price per Unit (Rs.)
Price per Unit (Rs.) Considered
1 5.3 DIAZEPAM | N5D9 SLIPIZEM 5 MG SUPPOSITORY 5 SLIPIZEM BLISS CHEMICAL& PHARMACEUTICALS LTD 5 MG 5 SUPPOSITORY 43.12 62,912 98.68% Y 8.62 4.912 DIAZEPAM | N5D9 JUNIZ RDS 5 MG SUPPOSITORY 5JUNIZ RDS ELDER PHARMACEUTICALS LTD 5 MG 5 SUPPOSITORY 46.79 842 1.32% Y 9.36 4.91
???? ?j �2013 ??�????� 4 ??�� ¡� , \?è��2015 ??�] ?? °?�??�] ??i?� , ? Uã?� ?� ??? ??Computation of Ceiling Price based on Aug-2015 Data under Para 4 of DPCO 2013
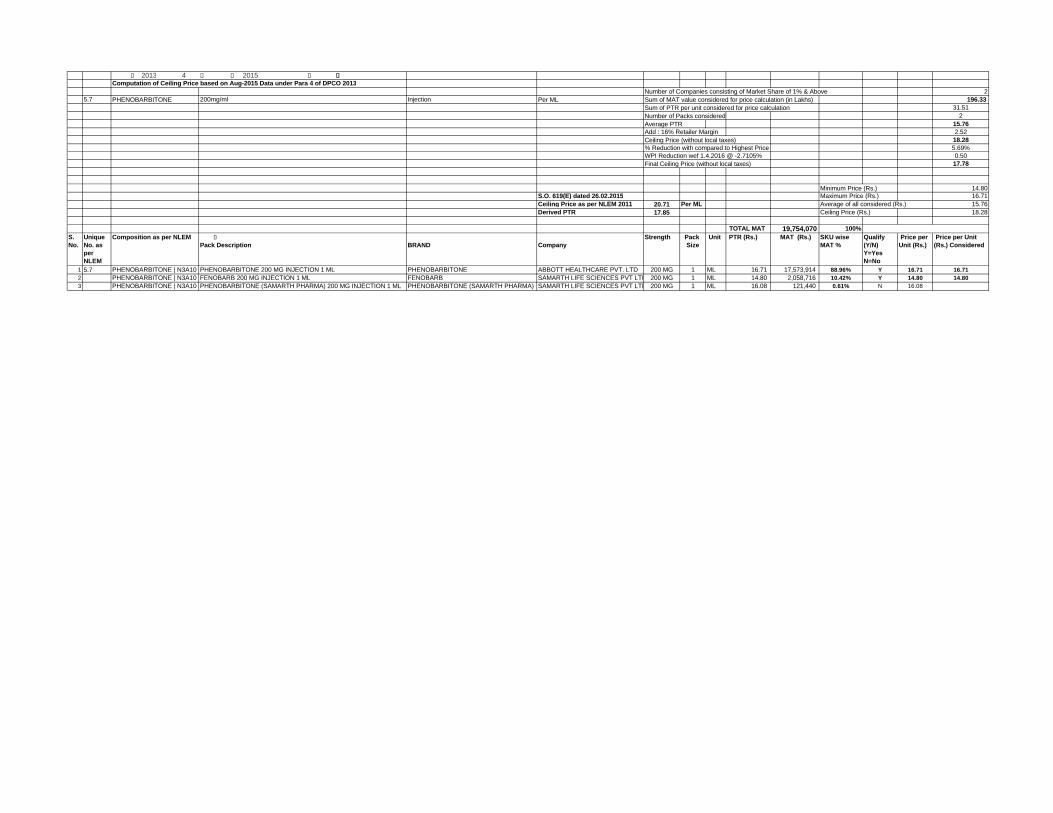
Number of Companies consisting of Market Share of 1% & Above 25.7 PHENOBARBITONE 200mg/ml Injection Per ML Sum of MAT value considered for price calculation (in Lakhs) 196.33
Sum of PTR per unit considered for price calculation 31.51Number of Packs considered 2Average PTR 15.76Add : 16% Retailer Margin 2.52Ceiling Price (without local taxes) 18.28% Reduction with compared to Highest Price 5.69%WPI Reduction wef 1.4.2016 @ -2.7105% 0.50Final Ceiling Price (without local taxes) 17.78
Minimum Price (Rs.) 14.80S.O. 619(E) dated 26.02.2015 Maximum Price (Rs.) 16.71Ceiling Price as per NLEM 2011 20.71 Per ML Average of all considered (Rs.) 15.76Derived PTR 17.85 Ceiling Price (Rs.) 18.28
TOTAL MAT 19,754,070 100%S. No.
Unique No. as per NLEM
Composition as per NLEM ??? � o��??Pack Description
? ??BRAND
?????Company
Strength Pack Size
Unit PTR (Rs.) MAT (Rs.) SKU wise MAT %
Qualify (Y/N)Y=YesN=No
Price per Unit (Rs.)
Price per Unit (Rs.) Considered
1 5.7 PHENOBARBITONE | N3A10 PHENOBARBITONE 200 MG INJECTION 1 ML PHENOBARBITONE ABBOTT HEALTHCARE PVT. LTD 200 MG 1 ML 16.71 17,573,914 88.96% Y 16.71 16.712 PHENOBARBITONE | N3A10 FENOBARB 200 MG INJECTION 1 ML FENOBARB SAMARTH LIFE SCIENCES PVT LTD 200 MG 1 ML 14.80 2,058,716 10.42% Y 14.80 14.803 PHENOBARBITONE | N3A10 PHENOBARBITONE (SAMARTH PHARMA) 200 MG INJECTION 1 ML PHENOBARBITONE (SAMARTH PHARMA) SAMARTH LIFE SCIENCES PVT LTD 200 MG 1 ML 16.08 121,440 0.61% N 16.08
???? ?j �2013 ??�????� 4 ??�� ¡� , \?è��2015 ??�] ?? °?�??�] ??i?� , ? Uã?� ?� ??? ??Computation of Ceiling Price based on Aug-2015 Data under Para 4 of DPCO 2013
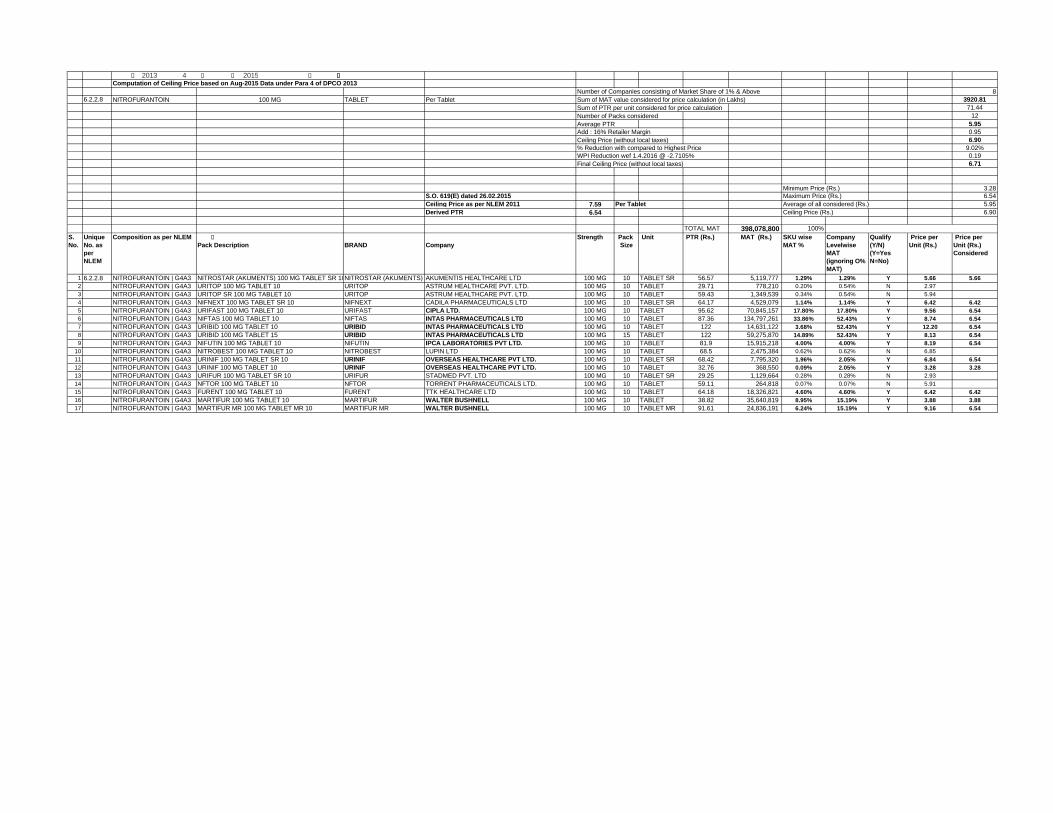
Number of Companies consisting of Market Share of 1% & Above 86.2.2.8 NITROFURANTOIN 100 MG TABLET Per Tablet Sum of MAT value considered for price calculation (in Lakhs) 3920.81
Sum of PTR per unit considered for price calculation 71.44Number of Packs considered 12Average PTR 5.95Add : 16% Retailer Margin 0.95Ceiling Price (without local taxes) 6.90% Reduction with compared to Highest Price 9.02%WPI Reduction wef 1.4.2016 @ -2.7105% 0.19Final Ceiling Price (without local taxes) 6.71
Minimum Price (Rs.) 3.28S.O. 619(E) dated 26.02.2015 Maximum Price (Rs.) 6.54Ceiling Price as per NLEM 2011 7.59 Per Tablet Average of all considered (Rs.) 5.95Derived PTR 6.54 Ceiling Price (Rs.) 6.90
TOTAL MAT 398,078,800 100%S. No.
Unique No. as per NLEM
Composition as per NLEM ??? � o��??Pack Description
? ??BRAND
?????Company
Strength Pack Size
Unit PTR (Rs.) MAT (Rs.) SKU wise MAT %
Company Levelwise MAT (ignoring O% MAT)
Qualify (Y/N)(Y=YesN=No)
Price per Unit (Rs.)
Price per Unit (Rs.) Considered
1 6.2.2.8 NITROFURANTOIN | G4A3 NITROSTAR (AKUMENTS) 100 MG TABLET SR 10NITROSTAR (AKUMENTS) AKUMENTIS HEALTHCARE LTD 100 MG 10 TABLET SR 56.57 5,119,777 1.29% 1.29% Y 5.66 5.662 NITROFURANTOIN | G4A3 URITOP 100 MG TABLET 10 URITOP ASTRUM HEALTHCARE PVT. LTD. 100 MG 10 TABLET 29.71 778,210 0.20% 0.54% N 2.973 NITROFURANTOIN | G4A3 URITOP SR 100 MG TABLET 10 URITOP ASTRUM HEALTHCARE PVT. LTD. 100 MG 10 TABLET 59.43 1,349,539 0.34% 0.54% N 5.944 NITROFURANTOIN | G4A3 NIFNEXT 100 MG TABLET SR 10 NIFNEXT CADILA PHARMACEUTICALS LTD 100 MG 10 TABLET SR 64.17 4,529,079 1.14% 1.14% Y 6.42 6.425 NITROFURANTOIN | G4A3 URIFAST 100 MG TABLET 10 URIFAST CIPLA LTD. 100 MG 10 TABLET 95.62 70,845,157 17.80% 17.80% Y 9.56 6.546 NITROFURANTOIN | G4A3 NIFTAS 100 MG TABLET 10 NIFTAS INTAS PHARMACEUTICALS LTD 100 MG 10 TABLET 87.36 134,797,261 33.86% 52.43% Y 8.74 6.547 NITROFURANTOIN | G4A3 URIBID 100 MG TABLET 10 URIBID INTAS PHARMACEUTICALS LTD 100 MG 10 TABLET 122 14,631,122 3.68% 52.43% Y 12.20 6.548 NITROFURANTOIN | G4A3 URIBID 100 MG TABLET 15 URIBID INTAS PHARMACEUTICALS LTD 100 MG 15 TABLET 122 59,275,870 14.89% 52.43% Y 8.13 6.549 NITROFURANTOIN | G4A3 NIFUTIN 100 MG TABLET 10 NIFUTIN IPCA LABORATORIES PVT LTD. 100 MG 10 TABLET 81.9 15,915,218 4.00% 4.00% Y 8.19 6.54
10 NITROFURANTOIN | G4A3 NITROBEST 100 MG TABLET 10 NITROBEST LUPIN LTD 100 MG 10 TABLET 68.5 2,475,384 0.62% 0.62% N 6.8511 NITROFURANTOIN | G4A3 URINIF 100 MG TABLET SR 10 URINIF OVERSEAS HEALTHCARE PVT LTD. 100 MG 10 TABLET SR 68.42 7,795,320 1.96% 2.05% Y 6.84 6.5412 NITROFURANTOIN | G4A3 URINIF 100 MG TABLET 10 URINIF OVERSEAS HEALTHCARE PVT LTD. 100 MG 10 TABLET 32.76 368,550 0.09% 2.05% Y 3.28 3.2813 NITROFURANTOIN | G4A3 URIFUR 100 MG TABLET SR 10 URIFUR STADMED PVT. LTD 100 MG 10 TABLET SR 29.25 1,129,664 0.28% 0.28% N 2.9314 NITROFURANTOIN | G4A3 NFTOR 100 MG TABLET 10 NFTOR TORRENT PHARMACEUTICALS LTD. 100 MG 10 TABLET 59.11 264,818 0.07% 0.07% N 5.9115 NITROFURANTOIN | G4A3 FURENT 100 MG TABLET 10 FURENT TTK HEALTHCARE LTD 100 MG 10 TABLET 64.18 18,326,821 4.60% 4.60% Y 6.42 6.4216 NITROFURANTOIN | G4A3 MARTIFUR 100 MG TABLET 10 MARTIFUR WALTER BUSHNELL 100 MG 10 TABLET 38.82 35,640,819 8.95% 15.19% Y 3.88 3.8817 NITROFURANTOIN | G4A3 MARTIFUR MR 100 MG TABLET MR 10 MARTIFUR MR WALTER BUSHNELL 100 MG 10 TABLET MR 91.61 24,836,191 6.24% 15.19% Y 9.16 6.54
???? ?j �2013 ??�????� 4 ??�� ¡� , \?è��2015 ??�] ?? °?�??�] ??i?� , ? Uã?� ?� ??? ??Computation of Ceiling Price based on Aug-2015 Data under Para 4 of DPCO 2013
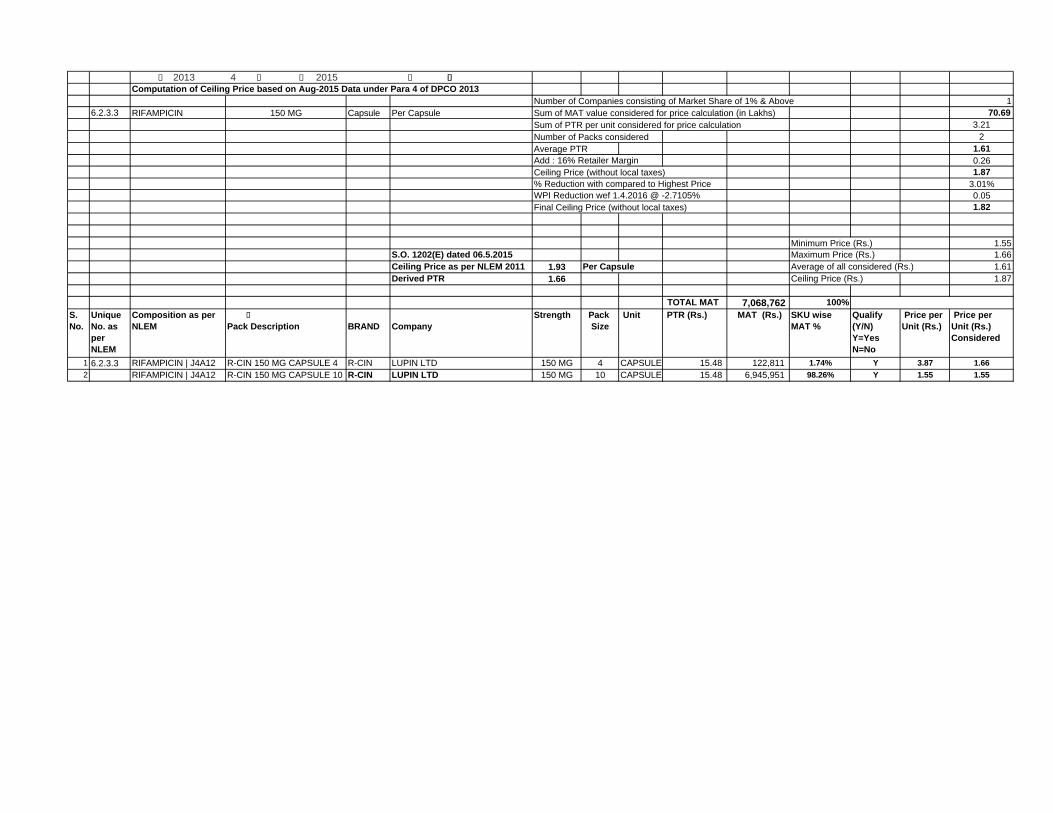
Number of Companies consisting of Market Share of 1% & Above 16.2.3.3 RIFAMPICIN 150 MG Capsule Per Capsule Sum of MAT value considered for price calculation (in Lakhs) 70.69
Sum of PTR per unit considered for price calculation 3.21Number of Packs considered 2Average PTR 1.61Add : 16% Retailer Margin 0.26Ceiling Price (without local taxes) 1.87% Reduction with compared to Highest Price 3.01%WPI Reduction wef 1.4.2016 @ -2.7105% 0.05Final Ceiling Price (without local taxes) 1.82
Minimum Price (Rs.) 1.55S.O. 1202(E) dated 06.5.2015 Maximum Price (Rs.) 1.66Ceiling Price as per NLEM 2011 1.93 Per Capsule Average of all considered (Rs.) 1.61Derived PTR 1.66 Ceiling Price (Rs.) 1.87
TOTAL MAT 7,068,762 100%S. No.
Unique No. as per NLEM
Composition as per NLEM
??? � o��??Pack Description
? ??BRAND
?????Company
Strength Pack Size
Unit PTR (Rs.) MAT (Rs.) SKU wise MAT %
Qualify (Y/N)Y=YesN=No
Price per Unit (Rs.)
Price per Unit (Rs.) Considered
1 6.2.3.3 RIFAMPICIN | J4A12 R-CIN 150 MG CAPSULE 4 R-CIN LUPIN LTD 150 MG 4 CAPSULE 15.48 122,811 1.74% Y 3.87 1.662 RIFAMPICIN | J4A12 R-CIN 150 MG CAPSULE 10 R-CIN LUPIN LTD 150 MG 10 CAPSULE 15.48 6,945,951 98.26% Y 1.55 1.55

???? ?j �2013 ??�????� 4 ??�� ¡� , \?è��2015 ??�] ?? °?�??�] ??i?� , ? Uã?� ?� ??? ??Computation of Ceiling Price based on Aug-2015 Data under Para 4 of DPCO 2013
Number of Companies consisting of Market Share of 1% & Above 16.2.3.3 RIFAMPICIN 300 MG Capsule Per Capsule Sum of MAT value considered for price calculation (in Lakhs) 260.95
Sum of PTR per unit considered for price calculation 5.95Number of Packs considered 2Average PTR 2.98Add : 16% Retailer Margin 0.48Ceiling Price (without local taxes) 3.46% Reduction with compared to Highest Price 1.00%WPI Reduction wef 1.4.2016 @ -2.7105% 0.09Final Ceiling Price (without local taxes) 3.37
Minimum Price (Rs.) 2.94S.O. 1202(E) dated 06.5.2015 Maximum Price (Rs.) 3.01Ceiling Price as per NLEM 2011 3.49 Per Capsule Average of all considered (Rs.) 2.98Derived PTR 3.01 Ceiling Price (Rs.) 3.46
TOTAL MAT 26,095,483 100%S. No.
Unique No. as per NLEM
Composition as per NLEM
??? � o��??Pack Description
? ??BRAND
?????Company
Strength Pack Size
Unit PTR (Rs.) MAT (Rs.) SKU wise MAT %
Qualify (Y/N)Y=YesN=No
Price per Unit (Rs.)
Price per Unit (Rs.) Considered
1 6.2.3.3 RIFAMPICIN | J4A12 R-CIN 300 MG CAPSULE 4 R-CIN LUPIN LTD 300 MG 4 CAPSULE 29.29 265,397 1.02% Y 7.32 3.012 RIFAMPICIN | J4A12 R-CIN 300 MG CAPSULE 10 R-CIN LUPIN LTD 300 MG 10 CAPSULE 29.43 25,830,086 98.98% Y 2.94 2.94
???? ?j �2013 ??�????� 4 ??�� ¡� , \?è��2015 ??�] ?? °?�??�] ??i?� , ? Uã?� ?� ??? ??Computation of Ceiling Price based on Aug-2015 Data under Para 4 of DPCO 2013
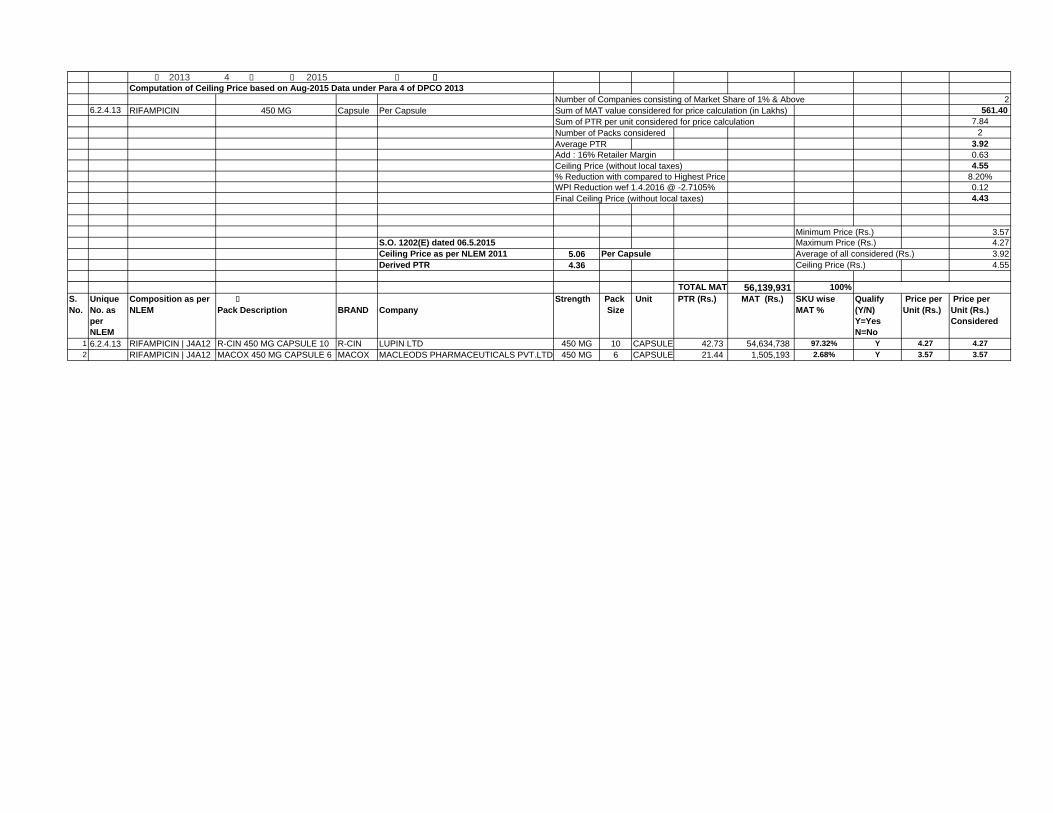
Number of Companies consisting of Market Share of 1% & Above 26.2.4.13 RIFAMPICIN 450 MG Capsule Per Capsule Sum of MAT value considered for price calculation (in Lakhs) 561.40
Sum of PTR per unit considered for price calculation 7.84Number of Packs considered 2Average PTR 3.92Add : 16% Retailer Margin 0.63Ceiling Price (without local taxes) 4.55% Reduction with compared to Highest Price 8.20%WPI Reduction wef 1.4.2016 @ -2.7105% 0.12Final Ceiling Price (without local taxes) 4.43
Minimum Price (Rs.) 3.57S.O. 1202(E) dated 06.5.2015 Maximum Price (Rs.) 4.27Ceiling Price as per NLEM 2011 5.06 Per Capsule Average of all considered (Rs.) 3.92Derived PTR 4.36 Ceiling Price (Rs.) 4.55
TOTAL MAT 56,139,931 100%S. No.
Unique No. as per NLEM
Composition as per NLEM
??? � o��??Pack Description
? ??BRAND
?????Company
Strength Pack Size
Unit PTR (Rs.) MAT (Rs.) SKU wise MAT %
Qualify (Y/N)Y=YesN=No
Price per Unit (Rs.)
Price per Unit (Rs.) Considered
1 6.2.4.13 RIFAMPICIN | J4A12 R-CIN 450 MG CAPSULE 10 R-CIN LUPIN LTD 450 MG 10 CAPSULE 42.73 54,634,738 97.32% Y 4.27 4.272 RIFAMPICIN | J4A12 MACOX 450 MG CAPSULE 6 MACOX MACLEODS PHARMACEUTICALS PVT.LTD 450 MG 6 CAPSULE 21.44 1,505,193 2.68% Y 3.57 3.57
???? ?j �2013 ??�????� 4 ??�� ¡� , \?è��2015 ??�] ?? °?�??�] ??i?� , ?Uã?� ?� ??? ??Computation of Ceiling Price based on Aug-2015 Data under Para 4 of DPCO 2013
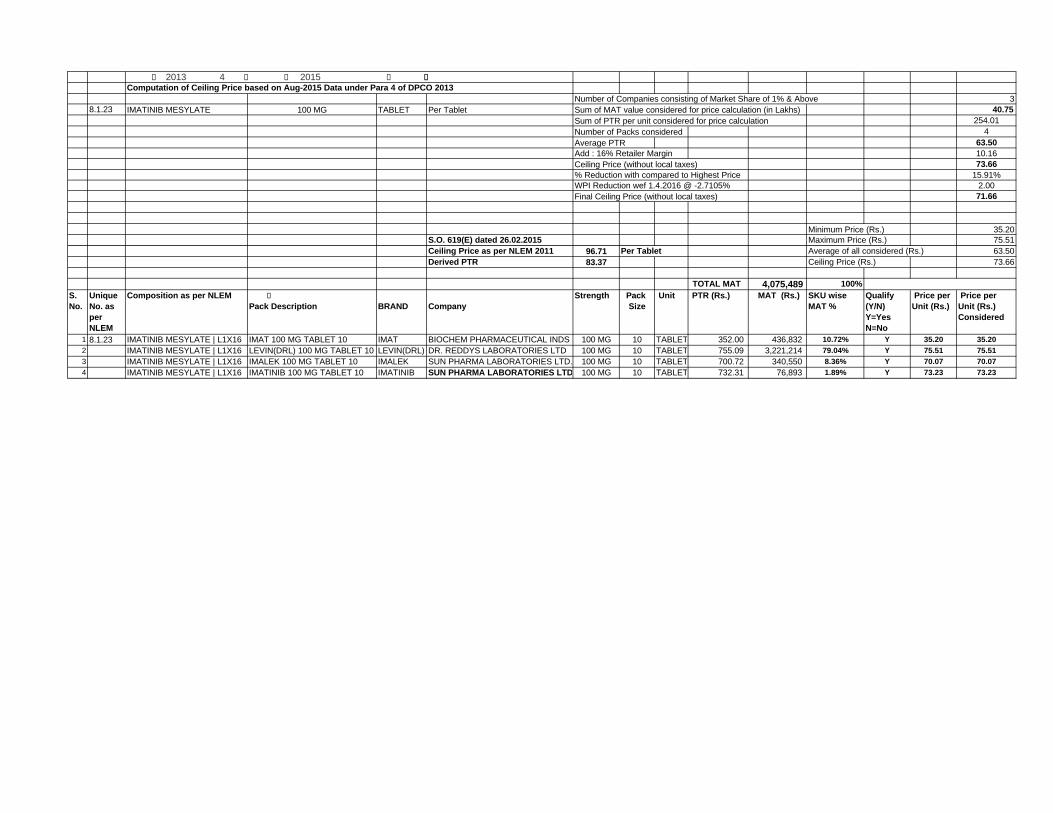
Number of Companies consisting of Market Share of 1% & Above 38.1.23 IMATINIB MESYLATE 100 MG TABLET Per Tablet Sum of MAT value considered for price calculation (in Lakhs) 40.75
Sum of PTR per unit considered for price calculation 254.01Number of Packs considered 4Average PTR 63.50Add : 16% Retailer Margin 10.16Ceiling Price (without local taxes) 73.66% Reduction with compared to Highest Price 15.91%WPI Reduction wef 1.4.2016 @ -2.7105% 2.00Final Ceiling Price (without local taxes) 71.66
Minimum Price (Rs.) 35.20S.O. 619(E) dated 26.02.2015 Maximum Price (Rs.) 75.51Ceiling Price as per NLEM 2011 96.71 Per Tablet Average of all considered (Rs.) 63.50Derived PTR 83.37 Ceiling Price (Rs.) 73.66
TOTAL MAT 4,075,489 100%S. No.
Unique No. as per NLEM
Composition as per NLEM ??? � o��??Pack Description
? ??BRAND
?????Company
Strength Pack Size
Unit PTR (Rs.) MAT (Rs.) SKU wise MAT %
Qualify (Y/N)Y=YesN=No
Price per Unit (Rs.)
Price per Unit (Rs.) Considered
1 8.1.23 IMATINIB MESYLATE | L1X16 IMAT 100 MG TABLET 10 IMAT BIOCHEM PHARMACEUTICAL INDS 100 MG 10 TABLET 352.00 436,832 10.72% Y 35.20 35.202 IMATINIB MESYLATE | L1X16 LEVIN(DRL) 100 MG TABLET 10 LEVIN(DRL) DR. REDDYS LABORATORIES LTD 100 MG 10 TABLET 755.09 3,221,214 79.04% Y 75.51 75.513 IMATINIB MESYLATE | L1X16 IMALEK 100 MG TABLET 10 IMALEK SUN PHARMA LABORATORIES LTD. 100 MG 10 TABLET 700.72 340,550 8.36% Y 70.07 70.074 IMATINIB MESYLATE | L1X16 IMATINIB 100 MG TABLET 10 IMATINIB SUN PHARMA LABORATORIES LTD. 100 MG 10 TABLET 732.31 76,893 1.89% Y 73.23 73.23
???? ?j �2013 ??�????� 4 ??�� ¡� , \?è��2015 ??�] ?? °?�??�] ??i?� , ? Uã?� ?� ??? ??Computation of Ceiling Price based on Aug-2015 Data under Para 4 of DPCO 2013
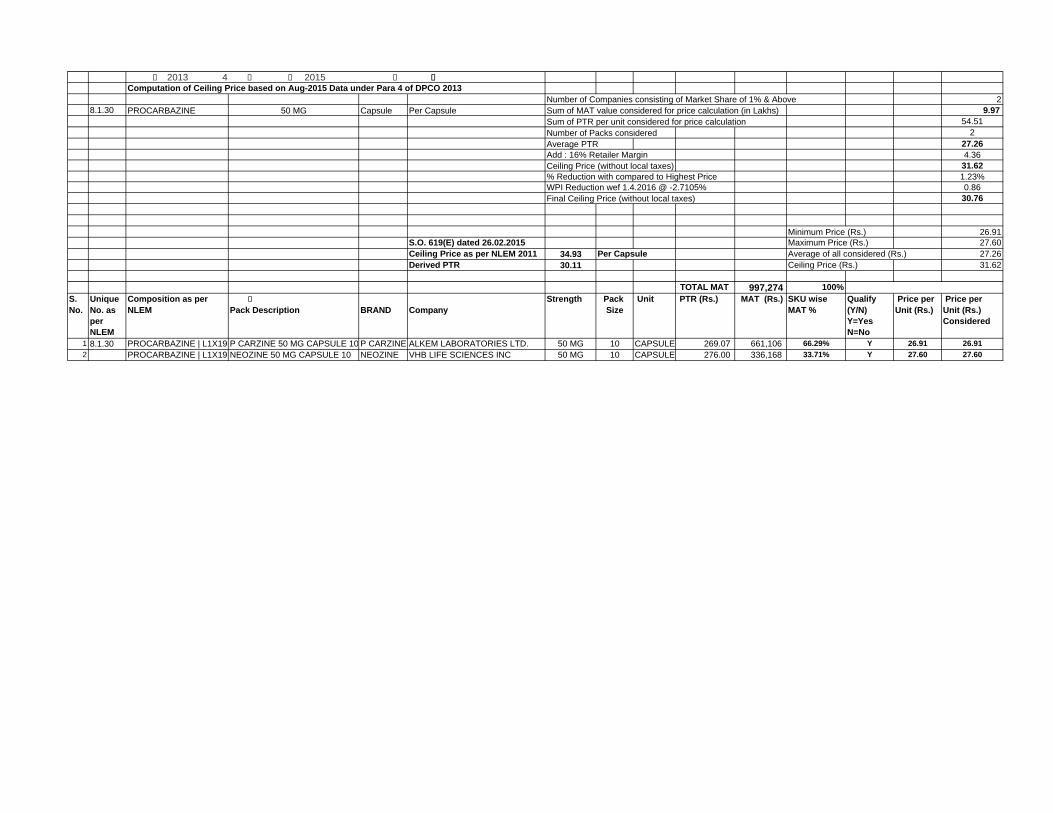
Number of Companies consisting of Market Share of 1% & Above 28.1.30 PROCARBAZINE 50 MG Capsule Per Capsule Sum of MAT value considered for price calculation (in Lakhs) 9.97
Sum of PTR per unit considered for price calculation 54.51Number of Packs considered 2Average PTR 27.26Add : 16% Retailer Margin 4.36Ceiling Price (without local taxes) 31.62% Reduction with compared to Highest Price 1.23%WPI Reduction wef 1.4.2016 @ -2.7105% 0.86Final Ceiling Price (without local taxes) 30.76
Minimum Price (Rs.) 26.91S.O. 619(E) dated 26.02.2015 Maximum Price (Rs.) 27.60Ceiling Price as per NLEM 2011 34.93 Per Capsule Average of all considered (Rs.) 27.26Derived PTR 30.11 Ceiling Price (Rs.) 31.62
TOTAL MAT 997,274 100%S. No.
Unique No. as per NLEM
Composition as per NLEM
??? � o��??Pack Description
? ??BRAND
?????Company
Strength Pack Size
Unit PTR (Rs.) MAT (Rs.) SKU wise MAT %
Qualify (Y/N)Y=YesN=No
Price per Unit (Rs.)
Price per Unit (Rs.) Considered
1 8.1.30 PROCARBAZINE | L1X19 P CARZINE 50 MG CAPSULE 10 P CARZINE ALKEM LABORATORIES LTD. 50 MG 10 CAPSULE 269.07 661,106 66.29% Y 26.91 26.912 PROCARBAZINE | L1X19 NEOZINE 50 MG CAPSULE 10 NEOZINE VHB LIFE SCIENCES INC 50 MG 10 CAPSULE 276.00 336,168 33.71% Y 27.60 27.60
???? ?j �2013 ??�????� 4 ??�� ¡� , \?è��2015 ??�] ?? °?�??�] ??i?� , ? Uã?� ?� ??? ??Computation of Ceiling Price based on Aug-2015 Data under Para 4 of DPCO 2013
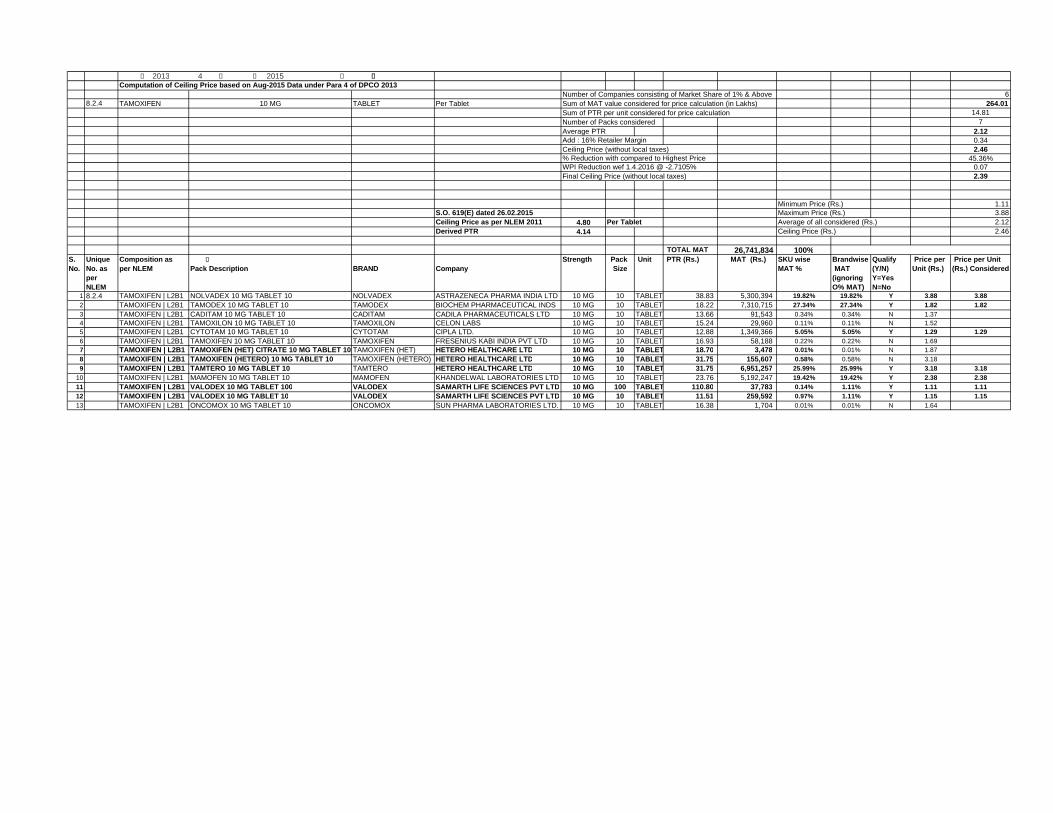
Number of Companies consisting of Market Share of 1% & Above 68.2.4 TAMOXIFEN 10 MG TABLET Per Tablet Sum of MAT value considered for price calculation (in Lakhs) 264.01
Sum of PTR per unit considered for price calculation 14.81Number of Packs considered 7Average PTR 2.12Add : 16% Retailer Margin 0.34Ceiling Price (without local taxes) 2.46% Reduction with compared to Highest Price 45.36%WPI Reduction wef 1.4.2016 @ -2.7105% 0.07Final Ceiling Price (without local taxes) 2.39
Minimum Price (Rs.) 1.11S.O. 619(E) dated 26.02.2015 Maximum Price (Rs.) 3.88Ceiling Price as per NLEM 2011 4.80 Per Tablet Average of all considered (Rs.) 2.12Derived PTR 4.14 Ceiling Price (Rs.) 2.46
TOTAL MAT 26,741,834 100%S. No.
Unique No. as per NLEM
Composition as per NLEM
??? � o��??Pack Description
? ??BRAND
?????Company
Strength Pack Size
Unit PTR (Rs.) MAT (Rs.) SKU wise MAT %
Brandwise MAT (ignoring O% MAT)
Qualify (Y/N)Y=YesN=No
Price per Unit (Rs.)
Price per Unit (Rs.) Considered
1 8.2.4 TAMOXIFEN | L2B1 NOLVADEX 10 MG TABLET 10 NOLVADEX ASTRAZENECA PHARMA INDIA LTD 10 MG 10 TABLET 38.83 5,300,394 19.82% 19.82% Y 3.88 3.882 TAMOXIFEN | L2B1 TAMODEX 10 MG TABLET 10 TAMODEX BIOCHEM PHARMACEUTICAL INDS 10 MG 10 TABLET 18.22 7,310,715 27.34% 27.34% Y 1.82 1.823 TAMOXIFEN | L2B1 CADITAM 10 MG TABLET 10 CADITAM CADILA PHARMACEUTICALS LTD 10 MG 10 TABLET 13.66 91,543 0.34% 0.34% N 1.374 TAMOXIFEN | L2B1 TAMOXILON 10 MG TABLET 10 TAMOXILON CELON LABS 10 MG 10 TABLET 15.24 29,960 0.11% 0.11% N 1.525 TAMOXIFEN | L2B1 CYTOTAM 10 MG TABLET 10 CYTOTAM CIPLA LTD. 10 MG 10 TABLET 12.88 1,349,366 5.05% 5.05% Y 1.29 1.296 TAMOXIFEN | L2B1 TAMOXIFEN 10 MG TABLET 10 TAMOXIFEN FRESENIUS KABI INDIA PVT LTD 10 MG 10 TABLET 16.93 58,188 0.22% 0.22% N 1.697 TAMOXIFEN | L2B1 TAMOXIFEN (HET) CITRATE 10 MG TABLET 10 TAMOXIFEN (HET) HETERO HEALTHCARE LTD 10 MG 10 TABLET 18.70 3,478 0.01% 0.01% N 1.878 TAMOXIFEN | L2B1 TAMOXIFEN (HETERO) 10 MG TABLET 10 TAMOXIFEN (HETERO) HETERO HEALTHCARE LTD 10 MG 10 TABLET 31.75 155,607 0.58% 0.58% N 3.189 TAMOXIFEN | L2B1 TAMTERO 10 MG TABLET 10 TAMTERO HETERO HEALTHCARE LTD 10 MG 10 TABLET 31.75 6,951,257 25.99% 25.99% Y 3.18 3.18
10 TAMOXIFEN | L2B1 MAMOFEN 10 MG TABLET 10 MAMOFEN KHANDELWAL LABORATORIES LTD 10 MG 10 TABLET 23.76 5,192,247 19.42% 19.42% Y 2.38 2.3811 TAMOXIFEN | L2B1 VALODEX 10 MG TABLET 100 VALODEX SAMARTH LIFE SCIENCES PVT LTD 10 MG 100 TABLET 110.80 37,783 0.14% 1.11% Y 1.11 1.1112 TAMOXIFEN | L2B1 VALODEX 10 MG TABLET 10 VALODEX SAMARTH LIFE SCIENCES PVT LTD 10 MG 10 TABLET 11.51 259,592 0.97% 1.11% Y 1.15 1.1513 TAMOXIFEN | L2B1 ONCOMOX 10 MG TABLET 10 ONCOMOX SUN PHARMA LABORATORIES LTD. 10 MG 10 TABLET 16.38 1,704 0.01% 0.01% N 1.64
???? ?j �2013 ??�????� 4 ??�� ¡� , \?è��2015 ??�] ?? °?�??�] ??i?� , ? Uã?� ?� ??? ??Computation of Ceiling Price based on Aug-2015 Data under Para 4 of DPCO 2013
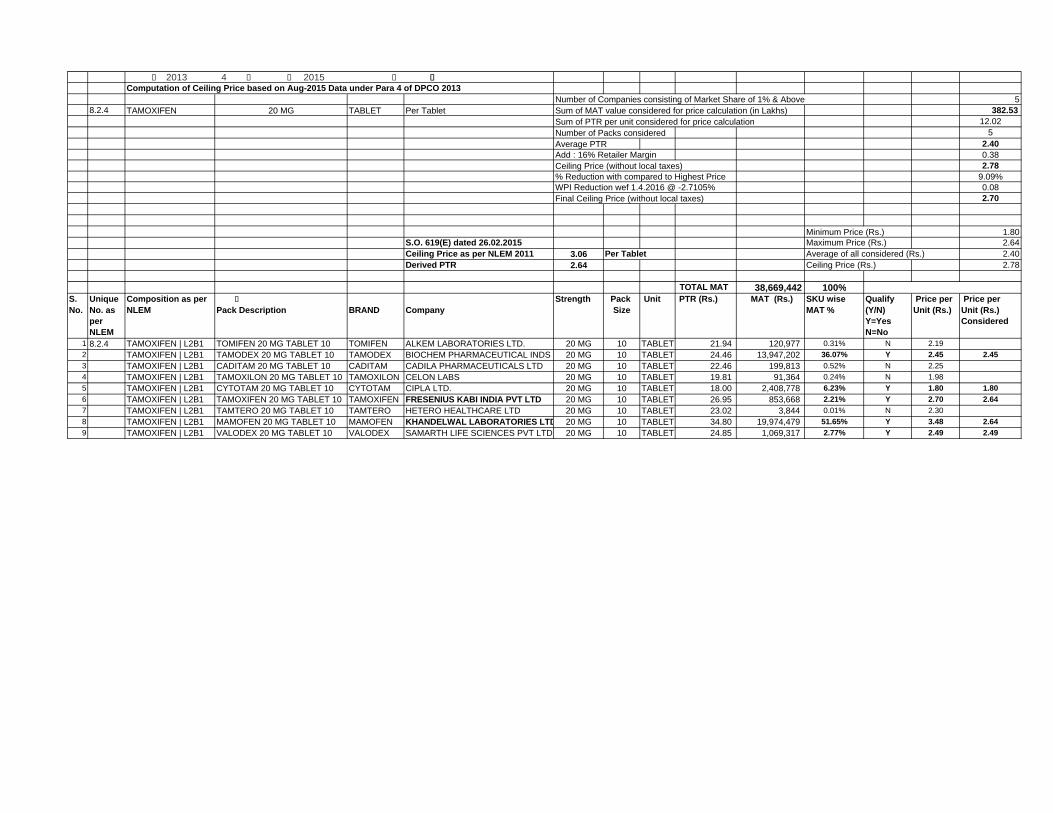
Number of Companies consisting of Market Share of 1% & Above 58.2.4 TAMOXIFEN 20 MG TABLET Per Tablet Sum of MAT value considered for price calculation (in Lakhs) 382.53
Sum of PTR per unit considered for price calculation 12.02Number of Packs considered 5Average PTR 2.40Add : 16% Retailer Margin 0.38Ceiling Price (without local taxes) 2.78% Reduction with compared to Highest Price 9.09%WPI Reduction wef 1.4.2016 @ -2.7105% 0.08Final Ceiling Price (without local taxes) 2.70
Minimum Price (Rs.) 1.80S.O. 619(E) dated 26.02.2015 Maximum Price (Rs.) 2.64Ceiling Price as per NLEM 2011 3.06 Per Tablet Average of all considered (Rs.) 2.40Derived PTR 2.64 Ceiling Price (Rs.) 2.78
TOTAL MAT 38,669,442 100%S. No.
Unique No. as per NLEM
Composition as per NLEM
??? � o��??Pack Description
? ??BRAND
?????Company
Strength Pack Size
Unit PTR (Rs.) MAT (Rs.) SKU wise MAT %
Qualify (Y/N)Y=YesN=No
Price per Unit (Rs.)
Price per Unit (Rs.) Considered
1 8.2.4 TAMOXIFEN | L2B1 TOMIFEN 20 MG TABLET 10 TOMIFEN ALKEM LABORATORIES LTD. 20 MG 10 TABLET 21.94 120,977 0.31% N 2.192 TAMOXIFEN | L2B1 TAMODEX 20 MG TABLET 10 TAMODEX BIOCHEM PHARMACEUTICAL INDS 20 MG 10 TABLET 24.46 13,947,202 36.07% Y 2.45 2.453 TAMOXIFEN | L2B1 CADITAM 20 MG TABLET 10 CADITAM CADILA PHARMACEUTICALS LTD 20 MG 10 TABLET 22.46 199,813 0.52% N 2.254 TAMOXIFEN | L2B1 TAMOXILON 20 MG TABLET 10 TAMOXILON CELON LABS 20 MG 10 TABLET 19.81 91,364 0.24% N 1.985 TAMOXIFEN | L2B1 CYTOTAM 20 MG TABLET 10 CYTOTAM CIPLA LTD. 20 MG 10 TABLET 18.00 2,408,778 6.23% Y 1.80 1.806 TAMOXIFEN | L2B1 TAMOXIFEN 20 MG TABLET 10 TAMOXIFEN FRESENIUS KABI INDIA PVT LTD 20 MG 10 TABLET 26.95 853,668 2.21% Y 2.70 2.647 TAMOXIFEN | L2B1 TAMTERO 20 MG TABLET 10 TAMTERO HETERO HEALTHCARE LTD 20 MG 10 TABLET 23.02 3,844 0.01% N 2.308 TAMOXIFEN | L2B1 MAMOFEN 20 MG TABLET 10 MAMOFEN KHANDELWAL LABORATORIES LTD 20 MG 10 TABLET 34.80 19,974,479 51.65% Y 3.48 2.649 TAMOXIFEN | L2B1 VALODEX 20 MG TABLET 10 VALODEX SAMARTH LIFE SCIENCES PVT LTD 20 MG 10 TABLET 24.85 1,069,317 2.77% Y 2.49 2.49

???? ?j �2013 ??�????� 4 ??�� ¡� , \?è��2015 ??�] ?? °?�??�] ??i?� , ? Uã?� ?� ??? ??Computation of Ceiling Price based on Aug-2015 Data under Para 4 of DPCO 2013
Number of Companies consisting of Market Share of 1% & Above 226.1.4 MISOPROSTOL 100 MCG TABLET Per Tablet Sum of MAT value considered for price calculation (in Lakhs) 76.76
Sum of PTR per unit considered for price calculation 21.49Number of Packs considered 3Average PTR 7.16Add : 16% Retailer Margin 1.15Ceiling Price (without local taxes) 8.31% Reduction with compared to Highest Price 20.27%WPI Reduction wef 1.4.2016 @ -2.7105% 0.23Final Ceiling Price (without local taxes) 8.08
Minimum Price (Rs.) 7.63S.O. 619(E) dated 26.02.2015 Maximum Price (Rs.) 8.98Ceiling Price as per NLEM 2011 10.42 Per Tablet Average of all considered (Rs.) 8.31Derived PTR 8.98 Ceiling Price (Rs.) 9.64
TOTAL MAT 8,124,237 100%S. No.
Unique No. as per NLEM
Composition as per NLEM
??? � o��??Pack Description
? ??BRAND
?????Company
Strength Pack Size
Unit PTR (Rs.) MAT (Rs.) SKU wise MAT %
Qualify (Y/N)Y=YesN=No
Price per Unit (Rs.)
Price per Unit (Rs.) Considered
1 26.1.4 MISOPROSTOL | A2E1 ZITOTEC 100 MCG TABLET 4 ZITOTEC SUN PHARMA LABORATORIES LTD. 100 MCG 4 TABLET 35.88 43,809 0.54% N 8.972 MISOPROSTOL | A2E1 ZITOTEC 100 MCG TABLET 2 ZITOTEC SUN PHARMA LABORATORIES LTD. 100 MCG 2 TABLET 15.25 98,272 1.21% Y 7.63 7.633 MISOPROSTOL | A2E1 CYTOLOG 100 MCG TABLET 4CYTOLOG ZYDUS CADILA 100 MCG 4 TABLET 64.83 7,577,726 93.27% Y 16.21 8.98
???? ?j �2013 ??�????� 4 ??�� ¡� , \?è��2015 ??�] ?? °?�??�] ??i?� , ? Uã?� ?� ??? ??Computation of Ceiling Price based on Aug-2015 Data under Para 4 of DPCO 2013
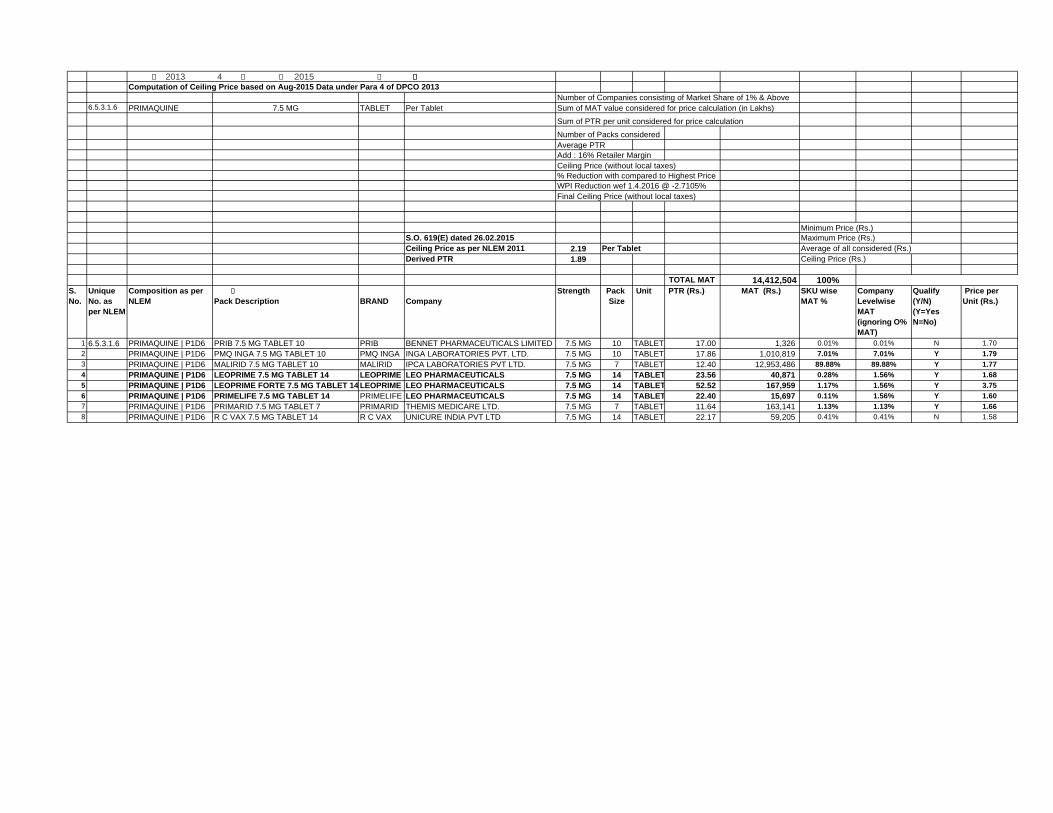
Number of Companies consisting of Market Share of 1% & Above 6.5.3.1.6 PRIMAQUINE 7.5 MG TABLET Per Tablet Sum of MAT value considered for price calculation (in Lakhs)
Sum of PTR per unit considered for price calculation
Number of Packs consideredAverage PTRAdd : 16% Retailer MarginCeiling Price (without local taxes)% Reduction with compared to Highest PriceWPI Reduction wef 1.4.2016 @ -2.7105%Final Ceiling Price (without local taxes)
Minimum Price (Rs.)S.O. 619(E) dated 26.02.2015 Maximum Price (Rs.)Ceiling Price as per NLEM 2011 2.19 Per Tablet Average of all considered (Rs.)Derived PTR 1.89 Ceiling Price (Rs.)
TOTAL MAT 14,412,504 100%S. No.
Unique No. as per NLEM
Composition as per NLEM
??? � o��??Pack Description
? ??BRAND
?????Company
Strength Pack Size
Unit PTR (Rs.) MAT (Rs.) SKU wise MAT %
Company Levelwise MAT (ignoring O% MAT)
Qualify (Y/N)(Y=YesN=No)
Price per Unit (Rs.)
1 6.5.3.1.6 PRIMAQUINE | P1D6 PRIB 7.5 MG TABLET 10 PRIB BENNET PHARMACEUTICALS LIMITED 7.5 MG 10 TABLET 17.00 1,326 0.01% 0.01% N 1.702 PRIMAQUINE | P1D6 PMQ INGA 7.5 MG TABLET 10 PMQ INGA INGA LABORATORIES PVT. LTD. 7.5 MG 10 TABLET 17.86 1,010,819 7.01% 7.01% Y 1.793 PRIMAQUINE | P1D6 MALIRID 7.5 MG TABLET 10 MALIRID IPCA LABORATORIES PVT LTD. 7.5 MG 7 TABLET 12.40 12,953,486 89.88% 89.88% Y 1.774 PRIMAQUINE | P1D6 LEOPRIME 7.5 MG TABLET 14 LEOPRIME LEO PHARMACEUTICALS 7.5 MG 14 TABLET 23.56 40,871 0.28% 1.56% Y 1.685 PRIMAQUINE | P1D6 LEOPRIME FORTE 7.5 MG TABLET 14 LEOPRIME LEO PHARMACEUTICALS 7.5 MG 14 TABLET 52.52 167,959 1.17% 1.56% Y 3.756 PRIMAQUINE | P1D6 PRIMELIFE 7.5 MG TABLET 14 PRIMELIFE LEO PHARMACEUTICALS 7.5 MG 14 TABLET 22.40 15,697 0.11% 1.56% Y 1.607 PRIMAQUINE | P1D6 PRIMARID 7.5 MG TABLET 7 PRIMARID THEMIS MEDICARE LTD. 7.5 MG 7 TABLET 11.64 163,141 1.13% 1.13% Y 1.668 PRIMAQUINE | P1D6 R C VAX 7.5 MG TABLET 14 R C VAX UNICURE INDIA PVT LTD 7.5 MG 14 TABLET 22.17 59,205 0.41% 0.41% N 1.58
???? ?j �2013 ??�????� 4 ??�� ¡� , \?è��2015 ??�] ?? °?�??�] ??i?� , ? Uã?� ?� ??? ??Computation of Ceiling Price based on Aug-2015 Data under Para 4 of DPCO 2013
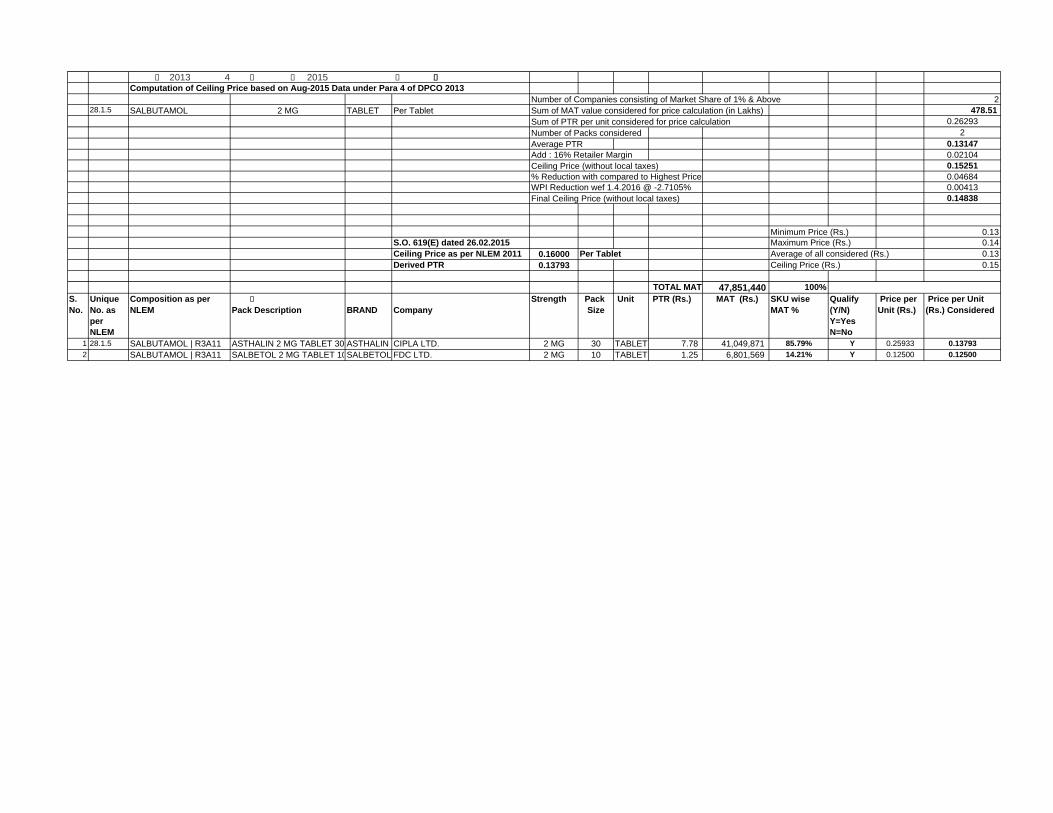
Number of Companies consisting of Market Share of 1% & Above 228.1.5 SALBUTAMOL 2 MG TABLET Per Tablet Sum of MAT value considered for price calculation (in Lakhs) 478.51
Sum of PTR per unit considered for price calculation 0.26293Number of Packs considered 2Average PTR 0.13147Add : 16% Retailer Margin 0.02104Ceiling Price (without local taxes) 0.15251% Reduction with compared to Highest Price 0.04684WPI Reduction wef 1.4.2016 @ -2.7105% 0.00413Final Ceiling Price (without local taxes) 0.14838
Minimum Price (Rs.) 0.13S.O. 619(E) dated 26.02.2015 Maximum Price (Rs.) 0.14Ceiling Price as per NLEM 2011 0.16000 Per Tablet Average of all considered (Rs.) 0.13Derived PTR 0.13793 Ceiling Price (Rs.) 0.15
TOTAL MAT 47,851,440 100%S. No.
Unique No. as per NLEM
Composition as per NLEM
??? � o��??Pack Description
? ??BRAND
?????Company
Strength Pack Size
Unit PTR (Rs.) MAT (Rs.) SKU wise MAT %
Qualify (Y/N)Y=YesN=No
Price per Unit (Rs.)
Price per Unit (Rs.) Considered
1 28.1.5 SALBUTAMOL | R3A11 ASTHALIN 2 MG TABLET 30 ASTHALIN CIPLA LTD. 2 MG 30 TABLET 7.78 41,049,871 85.79% Y 0.25933 0.137932 SALBUTAMOL | R3A11 SALBETOL 2 MG TABLET 10SALBETOL FDC LTD. 2 MG 10 TABLET 1.25 6,801,569 14.21% Y 0.12500 0.12500
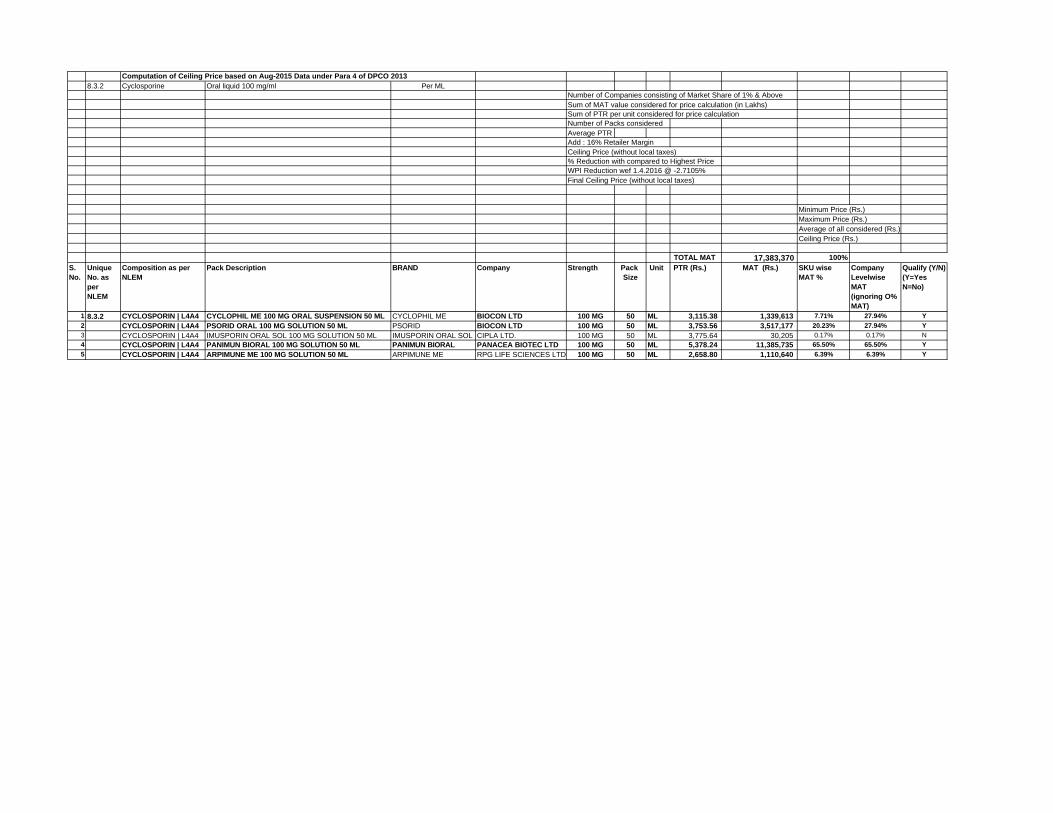
Computation of Ceiling Price based on Aug-2015 Data under Para 4 of DPCO 20138.3.2 Cyclosporine Oral liquid 100 mg/ml Per ML
Number of Companies consisting of Market Share of 1% & Above Sum of MAT value considered for price calculation (in Lakhs)Sum of PTR per unit considered for price calculationNumber of Packs consideredAverage PTRAdd : 16% Retailer MarginCeiling Price (without local taxes)% Reduction with compared to Highest PriceWPI Reduction wef 1.4.2016 @ -2.7105%Final Ceiling Price (without local taxes)
Minimum Price (Rs.)Maximum Price (Rs.)Average of all considered (Rs.)Ceiling Price (Rs.)
TOTAL MAT 17,383,370 100%S. No.
Unique No. as per NLEM
Composition as per NLEM
Pack Description BRAND Company Strength Pack Size
Unit PTR (Rs.) MAT (Rs.) SKU wise MAT %
Company Levelwise MAT (ignoring O% MAT)
Qualify (Y/N)(Y=YesN=No)
1 8.3.2 CYCLOSPORIN | L4A4 CYCLOPHIL ME 100 MG ORAL SUSPENSION 50 ML CYCLOPHIL ME BIOCON LTD 100 MG 50 ML 3,115.38 1,339,613 7.71% 27.94% Y2 CYCLOSPORIN | L4A4 PSORID ORAL 100 MG SOLUTION 50 ML PSORID BIOCON LTD 100 MG 50 ML 3,753.56 3,517,177 20.23% 27.94% Y3 CYCLOSPORIN | L4A4 IMUSPORIN ORAL SOL 100 MG SOLUTION 50 ML IMUSPORIN ORAL SOL CIPLA LTD. 100 MG 50 ML 3,775.64 30,205 0.17% 0.17% N4 CYCLOSPORIN | L4A4 PANIMUN BIORAL 100 MG SOLUTION 50 ML PANIMUN BIORAL PANACEA BIOTEC LTD 100 MG 50 ML 5,378.24 11,385,735 65.50% 65.50% Y5 CYCLOSPORIN | L4A4 ARPIMUNE ME 100 MG SOLUTION 50 ML ARPIMUNE ME RPG LIFE SCIENCES LTD. 100 MG 50 ML 2,658.80 1,110,640 6.39% 6.39% Y
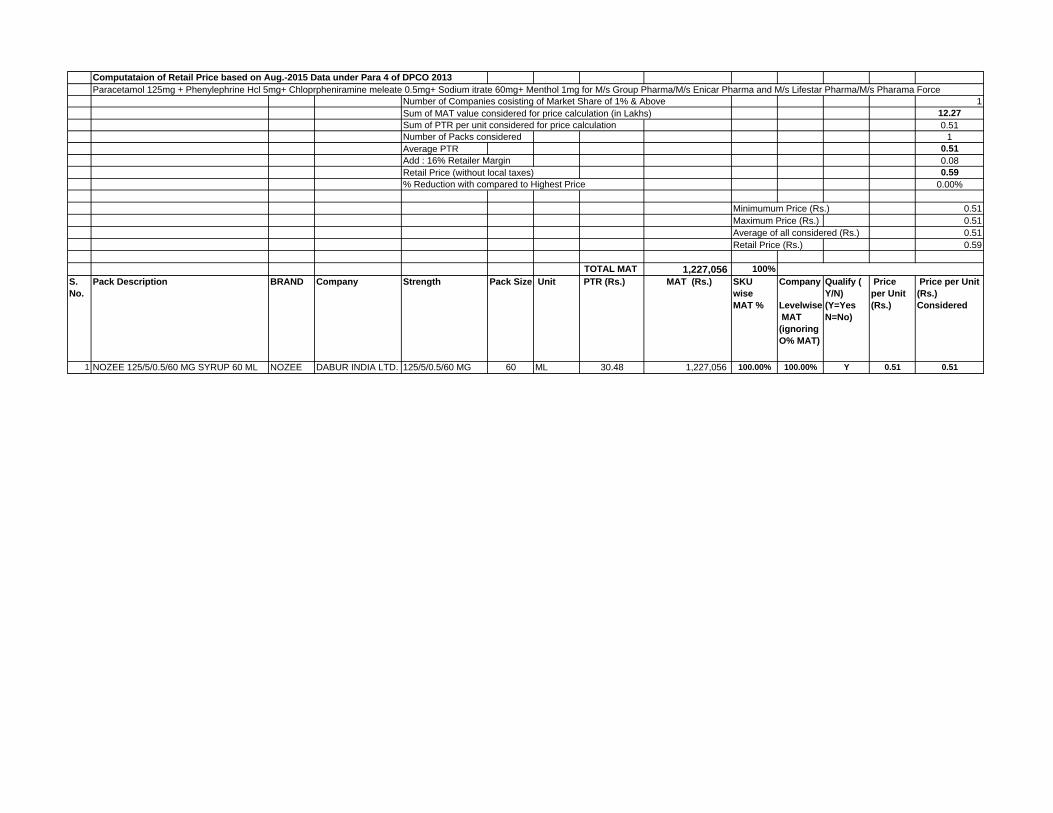
Computataion of Retail Price based on Aug.-2015 Data under Para 4 of DPCO 2013Paracetamol 125mg + Phenylephrine Hcl 5mg+ Chloprpheniramine meleate 0.5mg+ Sodium itrate 60mg+ Menthol 1mg for M/s Group Pharma/M/s Enicar Pharma and M/s Lifestar Pharma/M/s Pharama Force
Number of Companies cosisting of Market Share of 1% & Above 1Sum of MAT value considered for price calculation (in Lakhs) 12.27Sum of PTR per unit considered for price calculation 0.51Number of Packs considered 1Average PTR 0.51Add : 16% Retailer Margin 0.08Retail Price (without local taxes) 0.59% Reduction with compared to Highest Price 0.00%
Minimumum Price (Rs.) 0.51Maximum Price (Rs.) 0.51Average of all considered (Rs.) 0.51Retail Price (Rs.) 0.59
TOTAL MAT 1,227,056 100%S. No.
Pack Description BRAND Company Strength Pack Size Unit PTR (Rs.) MAT (Rs.) SKU wise MAT %
Company Levelwise MAT (ignoring O% MAT)
Qualify ( Y/N)(Y=YesN=No)
Price per Unit (Rs.)
Price per Unit (Rs.) Considered
1 NOZEE 125/5/0.5/60 MG SYRUP 60 ML NOZEE DABUR INDIA LTD. 125/5/0.5/60 MG 60 ML 30.48 1,227,056 100.00% 100.00% Y 0.51 0.51
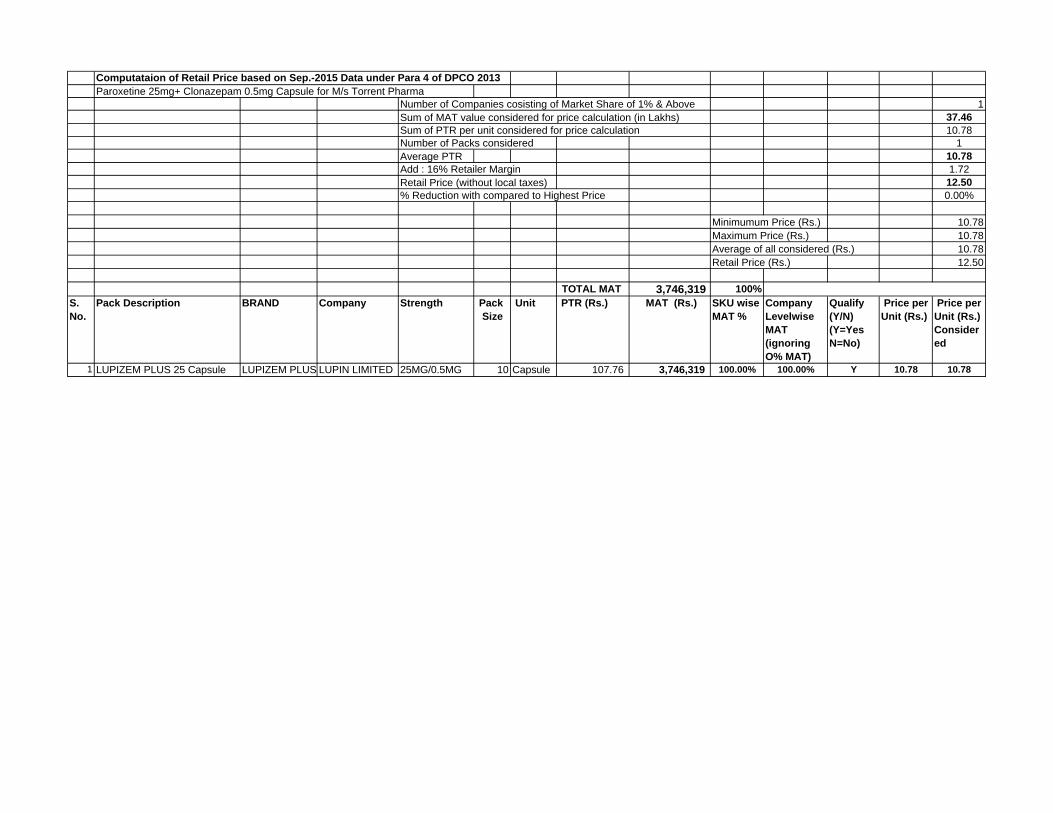
Computataion of Retail Price based on Sep.-2015 Data under Para 4 of DPCO 2013Paroxetine 25mg+ Clonazepam 0.5mg Capsule for M/s Torrent Pharma
Number of Companies cosisting of Market Share of 1% & Above 1Sum of MAT value considered for price calculation (in Lakhs) 37.46Sum of PTR per unit considered for price calculation 10.78Number of Packs considered 1Average PTR 10.78Add : 16% Retailer Margin 1.72Retail Price (without local taxes) 12.50% Reduction with compared to Highest Price 0.00%
Minimumum Price (Rs.) 10.78Maximum Price (Rs.) 10.78Average of all considered (Rs.) 10.78Retail Price (Rs.) 12.50
TOTAL MAT 3,746,319 100%S. No.
Pack Description BRAND Company Strength Pack Size
Unit PTR (Rs.) MAT (Rs.) SKU wise MAT %
Company Levelwise MAT (ignoring O% MAT)
Qualify (Y/N)(Y=YesN=No)
Price per Unit (Rs.)
Price per Unit (Rs.) Considered
1 LUPIZEM PLUS 25 Capsule LUPIZEM PLUS LUPIN LIMITED 25MG/0.5MG 10 Capsule 107.76 3,746,319 100.00% 100.00% Y 10.78 10.78
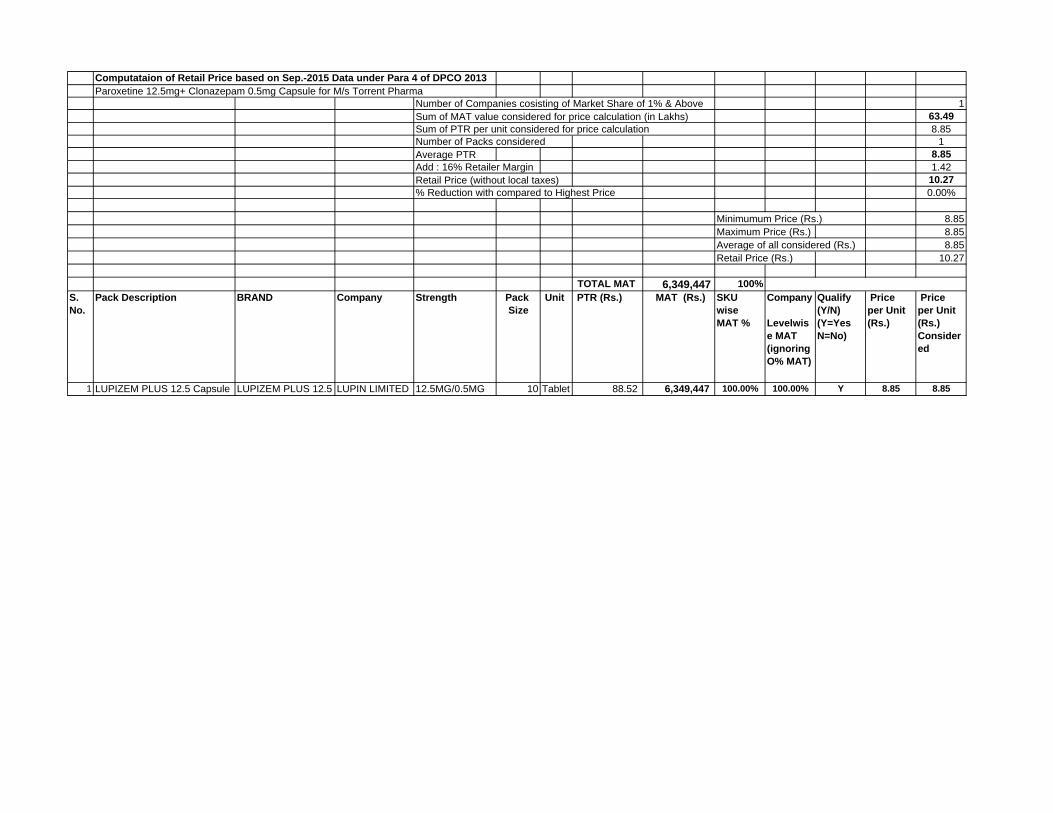
Computataion of Retail Price based on Sep.-2015 Data under Para 4 of DPCO 2013Paroxetine 12.5mg+ Clonazepam 0.5mg Capsule for M/s Torrent Pharma
Number of Companies cosisting of Market Share of 1% & Above 1Sum of MAT value considered for price calculation (in Lakhs) 63.49Sum of PTR per unit considered for price calculation 8.85Number of Packs considered 1Average PTR 8.85Add : 16% Retailer Margin 1.42Retail Price (without local taxes) 10.27% Reduction with compared to Highest Price 0.00%
Minimumum Price (Rs.) 8.85Maximum Price (Rs.) 8.85Average of all considered (Rs.) 8.85Retail Price (Rs.) 10.27
TOTAL MAT 6,349,447 100%S. No.
Pack Description BRAND Company Strength Pack Size
Unit PTR (Rs.) MAT (Rs.) SKU wise MAT %
Company Levelwise MAT (ignoring O% MAT)
Qualify (Y/N)(Y=YesN=No)
Price per Unit (Rs.)
Price per Unit (Rs.) Considered
1 LUPIZEM PLUS 12.5 Capsule LUPIZEM PLUS 12.5 LUPIN LIMITED 12.5MG/0.5MG 10 Tablet 88.52 6,349,447 100.00% 100.00% Y 8.85 8.85
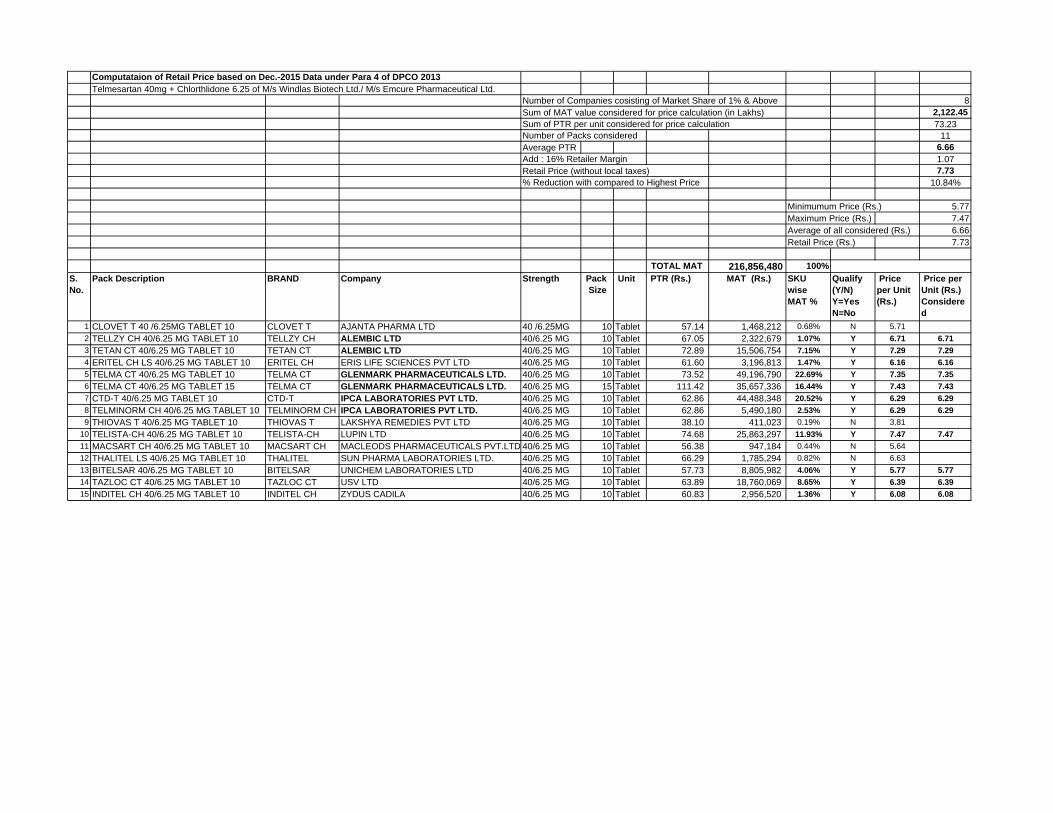
Computataion of Retail Price based on Dec.-2015 Data under Para 4 of DPCO 2013Telmesartan 40mg + Chlorthlidone 6.25 of M/s Windlas Biotech Ltd./ M/s Emcure Pharmaceutical Ltd.
Number of Companies cosisting of Market Share of 1% & Above 8Sum of MAT value considered for price calculation (in Lakhs) 2,122.45 Sum of PTR per unit considered for price calculation 73.23Number of Packs considered 11Average PTR 6.66Add : 16% Retailer Margin 1.07Retail Price (without local taxes) 7.73% Reduction with compared to Highest Price 10.84%
Minimumum Price (Rs.) 5.77Maximum Price (Rs.) 7.47Average of all considered (Rs.) 6.66Retail Price (Rs.) 7.73
TOTAL MAT 216,856,480 100%S. No.
Pack Description BRAND Company Strength Pack Size
Unit PTR (Rs.) MAT (Rs.) SKU wise MAT %
Qualify (Y/N)Y=YesN=No
Price per Unit (Rs.)
Price per Unit (Rs.) Considered
1 CLOVET T 40 /6.25MG TABLET 10 CLOVET T AJANTA PHARMA LTD 40 /6.25MG 10 Tablet 57.14 1,468,212 0.68% N 5.712 TELLZY CH 40/6.25 MG TABLET 10 TELLZY CH ALEMBIC LTD 40/6.25 MG 10 Tablet 67.05 2,322,679 1.07% Y 6.71 6.713 TETAN CT 40/6.25 MG TABLET 10 TETAN CT ALEMBIC LTD 40/6.25 MG 10 Tablet 72.89 15,506,754 7.15% Y 7.29 7.294 ERITEL CH LS 40/6.25 MG TABLET 10 ERITEL CH ERIS LIFE SCIENCES PVT LTD 40/6.25 MG 10 Tablet 61.60 3,196,813 1.47% Y 6.16 6.165 TELMA CT 40/6.25 MG TABLET 10 TELMA CT GLENMARK PHARMACEUTICALS LTD. 40/6.25 MG 10 Tablet 73.52 49,196,790 22.69% Y 7.35 7.356 TELMA CT 40/6.25 MG TABLET 15 TELMA CT GLENMARK PHARMACEUTICALS LTD. 40/6.25 MG 15 Tablet 111.42 35,657,336 16.44% Y 7.43 7.437 CTD-T 40/6.25 MG TABLET 10 CTD-T IPCA LABORATORIES PVT LTD. 40/6.25 MG 10 Tablet 62.86 44,488,348 20.52% Y 6.29 6.298 TELMINORM CH 40/6.25 MG TABLET 10 TELMINORM CH IPCA LABORATORIES PVT LTD. 40/6.25 MG 10 Tablet 62.86 5,490,180 2.53% Y 6.29 6.299 THIOVAS T 40/6.25 MG TABLET 10 THIOVAS T LAKSHYA REMEDIES PVT LTD 40/6.25 MG 10 Tablet 38.10 411,023 0.19% N 3.81
10 TELISTA-CH 40/6.25 MG TABLET 10 TELISTA-CH LUPIN LTD 40/6.25 MG 10 Tablet 74.68 25,863,297 11.93% Y 7.47 7.4711 MACSART CH 40/6.25 MG TABLET 10 MACSART CH MACLEODS PHARMACEUTICALS PVT.LTD 40/6.25 MG 10 Tablet 56.38 947,184 0.44% N 5.6412 THALITEL LS 40/6.25 MG TABLET 10 THALITEL SUN PHARMA LABORATORIES LTD. 40/6.25 MG 10 Tablet 66.29 1,785,294 0.82% N 6.6313 BITELSAR 40/6.25 MG TABLET 10 BITELSAR UNICHEM LABORATORIES LTD 40/6.25 MG 10 Tablet 57.73 8,805,982 4.06% Y 5.77 5.7714 TAZLOC CT 40/6.25 MG TABLET 10 TAZLOC CT USV LTD 40/6.25 MG 10 Tablet 63.89 18,760,069 8.65% Y 6.39 6.3915 INDITEL CH 40/6.25 MG TABLET 10 INDITEL CH ZYDUS CADILA 40/6.25 MG 10 Tablet 60.83 2,956,520 1.36% Y 6.08 6.08
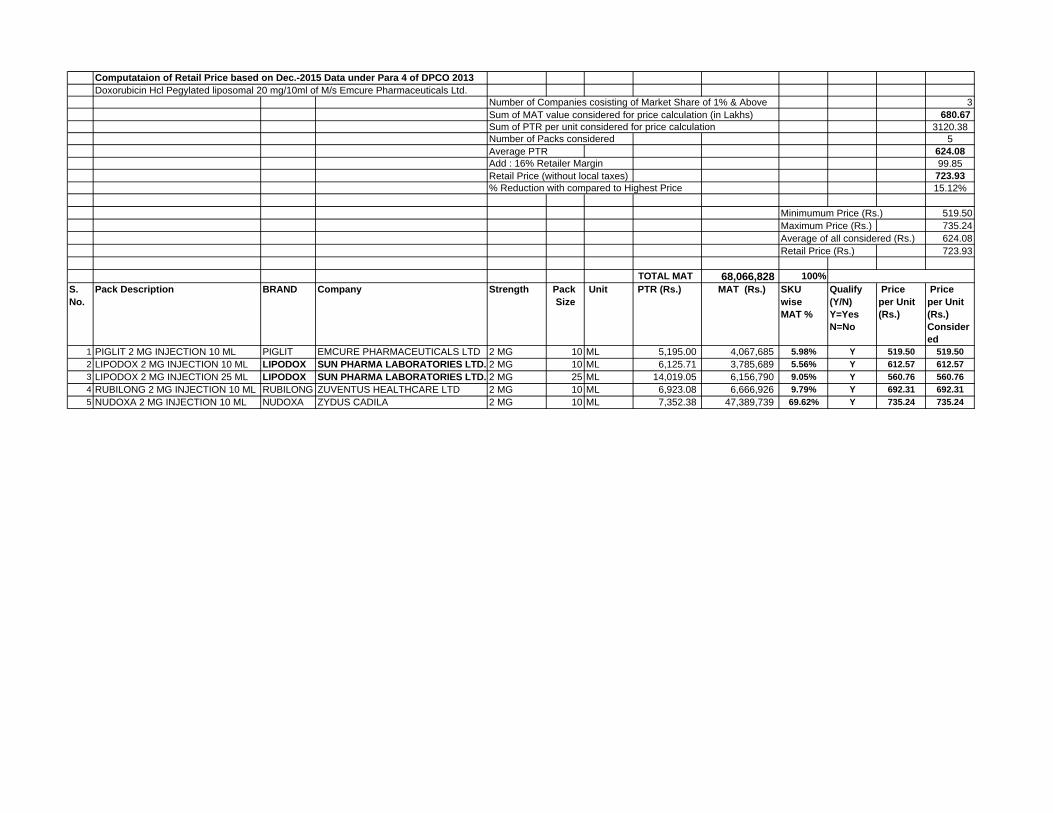
Computataion of Retail Price based on Dec.-2015 Data under Para 4 of DPCO 2013Doxorubicin Hcl Pegylated liposomal 20 mg/10ml of M/s Emcure Pharmaceuticals Ltd.
Number of Companies cosisting of Market Share of 1% & Above 3Sum of MAT value considered for price calculation (in Lakhs) 680.67 Sum of PTR per unit considered for price calculation 3120.38Number of Packs considered 5Average PTR 624.08Add : 16% Retailer Margin 99.85Retail Price (without local taxes) 723.93% Reduction with compared to Highest Price 15.12%
Minimumum Price (Rs.) 519.50Maximum Price (Rs.) 735.24Average of all considered (Rs.) 624.08Retail Price (Rs.) 723.93
TOTAL MAT 68,066,828 100%S. No.
Pack Description BRAND Company Strength Pack Size
Unit PTR (Rs.) MAT (Rs.) SKU wise MAT %
Qualify (Y/N)Y=YesN=No
Price per Unit (Rs.)
Price per Unit (Rs.) Considered
1 PIGLIT 2 MG INJECTION 10 ML PIGLIT EMCURE PHARMACEUTICALS LTD 2 MG 10 ML 5,195.00 4,067,685 5.98% Y 519.50 519.502 LIPODOX 2 MG INJECTION 10 ML LIPODOX SUN PHARMA LABORATORIES LTD. 2 MG 10 ML 6,125.71 3,785,689 5.56% Y 612.57 612.573 LIPODOX 2 MG INJECTION 25 ML LIPODOX SUN PHARMA LABORATORIES LTD. 2 MG 25 ML 14,019.05 6,156,790 9.05% Y 560.76 560.764 RUBILONG 2 MG INJECTION 10 ML RUBILONG ZUVENTUS HEALTHCARE LTD 2 MG 10 ML 6,923.08 6,666,926 9.79% Y 692.31 692.315 NUDOXA 2 MG INJECTION 10 ML NUDOXA ZYDUS CADILA 2 MG 10 ML 7,352.38 47,389,739 69.62% Y 735.24 735.24
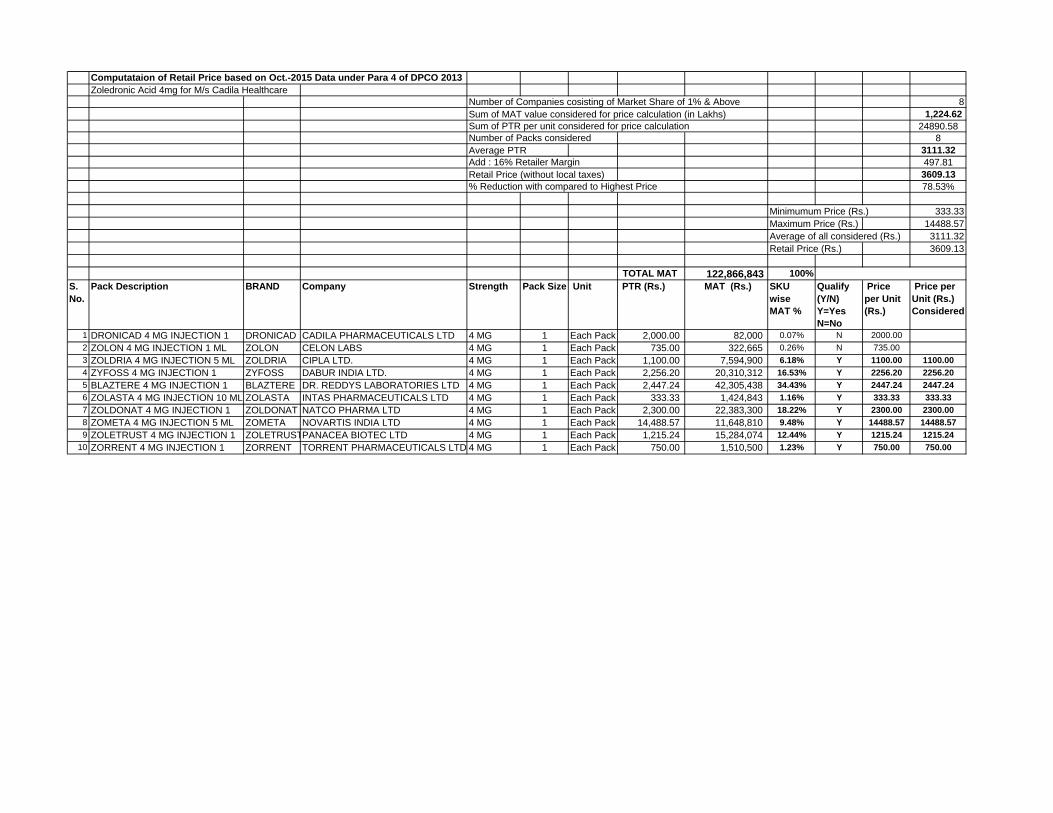
Computataion of Retail Price based on Oct.-2015 Data under Para 4 of DPCO 2013Zoledronic Acid 4mg for M/s Cadila Healthcare
Number of Companies cosisting of Market Share of 1% & Above 8Sum of MAT value considered for price calculation (in Lakhs) 1,224.62 Sum of PTR per unit considered for price calculation 24890.58Number of Packs considered 8Average PTR 3111.32Add : 16% Retailer Margin 497.81Retail Price (without local taxes) 3609.13% Reduction with compared to Highest Price 78.53%
Minimumum Price (Rs.) 333.33Maximum Price (Rs.) 14488.57Average of all considered (Rs.) 3111.32Retail Price (Rs.) 3609.13
TOTAL MAT 122,866,843 100%S. No.
Pack Description BRAND Company Strength Pack Size Unit PTR (Rs.) MAT (Rs.) SKU wise MAT %
Qualify (Y/N)Y=YesN=No
Price per Unit (Rs.)
Price per Unit (Rs.) Considered
1 DRONICAD 4 MG INJECTION 1 DRONICAD CADILA PHARMACEUTICALS LTD 4 MG 1 Each Pack 2,000.00 82,000 0.07% N 2000.002 ZOLON 4 MG INJECTION 1 ML ZOLON CELON LABS 4 MG 1 Each Pack 735.00 322,665 0.26% N 735.003 ZOLDRIA 4 MG INJECTION 5 ML ZOLDRIA CIPLA LTD. 4 MG 1 Each Pack 1,100.00 7,594,900 6.18% Y 1100.00 1100.004 ZYFOSS 4 MG INJECTION 1 ZYFOSS DABUR INDIA LTD. 4 MG 1 Each Pack 2,256.20 20,310,312 16.53% Y 2256.20 2256.205 BLAZTERE 4 MG INJECTION 1 BLAZTERE DR. REDDYS LABORATORIES LTD 4 MG 1 Each Pack 2,447.24 42,305,438 34.43% Y 2447.24 2447.246 ZOLASTA 4 MG INJECTION 10 ML ZOLASTA INTAS PHARMACEUTICALS LTD 4 MG 1 Each Pack 333.33 1,424,843 1.16% Y 333.33 333.337 ZOLDONAT 4 MG INJECTION 1 ZOLDONAT NATCO PHARMA LTD 4 MG 1 Each Pack 2,300.00 22,383,300 18.22% Y 2300.00 2300.008 ZOMETA 4 MG INJECTION 5 ML ZOMETA NOVARTIS INDIA LTD 4 MG 1 Each Pack 14,488.57 11,648,810 9.48% Y 14488.57 14488.579 ZOLETRUST 4 MG INJECTION 1 ZOLETRUSTPANACEA BIOTEC LTD 4 MG 1 Each Pack 1,215.24 15,284,074 12.44% Y 1215.24 1215.24
10 ZORRENT 4 MG INJECTION 1 ZORRENT TORRENT PHARMACEUTICALS LTD.4 MG 1 Each Pack 750.00 1,510,500 1.23% Y 750.00 750.00
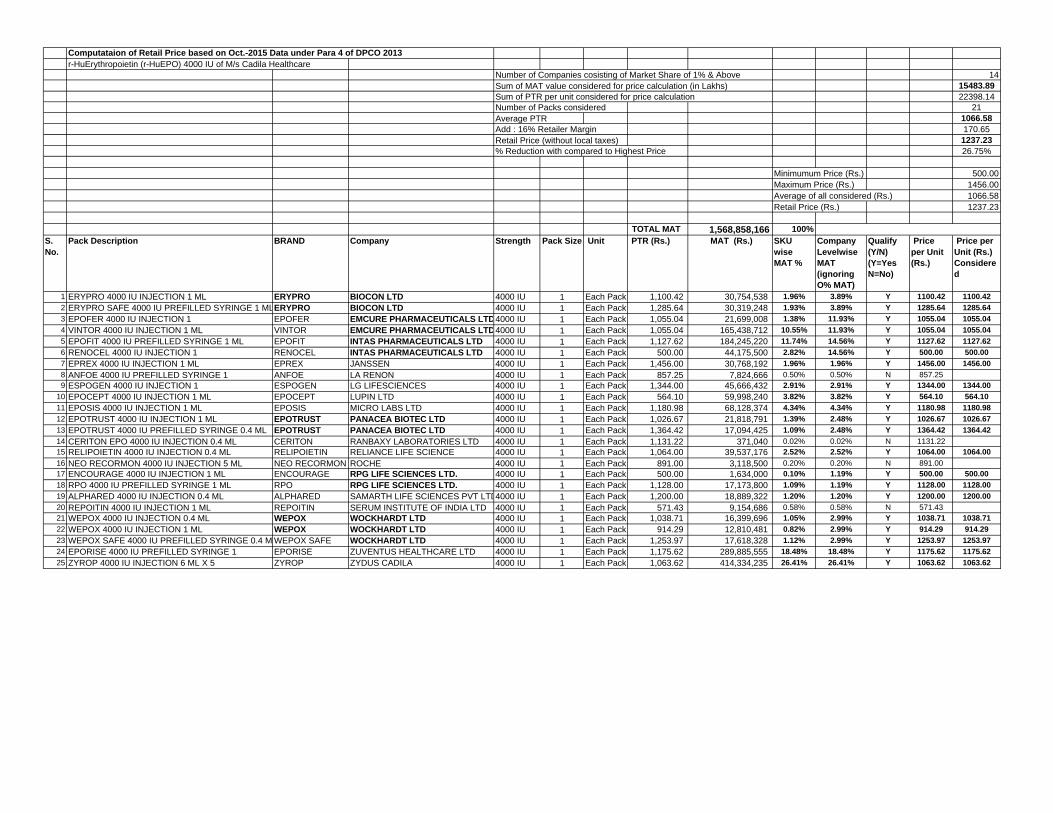
Computataion of Retail Price based on Oct.-2015 Data under Para 4 of DPCO 2013r-HuErythropoietin (r-HuEPO) 4000 IU of M/s Cadila Healthcare
Number of Companies cosisting of Market Share of 1% & Above 14Sum of MAT value considered for price calculation (in Lakhs) 15483.89Sum of PTR per unit considered for price calculation 22398.14Number of Packs considered 21Average PTR 1066.58Add : 16% Retailer Margin 170.65Retail Price (without local taxes) 1237.23% Reduction with compared to Highest Price 26.75%
Minimumum Price (Rs.) 500.00Maximum Price (Rs.) 1456.00Average of all considered (Rs.) 1066.58Retail Price (Rs.) 1237.23
TOTAL MAT 1,568,858,166 100%S. No.
Pack Description BRAND Company Strength Pack Size Unit PTR (Rs.) MAT (Rs.) SKU wise MAT %
Company Levelwise MAT (ignoring O% MAT)
Qualify (Y/N)(Y=YesN=No)
Price per Unit (Rs.)
Price per Unit (Rs.) Considered
1 ERYPRO 4000 IU INJECTION 1 ML ERYPRO BIOCON LTD 4000 IU 1 Each Pack 1,100.42 30,754,538 1.96% 3.89% Y 1100.42 1100.422 ERYPRO SAFE 4000 IU PREFILLED SYRINGE 1 MLERYPRO BIOCON LTD 4000 IU 1 Each Pack 1,285.64 30,319,248 1.93% 3.89% Y 1285.64 1285.643 EPOFER 4000 IU INJECTION 1 EPOFER EMCURE PHARMACEUTICALS LTD4000 IU 1 Each Pack 1,055.04 21,699,008 1.38% 11.93% Y 1055.04 1055.044 VINTOR 4000 IU INJECTION 1 ML VINTOR EMCURE PHARMACEUTICALS LTD4000 IU 1 Each Pack 1,055.04 165,438,712 10.55% 11.93% Y 1055.04 1055.045 EPOFIT 4000 IU PREFILLED SYRINGE 1 ML EPOFIT INTAS PHARMACEUTICALS LTD 4000 IU 1 Each Pack 1,127.62 184,245,220 11.74% 14.56% Y 1127.62 1127.626 RENOCEL 4000 IU INJECTION 1 RENOCEL INTAS PHARMACEUTICALS LTD 4000 IU 1 Each Pack 500.00 44,175,500 2.82% 14.56% Y 500.00 500.007 EPREX 4000 IU INJECTION 1 ML EPREX JANSSEN 4000 IU 1 Each Pack 1,456.00 30,768,192 1.96% 1.96% Y 1456.00 1456.008 ANFOE 4000 IU PREFILLED SYRINGE 1 ANFOE LA RENON 4000 IU 1 Each Pack 857.25 7,824,666 0.50% 0.50% N 857.259 ESPOGEN 4000 IU INJECTION 1 ESPOGEN LG LIFESCIENCES 4000 IU 1 Each Pack 1,344.00 45,666,432 2.91% 2.91% Y 1344.00 1344.00
10 EPOCEPT 4000 IU INJECTION 1 ML EPOCEPT LUPIN LTD 4000 IU 1 Each Pack 564.10 59,998,240 3.82% 3.82% Y 564.10 564.1011 EPOSIS 4000 IU INJECTION 1 ML EPOSIS MICRO LABS LTD 4000 IU 1 Each Pack 1,180.98 68,128,374 4.34% 4.34% Y 1180.98 1180.9812 EPOTRUST 4000 IU INJECTION 1 ML EPOTRUST PANACEA BIOTEC LTD 4000 IU 1 Each Pack 1,026.67 21,818,791 1.39% 2.48% Y 1026.67 1026.6713 EPOTRUST 4000 IU PREFILLED SYRINGE 0.4 ML EPOTRUST PANACEA BIOTEC LTD 4000 IU 1 Each Pack 1,364.42 17,094,425 1.09% 2.48% Y 1364.42 1364.4214 CERITON EPO 4000 IU INJECTION 0.4 ML CERITON RANBAXY LABORATORIES LTD 4000 IU 1 Each Pack 1,131.22 371,040 0.02% 0.02% N 1131.2215 RELIPOIETIN 4000 IU INJECTION 0.4 ML RELIPOIETIN RELIANCE LIFE SCIENCE 4000 IU 1 Each Pack 1,064.00 39,537,176 2.52% 2.52% Y 1064.00 1064.0016 NEO RECORMON 4000 IU INJECTION 5 ML NEO RECORMON ROCHE 4000 IU 1 Each Pack 891.00 3,118,500 0.20% 0.20% N 891.0017 ENCOURAGE 4000 IU INJECTION 1 ML ENCOURAGE RPG LIFE SCIENCES LTD. 4000 IU 1 Each Pack 500.00 1,634,000 0.10% 1.19% Y 500.00 500.0018 RPO 4000 IU PREFILLED SYRINGE 1 ML RPO RPG LIFE SCIENCES LTD. 4000 IU 1 Each Pack 1,128.00 17,173,800 1.09% 1.19% Y 1128.00 1128.0019 ALPHARED 4000 IU INJECTION 0.4 ML ALPHARED SAMARTH LIFE SCIENCES PVT LTD4000 IU 1 Each Pack 1,200.00 18,889,322 1.20% 1.20% Y 1200.00 1200.0020 REPOITIN 4000 IU INJECTION 1 ML REPOITIN SERUM INSTITUTE OF INDIA LTD 4000 IU 1 Each Pack 571.43 9,154,686 0.58% 0.58% N 571.4321 WEPOX 4000 IU INJECTION 0.4 ML WEPOX WOCKHARDT LTD 4000 IU 1 Each Pack 1,038.71 16,399,696 1.05% 2.99% Y 1038.71 1038.7122 WEPOX 4000 IU INJECTION 1 ML WEPOX WOCKHARDT LTD 4000 IU 1 Each Pack 914.29 12,810,481 0.82% 2.99% Y 914.29 914.2923 WEPOX SAFE 4000 IU PREFILLED SYRINGE 0.4 MLWEPOX SAFE WOCKHARDT LTD 4000 IU 1 Each Pack 1,253.97 17,618,328 1.12% 2.99% Y 1253.97 1253.9724 EPORISE 4000 IU PREFILLED SYRINGE 1 EPORISE ZUVENTUS HEALTHCARE LTD 4000 IU 1 Each Pack 1,175.62 289,885,555 18.48% 18.48% Y 1175.62 1175.6225 ZYROP 4000 IU INJECTION 6 ML X 5 ZYROP ZYDUS CADILA 4000 IU 1 Each Pack 1,063.62 414,334,235 26.41% 26.41% Y 1063.62 1063.62
Related Documents