BHARATHIDASAN U NIVERSITY TIRUCHIRAPPALLI A PROJECT REPORT ON DETAIL STUDY OF HDFC MUTUAL FUND SUBMITTED FOR THE PARTIAL FULFILLMRNT OF THE REQUIREMENT FOR THE DEGREE OF MBA SUBMITTED BY: HARISH SINGH NEGI REGISTRATION NO.-13295294 MBA-IV SEMESTER SESSION (2013-2015) INTERNAL GUIDE GAURAV GILL

34980370 project-on-hdfc-mutual-fund
Jul 15, 2015
Welcome message from author
This document is posted to help you gain knowledge. Please leave a comment to let me know what you think about it! Share it to your friends and learn new things together.
Transcript

BHARATHIDASAN UNIVERSITY TIRUCHIRAPPALLI
A PROJECT REPORT ON DETAIL STUDY OF
HDFC MUTUAL FUND
SUBMITTED FOR THE PARTIAL FULFILLMRNT
OF THE REQUIREMENT FOR THE DEGREE OF MBA
SUBMITTED BY:
HARISH SINGH NEGI
REGISTRATION NO.-13295294
MBA-IV SEMESTER
SESSION (2013-2015)
INTERNAL GUIDE
GAURAV GILL

BONOFIDE CERTIFICATE
This is to certify that the Report on Project Work titled “RISK RETURN ANALYSIS AND
COMPARATIVE STUDY OF MUTUAL FUNDS” for HDFC Asset Management Company
Ltd. is a bonafide record of the work done by
HARISH SINGH NEGI
Studying in Master of Business Administration in Bharathidasan University Tiruchirappalli
2013-15.
Project Viva-Voce held on.....................
Internal examiner External examiner

EXECUTIVE SUMMARY
The performance evaluation of mutual fund is a vital matter of concern to the fund managers,
investors, and researchers alike. The core competence of the company is to meet objectives
and the needs of the investors and to provide optimum return for their risk. This study tries to
find out the risk and return allied with the mutual funds.
This project paper is segmented into three sections to explore the link between conventional
subjective and statistical approach of Mutual Fund analysis. To start with, the first section
deals with the introductory part of the paper by giving an overview of the Mutual fund
industry and company profile.
This section also talks about the theory of portfolio analysis and the different measures of risk
and return used for the comparison.
The second section details on the need, objective, and the limitations of the study. It also
discusses about the sources and the period for the data collection. It also deals with the data
interpretation and analysis part wherein all the key measures related to risk and return are
done with the interpretation of the results.
In the third section, an attempt is made to analyse and compare the performance of the equity
mutual fund. For this purpose β-value, standard deviation, and risk adjusted performance
measures such as Sharpe ratio, Treynor measure, Jenson Alpha, and Fema measure have been
used.
The portfolio analysis of the selected fund has been done by the measure return for the
holding period.
At the end, it illustrates the suggestions and findings based on the analysis done in the
previous sections and finally it deals with conclusion part.

ACKNOWLEDGEMENT
I take this opportunity to express my deep sense of gratitude to all those who have
contributed significantly by sharing their knowledge and experience in the completion of
this project work. I am greatly obliged to, for providing me with the right kind of
opportunity and facilities to complete this venture.
My first word of gratitude is due to Mr.Sidhartha Chattergee – Branch Manager,
HDFC AMC, Barakhambha Road, my corporate guide, for his kind help and support
and his valuable guidance throughout my project. I am thankful to him for providing me
with necessary insights and helping me out at every single step. I am also thankful to Prof
Gaurav Gill Executive Trainee, the former student of Bharathidasan University
Tiruchirappali, Above all, I express my words of gratitude to HDFC AMC, Allahabad Branch
for proving me with all the knowledge resources and enabling me to pass AMFI-MTUTUAL
FUND (ADVISOR) MODULE; NSE’s CERTIFICATION IN FINANCIAL MARKETS
(NCFM) with 74.5 percentages.
I am extremely thankful to Mr–Gaurav Gill my internal faculty guide under whose able
guidance this project work was carried out. I thank her for her continuous support and
mentoring during the tenure of the project. Finally, I would also like to thank all my dear
friends for their cooperation, advice and encouragement during the long and arduous task of
carrying out the project and preparing this report.
PREFACE

This is the age of technical up gradation. Nothing remains same for a long period every thing
change with a certain span of time. So it is must for every organization to put a birds eye
view on it’s over all functioning.
This report was preparing during practical training of Master of business
administration (M.B.A.) from Bharathidasan University .The student of M.B.A.essentially
required a practical training of 4to6 weeks in any organization. It gives an opportunity to the
student to test their acquired knowledge through practical experiences.
The objective of my study was Risk Return Analysis And Comparative Study Of Mutual Funds “HDFC Asset Management Company Ltd.” I however present this report In all my
modesty to the readers with a faith that it shall serve the causes of subject.
.
PLACE-……….. Harish Singh Negi
DATE…………..
TABLE OF CONTENTS Page No.
Part-I 1-37
Executive Summary Iii
A. Mutual Fund Overview 1-19
1.1 Mutual Fund an Investment Platform 1-2
1.2 Advantages of Mutual Fund 3
1.3 Disadvantage of Investing Through Mutual Funds 4
1.4 Categories of Mutual Fund 4-8
1.5 Investment Strategies 8
1.6 Organisation of Mutual Fund 9-11
1.7 Distribution Channels 12
1.8 HDFC AMC Company Overview 12-19
B. Measuring and Evaluating Mutual Funds Performance 20-37
1.2.1 Purpose of Measuring and Evaluating 20-21
1.2.2 Financial Planning for Investors referring to Mutual Funds 22
1.2.3 Why Has It Become One Of The Largest Financial Instruments? 22-25
1.2.4 Evaluating Portfolio Performance 26
1.2.5 How to Reduce Risk While Investing 26-28
1.2.6 A Study of Portfolio Analysis from The Point Of Fund Manager 28-29
1.2.7 Measures of Risk and Return 29-37
Part-II 38-40
Research Methodology
2.1 Need For the Study 38-39
2.2 Objective of the Study 39
2.3 Limitations of the Study 40
2.4 Data Collection 40
Part-III 41-102
Case Analysis
3.1 Data Interpretation 41-87
3.2 Analysis of the observation 87-97
3.3 Findings 98
3.4 Recommendations 99-100
3.5 Conclusion 101
References 102
PART-I
1.MUTUAL FUND OVERVIEW
1.1 MUTUAL FUND AN INVESTMENT PLATFORM
Mutual fund is an investment company that pools money from small investors and
invests in a variety of securities, such as stocks, bonds and money market instruments. Most
open-end Mutual funds stand ready to buy back (redeem) its shares at their current net asset
value, which depends on the total market value of the fund's investment portfolio at the
time of redemption. Most open-end Mutual funds continuously offer new shares to
investors. It is also known as an open-end investment company, to differentiate it from a
closed-end investment company.

Mutual funds invest pooled cash of many investors to meet the fund's stated investment
objective. Mutual funds stand ready to sell and redeem their shares at any time at the fund’s
current net asset value: total fund assets divided by shares outstanding.
Figure: 1.1
In Simple Words, Mutual fund is a mechanism for pooling the resources by issuing units
to the investors and investing funds in securities in accordance with objectives as
disclosed in offer document.
Investments in securities are spread across a wide cross-section of industries and
sectors and thus the risk is reduced. Diversification reduces the risk because not all stocks
may move in the same direction in the same proportion at the same time. Mutual fund issues
units t o the investors in accordance with quantum of money invested by them.
Investors of Mutual fund are known as unit holders. The profits or losses are shared by the
investors in proportion to their investments. The Mutual funds normally come out with a
number of schemes with different investment objectives which are launched from time to
time.
In India, A Mutual fund is required to be registered with Securities and Exchange Boa
rd of India (SEBI) which regulates securities markets before it can collect funds from the
public.
INVE
STO
R
INVEST THEIR MONEY
INVEST IN VARIETY OF STOCKS/BONDS
MU
TUA
L FU
ND
SH
EMES
M
ARK
ET (F
LUCT
UA
TIO
NS)
PROFIT/LOSS FORM PORTFOLIO OF INVESTMENT
PROFIT/LOSS FROM INDIVIDUAL

In Short , a Mutual fund is a common pool of money in to which investors with
common investment objective place their contributions that are to be invested in
accordance with the state d investment objective of the scheme. The investment manager
would invest the money collected from the investor in to assets that are defined/ permitted
by the stated objective of the scheme. For example, a n equity fund would invest
equity and equity related instruments and a debt fund would invest in bonds, debentures,
gilts etc. Mutual fund is a suitable investment for the common ma n a s it offers an Oporto
unity to invest in a diversified, professionally managed basket of securities at a
relatively low cost.
1.2 ADVANTAGES OF MUTUAL FUND Table:1.1
S. No.
Advantage
Particulars
1.
Portfolio Diversification
Mutual Funds invest in a well-diversified portfolio of securities which enables investor to hold a diversified investment portfolio (whether the amount of investment is big or small).
2.
Professional Management
Fund manager undergoes through various research works and has better investment management skills which ensure higher returns to the investor than what he can manage on his own.
3.Less Risk
Investors acquire a diversified portfolio of securities even with a small investment in a Mutual Fund. The risk in a diversified portfolio is lesser than investing in merely 2 or 3 securities.
4. Low Transaction
Due to the economies of scale (benefits of larger volumes), mutual funds pay lesser transaction costs. These benefits are passed on to the investors.

Costs
5.Liquidity
An investor may not be able to sell some of the shares held by him very easily and quickly, whereas units of a mutual fund are far more liquid.
6.
Choice of Schemes
Mutual funds provide investors with various schemes with different investment objectives. Investors have the option of investing in a scheme having a correlation between its investment objectives and their own financial goals. These schemes further have different plans/options
7.Transparency
Funds provide investors with updated information pertaining to the markets and the schemes. All material facts are disclosed to investors as required by the regulator.
8.Flexibility
Investors also benefit from the convenience and flexibility offered by Mutual Funds. Investors can switch their holdings from a debt scheme to an equity scheme and vice-versa. Option of systematic (at regular intervals) investment and withdrawal is also offered to the investors in most open-end schemes.
9. Safety
Mutual Fund industry is part of a well-regulated investment environment where the interests of the investors are protected by the regulator. All funds are registered with SEBI and complete transparency is forced.
1.3 DISADVANTAGE OF INVESTING THROUGH MUTUAL FUNDS Table:1.2
S. No.
Disadvantage
Particulars
1.
Costs Control Not in the Hands of an Investor
Investor has to pay investment management fees and fund distribution costs as a percentage of the value of his investments (as long as he holds the units), irrespective of the performance of the fund.
2.
No Customized Portfolios
The portfolio of securities in which a fund invests is a decision taken by the fund manager. Investors have no right to interfere in the decision making process of a fund manager, which some investors find as a constraint in achieving their financial objectives.

3.
Difficulty in Selecting a Suitable Fund Scheme
Many investors find it difficult to select one option from the plethora of funds/schemes/plans available. For this, they may have to take advice from financial planners in order to invest in the right fund to achieve their objectives.
1.4 CATEGORIES OF MUTUAL FUND
Figure:1.2
BASED ON THEIR STURCTURE
OPEN ENDED FUNDSCLOSE-ENDED FUNDS
2. BASED ON INVESTMENT OBJECTIVE
EQUITY FUNDS BALANCED FUNDS
DEBT FUNDS
DEBT ORIENTED
LEQUID FUNDSINDEX FUNDS
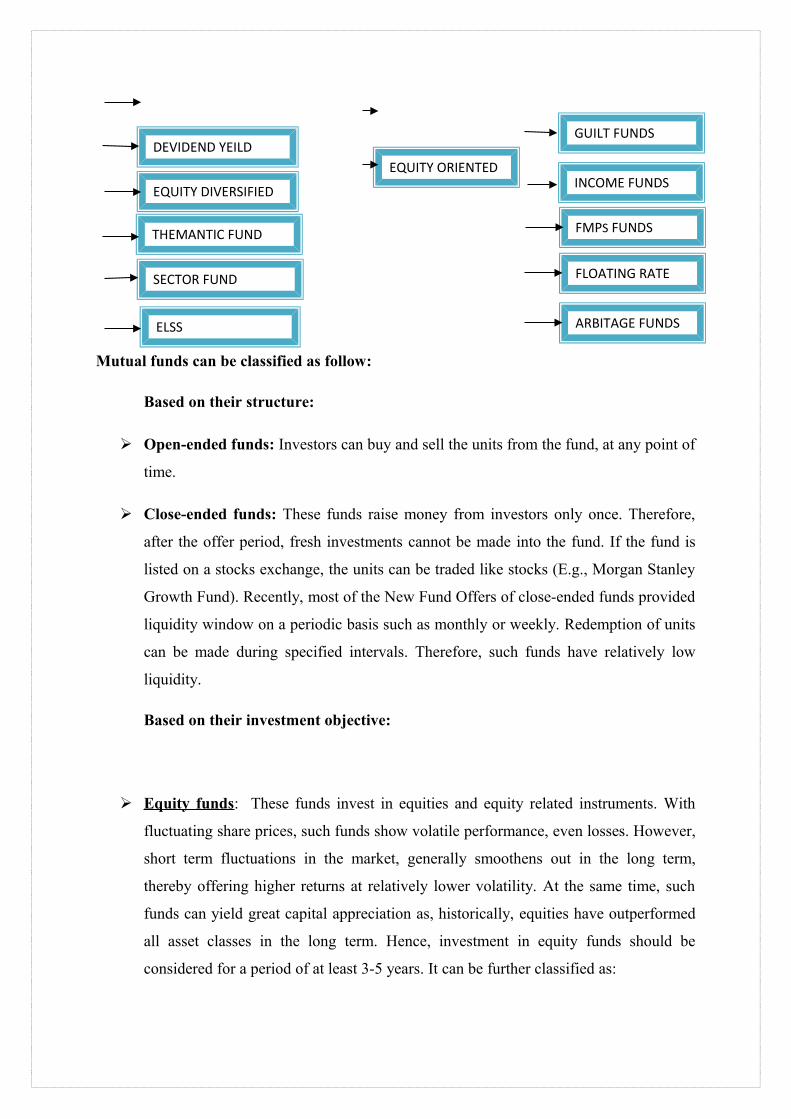
Mutual funds can be classified as follow:
Based on their structure:
Open-ended funds: Investors can buy and sell the units from the fund, at any point of
time.
Close-ended funds: These funds raise money from investors only once. Therefore,
after the offer period, fresh investments cannot be made into the fund. If the fund is
listed on a stocks exchange, the units can be traded like stocks (E.g., Morgan Stanley
Growth Fund). Recently, most of the New Fund Offers of close-ended funds provided
liquidity window on a periodic basis such as monthly or weekly. Redemption of units
can be made during specified intervals. Therefore, such funds have relatively low
liquidity.
Based on their investment objective:
Equity funds : These funds invest in equities and equity related instruments. With
fluctuating share prices, such funds show volatile performance, even losses. However,
short term fluctuations in the market, generally smoothens out in the long term,
thereby offering higher returns at relatively lower volatility. At the same time, such
funds can yield great capital appreciation as, historically, equities have outperformed
all asset classes in the long term. Hence, investment in equity funds should be
considered for a period of at least 3-5 years. It can be further classified as:
DEVIDEND YEILD
EQUITY DIVERSIFIED
THEMANTIC FUND
SECTOR FUND
EQUITY ORIENTED
ARBITAGE FUNDS
FLOATING RATE
FMPS FUNDS
INCOME FUNDS
GUILT FUNDS
ELSS

1. Index funds- In this case a key stock market index, like BSE Sensex or Nifty is tracked.
Their portfolio mirrors the benchmark index in terms of both composition and individual
stock weightages.
2. Equity diversified funds- 100% of the capital is invested in equities spreading across
different sectors and stocks.
3. Dividend yield funds- it is similar to the equity-diversified funds except that they invest in
companies offering high dividend yields.
4. Thematic funds- Invest 100% of the assets in sectors which are related through some
theme.
e.g. -An infrastructure fund invests in power, construction, cements sectors etc.
5. Sector funds- Invest 100% of the capital in a specific sector. e.g. - A banking sector fund
will invest in banking stocks.
6. ELSS- Equity Linked Saving Scheme provides tax benefit to the investors.
Balanced fund : Their investment portfolio includes both debt and equity. As a result,
on the risk-return ladder, they fall between equity and debt funds. Balanced funds are
the ideal mutual funds vehicle for investors who prefer spreading their risk across
various instruments. Following are balanced funds classes:
2 Debt-oriented funds -Investment below 65% in equities.
3 Equity-oriented funds -Invest at least 65% in equities, remaining in debt.
Debt fund : They invest only in debt instruments, and are a good option for investors
averse to idea of taking risk associated with equities. Therefore, they invest
exclusively in fixed-income instruments like bonds, debentures, Government of India
securities; and money market instruments such as certificates of deposit (CD),
commercial paper (CP) and call money. Put your money into any of these debt funds
depending on your investment horizon and needs.
1. Liquid funds- These funds invest 100% in money market instruments, a large
portion being invested in call money market.
2. Gilt funds ST- They invest 100% of their portfolio in government securities of and T-
bills.
3. Floating rate funds - Invest in short-term debt papers. Floaters invest in debt
instruments, which have variable coupon rate.
4. Arbitrage fund- They generate income through arbitrage opportunities due to miss-
pricing between cash market and derivatives market. Funds are allocated to equities,
derivatives and money markets. Higher proportion (around 75%) is put in money
markets, in the absence of arbitrage opportunities.
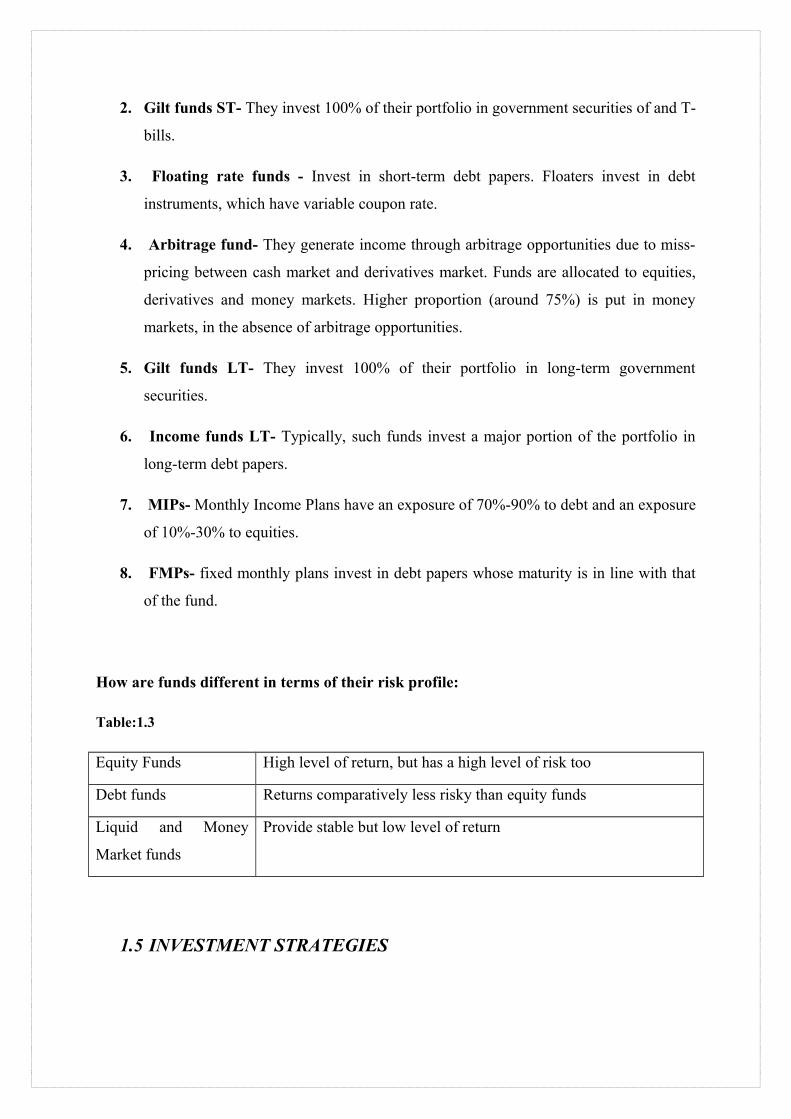
5. Gilt funds LT- They invest 100% of their portfolio in long-term government
securities.
6. Income funds LT- Typically, such funds invest a major portion of the portfolio in
long-term debt papers.
7. MIPs- Monthly Income Plans have an exposure of 70%-90% to debt and an exposure
of 10%-30% to equities.
8. FMPs- fixed monthly plans invest in debt papers whose maturity is in line with that
of the fund.
How are funds different in terms of their risk profile:
Table:1.3
Equity Funds High level of return, but has a high level of risk too
Debt funds Returns comparatively less risky than equity funds
Liquid and Money
Market funds
Provide stable but low level of return
1.5 INVESTMENT STRATEGIES

1. Systematic Investment Plan: Under this, a fixed sum is invested each month on a fixed
date of a month. Payment is made through post-dated cheques or direct debit facilities. The
investor gets fewer units when the NAV is high and more units when the NAV is low. This is
called as the benefit of Rupee Cost Averaging (RCA)
2. Systematic Transfer Plan: Under this, an investor invest in debt-oriented fund and give
instructions to transfer a fixed sum, at a fixed interval, to an equity scheme of the same
mutual fund.
3. Systematic Withdrawal Plan: if someone wishes to withdraw from a mutual fund then he
can withdraw a fixed amount each month.
1.6. ORGANISATION OF MUTUAL FUND:
Figure:1.4
THE STRUCTURE CONSISTS OF:
SPONSOR
Sponsor is the person who acting alone or in combination with another body corporate
establishes a mutual fund. Sponsor must contribute at least 40% of the net worth of the

Investment managed and meet the eligibility criteria prescribed under the Securities and
Exchange Board of India (Mutual Fund) Regulations, 1996. The sponsor is not responsible or
liable for any loss or shortfall resulting from the operation of the Schemes beyond the initial
contribution made by it towards setting up of the Mutual Fund.
TRUST
The Mutual Fund is constituted as a trust in accordance with the provisions of the Indian
Trusts Act, 1882 by the Sponsor. The trust deed is registered under the Indian Registration
Act, 1908.
TRUSTEE
Trustee is usually a company (corporate body) or a Board of Trustees (body of individuals).
The main responsibility of the Trustee is to safeguard the interest of the unit holders and
ensure that the AMC functions in the interest of investors and in accordance with the
Securities and Exchange Board of India (Mutual Funds) Regulations, 1996, the provisions of
the Trust Deed and the Offer Documents of the respective Schemes. At least 2/3rd directors
of the Trustee are independent directors who are not associated with the Sponsor in any
manner.
ASSET MANAGEMENT COMPANY (AMC)
The AMC is appointed by the Trustee as the Investment Manager of the Mutual Fund. The
AMC is required to be approved by the Securities and Exchange Board of India (SEBI) to act
as an asset management company of the Mutual Fund. At least 50% of the directors of the
AMC are independent directors who are not associated with the Sponsor in any manner. The
AMC must have a net worth of at least 10 cores at all times.
REGISTRAR AND TRANSFER AGENT
The AMC if so authorized by the Trust Deed appoints the Registrar and Transfer Agent to the
Mutual Fund. The Registrar processes the application form, redemption requests and
dispatches account statements to the unit holders. The Registrar and Transfer agent also
handles communications with investors and updates investor records.
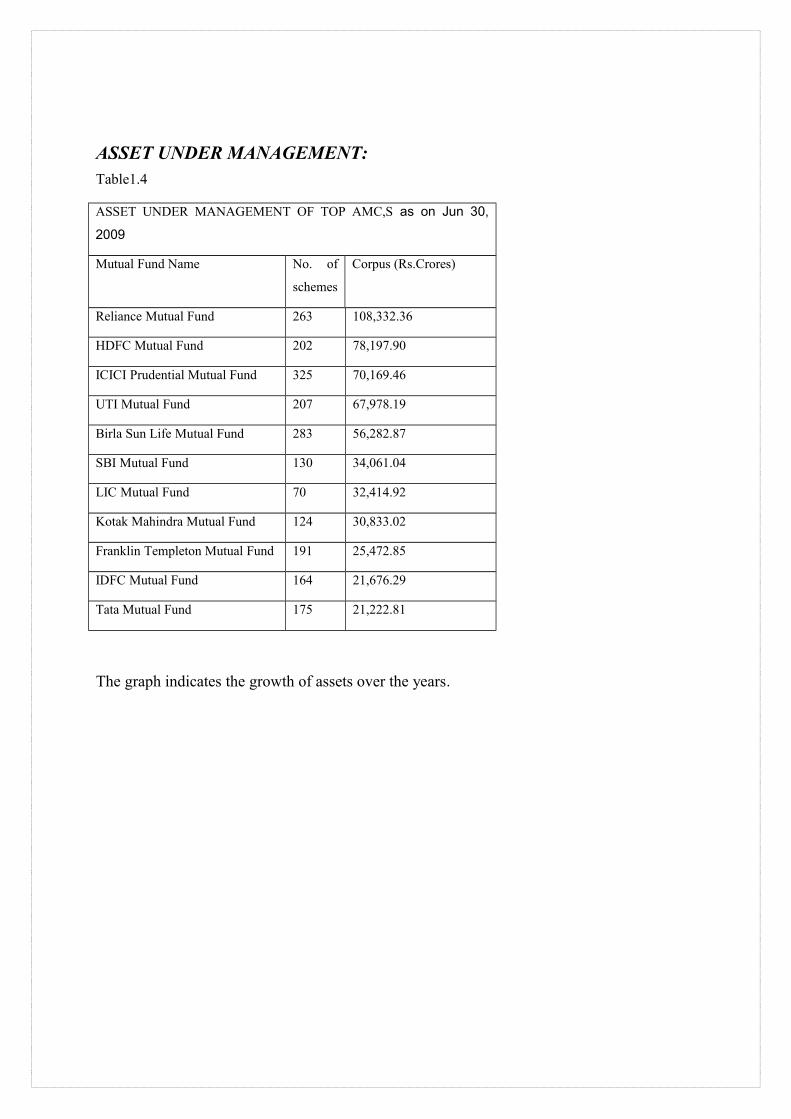
ASSET UNDER MANAGEMENT:Table1.4
ASSET UNDER MANAGEMENT OF TOP AMC,S as on Jun 30,
2009
Mutual Fund Name No. of
schemes
Corpus (Rs.Crores)
Reliance Mutual Fund 263 108,332.36
HDFC Mutual Fund 202 78,197.90
ICICI Prudential Mutual Fund 325 70,169.46
UTI Mutual Fund 207 67,978.19
Birla Sun Life Mutual Fund 283 56,282.87
SBI Mutual Fund 130 34,061.04
LIC Mutual Fund 70 32,414.92
Kotak Mahindra Mutual Fund 124 30,833.02
Franklin Templeton Mutual Fund 191 25,472.85
IDFC Mutual Fund 164 21,676.29
Tata Mutual Fund 175 21,222.81
The graph indicates the growth of assets over the years.

Figure:1.5
1.7 DISTRIBUTION CHANNELS:
Mutual funds posses a very strong distribution channel so that the ultimate customers doesn’t
face any difficulty in the final procurement. The various parties involved in distribution of
mutual funds are:
1. Direct marketing by the AMCs: the forms could be obtained from the AMCs directly.
The investors can approach to the AMCs for the forms. some of the top AMCs of India are;
Reliance ,Birla Sunlife, Tata, SBI magnum, Kotak Mahindra, HDFC, Sundaram, ICICI,
Mirae Assets, Canara Robeco, Lotus India, LIC, UTI etc. whereas foreign AMCs include:
Standard Chartered, Franklin Templeton, Fidelity, JP Morgan, HSBC, DSP Merill Lynch, etc.
2. Broker/ sub broker arrangements: the AMCs can simultaneously go for broker/sub-
broker to popularize their funds. AMCs can enjoy the advantage of large network of these
brokers and sub brokers.

3. Individual agents, Banks, NBFC: investors can procure the funds through individual
agents, independent brokers, banks and several non- banking financial corporations too,
whichever he finds convenient for him.
1.8 HDFC AMC COMPANY OVERVIEW
HDFC ASSET MANAGEMENT COMPANY LIMITED (AMC)
AMC was incorporated under the Companies Act, 1956, on December 10, 1999, and was
approved to act as an AMC for the Mutual Fund by SEBI on July 30, 2000.
The registered office of the AMC is situated at Ramon House, 3rd Floor, H.T. Parekh Marg,
169, Back bay Reclamation, Church gate, Mumbai - 400 020.
In terms of the Investment Management Agreement, the Trustee has appointed HDFC Asset
Management Company Limited to manage the Mutual Fund
As per the terms of the Investment Management Agreement, the AMC will conduct the
operations of the Mutual Fund and manage assets of the schemes, including the schemes
launched from time to time.
The present share holding pattern of the AMC is as follows:
Table:1.5
Particulars % of the paid up capital
Housing Development Finance Corporation Limited 50.10
Standard Life Investments Limited 49.90

Zurich Insurance Company (ZIC), the Sponsor of Zurich India Mutual Fund, following a
review of its overall strategy, had decided to divest its Asset Management business in India.
The AMC had entered into an agreement with ZIC to acquire the said business, subject to
necessary regulatory approvals.
On obtaining the regulatory approvals, the Schemes of Zurich India Mutual Fund has now
migrated to HDFC Mutual Fund on June 19, 2003.
The AMC is also providing portfolio management / advisory services and such activities are
not in conflict with the activities of the Mutual Fund. The AMC has renewed its registration
from SEBI vide Registration No. - PM / INP000000506 dated December 22, 2000 to act as a
Portfolio Manager under the SEBI (Portfolio Managers) Regulations, 1993. The Certificate of
Registration is valid from January 1, 2004 to December 31, 2006.
Board of Directors
The Board of Directors of the HDFC Asset Management Company Limited (AMC) consists of the following eminent persons.
Table:1.6
Mr. Deepak S. Parekh Chairman of the boardMr. N. Keith Skeoch CEO of Standard Life Investments Ltd.Mr. Keki M. Mistry Associate directorMr. James Aird Investment directorMr. P. M. Thampi Independent directorMr. Humayun Dhanrajgir Independent directorDr. Deepak B. Phatak Independent directorMr. Hoshang S. Billimoria Independent directorMr. Rajeshwar Raj Bajaaj Independent directorMr. Vijay Merchant Independent directorMs. Renu S. Karnad Joint managing director

Mr. Milind Barve Managing director
Mr. Deepak Parekh, the Chairman of the Board, is associated with HDFC Ltd. in his capacity as its Executive Chairman.
Mr. Parekh joined HDFC Ltd. in a senior management position in 1978. He was inducted as Wholetime Director of HDFC Ltd. in 1985 and was appointed as the Executive Chairman in 1993.
Mr. N. Keith Skeoch is associated with Standard Life Investments Limited as its Chief Executive and is responsible for all company business and investment operations within Standard Life Investments Limited.
Mr. Keki M. Mistry is an associate director on the Board. He is the Vice-Chairman & Managing Director of Housing Development Finance Corporation Limited (HDFC Ltd.) He is with HDFC Ltd. since 1981 and was appointed as the Executive Director of HDFC Ltd. in 1993. He was appointed as the Deputy Managing Director in 1999, Managing Director in 2000 and Vice Chairman & Managing Director in 2007.
SPONSORS
HOUSING DEVELOPMENT FINANCE CORPORATION LIMITED (HDFC):
HDFC was incorporated in 1977 as the first specialised housing finance institution in India.
HDFC provides financial assistance to individuals, corporate and developers for the purchase
or construction of residential housing. It also provides property related services (e.g. property
identification, sales services and valuation), training and consultancy. Of these activities,
housing finance remains the dominant activity.
HDFC currently has a client base of over 8, 00,000 borrowers, 12, 00,000 depositors, 92,000
shareholders and 50,000 deposit agents. HDFC raises funds from international agencies such
as the World Bank, IFC (Washington), USAID, CDC, ADB and KFW, domestic term loans
from banks and insurance companies, bonds and deposits. HDFC has received the highest
rating for its bonds and deposits program for the ninth year in succession. HDFC Standard
Life Insurance Company Limited, promoted by HDFC was the first life insurance company in
the private sector to be granted a Certificate of Registration (on October 23, 2000) by the
Insurance Regulatory and Development Authority to transact life insurance business in India.
HDFC is India's premier housing finance company and enjoys an impeccable track record in
India as well as in international markets. Since its inception in 1977, the Corporation has
maintained a consistent and healthy growth in its operations to remain the market leader in
mortgages. Its outstanding loan portfolio covers well over a million dwelling units. HDFC
has developed significant expertise in retail mortgage loans to different market segments and
also has a large corporate client base for its housing related credit facilities. With its
experience in the financial markets, a strong market reputation, large shareholder base and
unique consumer franchise, HDFC was ideally positioned to promote a bank in the Indian
environment.
STANDARD LIFE INVESTMENTS LIMITED
The Standard Life Assurance Company was established in 1825 and has considerable
experience in global financial markets. In 1998, Standard Life Investments Limited became
the dedicated investment management company of the Standard Life Group and is owned
100% by The Standard Life Assurance Company.
With global assets under management of approximately US$186.45 billion as at March 31,
2005, Standard Life Investments Limited is one of the world's major investment companies
and is responsible for investing money on behalf of five million retail and institutional clients
worldwide. With its headquarters in Edinburgh, Standard Life Investments Limited has an
extensive and developing global presence with operations in the United Kingdom, Ireland,
Canada, USA, China, Korea and Hong Kong. In order to meet the different needs and risk
profiles of its clients, Standard Life Investments Limited manages a diverse portfolio
covering all of the major markets world-wide, which includes a range of private and public
equities, government and company bonds, property investments and various derivative
instruments. The company's current holdings in UK equities account for approximately 2% of
the market capitalization of the London Stock Exchange.
HDFC MUTUAL FUND PRODUCTS

Equity Funds
HDFC Growth Fund
HDFC Long Term Advantage Fund
HDFC Index Fund
HDFC Equity Fund
HDFC Capital Builder Fund
HDFC Tax saver
HDFC Top 200 Fund
HDFC Core & Satellite Fund
HDFC Premier Multi-Cap Fund
HDFC Long Term Equity Fund
HDFC Mid-Cap Opportunity Fund
Balanced Funds
HDFC Children's Gift Fund Investment Plan
HDFC Children's Gift Fund Savings Plan
HDFC Balanced Fund
HDFC Prudence Fund
Debt Funds
HDFC Income Fund
HDFC Liquid Fund
HDFC Gilt Fund Short Term Plan
HDFC Gilt Fund Long Term Plan
HDFC Short Term Plan
HDFC Floating Rate Income Fund Short Term Plan
HDFC Floating Rate Income Fund Long Term Plan
HDFC Liquid Fund - PREMIUM PLAN
HDFC Liquid Fund - PREMIUM PLUS PLAN

HDFC Short Term Plan - PREMIUM PLAN
HDFC Short Term Plan - PREMIUM PLUS PLAN
HDFC Income Fund Premium Plan
HDFC Income Fund Premium plus Plan
HDFC High Interest Fund
HDFC High Interest Fund - Short Term Plan
HDFC Sovereign Gilt Fund - Savings Plan
HDFC Sovereign Gilt Fund - Investment Plan
HDFC Sovereign Gilt Fund - Provident Plan
HDFC Cash Management Fund - Savings Plan
HDFC Cash Management Fund - Call Plan
HDFCMF Monthly Income Plan - Short Term Plan
HDFCMF Monthly Income Plan - Long Term Plan
HDFC Cash Management Fund - Savings Plus Plan
HDFC Multiple Yield Fund
HDFC Multiple Yield Fund Plan 2005
ACHIEVEMENT AND AWARDS
CNBC - TV 18 - CRISIL Mutual Fund of the Year Awards 2008 :
HDFC Prudence Fund was the only scheme that won the CNBC - TV 18 - CRISIL Mutual
Fund of the Year Award 2008 in the Most Consistent Balanced Fund under CRISIL ~
CPR for the calendar year 2007 (from amongst 3 schemes).
HDFC Cash Management Fund - Savings Plan was the only scheme that won the CNBC -
TV 18 - CRISIL Mutual Fund of the Year Award 2008 in the Most Consistent Liquid Fund
under CRISIL ~ CPR for the calendar year 2007 (from amongst 5 schemes).
HDFC Cash Management Fund - Savings Plan was the only scheme that won the CNBC -
TV 18 - CRISIL Mutual Fund of the Year Award 2008 in the Liquid Scheme – Retail
Category for the calendar year 2007 (from amongst 19 schemes).
Lipper Fund Awards 2008:
HDFC Equity Fund - Growth has been awarded the 'Best Fund over Ten Years' in
the 'Equity India Category' at the Lipper Fund Awards 2008 (form amongst 23 schemes).
It was awarded the Best Fund over ten years in 2006 and 2007 as well. 2008 makes it three in
a row.
Lipper Fund Awards 2009 :
HDFC Equity Fund - Growth has been awarded the 'Best Fund over Ten Years' in the 'Equity
India Category' (form amongst 34 schemes) and HDFC Prudence Fund – Growth Plan in
the ‘Mixed Asset INR Aggressive Category’ (from amongst 6 schemes), have been awarded
the ‘Best Fund over 10 Years’ by Lipper Fund Awards India 2009.
ICRA Mutual Fund Awards – 2008 :
HDFC MF Monthly Income Plan - Long Term Plan - Ranked a Seven Star Fund and has
been awarded the Gold Award for "Best Performance" in the category of "Open Ended
Marginal Equity" for the three year period ending December 31, 2007 (from amongst 27
schemes)
HDFC High Interest Fund - Short Term Plan - Ranked a Five Star Fund indicating
performance among the top 10% in the category of "Open Ended Debt - Short Term" for
one year period ending December 31, 2007 (from amongst 20 schemes).
HDFC Prudence Fund - Ranked a Five Star Fund indicating performance among the top
10% in the category of "Open Ended Balanced" for the three year period ending December
31, 2007 (from amongst 16 schemes)

B. MEASURING AND EVALUATING MUTUAL FUNDS PERFORMANCE:
1.2.1 PURPOSE OF MEASURING AND EVALUATING
Every investor investing in the mutual funds is driven by the motto of either wealth creation
or wealth increment or both. Therefore it’s very necessary to continuously evaluate the funds’
performance with the help of factsheets and newsletters, websites, newspapers and
professional advisors like HDFC AMC. If the investors ignore the evaluation of funds’
performance then he can lose hold of it any time. In this ever-changing industry, he can face
any of the following problems:
1. Variation in the funds’ performance due to change in its management/ objective.
2. The funds’ performance can slip in comparison to similar funds.

3. There may be an increase in the various costs associated with the fund.
4 .Beta, a technical measure of the risk associated may also surge.
5. The funds’ ratings may go down in the various lists published by independent rating
agencies.
6. It can merge into another fund or could be acquired by another fund house.
Performance measures:
Equity funds: the performance of equity funds can be measured on the basis of: NAV
Growth, Total Return; Total Return with Reinvestment at NAV, Annualized Returns and
Distributions, Computing Total Return (Per Share Income and Expenses, Per Share Capital
Changes, Ratios, Shares Outstanding), the Expense Ratio, Portfolio Turnover Rate, Fund
Size, Transaction Costs, Cash Flow, Leverage.
Debt fund: Likewise, the performance of debt funds can be measured on the basis of: Peer
Group Comparisons, The Income Ratio, Industry Exposures and Concentrations, NPAs,
besides NAV Growth, Total Return and Expense Ratio.
Liquid funds: the performance of the highly volatile liquid funds can be measured on the
basis of: Fund Yield, besides NAV Growth, Total Return and Expense Ratio.
Concept of benchmarking for performance evaluation:
Every fund sets its benchmark according to its investment objective. The funds performance
is measured in comparison with the benchmark. If the fund generates a greater return than the
benchmark then it is said that the fund has outperformed benchmark , if it is equal to
benchmark then the correlation between them is exactly 1. And if in case the return is lower
than the benchmark then the fund is said to be underperformed.

Some of the benchmarks are:
1. Equity funds: market indices such as S&P CNX nifty, BSE100, BSE200, BSE-PSU, BSE
500 index, BSE bankex, and other sectoral indices.
2. Debt funds: Interest Rates on Alternative Investments as Benchmarks, I-Bex Total Return
Index, JPM T-Bill Index Post-Tax Returns on Bank Deposits versus Debt Funds.
3. Liquid funds: Short Term Government Instruments’ Interest Rates as Benchmarks, JPM
T- Bill Index.
To measure the fund’s performance, the comparisons are usually done with:
I) with a market index.
ii) Funds from the same peer group.
iii) Other similar products in which investors invest their funds.
1.2.2 FINANCIAL PLANNING FOR INVESTORS REFERRING TO MUTUAL FUNDS:
Investors are required to go for financial planning before making investments in any mutual
fund. The objective of financial planning is to ensure that the right amount of money is
available at the right time to the investor to be able to meet his financial goals. It is more than
mere tax planning. Steps in financial planning are:
Asset allocation.
Selection of fund.
Studying the features of a scheme.
In case of mutual funds, financial planning is concerned only with broad asset allocation,
leaving the actual allocation of securities and their management to fund managers. A fund

manager has to closely follow the objectives stated in the offer document, because financial
plans of users are chosen using these objectives.
1.2.3 WHY HAS IT BECOME ONE OF THE LARGEST FINANCIAL INSTRUMENTS?
If we take a look at the recent scenario in the Indian financial market then we can find the
market flooded with a variety of investment options which includes mutual funds, equities,
fixed income bonds, corporate debentures, company fixed deposits, bank deposits, PPF, life
insurance, gold, real estate etc. all these investment options could be judged on the basis of
various parameters such as- return, safety convenience, volatility and liquidity. Measuring
these investment options on the basis of the mentioned parameters, we get this in a tabular
form
Table:1.7
Return Safety Volatility Liquidity Convenienc
e
Equity High Low High High Moderate
Bonds Moderate High Moderate Moderate High
Co. Debentures
Moderate Moderate Moderate Low Low
Co. FDs
Moderate Low Low Low Moderate
Bank Deposits
Low High Low High High

PPF Moderate High Low Moderate High
Life Insurance
Low High Low Low Moderate
Gold Moderate High Moderate Moderate Gold
Real Estate
High Moderate High Low Low
Mutual Funds
High High Moderate High High
We can very well see that mutual funds outperform every other investment option. On three
parameters, it scores high whereas it’s moderate at one. comparing it with the other options,
we find that equities gives us high returns with high liquidity but its volatility too is high with
low safety which doesn’t makes it favourite among persons who have low risk- appetite.
Even the convenience involved with investing in equities is just moderate.
Now looking at bank deposits, it scores better than equities at all
fronts but lags badly in the parameter of utmost important ie; it scores low on return , so it’s
not an happening option for person who can afford to take risks for higher return. The other
option offering high return is real estate but that even comes with high volatility and
moderate safety level, even the liquidity and convenience involved are too low. Gold have
always been a favourite among Indians but when we look at it as an investment option then it
definitely doesn’t gives a very bright picture. Although it ensures high safety but the returns
generated and liquidity are moderate. Similarly, the other investment options are not at par
with mutual funds and serve the needs of only a specific customer group. Straightforward,
we can say that mutual fund emerges as a clear winner among all the options available.
The reasons for this being:

I)Mutual funds combine the advantage of each of the investment products: mutual fund
is one such option which can invest in all other investment options. Its principle of
diversification allows the investors to taste all the fruits in one plate. just by investing in it,
the investor can enjoy the best investment option as per the investment objective.
II) Dispense the shortcomings of the other options: every other investment option has
more or less some shortcomings. Such as if some are good at return then they are not safe, if
some are safe then either they have low liquidity or low safety or both….likewise, there
exists no single option which can fit to the need of everybody. But mutual funds have
definitely sorted out this problem. Now everybody can choose their fund according to their
investment objectives.
III) Returns get adjusted for the market movements: as the mutual funds are managed by
experts so they are ready to switch to the profitable option along with the market movement.
Suppose they predict that market is going to fall then they can sell some of their shares and
book profit and can reinvest the amount again in money market instruments.
IV) Flexibility of invested amount: Other then the above mentioned reasons, there exists
one more reason which has established mutual funds as one of the largest financial
intermediary and that is the flexibility that mutual funds offer regarding the investment
amount. One can start investing in mutual funds with amount as low as Rs. 500 through SIPs
and even Rs. 100 in some cases.
Not all award-winning funds may be suitable for everyone
Many investors feel that a simple way to invest in Mutual funds is to just keep investing in
award winning funds. First of all, it is important to understand that more than the
awards; it is the methodology to choose winners t at is more relevant.
A rating firm generally elaborates on the criteria for deciding the winner’s i.e.
consistent performance, risk adjusted returns, total returns and protection of capital. Each

of these factors is very important and ha s its significance for different categories of
funds.
Besides, each of these factors has varying degree of significance for different kinds of
investors. For example, consistent return re ally focuses on risk. If someone is afraid of
negative returns, consistency will be a more import ant measure than tot al ret urn i.e.
Growth in NAV as well as dividend received.
A fund can have very impressive total ret urns overtime, but can be very volatile and tough
for a risk adverse investor. Therefore, all the ward winning funds in different
categories may not be suitable for everyone. Typically, when one has to select funds, the
first step should be to consider personal goals and objectives. Invest ors need to decide which
element they value the most and the n prioritize the other criteria
Once one knows what one is looking for, one should go about selecting the funds according
to the asset allocation. Most investors need just a few funds, carefully picked, watched and
managed over period of time.
1.2.4 EVALUATING PORTFOLIO PERFORMANCE
It is important to evaluate the performance of the portfolio on an on-going basis. The
following factors are important in this process:
Consider long-term record of accomplishment rather than short -term performance. It is
important because long-term track record moderates the effects which unusually good
or bad short -term performance can have on a fund's track record. Besides, longer-term
track record compensates for the effects of a fund manager's particular investment style.
Evaluate the record of accomplishment against similar funds. Success in managing a small
or in a fund focusing on a particular segment of the market cannot be re lied upon as an
evidence of anticipated performance in managing a large or a broad based fund.
Discipline in investment approach is an important factor as the pressure to perform can make
a fund manager susceptible to have a n urge to change tracks in terms of stock selection as
well a s investment strategy.

The objective should be to differentiate investment skill of the fund manager from luck
and to identify those funds with the greatest potential of future success.
1.2.5 HOW TO REDUCE RISK WHILE INVESTING:
Any kind of investment we make is subject to risk. In fact we get return on our
investment purely and solely because at the very beginning we take the risk of parting
with our funds, for getting higher value back at a later date. Partition it self is a risk. Well
known economist and Nobel Prize recipient William Sharpe tried to segregate the total
risk faced in any kind of investment into two parts - systematic (Systemic) risk and
unsystematic (Unsystematic) risk.
Systematic risk is that risk which exists in the system. Some of the biggest examples of
systematic risk are inflation, recession, war, political situation etc.
Inflation erodes returns generated from all investments e .g. If return from fixed deposit is 8
percent and if inflation is 6 per cent then real rate of return from fixed deposit is reduced by 6
percent. Similarly if returns generated from equity market is 18 percent and inflation is still 6
per cent then equity returns will be lesser by the rate of inflation. Since inflation exists in the
system there is no way one can stay away from the risk of inflation.
Economic cycles, war and political situations have effects on all forms of investments. Also
these exist in the system and there is no way to stay away from them. It is like learning
to walk. Anyone who wants to learn to walk has to first fall; you cannot learn to walk
without falling. Similarly, anyone who wants to invest has to first face systematic risk.
Therefore, one can never make any kind of investment without systematic risk.
Another form of risk is unsystematic risk. This risk does not exist in the system and
hence is not applicable to all forms of investment.
Unsystematic risk is associated with particular form of investment. Suppose we invest in
stock market and the market falls, then only our investment in equity gets affected OR if we
have placed a fixed deposit in particular bank and bank goes bankrupt, than we only
lose money placed in that bank. While there is no way to keep away from risk, we can

always reduce the impact of risk. Diversification helps in reducing the impact of
unsystematic risk. If our investment is distributed across various asset classes, the impact of
unsystematic risk is reduced.
If we have placed fixed deposit in several banks, then even if one of the banks goes
bankrupt our entire fixed de posit investment is not lost. Similarly if our equity
investment is in Tata Motors, HLL, Infosys, adverse news about Infosys will only
impact investment in Infosys, all other stocks will not have any impact . To reduce the
impact of systematic risk, we should invest regularly. By investing regularly, we average out
the impact of risk. Mutual fund, as an investment vehicle gives us benefit of both
diversification and averaging. Portfolio of mutual funds consists of multiple securities
and hence adverse news about single security will have nominal impact on overall portfolio.
By systematically investing in mutual fund, we get benefit of rupee cost averaging. Mutual
fund as an investment vehicle helps reduce, both, systematic as well a s unsystematic risk
1.2.6 A STUDY OF PORTFOLIO ANALYSIS FROM THE POINT OF FUND MANAGER:
Effective use of portfolio management disciplines improves customer satisfaction, reduces
the number of risks problems, and increases success. The goal of portfolio analysis is to
realize these same benefits at the portfolio level by applying a consistent structured
management approach.
The considerations underlying the portfolio analysis is a matter of concern to the fund
managers, investors, and researchers alike. This study attempts to answer two questions
relating to the portfolio analysis:
• Make an average (or fair) return for the level of risk in the portfolio
• To find out the portfolio which best meets the purpose of the investor.

At a minimum, any comprehensive mutual fund selection and analysis approach should
include the following generalized processes:
• Fund selection
• Fund prioritize/ reprioritize
• Selection of the acceptable and required fund
• Fund analysing and monitoring
• Corrective action management
The fund portfolio analysis gives the ability to select funds that are aligned with the
investor’s strategies and objectives. It helps the fund manager to make the best use of
available opportunities by applying to the highest priority of the investor. A fund manager
can regularly assess how securities and stocks are contributing to portfolio health and can
make the corrective action to keep the portfolio in compliance with the investor’s interest and
objectives.
Mutual funds do not determine risk preference. However, once investor determines his/her
return preferences, he/she can choose a mutual fund a large and growing variety of alternative
funds designed to meet almost any investment goal. Studies have showed that the funds
generally were consistent in meeting investors stated goals for investment strategies, risk, and
return. The major benefit of the mutual fund is to diversify the portfolio to eliminate
unsystematic risk. The instant diversification of the funds is especially beneficial to the small
investors who do not have the resources to acquire 100 shares of 12 or 15 different issues
required to reduce unsystematic risk.
Mutual funds have generally maintained the stability of their correlation with the market
because of reasonably well diversified portfolios. There are some measures for the analysis
and each of them provides unique perspectives. These measures evaluate the different
components of performance.

1.2.7 MEASURES OF RISK AND RETURN:
Risk is variability in future cash flows. It is also known as uncertainty in the distribution of
possible outcomes. A risky situation is one, which has some probability of loss or unexpected
results. The higher the probability of loss or unexpected results is, the greater the risk.
It is the uncertainty that an investment will earn its expected rate of return. For an investor,
evaluating a future investment alternative expects or anticipates a certain rate of return is very
important.
Portfolio risk management includes processes that identify, analyse, respond to, track, and
control any risk that would prevent the portfolio from achieving its business objectives. These
processes should include reviews of project level risks with negative implications for the
portfolio, ensuring that the project manager has a responsible risk mitigation plan.
Additionally, it is important to do a consolidated risk assessment for the portfolio overall to
determine whether it is within the already specified limits. Since portfolio and their
environments are dynamic, managers should review and update their portfolio risk
management plans on a regular basis through the fund life cycle.
Simple measure of returns:
The return on mutual fund investment includes both income (in the form of dividends or
investment payments) and capital gains or losses (increase or decrease in the value of a
security). The return is calculated by taking the change in a fund’s Net Asset Value, which is
the market value of securities the fund holds divided by the number of the fund’s shares
during a given time period, assuming the reinvestment all income and capital gains
distributions, and dividing it by the original net asset value. The return is calculated net of
management fees and other expenses charged to the fund. Thus, a fund’s monthly return can
be expressed as follows:
Rt= (NAVt- NAVt-1)/NAVt-1
Where,
Rt is the return in month t

NAVt is the closing net asset value of the fund on the last trading day of the month
NAVt-1 is the closing net asset value of the fund on the last day of the previous month
Measure of risk
Investors are interested not only in fund’s return but also in risk taken to achieve those
returns. So risk can be thought as the uncertainty of the expected return, and uncertainty is
generally equated with variability. Variability and the risk are correlated; hence high returns
will tend to high variability.
Standard deviation:
in simple terms standard deviation is one of the commonly used statistical parameter to
measure risk, which determines the volatility of a fund. Deviation is defined as any variation
from a mean value (upward & downward). Since the markets are volatile, the returns
fluctuate every day. High standard deviation of a fund implies high volatility and a low
standard deviation implies low volatility.
S.D. =√1/T× (Rt-AR) ²
Where,
S.D. is the periodic standard deviation,
AR is the average periodic return,
T is the number of observations in the period for which the standard deviation is being
calculated.
Rt is the return in month t
Beta analysis: ) β(Beta) Co-efficient:
Systematic risk is measured in terms of Beta, which represents fluctuations in the NAV of the
fund vis-à-vis market. The more responsive the NAV of a Mutual Fund is to the changes in
the market; higher will be its beta. Beta is calculated by relating the returns on a Mutual Fund

with the returns in the market. While unsystematic risk can be diversified through
investments in a number of instruments, systematic risk cannot. By using the risk return
relationship, we try to assess the competitive strength of the Mutual Funds vis-à-vis one
another in a better way.
β(Beta) is calculated as = [N (ΣXY) – ΣXΣY]/ [N (ΣX2) – (ΣX) 2 ]
Beta is used to measure the risk. It basically indicates the level of volatility associated with
the fund as compared to the market. In case of funds, as compared to the market. In case of
funds, beta would indicate the volatility against the benchmark index. It is used as a short
term decision making tool. A beta that is greater than 1 means that the fund is more volatile
than the benchmark index, while a beta of less than 1 means that the fund is more volatile
than the benchmark index. A fund with a beta very close to 1 means the fund’s performance
closely matches the index or benchmark.
The success of beta is heavily dependent on the correlation between a fund and its
benchmark. Thus, if the fund’s portfolio doesn’t have a relevant benchmark index then a beta
would be grossly inappropriate. For example if we are considering a banking fund, we should
look at the beta against a bank index.
R-Squared (R2):
R squared is the square of ‘R’ (i.e.; coefficient of correlation). It describes the level of
association between the fun’s market volatility and market risk. The value of R- squared
ranges from0 to1. A high R- squared (more than 0.80) indicates that beta can be used as a
reliable measure to analyze the performance of a fund. Beta should be ignored when the r-
squared is low as it indicates that the fund performance is affected by factors other than the
markets.
For example:
Case 1 Case 2
R2 0.65 0.88
B 1.2 0.9

In the above tableR2 is less than 0.80 in case 1, implies that it would be wrong to mention
that the fund is aggressive on account of high beta. In case 2, the r- squared is more than 0.85
and beta value is 0.9. it means that this fund is less aggressive than the market.
Portfolio turnover ratio:
Portfolio turnover is a measure of a fund's trading activity and is calculated by dividing the
lesser of purchases or sales (excluding securities with maturities of less than one year) by the
average monthly net assets of the fund. Turnover is simply a measure of the percentage of
portfolio value that has been transacted, not an indication of the percentage of a fund's
holdings that have been changed. Portfolio turnover is the purchase and sale of securities in a
fund's portfolio. A ratio of 100%, then, means the fund has bought and sold all its positions
within the last year. Turnover is important when investing in any mutual fund, since the
amount of turnover affects the fees and costs within the mutual fund.
Total expenses ratio:
A measure of the total costs associated with managing and operating an investment fund such
as a mutual fund. These costs consist primarily of management fees and additional expenses
such as trading fees, legal fees, auditor fees and other operational expenses. The total cost of
the fund is divided by the fund's total assets to arrive at a percentage
amount, which represents the TER:
Total expense ratio = (Total fund Costs/ Total fund Assets)
The most important and widely used measures of performance are:
The Sharpe Measure
The Treynor’Measure
Jenson Model
Fama Model
The Sharpe Measure :-

In this model, performance of a fund is evaluated on the basis of Sharpe Ratio, which is a
ratio of returns generated by the fund over and above risk free rate of return and the total risk
associated with it.
According to Sharpe, it is the total risk of the fund that the investors are concerned about. So,
the model evaluates funds on the basis of reward per unit of total risk. Symbolically, it can be
written as:
Sharpe Ratio (Si) = (Ri - Rf)/Si
Where,
Si is standard deviation of the fund,
Ri represents return on fund, and
Rf is risk free rate of return.
While a high and positive Sharpe Ratio shows a superior risk-adjusted performance of a fund,
a low and negative Sharpe Ratio is an indication of unfavourable performance.
The Treynor Measure:
Developed by Jack Treynor, this performance measure evaluates funds on the basis of
Treynor's Index.
This Index is a ratio of return generated by the fund over and above risk free rate of return
(generally taken to be the return on securities backed by the government, as there is no credit
risk associated), during a given period and systematic risk associated with it (beta).
Symbolically, it can be represented as:

Treynor's Index (Ti) = (Ri - Rf)/Bi.
Where,
Ri represents return on fund,
Rf is risk free rate of return, and
Bi is beta of the fund.
All risk-averse investors would like to maximize this value. While a high and positive
Treynor's Index shows a superior risk-adjusted performance of a fund, a low and negative
Treynor's Index is an indication of unfavorable performance.
Comparison of Sharpe and Treynor
Sharpe and Treynor measures are similar in a way, since they both divide the risk premium
by a numerical risk measure. The total risk is appropriate when we are evaluating the risk
return relationship for well-diversified portfolios. On the other hand, the systematic risk is the
relevant measure of risk when we are evaluating less than fully diversified portfolios or
individual stocks. For a well-diversified portfolio the total risk is equal to systematic risk.
Rankings based on total risk (Sharpe measure) and systematic risk (Treynor measure) should
be identical for a well-diversified portfolio, as the total risk is reduced to systematic risk.
Therefore, a poorly diversified fund that ranks higher on Treynor measure, compared with
another fund that is highly diversified, will rank lower on Sharpe Measure.
Jenson Model:
Jenson's model proposes another risk adjusted performance measure. This measure was
developed by Michael Jenson and is sometimes referred to as the differential Return Method.
This measure involves evaluation of the returns that the fund has generated vs. the returns
actually expected out of the fund1 given the level of its systematic risk. The surplus between
the two returns is called Alpha, which measures the performance of a fund compared with the
actual returns over the period. Required return of a fund at a given level of risk (Bi) can be
calculated as:

E(Ri) = Rf + Bi (Rm - Rf)
Where,
E(Ri) represents expected return on fund, and
Rm is average market return during the given period,
Rf is risk free rate of return, and
Bi is Beta deviation of the fund.
After calculating it, Alpha can be obtained by subtracting required return from the actual
return of the fund.
αp= Ri –[ Rf + Bi (Rm - Rf) ]
Higher alpha represents superior performance of the fund and vice versa. Limitation of this
model is that it considers only systematic risk not the entire risk associated with the fund and
an ordinary investor cannot mitigate unsystematic risk, as his knowledge of market is
primitive.
Fama Model:
The Eugene Fama model is an extension of Jenson model. This model compares the
performance, measured in terms of returns, of a fund with the required return commensurate
with the total risk associated with it. The difference between these two is taken as a measure
of the performance of the fund and is called Net Selectivity.
The Net Selectivity represents the stock selection skill of the fund manager, as it is the excess
returns over and above the return required to compensate for the total risk taken by the fund
manager. Higher value of which indicates that fund manager has earned returns well above
the return commensurate with the level of risk taken by him.

Selectivity: measures the ability of the portfolio manager to earn a return that is consistent
with the portfolio’s market (systematic) risk. The selectivity measure is:
Ri –[ Rf + Bi (Rm - Rf) ]
Diversification: measures the extent to which the portfolio may not have been completely
diversified. Diversification is measured as:
[Rf +(Rm - Rf)(αi/ αm)]-[Rf + Bi (Rm - Rf)]
If the portfolio is completely diversified, contains no unsystematic risk, then diversification
measure would be zero. A positive diversification measure indicates that the portfolio is not
completely diversified; it would contain unsystematic risk and it represents the extra return
that the portfolio should earn for not being completely diversified. The performance of the
portfolio can be measured as:
Net selectivity = selectivity – diversification
Net selectivity measures, how well the portfolio mangers did manager did at earning a fair
return for the portfolio’ systematic risk and diversifying away unsystematic risk. Positive net
selectivity indicates that the fund earned a better return.
The comparison, done based on sharpe ratio, Treynor measure, Jensen alpha, and Fema
measure notifies that the portfolio performance can be evaluated on the following basis:
Sahrpe ratio: measures the reward to total risk trade off
Treynor: measures the reward to systematic risk trade off
Jensen’s alpha: measures the average return over and above that predicted.
Fema measure: measures return of portfolio for its systematic risk and diversifying away
unsystematic risk.
Among the above performance measures, two models namely, Treynor measure and Jenson
model use Systematic risk is based on the premise that the Unsystematic risk is diversifiable.
These models are suitable for large investors like institutional investors with high risk taking
capacities as they do not face paucity of funds and can invest in a number of options to dilute
some risks. For them, a portfolio can be spread across a number of stocks and sectors.

However, Sharpe measure and Fama model that consider the entire risk associated with fund
are suitable for small investors, as the ordinary investor lacks the necessary skill and
resources to diversify. Moreover, the selection of the fund on the basis of superior stock
selection ability of the fund manager will also help in safeguarding the money invested to a
great extent. The investment in funds that have generated big returns at higher levels of risks
leaves the money all the more prone to risks of all kinds that may exceed the individual
investors' risk appetite.
PART-II
RESEARCH METHODOLOGY
2.1 NEED FOR THE STUDY
The Mutual Fund Companies periodically build up a study, which can prioritize and analyse
the portfolio of the mutual funds. This study is helpful in having a comparison among the
mutual funds based on the risk bearing capacity and expected return of the investor and will
also carry out an analysis of the portfolio of the selected mutual fund.
The mutual fund industry is growing globally and new products are emerging in the market
with all captivating promises of providing high return. It has become difficult for the
investors to choose the best fund for their needs or in other words to find out a fund which
will give maximum return for minimum risk. Therefore, they turn to their financial adviser to
get precise direct investment. Hence, the company asked me to prepare a model, which will
facilitate them to analyse the fund and to have reasonable estimation for the fund
performance.
The driving force of Mutual Funds is the ‘safety of the principal’ guaranteed, plus the added
advantage of capital appreciation together with the income earned in the form of interest or
dividend. The various schemes of Mutual Funds provide the investor with a wide range of
investment options according to his risk bearing capacities and interest besides; they also give

handy return to the investor. Mutual Funds offers an investor to invest even a small amount
of money, each Mutual Fund has a defined investment objective and strategy. Mutual Funds
schemes are managed by respective asset managed companies, sponsored by financial
institutions, banks, private companies or international firms. A Mutual Fund is the ideal
investment vehicle for today’s complex and modern financial scenario.
The study is basically made to analyze the various open-ended equity schemes of HDFC
Asset Management Company to highlight the diversity of investment that Mutual Fund offer.
Thus, through the study one would understand how a common person could fruitfully convert
a meagre amount into great penny by wisely investing into the right scheme according to his
risk taking abilities.
Sharpe ratio is a performance measure, which reflects the excess return earned on a portfolio
per unit of its total risk (standard deviation). Treynor measure indicates the risk premium
return per unit risk of the portfolio. While Jensen alpha talks about the deviation of the actual
return from its expected one. Fema measure decomposes the portfolio total return into two
main components: systematic return and the unsystematic return. It determines whether the
portfolio is perfectly diversified or not. Hence, it is a significant measure to evaluate the
performance of the fund manager.
The analysis of the fund portfolio has been done to find out the influence of the top holdings
on the performance of the fund. All these measures give fair implication and results about the
portfolio performance and can show the ground reality to a rational investor.
2.2 OBJECTIVE OF THE STUDY
Whether the growth oriented Mutual Fund are earning higher returns than the
benchmark returns (or market Portfolio/Index returns) in terms of risk.

Whether the growth oriented mutual funds are offering the advantages of
Diversification, Market timing and Selectivity of Securities to their investors
This study provides a proper investigation for logical and reasonable comparison and
selection of the funds.
It also assists in analysing the portfolio of the selected funds.
2.3 LIMITATIONS OF THE STUDY
The study is limited only to the analysis of different schemes and its suitability to
different investors according to their risk-taking ability.
The study is based on secondary data available from monthly fact sheets, websites and
other books, as primary data was not accessible.
The study is limited by the detailed study of six schemes of HDFFC.
Many investors are all price takers.
The assumption that all investors have the same information and beliefs about the
distribution of returns.
Banks are free to accept deposits at any interest rate within the ceilings fixed by the
Reserve Bank of India and interest rate can vary from client to client. Hence, there
can be inaccuracy in the risk free rates.
The study excludes the entry and the exit loads of the mutual funds.
2.4 DATA COLLECTION
The Methodology involves the selected Open-Ended equity schemes of HDFC mutual fund
for the purpose of risk return and comparative analysis the competitive funds. The data
collected for this project is basically from secondary sources, they are;

The monthly fact sheets of HDFC AMC fund house and research reports from banks.
The NAVs of the funds have been taken from AMFI websites for the period starting from 31 st
jan 2007 to 31st May, 2009.
For the Benchmark prices, data has been taken from BSE and NSE sites.
Part-III
CASE ANALYSIS
3.1 DATA INTERPRETATION
Risk returns analysis and comparative study of funds
In this section, a sample of HDFC equity related funds have been studied, evaluated and
analysed. This study could facilitate to get a fair comparison.
The expectations of the study are to give value to the funds by keeping the risk in the view.
Here equity funds are taken as they bear high return with high risk.
Following are the products of HDFC Mutual Fund, which have been taken the evaluation
purpose.
HDFC Equity Fund Growth option
HDFC Capital Builder
HDFC Growth Fund
HDFC Long Term Advantage Fund
HDFC Top 200 Fund
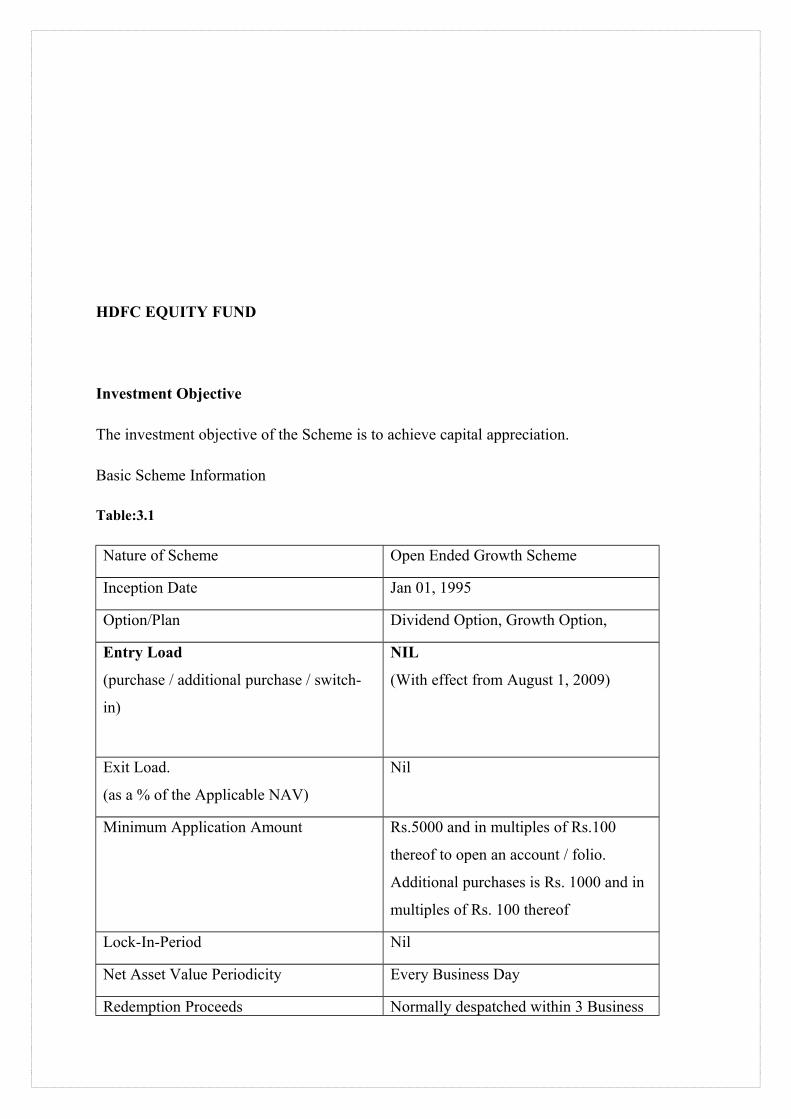
HDFC EQUITY FUND
Investment Objective
The investment objective of the Scheme is to achieve capital appreciation.
Basic Scheme Information
Table:3.1
Nature of Scheme Open Ended Growth Scheme
Inception Date Jan 01, 1995
Option/Plan Dividend Option, Growth Option,
Entry Load
(purchase / additional purchase / switch-
in)
NIL
(With effect from August 1, 2009)
Exit Load.
(as a % of the Applicable NAV)
Nil
Minimum Application Amount Rs.5000 and in multiples of Rs.100
thereof to open an account / folio.
Additional purchases is Rs. 1000 and in
multiples of Rs. 100 thereof
Lock-In-Period Nil
Net Asset Value Periodicity Every Business Day
Redemption Proceeds Normally despatched within 3 Business
days
Investment Pattern
The asset allocation under the Scheme will be as follows:
Table:3.2
SR NO. TYPE OF INSTRUMENTS NORMAL
ALLOCATION
(%of net asset)
RISK
PROFILE
1 Equities & Equities related
instruments
80-100 Medium to high
2 Debt securities, money market
instruments & cash
0-100 Low to medium
Investment in Securitised debt, if undertaken, would not exceed 20% of the net assets of the
scheme. The Scheme may also invest upto 25% of net assets of the Scheme in derivatives
such as Futures & Options and such other derivative instruments as may be introduced from
time to time for the purpose of hedging and portfolio balancing and other uses as may be
permitted under the Regulations.
Investment Strategy & Risk Control
In order to provide long term capital appreciation, the Scheme will invest predominantly in
growth companies. Companies selected under this portfolio would as far as practicable
consist of medium to large sized companies which: are likely achieved above average growth
than the industry; enjoy distinct competitive advantages, and have superior financial
strengths.
The aim will be to build a portfolio, which represents a cross-section of the strong growth
companies in the prevailing market. In order to reduce the risk of volatility, the Scheme will
diversify across major industries and economic sectors.

Benchmark Index : S&P CNX 500. HDFC Equity, which is benchmarked to S&P CNX 500
Index is not sponsored, endorsed, sold or promoted by Indian Index Service & Products
Limited (IISL).
Fund Manager : Mr. Prashant Jain
HDFC EQUITY FUND-GROWTH OPTION
Table:3.3
NAV S&P
CNX
500
Ri Rm Ri Rm Rm-Rm
av
sqr(Rm-
Rm av)
Rm2
2007
JAN
151.389 4899.39
FEB 141.228 4504.73 -6.71185 -8.05529 54.06587 -9.0864 82.56268 64.88767
MAR 142.602 4605.89 0.972895 2.24564 2.184771 1.214527 1.475077 5.042897
APL 151.16 4934.46 6.001318 7.133692 42.81156 6.10258 37.24148 50.88956
MAY 161.281 5185.95 6.695554 5.096606 34.1246 4.065494 16.52824 25.9754
JUN 165.313 5223.82 2.499984 0.730242 1.825594 -0.30087 0.090523 0.533254
JULY 172.325 5483.25 4.241651 4.966289 21.06526 3.935177 15.48562 24.66403
AUG 168.827 5411.29 -2.02989 -1.31236 2.663941 -2.34347 5.491863 1.72229
SEP 182.84 6094.11 8.300213 12.61843 104.7357 11.58732 134.266 159.2248
OCT 210.3 7163.3 15.0186 17.54465 263.4959 16.51353 272.6968 307.8146
NOV 206.176 6997.6 -1.96101 -2.31318 4.536164 -3.34429 11.18429 5.3508
DEC 223.324 7461.48 8.317166 6.62913 55.13557 5.598018 31.3378 43.94536
2008
JAN
188.42 6245.45 -15.6293 -16.2974 254.7177 -17.3285 300.2786 265.6065
FEB 187.594 6356.92 -0.43838 1.784819 -0.78243 0.753707 0.568075 3.18558
MAR 165.788 5762.88 -11.624 -9.34478 108.6241 -10.3759 107.6591 87.32486
APL 178.191 6289.07 7.481241 9.130678 68.3088 8.099566 65.60296 83.36928
MAY 169.605 5937.81 -4.81843 -5.58525 26.91209 -6.61636 43.77619 31.19497

JUN 143.171 4929.98 -15.5856 -16.9731 264.5363 -18.0042 324.1514 288.0859
JULY 151.715 5297.47 5.967689 7.454188 44.48428 6.423076 41.25591 55.56493
AUG 158.924 5337.28 4.751673 0.751491 3.570838 -0.27962 0.078188 0.564738
SEP 145.721 4807.2 -8.30774 -9.93165 82.50962 -10.9628 120.1822 98.63768
OCT 110.322 3539.57 -24.2923 -26.3694 640.5738 -27.4005 750.7883 695.3455
NOV 101.808 3379.53 -7.71741 -4.52145 34.8939 -5.55257 30.83098 20.44354
DEC 112.377 3635.87 10.38131 7.585078 78.74302 6.553966 42.95447 57.53341
2009
JAN
103.754 3538.57 -7.67328 -2.67611 20.53456 -3.70723 13.74352 7.161582
FEB 98.163 3403.33 -5.38871 -3.82188 20.59501 -4.85299 23.55156 14.60679
MAR 108.852 3720.51 10.88903 9.319696 101.4825 8.288584 68.70062 86.85673
APL 127.097 4278.54 16.76129 14.99875 251.3984 13.96764 195.0949 224.9625
MAY 169.897 5480.11 33.67507 28.08365 945.7186 27.05253 731.8396 788.6911
Total 29.7767 28.87114 3533.466 0 3469.417 3499.186
average 1.063454 1.031112 126.1952 0 123.9077
Figure:3.1
σm= √123.9077
=11.13239
β(Beta) =[N (ΣXY) – ΣXΣY ]/[ N (ΣX2) – (ΣX) 2 ]
= (98937.047- 859.6872)/( 97977.214- 833.54264)
= 98077.36/ 97143.672
= 1.0096114
Table:3.4
Ri Rm Ri-Rm Dev frm ave sq of Dev frm av
2007
JAN
FEB -6.71185 -8.05529 1.34344 -1.3111 1.71898
MAR 0.972895 2.24564 -1.27274 1.305086 1.70325
APL 6.001318 7.133692 -1.13237 1.164715 1.356561
MAY 6.695554 5.096606 1.598948 -1.56661 2.454256
JUN 2.499984 0.730242 1.769742 0.75698 0.573018
JULY 4.241651 4.966289 -0.72464 0.75698 0.573018
AUG -2.02989 -1.31236 -0.71753 0.749866 0.5623
SEP 8.300213 12.61843 -4.31822 4.350562 18.92739
OCT 15.0186 17.54465 -2.52605 2.558392 6.545367
NOV -1.96101 -2.31318 0.352172 -0.31983 0.102291

DEC 8.317166 6.62913 1.688036 -1.65569 2.741324
2008
JAN
-15.6293 -16.2974 0.668127 -0.63579 0.404223
FEB -0.43838 1.784819 -2.2232 2.255543 5.087475
MAR -11.624 -9.34478 -2.27926 2.311604 5.343511
APL 7.481241 9.130678 -1.64944 1.681778 2.828377
MAY -4.81843 -5.58525 0.76682 -0.73448 0.539459
JUN -15.5856 -16.9731 1.387467 -1.35513 1.836366
JULY 5.967689 7.454188 -1.4865 1.518841 2.306878
AUG 4.751673 0.751491 4.000182 -3.96784 15.74376
SEP -8.30774 -9.93165 1.623906 -1.59156 2.533078
OCT -24.2923 -26.3694 2.077092 -2.04475 4.181006
NOV -7.71741 -4.52145 -3.19596 3.228297 10.4219
DEC 10.38131 7.585078 2.796228 -2.76389 7.639067
2009
JAN
-7.67328 -2.67611 -4.99717 5.029507 25.29594
FEB -5.38871 -3.82188 -1.56683 1.599166 2.557333
MAR 10.88903 9.319696 1.569336 -1.53699 2.362352
APL 16.76129 14.99875 1.76254 -1.7302 2.993588
MAY 33.67507 28.08365 5.591422 -5.55908 30.90337
Total 29.7767 28.87114 0.90556 160.2354
avrage 1.063454 1.031112 0.032341 5.722694
Standard Deviation for the fund’s excess return (S.D.) σi=√5.722694
=2.392215
Sharpe Index (Si) = (Ri - Rf)/Si

= (1.063454-5)/ 2.392215
=-1.64557
Treynor's Index (Ti) = (Ri - Rf)/Bi.
=(1.063454-5)/ 1.0096114
=-3.89907
Jenson alpha (αp)= Ri –[ Rf + Bi (Rm - Rf) ]
= 1.063454 - [ 5+1.0096114 (1.031112-5)]
=0.070488
Expected return E(Ri) = Rf + Bi (Rm - Rf)
=[ 5+1.0096114 (1.031112-5)]
=0.992965
Fema Measures
Selectivity =Ri –[ Rf + Bi (Rm - Rf) ]
= 1.063454 - [ 5+1.0096114 (1.031112-5)]
=0.070488
Diversification =[Rf + (Rm - Rf)(αi/ αm)]-[Rf + Bi (Rm - Rf) ]
=[5+(1.031112-5)(2.392215/11.13139)]- [ 5+1.0096114 (1.031112-5)]
=3.154092

Net selectivity= selectivity- diversification
=0.070488-3.15409
=-3.0836
HDFC CAPITAL BUILDER FUND
Investment Objective
The Investment Objective of the Scheme is to achieve capital appreciation in the long term.
Basic Scheme Information
Nature of Scheme Open Ended Growth Scheme
Inception Date February 01, 1994
Option/Plan Dividend Option,Growth Option. The Dividend Option offers
Dividend Payout and Reinvestment Facility.
Entry Load
(purchase / additional
purchase / switch-in)
NIL
(With effect from August 1, 2009)
Exit Load
(as a % of the Applicable
NAV)
(Other than Systematic
Investment Plan (SIP)/
Systematic Transfer Plan
(STP))
• In respect of each purchase / switch-in of Units less
than Rs. 5 crore in value, an Exit Load of 1.00% is
payable if Units are
redeemed/switched-out within 1 year from the date of
allotment.
• In respect of each purchase / switch-in of Units equal
to or greater than Rs. 5 crore in value, no Exit Load is
payable.
No Exit Load shall be levied on bonus units and
units allotted on dividend reinvestment.

Minimum Application
Amount
(Other than Systematic
Investment Plan (SIP)/
Systematic Transfer Plan
(STP))
For new investors :Rs.5000 and any amount thereafter.
For existing investors : Rs. 1000 and any amount thereafter.
Lock-In-Period Nil
Net Asset Value Periodicity Every Business Day.
Redemption Proceeds Normally despatched within 3 business Days
Current Expense Ratio (#)
(Effective Date 22nd May
2009)
On the first 100 crores average weekly net assets 2.50%
On the next 300 crores average weekly net assets 2.25%
On the next 300 crores average weekly net assets 2.00%
On the balance of the assets 1.75%
Pattern
The asset allocation under the Scheme will be as follows :
Sr.No. Asset Type (% of Portfolio) Risk Profile
1 Equities and Equity Related Instruments Upto 100% Medium to High
2 Debt & Money Market Instruments Not more than 20% Low to Medium
Investment in Securitised debt, if undertaken, would not exceed 20% of the net assets of the
scheme.
Investment Strategy
This Scheme aims to achieve its objectives by investing in strong companies at prices which
are below fair value in the opinion of the fund managers.
The Scheme defines a "strong company" as one that has the following characteristics :

• strong management, characterized by competence and integrity
• strong position in its business (preferably market leadership)
• efficiency of operations, as evidenced by profit margins and asset turnover, compared
to its peers in the industry
• working capital efficiency
• consistent surplus cash generation
• high profitability indicators (returns on funds employed)
In common parlance, such companies are also called 'Blue Chips'.
The Scheme defines "reasonable prices" as :
• a market price quote that is around 30% lower than its value, as determined by the
discounted value of its estimated future cash flows
• a P/E multiple that is lower than the company's sustainable Return on funds employed
• a P/E to growth ratio that is lower than those of the company's competitors
• in case of companies in cyclical businesses, a market price quote that is around 50%
lower than its estimated replacement cost
Fund Manager
Mr. Chirag Setalvad (since Apr 2, 07)
Mr. Anand Laddha - Dedicated Fund Manager - Foreign Securities
HDFC CAPITAL BUILDER FUND
Table:3.5
NAV S&P CNX 500
Ri Rm Ri Rm Rm-Rm av
sqr(Rm-Rm av)
Rm2
2007 JAN
64.459 4899.39
FEB 61.259 4504.73 -4.9644 -8.05529 39.98964 -9.0864 82.56268
64.88767
MAR 60.3 4605.89 -1.56548 2.24564 -3.51551 1.214527 1.475077
5.042897
APL 65.818 4934.46 9.150912 7.133692 65.27979 6.10258 37.24148
50.88956
MAY 69.818 5185.95 6.077365 5.096606 30.97394 4.065494 16.52824
25.9754
JUN 73.27 5223.82 4.944284 0.730242 3.610525 -0.30087 0.090523
0.533254
JULY 76.914 5483.25 4.973386 4.966289 24.69927 3.935177 15.48562
24.66403
AUG 76.323 5411.29 -0.76839 -1.31236 1.008405 -2.34347 5.491863
1.72229
SEP 83.09 6094.11 8.866266 12.61843 111.8784 11.58732 134.266 159.2248
OCT 96.061 7163.3 15.61078 17.54465 273.8857 16.51353 272.6968
307.8146
NOV 99.034 6997.6 3.094908 -2.31318 -7.15908 -3.34429 11.18429
5.3508
DEC 106.538
7461.48 7.577196 6.62913 50.23022 5.598018 31.3378 43.94536
2008 JAN
88.367 6245.45 -17.0559 -16.2974 277.9672 -17.3285 300.2786
265.6065
FEB 87.439 6356.92 -1.05017 1.784819 -1.87436 0.753707 0.568075
3.18558
MAR 75.967 5762.88 -13.12 -9.34478 122.6035 -10.3759 107.6591
87.32486
APL 79.418 6289.07 4.542762 9.130678 41.4785 8.099566 65.60296
83.36928
MAY 75.065 5937.81 -5.48113 -5.58525 30.61343 -6.61636 43.77619
31.19497
JUN 64.169 4929.98 -14.5154 -16.9731 246.3716 -18.0042 324.1514
288.0859

JULY 67.228 5297.47 4.767099 7.454188 35.53486 6.423076 41.25591
55.56493
AUG 70.149 5337.28 4.344916 0.751491 3.265164 -0.27962 0.078188
0.564738
SEP 63.365 4807.2 -9.67084 -9.93165 96.04744 -10.9628 120.1822
98.63768
OCT 47.587 3539.57 -24.9002 -26.3694 656.603 -27.4005 750.7883
695.3455
NOV 44.556 3379.53 -6.36939 -4.52145 28.79888 -5.55257 30.83098
20.44354
DEC 48.064 3635.87 7.873238 7.585078 59.71913 6.553966 42.95447
57.53341
2009 JAN
45.564 3538.57 -5.2014 -2.67611 13.91953 -3.70723 13.74352
7.161582
FEB 43.34 3403.33 -4.88105 -3.82188 18.65479 -4.85299 23.55156
14.60679
MAR 46.604 3720.51 7.531149 9.319696 70.18802 8.288584 68.70062
86.85673
APL 53.006 4278.54 13.73702 14.99875 206.0381 13.96764 195.0949
224.9625
MAY 67.6 5480.11 27.53273 28.08365 773.2195 27.05253 731.8396
788.6911
TOTAL 21.08029 28.87114 3270.029 0 3469.417
3499.186
AVERAGE
0.752867 1.031112 116.7868 0 123.9077

Figure:3.2
σm = √123.9077
=11.13239
β(Beta) =[N (ΣXY) – ΣXΣY ]/[ N (ΣX2) – (ΣX) 2 ]
= (91560.82- 608.6119)/ (97977.21- 833.5426)
= 90952.21/ 97143.67
= 0.936265
Table:3.6
Ri Rm Ri-Rm Dev frm ave
sq of Dev frm av
2007 JAN
FEB -4.9644 -8.05529 3.090893 -3.36914 11.35109
MAR -1.56548 2.24564 -3.81112 3.532879 12.48124
APL 9.150912 7.133692
2.01722 -2.29546 5.269159
MAY 6.077365 5.096606
0.980759 -1.259 1.585089
JUN 4.944284 0.730242
4.214041 -4.49229 20.18063
JULY 4.973386 4.966289
0.007097 -0.28534 0.08142
AUG -0.76839 -1.31236 0.54397 -0.82221 0.676037
SEP 8.866266 12.61843
-3.75217 3.473923 12.06814
OCT 15.61078 17.54465
-1.93386 1.655617 2.741069
NOV 3.094908 -2.31318 5.408088 -5.68633 32.33438
DEC 7.577196 6.62913 0.948066 -1.22631 1.503837
2008 JAN -17.0559 -16.2974 -0.75845 0.480204 0.230596
FEB -1.05017 1.784819
-2.83499 2.55674 6.536922
MAR -13.12 -9.34478 -3.77523 3.496982 12.22888
APL 4.542762 9.130678
-4.58792 4.309671 18.57326
MAY -5.48113 -5.58525 0.10412 -0.38237 0.146203
JUN -14.5154 -16.9731 2.457673 -2.73592 7.485245
JULY 4.767099 7.454188
-2.68709 2.408844 5.802531
AUG 4.344916 0.751491
3.593425 -3.87167 14.98983
SEP -9.67084 -9.93165 0.260807 -0.53905 0.290577
OCT -24.9002 -26.3694 1.469223 -1.74747 3.053642
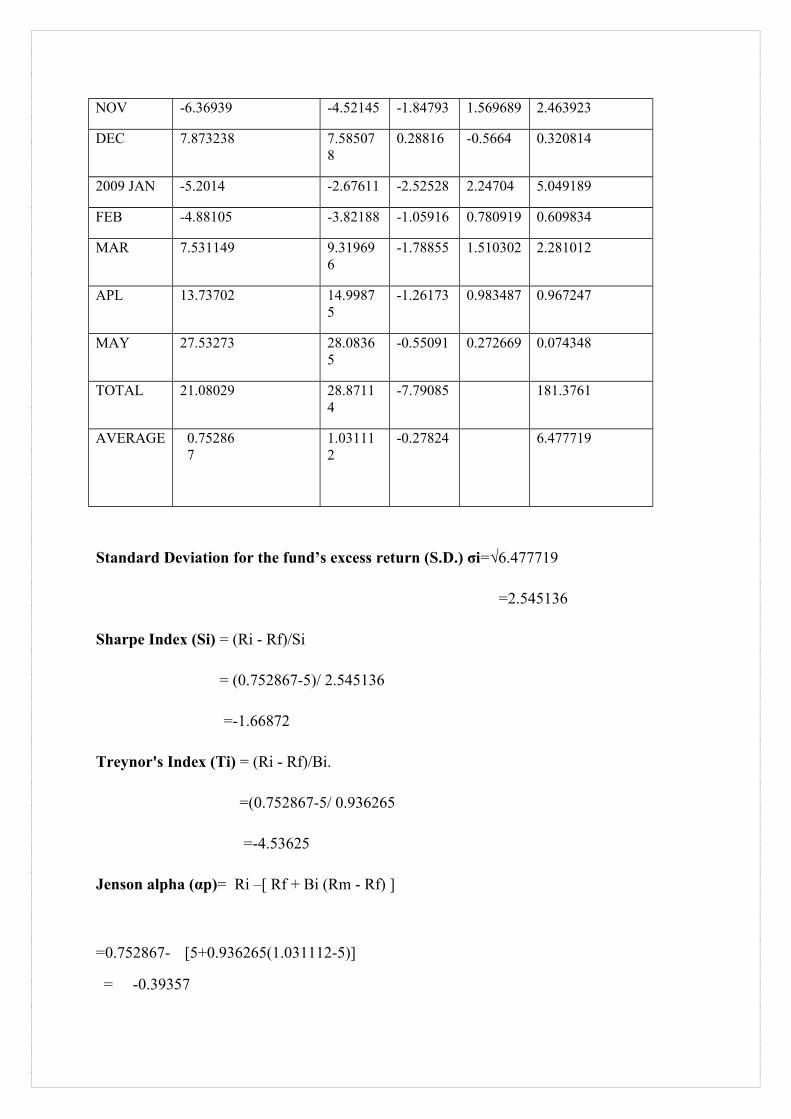
NOV -6.36939 -4.52145 -1.84793 1.569689 2.463923
DEC 7.873238 7.585078
0.28816 -0.5664 0.320814
2009 JAN -5.2014 -2.67611 -2.52528 2.24704 5.049189
FEB -4.88105 -3.82188 -1.05916 0.780919 0.609834
MAR 7.531149 9.319696
-1.78855 1.510302 2.281012
APL 13.73702 14.99875
-1.26173 0.983487 0.967247
MAY 27.53273 28.08365
-0.55091 0.272669 0.074348
TOTAL 21.08029 28.87114
-7.79085 181.3761
AVERAGE 0.752867
1.031112
-0.27824 6.477719
Standard Deviation for the fund’s excess return (S.D.) σi=√6.477719
=2.545136
Sharpe Index (Si) = (Ri - Rf)/Si
= (0.752867-5)/ 2.545136
=-1.66872
Treynor's Index (Ti) = (Ri - Rf)/Bi.
=(0.752867-5/ 0.936265
=-4.53625
Jenson alpha (αp)= Ri –[ Rf + Bi (Rm - Rf) ]
=0.752867- [5+0.936265(1.031112-5)]
= -0.39357

Expected return E(Ri) = Rf + Bi (Rm - Rf)
=[5+0.936265(1.031112-5)]
=1.284069
Fema Measures
Selectivity =Ri –[ Rf + Bi (Rm - Rf) ]
=0.752867- [5+0.936265(1.031112-5)]
= -0.39357
Diversification =[Rf + (Rm - Rf)(αi/ αm)]-[Rf + Bi (Rm - Rf) ]
=[5+(1.031112-5)( 2.545136/11.13139)]- [5+0.936265(1.031112-5)]
=2.808464
Net selectivity= selectivity- diversification
=-0.39357-2.808464
=-3.33967

HDFC GROWTH FUND
Investment objective
The primary investment objective of the Scheme is to generate long term capital appreciation
from a portfolio that is invested predominantly in equity and equity related instruments.
Basic Scheme Information
Table:3.7
Nature of Scheme Open Ended Growth Scheme
Inception Date Sep 11, 2000
Option/Plan Dividend Option, Growth Option,
Entry Load
(purchase / additional purchase / switch-
in)
NIL
(With effect from August 1, 2009)
Exit Load.
(as a % of the Applicable NAV)
Nil
Minimum Application Amount Rs.5000 and in multiples of Rs.100
thereof to open an account / folio.
Additional purchases is Rs. 1000 and in
multiples of Rs. 100 thereof
Lock-In-Period Nil
Net Asset Value Periodicity Every Business Day
Redemption Proceeds Normally despatched within 3 Business

days
Investment pattern
The corpus of the Scheme will be invested primarily in equity and equity related instruments.
The Scheme may invest a part of its corpus in debt and money market instruments, in order to
manage its liquidity requirements from time to time, and under certain circumstances, to
protect the interests of the Unit holders. The asset allocation under the Scheme will be as
follows :
Table:3.8
SR
NO.
TYPE OF INSTRUMENTS NORMAL
ALLOCATION
(%of net asset)
RISK
PROFILE
1 Equities & Equities related
instruments
80-100 Medium to
high
2 Debt securities, money market
instruments & cash
0-100 Low to
medium
Investment Strategy & Risk Control
The investment approach will be based on a set of well established but flexible principles that
emphasise the concept of sustainable economic earnings and cash return on investment as the
means of valuation of companies. In summary, the Investment Strategy is expected to be a
function of extensive research and based on data and reasoning, rather than current fashion
and emotion. The objective will be to identify "businesses with superior growth prospects and
good management, at a reasonable price".
Benchmark Index : SENSEX
Fund Manager : Mr. Shrinivas Rao

HDFC GROWTH FUND
Table:3.9
NAV SENSEX Ri Rm Ri Rm Rm-Rm av
sqr(Rm-Rm av)
Rm2
2007 JAN
48.917 14090.92
FEB 45.047 12938.09 -7.91136 -8.18137 64.72575 -8.91997 79.56584 66.93478
MAR 45.461 13072.1 0.91904 1.035779 0.951922 0.297178 0.088315 1.072838
APL 48.581 13872.37 6.863025 6.12197 42.01523 5.383369 28.98066 37.47851
MAY 53.198 14544.46 9.503715 4.84481 46.0437 4.106209 16.86095 23.47219
JUN 54.695 14650.51 2.814016 0.729144 2.051821 -0.00946 8.94E-05 0.53165
JULY 58.716 15550.99 7.351677 6.146407 45.1864 5.407806 29.24437 37.77832
AUG 58.17 15318.6 -0.9299 -1.49437 1.389618 -2.23298 4.986179 2.233155
SEP 63.82 17291.1 9.71291 12.8765 125.0683 12.1379 147.3287 165.8043
OCT 73.682 19837.99 15.45284 14.72949 227.6123 13.99088 195.7448 216.9577
NOV 74.895 19363.19 1.646264 -2.39339 -3.94015 -3.13199 9.809352 5.728304
DEC 80.576 20286.99 7.585286 4.770908 36.1887 4.032307 16.2595 22.76156
2008 JAN
68.432 17648.71 -15.0715 -13.0048 196.0015 -13.7434 188.8807 169.1245
FEB 67.827 17578.72 -0.88409 -0.39657 0.350606 -1.13517 1.28862 0.15727
MAR 62.15 15644.44 -8.36982 -11.0035 92.09761 -11.7421 137.8777 121.0777
APL 66.196 17287.31 6.510056 10.5013 68.36407 9.762702 95.31035 110.2774
MAY 62.813 16415.57 -5.11058 -5.04266 25.77091 -5.78126 33.42296 25.4284
JUN 53.472 13461.6 -14.8711 -17.9949 267.6048 -18.7335 350.9451 323.8174
JULY 56.819 14355.75 6.259351 6.642227 41.57603 5.903626 34.8528 44.11918
AUG 58.871 14564.53 3.611468 1.45433 5.252267 0.715729 0.512268 2.115076
SEP 54.54 12860.43 -7.35676 -11.7003 86.07665 -12.4389 154.7273 136.898
OCT 42.283 9788.06 -22.4734 -23.8901 536.8922 -24.6287 606.5731 570.737

NOV 40.089 9092.72 -5.18885 -7.10396 36.86137 -7.84256 61.50578 50.46627
DEC 41.652 9647.31 3.898825 6.099275 23.78001 5.360674 28.73683 37.20116
2009 JAN
38.443 9424.24 -7.70431 -2.31225 17.8143 -3.05085 9.307696 5.346504
FEB 36.429 8891.61 -5.23893 -5.6517 29.60885 -6.3903 40.83598 31.94174
MAR 38.73 9708.5 6.316396 9.1872 58.03 8.448599 71.37883 84.40465
APL 44.131 11403.25 13.94526 17.45635 243.4334 16.71775 279.4832 304.7242
MAY 56.982 14625.25 29.12012 28.2551 822.792 27.5165 757.1579 798.3508
TOTAL 30.39962 20.68083 3139.6 0 3381.666 3396.941
AVG 1.085701 0.738601 112.1286 0 120.7738
Figure:3.3
σm= √120.7738
=10.98971

β(Beta) =[N (ΣXY) – ΣXΣY ]/[ N (ΣX2) – (ΣX) 2 ]
= (87908.8-628.6893)/ (95114.34-427.6966)
= 87280.12/ 94686.64
= 0.921779
Table:3.10
Ri Rm Ri-Rm Dev frm ave sq of Dev frm av
Rm2
2007 JAN
FEB -7.91136 -8.18137 0.270008 0.077092104 0.005943 66.93478
MAR 0.91904 1.035779 -0.11674 0.463838642 0.215146 1.072838
APL 6.863025 6.12197 0.741056 -0.393955855 0.155201 37.47851
MAY 9.503715 4.84481 4.658905 -4.311805316 18.59167 23.47219
JUN 2.814016 0.729144 2.084872 -1.737772055 3.019852 0.53165
JULY 7.351677 6.146407 1.20527 -0.85817039 0.736456 37.77832
AUG -0.9299 -1.49437 0.564474 -0.217374552 0.047252 2.233155
SEP 9.71291 12.8765 -3.16359 3.510692544 12.32496 165.8043
OCT 15.45284 14.72949 0.723351 -0.376251086 0.141565 216.9577
NOV 1.646264 -2.39339 4.039651 -3.692551406 13.63494 5.728304
DEC 7.585286 4.770908 2.814378 -2.467278063 6.087461 22.76156
2008 JAN
-15.0715 -13.0048 -2.0667 2.413797413 5.826418 169.1245
FEB -0.88409 -0.39657 -0.48752 0.834616326 0.696584 0.15727
MAR -8.36982 -11.0035 2.633708 -2.286608411 5.228578 121.0777
APL 6.510056 10.5013 -3.99125 4.338346289 18.82125 110.2774
MAY -5.11058 -5.04266 -0.06792 0.415022146 0.172243 25.4284
JUN -14.8711 -17.9949 3.123803 -2.776702677 7.710078 323.8174
JULY 6.259351 6.642227 -0.38288 0.729975995 0.532865 44.11918
AUG 3.611468 1.45433 2.157138 -1.810037944 3.276237 2.115076
SEP -7.35676 -11.7003 4.34358 -3.996480234 15.97185 136.898

OCT -22.4734 -23.8901 1.416689 -1.069589295 1.144021 570.737
NOV -5.18885 -7.10396 1.915115 -1.568014871 2.458671 50.46627
DEC 3.898825 6.099275 -2.20045 2.547549815 6.49001 37.20116
2009 JAN
-7.70431 -2.31225 -5.39206 5.73916105 32.93797 5.346504
FEB -5.23893 -5.6517 0.412777 -0.065677352 0.004314 31.94174
MAR 6.316396 9.1872 -2.8708 3.217903695 10.3549 84.40465
APL 13.94526 17.45635 -3.51109 3.858190515 14.88563 304.7242
MAY 29.12012 28.2551 0.865017 -0.517917027 0.268238 798.3508
TOTAL 30.39962 20.68083 9.718797 -4.44089E-15 181.7403 3396.941
AVG 1.085701 0.738601 0.3471 -1.58603E-16 6.490725
Standard Deviation for the fund’s excess return (S.D.) σi=√6.490725
=2.54769
Sharpe Index (Si) = (Ri - Rf)/Si
= (1.085701-5)/ 2.54769
=-1.53641
Treynor's Index (Ti) = (Ri - Rf)/Bi.
=(1.085701-5)/ 0.921779
=-4.24646
Jenson alpha (αp)= Ri –[ Rf + Bi (Rm - Rf) ]
=1.085701- [5+0.921779 (0.738601-5)]
= 0.013767
Expected return E(Ri) = Rf + Bi (Rm - Rf)

=[5+0.921779 (0.738601-5)]
=1.071934
Fema Measures
Selectivity =Ri –[ Rf + Bi (Rm - Rf) ]
=1.085701- [5+0.921779 (0.738601-5)]
= 0.013767
Diversification =[Rf + (Rm - Rf)(αi/ αm)]-[Rf + Bi (Rm - Rf)]
=[5+(0.738601-5)( 2.54769/10.98971)]- [5+0.921779 (0.738601-5)]
=2.940167
Net selectivity= selectivity- diversification
=0.013767-2.940167
=-2.9264

HDFC LONG TERM FUND
Investment Objective
To achieve long term capital appreciation.
Basic Scheme Information
Nature of Scheme Close Ended Equity Scheme with a maturity period of 5 years
with automatic conversion into an open-ended scheme upon
maturity of the Scheme.
Inception Date 10-Feb-06
Closing Date 27-Jan-06
Option/Plan Dividend Option,Growth Option. Dividend Option currently
offers payout facility only.
Entry Load
(purchase / additional
purchase / switch-in)
NIL
(With effect from August 1, 2009)
Exit Load
(as a % of the Applicable
NAV)
(Other than Systematic
Investment Plan (SIP)/
Systematic Transfer Plan
(STP))
Redemption / Switch-out from the Date of Allotment :
• Upto 12 months 4%
• After 12 months upto 24 months 3%
• After 24 months upto 36 months 2%
• After 36 months upto 48 months 1%
• After 48 months upto 54 months 0.5%
• After 54 months upto Maturity Nil
No Exit Load shall be levied on bonus units and units
allotted on dividend reinvestment.

Specified Redemption Period A Unit holder can submit redemption/ switch-out request
only during the Specified Redemption Period. Presently, the
Specified Redemption Period is the first five Business Days
immediately after the end of each calendar half year.
Minimum Application
Amount
(Other than Systematic
Investment Plan (SIP)/
Systematic Transfer Plan
(STP))
Currently no purchases/ switch-ins are allowed into this
scheme.
Lock-In-Period Nil
Net Asset Value Periodicity Every Business Day.
Redemption Proceeds Normally dispatched within 3 Days
Current Expense Ratio (#)
(Effective Date 22nd May
2009)
On the first 100 crores average weekly net assets 2.50%
On the next 300 crores average weekly net assets 2.25%
On the next 300 crores average weekly net assets 2.00%
On the balance of the assets 1.75%
Investment Pattern
The following table provides the asset allocation of the Schemes portfolio.
Type of Instruments Minimum Allocation
(% of Net Assets)
Minimum Allocation
(% of Net Assets)
Risk Profile of
the Instrument
Equity & Equity related
instruments
70 100 High
Fixed Income Securities 0 30 Low

(including money market
instruments)
Investment Strategy
The investment strategy of the Scheme is to build and maintain a diversified portfolio of
equity stocks that have the potential to appreciate in the long run. Companies identified for
selection in the portfolio will have demonstrated a potential ability to grow at a reasonable
rate for the long term.
The aim will be to build a portfolio that adequately reflects a cross-section of the growth
areas of the economy from time to time. While the portfolio focuses primarily on a buy and
hold strategy at most times, it will balance the same with a rational approach to selling when
the valuations become too demanding even in the face of reasonable growth prospects in the
long run.
Fund Manager
Mr. Srinivas Rao Ravuri (since Apr 3, 06)
Mr. Anand Laddha - Dedicated Fund Manager - Foreign Securities
HDFC LONG TERM FUND
Table:3.11
NAV SENSEX Ri Rm Ri Rm Rm-Rm av
sqr(Rm-Rm av)
Rm2
2007 JAN
95.224 14090.92
FEB 87.782 12938.09 -7.81526 -8.18137 63.93949 -8.91997 79.56584 66.93478
MAR 86.337 13072.1 -1.64612 1.035779 -1.70502 0.297178 0.088315 1.072838
APL 91.627 13872.37 6.127153 6.12197 37.51024 5.383369 28.98066 37.47851
MAY 96.561 14544.46 5.384876 4.84481 26.0887 4.106209 16.86095 23.47219
JUN 100.695 14650.51 4.281232 0.729144 3.121633 -0.00946 8.94E-05 0.53165
JULY 102.976 15550.99 2.265256 6.146407 13.92319 5.407806 29.24437 37.77832
AUG 102.627 15318.6 -0.33891 -1.49437 0.506464 -2.23298 4.986179 2.233155

SEP 109.68 17291.1 6.87246 12.8765 88.49326 12.1379 147.3287 165.8043
OCT 118.185 19837.99 7.754376 14.72949 114.218 13.99088 195.7448 216.9577
NOV 119.445 19363.19 1.066125 -2.39339 -2.55165 -3.13199 9.809352 5.728304
DEC 128.983 20286.99 7.985265 4.770908 38.09697 4.032307 16.2595 22.76156
2008 JAN
112.202 17648.71 -13.0102 -13.0048 169.1954 -13.7434 188.8807 169.1245
FEB 110.554 17578.72 -1.46878 -0.39657 0.582478 -1.13517 1.28862 0.15727
MAR 96.105 15644.44 -13.0696 -11.0035 143.8121 -11.7421 137.8777 121.0777
APL 103.44 17287.31 7.632277 10.5013 80.14885 9.762702 95.31035 110.2774
MAY 99.18 16415.57 -4.11833 -5.04266 20.76733 -5.78126 33.42296 25.4284
JUN 85.045 13461.6 -14.2519 -17.9949 256.4613 -18.7335 350.9451 323.8174
JULY 88.972 14355.75 4.617555 6.642227 30.67085 5.903626 34.8528 44.11918
AUG 93.359 14564.53 4.930765 1.45433 7.17096 0.715729 0.512268 2.115076
SEP 82.286 12860.43 -11.8607 -11.7003 138.7739 -12.4389 154.7273 136.898
OCT 63.504 9788.06 -22.8253 -23.8901 545.298 -24.6287 606.5731 570.737
NOV 57.237 9092.72 -9.86867 -7.10396 70.10665 -7.84256 61.50578 50.46627
DEC 61.406 9647.31 7.28375 6.099275 44.42559 5.360674 28.73683 37.20116
2009 JAN
58.709 9424.24 -4.39208 -2.31225 10.15559 -3.05085 9.307696 5.346504
FEB 55.785 8891.61 -4.9805 -5.6517 28.14829 -6.3903 40.83598 31.94174
MAR 59.209 9708.5 6.137851 9.1872 56.38966 8.448599 71.37883 84.40465
APL 68.298 11403.25 15.35071 17.45635 267.9674 16.71775 279.4832 304.7242
MAY 87.958 14625.25 28.78562 28.2551 813.3405 27.5165 757.1579 798.3508
TOTAL 6.828943 20.68083 3065.056 0 3381.666 3396.941
AVG 0.243891 0.738601 109.4663 0 120.7738
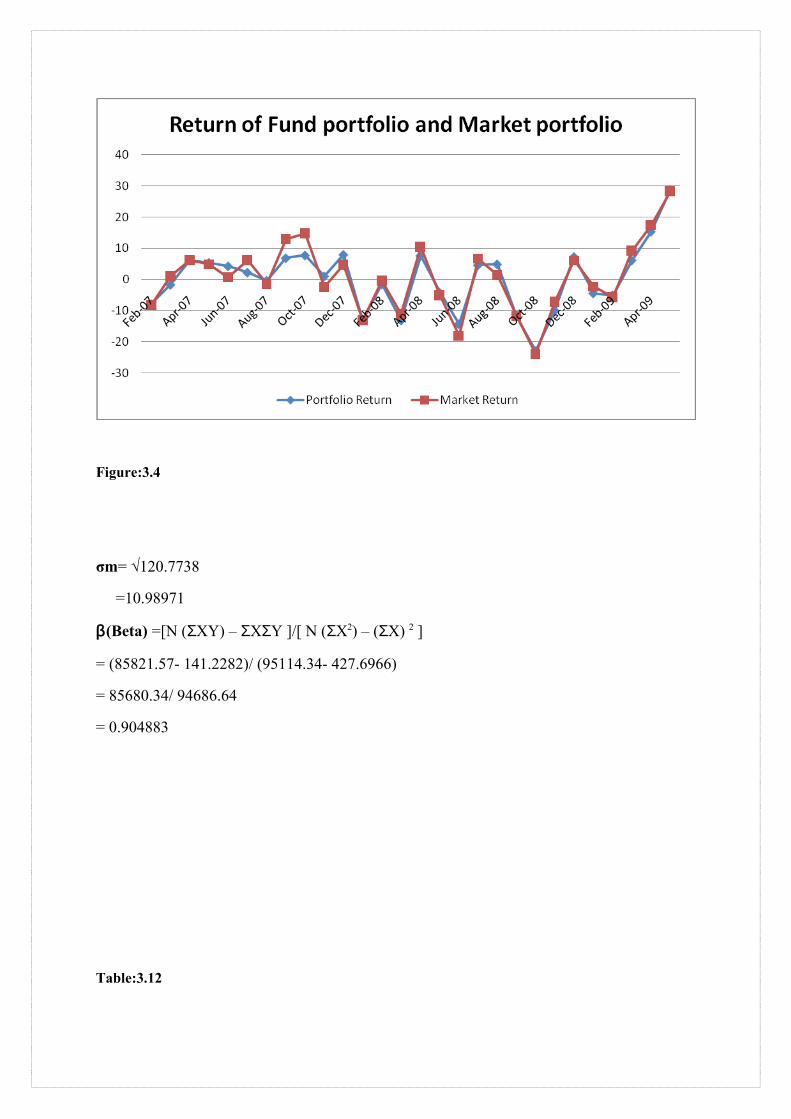
Figure:3.4
σm= √120.7738
=10.98971
β(Beta) =[N (ΣXY) – ΣXΣY ]/[ N (ΣX2) – (ΣX) 2 ]
= (85821.57- 141.2282)/ (95114.34- 427.6966)
= 85680.34/ 94686.64
= 0.904883
Table:3.12

Ri Rm Ri-Rm Dev frm ave sq of Dev frm av
2007 JAN
FEB -7.81526 -8.18137 0.366111 -0.860821325 0.741013
MAR -1.64612 1.035779 -2.6819 2.187192079 4.783809
APL 6.127153 6.12197 0.005183 -0.499893333 0.249893
MAY 5.384876 4.84481 0.540065 -1.034775537 1.07076
JUN 4.281232 0.729144 3.552088 -4.046798071 16.37657
JULY 2.265256 6.146407 -3.88115 3.386440599 11.46798
AUG -0.33891 -1.49437 1.15546 -1.650170515 2.723063
SEP 6.87246 12.8765 -6.00404 5.509332488 30.35274
OCT 7.754376 14.72949 -6.97511 6.48039862 41.99557
NOV 1.066125 -2.39339 3.459513 -3.954222903 15.63588
DEC 7.985265 4.770908 3.214357 -3.709067209 13.75718
2008 JAN
-13.0102 -13.0048 -0.00545 -0.489256261 0.239372
FEB -1.46878 -0.39657 -1.07221 0.577496505 0.333502
MAR -13.0696 -11.0035 -2.0661 1.571389464 2.469265
APL 7.632277 10.5013 -2.86903 2.374315379 5.637374
MAY -4.11833 -5.04266 0.924329 -1.419039116 2.013672
JUN -14.2519 -17.9949 3.743063 -4.237772814 17.95872
JULY 4.617555 6.642227 -2.02467 1.529961243 2.340781
AUG 4.930765 1.45433 3.476435 -3.971144712 15.76999
SEP -11.8607 -11.7003 -0.16032 -0.334386466 0.111814
OCT -22.8253 -23.8901 1.064835 -1.559545364 2.432182
NOV -9.86867 -7.10396 -2.76471 2.26999821 5.152892
DEC 7.28375 6.099275 1.184475 -1.679185121 2.819663
2009 JAN
-4.39208 -2.31225 -2.07983 1.585118054 2.512599
FEB -4.9805 -5.6517 0.671205 -1.165915514 1.359359
MAR 6.137851 9.1872 -3.04935 2.554639268 6.526182

APL 15.35071 17.45635 -2.10565 1.610935739 2.595114
MAY 28.78562 28.2551 0.530513 -1.025223388 1.051083
TOTAL 6.828943 20.68083 -13.8519 -4.44089E-15 210.478
AVG 0.243891 0.738601 -0.49471 -1.58603E-16 5.538895
Standard Deviation for the fund’s excess return (S.D.) σi=√5.538895
=2.353486
Sharpe Index (Si) = (Ri - Rf)/Si
= (0.243891-5)/ 2.353486
=-2.02088
Treynor's Index (Ti) = (Ri - Rf)/Bi.
=(0.243891-5)/ 0.904883
=-5.25605
Jenson alpha (αp)= Ri –[ Rf + Bi (Rm - Rf) ]
=0.243891- [5+0.904883 (0.738601-5)]
= -0.90004
Expected return E(Ri) = Rf + Bi (Rm - Rf)
=[5+0.904883 (0.738601-5)]
=1.143932
Fema Measures
Selectivity =Ri –[ Rf + Bi (Rm - Rf) ]

=0.243891- [5+0.904883 (0.738601-5)]
= -0.90004
Diversification =[Rf + (Rm - Rf)(αi/ αm)]-[Rf + Bi (Rm - Rf)]
=[5+(0.738601-5)( 2.353486/10.98971)]- [5+0.904883 (0.738601-5)]
=2.943474
Net selectivity= selectivity- diversification
=-0.90004-2.943474
=-3.84352
HDFC TAXSAVER
Investment Objective
The investment objective of the Scheme is to achieve long term growth of capital.
Basic Scheme Information
Table:3.13
Nature of Scheme Open Ended Equity Linked Saving
Scheme
Inception Date Mar 31, 1996
Option/Plan Dividend Option, Growth Option,
Entry Load
(purchase / additional purchase / switch-
in)
NIL
(With effect from August 1, 2009)
Exit Load.
(as a % of the Applicable NAV)
Nil
Minimum Application Amount Rs.5000 and in multiples of Rs.100

thereof to open an account / folio.
Lock-In-Period 3 yrs
Net Asset Value Periodicity Every Business Day
Redemption Proceeds Normally despatched within 3 Business
days
Investment Pattern
The asset allocation under the Scheme will be as follows:
Table:3.14
SR NO. ASSET TYPE (% OF
PORTFOLIO)
RISK
PROFILE
1 Equities & Equities
related instruments
Minimum 80% Medium to high
2 Debt securities, money
market instruments &
cash
Minimum 20% Low to medium
Investment in Securitized debt, if undertaken, would not exceed 20% of the net assets of the
scheme.
The Scheme may also invest up to 25% of net assets of the Scheme in derivatives such as
Futures & Options and such other derivative instruments as may be introduced from time to
time for the purpose of hedging and portfolio balancing and and other uses as may be
permitted under the regulations and guidelines.
The Scheme may also invest a part of its corpus, not exceeding 40% of its net assets, in
overseas markets in Global Depository Receipts (GDRs), ADRs, overseas equity, bonds and
mutual funds and such other instruments as may be allowed under the Regulations from time
to time. The ELSS (Equity Linked Savings Scheme) guidelines, as applicable, would be
adhered to in the management of this Fund. If the investment in equities and related

instruments falls below 80% of the portfolio of the Scheme at any point in time, it would be
endeavoured to review and rebalance the composition.
Benchmark Index :
S&P CNX 500. HDFC Tax saver, which is benchmarked to S&P CNX 500 Index is not
sponsored, endorsed, sold or promoted by Indian Index Service & Products Limited (IISL).
Fund Manager : Dhawal Mehta
HDFC TAX SAVER FUND
Table:3.15
NAV S&P CNX 500
Ri Rm Ri Rm Rm-Rm av
sqr(Rm-Rm av)
Rm2
2007 JAN
146.134 4899.39
FEB 135.133 4504.73 -7.52802 -8.05529 60.64039 -9.0864 82.56268 64.88767
MAR 133.882 4605.89 -0.92575 2.24564 -2.07891 1.214527 1.475077 5.042897
APL 144.308 4934.46 7.787455 7.133692 55.5533 6.10258 37.24148 50.88956
MAY 153.765 5185.95 6.553344 5.096606 33.39982 4.065494 16.52824 25.9754
JUN 156.535 5223.82 1.80145 0.730242 1.315495 -0.30087 0.090523 0.533254
JULY 163.61 5483.25 4.519756 4.966289 22.44641 3.935177 15.48562 24.66403
AUG 161.481 5411.29 -1.30127 -1.31236 1.707729 -2.34347 5.491863 1.72229
SEP 173.27 6094.11 7.300549 12.61843 92.12149 11.58732 134.266 159.2248
OCT 198.737 7163.3 14.69787 17.54465 257.8689 16.51353 272.6968 307.8146
NOV 196.735 6997.6 -1.00736 -2.31318 2.330208 -3.34429 11.18429 5.3508
DEC 204.284 7461.48 3.837141 6.62913 25.43691 5.598018 31.3378 43.94536
2008 JAN
173.277 6245.45 -15.1784 -16.2974 247.3687 -17.3285 300.2786265.6065
FEB 171.845 6356.92 -0.82642 1.784819 -1.47501 0.753707 0.568075 3.18558
MAR 152.02 5762.88 -11.5366 -9.34478 107.8066 -10.3759 107.6591 87.32486
APL 158.411 6289.07 4.204052 9.130678 38.38584 8.099566 65.60296 83.36928

MAY 148.793 5937.81 -6.07155 -5.58525 33.91109 -6.61636 43.77619 31.19497
JUN 126.45 4929.98 -15.0162 -16.9731 254.8707 -18.0042 324.1514 288.0859
JULY 135.953 5297.47 7.515223 7.454188 56.01989 6.423076 41.25591 55.56493
AUG 142.358 5337.28 4.711187 0.751491 3.540414 -0.27962 0.078188 0.564738
SEP 132.682 4807.2 -6.79695 -9.93165 67.50492 -10.9628 120.1822 98.63768
OCT 99.119 3539.57 -25.2958 -26.3694 667.0357 -27.4005 750.7883 695.3455
NOV 90.957 3379.53 -8.23455 -4.52145 37.23212 -5.55257 30.83098 20.44354
DEC 98.972 3635.87 8.811856 7.585078 66.83862 6.553966 42.95447 57.53341
2009 JAN
93.555 3538.57 -5.47327 -2.67611 14.64708 -3.70723 13.743527.161582
FEB 89.449 3403.33 -4.38886 -3.82188 16.77372 -4.85299 23.55156 14.60679
MAR 97.063 3720.51 8.512113 9.319696 79.3303 8.288584 68.70062 86.85673
APL 112.05 4278.54 15.44049 14.99875 231.588 13.96764 195.0949 224.9625
MAY 144.827 5480.11 29.25212 28.08365 821.5062 27.05253 731.8396 788.6911
TOTAL 15.36369 28.87114 3293.627 0 3469.417 3499.186
AVG 0.548703 1.031112 117.6295 123.9077

Figure:3.5
σm= √123.9077
=11.13139
β(Beta) =[N (ΣXY) – ΣXΣY ]/[ N (ΣX2) – (ΣX) 2 ]
= (92221.54- 443.5671)/ (97977.21- 833.5426)
= 91777.98/ 97143.67
= 0.944765
Table:3.16
Ri Rm Ri-Rm Dev frm ave
sq of Dev frm av
2007 JAN
FEB -7.52802 -8.05529 0.527266 -1.00968 1.019444
MAR -0.92575 2.24564 -3.17139 2.688985 7.230641
APL 7.787455 7.133692 0.653763 -1.13617 1.290886
MAY 6.553344 5.096606 1.456738 -1.93915 3.760291
JUN 1.80145 0.730242 1.071208 -1.55362 2.413726
JULY 4.519756 4.966289 -0.44653 -0.03588 0.001287
AUG -1.30127 -1.31236 0.011095 -0.4935 0.243546
SEP 7.300549 12.61843 -5.31788 4.835475 23.38182
OCT 14.69787 17.54465 -2.84678 2.364366 5.590227
NOV -1.00736 -2.31318 1.305818 -1.78823 3.197757
DEC 3.837141 6.62913 -2.79199 2.30958 5.334158
2008 JAN
-15.1784 -16.2974 1.119058 -1.60147 2.564696
FEB -0.82642 1.784819 -2.61124 2.128833 4.531929
MAR -11.5366 -9.34478 -2.19178 1.709373 2.921956
APL 4.204052 9.130678 -4.92663 4.444217 19.75106

MAY -6.07155 -5.58525 -0.4863 0.003894 1.52E-05
JUN -15.0162 -16.9731 1.956929 -2.43934 5.950372
JULY 7.515223 7.454188 0.061035 -0.54344 0.295331
AUG 4.711187 0.751491 3.959696 -4.44211 19.7323
SEP -6.79695 -9.93165 3.134702 -3.61711 13.08349
OCT -25.2958 -26.3694 1.073584 -1.55599 2.421115
NOV -8.23455 -4.52145 -3.71309 3.230684 10.43732
DEC 8.811856 7.585078 1.226778 -1.70919 2.921319
2009 JAN
-5.47327 -2.67611 -2.79715 2.314743 5.358035
FEB -4.38886 -3.82188 -0.56698 0.08457 0.007152
MAR 8.512113 9.319696 -0.80758 0.325174 0.105738
APL 15.44049 14.99875 0.441737 -0.92415 0.854046
MAY 29.25212 28.08365 1.168474 -1.65088 2.725415
TOTAL 15.36369 28.87114 -13.5075 147.1251
AVG 0.548703 1.031112 -0.48241 5.254467
Standard Deviation for the fund’s excess return (S.D.) σi=√ 5.254467
= 2.292262
Sharpe Index (Si) = (Ri - Rf)/Si
= (0.548703-5)/ 2.292262
=-1.94188
Treynor's Index (Ti) = (Ri - Rf)/Bi.
=(0.548703-5)/ 0.944765
=-4.71154
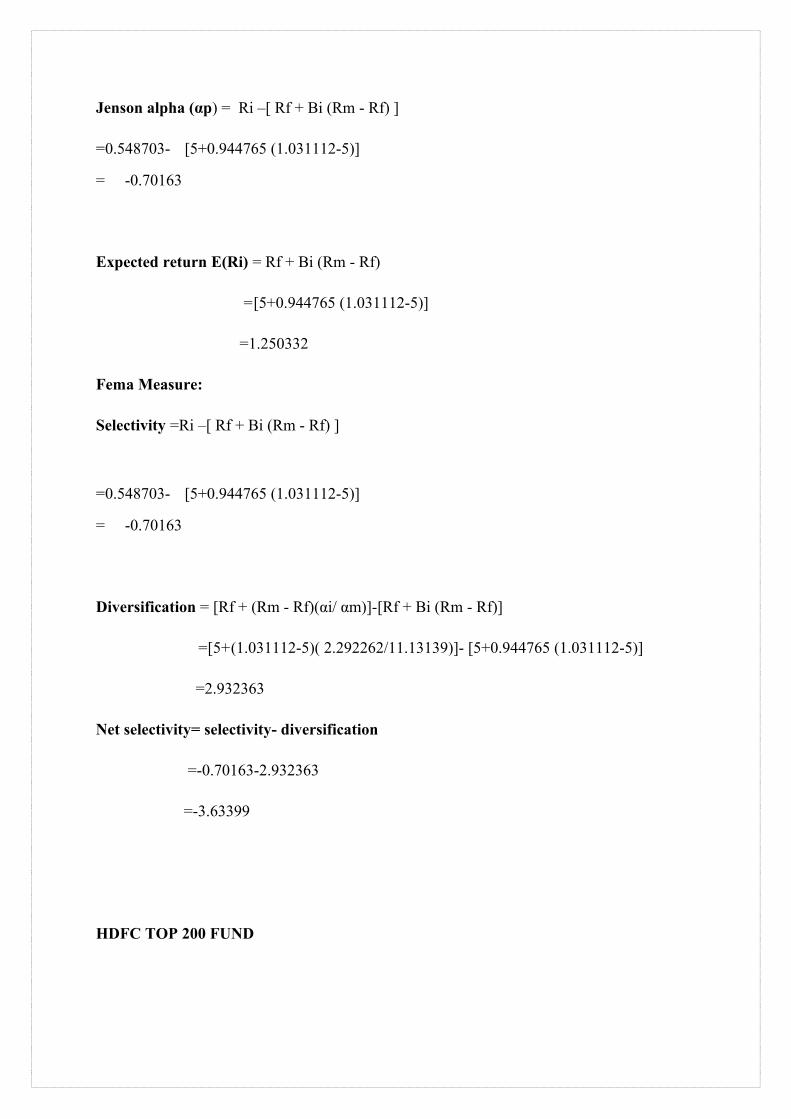
Jenson alpha (αp) = Ri –[ Rf + Bi (Rm - Rf) ]
=0.548703- [5+0.944765 (1.031112-5)]
= -0.70163
Expected return E(Ri) = Rf + Bi (Rm - Rf)
=[5+0.944765 (1.031112-5)]
=1.250332
Fema Measure:
Selectivity =Ri –[ Rf + Bi (Rm - Rf) ]
=0.548703- [5+0.944765 (1.031112-5)]
= -0.70163
Diversification = [Rf + (Rm - Rf)(αi/ αm)]-[Rf + Bi (Rm - Rf)]
=[5+(1.031112-5)( 2.292262/11.13139)]- [5+0.944765 (1.031112-5)]
=2.932363
Net selectivity= selectivity- diversification
=-0.70163-2.932363
=-3.63399
HDFC TOP 200 FUND
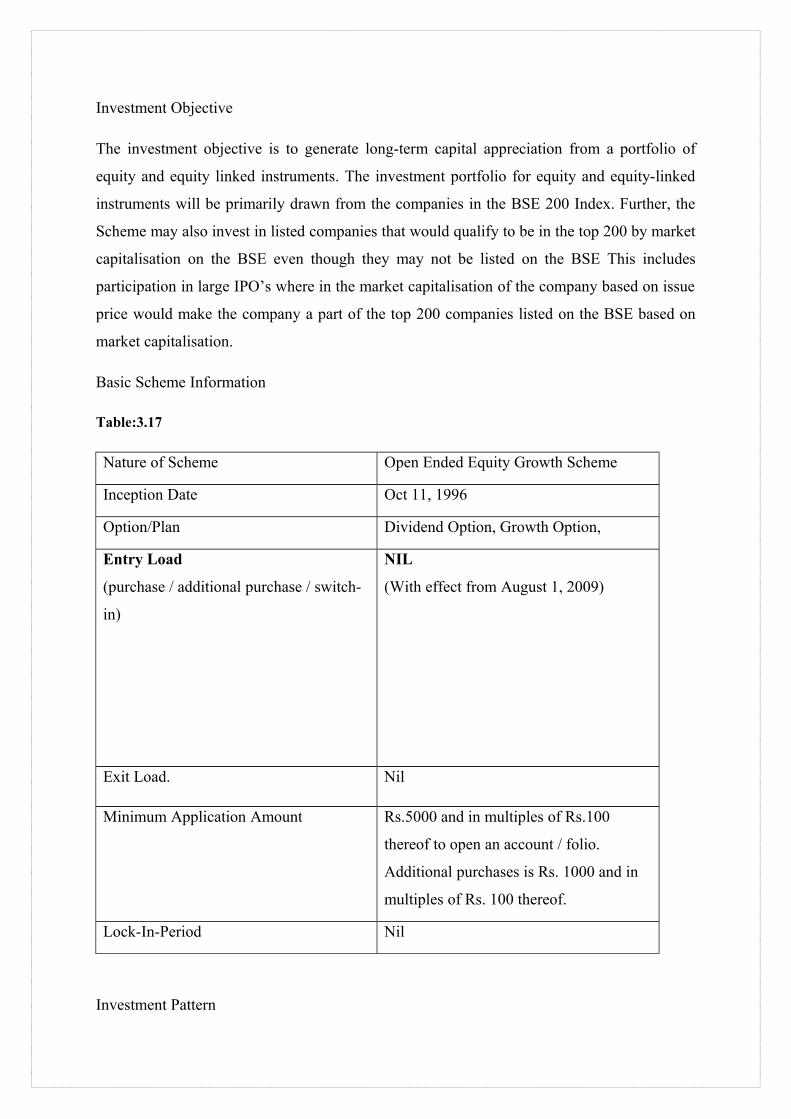
Investment Objective
The investment objective is to generate long-term capital appreciation from a portfolio of
equity and equity linked instruments. The investment portfolio for equity and equity-linked
instruments will be primarily drawn from the companies in the BSE 200 Index. Further, the
Scheme may also invest in listed companies that would qualify to be in the top 200 by market
capitalisation on the BSE even though they may not be listed on the BSE This includes
participation in large IPO’s where in the market capitalisation of the company based on issue
price would make the company a part of the top 200 companies listed on the BSE based on
market capitalisation.
Basic Scheme Information
Table:3.17
Nature of Scheme Open Ended Equity Growth Scheme
Inception Date Oct 11, 1996
Option/Plan Dividend Option, Growth Option,
Entry Load
(purchase / additional purchase / switch-
in)
NIL
(With effect from August 1, 2009)
Exit Load. Nil
Minimum Application Amount Rs.5000 and in multiples of Rs.100
thereof to open an account / folio.
Additional purchases is Rs. 1000 and in
multiples of Rs. 100 thereof.
Lock-In-Period Nil
Investment Pattern
The asset allocation under the Scheme will be as follows:
Table:3.18
SR NO. ASSET TYPE (% OF PORTFOLIO) RISK
PROFILE
1 Equities & Equities
related instruments
Upto 100% (including use of
derivatives for hedging and other
uses as permitted by prevailing
SEBI Regulations)
Medium to high
2 Debt securities, money
market instruments &
cash
Balance in Debt & Money Market
Instruments
Low to medium
Investment in Securitised debt, if undertaken, would not exceed 20% of the net assets of the
scheme. The Scheme may also invest upto 25% of net assets of the Scheme in derivatives
such as Futures & Options and such other derivative instruments as may be introduced from
time to time for the purpose of hedging and portfolio balancing and other uses as may be
permitted under the regulations and guidelines.
Investment Strategy & Risk Control
The investment strategy of primarily restricting the equity portfolio to the BSE 200 Index
scrips is intended to reduce risks while maintaining steady growth. Stock specific risk will be
minimised by investing only in those companies / industries that have been thoroughly
researched by the investment manager's research team. Risk will also be reduced through a
diversification of the portfolio.
Benchmark Index : BSE 200
Fund Manager : Mr. Prashant Jain
HDFC TOP 200 FUND
Table:3.19
Ri Rm Ri Rm Rm-AvRm (Rm-AvRm)2
Rm2

2007 JAN
112.359 1687.35
FEB 103.269 1545.27 -8.09014 -8.4203 68.12144 -9.34081 87.25075 70.90152
MAR 104.504 1556.72 1.195906 0.740971 0.886131 -0.17954 0.032233 0.549038
APRIL
111.805 1666.14 6.986335 7.028881 49.10612 6.108374 37.31223 49.40517
MAY 119.096 1766.08 6.521175 5.998295 39.11594 5.077788 25.78393 35.97955
JUNE 120.34 1804.81 1.044536 2.192992 2.290658 1.272485 1.619219 4.809216
JULY 127.614 1894.18 6.04454 4.951768 29.93116 4.031261 16.25106 24.52
AUG 126.201 1857.7 -1.10725 -1.9259 2.132443 -2.84641 8.10203 3.709088
SEPT 140.49 2118.86 11.32241 14.05824 159.1733 13.13774 172.6001 197.6342
OCT 160.215 2439.87 14.04015 15.15013 212.71 14.22962 202.4821 229.5264
NOV 158.356 2454.23 -1.16032 0.588556 -0.68291 -0.33195 0.110192 0.346398
DEC 169.794 2656.52 7.222966 8.242504 59.53532 7.321997 53.61163 67.93887
2008 JAN
147.718 2230.39 -13.0016 -16.0409 208.5581 -16.9614 287.6897 257.3108
FEB 147.689 2217.47 -0.01963 -0.57927 0.011372 -1.49978 2.249334 0.335555
MAR 131.544 1932.41 -10.9318 -12.8552 140.5298 -13.7757 189.7699 165.2559
APRIL
143.025 2157.52 8.727878 11.64918 101.6727 10.72868 115.1045 135.7035
MAY 137.675 2038.22 -3.7406 -5.5295 20.68366 -6.45 41.60255 30.57534
JUNE 115.424 1644.18 -16.162 -19.3326 312.4523 -20.2531 410.1865 373.7477
JULY 123.902 1749.11 7.345093 6.381905 46.87568 5.461398 29.82686 40.72871
AUG 129.235 1782.08 4.304208 1.884959 8.113254 0.964452 0.930167 3.553069
SEPT 118.754 1555.7 -8.11003 -12.7031 103.0228 -13.6236 185.6036 161.3696
OCT 92.324 1145.68 -22.2561 -26.356 586.5812 -27.2765 744.0068 694.6377
NOV 86.546 1062.35 -6.25839 -7.27341 45.51987 -8.19392 67.14027 52.90249
DEC 92.798 1156.59 7.223904 8.870899 64.08253 7.950392 63.20874 78.69286
2009 JAN
88.074 1107.06 -5.09063 -4.28242 21.80018 -5.20292 27.07041 18.33909
FEB 84.379 1044.94 -4.19534 -5.61126 23.54111 -6.53177 42.66396 31.48622
MAR 92.552 1140.43 9.686059 9.138324 88.51435 8.217817 67.53251 83.50896

APRIL
107.584 1339.38 16.24168 17.44517 283.3389 16.52467 273.0646 304.3341
MAY 139.341 1772.82 29.51833 32.36124 955.2498 31.44073 988.5198 1047.25
Total 37.30138 25.7742 3632.867 0 4141.326 4165.051
Average
1.332192 0.920507 129.7453 0 147.9045
Figure:3.6
σm= √147.9045
=12.1616
β(Beta) =[N (ΣXY) – ΣXΣY ]/[ N (ΣX2) – (ΣX) 2 ]

= (101720.3- 961.4133)/ (116621.4- 664.3093)
= 100758.9/ 115957.1
= 0.868932
Table:3.20
Ri Rm Ri-Rm dev frm av sq of dev Rm2
2007 JAN
FEB -8.09014 -8.4203 0.330164 0.081521 0.006646 70.90152
MAR 1.195906 0.740971 0.454935 -0.04325 0.001871 0.549038
APRIL 6.986335 7.028881 -0.04255 0.454231 0.206326 49.40517
MAY 6.521175 5.998295 0.52288 -0.11119 0.012364 35.97955
JUNE 1.044536 2.192992 -1.14846 1.560142 2.434043 4.809216
JULY 6.04454 4.951768 1.092773 -0.68109 0.46388 24.52
AUG -1.10725 -1.9259 0.818654 -0.40697 0.165624 3.709088
SEPT 11.32241 14.05824 -2.73583 3.147515 9.906851 197.6342
OCT 14.04015 15.15013 -1.10998 1.521668 2.315473 229.5264
NOV -1.16032 0.588556 -1.74887 2.160557 4.668006 0.346398
DEC 7.222966 8.242504 -1.01954 1.431223 2.048399 67.93887
2008 JAN
-13.0016 -16.0409 3.039273 -2.62759 6.90422 257.3108
FEB -0.01963 -0.57927 0.559639 -0.14795 0.02189 0.335555
MAR -10.9318 -12.8552 1.923436 -1.51175 2.285389 165.2559
APRIL 8.727878 11.64918 -2.92131 3.332991 11.10883 135.7035
MAY -3.7406 -5.5295 1.788892 -1.37721 1.896699 30.57534
JUNE -16.162 -19.3326 3.170579 -2.75889 7.611496 373.7477
JULY 7.345093 6.381905 0.963188 -0.5515 0.304156 40.72871
AUG 4.304208 1.884959 2.41925 -2.00756 4.030315 3.553069
SEPT -8.11003 -12.7031 4.593101 -4.18142 17.48424 161.3696
OCT -22.2561 -26.356 4.099889 -3.6882 13.60285 694.6377
NOV -6.25839 -7.27341 1.015015 -0.60333 0.364007 52.90249
DEC 7.223904 8.870899 -1.647 2.058681 4.238165 78.69286
2009 JAN
-5.09063 -4.28242 -0.80821 1.219896 1.488145 18.33909
FEB -4.19534 -5.61126 1.415923 -1.00424 1.008493 31.48622
MAR 9.686059 9.138324 0.547736 -0.13605 0.01851 83.50896
APRIL 16.24168 17.44517 -1.20349 1.615179 2.608803 304.3341
MAY 29.51833 32.36124 -2.84291 3.254597 10.5924 1047.25
37.30138 25.7742 11.52718 107.7981 4165.051
1.332192 0.920507 0.411685 3.849932
Standard Deviation for the fund’s excess return (S.D.) σi=√3.849932
=1.962124
Sharpe Index (Si) = (Ri - Rf)/Si
= (1.332192-5)/ 1.962124
=-1.8693
Treynor's Index (Ti) = (Ri - Rf)/Bi.
= (4.528901-5)/ 0.868932
=-4.22105
Jenson alpha (αp)= Ri –[ Rf + Bi (Rm - Rf) ]
=1.332192- [5+0.868932 (0.920507-5)]
= -0.12301
Expected return E(Ri) = Rf + Bi (Rm - Rf)

=[5+0.868932 (0.920507-5)]
=1.455198
Fema Measure:
Selectivity =Ri –[ Rf + Bi (Rm - Rf) ]
=1.332192- [5+0.868932 (0.920507-5)]
= -0.12301
Diversification =[Rf + (Rm - Rf)(αi/ αm)]-[Rf + Bi (Rm - Rf)]
=[5+(0.920507-5)( 1.962124/12.1616)]- [5+0.868932 (0.920507-5)]
=2.886626
Net selectivity= selectivity- diversification
=-0.12301-2.886626
=-2.87834
3.2 ANALYSIS OF THE OBSERVATION:
The table given below illustrates the comparison among the analysed funds based on the different measures of comparison.
Performance of Fund portfolio and Benchmark return for 29 months (jan07-may08)
Table:3.21
FUND RETURNS
BENCHMARK RETURN
EQUITY FUND
12.22546 11.8529
Capital builder
4.872865 11.8529

Growth fund
16.48711 3.792016
Long term adv
-7.63043 3.792016
Tax saver -0.89438 11.8529
Top 200 24.0141 5.065339
Figure:3.7
Performance Evaluation against Benchmarks
The above table presents return and risk of the six funds along with market return and risk.
From the table it is evident that, Top 200, Equity fund and Growth fund have earned greater
return as against the market earning. Capital builder, Long term advantage and Tax saver
funds have not earned higher return than the Market portfolio. Long-term advantage and Tax
saver funds have even negative returns.

Comparison of ratios:
Table:3.22
Fund name
S.D. market
S.D. fund B value Sharpe ratio
Treynor ratio
Jenson’s alpha
Fema Retuns jan07- may08(29 months)
HDFC Equity
11.13239 2.392215 1.0096114 -1.64557 -3.89907 0.070488 -3.0836 12.22546
HDFC Capital Builder
11.13239 2.545136 0.936265 -1.66872 -4.53625 -0.39357 -3.33967 4.872865
HDFC Growth Fund
10.98971 2.54769 0.921779 -1.53641 -4.24646 0.013767 -2.9264 16.48711
HDFC Long Term Adv
10.98971 2.353486 0.904883 -2.02088 -5.25605 -0.90004 -3.84352 -7.63043
HDFC Tax saver
11.13139 2.292262 0.944765 -1.94188 -4.71154 -0.70163 -3.63399 -0.89438
HDFC Top 200
12.1616 1.962124 0.868932 -1.8693 -4.22105 -0.12301 -2.87834 24.0141

Standard Deviation of the Market:
High standard deviation of a fund implies high volatility and a low standard deviation implies
low volatility. HDFC equity fund, HDFC capital Builder and HDFC Tax saver take S&P
CNX 500 as their benchmark, HDFC Growth fund and HDFC long term have taken Sensex
as bench mark and HDFC Top 200 has taken BSE 200 as its bench mark. We found out that
BSE 200’s S.D. is 12.1616, which is greater than Sensex and S&P CNX 500 having
10.98971 and 11.13139 S.D. respectively. Therefore, BSE 200 is more volatile than Sensex
and S&P CNX 500.
Standard deviation of the Fund:
It has been found that HDFC Top 200’s S.D. is lesser than all other funds. Although
benchmark index (BSE 200) is more volatile as it has higher S.D. than other indexes still
HDFC Top 200 is less volatile because of lesser fund S.D. This is might be because of
diversification of unsystematic risk as it compensates the systematic risk.
β Value :
As we know in case of funds, beta would indicate the volatility against the benchmark index.
It is used as a short term decision making tool. A beta that is greater than 1 means that the
fund is more volatile than the benchmark index, while a beta of less than 1 means that the
fund is more volatile than the benchmark index. A fund with a beta very close to 1 means the
fund’s performance closely matches the index or benchmark.
The analysis illustrates that HDFC Equity fund’s is less volatile and its performance is very
close to its benchmark as its beta value is 1.0096114 compared to other funds which have
beta value lesser than 1 point. HDFC Top 200’s beta value is more volatile than the
benchmark as its value is 0.868932, which is very far from point 1.
Sharpe ratio:
A fund with a higher Sharpe ratio means that these returns have been generated taking lesser
risk. In other words, the fund is less volatile and yet generating good return.
The analysis shows that all the funds have negative Sharpe ratio therefore they are more
risky. Comparing all the funds HDFC growth fund has lesser negative marks that means its
return 16.48711 is generated taking lesser risk.

Treynor ratio:
While a high and positive Treynor's Index shows a superior risk-adjusted performance of a
fund, a low and negative Treynor's Index is an indication of unfavourable performance
(systematic risk associated with it (beta)).
All the funds are having negative Treynor’s ratio which means they are affected by the
volatility of the market (systematic risk)or by the great recession.
Jenson’s alpha:
Its measure involves evaluation of the returns that the fund has generated vs. the returns
actually expected out of the fund given the level of its systematic risk. Higher alpha
represents superior performance of the fund and vice versa.
The analysis points out that all the funds are having negative alpha except HDFC Equity fund
and HDFC Growth fund which have positive points. Jenson alpha ratio justifies that these
two funds are at least able to achieve the expected return given the level of their systematic
risk.
Fema measure:
The Net Selectivity (Fema) represents the stock selection skill of the fund manager, as it is
the excess returns over and above the return required to compensate for the total risk taken by
the fund manager. Higher value of which indicates that fund manager has earned returns well
above the return commensurate with the level of risk taken by him.
It has been that all the funds are having negative net selectivity because of the higher risk
found both in systematic risk (B) and unsystematic risk. This findings point out, that the stock
selection of the fund manager has been failed because of the systematic risk i.e. recession.
Comparing to other funds HDFC Growth fund (-2.9264) has lesser negative points in this
time of great crisis. This indicates that HDFC Growth fund is getting enhanced return by
nullifying systematic risk and unsystematic risk.
From the above analysis there is no fund which has consistency. The funds are being affected
very badly either by the systematic risk or by the unsystematic risk. As we observe closely, it
is the HDFC Growth fund, which has better option for the investment. Its Sharpe ratio is

lesser negative than other funds which illustrates that its return is less affected by overall risk.
Its alpha value is more than 0 which means its less affected by the market risk (systematic
risk) and also its Fema value (selectivity) has lesser negative value which has managed to
nullify systematic risk and unsystematic risk during the time of recession.
An investor who is entering into the capital market for making long-term investment, the
volatility of the market is important to accomplish his or her goal and these expectations are
often formed on the basis of historical record of monthly returns, measured for holding period
and other important ratios. We will take this fund (HDFC Growth fund) for further analysis
of its portfolio.
HDFC Growth Fund Portfolio Analysis
Table:3.23
Portfolio 31-May-09
Name of Instrument Industry + Quantity Market/ Fair Value(Rs. In Lakhs)
% toNAV
Equity & Equity Related
(a) Listed / awaiting listing on Stock Exchanges
State Bank of India Banks 448,000 8,372.45 7.20
Zee Entertainment Enterprises Ltd. Media & Entertainment
4,160,179 7,001.58 6.02
ICICI Bank Ltd. Banks 932,397 6,901.14 5.93
Bharti Airtel Ltd. Telecom - Services 750,346 6,159.59 5.30
Crompton Greaves Ltd. Industrial Capital Goods
2,099,819 5,513.07 4.74
Bharat Petroleum Corporation Limited Petroleum Products 926,557 4,305.71 3.70
Housing Development Finance Corporation Ltd.$
Finance 182,500 3,977.77 3.42
Exide Industries Ltd. Auto Ancillaries 5,319,910 3,769.16 3.24
Divis Laboratories Ltd. Pharmaceuticals 318,535 3,666.18 3.15

Sun Pharmaceutical Industries Ltd. Pharmaceuticals 272,365 3,305.83 2.84
H T Media Ltd. Media & Entertainment
2,307,000 2,861.83 2.46
Solar Explosives Ltd. Chemicals 913,257 2,807.81 2.41
Nestle India Ltd. Consumer Non Durables
160,268 2,766.79 2.38
Dr Reddys Laboratories Ltd. Pharmaceuticals 420,000 2,719.50 2.34
ITC Ltd. Consumer Non Durables
1,462,305 2,685.52 2.31
Coromandel Fertilisers Ltd. Fertilisers 1,433,271 2,608.55 2.24
Biocon Limited Pharmaceuticals 1,319,006 2,397.95 2.06
Reliance Industries Ltd. Petroleum Products 104,250 2,368.46 2.04
Hindustan Petroleum Corporation Ltd. Petroleum Products 633,721 2,300.09 1.98
Dabur India Ltd. Consumer Non Durables
2,050,115 2,264.35 1.95
Bank of Baroda Banks 469,151 2,058.63 1.77
Infosys Technologies Ltd Software 120,000 1,926.12 1.66
MphasiS Limited Software 569,000 1,916.96 1.65
Axis Bank Ltd Banks 220,000 1,713.69 1.47
Apollo Tyres Ltd Auto Ancillaries 5,367,120 1,682.59 1.45
Tata Steel Limited Ferrous Metals 400,000 1,621.40 1.39
Hindustan Unilever Ltd. Consumer Non Durables
653,355 1,507.94 1.30
Noida Toll Bridge Company Ltd. Transportation 3,607,000 1,441.00 1.24
Thermax Ltd. Industrial Capital Goods
367,366 1,345.29 1.16
Oil & Natural Gas Corporation Ltd. Oil 111,353 1,301.99 1.12
Nagarjuna Construction Co. Ltd. Construction Project 711,738 990.03 0.85
Ballarpur Industries Ltd. Paper Products 3,967,287 987.85 0.85
Eimco Elecon (India) Ltd. Industrial Capital Goods
276,428 811.18 0.70
Amara Raja Batteries Ltd. Auto Ancillaries 836,454 705.97 0.61

C & C Constructions Ltd Construction 396,496 635.78 0.55
Maytas Infra Ltd Construction 761,912 552.01 0.47
KNR Construction limited Construction 710,597 531.53 0.46
ISMT Ltd. Ferrous Metals 1,175,668 413.25 0.36
Ahmednagar Forgings Ltd. Industrial Products 424,234 245.21 0.21
Disa India Ltd Engineering 12,612 207.85 0.18
Technocraft Industries (India) Ltd Ferrous Metals 538,745 199.07 0.17
Sub total 101,548.67 87.33
Total 101,548.67 87.33
Short Term Deposits as margin for Futures & Options 1,000.00 0.86
Cash margin / Earmarked cash for Futures & Options 5,072.00 4.36
Other Cash,Cash Equivalents and Net Current Assets 8,679.32 7.45
Net Assets 116,299.99 100.00
Table:3.24
Sectoral Allocation of Assets(%)
Banks 16.37
Pharmaceuticals 10.39
Media & Entertainment 8.48
Consumer Non Durables 7.94
Petroleum Products 7.72
Industrial Capital Goods 6.60
Telecom - Services 5.30
Auto Ancillaries 5.30
Finance 3.42
Software 3.31
Chemicals 2.41
Fertilisers 2.24
Ferrous Metals 1.92
Construction 1.48
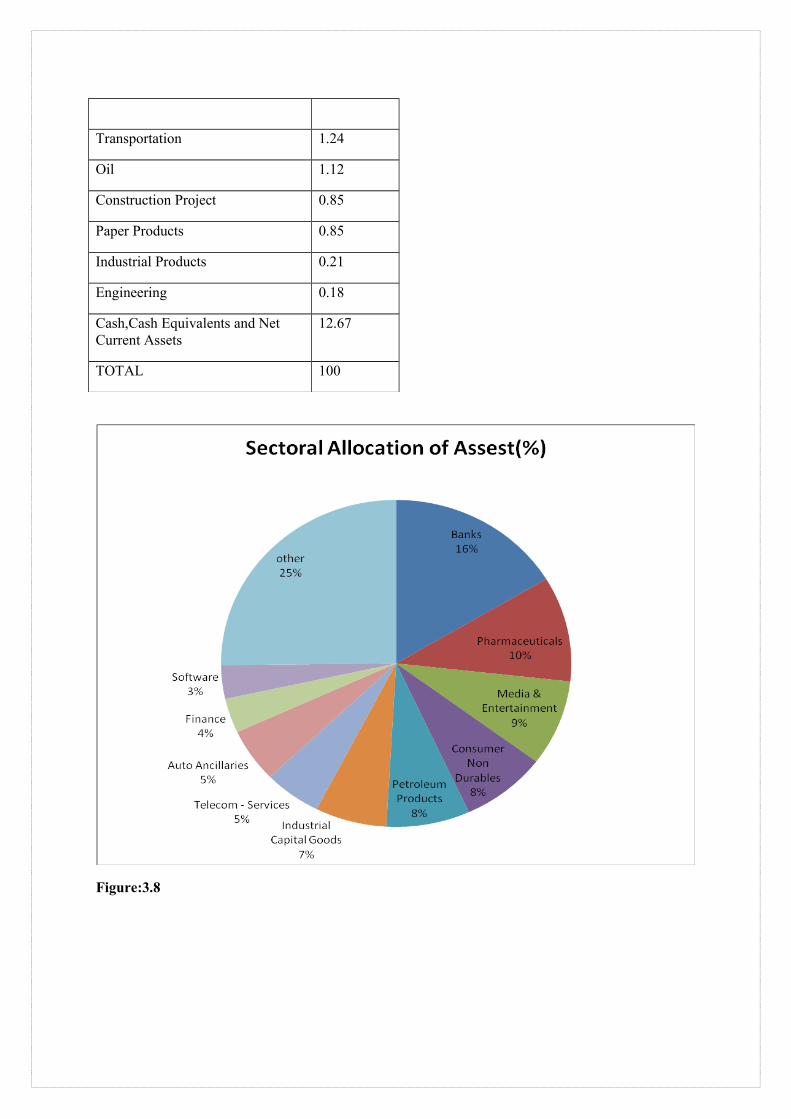
Transportation 1.24
Oil 1.12
Construction Project 0.85
Paper Products 0.85
Industrial Products 0.21
Engineering 0.18
Cash,Cash Equivalents and Net Current Assets
12.67
TOTAL 100
Figure:3.8

Table:3.25
HDFC Growth Fund
(NAV as at evaluation date 30-June-09, Rs. 57.219 Per unit)
Date Period NAV Per Unit (Rs.)
Returns (%) ^
Benchmark Returns (%) Sensex
December 30, 2008
Last Six months (182 days)
41.697 37.23 49.17
June 30, 2008 Last 1 Year (365 days) 53.472 7.01 7.67
June 30, 2006 Last 3 Years (1096 days)
36.034 16.65 10.95
June 30, 2004 Last 5 Years (1826 days)
16.439 28.31 24.74
June 30, 1999 Last 10 Years (3653 days)
N.A N.A. 13.34
September 11, 2000
Since Inception (3214 days)
10 21.91 13.65

Figrure:3.9
HDFC Growth Fund - Analysis
It requires a lot of research and constant watch on the capital market for a fund manager to analyze the portfolio of the particular fund. I took the secondary data from the fund review of the article corner from The Business Line web site. I comprehended the analysis and concluded my view as stated below.
HDFC Growth Fund invests in stocks across market capitalisations. Despite a large-cap bias, mid and small cap stocks account for 28 per cent of the portfolio. The fund has managed to consistently beat its benchmark Sensex over one-, three- and five-year periods.
In the latest portfolio, the fund has invested in as many as 52 stocks across 18 different sectors making it a fairly diversified portfolio. This may indicate net inflows into the fund.
Sector Moves: There is a fair bit of stability in terms of top sector holdings in the portfolio. Banks (16.39 per cent) and pharmaceuticals (10.37 per cent) sectors continue to be the top two sector holdings, although exposures have been a bit reduced.
Banks and consumer non-durables also figure among top holdings in the fund, and have seen increased exposures over the September-February period. While capital goods and banks have done well in the past year, they have been among the worst hit in the recent meltdown.

The respective sector indices were beaten down by over 25 per cent in the last couple of months. Construction and predictably, software exposures have been pared in the six-month period.
Interestingly, media and entertainment (8.48 per cent), which were not part of the portfolio six months ago is now in the top ten sector holdings for the fund. The power sector has been exited, while telecom services and auto ancillaries exposures have been increased substantially.
Stock Moves: Most stocks are those whose prices have fallen during September-February, include stocks such as Zee Entertainment, HT Media and Dr Reddy's Labs.
The fund has also taken profit booking opportunities, with several stocks whose prices rose between 60-105 per cent have been exited. These include, Axis Bank, Hanung Toys and Tata Power. Other high-profile exits include DLF, HPCL, Ranbaxy Labs, and Punj Lloyd.
Reliance Industries, SBI, ONGC and BHEL are the stocks retained by the fund during the period and are among the fund's top holdings.
3.4 FINDINGS
As far as analysis is concerned, we found out that the HDFC Growth Fund was among
the best performers fund. Although all the funds are affected by the global meltdown,
(recession) still HDFC Growth Fund has better performed comparing to other funds
for its systematic and unsystematic risk. It offers advantages of diversification, market
timing, and selectivity. In the comparison of sample of funds, HDFC Growth fund is
found highly diversified fund and because of high diversification, it has reduced the
total risk of portfolio.
Further, other funds were found very poor in diversification, market timing, and
selectivity. Although HDFC Top 200 Fund and Equity Fund performed better in terms
of returns but these suffered by the systematic risk (market volatility) and lack of
diversification. For the further clarification, we too studied the portfolio of HDFC
Growth fund.

One of the findings that I came across is that generally, a good model of asset classes
is the one that can explain a large portion of the variance of returns on the assets and
there were some stocks in the fund portfolio, which were not aligned with strategy of
the fund portfolio.
The optimal situation involves the selection that proceeds from sensible assumptions,
is carefully and logically constructed, and is broadly consistent with the data while
collecting the stocks for the portfolio. The portfolio was showing constructive
outcome in long time horizon and the results can be improved by making the minor
changes in fund portfolio.
Hence, the portfolio theory teaches us that investment choices are made on the basis
of expected risk and returns and these expectations can be satisfied by having right
mix of assets.
3.5 RECOMMENDATIONS:
Considering the above analysis, it can be noted that the three growth oriented mutual funds
(HDFC Equity Fund, HDFC Growth Fund and HDFC Top 200 fund) have performed better
than their benchmark indicators. Other funds such as HDFC Capital Builder Fund, HDFC
Long term Advantage Fund did not perform well even some performed negatively. Though
HDFC Equity Fund, HDFC Growth Fund and HDFC Top 200 fund have performed better
than the benchmark of their systematic risk (volatility) but with respect to total risk the fund
have not outperformed the Market Index.
Growth oriented mutual funds are expected to offer the advantages of Diversification, Market
timing and Selectivity. In the sample, HDFC Equity Fund, HDFC Growth Fund and HDFC
Top 200 fund is found to be diversified fund and because of high diversification, it has
reduced total risk of the portfolio. Whereas, others are low diversified and because of low
diversification their total risk is found to be very high. Further, the fund managers of these

under performing funds are found to be poor in terms of their ability of market timing and
selectivity.
The fund manager of HDFC Equity Fund, HDFC Growth Fund and HDFC Top 200
fund can improve the returns to the investors by increasing the systematic risk of the
portfolio, which in turn can be done by identifying highly volatile shares.
Alternatively, these can take advantage by diversification, which goes to reduce the
risk if the same return is given to the investor at a reduced risk level, the
compensation for risk might seem adequate. The fund manager of HDFC Capital
Builder Fund, HDFC Long term Advantage Fund can earn better returns by adopting
the marketing timing strategy and selecting the under priced securities.
The fund manager can divide all securities into several asset classes and tries to
construct an efficient portfolio based on expected returns, risk, and correlations of
indexes representing these asset classes. The investment should be done in the bench
mark indexes to get an “efficient” portfolio in such a way that no other combination
of these indexes would result in a portfolio with a higher return for a given level of
risk. It should be emphasized, however, that this is not a fully efficient portfolio
because information about correlations among individual securities within an index
and across the indexes is lost in the transition from individual securities to the
benchmarks that represent them.
These measures are more useful to investors who are putting their money into one
diversified fund and are able to use leverage or invest in the risk-free asset. When the
investor is investing in the different funds, the fund’s marginal contribution to the
portfolio’s risk and return is more important than its individual security
characteristics. To construct an efficient portfolio, an investor must take account of
the correlations among the being considered.
It is not advisable to apply just procedure or approach for all situations at least when it comes
to investments though the used measures are highly reliable in the studies done on similar
veins. Even at this juncture it would still be recommended that instead of going ahead only on
the basis of risk and return, other indicators like new projects, sector impact, individual
sentiments about companies etc besides ‘common sense and intuition’ may also be looked
into.

3.6 CONCLUSIONS:
Mutual fund has become one of the important sources for investing. It is quite likely that a
more efficient portfolio can be constructed directly from funds. Thus, the two-step process of
choosing an asset allocation based on the information about benchmark indexes and then
choosing funds in each category may be one of the best realistically attainable approaches. To
use this approach to portfolio selection effectively, investors would benefit from estimates of
future asset returns, risks and correlations, as well as from fund management’s disclosure of
future asset exposures and appropriate benchmarks.
It has been a great opportunity for me to get a first experience of Mutual Funds. My study is
to get the feel of how the work is carried out in relation to fund’s portfolio aspect. I got an
opportunity in relation to the documentation and also the portfolio analysis that have been
carrying out in facilitating the investor and the fund manager.
REFERENCES
Books:
1. Security Analysis and Portfolio Management (sixth Edition 1995) by Donald E. Fisher and Ronald J. Jordan. Publication: Pearson education.
2. The Indian Financial System (second edition) by Bharati V. Pathak. Published by Dorling Kindersley (India) Pvt. Ltd., licensees of Pearson Education in South Asia.
3. Security Analysis and Portfolio Management by Khan and Jain.
Magazines:
• Money Outlook (May &June 2009)

• Business world (May & June 2009)
Websites
• www.hdfcfund.com
• www.amfiindia.com
• www.moneycontrol.com
• www.sebi.gov.in
Related Documents


![Hdfc Mutual Fund Auto Saved]](https://static.cupdf.com/doc/110x72/577d260d1a28ab4e1ea02953/hdfc-mutual-fund-auto-saved.jpg)