RAVIKISHORE [Year] Ravikishore [Type the document subtitle] [Type the author name] [ T YPE THE COMPANY ADDRESS ]

Welcome message from author
This document is posted to help you gain knowledge. Please leave a comment to let me know what you think about it! Share it to your friends and learn new things together.
Transcript

8/6/2019 3_47_ratio
http://slidepdf.com/reader/full/347ratio 1/18
RAVIKISHORE
[Year]
Ravikishore
[Type the document subtitle]
[Type the author name]
[ T Y P E T H E C O M P A N Y A D D R E S S ]

8/6/2019 3_47_ratio
http://slidepdf.com/reader/full/347ratio 2/18
2
RATIO ANALYSIS
The system of analysis of financial statement by means of ratio was first made in 1919 by Alexander Wall
in his book STUDY OF CREDIT BAROMETICS
By the help of ratio we can know the relationship of the item or group of item in the financial statement.
Relationship
ASSOCIATED RELATIONSHIP (COST AND COST OF SALE)
CAUSE EFFECT RELATIONSHIP (PROFIT AND SALE)
Ways of expressing ratios
1) As ratio or as proportion 4/2
2) As ratio or turnover 2 TIMES
3) As percentage 200%
RATIOS
Financial ratios
Accounting ratios
Structural ratios
OBJECTIVE
Simplifies accounting figure
Measure liquidity position
Measure long term solvency
Measure operational efficiency
Measure profitability
Facilitates inter firm or intra firm comparison
Trend analysis
Managerial uses
Aid in planning and forecasting
Aid in control
Add in communication
Aid in decision making
In accounting and financial management, ratios are regarded as the real test of earning capacity,
financial soundness and operating efficiency of a business concern.

8/6/2019 3_47_ratio
http://slidepdf.com/reader/full/347ratio 3/18
3
LIMITATION
Ratios are only guide in anlaysing the financial statement and not conclusive end in themselves
Need for comparative analysis
Q ualitative factor ignored
Possibility of window dressing
o Like postponing purchase of desired fixed assets
Inherint limitation of accounting
Difference in accounting method and system
No substitute for sound management
Lack of standard ratios
Personal bias
Effect of price level change
PRECAUTION IN USING RATIOS
Ability to understand accounting data
Speedy compilation
Cost benefit
Presentation
Incorporation of change
CLASSIFICATION OF RATIOS
RATIOS
STRUCTURALCLASSIFICATION
BALANCE SHEET RATIOS
P&L A/c RATIOS
INTER STATEMENT RATIOOR COMBINED RATIOS
FUNCTIONALCLASSIFICATION
CLASSIFICATION BYSIGNIFICANCE
PRIMRY RATIOS
SECONDARY RATIOS

8/6/2019 3_47_ratio
http://slidepdf.com/reader/full/347ratio 4/18
4
FUNCTIONALCLASSIFICATION
LIQ UIDITY RATIO
CURRENT RATIOS
LIQ UIDITY RATIOS
ABSOLUTELIQ UIDITY RATIO
BASIC DEFENCEINTERVAL
NET WORKINGCAPITAL RATIO
CAPITALSTRUCTURE OR
LEVERAGE RATIO
DEBT EQ UITYRATIO
PROPRIETORYRETIO
DEBT TO TOTALASSETS OR
SOLVENCY RATIO
FIXED ASSETSRATIO
DEBT SERVICERATIO
CAPITAL GEARING
ACTIVITY OREFFICIENCY RATIO
STOCK T/O RATIO
DEBTOR T/O RATIO
CREDITOR T/ORATIO
TOTAL ASSETS T/ORATIO
FIXED ASSETS T/ORATIO
CURRENT ASSETST/O RATIO
WORKING CAPITALT/O RATIO
CAPITAL GEARINGRATIO
PROFITABALITYRATIO
BASED ON SALE
G/P RATIO
N/P RATIO
OPERATING RATIO
EXPENSES RATIO
OPERATING PROFITRATIO
BASED ON CAPITALINVESTMENT
RETURN ONCAPITAL
EMPLOYED
RETURN ONPROPRIETOS'S
FUND
RETURN ONEQ UITY SHAREHOLDER FUND
RETURN ON TOTALASSETS
INVESTMENTANALYSIS OR
MARKET RATIO
EARING PER SHARE
PRICE EARNINGRATIO
CAPITALISATIONRATIO
DIVIDEND PERSHARE
DIVIDEND YIELDRATIO
DIVIDENDPAYMENT RATIO
RESERVE TOCAPITAL RATIO

8/6/2019 3_47_ratio
http://slidepdf.com/reader/full/347ratio 5/18
5
LIQUIDITY RATIOS SHORT TERM SOLVANCY
1. CURRENT RATIOS
If current ratio good for creditor and bad for management
IDLE 2:1
2. LIQUIDITY RATIO
Liquid assets = current assets- stock- prepaid expenses
Liquid liability= current liabilities- bank overdraft- cash credit
Liquid ratio is an indication of a firms ability to meet unexpected demand of
working capital
A high liquid ratio compared to current ratio may indicate under stocking while
a low liquid ratio indicates over stocking.
IDLE 1:1
3. ABSOLUTE LIQUIDITY RATIO
Debtor and receivable will not be included
Bank overdraft and cash credit will not be included
IDLE 0.5: 1
4. BASIC DEFENCE INTERVAL
It says that if the revenue of the company is suddenly ceased then how
much days company will continue its operation
OR

8/6/2019 3_47_ratio
http://slidepdf.com/reader/full/347ratio 6/18
6
5. NET WORKING CAPITAL RATIO
CURRENT ASSETS CURRENT LIABITIES
BANK OVERDRAFT CASH AND BANK
creditor debtor
Bills payable Bills receivable
Income tax payable Short term investment
Unclaimed dividend Marketable securities
Outstanding expenses Prepaid expenses
Proposed dividend Advance payment
LEVERAGE OR CAPTAL STRUCTURE RATIO LONG TERM SOLVANCY
Leverage ratio reflect for a firm its ability to assure the long term creditors and owner with regards to
y Payment of interest business risk
y Payment of principal financial risk
1. EQUITY RATIO
In total capital employed we also include long term loan and debenture
2. DEBT RATIO
CAPITAL STRUCTURE RATIO
RELATED TO CAPITALSTRUCTURE
COVERAGE RATIO
RELATED TO FIXED CLAIM ONASSETS

8/6/2019 3_47_ratio
http://slidepdf.com/reader/full/347ratio 7/18
7
3. DEBT EQUITY RATIO
OR
OR
RATIO safety to creditors
RATIO claim of creditors are higher than owner
IDLE 1:1
This is indicator of leverage
4. PROPRIETORY RATIO
Owner equity to total assets
Net worth to total assets
RATIO more secured is the position of creditors
ratio greater risk to the creditors
IDLE 50%
If current assets increase then equity reduce and vice versa
5. SOLVENCY RATIO
OR

8/6/2019 3_47_ratio
http://slidepdf.com/reader/full/347ratio 8/18
8
6. FIXED ASSETS RATIO
CAPITAL EMPLOYEED TO FIXED ASSETRS RATIO
Relationship between long term fund or capital employed and fixed assets of the firm.
IDLE 1.5:1
7. INTEREST COVERAGE RATIO OR DEBT SERVICE RATIO
IDLE 6 OR 7 TIMES
8. DEBT SERVICE COVERAGE RATIO
9. DIVIDEND COVERAGE RATIO
10. GEARING RATIO
GEARING
CAPITAL GEARING FIXED CHARGE GEARING

8/6/2019 3_47_ratio
http://slidepdf.com/reader/full/347ratio 9/18
9
OR
ACTIVITY OR EFFICIENCY RATIO
The funds of creditors and owners are invested in various assets to generate sale and profit. Better the
management of these assets the larger the amount of sale and profit.
These ratios indicate the speed with which assets are being converted or turned over into sale. That is
why these ratios are called turnover ratios or sales ratio.
An activity ratio is the relationship between sales or cost of goods sold and investment in various assets
of the firm.
1. INVENTORY TURNOVER RATIO
Inventory turnover ratio normally establish a relationship between cost of sale and average inventory
This ratio reveals the number of times finished stock is turned over during a given accounting period in
relation to sale.
High ratio is better
High ratio reflect more profit
High ratio is also good from the view point of liquidity
STOCK VELOCITY
The inventory turnover ratio indicate the stock velocity with which stock moves through
the business
OR

8/6/2019 3_47_ratio
http://slidepdf.com/reader/full/347ratio 10/18
10
2. DEBTOR OR RECEIVABLE TURNOVER RATIO
The debtor turnover ratio throws lights on the collection and credit policies of the firm
Debtors = debtors + B/R +discounted B/R + sales tax
Sales = net credit sales + sales tax
Provision for doubtful debts shall not be deducted
High ratio efficiency in collection
Debtors are being collected more promptly
AVERAGE COLLECTION PERIOD
OR
Average collection period means the number of days over which debtors and bills receivables remain
uncollected
3. CREDITOR OR PAYABLE TURNOVER RATIO
AVERAGE COLLECTION PERIOD
OR
shorter payment period lesser liquidity
8/6/2019 3_47_ratio
http://slidepdf.com/reader/full/347ratio 11/18
11
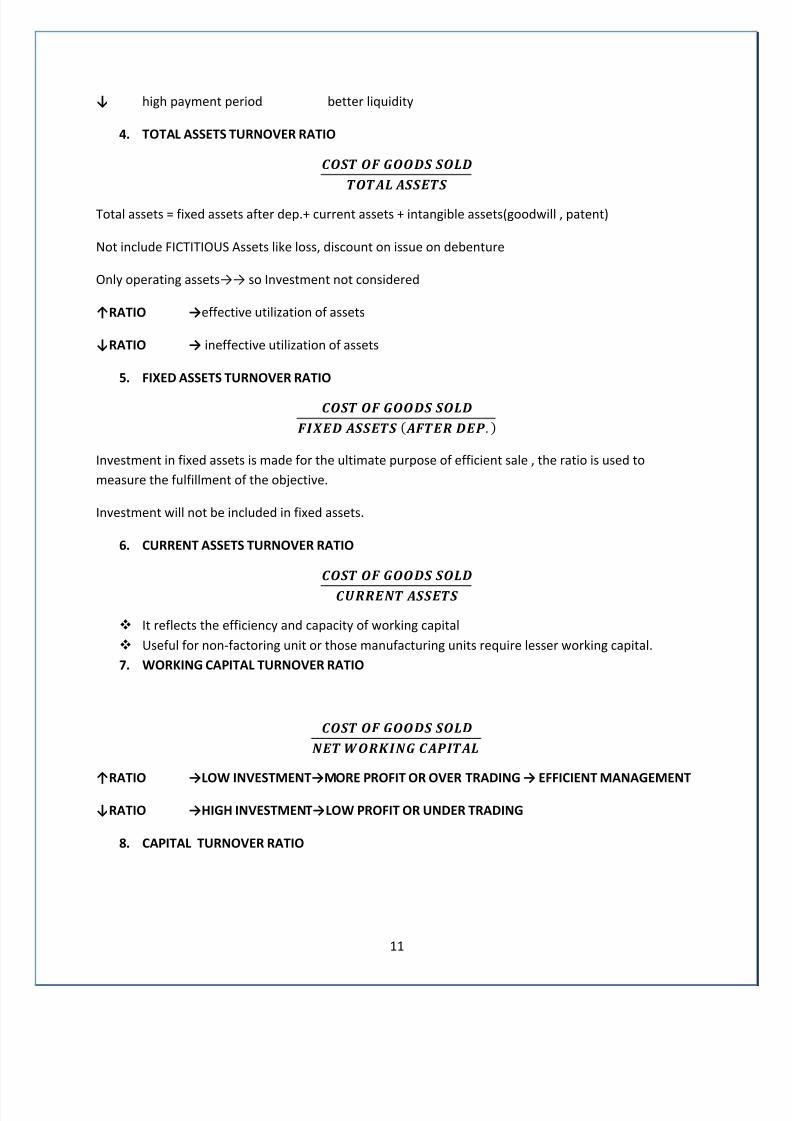
high payment period better liquidity
4. TOTAL ASSETS TURNOVER RATIO
Total assets = fixed assets after dep.+ current assets + intangible assets(goodwill , patent)
Not include FICTITIOUS Assets like loss, discount on issue on debenture
Only operating assets so Investment not considered
RATIO effective utilization of assets
RATIO ineffective utilization of assets
5. FIXED ASSETS TURNOVER RATIO
Investment in fixed assets is made for the ultimate purpose of efficient sale , the ratio is used to
measure the fulfillment of the objective.
Investment will not be included in fixed assets.
6. CURRENT ASSETS TURNOVER RATIO
It reflects the efficiency and capacity of working capital
Useful for non-factoring unit or those manufacturing units require lesser working capital.
7. WORKING CAPITAL TURNOVER RATIO
RATIO LOW INVESTMENTMORE PROFIT OR OVER TRADING EFFICIENT MANAGEMENT
RATIO HIGH INVESTMENTLOW PROFIT OR UNDER TRADING
8. CAPITAL TURNOVER RATIO

8/6/2019 3_47_ratio
http://slidepdf.com/reader/full/347ratio 12/18
12
RATIOHIGHPROFIT
RATIOLOWER PROFIT
PROFITABILITY RATIO
Each firm wants to earn maximum profit not only in absolute term but also in relative term.
The firms ability to earn maximum profit by the best utilization of its resources is called
profitability
1. GROSS PROFIT RATIO OR MARGIN RATIO
RATIO high margin
Due to
Higher selling price
Lower cost of goods sold
Excess combination of selling price and cost where margin is more
Increase in item of excess margin
2. OPERATING RATIO
Operating cost = operating expenses + cost of goods sold
OPERATING EXENSES office and administration exp as salary, rent, depreciation, director fees,
Electricity, insurance and selling &distribution exp.
NON OPERATING EXPENSES interest, discount provision for doubtful debts, provision for tax,
Abnormal exp. preliminary expenses donation, share or debenture
Issue expenses.
RATIO HIGH OPERATINGPROFIT

8/6/2019 3_47_ratio
http://slidepdf.com/reader/full/347ratio 13/18
13
3. OPERATINGPROFIT RATIO
OR
100- OPERATING RATIO
This ratio indicates the net profitability of the main business i.e. operating efficiency of a firm
RATIO firm is able to increase sale and can cut down its operating cost.
4. NET PROFIT RATIO
FOR MANAGERIAL EFFICIENCY
FOR OWNERS PURPOSE
5. RETURN ON PROPRIETORS FUND OR EQUITY
Share holder fund = net assets = net worth
6. RETURN ON EQUITY SHARE HOLDERS FUND
RETURN ON EQUITYU CAPITAL
7. RETURN ON TOTAL ASSETS
Non trade investment will not be included

8/6/2019 3_47_ratio
http://slidepdf.com/reader/full/347ratio 14/18
14
RATIOBETTERPOSITION
This ratio is not sound if assets are financed by funds provided by owners and creditors
Basic objective is to measure the effectiveness of the use of funds
But income earned by use of fund is not true because amount of interest is charged against
profit RETURN ON TOTAL ASSETS
8. RETURN ON CAPITAL EMPLOYEED
Or
RETURN ON INVESTMENT
Compare profitability of firm with capital employed
Managerial efficiency
Net profit before interest on long term funds and tax & and excluding non trading income and abnormal
loss
Owners purpose
Gross capital employed Total assets
Net capital employed total assets current liabilities
Capital employed Debt + share holder fund
Capital employed Fixed Assets +working capital
Return on capital employed assets turnover ratio* profit margin
While calculating capital employed these items should be excluded
A. Non trading investment
B. Idle assets
C. Intangible assets like G/W, patent, whose realizable value is nil
D. Factious assets
E. Abnormal debtors
F. Cash and bank balance more than requirement

8/6/2019 3_47_ratio
http://slidepdf.com/reader/full/347ratio 15/18
15
This ratio provides profitability related to long term funds
IMPORTANCE
Measurement of overall profitability
Basis of inter firm comparison
Aid in decision making
Aid in budgetary control
DU-PONT ANALYSIS CHART
Company with high return on equity with little or no debt can grow easily.
If two companies have same ROE than it is possible that one is sounder.
For the reason a finance executive of E.I.Du.Pont Nemours and Co. of Wilmington Delaware created the
Du-Pont system in 1919
Composition of return on equity
1) Net profit margin
2) Assets turnover
3) Equity multiplier net assets /share holder equity
RETURN ONINVESTMENT
NET PROFITRATIO
NET PROFIT
SALES
EXPENSES
cost of goodssold
adm.andselling exp.
SALES
CAPITAL T/ORATIO
SALES
WORKING
CAPITAL
current assets
currentliabities
FIXED ASSETS
CAPITALEMPLOYEED

8/6/2019 3_47_ratio
http://slidepdf.com/reader/full/347ratio 16/18
16
ROE is affected by many factors
If cost of goods sold than net profit so ROI
If working capital than capital employed so ROI will
QUESTION
Calculate ROE from following data
Revenue = 29261
Net income = 4212
Assets = 27987
Share holders equity = 13572
SOLUTION
ROE=net profit ratio*assets turnover ratio ratio*equity multiplier
.1439*1.0455*2.0621
=31.02%
INVESTMENT ANALYSIS RATIO
1. EARNING PER SHARE (EPS)
No of equity share as per AS 20 no. of equity share means weighted average no. of equity share
outstanding during the period
Ratio high price of share
Helps to company in raising additional capital
2. PRICE EARNING RATIO (P/E RATIO) establish relationship between the market price of share and
earning per share.
A high P/E ratio as the indication of over valuation of shares and vice-versa
This ratio is use in determining the future market price of share and rate of capitalization.
This ratio measure the growth potential of investment, risk characteristics, shareholders orientation,
corporate image and degree of liquidity.
3. DIVIDEND PER SHARE
The EPS ratio represent to what extent the profit belong to the owner of
a firm but it is customary in all companies to retain a portion of profit in the business.

8/6/2019 3_47_ratio
http://slidepdf.com/reader/full/347ratio 17/18
17
This ratio represent to what extent the profit have been received by the owners as dividend
Investor would like to invest in high dividend paying company.
Dividend per share is not measure of profitability because retain earning might have beenutilized for payment of dividend.
4. DIVIDEND YIELD RATIO
EPS and DPS are determined on the basis of book value of share
5. DIVIDEND PAY OUT RATIO(D/P RATIO)
This ratio shows that what % of NPAT is distributed to owners.
This is a relationship between EPS and DPS
OR
TRANSFER TO RESERVE = 100- D/P RATIO
6. RESERVE TO CAPITAL RATIO
This ratio explain the profit allocation policy of a company
High ratio sound financial position and company can absorb losses in future
This ratio shows the progress or development made by a company , when it follows conservative policy
in dividend distribution then it will be high.
INTERPRETATION OF RATIOS
I. Interpretation by single absolute ratio
II. Interpretation by group of ratioIII. Interpretation by historical comparison
IV. Interpretation by inter firm comparison
QUESTION
From the following information prepare a B/S on 31 march 2009
Working capital 2,40,000

8/6/2019 3_47_ratio
http://slidepdf.com/reader/full/347ratio 18/18
18
Bank overdraft 40,000
Fixed assets to proprietary ratio 0.75
Reserve 1, 60,000
Current ratio 2.5 times
Liquid ratio 1.5 times
ANSWER
CA-CL = 2, 40,000
CA/CL = 2.5 CA = 2.5 CL
2.5 CL-CL = 2, 40,000 CL = 1, 60,000
CA = 4, 00,000
LIQ UID RATIO
LA/LL = LA/1, 60,000-40,000 = 1.5
LA = 1, 80,000
STOCK = 2, 20,000
Proprietary fund = cap. + Reserve loss = X
Total of B/S = X + current liabilities
= X 2, 40,000
Fixed assets = total of B/S CA
= X+1, 60,000-4, 00,000
= X-2, 40,000
FA to proprietary fund ratio
X= 9, 60,000
CAPITAL 8,00,000 CURRENT ASSETS 1,80,000
RESERVE 1,60,000 STOCK 2,20,000
BANK O/D 40,000 FIXED ASSETS 7,20,000
OTHER C/L 1,20,000
11,20,000 11,20,000
OTHER WORKING NOTES
PROPERITORY FUND FA = WORKING CAPITAL
ANOTHER WAY
FA/PROPRITORY FUND = 0.75 SO
WC/PROPRITORY FUND = 0.25
2,40,000/PROPRETORY FUND = 0.25
PROPRIETORY FUND = 9,60,000